Embed Size (px)
Citation preview

Chapter – VIII The impact of regulatory regime in Kerala: An analysis
215
CHAPTER – 8
THE IMPACT OF REGULATORY REGIME IN KERALA:
AN ANALYSIS
8.1 Introduction
The Kerala State Electricity Regulatory Commission (KSERC) was
constituted under the provisions of Subsection (1) of Section 17 of the Electricity
Regulatory Commissions Act, 1998. With effect from 10th June, 2003, the
Commission has come under the purview of the Electricity Act, 2003, as the
Electricity Regulatory Commissions Act, 1998 has since been repealed. The
Commission was constituted vide Government of Kerala Order (Ms) No.34/2002/PD
dated 14 November, 2002 notified in the Govt. of Kerala Gazette, Extra Ordinary
dated 18 November, 2002. The Kerala State Electricity Regulatory Commission is a
body corporate having perpetual succession and a common seal, with power to
acquire, hold and dispose of property, both movable and immovable, and to contract
and shall, by the said name, sue or be sued. In addition, the Commission is a quasi-
judicial body. With effect from 10 June, 2003, the Commission has come under the
purview of the Electricity Act, 2003, as the Electricity Regulatory Commissions Act,
1998 has since been repealed.
The Commission consists of Chairman and two Members. In recognition of
the need for multi-disciplinary approach while addressing issues related to
independent regulation, the statute prescribes that the Chairman and Members shall
be persons of ability, integrity and standing who have adequate knowledge of, and
having shown capacity in, dealing with problems relating to engineering, finance,
commerce, economics, law or management. The Chairman and Members are
appointed by the Government of Kerala on the recommendation of a selection
committee constituted by the State Government as prescribed under the statute. The
statute also provides for the appointment of a Secretary, functioning under the
Commission, whose powers and duties are defined by the Commission.

Chapter – VIII The impact of regulatory regime in Kerala: An analysis
216
In this chapter, an attempt is made to analyse the impact of electricity
regulatory regime in Kerala in areas like ARR approval, industrial tariff, financial
performance of KSEB, T&D loss, Scheduling and generation, power purchase etc.
The compliance of KSEB and KSERC in meeting the key provisions of Electricity
Act 2003, National Power Policy and National Tariff Policy in meeting the
requirements of Industrial Consumers in the State of Kerala also will be studied. The
period of study in this chapter is from the inception of KSERC in 2002 to 2010. We
can find from following sections that the KSERC has shown at maximum prudence
in the analysis of KSEB’s tariff petitions and has questioned the merit of each and
every demands put forward by the Board. The analysis of ARR & ERC by KSERC
for the year 2010-11 has been taken as a typical case for analysis and at the same the
regulatory intervention by the Commission for the period from 2002 to 2010 is also
analysed.
8.2 Summary of ARR&ERC approvals done by the Commission
The Kerala State Electricity Board (hereinafter referred to as KSEB or the
Board) in accordance with the KSERC (Tariff) Regulations 2003, filed the
Aggregate Revenue Requirements (ARR) and the Expected Revenue from Charges
(ERC) for FY 2010-11 before the Commission on 24-12-2009. Prior to filing of the
petition, the Board had sought extension of time for filing the petition till 31-12-
2009, and the Commission after considering the request had allowed time till 24-12-
2009. In the petition the Board has proposed a record revenue gap of Rs.2219.60
crore and no proposal was made for bridging such a large revenue gap. The
Commission directed the Board to file the proposal for bridging the revenue gap and
the Board expressed reluctance raising certain reasons. Therefore the Commission
admitted the petition on 15-1-2010 to avoid further delay. The Commission so far
has issued six Orders on ARR & ERC of the Board starting from 2003-04 as shown
below (Table8.1)

Chapter – VIII The impact of regulatory regime in Kerala: An analysis
217
Table 8.1
Details of ARR & ERC approved by KSERC
Year
Date of submission
of ARR&ERC
Revenue Gap proposed by
KSEB (Rs. Crore)
Approved ARR (Rs.
Crore)
Approved Revenue
(Rs. Crore)
Approved revenue
(gap) /surplus
(Rs. Crore)
Date of
order
2003-04 1-8-2003 926.08 3,697.37 3,141.37 ( 556.00) 31-12-2003
2004-05 15-12-2003 854.19 3,492.46 3,196.00 ( 296.46) 16-4-3004
2005-06 15-11-2004 492.25 3,367.32 3,316.01 ( 51.31) 23-3-2005
2006-07 30-11-2005 302.78 3,680.43 3,865.05 184.62 30-3-2006
2007-08 11-12-2006 430.11 4,074.22 4,403.95 329.73 26-12-2007
2008-09 21-12-2007 754.69 4,983.27 4,979.34 (3.93) 19-4-2008
2009-10 29-12-2008 1,099.28 5,316.30 4,981.00 (335.30) 17-4-2009
Source: Kerala State Electricity Regulatory Commission
The revenue gap of Rs. 556.46 crore for the year 2003-04 arrived at by the
Commission was recommended to be bridged by way of exemption from payment of
Electricity duty amounting to Rs.182.56 Crore and by availing a subsidy of Rs. 375
Crore from Government. The revenue gap for the year 2004-05 was to be filled up by
exemption from paying electricity duty under Section 3(1) and Section 4 of Kerala
Electricity Duty Act, 1963 to the tune of Rs.200 Crore and by providing the balance
amount of Rs.96 Crore by way of revenue subsidy by Government.
The truing up petition for 2003-04 & 2004-05 filed by the Board was
disposed of together by the Commission by allowing an amount of Rs.360.06 Crore.
This was adjusted against the revenue surplus of Rs. 329.73 Crores arrived at in the
ARR&ERC for 2007-08 resulting in a net deficit of Rs.30.34 Crore for 2007-08.
Based on the petition filed by the Board for revision of tariff, the Commission in the
order dated 26-11-2007 revised the tariffs with effect from 1-12-2007. The increase

Chapter – VIII The impact of regulatory regime in Kerala: An analysis
218
in revenue due to tariff revision was estimated as Rs.69.79 Crore for a full year and
Rs.23.26 Crore for the balance four months of 2007-08.
Against the revenue surplus of Rs.184.64 crore fixed in 2006-07, the
Commission directed the Board to file tariff revision proposal, however, the Board
did not file the same. The Commission finalized truing up for the year 2005-06 by
approving the revenue surplus of Rs.181.36 crore, which was adjusted against the
revenue gap of Rs.335.30 crore approved for the year 2009-10. The Commission
directed the Board to file appropriate proposals for tariff rationalization for 2009-10
and accordingly KSEB filed a tariff petition on 24-07-2009, for additional revenue of
Rs.150.86 crore on a yearly basis. Other major highlights of the proposal were (a)
introduction of non-telescopic tariff for domestic consumers, (b) 15% & 20%
increase in demand and energy charges respectively for HT Commercial class, (c)
25% increase in tariff for Bulk supply (BST) to Licensees and (d) reduction to the
tune of 10% of the tariff applicable to Kerala Water Authority (KWA). KSEB also
proposed to rationalize the ToD tariff applicable to HT/EHT consumers and
proposed a new ToD tariff for LT industrial consumers. The Commission in its order
dated 2-12-2009 rejected the proposal on rationalization/revision of tariff proposed
by KSEB for LT-I A(Domestic) and HT-IV (Commercial) since the proposals were
against the provisions of the Act and would entail a tariff shock for certain group of
consumers. Besides the Commission noticed that after the completion of pending
truing up proposals from 2006-07 onwards, the picture of deficit might change. The
Commission deferred the proposal on Bulk Supply Tariff to licensees. The
Commission revised the Time of Day Tariff for HT-EHT consumers to be effective
from 1-1-2010. Maximum demand based tariff was introduced for LT Industrial and
LT VII (A) & (C) consumers having connected load of 20 kW and above as an
optional scheme. With a view to staggering the peak time load demand, an optional
Time of Day tariff was also introduced for LT Industrial consumers who have opted
for a maximum demand based tariff and having 30 kVA contract demand or above.

Chapter – VIII The impact of regulatory regime in Kerala: An analysis
219
8.2.1 Procedural Overview
In the ARR for FY 2010-11, the Board has projected a revenue requirement
of Rs.7503.98 Crores and a revenue receipt of Rs. 5284.38 Crores thereby leaving a
revenue gap of Rs.2219.60 Crores. Since such a gap would entail increase in existing
tariff by about 46%, before admitting the petition, the Commission vide letter dated
2-1-2010 directed the Board to provide a detailed proposal on bridging the revenue
gap. The Commission also directed the Board to ascertain from the Government
whether subsidy if any is intended by the Government to avoid a steep tariff increase.
The Board in its reply stated that, filing a proposal on the revenue gap projected by
Board would be a futile exercise since in the past, the Commission had substantially
reduced the ARR proposed by the Board. Hence, appropriate measures like filing
tariff petition or seeking subsidy from the Government or to keep the revenue gap, as
regulatory asset will be taken once the Commission approves the ARR&ERC. The
Board also informed that, they had requested the Government to communicate the
decision, if any, on the provision of subsidy to the consumers. In the letter dated
29-1-2010, the Board further attempted to appraise the Commission on the issues on
revenue gap. According to the Board, the accounts of the Board are still being
prepared under Electricity (Supply) Annual Accounts Rules (ESAAR) - 1985 which
are being audited by C&AG. The actual revenue gap for various years has been
substantially higher than what has been approved by the Commission. It would be
difficult for the Board as a distribution licensee, to limit expenses especially for
power purchase cost. The Board further stated that it cannot propose on its own tariff
proposals under the provisions of the Act and conceded that they did not possess
necessary expertise to conduct studies on T&D loss reduction, improving efficiency
of generating stations, man power utilisation etc., as directed by the Commission.
Before taking up the ARR&ERC for 2010-11, the Commission expressed its
views on the reply given by the Board, which were communicated to the Board vide
letter dated 15-1-2010. The Commission was not in agreement with the contentions
of the Board on major issues such as proposal on bridging revenue gap and various
directions issued to the Board. According to the Commission, KSEB is a responsible

Chapter – VIII The impact of regulatory regime in Kerala: An analysis
220
public entity entrusted with the task of providing electricity at a reasonable cost to
the public. The Government at all levels is taking maximum effort to keep the entity
under public ownership. The Board has inherent obligation and duty to optimally
plan, develop and maintain the electricity system, and is expected to exercise such
functions in the most reasonable and efficient manner. KSEB has been consistently
projecting expenses more than what is optimally required for efficient service. Such
projections are placed before the public, without serious concern on its impact,
thereby revealing an unwholesome aspect of cost plus regime. In the absence of
proper and reliable estimates from KSEB, the Commission in the past was forced to
exercise its regulatory scrutiny to optimize, control and prune certain expenses. The
Commission was of the firm view that it was not bound to accept all the projections
of the Board without scrutiny. It was not the intention of the regulatory scrutiny to
scale down the expenses, which were over projected by the licensee (KSEB). In
actual terms, KSEB has failed to control the expenses at the approved level, notably
in areas where restraints have to be observed such as many items of revenue
expenditure, and reduced the expenditure much below the desired level in areas
where it was very much needed such as capital expenditure. Even after seven years
of regulatory regime in the State, the Commission has received no material on record
to establish that a professional body like KSEB has an internal mechanism to limit
the various expenses at the approved level and implement the capital programmes as
proposed. The Commission opined that, such an approach of the licensee (KSEB) in
not having a system or initiative to optimize the operations may render the regulatory
regime less effective in the State.
The Commission insisted on proposals for filling up the revenue gap of
Rs.2219.60 Crore as projected by the Board mainly on the reason that KSEB should
visualize and gauge the impact of such a huge revenue gap on 97 lakh consumers in
the State. According to the Commission, if KSEB proposes such a huge revenue gap,
it cannot shy away from its responsibility of proposing the means to bridge the
revenue shortfall through tariff revision or efficiency improvement or direct subsidy
from the government or a combination of all of these. As per the ARR&ERC for

Chapter – VIII The impact of regulatory regime in Kerala: An analysis
221
2010-11 projected by the Board, the average cost of supply was estimated to
Rs.5.06/kWh (Rupees five and paise six), which was much higher than the levels
existing elsewhere. KSERC in principle disagreed with KSEB’s practice to project
such a high level of expenditure, without proposals or attempts to plan and control
the expenses saying that Cost plus regulatory regime is not about passing on all costs
incurred by the utilities, but about prudently optimal and efficiently managed costs
being loaded on to the consumers.
Regarding the lack of expertise for the conduct of various studies, the
argument of the Board was surprising. If in a particular domain, expertise was not
available, either the expertise should be acquired or outsourcing to be resorted to.
Commission opined that the Board is not the only one electric utility in India and is
not required to reinvent the wheel. It can emulate the best practices adopted
elsewhere in the Country. There are several success stories reported on the
achievements in the power sector in India especially under public management.
Further, there is no dearth of expertise in the country. Already M/s. PFC Consulting
and others are helping the Board on re-organisation. In the past also Board has
benefited from the services of consultants. It was surprising to note that it took nearly
seven years since the directions have been issued, to understand its own the
limitations. Commission observed that the Board has to realize the cost of time and
should speed up the efforts. The Commission after considering all these aspects and
also the fact that the ARR&ERC for the year 2010-11 was delayed, decided to admit
the petition on 15-1-2010.
After admitting the petition, the Commission sought clarifications on various
issues on the petition from the Board vide letter dated 15-1-2010. The Board
provided its reply on 5-3-2010 after some delay. The Commission directed the Board
to publish the summary of the petition by giving time till 1-3-2010 for providing
comments by the Public and stakeholders. The Board published the summary of the
petition in the leading dailies.

Chapter – VIII The impact of regulatory regime in Kerala: An analysis
222
In the meanwhile, the Commission vide letter dated 10-1-2010 directed the
Board to submit truing up petitions for the years from 2006-07 to 2008-09. On the
request of the Board the Commission allowed time till 20-1-2010 for filing the
Truing up petition for 2006-07 and for other years till 31-1-2010. Further extension
of time was also given. As on date of this order, the petition for 2007-08 and 2008-09
were not yet filed. In its absence, the Commission could not take a considered view
on the exact position of revenue gap/surplus for the years till 2008-09. Hence
Commission ordered that the present order on ARR&ERC 2010-11 will be subjected
to the outcome of truing up exercise for the years 2006-07 to 2008-09.
8.3 Review of Capital Expenditure
8.3.1 Introduction
The Board has initiated a new interactive approach for identifying capital
projects in generation, transmission and distribution since 2008-09. Probable load
growth was projected based on the feedback received from stakeholders and in
consultation with elected people’s representatives certain projects were formulated.
An ambitious plan of capital expenditure for Rs.1377.70 Crores proposed in 2009-10
was revised by the Board to Rs.947.66 Crore. For the year 2010-11, capital
expenditure of Rs.995.15 Crores was proposed.
The capital expenditure for generation in 2009-10 and 2010-11 includes 9
ongoing projects viz., Kuttiyadi tail race, Kuttiyadi additional extension, Pallivasal
extension, Kuttiar diversion, Ranni-Perunad SHP, Thottiyar, Sengulam
Augmentation, Adyanpara SHP, and Poozhithodu SHP, with a total out lay for the
year 2009-10 and 2010-11 as Rs.113.70 Crore and Rs.124.26 crore respectively. Out
of the 6 tendered projects, 3 projects were under pre-qualification stage and two
other projects were already tendered. One project (Athirappally) was held up. The
total out lay for tendered projects for 2010-11 was Rs.22.65 crore.
In 2009-10, 8 projects were taken up for tendering which were in various
stages for which Rs.19.74 crore was earmarked for 2010-11. Another 14 projects

Chapter – VIII The impact of regulatory regime in Kerala: An analysis
223
were prioritized for approval (total 207MW to generate 592.02MU) during the year
2010-11 and 2011-12. Other capital works in generation include, capital works for
diesel projects BDPP/KDPP, renovation and modernization of hydro stations, survey
and investigation, revamping seismic network in Idukki region, mechanical
fabrication, civil R&D, construction of administrative complexes, and Dam safety
works etc., the total outlay for these works was Rs.284.34 crore.
In transmission, the projects planned for 2010-11 are 2 nos. of 220kV
substations, 19 nos. of 110kV substations, 6 nos. of 66kV substations and 19nos of
33 kV substations. Further 28.5 km of 220 kV lines, 138.8 km of 110 kV lines, 13.5
km of 66 kV lines and 138 km of 33 kV lines were also planned. In the petition, the
Board has committed that the financial viability of these projects will be submitted
by January 2010. Modernisation of Load Dispatch centre was another project
included as part of transmission.
In the distribution wing, Board was planning to provide 5 lakh connections
and to construct 3000 km of 11kV lines, 3800km of LT lines and installation of 5000
distribution transformers. 8 lakh faulty meters were also proposed for replacement in
2010-11.
The Board reported that APDRP scheme sanctioned by Government of India
for Rs.853.62 crore included 3 circle schemes (Rs.148.24 crore), 46 nos. of town
schemes (Rs.341.87 Crore) and 3 nos. of sub-transmission and distribution project
for cities (Rs.373.56 crore). These projects were either completed or short closed on
31-3-2009. The total allowable expenditure under APDRP is Rs.556.60 Crore. For
the completed schemes 25% of the amount will be provided as grant. The city
scheme (Thiruvananthapuram, Ernakulam and Kozhikode) envisages laying of 11kV
UG cables and installation of RMUs, compact secondary substations and
transformers. The expenditure up to 31-3-2009 under the city scheme was Rs.82.19
crore. Balance work under the project was planned to be completed using Board’s
own funds.

Chapter – VIII The impact of regulatory regime in Kerala: An analysis
224
The Board obtained sanction for implementing RAPDRP scheme during 11th
five-year plan from Government of India. The project is proposed to be implemented
in 43 towns. Part A of the project consists of establishment of IT infrastructure and
part B consists of distribution infrastructure. As part of Part A, project worth
Rs.288.33 crore was forwarded and Rs.241.39 crore is expected from the
Government of India and balance Rs.76.04 crore to be met from Own fund. If the
project is implemented in time, the complete funding under Part A will be converted
as grant.
As part of RGGVY projects for all districts are under preparation. Revised
DPRs for southern districts such as Thiruvananthapuram, Kollam, Pathanamthitta,
Alappuzha, Kottayam, Ernakulam and Thrissur are being submitted for REC
approval.
8. 3.2 Analysis
The KSERC in the previous Orders had mentioned the lack of progress in
capital expenditure programmes. The Board has been submitting the investment
proposal as part of the annual budget, without providing the scheme-wise details or
viability studies. The information provided by the Board even after several queries
was incomplete and hence which was not useful for continuous monitoring of the
projects. Hence, project monitoring and evaluation could not be taken up effectively.
The Commission on several occasions had made it clear that for the approval of the
investment plan, project-wise details with necessary information on the viability of
the project need to be submitted. In the ARR petition, the Board stated that scheme-
wise details with DPR would be submitted by February 2010 and Chief Engineer
Planning was entrusted with the task. However, the information was provided by the
Board only on 24-4-2010, which KSERC could not be evaluated.
The KSERC noted that the Board was following a strategy of projecting the
capital expenditure initially high, which was later scaled down successively. The
Board has proposed Rs.1022.38 Crore in the ARR for 2007-08, which was revised to
Rs.956.17 Crore subsequently. Similarly, for the year 2008-09, Rs.1145 Crore was

Chapter – VIII The impact of regulatory regime in Kerala: An analysis
225
proposed which was revised to Rs.1047.6 Crore. For 2009-10 the capital expenditure
proposed was Rs.1377.10 crore which was about 31% more than the revised
estimates for 2008-09. However, it was substantially scaled down to Rs.947.66 crore
later i.e., the projected capital expenditure in the ARR later revised downwards and
as per the actuals, the performance was much lower as shown below (Table-8.2).
Table No. 8.2
Performance under capital expenditure 2006/07 to 2009-10
Year Generation Transmission Distribution Other works
Total
2006-07 Proposed 250.00 218.50 290.00 1.50 760.00
Revised 323.94 168.78 288.00 1.50 782.22
Actuals 150.77 139.49 255.01 545.27
2007-08 Proposed 336.22 221.80 464.36 1,022.38
Revised 344.53 221.50 386.09 4.05 956.17
Actuals 115.60 241.34 284.43 641.37
2008-09 Proposed 540.52 181.00 419.52 5.05 1,146.09
Revised 310.37 276.88 456.25 4.10 1,047.60
Actuals 68.89 153.30 223.16 445.35
2009-10 Proposed 403.33 366.73 600.64 6.40 1,377.10
Revised 262.82 240.66 436.40 7.78 947.66
2010-11 Proposed 284.34 275.97 425.00 9.84 995.15
Source: Kerala State Electricity Regulatory Commission
The jacking up of figures in the ARR may be for enhancing the interest
liability and also depreciation benefits for the period under scrutiny. Hence, the
Commission would seriously consider to claw back the excess interest and
depreciation on account of actual lower performance. Based on the information

Chapter – VIII The impact of regulatory regime in Kerala: An analysis
226
provided by the Board over the years, the physical progress in the generation sector
is analysed below (Table 8.3):
Table No. 8.3
Status of Ongoing Projects
Capacity Target date
Hydel schemes
As per Five year plan
As per 2008/09 ARR
As per 2009-10 ARR
Kuttiyadi tail race 3.75MW 2007-08 Nov.2008
Commissioned 1
st unit on
9-11-2008 and 22-10-09
Neriamangalam Extn 25MW 2007-08 May-08 22-5-2008
Kuttiyadi Addl Extn 100 MW 2007-08 May-09 Mar-10
Azhutha Diversion 57MU 2006-07 Apr-07 May 2007
Kuttiyar Diversion 37MU 2007-08 Jun-07 Jun-09
Source: Kerala State Electricity Regulatory Commission
All the on going projects are delayed beyond the initial target dates. As per
the information available, 3 projects have been completed now. The cost due to
delay in commissioning the projects is the additional cost of power purchase
necessitated, which needs to be imposed on the Board as penalty. The Commission
will be addressing this issue separately.
The Commission’s observation on Baitarni Coal block and the proposed
Cheemeni Power project was that without even a prefeasibility report, no evaluation
of the project would be possible.
The achievements in transmission and distribution sector were very low as
per the five-year plan targets as shown below (Table No.8.4):

Chapter – VIII The impact of regulatory regime in Kerala: An analysis
227
Table No. 8.4
Physical target and Achievement in Transmission capital expenditure
Substations Transmission 2007-08 2008-09 2009-10 2010-11 2011-12 Total
As per Five year
plan Proposal 220kV 2 0 1 2 1 6
110kV 11 11 8 6 18 54
66kV 1 4 0 0 1 6
33kV 12 26 7 4 7 56
Actual Achievement
reported 220kV 1 - - - - 1
110kV 4 2 - - - 6
66kV 1 - - - 1
33kV 13 16 - - - 29
Lines Ckt kms Transmission 2007-08 2008-09 2009-10 2010-11 2011-12 Total
As per Five year plan
Proposal 220kV 39.34 18.61 28.5 15 17 118.45
110kV 124 134.8 41.8 85.58 286.4 672.58
66kV 40 14.61 164 57.6 0 276.21
33kV 174.63 309 63.94 63.94 10 621.51
Actual Achievement
reported 220kV 1.01 - - - - 1.01
110kV 56.38 17.5 - - - 73.88
66kV 11.13 - - - - 11.13
33kV 105.27 169.27 - - - 274.54
Distribution Transmission 2007-08 2008-09 2009-10 2010-11 2011-12 Total
As per Five year
plan Proposal
11kV lines
(Ckt kms) 3427 3177 3225 3264 3463 16556
LT lines
(Ckt kms) 4043 3798 3663 4186 3575 19265
Distribution
transformers
(Nos)
2009 2286 2346 2503 2646 11790
Actual Achievement
reported
11kV lines
(Ckt kms) 1807 3018 - - - 4825
LT lines
(Ckt kms) 8128 7636 - - - 15764
Distribution
transformers
(Nos)
2553 4109 - - - 6662
Source: Kerala State Electricity Regulatory Commission
Chapter – VIII The impact of regulatory regime in Kerala: An analysis
228
The Commission sought details of load flow studies to support the
transmission plan. The Board stated that the studies were not conducted on regular
basis but for annual peak only due to inaccurate metering and lack of details. There
was no doubt that in the absence of systematic load flow studies, the constraints and
stability of the system cannot be predicted. Commission observed that the reasons
stated by the Board that meters are inaccurate and details on load flow are
insufficient are illogical. Thus, the reply from Board clearly indicates that
transmission planning in KSEB is weak and it needs to be strengthened urgently.
The Board stated that region-wise voltage adalaths were conducted and
results were provided. It is apparent that the efforts made were not scientific and no
integration was made into the overall planning process.
The Commission observed that under Modernisation of Load Dispatch
Centre, the Board has been continuously providing a budget provision, but no work
has been executed so far. It was noted that in 2008-09 Rs.153 lakh & in 2009-10
Rs.266 lakhs were provided. In 2010-11, Rs.5.97 Crore was earmarked for this. On
this issue, Board’s reply is that modernization of LD is under the consideration of
the Board and would be reported after finalisation. This shows that even without a
firm project, KSEB is making provisions as part of the proposed capital expenditure.
The Commission has analysed the capital expenditure proposed by the Board
in the ARR and the actual expenditure and the deviations. The following table gives
the details (table 8.5).

Chapter – VIII The impact of regulatory regime in Kerala: An analysis
229
Table 8.5
Capital expenditure proposed in ARR and actual (2002-03 to 2009-10)
Proposed in the ARR Rs. Crore
2003-04 2004-05 2005-06 2006-07 2007-08 2008-09 2009-10
Capital Expenditure 453.40 459.01 695.21 662.60 924.49 1061.15 1293.00
IDC capitalized 115.45 115.73 99.51 53.30 37.11 25.75 27.87
Other expenses
capitalized 119.25 123.53 158.95 43.90 65.26 59.19 55.82
Total capital
expenses 688.10 698.27 953.67 759.80 1026.86 1146.09 1376.69
Expenses transferred
to Gross asset 924.65 707.84 905.68 603.33 821.48 912.07 1189.26
Actuals Rs. Crore
2002-03 2003-04 2004-05 2005-06 2006-07 2007-08 2008-09
Capital Expenditure 235.36 621.93 357.00 407.82 459.13 296.30 551.73
IDC capitalized 101.08 78.11 62.04 48.50 35.13 29.33 22.71
Other expenses capitalized
118.15 109.05 42.88 43.61 43.19 48.08 70.75
Total capital expenses 454.59 809.09 461.92 499.93 537.45 373.71 645.19
Expenses transferred
to Gross asset 801.37 968.51 501.42 651.65 505.23 467.70 564.56
Difference Rs. Crore
2002-03 2003-04 2004-05 2005-06 2006-07 2007-08 2008-09
Capital Expenditure 168.53 -102.01 -287.39 -203.47 -628.19 -509.42
Total capital
expenditure 120.99 -236.35 -453.74 -222.35 -653.15 -500.90
Expenses transferred
to Gross asset 43.86 -206.42 -254.03 -98.10 -353.78 -347.51
Source: Kerala State Electricity Regulatory Commission
As noted above, the achievement in terms of completion of projects was
much lower than projected. Considering this, the Commission directed the KSEB
that scheme/project wise details with benefits quantified, date of commencement,
physical and financial progress, target date of completion etc., are to be submitted
along with ARR&ERC. KSERC has made it clear that in the absence of above
details, the Commission may be forced to disallow interest commitments in the
tariff.
8.4 Sales Energy Projections
8.4.1. Sales projections
The Board has projected the energy sales for the year 2010-11 based on the
past trend. According to the Board, energy sales in the State was showing an
increasing trend since 2003-04. The Board stated that, as in the previous years, the
energy consumption was estimated by considering factors such as connected load,
actual growth of consumers, regional characteristics, seasonal variations, change in

Chapter – VIII The impact of regulatory regime in Kerala: An analysis
230
consumer habits etc. According to the Board, the methodology used in the past was
realistic and the percentage error was less than 2%. However the methodology used
in the previous years required modification due to the power restrictions in 2008-09
(on account of low monsoon and precarious water levels in dams). Energy sales in
2008-09 was lower on account of power restrictions such as half an hour load
shedding, 20% restriction in consumption for HT-EHT and LT consumers and high
rate for consumption above 200 units per month for domestic consumers. These
restrictions were removed on 1st May 2009. In view of the distortion in sales data,
the Board omitted the energy sales for 2008-09 for projecting the sales for 2010-11.
Energy sales for 2009-10 was projected as 13679 MU by KSEB, which was
later re-estimated as 13870MU, due to lifting of restrictions. KSEB has expected an
addition of 5.13 lakh consumers in 2009-10. The average growth of sales for the
period from 2003-04 to 2008-09 was 6.9% of which LT growth was 8.4% and HT
growth was 3.5%. Compared to this, in 2008-09, the growth rate was only 3% and
for many consumer categories (agriculture, HT-EHT, licensees) sales growth was
negative on account of restrictions.
By excluding the sales for the year 2008-09, sales for 2010-11 was estimated
effectively by considering sales from 2003-04 to 2007-08. KSEB has taken into
consideration, an addition of about 5 lakh consumers in 2010-11. Accordingly, the
total sales projected for the year 2010-11 is 14830 MU as shown below (Table 8.6).
Table 8.6
Estimated Energy Sales by KSEB
Actual Revised
estimate Projections
Category 2003-04 2004-05 2005-06 2006-07 2007-08 2008-09 2009-10 2010-11
LT Category
Domestic 4004 4262 4668 5213 5603 5931 6580 7078
Commercial 879 948 1093 1246 1378 1502 1706 1886
Industrial 751 783 874 934 984 1015 1131 1211
Agricultural 202 191 190 220 231 225 238 250
Street Lights 166 183 208 229 249 294 305 325
Sub total LT 6002 6367 7033 7842 8445 8967 9960 10750

Chapter – VIII The impact of regulatory regime in Kerala: An analysis
231
HT category
HT – I 1125 1238 1362 1436 1461 1326 1439 1485
HT – II 130 141 130 135 138 107 115 119
HT – III 9 9 10 9 9 9 10 10
H – IV 304 339 378 431 507 579 686 723
EHT 66/110 1107 1036 1004 1070 1024 966 1105 1158
Railway Traction 46 44 58 72 109 142 161 168
Bulk Supply 188 212 296 335 357 317 394 417
Sub total HT 2909 3019 3238 3488 3605 3446 3910 4080
Total 8911 9386 10271 11330 12050 12413 13370 14830
Source: Kerala State Electricity Regulatory Commission
8.4.2 Analysis
KSEB adopted a method of eliminating the abnormal year 2008-09 in the
projections. The Commission has noted that, in general, the annual projections of
KSEB are not much far from reality, though much effort is not taken to substantiate
the projection with robust analysis. The Commission has always insisted that KSEB
should have a comprehensive database and robust forecasting methods for medium
to long term sales projection and validation. The Commission was of the view that
KSEB should not limit the load forecast for ARR purposes alone, but it should be the
basis for the medium and long term planning process. Accordingly, regional
forecasts of energy (MU) and demand (MW) are essentially to be developed for
transmission and distribution planning. When the Commission sought the details of
regional forecasts, the Board has given the reply that developing regional forecasts
required large quantity of data, which cannot be processed, at the corporate level. In
this context, the Commission pointed out that KSEB should be well aware of the
duty cast upon them as a licensee as per section 39(2)(b) and section 42(1) of the
Electricity Act 2003.
The average annual growth rate from 2003-04 to 2007-08 works out to 7.8%.
A comparison of annual sales growth shows that only the energy sales for industrial
consumers have been lower during power restrictions. For all other consumers, the
sales were near normal even with power restrictions. The overall sales growth for
HT-EHT was 5.1% and EHT alone was - 2%. Sales growth of HT-I industrial, HT-

Chapter – VIII The impact of regulatory regime in Kerala: An analysis
232
IV Commercial, Railways, and Licensees were higher than the average growth rate.
In the Low Tension sector, growth was phenomenal at 8.9%, which was mainly
propelled by LT Commercial and Domestic category.
Table 8.7
Growth rate of energy sales
Category 2003-04 2004-05 2005-06 2006-07 2007-08 2008-09 2009-10 2010-11
Annual
Average
Growth rate
Domestic 4004 6.4% 9.5% 11.7% 7.5% 5.9% 10.9% 7.6% 8.5%
Commercial 879 7.8% 15.3% 14.0% 10.6% 9.0% 13.6% 10.6% 11.5%
Industrial 751 4.3% 11.6% 6.9% 5.4% 3.2% 11.4% 7.1% 7.1%
Agricultural 202 -5.4% -0.5% 15.8% 5.0% -2.6% 5.8% 5.0% 3.1%
Street Lights 166 10.2% 13.7% 10.1% 8.7% 18.1% 3.7% 6.6% 10.1%
Sub total LT 6002 6.1% 10.5% 11.5% 7.7% 6.2% 11.1% 7.9% 8.7%
HT category
HT I 1125 10.0% 10.0% 5.4% 1.7% -9.2% 8.5% 3.2% 4.0%
HT II 130 8.5% -7.8% 3.8% 2.2% -22.5% 7.5% 3.5% -1.3%
HT-III 9 0.0% 11.1% -10.0% 0.0% 0.0% 11.1% 0.0% 1.5%
H- IV 304 11.5% 11.5% 14.0% 17.6% 14.2% 18.5% 5.4% 13.2%
EHT 66/110 1107 -6.4% -3.1% 6.6% -4.3% -5.7% 14.4% 4.8% 0.6%
Railway
Traction 46 -4.3% 31.8% 24.1% 51.4% 30.3% 13.4% 4.3% 20.3%
Bulk Supply 188 12.8% 39.6% 13.2% 6.6% -11.2% 24.3% 5.8% 12.1%
Sub total
HT 2909 3.8% 7.3% 7.7% 3.4% -4.4% 13.5% 4.3% 5.0%
Total 8911 5.3% 9.4% 10.3% 6.4% 3.0% 11.7% 6.9% 7.5%
Source: Kerala State Electricity Regulatory Commission
From the above table (table 8.7) it is amply clear that the growth was
propelled by the LT sector with sales growth rate close to 9%. The major
contributors in the LT sector are Domestic (8.5%), Commercial (11.5%) and public
lighting (10.1%). The Commission pointed out that the growth of public lighting
should be viewed with caution mainly on two counts: i) it contributes to the peak
load ii) the tariff levels are comparatively low (only Rs.2/kWh as per the projections
of the Board). Board shall introduce energy efficient CFL/LED lamps for public
lighting.

Chapter – VIII The impact of regulatory regime in Kerala: An analysis
233
Based on the proposal from KSEB, the Commission in its order dated
2 December 2009 has revised the ToD tariff for HT-EHT categories and also
introduced Maximum Demand based tariff and ToD tariff for LT industrial
consumers as an optional scheme. Since the impact of peak shifting is difficult to
assess, the Commission directed the Board to study and report not later than 6
months, the impact of the approved TOD tariff on peak shifting and on the revenue.
It was also directed that KSEB should approach the Commission with all supporting
materials, if the approved tariff has substantial financial or any other adverse
impacts. Since the Board so far has not approached the Commission on this count,
the Commission assumed that the new and revised schemes have a positive effect on
the system.
The Board in its petition dated 25-3-2010 proposed power restrictions for
two months April and May 2010. The Board proposed to impose 25% restriction on
all HT&EHT consumers, LT-II, LT-IV, LT-VI(A), LT-VI(B), LT-VI (C ), LT-VII
(A), LT-VII(B), LT-VII (C) and to restrict domestic consumption by 200 units per
month. As per the projections of the Board, due to restrictions, the consumption
would reduce by 5.97 MU per day and energy requirement by 6.87 MU per day.
After following the due procedure the Commission disposed of the petition by
allowing 10% restrictions on all consumers except LT-VID and LT-V. In the case of
domestic category the limit was fixed as 300 units/month. Accordingly, the
Commission projected that the sales would be about 2.67MU less per day for the
month of April and May 2010 ie., a total of 163MU. Hence the Commission
assumed that energy sales would be about 163MU less than the level projected by
KSEB due to power restrictions. Considering all the above, energy sales for the year
2010-11 was estimated as follows (Table-8.8):

Chapter – VIII The impact of regulatory regime in Kerala: An analysis
234
Table 8.8
Approved Energy Sales for 2010-11
Category Sales as per ARR (MU) Approved Sales (MU)
LT Category
Domestic 7078 7078
Commercial 1886 1886
Industrial 1211 1211
Agricultural 250 250
Street Lights 325 325
Sub total LT 10750 10750
HT category
HT I 1485 1485
Category Sales as per ARR (MU) Approved Sales (MU)
HT II 119 119
HT-III 10 10
H- IV 723 723
EHT 66/110 1158 1158
Railway Traction 168 168
Bulk Supply 417 417
Sub total HT 4080 4080
Total 14830 14830
Less sales due to restrictions
in April and May 2010 (163)
Net Sales 14667
Source: Kerala State Electricity Regulatory Commission
As part of the validation process, the Commission sought the details and
methodology for month-wise projection of sales by KSEB. However, Board did not
provide any data, but maintained that monthly projections were available in the ARR
petition. In the absence of sufficient information, the Commission could not proceed

Chapter – VIII The impact of regulatory regime in Kerala: An analysis
235
to allocate monthly sales for the year 2010-11, which was required for estimating the
additional commitment on fuel price increase. The Commission has directed KSEB ,
to revise the month wise energy sale based on the approved overall energy sales, and
furnish the details to the Commission within one month from the date of ARR order
2010-11.
8.5 Transmission and distribution loss
8.5.1 Introduction
KSEB in its petition has stated that in between 2001-02 and 2008-09, T&D
loss was reduced by 11.93% due to the sincere efforts taken by KSEB as shown
below. The internal loss level projected for 2010-11 is 16.78% compared to 17.70%
in 2009-10 (table 8.9).
Table 8.9
Loss reduction achieved by KSEB
Year External loss Extent of reduction
Internal loss Extent of reduction
(%) (%) (%) (%)
2001-02 32.15 30.76
2002-03 30.41 1.74 29.08 1.68
2003-04 28.46 1.95 27.44 1.64
2004-05 26.22 2.24 24.95 2.49
2005-06 24.59 1.63 22.96 1.99
2006-07 23.43 1.16 21.47 1.50
2007-08 21.63 1.80 20.02 1.45
2008-09 20.45 1.18 18.83 1.19
2009-10 (Revised
projections
19.24 1.21 17.70 1.13
2010-11
(Projections) 18.53 0.71 16.78 0.92
Source: Kerala State Electricity Regulatory Commission

Chapter – VIII The impact of regulatory regime in Kerala: An analysis
236
KSEB estimated that transmission system loss is about 5% and distribution
loss is 14.55%. As per the study report of the Power Finance Corporation, the T&D
losses of KSEB for the year 2007-08 was better compared to other states except
Andhra Pradesh and Tamil Nadu. According to KSEB, in Tamil Nadu and Andhra
Pradesh, about 20 to 30% of the consumers are unmetered and consumption is based
on assessment. In the case of Kerala metering is 100% and hence estimates are more
reliable. The Board has also given a calculation of Rs.790.55 Crore of saving through
reduction in energy losses from 2001-02 to 2008-09. According to the Board, the
target level of distribution losses stipulated by Ministry of Power at the end of 11th
plan is 15%, but the distribution losses in Kerala has already reached that level. With
respect to the directions issued by the Commission such as separation of transmission
and distribution losses, estimate of voltage level distribution losses and separation of
technical and commercial losses, the Board has forwarded a status report which was
communicated to the Commission vide letter 21-11-2009. KSEB stated that the
attempt to study losses through load flow analysis had failed due to inaccurate
database and mismatch of meters due to difference in loading in off-peak and peak
periods. A pilot study was initiated to assess the distribution losses separately in
urban and rural areas with target date of completion as February 2010. Transmission
losses could not be estimated because of inaccurate meters and low
accuracy meters in EHT panels. The replacement of meters requires considerable
capital investment and the tasks were assigned to Transmission Chief Engineers and
the reports are awaited. KSEB further reported that one of the objectives of R-
APDRP is to assess and segregate technical and commercial losses in the system.
Part-A of the R-APDRP includes establishment of base line data using IT
applications for energy accounting. The Board is in the process of replacement of
faulty meters in a phased manner. After completion of these works, AT&C loss can
be accurately quantified. In order to reduce the losses Board has narrated several text
book steps such as reduction in LT:HT ratio, strengthening of transmission network,
reconditioning of lines, capacitor compensation, realigning of LT feeders,
reallocation of transformers, use of amorphous core transformers, introducing ‘LT
less’ system, load balancing, energy audit at transformer level etc., However, no

Chapter – VIII The impact of regulatory regime in Kerala: An analysis
237
action taken report was submitted and the status of the above measures are not
known. The progress of capital works in transmission & distribution and the
proposed works for 2010-11 are shown below (Table-8.10):
Table 8.10
Physical Targets Achieved by the Board
Year 2003-04 2004-05 2005-06 2006-07 2007-08 2008-09 2009-10
(Revised)
2010-11
(projection)
Substations (Nos)
220kV 1 1 1 0 1 3 2
110 kV 6 8 4 2 4 2 20 19
66kV 3 2 4 3 1 4 6
33kV 7 15 10 10 13 16 39 19
Lines (Km)
220kV 4.3 15 56 1.01 0 29.1 28.5
110 kV 154.6 30 55 30 56.38 17.5 100 138.5
66kV 8.4 5 13 15 11.13 0 0.3 13.5
33kV 95.4 157 131 95 105.44 169.27 457.8 138
11 kV lines 1269 955 1062 1820 1807 3018 4880 3000
LT lines 4429 6074 7441 8229 8128 7636 6666 3800
Distribution Transformers
(Nos) 1063 1882 1751 2124 2553 4109 5400 5000
Source: Kerala State Electricity Regulatory Commission
As in the case of previous ARR&ERC petitions, the Board narrated the usual
steps being taken for reducing the commercial losses such as replacement of faulty
meters, anti-power theft activities, computerization of billing and revenue collection,
energy audit, loss monitoring at circle level, installing meters at transformers,
feeders and border points, providing load factor and power factor incentives etc., The
Board has stated that in 2009-10, target for replacement of meters was 7.44 lakhs of
which 3.78 has been already completed (upto September). In 2010-11, the Board’s
proposal was to replace 8 lakh meters. The status of replacement of faulty meters
reported by the Board is as follows (Table 8.11):
Table 8.11
Progress of faulty meters replacement
Year No. of faculty meters replaced
2002-03 4.21
2003-04 8.67
2004-05 4.35
2005-06 6.38
2006-07 2.69
2007-08 5.80
2008-09 6.44
Source: Kerala State Electricity Regulatory Commission
Chapter – VIII The impact of regulatory regime in Kerala: An analysis
238
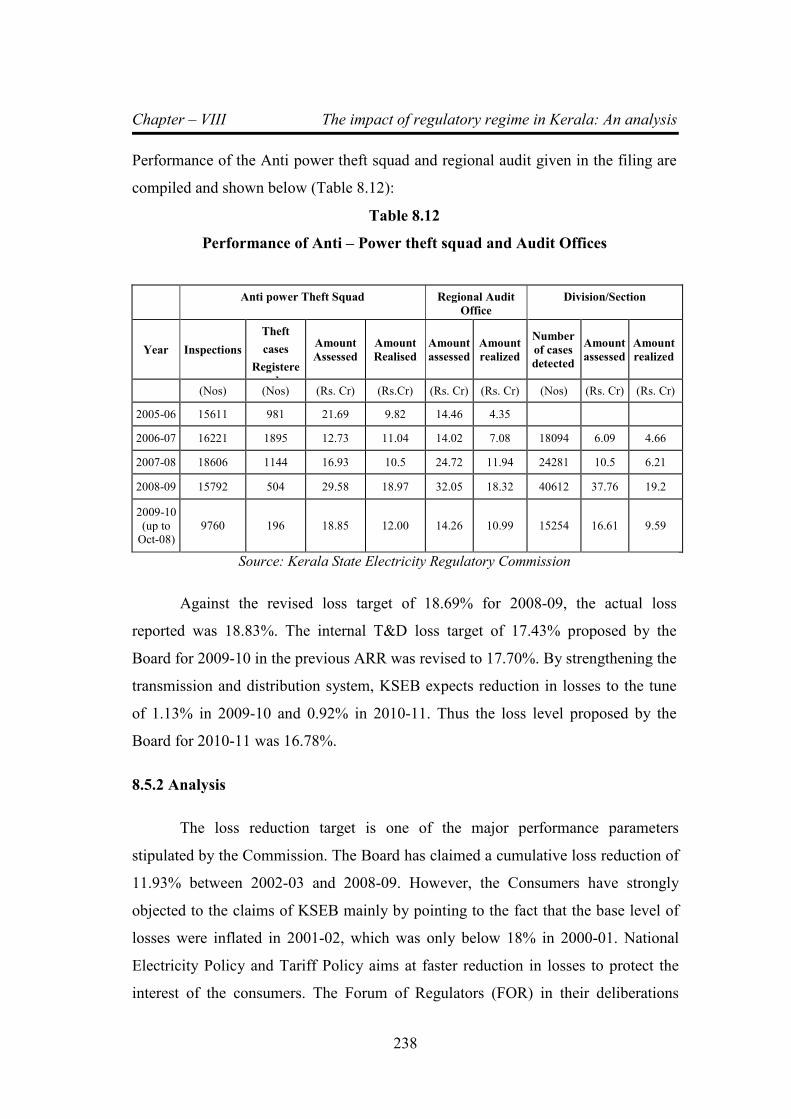
Performance of the Anti power theft squad and regional audit given in the filing are
compiled and shown below (Table 8.12):
Table 8.12
Performance of Anti – Power theft squad and Audit Offices
Anti power Theft Squad
Regional Audit
Office
Division/Section
Year Inspections
Theft
cases Registere
d
Amount
Assessed Amount
Realised Amount
assessed Amount
realized
Number
of cases
detected
Amount
assessed Amount
realized
(Nos) (Nos) (Rs. Cr) (Rs.Cr) (Rs. Cr) (Rs. Cr) (Nos) (Rs. Cr) (Rs. Cr)
2005-06 15611 981 21.69 9.82 14.46 4.35
2006-07 16221 1895 12.73 11.04 14.02 7.08 18094 6.09 4.66
2007-08 18606 1144 16.93 10.5 24.72 11.94 24281 10.5 6.21
2008-09 15792 504 29.58 18.97 32.05 18.32 40612 37.76 19.2
2009-10
(up to Oct-08)
9760 196 18.85 12.00 14.26 10.99 15254 16.61 9.59
Source: Kerala State Electricity Regulatory Commission
Against the revised loss target of 18.69% for 2008-09, the actual loss
reported was 18.83%. The internal T&D loss target of 17.43% proposed by the
Board for 2009-10 in the previous ARR was revised to 17.70%. By strengthening the
transmission and distribution system, KSEB expects reduction in losses to the tune
of 1.13% in 2009-10 and 0.92% in 2010-11. Thus the loss level proposed by the
Board for 2010-11 was 16.78%.
8.5.2 Analysis
The loss reduction target is one of the major performance parameters
stipulated by the Commission. The Board has claimed a cumulative loss reduction of
11.93% between 2002-03 and 2008-09. However, the Consumers have strongly
objected to the claims of KSEB mainly by pointing to the fact that the base level of
losses were inflated in 2001-02, which was only below 18% in 2000-01. National
Electricity Policy and Tariff Policy aims at faster reduction in losses to protect the
interest of the consumers. The Forum of Regulators (FOR) in their deliberations

Chapter – VIII The impact of regulatory regime in Kerala: An analysis
239
stressed the need for aggressive reduction of AT&C losses. The Sub Committee of
Forum of Regulators on “Methods of loss reduction” has suggested that loss
reduction target of not less than 10% of the current level to be set if the current loss
level is above 20% (ie., 2% reduction every year). It is also pertinent to point out that
the Board could not achieve the proposed loss reduction in any of the ARR&ERC
petitions in the last 6 years. Kerala is a 100% metered State with low level of non-
technical losses compared to other states. However, so far the Board did not initiate a
comprehensive exercise to assess the base level of T&D loss in the State. In the
absence of any reliable studies on loss level, the loss reduction targets proposed by
the Board is more of an assumption than realistic assessment. The Commission since
its inception, has repeatedly given directions for carrying out loss studies at different
levels for reasonable assessment of the base level of losses. In the compliance report
on directives, the Board has admitted that the directions have been not complied so
far. After the lapse of four years, Board has reported in the letter dated 24-11-2009 as
follows:
(1) Board has made an attempt to find out transmission and distribution losses
through load flow analysis. But this was not successful for want of sufficiently
accurate database, issues of accuracy of meters and large number of
arbitrary assumptions required. Hence Board has taken alternative steps for
assessment of T&D losses.
(2) In the distribution wing a pilot study is initiated for assessment of
distribution losses in 33kV/11kV and LT system as well as commercial
losses, separately in urban and rural areas. the Board has targeting to
complete the study by 15th February 2010.
(3) Transmission loss: to find out transmission losses accurate metered data
are required. Many meters with EHV panels are of lower accuracy levels and
need to be replaced with accurate meters. The Board has directed
Transmission chief engineers to evolve a suitable methodology for
segregation of transmission losses at different voltage levels.”

Chapter – VIII The impact of regulatory regime in Kerala: An analysis
240
The above reply shows the state of affairs in the Board in dealing with
creation of basic database on the system. In the absence of such information, the
rationale for investments proposed by the Board for system strengthening and
expansion are quite questionable. The Commission could infer from the above reply
that the transmission and distribution loss of 5% and 14.55% respectively claimed by
the Board is only by a thumb rule. The contention of the Board that heavy investment
is required for replacing EHV panels needs to be viewed seriously since, it shows
even after providing substantial amount under R&M expenses, basic monitoring
systems are not kept in sound condition. Further such approach would look lime a
deliberate attempt to withhold critical information so as to escape proper scrutiny and
the matter deserves in depth probe.
As noted above, the Commission faces the problem of lack of authenticity of
data since the loss figures are never supported with adequate data. As per the data
provided by the Board, about 45 lakhs of faulty /electromechanical meters were
replaced (other than new connections) with electronic meters in the last 5 years. It is
reasonable to attribute the reduction in losses to the replacement of more sensitive
electronic meters, than proper strengthening of the distribution system. It has been
noticed that after the introduction of electronic meters, recorded sales have been
substantially improved, which could be one reason for improvement in loss reduction
without corresponding reduction in technical loss. This conclusion carries more
weight in the absence of any better information or supporting details provided by
KSEB. Even though a wing of KSEB namely TRAC is communicating with plan and
programmes for loss reduction, it is reasonably suspected that none of the such plans
and programmes and consequent targeted loss reduction are seen communicated to
the field office through the Chief Engineers of Transmission and Distribution wings.
The Commission also noted that the Board has taken little effort in estimating
losses using the existing facilities. The Board has already invested more than Rs.500
Crore in APDRP scheme. One of the major objectives of the APDRP scheme is
energy audit and systems are created for measurement of losses since funds
allocation as well as incentives is based on the reduction in distribution loss. If such

Chapter – VIII The impact of regulatory regime in Kerala: An analysis
241
facilities are not properly employed to estimate the loss, it apparently points to the
fact that investments made for recording such information are either faulty or not
maintained properly.
The Board has always projected higher loss reduction, which was later scaled
down to lower levels and the actuals will be again lower. Target for loss reduction in
2008-09 was 1.63%, which was revised to 1.32%. Against this, the actual reduction
achieved in 2008-09 was only 1.19%. Similarly for 2009-10, loss reduction was
projected as 1.27%, which was revised to 1.13%. In 2010-11, the Board proposed a
lower target of 0.92% (Table No.8.13).
The Commission also analysed the capital expenditure proposed by KSEB in
the past in relation to the loss levels. It is clear that there is no correlation between
loss targets and capital expenditure proposed. Most of schemes provided under
distribution are generally for providing service connection, rather than for than
strengthening the distribution system.
Table 8.13
Capital expenditure in Distribution
Years Capital Expenditure (Rs. Crore) Loss reduction
Target proposed (%)
Proposed in ARR
Revised Actuals
2006-07 290.00 288.00 255.01 1.76
2007-08 464.36 386.09 284.43 1.83
2008-09 419.52 456.25 233.16 1.63
2009-10 600.64 436.40 NA 1.27
2010-11 425.00 0.92
Source: Kerala State Electricity Regulatory Commission
Lack of proper studies (to support the loss targets proposed by the Board) are
proving to be costly to the Board since, the underachievement of losses would result
in disallowance of excess power purchase cost during the truing up process. Hence,

Chapter – VIII The impact of regulatory regime in Kerala: An analysis
242
the Board should realise the facts and immediately initiate proper system to estimate
the losses on a sound footing by giving instructions to Chief Engineers to fix section-
wise loss reduction targets and to conduct month-wise monitoring of input energy
into the section and revenue realisation. Best achievements have to be properly
rewarded.
8.5.3 Progress of replacement of faulty meters
The Commission noted that progress in the area of replacement of faulty
meters is also tardy. As against the target of 10.3 lakhs in 2008-09, only 6.44 lakhs
meters were replaced. In 2009-10 target set by the Board was 8 lakhs, which was
later revised to 7.44 lakhs. Against this, the achievement reported as on 30-9-2009 is
only 3.78 lakhs. The Commission noted that total number of faulty meters in the
system remains at very high levels (7.44 lakhs). In the letter dated 13-8-
2009 on status of compliance, the Board reported that about 3.9 lakh faulty meters
are expected to be faulty thus the total faulty meters will be 11.39 lakhs (single phase
only). The Board also provided a plan for complete replacement of meters by March
2010 along with a purchase plan of about 17 lakh Single-phase static meters with
LCD (Ref table-8.14). Mere purchase of meters at competitive rates without
ensuring quality of meters is likely to increase the number of faulty meters year by
year even if Crores of meters are replaced.
Table 8.14
Progress of replacement of faulty metes – Target Vs Achievement
Year Target given in
the ARR (Lakhs) Revised Target
(Lakhs)
No. of Faulty meters actually replaced
(Lakhs)
2002-03 4.21
2003-04 8.67
2004-05 5.00 4.35
2005-06 5.00 8.50 6.38
2006-07 4.00 4.00 2.69
2007-08 4.13 6.00 5.80
2008-09 6.00 10.30 6.44
2009-10 8.00 7.44 (data not available)
Source: Kerala State Electricity Regulatory Commission

Chapter – VIII The impact of regulatory regime in Kerala: An analysis
243
Considering the routine exercise of purchase of meters, the Commission
sought year-wise details of purchase of meters, number of faulty meters reported,
new connection provided, number of faulty meters replaced, total number of meters
used and closing stock in the following format. Board conveniently, skipped the data
on total number of purchase of meters over the years and gave only the following
data (Table 8.15) which is incomplete.
Table 8.15
Purchase of meters and utilization
Year
No. of
faulty
meters as
on 1st April
No. of
faulty
meters
reported
Total
number of
meters
purchased
No. of new
connections
provided
No. of
faulty
meters
replaced
Total No.
of meters
used
Closing stock
of meters as
on 31st
March
2002-03 355520 427000
2003-04 391815 863536
2004-05 548307 418791
2005-06 497222 608445 548521 636256
2006-07 469411 481355 478745 269844
2007-08 680922 583630 482725 580484
2008-09 684068 747922 482766 647282 2009-10 784708 553400 323814 741015
Total 2974752 3612213 4584208
Source: Kerala State Electricity Regulatory Commission
The Board did not provide the critical information on number of meters
purchased and closing stock of meters. The data provided by the Board shows that
even after replacing considerable number of meters every year the opening position
of faulty meters each year has in fact increased. This is on account of substantial
number of meters becoming faulty every year, which raises the concern on the
quality of meters being procured. It should also be noted with concern that from
2005-06 to 2009-10 (5 years), about 29.74 lakh meters become faulty, which is about
37% of the total number of consumers. There are reports that the new meters
purchased for replacing faulty meters becoming faulty within a short time. It is
alarming to note that from 2002-03 to 2009-10, Board has replaced 45.85lakh faulty
meters. Assuming Rs.300 per meter, about Rs.137.52 crore has been spent on
replacing faulty meters, which is being loaded on to the consumers. The Commission
in the previous order observed that a large number of meters are becoming faulty

Chapter – VIII The impact of regulatory regime in Kerala: An analysis
244
regularly, which points towards the necessity of procuring high quality meters by
issuing good quality specifications and ensuring the same.
8.5.4 Progress in achieving planned capital investment programme
The Commission noted that the target investments proposed by the Board in the
transmission and distribution sector have never been achieved. The Board has
always proposed ambitious investment programmes, later the targets were revised
downwards, and the actual achievement was still less.
Table 8.16
Performance of the Board on project implementation in Transmission &
Distribution
Year 2007-08
(Proj)
2007-08
(Actual)
2008-09
(Proj)
2008-09
(Actual)
2009-10
(Proj)
2009-10
(Rev)
2010-11
(Proj)
Substations
(Nos)
220kV 3 1 2 2 3 2
110 kV 11 4 7 2 18 20 19
66kV 1 1 5 4 6
33kV 31 13 32 16 27 39 19
Lines (Km)
220kV 30.7 1.01 18.5 0 74 29.1 28.5
Year 2007-08
(Proj)
2007-08
(Actual)
2008-09
(Proj)
2008-09
(Actual)
2009-10
(Proj)
2009-10
(Rev)
2010-11
(Proj)
110 kV 114.75 56.38 119 17.5 202.3 100 138.5
66kV 36.99 11.13 15.5 0 16 0.3 13.5
33kV 170.5 105.44 375.7 169.27 318.3 457.8 138
11 kV lines 2000 1807 3941 3018 5000 4880 3000
LT lines 6000 8128 6500 7636 3800 6666 3800
Distribution
Transformers
(Nos)
2000 2553 4128 4109 5000 5400 5000
Source: Kerala State Electricity Regulatory Commission

Chapter – VIII The impact of regulatory regime in Kerala: An analysis
245
As per the above table (table no. 8.16) , for 2007-08, the Board has proposed
three 220 kV substations, eleven 110 kV substations and thirty-one 33 kV
substations, but the achievement was only one 220kV substation, four 110 kV
substations and thirteen 33kV substations. In 2008-09 as against the target of 2nos of
220kV substations, none was completed, against the target of 7 nos. (including the
backlog of previous years) of 110kV substations only 2 was achieved. Against 16
nos. of 33kV substations only 16 are operational. Same is the case with construction
of lines. As against the target of 30.70 km of 220 kV lines in 2007-08 achievement
was only 1.01 km in 2007-08. In 2008-09 as against the target of 18.5 kms the
achievement was nil. Exception is in the case of installation of transformers and
construction of 11kV lines. However, the Commission is completely in the dark on
the benefits of such investments made in the system.
Table 8.17
Loss reduction proposed, approved and achievement
Year Proposed in
the ARR (%)
Approved by the
Commission (%)
Actual achieved by
KSEB (%)
2005-06 2.72 2.72 1.99
2006-07 1.76 2.50 1.50
2007-08 1.83 2.00 1.45
2008-09 1.63 1.63 1.19
2009-10 1.27 1.00 1.13*
*proposed to be achieved as per ARR petition
The observations of the Commission reveal the following (Table-8.17):
� The base level of losses is not firm. The present loss levels are based on the
difference between total energy input and energy sales without proper
backing of technical studies and hence the exact level of loss is not
ascertainable
� No information is available on the separation of transmission and distribution
losses or technical and commercial losses

Chapter – VIII The impact of regulatory regime in Kerala: An analysis
246
� Loss targets are prepared without any systematic basis or capital expenditure
plan and system-strengthening plan. No relation is established between the
amount of investment and loss reduction
� Progress of works proposed and executed is very low, which contributes to
non-achievement of targets set by the Commission.
� No systems are in place for estimation and periodic monitoring of system
losses and remedial measures. Plans and targets seem to remain at the head
office level only. At the field level, programmes and targets are not properly
communicated.
The Board has projected an internal loss level of 16.78%, which is about
0.92% less than the revised estimates for the year 2009-10. The Commission had
fixed internal loss for the year 2009-10 as 16.92%. After having deliberated on the
issue in detail, the Commission is of the view that for 2010-11, the targeted loss
reduction shall be 0.92% as projected by the Board, from that approved for the year
2009-10 ie.,16.92%. Accordingly, the loss target fixed for 2010-11 would be 16.00%
as follows (Table no. 8.18):
Table 8.18
Loss target fixed by commission
Proposed in the
ARR
14830
Approved by the Commission
Energy sales (MU) 14830 14667
Internal loss (%) 16.78% 16.00%
Net Energy input to KSEB System (MU) 17821 17461
Source: Kerala State Electricity Regulatory Commission
8.5.5 AT & C Loss
The Commission has repeatedly pointed out that the amount collected against
the current demand has to be separated to know the actual collection efficiency. It is
obvious that the collection efficiency furnished by the Board would be lower if
collection against current demand is considered. In the Order on ARR & ERC for
2008-09 and 2009-10, the Commission had fixed collection efficiency as 98%. For

Chapter – VIII The impact of regulatory regime in Kerala: An analysis
247
the year 2010-11 the collection efficiency shall be 99%. Accordingly the AT&C loss
target for 2010-11 shall be (table 8.19):
Table 8.19
AT&C Loss – target fixed by KSERC
2010-11
T&D loss 16.00%
Collection efficiency 99.00%
AT&C loss 16.84%
Source: Kerala State Electricity Regulatory Commission
8.6 Review Of Annual Revenue Requirements
8.6.1 Introduction
The procedure for review and approval of Annual Review Requirement of the
board is deliberated in this section by taking the typical case of the ARR approval for
the year 2010 – 11. However, summary of regulatory scrutiny for the previous years
is also included in the analysis. The Board has projected an Aggregate Revenue
Requirement (ARR) of Rs.7503.98 Crore for 2010-11 including the return on equity.
The details of expenses under different heads and the approach of the Commission
are explained in the ensuing sections.
8.6.2 Generation and Power purchase
Total energy requirement of energy for 2010-11 estimated by the Board was
18230.16 MU. The peak demand estimated for the year was 3280 MW, which is an
increase of 6% on a compounded basis over the peak demand met during 2007-08
(2745 MW). Two projects, Neriamangalam extension (25MW) and Kuttiadi Tail race
(3.75 MW) were commissioned during 2008-09. Kuttiadi Additional extension (100
MW) was expected to commence commercial operation in March 2010.

Chapter – VIII The impact of regulatory regime in Kerala: An analysis
248
8.6.3 Internal Generation
Based on the ten-year inflow data (from 2000-01 to 2009-10), the average
inflow was estimated as 6537 MU. Based on the present reservoir storage and past
trend in inflow it was estimated that 19.15 MU per day hydro generation was
expected in the first two months (April and May) of the current year. Based on the 10
year average, daily average generation of 17.89MU was expected for the period from
June 2010 to March 2011. Hence the total hydro availability from storage plants for
the next financial year was estimated as 6607MU (19.15MU/day for two months &
17.89 MU/day from June,09 to March, 2010). In addition to this, 106 MU was
expected from small hydro projects having capacity of 41.10MW and 240MU from
Kuttiyadi additional extension. Thus the total expected hydro generation for the year
2010-11 was 6953.03MU. By considering 0.5% auxiliary consumption, the net hydro
availability would be 6918.4MU.
In 2010-11, the Board was planning to operate BDPP and KDPP to the full
available capacity. The cost of fuel was the major issue with these
plants. The auxiliary consumption was taken as 2.5% of the total generation.
According to the Board a total of 286.47MU was expected from BDPP and 447 MU
from KDPP. ie., a total of about 733.47 MU from BDPP and KDPP. Considering the
auxiliary consumption, the net energy available would be 715.13 MU. Based on the
price of fuel as on 1-12-2009, the variable cost of generation was estimated as
Rs.7.21/kWh for BDPP and Rs.7.37/kWh for KDPP. The total generation cost from
these plants was estimated to be Rs.536.58 Crores as follows (Table-8.20):
Table 8.20
Generation and cost of BDPP and KDPP proposed for 2010-11
Generating station
Gross Generation
Auxiliary consumption
Net Generation
Variable cost
Total Variable cost
(MU) (MU) (MU) (Rs/kWh) (Rs in Crore)
BDPP 286.47 7.16 279.31 7.21 206.54
KDPP 447.00 11.18 435.83 7.37 329.44
Total 733.47 18.34 715.13 536.58
Source: Kerala State Electricity Regulatory Commission

Chapter – VIII The impact of regulatory regime in Kerala: An analysis
249
8.6.4 Purchase of power from Central Generating Stations (CGS)
As projected by KSEB, the present allocation from Central Generating
Stations was about 1029.7 MW. In addition, NLC expansion Stage II was expected
to start commercial operation from April 2010 and Koodamkulam 1st unit by June
2010 and 2nd
unit by December 2010. Another project of NTPC Simhadri 2nd
stage
was expected to start commercial operation by February 2011. The new projects
expected at the Central level are as follows (Table-8.21):
Table 8.21
New CGS expected to be commissioned during 2010-11
Name of the station Total
capacity Allocation to KSEB
Allocated capacity
Expected date of commercial operation
(MW) (%) (MW)
NLC- Exp- Stge-II 500 14.0 70 April- 2010
Koodamkulam- NPC 2000 13.0 260 1st unit by June-10 and 2nd unit by Dec-10
NTPC- Simhadri 1000 8.0 80 Feb-11
Total 3500 410
Source: Kerala State Electricity Regulatory Commission
The capacities available from CGS stations for the year 2010-11
and the estimated fixed cost projected by the Board are given below (table-8.22).

Chapter – VIII The impact of regulatory regime in Kerala: An analysis
250
Table 8.22
Fixed cost commitment to CGS during 2010-11
Sl No.
Power Plant Allotted Capacity Fixed Cost
(MW) (Rs in crore)
1 Thalcher - II 415.8 175.64
2 NLC- Exp- Stage-1 58.8 34.31
3 NLC-II- Stage-1 63.0 12.67
5 NLC-II- Stage-2 90.0 19.68
6 RSTPS Stage I, II&III 306.1 87.58
7 MAPS 23.0 24.48
8 KAIGA Stg I 38.0 70.36
9 KAIGA Stg II 35.0 67.22
10 Kudankulam 266.0 283.74
11 NLC - II Exp 70.0 38.73
12 Simhadri Exp 80.0 8.40
Total 1445.6 822.80
Source: Kerala State Electricity Regulatory Commission
The Board has stated that the fixed cost shown above is likely to increase by
67% if CERC finalises rates as per the norms applicable for the period 2009-14. The
variable cost of power from central stations has been estimated based on the actuals
from April 2009 to September 2009. In the case of nuclear power stations single part
tariff would be applicable ie., Rs.2.00/kWh for MAPS and Rs.3.12/kWh for KAIGA.
For Koodamkulam Rs.3.25/kWh was taken. The average cost of NLC expansion was
adopted for new NLC Exp Stage II. The fixed and variable cost of Simhadri was
taken as Rs.1.00/kWh and Rs.1.23/kWh respectively.
The capacity allocation of Central stations and the generation expected by
KSEB would be as follows:
Chapter – VIII The impact of regulatory regime in Kerala: An analysis
251
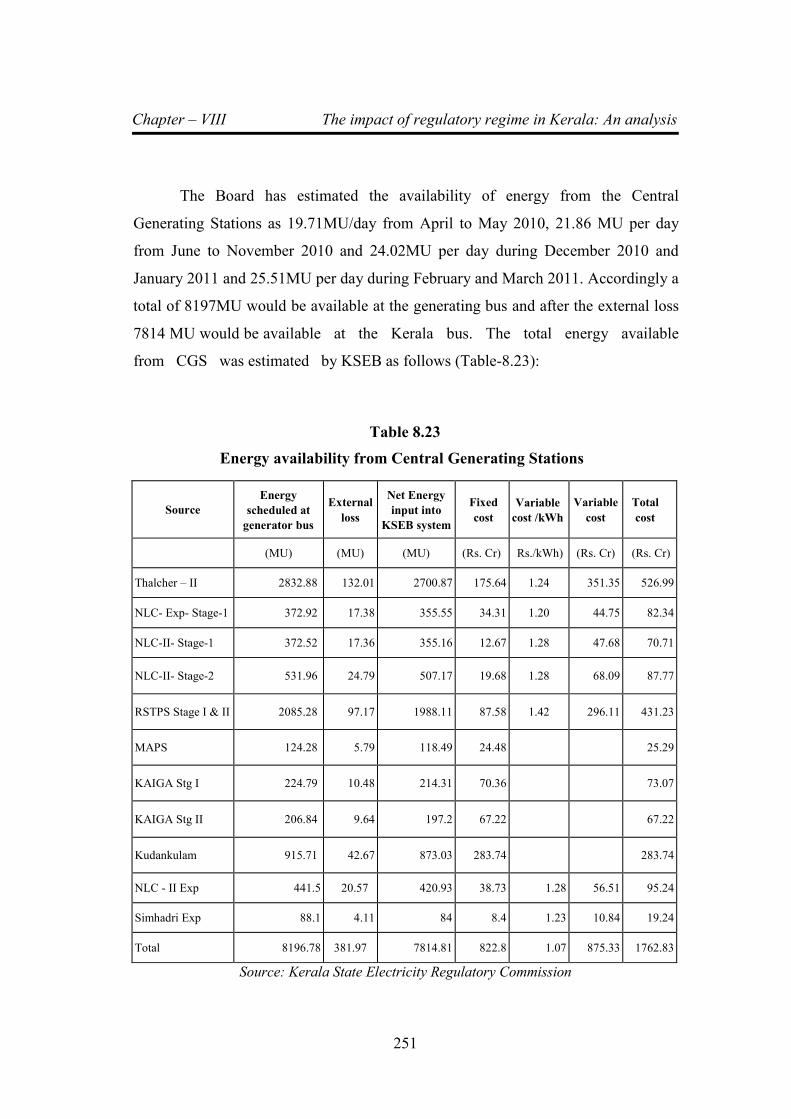
The Board has estimated the availability of energy from the Central
Generating Stations as 19.71MU/day from April to May 2010, 21.86 MU per day
from June to November 2010 and 24.02MU per day during December 2010 and
January 2011 and 25.51MU per day during February and March 2011. Accordingly a
total of 8197MU would be available at the generating bus and after the external loss
7814 MU would be available at the Kerala bus. The total energy available
from CGS was estimated by KSEB as follows (Table-8.23):
Table 8.23
Energy availability from Central Generating Stations
Source
Energy
scheduled at
generator bus
External
loss
Net Energy
input into
KSEB system
Fixed
cost
Variable
cost /kWh
Variable
cost
Total
cost
(MU) (MU) (MU) (Rs. Cr) Rs./kWh) (Rs. Cr) (Rs. Cr)
Thalcher – II 2832.88 132.01 2700.87 175.64 1.24 351.35 526.99
NLC- Exp- Stage-1 372.92 17.38 355.55 34.31 1.20 44.75 82.34
NLC-II- Stage-1 372.52 17.36 355.16 12.67 1.28 47.68 70.71
NLC-II- Stage-2 531.96 24.79 507.17 19.68 1.28 68.09 87.77
RSTPS Stage I & II 2085.28 97.17 1988.11 87.58 1.42 296.11 431.23
MAPS 124.28 5.79 118.49 24.48 25.29
KAIGA Stg I 224.79 10.48 214.31 70.36 73.07
KAIGA Stg II 206.84 9.64 197.2 67.22 67.22
Kudankulam 915.71 42.67 873.03 283.74 283.74
NLC - II Exp 441.5 20.57 420.93 38.73 1.28 56.51 95.24
Simhadri Exp 88.1 4.11 84 8.4 1.23 10.84 19.24
Total 8196.78 381.97 7814.81 822.8 1.07 875.33 1762.83
Source: Kerala State Electricity Regulatory Commission

Chapter – VIII The impact of regulatory regime in Kerala: An analysis
252
8.6.5 Power purchase from IPPs
In addition to CGS, RGCCPP (180 MW), BSES (157 MW) and KPCL
(20MW) are the IPPs available to the State. From these plants 2069 MU is expected
for the year 2010-11. The fixed cost commitments to these plants based on the past
claims are Rs.9.18 Crore for KPCL, Rs.89.76 Crore for BSES and Rs.99.16 Crore
for RGCCPP. The average cost of power from BSES and RGCCPP was proposed
as Rs.7.16kWh and Rs.7.34/kWh respectively and for KPCL Rs.7.26/kWh was
assumed based on the fuel price on 1st December 2009. The power purchase cost
from IPPs estimated by the Board is as follows(Table-8.24):
Table 8.24
Cost of power purchase from IPPs
Source Annual
generation proposed (MU)
Fixed cost (Rs.Cr)
Variable Cost
Total (Rs.Cr) Rate
(Rs/kWh) Amount (Rs.Cr)
RGCCPP 1010.69 99.16 7.34 741.85 841.01
BSES 922.03 89.76 7.16 660.17 749.93
KPCL 135.96 9.18 7.26 98.70 107.88
Total 2068.68 198.10 1500.72 1698.82
Source: Kerala State Electricity Regulatory Commission
In addition to the above IPPs, the Board proposed to purchase power from
Wind energy generators, Ullumkal SHP and MPS Steel Co-generation Plant. Total
energy expected from these sources was 135MU. The Board has entered into PPA
with WEGs for 27.9 MW at Agali and Ramakkalmedu. The Board expects about
61.05 MU from WEGs @ Rs.3.14 /kWh. The estimated cost would be about
Rs.19.17 crore. Ullumkal SHP with installed capacity of 7 MW would be
operational from this year and the cost of purchase is now a provisional rate of
Rs.2.00/kWh. The total generation expected is 34 MU at a cost of Rs.

Chapter – VIII The impact of regulatory regime in Kerala: An analysis
253
6.80 crore. M/s MPS Steel may provide 40 MU from the plant @2.34/kWh
which would be about Rs.9.55 crore (Table-8.25).
Table 8.25
Proposed generation & Cost from other IPPs
Source Capacity
(MW)
Annual
generation
proposed (MU)
Cost of
energy
(Rs/ kWh)
Total
cost
(Rs.Cr)
Wind IPPs 21.90 61.05 3.14 19.17
Ullumkal SHP 7.00 34.00 2.00 6.80
MP steel- Co generation plant 8.00 40.80 2.34 9.55
Total 36.90 135.85 35.52
Source: Kerala State Electricity Regulatory Commission
The proposed monthly demand supply position for the year is given in the
following table (Table8.26). It is estimated that 165MU may be purchased from
traders/day ahead purchase or exchanges (Table 8.26).
Table 8.26
Demand and Supply position for the year 2010-11
Month
Energy
Demand
(MU)
Availability (MU) Shortages to be
met through
Traders/ PX (MU) Hydro
(net)
KSEB sources
thermal &
Wind
CGS IPPs Total
Apr-10 1535.03 593.51 73.38 591.20 212.31 1470.41 64.63
May-10 1577.34 609.34 75.81 610.91 214.49 1510.55 66.79
Jun-10 1432.69 508.81 69.02 655.84 199.02 1432.69 0.00
Jul-10 1387.44 567.63 29.22 677.70 112.89 1387.44 0.00
Aug-10 1494.62 584.51 24.43 677.70 207.98 1494.62 0.00
Sep-10 1452.32 609.48 73.38 655.84 113.62 1452.32 0.00
Oct-10 1538.96 592.05 64.60 677.70 204.60 1538.96 0.00
Nov-10 1517.31 558.65 73.38 655.84 195.55 1483.42 33.89
Dec-10 1555.12 545.92 63.07 744.50 201.64 1555.12 0.00
Jan-11 1579.42 584.14 59.19 744.50 191.60 1579.42 0.00
Feb-11 1484.04 553.50 53.49 714.26 162.80 1484.05 0.00
Mar-11 1648.85 610.8
5 59.19 790.7
9 188.02 1648.85 0.00
Total 18203.15 6918.4
0 718.13 8196.7
8 2204.53 18037.84 165.31
Source: Kerala State Electricity Regulatory Commission

Chapter – VIII The impact of regulatory regime in Kerala: An analysis
254
Based on the above the merit order stack proposed by KSEB is as follows:
Table 8.27
Merit Order Stack as projected by KSEB
Source Merit Order
Estimated variable cost for 2010-11 (Rs/kWh)
Source Merit Order
Estimated variable cost for 2010-11
(Rs/kWh)
Hydel 1 0 MP steel Co-Gen 11 2.34 Thalcher - II 2 1.20 Kaiga 12 3.13
NLC - Exp 3 1.20 Kaiga- Stg-II 13 3.13 NLC-II - Stage-1 4 1.28 Wind IPP 14 3.14 NLC- Exp- Stage-II 5 1.28 Koodamkulam 15 3.25 NLCII - Stage II 6 1.28 BSES 16 7.16 NTPC- RSTPS 7 1.42 BDPP 17 7.21 MAPS 8 1.97 KPCL 18 7.26
Wind -Kanjikode 9 2.00 Kayamkulam 19 7.34 Ullumkal IPP 10 2.00 KDPP 20 7.37
Source: Kerala State Electricity Regulatory Commission
8.6.6 Transmission charges
Transmission charges payable to PGCIL proposed by the
Board based on the actuals from April 2009 to September 2009 are as follows:
Table 8.28
Transmission charges payable
Sl. No. Items
Actuals Apr-09 to Sep-09
Estimate for the year 2010-11
1
Southern region Transmission charges 85.54 204.92
ULDC Charges 6.46 16.39 Sub total 91.99 221.31
2 NTPC Kayamkulam Transmission charges 5.64 11.27
3
Total transmission charges 232.58
Source: Kerala State Electricity Regulatory Commission
In addition to the above, income tax, incentives, water cess, foreign exchange
variation, etc., are also payable to CGS and PGCIL. Based on the actual bills in the
past years the Board projects the same as Rs.104.19 Crore for 2010-11.

Chapter – VIII The impact of regulatory regime in Kerala: An analysis
255
Based on the above, total internal generation cost (excluding the cost of hydel
stations) projected by the Board as Rs.536.58 Crore and power purchase cost as
Rs.3824.75 Crore, totaling to an amount of Rs.4361.33 Crore i.e., about an average
of Rs.2.45/kWh if internal generation and power purchase cost are taken together.
The power purchase cost alone works out to 3.75/kWh. Summary of total generation
and power purchase cost proposed by the Board is as follows (Table-8.29):
Table 8.29
Internal generation and Power purchase proposed by KSEB for 2010-11
Source
Energy
Produced
/Purchased
Auxiliary
Consumption
External
Loss
Net Energy
Input to
KSEB T&D
system
Fixed
Cost
Incentive,
Tax, etc.
Total
Variable
cost
Total Cost
MU MU MU MU Rs. Cr Rs. Cr Rs. Cr Rs. Cr
KSEB Internal
Hydel 6953.16 34.77 6918.40
Wind -Kanjikode 3.00 0.00 3.00 0.60 0.60
BDPP 286.47 7.16 279.31 206.54 206.54
KDPP 447.00 11.18 435.83 329.44 329.44
Sub total 7689.63 53.10 7636.53 536.58 536.58
Power purchase
(a) CGS
Thalcher – II 2832.88 132.01 2700.87 175.64 3.34 339.95 518.92
NLC- Exp- Stage-1
372.92 17.38 355.55 34.31 3.28 44.75 82.34
NLC-II- Stage-1 372.52 17.36 355.16 12.67 10.36 47.68 70.71
NLC-II- Stage-2 531.96 24.79 507.17 19.68 68.09 87.77
RSPTS Stage
I & II 2085.28 97.17 1988.11 87.58 47.54 296.11 431.23
MAPS 124.28 5.79 118.49 24.48 0.81 0.00 25.29
KAIGA Stg I 224.79 10.48 214.31 70.36 2.71 0.00 73.07
KAIGA Stg II 206.84 9.64 197.20 67.22 0.00 0.00 67.22
Kudankulam 915.71 42.67 873.03 283.74 0.00 0.00 283.74
NLC - II Exp 441.50 20.57 420.93 38.73 0.00 56.51 95.24
Simhadri Exp 88.10 4.11 84.00 8.40 0.00 10.84 19.24
IPPs
RGCCPP 1010.69 1010.69 99.16 741.85 841.01
BSES 922.03 922.03 89.76 660.17 749.93
KPCL 135.96 135.96 9.18 98.70 107.88
Wind 61.05 61.05 19.17 19.17
Ullumkal 34.00 34.00 6.80 6.80
MP steel 40.80 40.80 9.55 9.55
Traders 165.31 165.31 82.66 82.66

Chapter – VIII The impact of regulatory regime in Kerala: An analysis
256
PGCIL Charges
Eastern Region 0.00 0.00 0.05 0.00 0.00
Southern Region 0.00 221.31 20.39 0.0 241.70
Kayamkulam 0.00 11.28 0.00 0.00 11.28
Sub total power
purchase 10566.62 1253.50 88.47 2482.83 3824.75
Total 18256.25 53.10 381.97 17821.18 1253.50 88.47 3019.41 4361.33
Source: Kerala State Electricity Regulatory Commission
8.6.7 Analysis
The total power generation and purchase expenses proposed by the Board for
the year 2010-11 was comparatively higher than the levels in the previous years
mainly on account of increases in the cost of power from the liquid fuel stations. Of
the total energy requirement, about 15% (2802MU) was from the liquid fuel stations,
but the cost was about 51% of the total cost (Rs. 2235 Crore), at an average rate of
about Rs.8/kWh. The average cost of power including hydel stations was
Rs.2.45/kWh, and excluding hydel was Rs.4/kWh. If the energy from liquid fuel
stations are excluded, the average cost of power would be reduced to Rs.1.41/kWh
ie., by Rs.1/kWh. As pointed out by the commission earlier, this shows the high cost
of power the consumers in Kerala are forced to pay for the lack of proper planning
and execution by KSEB over the years.
The analysis of the proposal of the Board on generation and power purchase
in detail, which is given in the following sections.
8.6.7.1 Internal generation
The Board has estimated the hydro generation at 6953.16 MU, considering
19.51MU per day for April and May 2010. Considering the storage available, the
Commission re-estimates the hydro availability for April and May 2010. The storage
as on 31-4-2010 was 1202MU. The average inflow in May was 179MU.
By providing 550 MU as reserve on 1-6-2010, generation possible in May
would be 831MU. The Board has already generated 584MU in April. The total hydro
available for April and May would be 1415MU, which works out to be an average of
about 23.2MU instead of 19.15MU estimated by the Board. Hence, the Commission

Chapter – VIII The impact of regulatory regime in Kerala: An analysis
257
considered a conservative estimate of 23MU per day for April and May, 2010. Thus
the estimated hydro generation for 2010-11 would be about 234MU higher than the
estimates of the Board. Hence the Commission re-estimated the hydro availability at
7187 MU.
The Board has projected 733.47 MU from BDPP and KDPP at the rate of
Rs.7.21/kWh and Rs.7.37/kWh. The Commission generally projects the cost of
power from these stations based on the projections of KSEB and price of fuel. The
Commission has already issued KSERC (Fuel Price Adjustment formula)
Regulations, 2009. As per the regulation, the difference in fuel cost over the
approved level will be adjusted in each quarter considering the benchmark
performance parameter such as station heat rate, specific fuel oil consumption etc.,
The Commission as part of fixing the benchmark parameters, sought the details of
station heat rate (including the heat rate prescribed by the manufacturers) and other
parameters. KSEB provided the actual performance parameters up to the month of
December 2009. The Commission also convened a meeting with KSEB on this issue
on 16-4-2010. In the meeting, the Board presented its draft normative calculations by
considering derating, PLF and other corrections, which was about 10 to 20% higher
than the actual values. In the case of KDPP, the Board has stated certain assumptions
have been used in the past to estimate the parameters. The Commission has directed
the Board to separately provide its proposal on this. The Commission was of the
view that the proposal of the Board can be considered after a consultation process. In
the mean time, for the purpose of estimation, following values based on the data
submitted by KSEB was used, which shall be replaced with approved normative
parameters as and when it is approved by the Commission. Accordingly tentative
benchmark parameters are worked out as follows (Table-8.30)

Chapter – VIII The impact of regulatory regime in Kerala: An analysis
258
Table 8.30
KSERC Benchmark parameters for BDPP/KDPP
BDPP KDPP
Gross station heat rate
(kCal/kWh)
2000 1945
Average Calorific value of 10045 9700 Lubricant oil consumption 1.32 0.50 Price of LSHS (Rs./MT) 35000 35000 Price of Lub Oil (Rs./lt) 110 95 Auxiliary Consumption 2.5% 2.5%
Source: KSERC, Thiruvananthapuram
As per the data furnished by KSEB the average use of lubricant oil per kWh
is 1.32ml/kWh and 0.5ml/kWh. The average LSHS cost as on 1st April 2010 is taken
as Rs.35000/MT. The Commission also accepted the auxiliary consumption proposed
by KSEB, which is 2.5% for both plants. Accordingly, the fuel cost for BDPP and
KDPP was worked out as follows (Table-8.31):
Table 8.31
KSERC Benchmark parameters for BDPP/KDPP for BDPP/KDPP
BDPP KDPP
Heat Rate (kcal/kWh) 2,000.00 1945.00 Cal. Value (kCal/kg) 10045 9700 Net Generation (MU) 279.31 435.83 Auxiliary Consumption 2.50% 2.50% Gross Generation 286.29 446.73 Qty. of fuel Required 57002 89575 Price of Fuel 35000 35000 Cost of fuel 199.51 313.51 Cost/kWh 6.97 7.02 Lubricant oil 1.2 0.5 Cost of Lub oil (Rs./lts) 109.52 95 Cost of lub oil (Rs./kWh) 0.13 0.05 Fuel Cost 7.10 7.07 Total Cost 203.27 315.64
Source: Kerala State Electricity Regulatory Commission
8.6.7.2 Availability of power from CGS
The Board has estimated generation from CGS stations based on the norms
and target availability fixed by CERC as 8196.78MU. However, Commission notes
that the auxiliary consumption factor for some CGS used by KSEB was not as per

Chapter – VIII The impact of regulatory regime in Kerala: An analysis
259
the CERC norms. CERC has revised the operational norms including
auxiliary consumption for the tariff period starting from 1-4-2009. The Commission
has considered the revised norms, which is as follows (Table-8.32)
Table 8.32
Existing and revised norm for CGS
Aux. Consumption Availability
Station Existing norm Revised
norm
Existing
norm
Revised norm
Talcher 7.50% 6.50% 80% 85%
RSTPS I&II, III 7.85% 7.08% 80% 85%
NLC II -Stage II 10.00% 10.00% 75% 75%
NLC I Exp 9.50% 9.50% 75% 80%
NLC II -Stage I 10.00% 10.00% 75% 75%
Source: Statement of Reasons on Tariff Regulations published by CERC
In the tariff petition, KSEB has stated that the actual availability from CGS
was lower compared to the approved quantity of generation in 2009-10. According to
KSEB, the method followed by the Commission in 2009-10, does not consider
factors such as fuel shortage and plant availability but considers only machine
availability, which does not represent actual generation. However, KSERC found
that the arguments of KSEB were unacceptable considering the fact that the actual
generation from CGS for the year 2009-10 (especially from Talcher and
Ramagundam) was higher than the approved quantity. Further, the Commission
considered the average PLF achieved by these stations, it was not the average
availability as pointed out KSEB. In the previous order the Commission used average
PLF achieved by CGS for estimating the generation, since actual PLF achieved by
the Stations would be a better indicator of performance and the generation
availability. Further the Commission has allowed the incentives applicable to

Chapter – VIII The impact of regulatory regime in Kerala: An analysis
260
the CGS at actuals. Since incentives are based on the actual performance, it would
always fair to consider the average performance over the years. The PLF represents
the actual performance of the station, which takes into consideration the availability
of fuel. The performance of Central Stations as given by CERC is given below
(Table-8.33):
Table 8.33
Actual PLF Achieved by CGS Stations
CGS 2002-03 2003-04 2004-05 2005-06 2006-07 2007-08 Average
Talcher 73% 82% 82% 84% 90% 94% 88%
RSTPS I&II,
III
92% 89% 91% 86% 89% 90% 89%
NLC II -
Stage II
80% 80% 72% 72% 73% 81% 75%
NLC I Exp 54% 88% 84% 89% 89% 87%
NLC II -Stage I 83% 74% 72% 70% 57% 82% 70%
Source: Statement of reasons published by CERC
The average PLF of Central stations is much higher than the target
availability norms especially in the case of Ramagundam and Talcher. The
Commission also verified the actual PLF achieved by the existing CGS especially
Talcher and NTPC Ramagudam, which are much higher for the year 2009-10 than
the PLF used by the Commission in 2009-10. Hence, the Commission concluded that
there is no reason to deviate from the methodology followed in the previous order.
Hence the Commission has decided to approach the matter following the same
method as used in 2009-10. Accordingly, the Commission re-estimated the
generation from CGS stations as below (Table 8.34).

Chapter – VIII The impact of regulatory regime in Kerala: An analysis
261
Table 8.34
Energy Availability from CGS
Power Plant
Projection by KSEB Approved by KSERC
Allocation
(MW) Aux
consumption PLF MU/Day Total
Energy (MU)
Aux
consumption (Revised
CERC Norm)
PLF Energy
available (MU)
TALCHER – II 415.80 8.50% 80% 7.76 2832.88 6.50% 88%* 2997
NLC – Exp 58.80 10.00% 80% 1.02 372.92 10.00% 87%* 372
NLCII - Stage I 63.00 10.00% 75% 1.02 372.52 10.00% 70%* 372 NLCII - Stage II 90.00 8.50% 75% 1.46 531.96 7.08% 75%* 532
NTPC
(RSPTS) 306.00 8.50% 85% 5.71 2085.28 7.08% 89%* 2217
MAPS 23.00 10.00% 68.50% 0.34 124.28 10.00% 68.50% 124.28
KAIGA stage I 38.00 10.00% 75% 0.62 224.79 10.00% 75% 224.79
KAIGA stage II 35.00 10.00% 75% 0.57 206.84 10.00% 75% 206.84
Kudamkulam 266.00 10.00% 75% 4.31 915.71 10.00% 75% 915.71
NLC-Exp-II 70.00 10.00% 80% 1.21 441.5 10.00% 80% 441.5
Simhadri Exp 80.00 8.50% 85% 1.49 88.1 8.50% 85% 88.1
Total 1,445.60 8196.8 8491.22 *Average PLF for the past 5 years
Source: Kerala State Electricity Regulatory Commission
Board has used the actual fuel cost from April to September 2009 as the basis
for arriving at the variable cost of power from CGS. As per the data submitted by the
Board in the average fuel cost of the CGS stations from April to February, the
Commission has arrived at the average variable cost for CGS as follows (Table-8.35)
Table 8.35
Approved Average variable cost of power from CGS
Month (2009-10) RSTS Talcher Stage-II NLC Stage-I NLC Stage-II NLC Expansion
April 1.38 1.46 1.21 1.21 1.14
May 1.42 1.28 1.21 1.21 1.14
June 1.57 1.12 1.21 1.21 1.14
July 1.30 1.46 1.21 1.21 1.14
August 1.23 0.85 1.21 1.21 1.14
September 1.23 0.80 1.21 1.21 1.14
October 1.37 0.81 1.21 1.21 1.14
November 1.37 0.81 1.21 1.21 1.14
December 1.43 0.93 1.21 1.21 1.14
January 1.58 1.12 1.22 1.22 1.15
February 1.57 1.19 1.22 1.22 1.15
Average 1.40 1.08 1.21 1.21 1.14
Source: Kerala State Electricity Regulatory Commission

Chapter – VIII The impact of regulatory regime in Kerala: An analysis
262
8.6.7.3 Energy purchase from other sources:
The Board has projected a total generation from IPPs using liquid fuel such
as KPCL, RGCCP and BSES as 2093.68 MU at a total cost of Rs.1698.82 crore. The
variable cost projected by KSEB for RGCCPP is Rs7.34/kWh and for BSES
Rs.7.16/kWh. For the diesel plant KPCL, the variable cost was assumed as
Rs.7.26/kWh. The cost of energy from other IPPs such wind (61.05MU), Ullumgal
(34MU), M.P.Steel (40.8MU) was estimated at Rs.35.52 Crore. KSEB estimated
that 165 MU needs to be purchased from traders/exchange at rate of Rs.5/kWh.
As per the estimates of the Commission, high cost purchase from many
sources could be curtailed by about 874 MU as follows (Table-8.36):
Table 8.36
Generation and Power purchase approved for 2010-11
Sources Proposed in the
ARR(MU) Estimates of the
Commission (MU)
Gross Energy
Net energy Available at KSEB Bus
Gross
Energy
Net energy Available at KSEB Bus
Hydel stations 6953.16 6918.40 7187 7,151.07
Wind 3.00 3.00 3.00 3.00
BDPP 286.47 279.31 286.47 279.31
KDPP 447.00 435.83 447.00 435.83
Internal Total 7689.63 7636.53 7923.47 7869.20
Thalcher – II 2832.88 2700.87 2,997.00 2,857.34
NLC – Exp 372.92 355.55 372.00 354.66
NLC-II - Stage-1 372.52 355.16 372.00 354.66
NLCII - Stage II 531.96 507.17 532.00 507.21
NTPC- RSTPS 2085.28 1988.11 2,217.00 2,113.69
MAPS 124.28 118.49 124.28 118.49
KAIGA Stg I 224.79 214.31 224.79 214.31
KAIGA Stg II 206.84 197.20 206.84 197.20
Kudamkulam 915.71 873.03 915.71 873.04
NLC- Exp-II 441.50 420.93 441.50 420.93
Simhadri Exp 88.10 84.00 88.10 83.99

Chapter – VIII The impact of regulatory regime in Kerala: An analysis
263
CGS Total 8196.78 7814.81 8491.22 8095.53
Kayamkulam 1010.69 1010.69 1010.69 1010.69
BSES 922.03 922.03 922.03 922.03
KPCL 135.96 135.96 135.96 135.96
Wind 61.05 61.05 61.05 61.05
Ullumkal 34.00 34.00 34.00 34.00
MPS Steel 40.80 40.80 40.80 40.80
Purchase from Traders 165.31 165.31 165.31 165.31
Purchase other than CGS 2370 2370 2370 2370
Total 18256 17821 18785 18335
Energy requirement at KSEB BUS
17821 17461
Surplus 0 874
Source: Kerala State Electricity Regulatory Commission
Based on the merit order principle, the surplus energy should be deducted
from the high cost sources. As per the merit order, the highest cost plants are the
liquid fuel stations as follows (Table 8.37):
Table 8.37
Variable cost of high cost thermal power plants in Kerala
Stations Rate (Rs./kWh)
KDPP 7.07 BDPP 7.10
BSES 7.16
KPCL 7.26
RGCCPP 7.34
Source: Kerala State Electricity Regulatory Commission
Though the RGCCP is the bottom of the merit order stack, because of
compensatory share received from CGS, the pooled cost of RGCCP would be lower
than Rs.7/kWh, hence, it is excluded from the list. For the other stations the cost
ranges from Rs.7.00/kWh to Rs,7.30/kWh. Since all the plants are required for
meeting the peak, proportionate reduction method was followed for eliminating the
surplus energy (Table 8.38).

Chapter – VIII The impact of regulatory regime in Kerala: An analysis
264
Table 8.38
High cost energy from thermal stations
Plants Rate
(Rs./kWh)
Energy
Proposed (MU)
Less
Surplus (MU)
Net Energy
considered (MU)
BDPP 7.10 279 138 142
BSES 7.16 922 454 468
KPCL 7.26 136 67 69
KDPP 7.07 436 215 221
Total 1773 874 899
Source: KSERC’s C ARR &ERC order 2010-11
Based on the above, the total power purchase approved for 2010-11 is as follows:
Table 8.39
Power purchase and generation cost approved for 2010-11
Source
Energy
Produced
/Purchased
Auxiliary
Consumption
External
Loss
Net Energy
Input to
KSEB T&D
system
Fixed Cost Incentive,
Tax, etc.
Variable
cost
/Unit
Total
Variable
cost
Total
Cost
MU MU MU MU Rs. Cr Rs. Cr Rs/kWh Rs. Cr Rs. Cr
KSEB Internal
Hydel 7187 36 7151
Wind -Kanjikode 3 0 3
BDPP 145 4 142 7.10 103.09 103.09
KDPP 227 6 221 7.07 160.08 160.08
Sub total 7562 0 7517 263.17 263.17
Power purchase
(a) CGS
Thalcher - II 2997 140 2857 175.64 3.34 1.08 322.24 501.22
NLC- Exp- Stage-
1 372 17 355 34.31 3.28 1.14 42.50 80.08
NLC-II- Stage-1 372 17 355 12.67 10.36 1.21 45.09 68.12
NLC-II- Stage-2 532 25 507 19.68 1.21 64.46 84.15
RSPTS Stage I
& II 2217 103 2114 87.58 47.54 1.40 311.05 446.17
MAPS 124 6 118 24.48 0.81 - - 25.29
KAIGA Stg I 225 10 214 70.36 2.71 - - 73.07
Source
Energy
Produced/ Purchased
Auxiliary
Consumption
External
Loss
Net Energy Input to
KSEB T&D
system
Fixed Cost Incentive,
Tax, etc.
Variable
cost /Unit
Total
Variable cost
Total
Cost
KAIGA Stg II 207 10 197 67.22 - - - 67.22
Kudankulam 916 43 873 283.74 - - - 283.74
NLC - II Exp 442 21 421 38.73 - 1.28 56.51 95.24
Simhadri Exp 88 4 84 8.40 - 1.23 10.84 19.24
Total CGS 8491 396 8096 822.80 68.04 852.69 1,743.53
IPPs
RGCCPP 1011 1011 99.16 7.34 741.85 841.01
BSES 468 468 89.76 7.16 334.82 424.58
KPCL 69 69 9.18 7.26 50.06 59.24
Wind 61 61 3.14 19.17 19.17

Chapter – VIII The impact of regulatory regime in Kerala: An analysis
265
Ullumkal 34 34 2.00 6.80 6.80
MP steel 41 41 2.34 9.55 9.55
Traders 165 165 5.00 82.66 82.66
Total IPPs 1848 1848 198.10 1,244.90 1,443.00
Total purchase 10340 0 396 9944 1,020.90 68.04 2097.59 3186.53
Eastern Region - 0.05 0.05
Southern Region 221.31 20.39 241.70
Kayamkulam 11.28 - 11.28
Sub total PGCIL - - - - 232.59 20.44 - - 253.03
Total 17,901 - 396 17,461 1,253.50 88.48 - 2,360.75 3,702.73
Source: KSERC’s C ARR &ERC order 2010-11
The total power purchase approved was 10340 MU with a cost of Rs.3186.53
Crore. The total cost of generation, power purchase and transmission cost allowed
was Rs.3702.73 crore for 2010-11 against Rs. 4361.33 Crore projected by KSEB.
The Commission ordered that, KSEB shall within one month (from the date
of ARR order 2010-11 dated 17 May 2010) prepare and submit to the Commission,
month-wise energy generation and purchase plan based on the approved figures for
the year 2010-11, in accordance with the KSERC (Fuel Surcharge
Formula) Regulations. KSEB is duty bound to schedule the generation and power
purchase in accordance with the principles envisaged under Section 61 so as to
minimize the cost to the Consumers. KSEB shall endeavor to reduce dependence on
high cost sources such as liquid fuel stations. In 2009-10, KSEB could purchase
substantial amount of energy through traders/power exchange. Hence, the
Commission ordered that the Board should take steps to replace the costly power
from liquid fuel stations through short-term contracts through traders/power
exchange judiciously through a transparent bidding process. Efforts should be taken
to purchase on an average additional 50MU per month from June onwards from the
traders, which would reduce the power purchase cost by about Rs.150 to Rs.200
Crores. The Board shall submit the information as per the fuel surcharge regulations
periodically.

Chapter – VIII The impact of regulatory regime in Kerala: An analysis
266
In order to insulate the licensee from hydro risk, the Commission would
resort to a comprehensive review of hydro energy availability in the month of
December 2010, by then the rainfall position and the shortage/surpluses if any would
be reasonably established. Accordingly, KSEB shall approach the Commission with
all necessary details for the review and if necessary, a reasonable proposal for short
term purchase in a situation of hydro failure or reduction in availability from CGS or
short fall in meeting peak load.
8.6.8 Interest and financing charges:
The Board has projected Rs.391.62 crore towards interests and finance
charges for the year 2010-11. As against the borrowing of Rs.587 Crore and
repayment of Rs.587.34 crore proposed in 2008-09, the actual borrowing was
Rs.94.49 crore (out of which Rs.9.34 crore was on account of foreign exchange
variation) and repayment was Rs.850.crore, which was made possible by utilizing
the deposits made earlier for this purpose. Accordingly, the outstanding liability as
on 31-3-2009 was only Rs.1100 crore only compared to Rs.2295.54 crore proposed.
It was made possible by resorting to swapping of loans, borrowing from least cost
options, restricting the borrowing and reduction in cost of borrowing from Govt., and
preclosure of loans and bonds. The Board claimed that as against the approved
interest cost of Rs.365.60 crore, the actual interest cost was only Rs.339.60 crore.
In 2009-10, Board has revised estimates on capital expenditure, borrowing
and repayment. As against the proposed capital expenditure of Rs.1377.10Crore, the
revised estimate was Rs.947.65 crore. The revised borrowing would be Rs.655.79
Crore against Rs.764.87 crore proposed. As per the revised estimate for 2009-10, the
closing balance of loans and bonds will be Rs.1206.99 crore. The revised borrowing
plan proposed by the Board for 2009-10 is as follows (Table 8.40):

Chapter – VIII The impact of regulatory regime in Kerala: An analysis
267
Table 8.40
Summary of Borrowings & Repayments for the year 2009-10(RE)
Rs.in Crore
Item Opening Balance as
on 01.04.09 Borrowing in
2009-10 Redemption in
2009-10 Closing Balance as
on 31.03.10
ARR Revised ARR Revised ARR Revised ARR Revised
Loans from GOK 69.50 0.00 69.50 0.00 0.00 0.00 139.00 0.00
Existing Bonds 43.20 43.20 0.00 0.00 20.90 22.30 22.30 20.90
Loans from
Financial
Institutions 1387.61 1057.17 695.37 655.79 206.75 526.86 1876.23 1186.09
Total 1500.31 1100.37 764.87 655.79 227.65 549.16 2037.53 1206.99
Source: KSERC’s C ARR &ERC order 2010-11
Based on the above the interest charges for 2009-10 was re-estimated as
Rs.115.40 crore for loans and bonds.
The estimate for 2010-11 was prepared based on the revised estimates of
2009-10. The total fresh borrowing proposed in 2010-11 was Rs.450 crore, against
the total capital expenditure of Rs.995.16 crore and repayment of Rs.653.35 crore
proposed in 2010-11. Accordingly, the total interest charge for loans and bonds was
arrived at as Rs.138.08 Crores as follows (Table 8.41)
Table 8.41
Interest Charges on Loans & Bonds proposed for 2010-11 (Rs. in Crore)
Sl.
No. Particulars Rate of
Interest (%)
Balance at the beginning
of the year
Planned borrow in
during the year
Planned redemptio
n during the
year
Balance out standing at the end of the year
Interest for
the year
I Loans from Government 0.00 0.00 0.00 0.00
II Loans from others
secured
KSE Bond 11.50 -
13.00 20.90 0.00 10.45 10.45 1.87
REC 8.25-12.75 269.56 0.00 65.45 204.11 28.09
LIC 9.00 18.00 0.00 2.00 16.00 1.62
PFC 6.00 - 10.50 17.37 0.00 11.58 5.79 1.52
Subtotal 325.83 0.00 89.48 236.35 33.10
III Loans from others
unsecured
IDBI 9.50 - 13.50 0.43 0.00 0.43 0.00 0.19
STL from REC 8.25-8.5 195.00 0.00 195.00 0.00 5.15

Chapter – VIII The impact of regulatory regime in Kerala: An analysis
268
LIC 9.00 47.76 0.00 13.37 34.39 4.81
REC 8.25-12.75 167.88 0.00 25.00 142.88 17.48
KPFC 6.25-12.25 330.09
741.16 0.00 0.00
330.07 563.87 0.02 21.30
177.29 48.93
Additional borrowing
10-11 9.50 140.00 450.00 0.00 590.00 56.05
Grand Total 1206.99 450.00 653.35 1003.64 138.08
Source: KSERC’s C ARR &ERC order 2010-11
In addition, interest on security deposit (Rs.64.18 crore), interest on
borrowing for working capital (Rs.95.32 crore), rebate to consumers for advance
payment (Rs.14Crore), interest on provident fund balance (Rs.55.59 Crore), Cost of
raising finance (Rs.1 crore), guarantee commission (Rs.3.49 crore), other bank
charges (Rs.20 Crore) etc. were also proposed under “other interest charges”.
Regarding interest on working capital, the Board claimed that it should be
based on normative basis, irrespective of actuals as has been done by CERC. As per
the CERC norms, the interest on working capital would be allowed based on two
months receivables, one and half month of fuel stock and one month O&M cost.
Accordingly, KSEB estimated the interest on Working capital as Rs.95.32
crore as follows (Table 8.42):
Table 8.42
Summary of interest and finance charges (in Crores)
Sl. No.
Description 2008-09 2009-10 2010-11
O&M EXPENSES 1255.19 1456.63 1690.42
Employee cost
A&G Expenses 135.46 155.45 171.05
R&M Expenses 138.80 155.15 175.32
Total 1529.45 1767.23 2036.79

Chapter – VIII The impact of regulatory regime in Kerala: An analysis
269
1/12th of above A 127.45 147.27 169.73
Receivables
Annual Revenue 4893.02 4531.00 4867.00
Receivables equivalent to 2 months 815.50 753.83 809.00
Fuel including stock 322.21 330.12 334.28
Fuel and stock equivalent to 1 ½
months 40.28 41.27 41.78
Total Working Capital (A+B+C) 983.23 943.7 1020.51
Interest on working capital @9.34% 95.32
Source: KSERC’s C ARR &ERC order 2010-11
Thus, total interest & financing charges proposed at Rs.391.632 crore for 2010-11
as follows (Table 8.43):
Table No. 8.43
Summary of Interest and Finance Charges (Rs. in Crores)
Particulars 2008-09 2009-10 2010-11
Accounts RR SERC Revised Estimate
I - Interest on outstanding Loans & Bonds 151.31 188.45 188.94 115.40 138.08
II - Interest on Security Deposit 50.50 50.50 50.50 55.35 64.18
III - Other Interest and Finance Charges
Interest on borrowings for working
capital
22.14 18.00 5.31 27.00 95.32
Rebate to consumers for timely payment 10.46 5.50 5.50 12.00 14.00
Interest on PF 37.93 64.88 64.88 51.34 55.59
Other Interest 0.00 0.01 0.01 0.01 0.01
Cost of raising finance: 0.03 1.00 1.00 1.00 1.00
Guarantee Commission 67.23 3.97 13.00 16.97 4.02 3.49
Bank Charges
17.00 20.00
Total of (III) 137.79 106.36 93.67 112.37 189.41
Grand Total (I+II+III) 339.60 345.31 333.11 283.12 391.62
Source: KSERC’s C ARR &ERC order 2010-11

Chapter – VIII The impact of regulatory regime in Kerala: An analysis
270
8.6.9 Analysis
The Board has claimed that the interest charges have been reduced
substantially over the years due to several measures such as swapping of loans and
restricting the fresh loans. It needs to be mentioned that over the years the Board has
made efforts in reducing the outstanding liabilities by promptly repaying the loans.
Further, the Board has parked substantial funds in short-term deposits for repayment
even before they are due. The efforts on the part of the Board were cited for
appreciation. However, the Commission noted that the substantial cash surplus was
accumulated through lower capital expenditure, which helped KSEB to reduce the
interest burden. Another reason could be the netting off of loans from the
Government, which was about Rs.436.78 Crore. There was a decrease of Rs.132.95
Crores towards interest cost in 2006-07 when compared to 2005-06 a major portion
of which could be attributed to the writing off of loans. The actual borrowing by
KSEB was much less than what was proposed in the ARR as shown below (Table
8.44)
Table No. 8.44
Borrowings proposed and actual (2004-05 to 2008-09)
Borrowing (Rs. Crore)
Year Proposed in ARR Revised Actual Actual as % of proposed
2004-05 800.00 800
.0
582.2 73%
2005-06 1000.0 511
.4
379.4 38%
2006-07 600.0 536
.5
41.1 7%
2007-08 584.6 353
.6
3.1 1%
2008-09 587.3 390
.1
94.5 16.1%
Source: KSERC’s ARR & ERC order 2010-11
Though low interest cost gets directly transferred to lower cost of electricity,
the Commission is of the view that this trend is not desirable for a growing capital-
intensive industry. The reduction in outstanding liability is the result of surplus cash
available, which was accumulated with lower capital investment. Further, as shown
below, no long-term borrowing was necessitated since major share of the total

Chapter – VIII The impact of regulatory regime in Kerala: An analysis
271
capital expenses was funded through contribution and expenses capitalization (i.e., in
2008-09 about 80% of the capital expenditure (Refer Table 8.45). The funds
available such as PF, security deposits, RoE, Depreciation, Grants, Electricity Duty
etc., would be more than sufficient for meeting repayment obligation, which was the
reason for the cash surplus accumulated over the years. Further nearly Rs.300 Crore
was available with the Board in 2009-10 from duty collected from the consumers,
which was not remitted to Government.
Table No. 8.45
Funding pattern of capital expenditure over the years
(Rs. Crore)
2002-03 2003-04 2004-05 2005-06 2006-07 2007-08 2008-09
1 Total capital expenses 454.59 809.09 461.92 499.93 537.45 373.71 645.19
2 IDC + Expenses capitalized 219.23 187.16 104.92 92.11 78.32 77.41 93.46
3 Contribution for cost of capital
Assets 155.88 185.26 201.23 265.83 216.14 186.47 422.57
4 = 1-
(2+3)
Internal funds or net
borrowing required for
Capex
79.48 436.67 155.77 141.99 242.99 109.83 129.16
(2+3) as % of 1 83% 46% 66% 72% 55% 71% 80%
Source: KSERC’s C ARR &ERC order 2010-11
The interest for the additional borrowing proposed by the Board for 2010-11
was Rs.56.05 Crores, considering proposed additional borrowing of Rs.450 crore for
2010-11 and Rs.140 Crore in 2009-10. It seems, while projecting Rs.56 crore as
interest, Board has assumed that Rs.450 crore additional borrowing would be
available in the beginning of the year itself. The Board has proposed Rs.764.87 Crore
as additional borrowing in the ARR for 2009-10. The Commission in the Order for
2009-10, based on the actual borrowing in the previous years, capital expenditure,
and the cash surplus available, concluded that borrowing requirement would be about
Rs.382.44Crore in 2009-10. As against this, as per the filing, the Board has proposed
Rs.140 crore only. The Commission in its letter dated 15-1-2010 sought the details of
actual borrowing upto December 2009 and plan for borrowing upto March 2010.
However, Board did not provide the complete details as sought by the Commission,

Chapter – VIII The impact of regulatory regime in Kerala: An analysis
272
but provided total borrowing including short term working capital loans/overdraft
etc. Based on the information given by the Board, Rs.600 Crore was availed
as short term loan/over draft. Since the Board did not provide the information as
sought, the Commission was compelled to proceed with the information available in
the filing. For 2010-11, the Board has proposed Rs.450 Crore as borrowing.
However, the Commission was of the view that, borrowing level proposed by the
Board was not at all required since, substantial revenue realized from the consumers
in the form of Electricity Duty was retained by the Board and used as internal
sources, which was about Rs.227 crore in 2008-09. The same was revealed in the
actual financial position shown above.
Considering the above and the planned redemption proposed to the tune of
Rs.653.35crore and depreciation and other non-cash expenses available to the Board,
the Commission concluded that the borrowing proposed to the tune of Rs.450 Crore
may not be required for 2010-11. From the experience of previous years, the
Commission could not judge reasonably the actual amount of capital investment to
be incurred in 2010-11 against the proposed Rs.995 Crore. The Board has estimated
interest for additional borrowing as Rs.56.05 Crore, apparently assuming all
borrowing at the beginning of the year. Even if the projections on additional
borrowings were considered, the interest for the additional borrowing would only be
Rs.34.67 crore since borrowings are resorted to staggered manner.
The Board has incorporated the impact of netting off of Government loans
while estimating the interest and financing charges. The Commission in its Order on
ARR&&ERC for 2008-09 has taken a position that netting off in the present form
would not be acceptable. Similar stand has been taken by the Comptroller and
Auditor General of India. Still no conclusive decision was taken by the Government
on this issue. Since the decision on netting of was delayed, Commission was not in a
position to provide the interest on Government loans in the ARR in a fictitious
manner, which allows the Board to have excess cash without corresponding liability.
Hence, as and when netting of proposal will be decided, the Commission will

Chapter – VIII The impact of regulatory regime in Kerala: An analysis
273
consider the matter and will address the issue appropriately. Till then the issue was
deferred and no provision on interest on government loan was provided in the ARR.
8.6.10 Other interest charges
Regarding other interest charges, the Commission has noted the interest on
working capital projected by the Board. The Board suggested to follow the norms of
CERC for estimation of interest on working capital. However, while making such
proposal, the Board has failed to consider the substantial security deposits available
with them in comparison with Central Generating Stations, where only
LC was available as payment security mechanism. If the security deposits were
also considered, the actual working capital would be negative and the interest
commitment should come down as shown below (Table-8.46).
Table 8.46
Details of working capital
Sl
No.
Description 2008-09
Rs. Crore
2009-10
Rs. Crore
2010-11
Rs. Crore
O&M EXPENSES 1255.19 1456.63 1690.42
Employee cost
A&G Expenses 135.46 155.45 171.05
R&M Expenses 138.80 155.15 175.32
Total 1529.45 1767.23 2036.79
1/12th of above A 127.45 147.27 169.73
Receivables
Annual Revenue 4893.02 4531.00 4867.00
Receivables equivalent to 2 months 815.50 753.83 809.00
Fuel including stock 322.21 330.12 334.28
Fuel and stock equivalent to 1 ½ months 40.28 41.27 41.78
Total Working Capital (A+B+C) 983.23 943.7 1020.51
Less Security Deposits available 1069.75 1194.75 1324.75
Net working capital (A+B+C)-D -86.52 -251.05 -304.24
Source: KSERC’s C ARR &ERC order 2010-11
Further as per the ARR Petition, for 2010-11 the Board has a net negative
working capital of about Rs.5435.84 crore, which shows that Board was doing
business with consumers advance money and no funds of the Board was blocked on
this account. Considering this position, the Commission was of the view that there
was no justification for proposing such high level of interest for working capital.
Hence, only the approved level of interest on working capital of Rs.5.31 Crore as in
previous year was allowed for this year also.

Chapter – VIII The impact of regulatory regime in Kerala: An analysis
274
The Board has proposed Rs.64.18 Crore on interest on security deposits as it
expects that the outstanding as on 1-4-2009 would be Rs.1069.75 Crore. The
Commission sought the details of debts and deposits for 2010-11, in which Board has
shown the addition to security deposit as Rs.130 Crore only in 2010-11. However,
addition to security deposits for the year 2009-10 itself was about Rs.147.32 crore as
per the ARR. Since the Board provided not much information, the Commission
agreed to the proposal of the Board. Similarly, the Board estimated Rs.14 crore
towards rebate for advance payment by the consumers. The actual rebate paid to the
consumers was only Rs.1.7 Crore in 2008-09. Considering this, the Commission has
allowed Rs.2 crore on this head. Cost of raising finance, Bank charges, Guarantee
Commission and interest on outstanding on provident fund balance are allowed as
projected by the Board. The Commission reiterated that, these payments shall only
be allowed on actual basis after the prudence check in the truing up process.
Accordingly, the interest charge for 2010-11 was approved as shown below on a
provisional basis considering the ambiguity in the netting off proposal.
8.7 Depreciation
The Board has estimated the depreciation for 2010-11 as Rs.532.89 Crore.
The Board argued that since 2006-07, the Commission was adopting CERC norms
for depreciation as per Tariff policy. KSEB further stated that FOR is yet to make
modification on the depreciation rates notified by CERC for generation and
transmission assets. Though KSEB follows Annual Account Rules for 2010-11, as
directed by the Commission, KSEB has claimed depreciation as per CERC norms.
As part of the restructuring process, KSEB formed committees to rectify the
anomalies in the capitalization, and it was estimated that after rectification, an
amount of about Rs.690 Crores might be added to assets at the end of the year.
Hence the opening gross fixed assets for 2010-11 would be Rs.10744.62 Crore,
accordingly the depreciation is worked out as follows (Table 8.47):

Chapter – VIII The impact of regulatory regime in Kerala: An analysis
275
Table No. 8.47
Depreciation proposed by the Board for 2010-11
Asset Class
Gross Fixed Assets Depreciation
rates
Depreciation Amount
2009-10 2010-11 2009-10
(Estimate) 2010-11
(Estimate) Rs. Cr Rs. Cr. % Rs. Cr Rs. Cr.
Land and Land Rights 280.8 344.66 0 0.00 0.00
Buildings 497.3 524.37 3.34 16.61 17.51
Hydraulic Works 899.02 931.02 5.28 47.47 49.16
Other Civil Works 301.93 378.65 3.34 10.08 12.65
Plant and Machinery 3454.35 3978.72 5.28 182.39 210.08
Lines, Cable Network, etc. 3753.53 4513.04 5.28 198.19 238.29
Vehicles 13.05 16.04 9.50 1.24 1.52
Furniture and Fixtures 13.91 15.41 6.33 0.88 0.98
Office Equipments 35.22 42.7 6.33 2.23 2.70
Assets not in use 0.01 0.01
Total 9249.12 10744.62 459.09 532.89
Source: KSERC’s C ARR &ERC order 2010-11
8.7.1 Analysis
The Commission in the previous orders has taken a stand that depreciation
shall be allowed as per the provisions of CERC norms, which was endorsed by the
State Advisory Committee and stakeholders in general. The Central Commission has
revised the depreciation norms in the tariff period for 2009-14 for Generating
Companies and Transmission utilities. In the said regulations, CERC has made
significant change in the manner of calculation of Depreciation. In
the said regulations, the CERC has considered 12-year repayment period for long-
term loans and adjusted the depreciation for the loan component in such a way that
cash flow would be available to meet the repayment obligation. Accordingly the
actual depreciation would increase to 4.5% to 5%, where as per the old norms it
was about 3% to 3.5%.
It would be relevant to note that, KSEB in the petition proposed to follow
CERC norms apparently lured by the higher cash flow available. In the past, the
Board has been taking a consistent view that CERC norms are not applicable to

Chapter – VIII The impact of regulatory regime in Kerala: An analysis
276
them. The Board all along had argued that, it is mandatory on its part to keep the
accounts as per the Annual Accounting Rules in force, where norms as per
Government of India notification 1994 shall apply. The Policy directions issued by
the Government and the request of the Government to the Commission vide letter
dated 15-7-2008, were repeatedly quoted in support of the claim, in spite of serious
audit objections of C&AG. Almost all the orders of the Commission on ARR&ERC
and Truing up in various years have been challenged by KSEB at the Appellate
Tribunal on this ground at the cost of public funds. This being the situation, the
Board suddenly proposed the CERC norms with no supporting claims as to why such
change in stand was required.
The Board has increased the addition to capital assets for the year 2010-11 to
the tune of about Rs.690 crore in the name of rectification of accounts, which is yet
to be completed. Commission found that such claims of the Board without proper
supporting details would be untenable and hence cannot be admitted. Hence it was
decided by the Commission to reject the addition of Rs. 1495.50 Crores for the year
2009-10. Nowhere in the history of the Board, such high level of capitalization has
been recorded. In the absence of authentic data, the KSERC used average
capitalisation from 2002-03 to 2008-09, which is Rs.637.21 crore for arriving at the
opening GFA (Gross Fixed Assets) for the year 2010-11.
As per the para 5.3(c) of Tariff Policy, the Forum of Regulators (FOR) vide
letter dated 23-6-2006 had communicated that depreciation as per CERC (Terms and
conditions of Tariff) Regulations 2004 shall be applicable for distribution. FOR has
not taken any decision on depreciation consequent to the revision of rates by CERC
since the said regulation was applicable for the period 2004-09 only. Hence, the
depreciation allowed would be subject to the revision by FOR if any.
Accordingly, Rs.485.75 Crore was estimated provisionally by KSERC as
depreciation for the year 2010-11 (Table 8.48). Commission ordered that as and
when properly authenticated information is provided, depreciation would be re-
estimated after prudence check.

Chapter – VIII The impact of regulatory regime in Kerala: An analysis
277
Table No. 8.48
Depreciation approved for the year 2010-11
Asset Class
2009-10 2010-11
GFA at the
beginning of the
year
Addition to
GFA
GFA at the
beginning of
the year
Depreciation
rates Depreciation
Rs. Cr Rs. Cr Rs. Cr. % Rs. Cr.
Land & Rights 280.8 27.21 308.01 0 0.00
Buildings 497.3 11.53 508.83 3.34 17.00
Hydraulic Works 899.02 13.63 912.65 5.28 48.19
Other Civil Works 301.93 32.69 334.62 3.34 11.18
Plant & Machinery 3454.35 223.42 3,677.77 5.28 194.19
Cable Network etc 3753.53 323.61 4,077.14 5.28 215.27
Vehicles 13.05 1.27 14.32 9.50 1.36
Furniture and Fixtures 13.91 0.64 14.55 6.33 0.92
Office Equipments 35.22 3.19 38.41 6.33 2.43
Assets not in use 0.01 - 0.01
Total 9249.12 637.21 9,886.33 4.96 490.53
Source: KSERC’s C ARR &ERC order 2010-11
Many objectors have raised the issue that depreciation shall not be allowed
for assets created out of consumer contribution and grant. The Commission has
taken a position that since replacement of assets is being carried out by the Board,
providing depreciation would be justifiable. In such circumstances, when such
assets are replaced, the Board should not claim the capital expenditure and should
deduct the same from the capital expenditure plan. However, the Board is not
practicing such steps. Hence, the Commission is of the view that there is a merit in
the arguments of the objectors. Hence, this issue would be examined separately
collecting the relevant facts and figures and giving opportunity for hearing to all
2010-11

Chapter – VIII The impact of regulatory regime in Kerala: An analysis
278
concerned. Therefore the provision agreed to for depreciation will be treated as
provisional.
8.8 Employee cost:
The Board has projected substantially high employee cost of Rs.1690.42
crore for the year 2010-11 which is about 58% higher than the approved level in
2009-10. The Board has revised the employee cost for 2009-10 as Rs.1456.63 crore
by about 36% over the approved level. The total number of employees as on 31-3-
2009 was reported as 27089, of which distribution sector accounts for 21690
numbers. According to the Board, the salary and terminal benefits are allowed
periodically in line with the policy of the Government, which the Board cannot deny
to the employees. The salary and other benefits for the serving employees are
estimated at Rs.927.59 crore for 2010-11. While projecting salary & DA Board
considered DA as on 31-3-2010 as 73% and for the ensuring year an addition of 18%
(9% from July 10 and another 9% from Jan 2011). A provision of Rs.70 crore was
given for leave encashment. In order to accommodate the salary revision due
from August 2008 to workmen and from July 2008 to Officers a provision of 12%
was also included as part of employee cost. To support this provision, the Board has
referred to the judgment of Hon. Supreme Court dated 3-3-2009 in appeal No. 1110,
1112, 1138, 1152 and 1327 of 2007. According to the Board, as per the judgment
appropriate provision for pay and allowance has to be made in the respective years in
which it becomes due. Board also stated that the salary is only 12.35% of the total
expenses. According to the Board the number of consumers served per employee and
also employee per MU sold are the productivity parameters to be considered for
evaluation of employee costs. The number of consumers per employee increased
from 295 in 2003-04 to 375 in 2010-11, and employee per MU sold is 2.78 in 2003-
04 and 1.86 in 2010-11. The employee cost (excluding pension) per unit of energy is
45 paise unit in 2003-04 and in 2010-11 it is 63 paise/unit. The cost of serving
employees for the year 2010-11 is estimated by the Board (table 8.49) is as follows:

Chapter – VIII The impact of regulatory regime in Kerala: An analysis
279
Table No. 8.49
Details of salary and benefits of serving employees projected by the Board
Sl No. Particulars
2008-09 2009-10 2010-11
(Rs. Cr) (Rs. Cr) (Rs. Cr)
A. Basic Pay 378.80 405.32 433.69
B. DA at the beginning of the year * 173.18 222.93 316.59
DA released/ provision made during the year 32.10 36.48 39.00
C Other allowances (HRA, Project allowances) 27.33 29.85 32.00
Over Time/ holiday wages 0.08 0.10 0.12
Bonus 4.18 4.25 4.50
Medical reimbursements 3.54 4.00 4.50
Compensation 0.46 0.50 0.54
Leave salary & Pension Contribution 0.17 0.18 0.20
Earned Leave encashment 57.59 60.00 70.00
Staff Welfare 0.79 0.85 1.00
D Additional provisions made for pay revision, due from
July/Aug-2008 81.15 95.15 114.60
E Total 759.37 859.61 1016.74
F Less amount capitalised from employee cost 67.22 77.57 89.15
G Net Employee cost 692.15 782.04 927.59
Source: KSERC’s ARR & RC order 2010-11
* DA as on 31-3-2008 = 38% , DA as on 31-3-2009 = 55% , DA anticipated as on 31-3-2010= 73%
The Board has also made an effort to address the criticism that the employee
cost is much higher in KSEB than in other utilities. According to KSEB it is due to
the fact that in other utilities cost of employees associated with operation and
maintenance only is booked under employee cost and employee cost for capital
works are booked separately under capital cost. However in the Board, except in
construction of lines, substations and generating stations same employees are used
for capital works and O&M, which inflate the employee cost artificially(Table 8.50).

Chapter – VIII The impact of regulatory regime in Kerala: An analysis
280
Table No. 8.50
Performance parameters of the employees as furnished by the KSEB
Particulars 2003-04 2004-05 2005-06 2006-07 2007-08 2008-09 2009-10 2010-11
No. of employees 24766 24454 25565 25894 25110 27089 27625 27625
No. of Consumers in Lakh 73.00 78.00 83.00 87.10 90.30 93.63 98.76 103.76
Energy sold in MU 8910.80 9384.40 10905.70 12377.90 13396.60 12877.65 13870.10 14830.10
Revenue from sale of energy
(Rs. in Crore) 2756.10 2917.40 3367.30 4009.70 4697.00 4893.02 4531.17 4867.25
No. of consumers / employee 295.00 319.00 324.00 337.00 359.62 345.64 357.50 375.60
Revenue/employee (Rs. Lakh) 11.10 11.90 13.20 15.50 18.71 18.06 16.40 17.62
Employee cost -
serving employees
(Rs. Crore)
397.50 446.70 487.60 542.10 514.90 692.15 782.04 927.59
Employee cost/unit of energy
sold excluding pension (Rs/kWh) 0.45 0.48 0.45 0.44 0.38 0.54 0.56 0.63
Employee per MU of energy sold 2.78 2.61 2.34 2.09 1.87 2.10 1.99 1.86
Source: KSERC’s ARR & RC order 2010-11
Another component of employee costs, pension liabilities, are projected at
Rs.673.68 crore. As on 30-9-2009, the number of pensioners is 30278 and 574
employees are due to retire in the current financial year. KSEB proposes to separate
the pension liabilities by creating a pension fund. As part of the restructuring process,
Board has appointed a consultant to suggest an appropriate scheme for meeting
pension liabilities. The size of the fund is estimated to be Rs.4520 crore. The pension
liabilities for the year 2010-11 is estimated as follows (Table 8.51):
Table No. 8.51
Estimate of pension and terminal benefits for 2010-11
Particulars 2008-09 (Prov.) 2009-10 (Revised) 2010-11
(Rs. Cr) (Rs. Cr) (Rs. Cr)
Monthly Pension 402.08 490.79 555.39
Commutation 25.02 26.4 28.6
DCRG 22.81 24.2 26.4
Medical, interim relief and festival
allowance 2.16 2.58 3.26
Provision for pension revision 43.75 53.05 60.03
Total 495.82 597.02 673.68
Source: KSERC’s ARR & RC order 2010-11
Accordingly the total employee cost projected for 2010-11 is Rs.1690.42 Crore.

Chapter – VIII The impact of regulatory regime in Kerala: An analysis
281
8.8.1 Analysis
There was a strong criticism in the public hearing about huge employee
expenses in KSEB. The staggering increase in employee cost was a concern to all the
stakeholders and many have pointed out this. The Commission pointed out that
Board has not taken any concrete measures in addressing this pertinent issue over the
years. The Board has been impervious to the directions of the Commission as well as
to the concerns expressed by the consumers on the increasing employee cost. The
Commission has analysed this issue in detail. The increase in employee cost is due to
uncontrolled increase in wages as well as in pensions. There was no effort to control
the number of employees in the organization. Over the years (between 2004-05 to
2008-09), though the number of sanctioned places have decreased by about 5000,
actual number of employees have increased by about 2600 at a rate of 11%.(Ref.
Table 8.52). KSERC ordered KSEB to review these figures on an urgent basis.
Table No. 8.52
Growth in number of employees
No. of employees
Year Sanctioned Annual
Increase (%) Actual
Annual
Increase (%)
2004-05 35870 24454
2005-06 35870 0.0% 25565 4.5%
2006-07 30877 -13.9% 25894 1.3%
2007-08 30862 0.0% 25110 -3.0%
2008-09 30862 0.0% 27089 7.9%
Overall Increase -5008 -14.0% 2635 10.8%
Source: KSERC’s ARR & RC order 2010-11
The table below shows the category wise increase in number of employees.
Over the last four years, the category wise increase in number of employees is about
20% to over 85%. Number of chief engineers have increased by 45%, Asst.
Engineers or equivalent have increased by a staggering 85%, Executive Engineers by
31%, other non-technical officers by 42% and technical staff by 20%. In spite of
considerable increase at all levels, the overall increase was limited to 11% on

Chapter – VIII The impact of regulatory regime in Kerala: An analysis
282
account of reduction in non-technical category to the tune of 2100 nos. (32%).
KSERC concluded that KSEB is becoming more and more top heavy (table 8.53).
Table 8.53
Comparison of increase in employees based on category
Category of Employee 2004-05 2008-09 Increase (nos) Increase (%)
Sanctioned Working Sanctioned Working Sanctioned Working Sanctioned Working
Chairman/CMD 1 1 1 1 0 0 0% 0%
Members of Board 6 3 3 3 -3 0 -50% 0%
Chief Engineers 15 11 18 16 3 5 20% 45%
Deputy Chief Eng. or equivalent
78 67 83 79 5 12 6% 18%
Executive Engineers or equivalent
270 238 332 311 62 73 23% 31%
Asst. Exe. Engineers or
equivalent 935 670 922 800 -13 130 -1% 19%
Asstt. Engineers or equivalent
2666 1539 3632 2847 966 1308 36% 85%
All non-technical -officers 1807 936 1350 1330 -457 394 -25% 42%
All other Technical staff 21446 14358 18391 17182 -3055 2824 -14% 20%
All non-technical -Non
officers 8646 6631 6130 4520 -2516 -2111 -29% -32%
Total 35870 24454 30862 27089 -5008 2635 -14% 11%
Source: KSERC’s ARR & RC order 2010-11
It is also pertinent to examine whether the above increase in employees is
justified with respect to the growth in the system. The installed capacity almost
stagnant, annual sales increased by 32% and number of consumers increased by
20%, HT lines by 9%, and LT lines by 19% as shown below (Table 5.54):
Table- No. 8.54
Comparative growth in the system
Parameters Unit 04-05 08-09 % increase
Hydel MW 1843.6 1886.5 2%
Thermal (Incl. IPPs) MW 591.6 591.6 0%
Wind MW 2 23.9 1095%
Total MW 2437.2 2502 3%
Annual Sales MU 9384 12414 32%
No of Consumers (Lakhs) 77.99 93.6 20%
Per Capita Consumption kWh 400 470 18%
EHT lines Ckt Kms 9924 10855 9%
EHT S/s (Nos) 251 299 19%
HT lines Ckt Kms 33998 41245 21%
LT lines Ckt Kms 207711 241888 16%
Distribution transformers (Nos) 36442 46510 28%
Source: KSERC’s ARR & RC order 2010-11

Chapter – VIII The impact of regulatory regime in Kerala: An analysis
283
The above analysis shows that the uncontrollable increase in employee cost
needs urgent attention. The Commission since inception had issued several
directions to KSEB to control/limit the expenses and to improve the productivity so
as to justify high employee costs. However, no action has been taken till now. The
Commission as part of the clarification process raised about 10 questions on
employee cost. KSEB could not provide convincing answers to the queries. Since as
per the estimates of the Board, the employee cost/kWh sale for 2010-11 works out to
about Rs.1.14, the Commission sought the long-term steps taken to arrest the
employee costs by KSEB. The Board instead of suggesting any means, justified the
high level of employee cost with innovative replies. According to KSEB, cost of
employees working in capital works is not completely included in capital expenses,
which inflate the employee cost (revenue expenses). At present no separate
employees are provided for carrying out capital works in the distribution sector. If
the cost of employees executing the capital works in generation, transmission and
distribution are separated; the cost of employees will be comparable to other
distribution utilities. According to KSEB, the criticism on employee cost is without
appreciating these facts. Further, according to the Board, comparison of per unit cost
of employees is misleading in the case of Kerala, which is an industrially backward
state. As part of the restructuring process M/s PFC Consulting Limited has submitted
actuarial valuation report, which is under the consideration of the Government.
Commission found that the arguments put forwarded by the Board for
justifying the employee expenses were neither reasonable nor logical. As per the
provisions of the Act, electricity has to be supplied at a reasonable cost. Hence it is
pertinent to compare the per unit cost, since that is what the consumer is ultimately
concerned with. The justification that high employee cost in distribution was due to
capital works is no way helpful for the Board in supporting their claim since the
accounting practices followed in all SEBs are the same. Further, almost all
the capital works are carried out through contractors and at the most only
the supervision charges needs to be accounted. Further provision of capitalizing the

Chapter – VIII The impact of regulatory regime in Kerala: An analysis
284
employee cost is available and in 2010-11 about 9% of the employee cost is
proposed to be capitalized by the Board.
Commission observed that the efforts of the Board in curtailing employee
expenses are cosmetic and halfhearted. To cite an example, while finalizing the
ARR&ERC for 2009-10, the Board vide letter dated 26-3-2009, stated that several
steps are taken to improve the productivity of the employees by fixing
responsibilities. Circulars were issued on the guidelines for promotion to the post of
managerial cadres. The task of work-study on various functional areas has been
entrusted to M/s Centre for Management Development. However, no update or
follow-up action on the above steps has been reported in the present ARR.
It is also pertinent to verify the parameters supplied by the Board to show the
improving level of productivity/efficiency. The employee per MU of energy sold
increased from 1.87 in 2007-08 to 2.10 in 2008-09 & in 2009-10 it is 1.99. In 2010-
11, the numbers of employees are held constant to reduce the ratio to 1.86. While
estimating employee related performance parameters, the Board has excluded
pension liabilities, which cannot be justified. Though the Board has repeatedly stated
about the consultant’s report on structuring of pension liabilities, the report was not
produced before the Commission even after despite several reminders by
Commission. The Commission is of the considered view that any justification
provided by the Board to substantiate the increase in employee costs is self defeating
unless concrete steps are taken to address the issue rather than evading it.
There is widespread criticism that the salary levels of employees in the Board
are higher than that in Government or any other comparable organizations. Several
objectors have pointed to the share of salaries in the total income. The following
table (Table 8.55) shows the cost per employee and pension, which is self-
explanatory.

Chapter – VIII The impact of regulatory regime in Kerala: An analysis
285
Table No. 8.55
Trend of salary and pension – KSEB Table No.
Salary 2008-09 2009-10 2010-11 Growth Rate
Employee costs (Rs.Crore) 759.37 859.61 1016.74 15.7%
No. of employees 27089 27625 27625
Average Annual Salary (Rs.lakhs) 2.80 3.11 3.68
Average monthly salary (Rs.) 23360 25931 30671 14.6%
Pension
Pension (Rs. Crore) 495.84 597.02 673.68 16.6%
No.of pensioners 30,278 30,852
Average annual pension (Rs.
Lakhs) 1.97 2.18
Average monthly pension (Rs.) 16432 18197
Source: Kerala State Electricity Regulatory Commission
The level of favourable employee indicators, if any, presented by the Board
are incomplete without the status of outsourcing and contracting at different levels.
For several posts vacancies exist, but the work is being outsourced and many people
have been engaged on contract basis. These outsourced employees never become
part of the official statistics which artificially keeps the employee indicators
favourable. The Commission sought the details of category-wise number of
employees on contract basis/HR basis and the expenses incurred for various years.
The Board has not provided the information.
8.8.1.2. Comparison of cost structure
The Commission has to refer to the present industry status and similar
benchmarks available. A comparison of cost levels with those of other states would
be useful to benchmark the position of KSEB with similarly placed SEBs. Based on

Chapter – VIII The impact of regulatory regime in Kerala: An analysis
286
the study report of PFC, cost levels of various utilities for the year 2006-07 are
compiled and given below. Major component of the cost is power purchase cost. In
the case of Kerala, lower power purchase cost does not translate into lower overall
cost due to high employee cost and other costs. Employee costs and O&M costs in
Kerala are one of the highest in comparison with similar entities (Ref. Table 8.56).
Table 8.56
Comparison of cost structure of SEBs and Utilities in 2006-07
State Utility Total Cost
Rs./kWh
Power
Purchase
Cost Rs./kWh
Employee Cost
Rs./kWh
O&M Rs./k
Wh
Financing Cost
Rs.kWh
Cost other than power
purchase
Empl.
Cost as% of
total
cost
Empl
Cost % of
other
cost
T&D
Loss
Bundled Utilities Jharkhand
West Bengal
Himachal Pradesh Punjab
Tamil Nadu
Maharashtra Chattisgarh
JSEB WBSEB
HPSEB
PSEB TNEB
MSEDCL
CSEB
5.43
6.56
3.70 3.70
3.59
4.05 3.13
3.79
2.64
2.26 2.43
2.64
3.30 1.80
0.55
0.40
0.85 0.63
0.39
0.39 0.66
0.18
0.13
0.10 0.12
0.08
0.11 0.26
0.91
0.84
0.35 0.53
0.46
0.22 0.28
1.64
3.92
1.44 1.27
0.95
0.74 1.33
10%
6%
23% 17%
11%
10% 21%
33%
10%
59% 49%
41%
53% 50%
45%
30%
14% 23%
18%
35% 36%
Kerala KSEB 3.51 1.41 0.69 0.20 0.65 2.10 20% 33% 22%
Distribution
companies Orissa
Delhi Haryana
Andhra Pradesh
Karnataka
CESCO
NDPL DHBVNL
APCPDCL
BESCOM
3.63
3.97 3.84
2.75
3.77
2.50
3.01 3.36
2.39
3.24
0.48
0.36 0.26
0.15
0.19
0.23
0.19 0.10
0.07
0.07
0.41
0.43 0.10
0.20
0.15
1.13
0.96 0.48
0.36
0.53
13%
9% 7%
5%
5%
43%
37% 54%
41%
35%
44%
27% 30%
15%
24%
Source: Kerala State Electricity Regulatory Commission
There has been a quantum jump in the employee costs since the study period,
which will make the current position more unfavorable for Kerala. The Commission
has made reservations in the projections of the Board. As per the Board, the basic
salary will increase at 7% in 2010-11, though more than 500 employees are retiring
(no increase in no. of employees projected in 2010-11). The projections of the Board
do not reflect the impact of retirement on the basic pay, though cost of retiring
persons was accounted in the terminal benefits. In order to account for inflation,
about 18% increase in DA was provided for 2010-11. These projections would be
valid only if inflation as per CPI for industrial workers grow at the same rate as that
of the current year. The Commission also noticed the lack of basis for projections by

Chapter – VIII The impact of regulatory regime in Kerala: An analysis
287
the Board. The earned leave provision was estimated to increase over the years.
Commission sought the methods for estimation of earned leave encashment details,
the Board has given the following tables (Tables 8.57 & 8.58).
Table 8.57
Leave encashment/surrender details
2006-07 2007-08 2008-09
1 EL encashment of serving employees 15.68 24.76 45.29
2 Terminal surrender 8.78 11.88 12.29
3 Total 24.46 36.64 57.58
4 Salaries/DA /allowances 514.64 474.07 696.83
5 One Month Salary (5/12) 42.89 39.51 58.07
6 Surrender of serving employees as a % of 1
month salary (1 /5 ) 37% 63% 78%
Source: KSEB, Vydhyuthi Bhavanam, Thiruvananthapuram
With the above, Board stated that EL provision is below one month salary of
serving employees. However, Board could not explain the increase in the provision
from 37% to 78% in the last 3 years.
Table No. 8.58
Comparison of increase in employee costs & pension liabilities
Year
Salary &
benefits to
serving
employees
Yearly
increase
Pension &
other
benefits to
retired
employees
Yearly
increase
Total
employee
costs
Yearly
increase
(%) of
pension in
total
employee
cost
(Rs. Cr) (%) (Rs. Cr) (%) (Rs. Cr) (%)
(1) (2) (3) (4)= (2)+(3) (5)= (3)/(4)
2002-03 356.38 314.45 670.83 46.9%
2003-04 397.53 11.5% 390.78 24.3% 788.31 17.5% 49.6%
2004-05 446.73 12.4% 342.91 -12.2% 789.64 0.2% 43.4%
2005-06 487.65 9.2% 374.88 9.3% 862.53 9.2% 43.5%
2006-07 542.14 11.2% 355.95 -5.0% 898.09 4.1% 39.6%
2007-08 514.88 -5.0% 390 9.6% 904.88 0.8% 43.1%
2008-09 759.37 47.5% 495.84 27.1% 1255.21 38.7% 39.5%
2009-10 (Estimates) 859.61 13.2% 597.02 20.4% 1456.63 16.0% 41.0%
2010-11 (projection) 1016.74 18.3% 673.68 12.8% 1690.42 16.1% 39.9%
Rate of increase 14.00% 9.99% 12.25%
Source: Kerala State Electricity Board, Vydhyuthy Bhavanam, Trivandrum

Chapter – VIII The impact of regulatory regime in Kerala: An analysis
288
In between 2007-08 and 2008-09, the employee cost has increased by 47.5%
and pension liabilities increased by 27.1%. The Board could not provide the reasons
for such increase. The projection for 2009-10 and 2010-11 is made on the premise of
inflated figures of 2008-09. The Commission was of the view that such increase was
not reasonable by any standards. Further, inflationary trends in the economy have
moderated considerably. The Commission has approved the employee cost of
Rs.1069.96 crore as projected by KSEB for 2009-10. Stressing the need for
curtailing the employee expenses and conveying strong signals to the management to
take appropriate action, the Commission has decided to provide 7% increase over
2009-10 approved level for various items of employee expenses except DA. Two
installments of DA @6% over the present level allowed for 2010-11 (Table-8.59).
Table No. 8.59
DA & Other allowances
Particulars
2010-11
Projected Approved
(Rs. Cr) (Rs. Cr)
Basic pay 433.69 415.01
DA 355.59 302.96
Other allowances (HRA, Project allowances) 32.00 28.89
Over Time/ holiday wages 0.12 0.21
Bonus 4.50 3.53
Medical reimbursements 4.50 3.64
Compensation 0.54 0.75
Leave salary & Pension Contribution 0.20 0.21
Earned Leave encashment 70.00 42.80
Staff Welfare 1.00 0.70
Additional provisions made for pay revision, which is due from
July/Aug-2008 114.60
Total 1,016.74 798.70
Monthly pension 555.39 448.61
Commutation 28.60
DCRG 26.40
Medical, Interim relief, Festival allowance, FPS offices 3.26
Provision for pension revision 60.03
Total pension liabilities 673.68
Grand total 1,690.42 1,247.31
Source: Kerala State Electricity Regulatory Commission

Chapter – VIII The impact of regulatory regime in Kerala: An analysis
289
Any increase in employee costs above the approved levels shall be funded
through efficiency gains. In the previous order, the Commission had directed the
Board to initiate work-study to assess the reasonable level of employee costs, which
has not been initiated. The Commission directed that Board shall within
one month initiate the work-study to assess the reasonable level of employee
strength and costs taking into consideration improvement in technology, possibility
of outsourcing, mechanization, improved management strategies etc. The Board shall
be transformed into a lean and efficient organization not only to protect the interest
of the consumers, but also the existing employees.
8.9 A&G Expenses
Administration and General expenses (net of electricity duty) projected by the
Board for 2010-11 is Rs.85.64 Crore against Rs.60.99 Crore for 2008-09 (actual).
The Section 3(1) duty is estimated as Rs.85.4 Crore. According to the Board, A&G
expenses are highly amenable to inflation and business growth. As per CERC
norms, inflation of 5.72% is allowed for various expenses. The increase in A&G
expenses is due to addition of new connections to the tune of 5 lakhs every year and
increase in energy sales at the rate of 8% per year. The Board projected Rs.1 crore
for consultancy charges for reorganization of the Board. Rs.10 Crore has been
provided for advertisement for awareness programmes. The A&G expenses projected
for 2010-11 is as follows (Table No.- 8.60):
Table No. 8.60
A&G expenses proposed for 2010-11
Sl. No.
Particulars 2008-09 2009-10 2010-11 Provisional Revised Estimate
1 Rents, rates and taxes 3.89 4.12 4.66
2 Insurance 0.50 0.75 0.85
3 Telephone/telex charges, etc. 3.93 4.17 4.72 4 Internet and related charges 0.01 0.06 0.07 5 Legal charges 1.74 1.98 2.24 6 Audit fees 2.25 2.65 3.00 7 Consultancy charges 0.06 1.18 1.33 8 Other Professional charges 0.51 0.55 0.62

Chapter – VIII The impact of regulatory regime in Kerala: An analysis
290
9 Conveyance and vehicle hire charges 13.44 14.52 17.55
10 Sub Total (Total of 1 to 9) 26.33 29.98 35.04
11 OTHER EXPENSES a) Fees and subscriptions 0.25 0.42 0.53 d) Printing & stationary 7.25 8.12 9.18 e) Advertisements 3.35 10.75 11.00 f) Contributions/donations 0.33 0.42 0.48 g) Electricity charges 3.45 3.62 4.09 h) Water charges 0.27 0.31 0.35 i) Entertainment 0.25 0.28 0.32
j) Miscellaneous expenses 8.41 9.19 10.46
12 Total of Other Expenses 23.56 33.21 36.41 13 Freight 6.98 8.17 9.24 14 Other purchase related expenses 4.12 4.38 4.95 Total 60.99 75.74 85.64 15 Ele. Duty u/s 3(I), KED Act 74.47 79.8 85.4 GRAND TOTAL 135.46 155.45 171.05
Source: Kerala State Electricity Regulatory Commission
8.9.1 Analysis
The Commission noted the over projection of A&G expenses by the Board.
A&G expense no doubt is one of the controllable items of cost hence no escalation
over inflation can be allowed for this item. The Commission noted that the actual
A&G expenses for 2007-08 was only Rs.47.81 crore, where as it is projected at
Rs.85.64 Crore for 2010-11, showing an increase of 21% on a compounded level. In
between 2007-08 and 2008-09 A&G expenses have increased by 28%, mainly due to
increase in printing & stationary, advertisements and miscellaneous expenses. The
Commission sought the details of miscellaneous expenses, but the Board did not
provide the exact details, instead stated that all expenses other than specifically
mentioned will form part of miscellaneous expenses. The Board attributed increase
in A&G expenses due to increase in number of connections and sales, with out
substantiating how these factors related to A&G expenses. The Board provided Rs.10
crore for advertisement expenses. In 2008-09, where large-scale campaigns were
organised on account of power restrictions, the advertisement expense was only
Rs.3.35 crore. Hence, the arguments of the Board for about 21% increase in A&G
expenses cannot be substantiated and it is on the higher side. The Board has stated
that CERC is providing 5.37% escalation based on inflation. Considering all the

Chapter – VIII The impact of regulatory regime in Kerala: An analysis
291
factors and stressing the need to contain the expenses under this head, the
Commission has sealed the A&G expenses for 2010-11 at a level of 6% compounded
increase over actual expenses in 2008-09 and ordered that the Board shall limit the
A&G expenses at this level and under any circumstances shall not exceed this
amount without proper justification. In the case of advertisements, the KSERC has
agreed to Rs.4 Crore for the campaign for promoting energy efficiency and efficient
energy use as requested for the Board. Accordingly the A&G expenses approved for
2010-11 is as follows (Table-8.61):
Table No. 8.61
A&G Expenses approved for 2010-11
Sl.
No. Particulars 2007-08 2008-09 2009-10 2010-11 2010-11
Actual Actual Approved ARR Approved
1 Rents, rates and taxes 3.45 3.89 4.46 4.66 4.37
2 Insurance 0.6 0.50 1.21 0.85 0.56
3 Telephone/telex charges, etc. 3.6 3.93 4.37 4.72 4.42
4 Internet and related charges 0.01 0.01 0.07 0.07 0.01
5 Legal charges 2.42 1.74 5 2.24 1.96
6 Audit fees 2.27 2.25 2.15 3.00 2.53
7 Consultancy charges 0.06 0.06 0.2 1.33 0.07
8 Other Professional charges 0.4 0.51 0.42 0.62 0.57
9 Conveyance and vehicle hire
charges 11.21 13.44 15.74 17.55 15.10
10 Sub Total (Total of 1 to 9) 24.01 26.33 33.6 35.04 29.58
11 OTHER EXPENSES
a) Fees and subscriptions 0.48 0.25 0.29 0.53 0.28
d) Printing & stationary 4.2 7.25 4.33 9.18 8.15
e) Advertisements 0.92 3.35 0.75 11.00 4.00
f) Contributions/donations 0.78 0.33 1.00 0.48 0.37
g) Electricity charges 3.38 3.45 3.74 4.09 3.88
h) Water charges 0.11 0.27 0.17 0.35 0.30
i) Entertainment 0.18 0.25 0.31 0.32 0.28
j) Miscellaneous expenses 6.2 8.41 8.84 10.46 9.45
12 Total of Other Expenses 16.25 23.56 19.43 36.41 26.71
13 Freight 5.3 6.98 7.81 9.24 7.84
14 Other purchase related
expenses 2.25 4.12 3.39 4.95 4.63
Total 47.81 60.99 64.22 85.64 68.76
Source: Kerala State Electricity Regulatory Commission

Chapter – VIII The impact of regulatory regime in Kerala: An analysis
292
As per the Order of the APTEL, Electricity duty under Section 3(1) is not
included in A&G expenses. KSEB suggested that KSEB need not take up this issue
before the Commission henceforth.
8.10 Repair and maintenance Expenses:
There was no objection raised by any consumer as far R&M expenses are
concerned. There was a general perception among the consumers that maintenance
practices in KSEB need to be improved in view of recent mishap that occurred in
Panniyar, Moozhiyar etc.
Table No. 8.62
Growth in R&M Expenses
Function R&M Expenses (Rs. Crore)
2007-08 2008-09 2009-10 2010-11
Generation 7.02 14.92 20.93 24.47
Transmission 29.75 36.65 34.91 37.40
Distribution 78.33 86.30 98.54 112.67
Others 1.16 0.93 0.77 0.78
Total 116.26 138.80 155.15 175.32
Annual Growth rate
Generation 113% 40% 17%
Transmission 23% -5% 7%
Distribution 10% 14% 14%
Others -20% -17% 1%
Total 19% 12% 13%
Source: Kerala State Electricity Regulatory Commission
As per the details given by the Board (Ref. Table 8.62) the Commission has
attempted to correlate the growth rate in the system with the R&M expenses. As

Chapter – VIII The impact of regulatory regime in Kerala: An analysis
293
shown in the table below (Table 8.63), the growth in physical infrastructure is not
commensurate with the growth in R&M expenses. Growth in the installed capacity
over the last four years is less than 1%, annual sales, and growth of lines and
transformers is between 2.2% to 6.8%, where as R&M expenses projected are at 13%
on a compounded level.
Table No. 8.63
Growth of the power system
Year 2005-06 2006-07 2007-08 2008-09 CAGR
Installed capacity (within the State)
Hydel (MW) 1849.60 1849.60 1851.60 1886.50 0.7%
Thermal (Incl. IPPs) (MW)
591.60 591.60 591.60 591.60 0.0%
Wind (MW) 2.00 2.00 2.00 23.90 128.6%
Total (MW) 2443.20 2443.20 2445.20 2502.00 0.8%
Annual Sales MU 10906 11331 12050 12414 4.4%
No of Consumers (Lakhs) 82.98 87.14 90.3 93.6 4.1%
Per Capita Consumption
kWh 427 465 470 470 3.2%
EHT lines Ckt Kms 10178 10593 10650 10855 2.2%
EHT S/s (Nos) 269 276 281 299 3.6%
HT lines Ckt Kms 35060 37891 38227 41245 5.6%
LT lines Ckt Kms 215152 223370 234252 241888 4.0%
Dist transformers (Nos) 38193 39872 42401 46510 6.8%
Source: Kerala State Electricity Regulatory Commission
In the absence of proper details to quantify the required R&M expenses, the
KSERC approved Rs.161.47 crore which is 1.69% of GFA re-estimated by the
Commission (Table 8.64). This estimate makes about 5.7% increase over the
approved level in 2009-10, and may amply cover the inflation as proposed by the
Board.

Chapter – VIII The impact of regulatory regime in Kerala: An analysis
294
Table No. 8.64
R&M Expenses approved for the year 2010-11
Asset Category
R&M expenses proposed in the
ARR
Revised GFA at the
beginning of the year
R&M Expenses Approved
%of
GFA
Rs. Crore Rs. Crore Rs. Crore
Buildings 4.92 508.83 4.53 0.94%
Hydraulic Works 2.12 912.65 1.95 0.23%
Other Civil Works 6.25 334.62 5.76 1.65%
Plant & Machinery 47.63 3,677.77 43.87 1.20%
Cable Network etc 107.49 4,077.14 99.00 2.38%
Vehicles 6.01 14.32 5.54 37.47%
Furniture and Fixtures 0.28 14.55 0.26 1.82%
Office Equipments 0.62 38.41 0.57 1.45%
Total 175.32 9,578.31 161.47 1.69%
Source: Kerala State Electricity Regulatory Commission
The higher provision of R&M can be justified only if performance
benchmarks are achieved progressively. The Commission has already introduced
standards of performance for distribution licensees. The Commission has directed the
Board to provide the base level of SoP achieved by the Board, which is yet to be
furnished. In its absence, it is difficult to assess the R&M requirement for
maintaining the standards. Hence, the Board shall with all supporting details provide
the actual base level of performance standards at the sections for the year 2009-10,
by the end of the first quarter of 2010-11. Commission ordered that unless such
details are provided, any increase in R&M expenses cannot be entertained. Similar
exercise would be extended for Generation and Transmission also.
8.11 Return on Equity
The Board has projected the return on equity of Rs.286.99 crore for 2010-11.
According to the Board, the Tariff Policy and CERC regulations permit them to
claim a return on the 30% contribution made from its internal resources. From
2010-11 onwards KSEB is giving due attention on capital investment and it is
finding it difficult to meet the fund requirements for 30% contribution. Hence from

Chapter – VIII The impact of regulatory regime in Kerala: An analysis
295
2010-11 onwards return as per CERC norms for the investment made by KSEB from
its own resources has to be allowed. Accordingly, KSEB estimated that of the capital
expenditure proposed of Rs.995.17 crore, 30% ie., Rs.298.55 crore is treated as from
own resources. Thus the total equity will be Rs.1851.55 crore. As per the revised
CERC norms the return on equity is at 15.5%, thus Rs.286.99 crore is claimed as
RoE. In support of the claim KSEB has also provided a copy of the letter from the
Secretary, Ministry of Power Government of India, which expresses concern over the
state utilities foregoing the permissible RoE. According to KSEB, in the said letter,
the Central Government had directed the State Governments to issue directions to
SERCs to initiate regulatory initiatives in line with CERC Tariff Regulations, 2009.
8.11.1 Analysis
The proposal of KSEB that 15.5% return on normative Debt Equity Ratio is
surprising. The Commission has given a thought to the contentions of KSEB so as to
examine its legality. According to the Board it is difficult to meet the funds for
capital expenditure to maintain DE ratio of 70:30. In the petition KSEB estimated
that Rs.286.99 Crore should be the investment from own sources in 2010-11.
Generally returns are allowed/claimed for the amount actually invested in the
regulated business. In this case KSEB has not made any investment. Further no
evidence is available that 30% of the funds have been generated from own sources.
In this respect it is interesting to see the provision in the CERC Regulations, 2009.
Clause 3(2), which is as follows:
Clause 3(2) ‘expenditure incurred’ means the fund, whether the equity or
debt or both, actually deployed and paid in cash or cash equivalent, for creation or
acquisition of a useful asset and does not include commitments or liabilities for
which no payment has been released;
KSEB’s claims do not fall under the above definition. The guiding principles
on determination of tariff under Clauses (a) to (h) of the Section 61 of the Act are as
follows:

Chapter – VIII The impact of regulatory regime in Kerala: An analysis
296
(a) commercial principles
(b) competition, efficiency, economical use of resources, good performance and
optimum investments
(c) balance between consumer interest and recovery of the cost of electricity in a
reasonable manner
(d) reward of efficiency of performance
(e) multi-year tariff principles
(f) tariff progressively reflects cost of generation and reduces cross subsidies
(g) promotion of cogeneration and generation from renewable resources
(h) National Electricity Policy
(i) Tariff Policy
Para 5.8.5 of the National Electricity Policy provides as under:
“All efforts will have to be made to improve the efficiency of operations in all
the segments of the industry. Suitable performance norms of operations together with
incentives and disincentives will need to be evolved along with appropriate
arrangement for sharing the gains of efficient operations with the consumers. This
will ensure protection of consumer interests on the one hand and provide motivation
for improving the efficiency of operations on the other.”
Hence, KSEB must realize that the provisions in the Regulations, need not
automatically make them eligible to get return which are passed on to the
consumers. The Board has no right or permission under the regulations to claim
returns without any basis. The regulations are clear in this respect that the
licensees/generating companies become eligible for return on their investment based
on the performance. No regulation guarantees any return for non-performance.

Chapter – VIII The impact of regulatory regime in Kerala: An analysis
297
Hence, in a performance based regulatory regime, return on equity is not a
right of the licensee, but it has to be directly linked with the fulfillment of the duty
cast upon the licensee and the efficiency with which they carryout such business. The
intention of the Act, Policies and Regulations is very clear in this respect. The
generating companies and licensees are ensured adequate return to attract sufficient
funds for investment. Adequacy of return‟ thus depends on the ability to attract
investment. As far as the Commission knows, KSEB has no difficulty in attracting
funds for investment. As long as KSEB exists as a monolithic entity, there is limited
scope for investment by any other sector. Hence the argument based on attracting
investment for a high rate of return is not sustainable.
Hence, as an interim measure, the Commission allowed a notional return of
Rs.100 Crore to Board. This provision will be treated as provisional and will be
refixed on the basis of real equity or what can be treated as equity for the purpose
calculating return on investment, which will be submitted by the Board on the basis
of a study by a reputed agency with approval of the Commission.
8.12 Expenses and Interest Capitalized
The Board has provided Rs.23.24 Crore towards interest and financing
charges capitalized and Rs.94.10crore towards expenses capitalized. The
Commission provisionally allowed these items in the ARR for 2010-11 as proposed
by the Board.
8.13 Aggregate Revenue Requirements
The summary of Aggregate Revenue Requirements projected by
the Board and approved by the Commission for 2010-11 is as follows (Table-8.64):

Chapter – VIII The impact of regulatory regime in Kerala: An analysis
298
Table No. 8.65
Aggregate Revenue Requirements for 2010-11
2010-11 (Rs. Crore)
Items Proposed by the Board Approved by the
Commission
Generation of Power 536.58 263.17
Purchase of power 3,824.75 3,439.56
Interest & Finance Charges 391.62 268.29
Depreciation 532.89 490.53
Employee Cost 1,690.42 1,247.31
Repair & Maintenance 175.32 161.47
Administration & General Expenses 171.05 68.76
Other Expenses 11.70 10.10
Gross Expenditure (A) 7,334.33 5,949.19
Less: Expenses Capitalized 94.10 94.10
Less: Interest Capitalized 23.24 23.24
Net Expenditure (B) 7,216.99 5,831.85
Return 286.99 100.00
ARR (D) = (B) + ( C) 7,503.98 5,931.85
Source: KSERC, Thiruvananthapuram, Tariff Order 2010-11
8.14 Order of the Commission
The Commission after considering the documents placed before it and having
heard the views of the stakeholders and the Board, approved an Aggregate Revenue
Requirement of Rs.5931.85 Crore and a total Expected Revenue from Charges of
Rs.5474.38 Crore as against Rs.7503.98 Crore and Rs.5284.38 Crore respectively
projected by the Kerala State Electricity Board in the Petition TP70 of 2010 for the
year 2010-11, subject to the observations and conditions mentioned in this Order.
Accordingly the KSERC has arrived at a provisional revenue gap of Rs.457.47 Crore
as against the revenue gap of Rs.2219.60 Crore projected by the Board. The revenue
gap arrived at is subject to the adjustment based on the truing up for 2006/07,
efficiency gains, adjustment of electricity duty under section 4 and the outcome of
the truing up exercise pending for the years 2007-08 and 2008-09. Commission
ordered that till such time, the existing tariff will continue.

Chapter – VIII The impact of regulatory regime in Kerala: An analysis
299
8.15 Tariff petitions & tariff revision orders
The electricity tariff for domestic consumers was reduced by 20 ps / unit with
effect from 1-1-2006 by KSERC. Earlier, Government of Kerala had agreed to
KSERC to release subsidy to KSEB to meet the additional expenditure incurred
towards implementing the tariff reduction. GoK paid the subsidy for 3 months only.
The reduction was withdrawn only during the next tariff revision in Nov. 2007.
KSERC should have withdrawn the tariff reduction immediately after Government of
Kerala stopped payment of subsidy to KSEB. This is a lapse on the part of KSERC.
KSEB submitted tariff proposal in June 2007 for revising the electricity tariff.
An increase of Rs. 1/unit was proposed in energy charges for HT & EHT industrial
electricity consumers. An increase of Rs. 70/kVA was proposed for demand charges
and Rs. 1.25/unit was proposed for energy for Railway traction. Such a tariff
increase would have resulted in closure of several power intensive industries working
in the State for the last many decades. This was fought tooth and nail by the
Industrial Electricity Consumers under the banner of Kerala HT & EHT Industrial
Electricity Consumers Association. The Trade Unions also realized the danger.
They also opposed the increase vehemently. The Commission issued its Order
revising tariff with effect from 1-12-2007. But there was no increase for most of the
categories including Domestic, HT and EHT Industrial, Commercial consumers etc.
Power Intensive Industries who started functioning after 17-12-1996 was imposed
with an increase of 50 paise / unit and also double the rates during peak time. Those
existed prior to December 1996 were exempted from the increase.
The basic tariff structure remains the same after the constitution of KSERC in
year 2002 (Ref. Figure 8.1).This is the single largest achievement of KSERC. The
increase from 1997 to 2002 i.e. 7 years prior to 2002 was from 112 paise / unit to 340
paise / unit i.e. more than 200 % and there was no increase since 2002. A graph
depicting the increase is attached in figure 9.1

Chapter – VIII The impact of regulatory regime in Kerala: An analysis
300
Figure 8.1
Tariff variation 1997-2010
0
1
2
3
4
5
95-1
95-2
96-1
96-2
97-1
97-2
98-1
98-2
99-1
99-2
00-1
00-2
01-1
01-2
02-1
02-2
03-1
03-2
04-1
04-2
05-1
05-2
06-1
06-2
07-1
07-2
08-1
08-2
09-1
09-2
Unit Rate Rs/KWHr
KSEB Average Energy Charges 1997-2010
110 KV
11 KV HT1 INDUSTRIAL
LT 1 DOMESTIC(41-80
slab)
Source: Kerala State Electricity Board
8.16 Conclusion
As mentioned in the beginning, during the period from 2003-04 to 2010-11
KSERC has reviewed 8 tariff petitions filed by KSEB as shown in table 8.1 and
issued ARR orders accordingly. There was not a single instance of tariff increase for
Industrial EHT/HT Electricity consumers during the period. After scrutinising the
documents submitted by the Board in the form of tariff petition with all supporting
documents covering all the points mentioned the previous sections and after hearing
the views of all stakeholders, the Hon’ble Regulatory Commission did not find any
valid reasons for increasing tariff for the industrial consumers during the period of
Year

Chapter – VIII The impact of regulatory regime in Kerala: An analysis
301
regulatory regime under study (i.e. 2002 to 2010) or till date. The thorough prudence
check and close scrutiny of each and every items of expenditure by SERC has
brought about a discipline in the functioning of KSEB. The style of independent
regulatory process and independent decision-making by the KSERC on the basis of
merit, after hearing the views of licensee (KSEB) as well as consumers by
conducting open public hearing and inviting objections has strengthened the
regulatory review as a whole. KSEB did not like the control on their activities by
KSERC and the Board filed appeals at Appellate Tribunal for Electricity (ATE),
New Delhi against the orders of KSERC. But most of the appeals were dismissed.
An appeal on truing up was allowed partially. ARR & ERC Orders are, in effect, a
thorough review of the functioning of KSEB. KSERC issued a few directives in its
Order every year. Though, initially, KSEB was disregarding the directives, they
have started giving explanation now for not carrying out the directives.
Arresting the steep increase in electricity tariff, which was in vogue for a
decade, and maintaining it at the same level for almost another decade is the single
largest achievement of KSERC. It has saved many industrials units from closure.
Industries cross-subsidise heavily to other categories of consumers. Therefore, the
survival of high revenue contributing industrial consumers is a must for the survival
of KSEB and for the benefit of other categories of consumers. This is a great
achievement of KSERC, but it is not properly realized and appreciated. KSEB has
started to realize the power of KSERC, though belatedly. T & D losses and quality
of power are areas of improvement. Collection of service connection charges by
KSEB was declared illegal and stopped. Of course, there are areas where KSERC
could not achieve much progress. Multi Year Tariff, Open Access, Reduction in
Employment Cost, Open Access regulations which improve power trading in the
State, Cross subsidy reduction etc. are the main such areas. But overall, the
functioning of KSERC has been a grand success.