Embed Size (px)
Citation preview

© Frontier Economics Ltd, London.
The impact of regulation on growth A REPORT PREPARED FOR THE DEPARTMENT OF BUSINESS,
INNOVATION AND SKILLS
May 2012


May 2012 | Frontier Economics i
Contents
The impact of regulation on growth
Executive Summary 5
1 Introduction 12
2 Aggregate measures of regulation 16
3 Product market regulation 22
3.1 Product Market Regulation ....................................................... 22
3.2 Planning regulation .................................................................. 30
3.3 Environmental regulation ......................................................... 34
4 Labour market regulation 37
5 Conclusion 43
Annexe 1: Methodology 48
Annexe 2: List of literature reviewed 53
Annexe 3: Detailed overview of selected empirical evidence 57

ii Frontier Economics | May 2012
Tables & Figures
The impact of regulation on growth
Figure 1. Summary of findings 6
Figure 2. Key theoretical mechanisms that link product market
regulation and productivity 7
Figure 3. Key theoretical mechanisms that link labour market regulation
and productivity 9
Figure 4. Overview of key implications of findings 11
Figure 5. The impact of regulation on growth 12
Figure 6. Illustration of one-off vs. permanent effect 13
Figure 7. Key channels 15
Figure 8. Theoretical mechanisms based on Gorgens et al. (2003) 17
Figure 9. The relationship between regulation and growth 17
Figure 10. 2011 Fraser Institute of Economic Freedom – Top 42
countries 18
Figure 11. Theoretical mechanisms based on Busse and Groizard
(2008) 19
Figure 12. Overview of how product market regulation can affect
efficiency 23
Figure 13. Theoretical mechanism based on Poschke (2010) 24
Figure 14. Illustration of inverse-U relationship between the level of
competition and incentives to innovate 25
Figure 15. Theoretical mechanisms based on Griffith et al (2010) 26
Figure 16. Empirical findings by Griffith et al (2010) 26
Figure 17. Theoretical mechanisms based on Bourles (2010) 27
Figure 18. 2008 OECD Product Market Regulation Indicator 29
Figure 19. Mark-up in non-manufacturing sector 30
Figure 20. Theoretical mechanism based on Haskel and Sadun (2009)
31
Figure 21. Theoretical mechanism based on Cheshire and Hilber
(2008) 32

May 2012 | Frontier Economics iii
Tables & Figures
Figure 22. Regulatory tax as estimated by Cheshire and Hilber (2008)
33
Figure 23. Theoretical mechanisms based on Ambec et al (2010) 35
Figure 24. Theoretical mechanisms based on Bassanini et al (2009)
and Griffith & Macartney (2010) 38
Figure 25. Theoretical mechanisms based on Cingano (2010) 40
Figure 26. Theoretical mechanisms based on Damiani and Pompei
(2010) 40
Figure 27. OECD Indicators of Employment Protection 42
Figure 28. Summary of findings 43
Figure 29. Key theoretical mechanisms that link product market
regulation and productivity 44
Figure 30. Key theoretical mechanisms that link labour market
regulation and productivity 46
Figure 31. Overview of key implications of findings 47
Table 1. Area of business regulation measured by Doing Business
indicators 20
Table 2. Types of publications included in the literature review 51

May 2012 | Frontier Economics 5
Executive Summary
Executive Summary
Background and objective
The Better Regulation Executive (BRE) of the Department of Business,
Innovation and Skills (BIS) is responsible for the cross-Whitehall framework that
aims to control regulatory burdens on business. This aim is driven by the belief
that, if business resources are freed up, these can be used for productive means,
which should facilitate growth. This is of particular importance in the current
economic climate as one of the UK government’s priorities is to stimulate
economic growth.
However, the relationship between regulation and growth is complex.
Regulations can have a positive impact on growth by removing certain market
failures and improving economic efficiency. Regulations can have a negative
impact on growth by creating substantial compliance costs, undesirable market
distortions or unintended consequences. The overall impact of regulation on
growth depends on which effect is larger and this can vary depending on
particular circumstances.
As the relationship between regulation and growth is complex, BRE has asked
Frontier Economics to review the relevant literature on the theoretical and
empirical links between regulation and economic growth. The literature review is
intended to provide a sound evidence base and inform policy decisions.
Scope and approach
The focus of the literature review is on product market and labour market
regulation. The BRE limited the scope of the research by excluding financial
regulation and indicating that environmental regulation is less of a priority as the
Department for Environment, Food and Rural Affairs (Defra) has commissioned
a research project that deals specifically with environmental regulation and
growth. The scope of the literature review included the impact of alternatives to
regulation on growth and the potential impact of regulation on growth via the
creation of new markets. Our approach involved developing a long list of 94
articles that we filtered to a short list of 36 articles using a range of selection
criteria. For more detail on our approach, refer to Annexe 1.
Most of the literature does not deal with the impact of regulation on growth
directly but instead focuses on the impact of regulation on one of the growth
drivers (labour productivity, investment, innovation, total factor productivity).
This also implies that the literature focuses on the permanent growth
implications of regulations that are driven by factors such as a change in
incentives or market structure. One-off reductions in growth as often measured
by compliance costs are not considered separately.

6 Frontier Economics | May 2012
Executive Summary
None of the measures of regulation capture the regulatory design or quality of
regulations. Most of analysis in the literature relies on measures of regulation
that translate legislative requirements into quantitative indicators. The concept of
deregulation used in this report therefore refers to a reduction in such indicators.
Main findings
The relationship between regulation and growth can be both positive and
negative depending on the type of regulation considered. Our literature review
has also indicated that the strength of the evidence varies with the type of
regulation assessed. Figure 1 summarises our main findings. It shows the degree
of conclusiveness derived from the literature review and the nature of the
relationship between regulation and growth.
Figure 1. Summary of findings
Source: Frontier Economics
From the literature review, we can conclude that product market regulation is
the area where the theoretical mechanisms and empirical evidence are most
conclusive. While there is no widely accepted definition of product market
regulation, in general product market regulation covers a broad range of rules
that affect business operations during the firm life cycle including start up,
operation and expansion and exit1. These product market regulations can have a
1 See for example, Loayza et al. (2010) who define product market regulations those regulations that
affect entry, trade, financial markets, bankruptcy and judicial administration.

May 2012 | Frontier Economics 7
Executive Summary
negative and significant impact on economic growth. The key channel by which
product market regulations affect growth is by creating barriers to entry and
therefore reducing the level of competition in markets. Figure 2 summarises the
theoretical mechanisms that link product market regulation and productivity.
Figure 2. Key theoretical mechanisms that link product market regulation and
productivity
Source: Frontier Economics
Some of the most robust empirical evidence suggests that:
Increasing the administrative costs of market entry can have a significant
negative impact on productivity growth;
A reduction in product market regulation has a positive impact on
competition which increases innovation and therefore productivity;
Regulation in upstream markets can have a significant negative impact on
downstream market productivity; and
Where regulatory burdens are lightest the reallocation of resources towards
the highest productivity firms is stronger.
For example, Poschke (2010) finds that simulating the effect of changing the
entry costs in the US from 1.7% of GDP per capita to 10% reduces total factor
productivity by 0.8%. Even though the impact of product market regulation on
growth may be relatively small when considered on a per annum basis, it can still
have a significant long-term impact on standards of living.
Aggregate measures of regulation are generally based on indices that measure
a range of regulations and other government interventions which are ultimately
summarised in a single ranking or rating. Aggregate measures are different from
the product market regulation indicators as they try to capture the business
environment and cost of doing business. They are less focused on entry and exit
and often also include some measure of labour market regulation.
Literature that uses aggregate measures of regulation indicates that cross-country
differences in growth rates can partly be explained by differences in the level of

8 Frontier Economics | May 2012
Executive Summary
regulation. While the impact of regulation on growth in these studies is
significant, the results are driven by large differences between the countries in the
sample (e.g. developing vs. developed countries). For example, Djankov et al.
(2006) finds that improving from the worst (first) to the best (fourth) quartile of
business regulations (as measured by the World Bank Doing Business indicators)
implies a 2.3 percentage point increase in average annual growth. Some of the
research also finds a non-linear relationship between regulation and growth. This
implies that the benefits to reducing the level of regulation are larger for highly
regulated countries and diminishing with lower levels of regulation. As the UK is
among the top ten deregulated countries (as measured by the World Bank Doing
Business indicators and the Fraser Institute of Economic Freedom Index) the
main findings of these studies do not apply to the UK.
The impact of UK planning regulations on growth has not been studied widely
as the available literature focuses on the impact of planning regulations on
specific sectors. The literature indicates that planning regulation can change the
relative price of factor inputs (e.g. land, office space, etc.) and therefore have a
negative impact on productivity in specific sectors. For example, Haskel and
Sadun (2009) find that retail sector productivity growth would have been 0.44%
per annum rather than the actual 0.07% per annum (between 1997/98 and
2002/03) in the absence of changes in store size brought about by changes in
planning regulation. Using EUKLEMS data, we can infer that productivity
growth in the UK would have been 0.16 percentage points higher per annum in
the absence of changes in supermarket store sizes. On a growth accounting
basis, TFP growth can be directly compared with average annual GDP growth of
3.6% between 1997/98 and 2002/032. However, none of the studies on planning
regulation use a holistic approach that includes all relevant sectors of the
economy.
Environmental regulation may have a net positive impact on growth if positive
effects on firm innovation offset the compliance costs. However, the empirical
evidence appears to be mixed and the outcome depends on the regulatory design
and type of regulation.
In addition to product market regulation, labour market regulation is the other
important area that has an influence on growth. However, it is not clear whether
labour market regulation has a net positive or negative impact on growth. Most
of this literature focuses on the impact of employment protection legislation
(EPL) on growth. The key theoretical channels are:
2 Gross Domestic Product: chained volume measures: Seasonally adjusted based on Office of
National Statistics, Second estimate of GDP time series dataset 2011 Q4, Available
http://www.ons.gov.uk/ons/rel/naa2/second-estimate-of-gdp/q4-2011/tsd-second-estimate-of-gdp-2011-
q4.html
May 2012 | Frontier Economics 9
Executive Summary
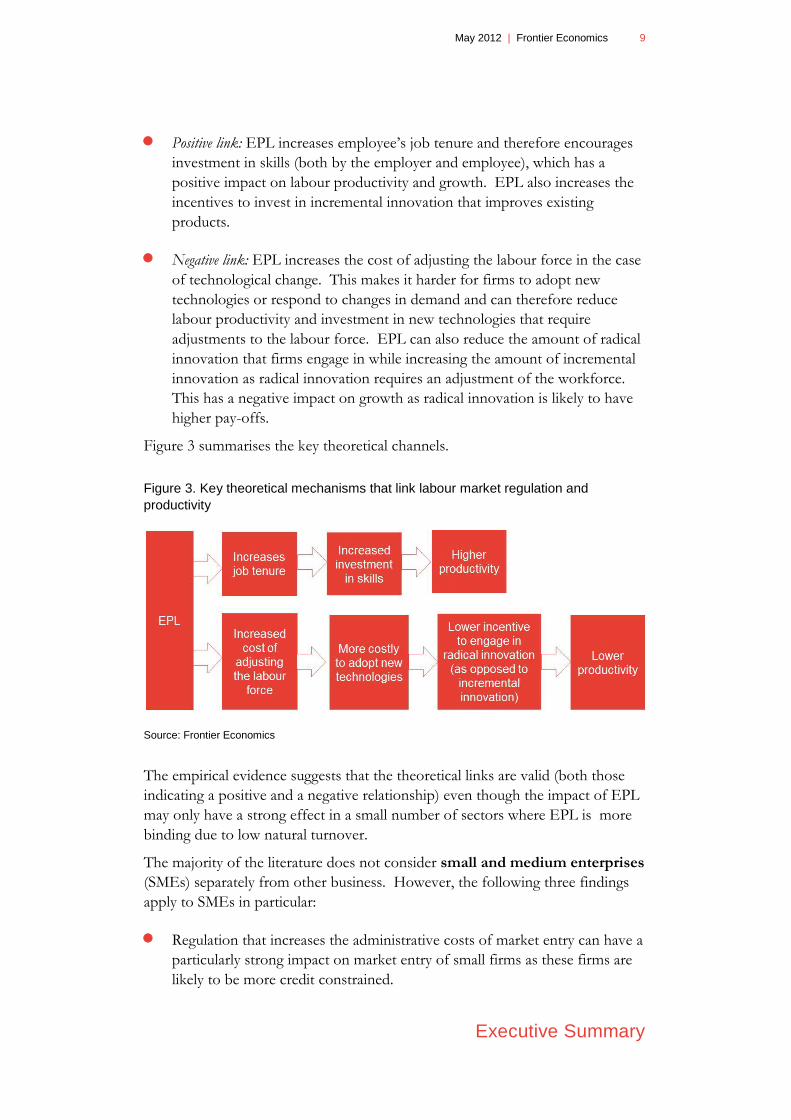
Positive link: EPL increases employee’s job tenure and therefore encourages
investment in skills (both by the employer and employee), which has a
positive impact on labour productivity and growth. EPL also increases the
incentives to invest in incremental innovation that improves existing
products.
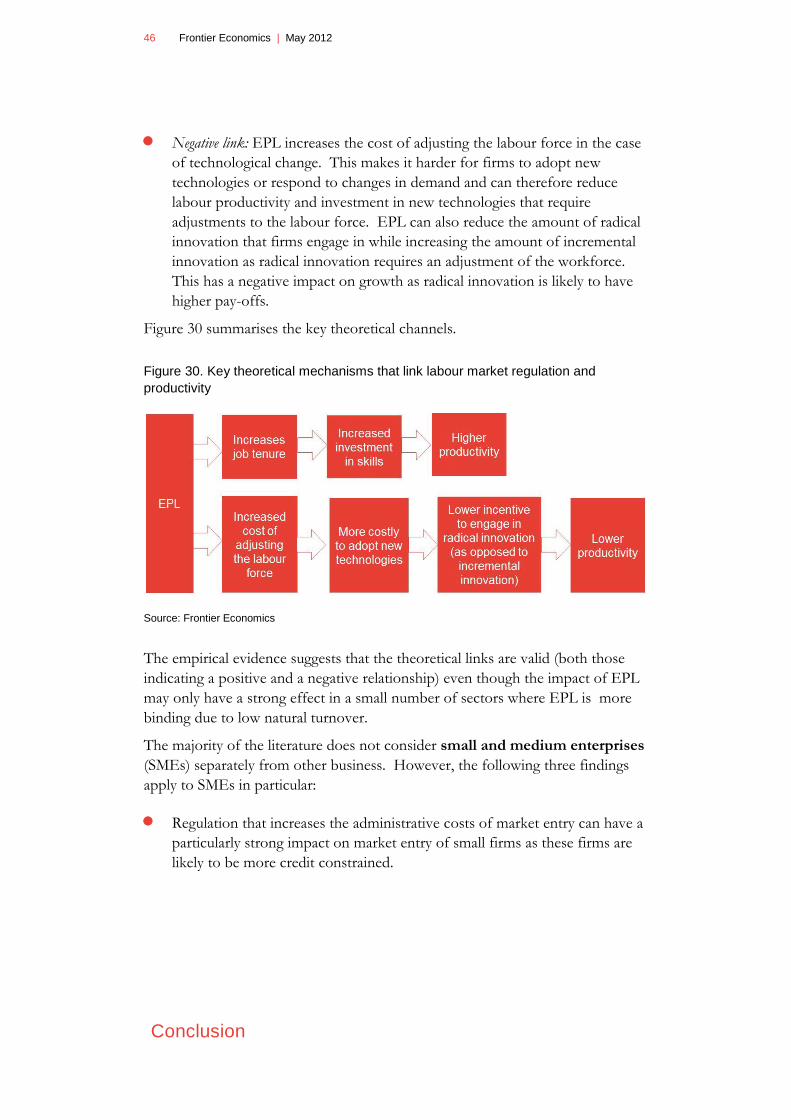
Negative link: EPL increases the cost of adjusting the labour force in the case
of technological change. This makes it harder for firms to adopt new
technologies or respond to changes in demand and can therefore reduce
labour productivity and investment in new technologies that require
adjustments to the labour force. EPL can also reduce the amount of radical
innovation that firms engage in while increasing the amount of incremental
innovation as radical innovation requires an adjustment of the workforce.
This has a negative impact on growth as radical innovation is likely to have
higher pay-offs.
Figure 3 summarises the key theoretical channels.
Figure 3. Key theoretical mechanisms that link labour market regulation and
productivity
Source: Frontier Economics
The empirical evidence suggests that the theoretical links are valid (both those
indicating a positive and a negative relationship) even though the impact of EPL
may only have a strong effect in a small number of sectors where EPL is more
binding due to low natural turnover.
The majority of the literature does not consider small and medium enterprises
(SMEs) separately from other business. However, the following three findings
apply to SMEs in particular:
Regulation that increases the administrative costs of market entry can have a
particularly strong impact on market entry of small firms as these firms are
likely to be more credit constrained.

10 Frontier Economics | May 2012
Executive Summary
The Porter Hypothesis states that environmental regulation can have a net
positive impact on growth if the regulation leads to innovation that improves
business performance and if the positive impact outweighs the direct
business costs. Ambec et al (2010) argue that this may apply particularly to
SMEs as they may be less likely to be profit-maximising due to, for example,
a lack of time and technical expertise.
Employment Protection legislation may have a stronger impact on SMEs as
they are less able to substitute capital for labour due to credit constraints.
Implications for policy development
In general, the UK is a highly deregulated economy when compared to other
OECD countries. Against this background, the literature nevertheless indicates
that further reduction of product market regulation is likely to have a positive
impact on growth. It is more difficult to be certain about labour market
regulations. From a policy perspective we would argue that employment
protection legislation in particular, are carefully assessed in terms of costs and
benefits before considering deregulation. In the context of new employment
production regulation, it is important that regulatory impact assessments clearly
set the balance between the potential negative and positive growth effects. The
theoretical mechanisms described in this report could be used to undertake such
an assessment.
Based on our main findings, Figure 4 provides an overview of the key
implications for policy development in the UK in each of the areas of regulation.

May 2012 | Frontier Economics 11
Executive Summary
Figure 4. Overview of key implications of findings

12 Frontier Economics | May 2012
Introduction
1 Introduction
A critical review of the literature needs to be based on a sound conceptual
framework. We consider it important to clarify some of the key concepts before
going into the detailed mechanisms of how regulations can affect growth.
Figure 5 illustrates that regulation can have a positive or negative impact on the
economy. Regulations that are introduced to correct market failures such as
economies of scale, asymmetric information, externalities or others have some
positive impact on economic activity as they enhance economic efficiency.
Reducing market failures can have a positive impact on economic growth even
though this is not always the case as greater economic efficiency is not always
captured by higher GDP growth (for example, in the case of pricing
externalities). Such positive impacts on economic growth may be more than
offset by high compliance costs, market distortions or unintended consequences.
The overall impact of regulations that are intended to remove market failures
depends on the balance between the two impacts as shown in Figure 5.
Figure 5. The impact of regulation on growth
Source: Frontier Economics

May 2012 | Frontier Economics 13
Introduction
Regulation can affect the level of economic activity and the rate of economic
growth. It is important to distinguish these two concepts illustrated in Figure 6.
A change in the level of economic activity can still represent a significant
reduction in economic activity but is a one-off impact. A change in the level of
economic activity as a result of regulation is often measured by compliance costs
even though compliance costs can also affect the permanent impact of
regulations on growth. The business community generally focuses on
compliance costs as they provide an indication of the amount of resources that
are diverted from productive to non-productive uses as a result of regulation.
However, such measures of direct compliance costs generally only include the
one-off levels effect rather than the sustained impact of regulations on the rate of
economic growth.
Figure 6. Illustration of one-off vs. permanent effect
Source: Frontier Economics
In contrast, the academic literature focuses more on the impact of regulation on
the rate of growth. A substantial impact on the growth rate over time can lead to
a substantial loss in output. As these impacts are larger than a change in the level
of economic activity, it is good that this is the focus of the literature. The
literature considers how regulations affect decisions to invest, innovate or to
adopt new technology as these decisions have an impact on the growth rate
rather that the level of economic activity.
Regulations that are not introduced on the basis of market failures are likely to
have a negative impact on growth. Two main types can be identified:

14 Frontier Economics | May 2012
Introduction
Regulation that is introduced to achieve wider government objectives such
as equality or social cohesion is likely to have a negative impact on growth.
However, this does not mean that these regulations should not be
implemented. It implies that the positive impacts of these types of
regulation are not captured in measures of economic growth. For example,
if a regulation was to contribute to greater safety for individuals a significant
part of this impact may not be measured in GDP.
Regulation that is introduced on the basis of rent-seeking3 will have a
negative impact on growth.
Economic growth drivers
To clarify some of the technical terms used in the study, we can consider a simple
model of economic growth:
Y = A F(K,L)
where Y is output, A is total factor productivity, K is capital and L is labour.
Using a Cobb Douglas production function, we can derive the growth rate of
output per worker as follows:
The last equation shows that growth in the output per worker is driven by total
factor productivity growth (change in A) and growth in the capital-labour ratio
(change in K/L). The capital-labour ratio grows when the required labour per
unit of capital falls which may be due to investment in technology or skills.
Key channels
Most of the literature does not deal with the impact of regulation on growth
directly but instead focuses on the impact of regulation on one of the growth
drivers (labour productivity, investment, innovation, total factor productivity). In
these cases, the relationship between the growth drivers and economic growth is
taken as given.
3 Rent-seeking includes activities such as lobbying by particular groups to gain a greater share of
existing wealth.

May 2012 | Frontier Economics 15
Introduction
The key channels by which regulation can have an impact on the growth rate are
shown in Figure 7. Regulation can affect the level of competition, the relative
prices of factor inputs and the incentives to invest (in both capital and labour)
and innovate. As a result, skills formation, investment, innovation and total
factor productivity may be affected which influence the output per worker and
therefore have an impact on economic growth. The key channels presented here
form underlying conceptual basis of most of the literature we reviewed.
Figure 7. Key channels
Source: Frontier Economics
Report outline
This report is structured as follows:
Section 2 provides the findings from the literature review on aggregate
measures of regulation
Section 3 provides our findings on product market regulation;
Section 3 provides the findings on labour market regulation;
Section 4 concludes.
Annexe 1 provides more detail on the methodology. Annexe 2 provides the list
of literature that we reviewed. Annexe 3 provides a summary of the detailed
empirical findings.

16 Frontier Economics | May 2012
Aggregate measures of regulation
2 Aggregate measures of regulation
There are a number of aggregate measures of regulation such as the OECD
indicators, World Bank Doing Business ranking and the Fraser Institute of
Economic Freedom Index (each discussed in more detail below). These
aggregate indices measure a range of regulations and other government
interventions which are ultimately summarised in a single ranking or rating.
Aggregate measures are different from the product market regulation indicators
as they try to capture the business environment and cost of doing business.
Main findings
Differences in the level of regulation can partly explain cross-country differences
in economic growth. For the most regulated countries, a reduction in regulation
is likely to have a positive impact on growth. However, growth impacts from
deregulation are likely to diminish with the level of regulation in a particular
country. As the UK is one of the most deregulated economies in the world,
literature that uses aggregate measures of regulation cannot be used to inform the
UK’s regulatory policy.
Theoretical mechanisms and empirical evidence
Our main findings are based on the review of a range of papers of which we
present the three most relevant papers in this section. Gorgens et al (2003)
acknowledge that regulation can have both a positive and negative impact on
growth (see Figure 8). Regulation can increase growth when it improves
economic efficiency by reducing market failures. However, regulation can
decrease growth if it is based on other objectives such as rent-seeking. The
purpose of the paper is to determine the functional form of the relationship
between regulation and growth using a semi-parametric regression. A non-linear
relationship could suggest that countries with a higher level of regulation are
more likely to have a high proportion of those regulations that have a negative
impact on growth.
May 2012 | Frontier Economics 17
Aggregate measures of regulation
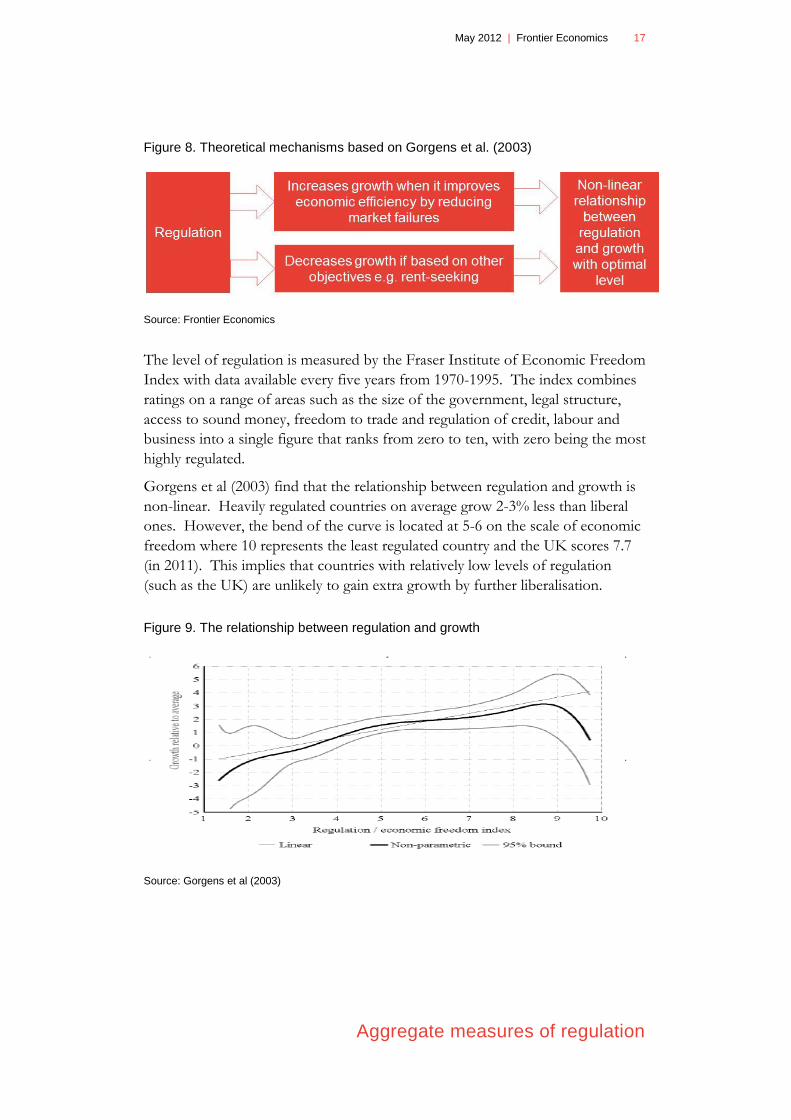
Figure 8. Theoretical mechanisms based on Gorgens et al. (2003)
Source: Frontier Economics
The level of regulation is measured by the Fraser Institute of Economic Freedom
Index with data available every five years from 1970-1995. The index combines
ratings on a range of areas such as the size of the government, legal structure,
access to sound money, freedom to trade and regulation of credit, labour and
business into a single figure that ranks from zero to ten, with zero being the most
highly regulated.
Gorgens et al (2003) find that the relationship between regulation and growth is
non-linear. Heavily regulated countries on average grow 2-3% less than liberal
ones. However, the bend of the curve is located at 5-6 on the scale of economic
freedom where 10 represents the least regulated country and the UK scores 7.7
(in 2011). This implies that countries with relatively low levels of regulation
(such as the UK) are unlikely to gain extra growth by further liberalisation.
Figure 9. The relationship between regulation and growth
Source: Gorgens et al (2003)

18 Frontier Economics | May 2012
Aggregate measures of regulation
The Fraser Institute Index of Economic Freedom
Forty-two data points are used to construct a summary index and to measure the
degree of economic freedom in five broad areas:
1. Size of Government: Expenditures, Taxes, and Enterprises;
2. Legal Structure and Security of Property Rights;
3. Access to Sound Money;
4. Freedom to Trade Internationally;
5. Regulation of Credit, Labour, and Business.
The data is mainly sourced from the World Bank, International Monetary Fund
and Global Competitiveness Report. Figure 10 shows the top rankings of the
latest survey. The top three countries are Hong Kong, Singapore, New Zealand.
The UK ranks 8th, Germany ranks 21th and France 42nd.
Figure 10. 2011 Fraser Institute of Economic Freedom – Top 42 countries

May 2012 | Frontier Economics 19
Aggregate measures of regulation
Busse and Groizard (2008) focus on how regulations can change the impact
that foreign direct investments (FDI) have on economic growth. FDI generally
has a positive impact on growth as the capital stock is increased and knowledge
from abroad is diffused via imitation and learning. Regulations that restrict entry
of new firms or labour turnover slow the diffusion of technology and the
increase in human capital which reduces the positive impact of FDI and
therefore slows down growth. This mechanism is summarised in Figure 11.
Figure 11. Theoretical mechanisms based on Busse and Groizard (2008)
Source: Frontier Economics
Busse and Groizard (2008) use a standard cross-country growth regression with
regulation interacted with FDI inflows and other control variables. Regulation is
measured by five components of the World Bank Doing Business Indicators.
The indicators cover 11 different areas including starting a business, registering
property, enforcing contracts and protecting investors. Busse and Groizard
(2008) select the five most relevant areas for their empirical analysis. They find
that FDI does not stimulate growth in economies with excessive business and
labour regulations. This finding applies to the 20-30% most regulated countries.
The indicator on starting a business affects the impact of FDI on growth in
particular. Overall, Busse and Groizard (2008) find that there is a threshold effect
rather than a linear relationship between regulation and the impact of FDI on
growth. Regulation has a negative impact on the way FDI can influence growth
only in the most regulated countries.

20 Frontier Economics | May 2012
Aggregate measures of regulation
World Bank Doing Business Indicators
The World Bank Doing Business indicators measures the ease of doing business
in the areas shown in Table 1 below.
Table 1. Area of business regulation measured by Doing Business indicators
Start up Expansion Operations Insolvency
Starting a
business
Registering
property
Dealing with
construction permits
Resolving
insolvency
Getting credit Getting electricity
Protecting
investors
Paying taxes
Enforcing
contracts Trading across
borders
Source: World Bank 2012
The data is collected by using a questionnaire that is used to survey experts in a
range of fields including lawyers, accountants, freight forwarders, etc. The World
Bank states that having a representative sample of respondents is not an issue as
Doing Business is not a statistical survey as the texts of the relevant laws and
regulations and collected and answers checked for accuracy. In 2012, the top
three countries are Singapore, Hong Kong and New Zealand. The UK ranks 7th,
Germany ranks19th and France ranks 29th.
Djankov et al. (2006) examine the impact of regulation on growth on the basis
that institutions are a major determinant of wealth and long-term growth.
Countries that had better political and economic institutions in the past are richer
today. Their analysis is based on the World Bank Doing Business Indicators.
They find that the relationship the relationship between more business-friendly
regulations and higher growth rates is consistently significant in various
specifications of standard growth models. Improving from the worst (first) to
the best (fourth) quartile of business regulations implies a 2.3 percentage point
increase in average annual growth.

May 2012 | Frontier Economics 21
Aggregate measures of regulation
Limitations of the results
The literature that uses aggregate measures of regulation is subject to a number
of limitations:
The literature in this area uses aggregate indicators that measure a vast range
of regulations and compares a large number of countries. The results are
therefore driven by large cross-country differences.
The indices do not capture the level of enforcement of regulations. The
indices measure regulation imperfectly so differences may also be caused by
legal frameworks or other factors.
Results do not provide insights into how regulation affects growth within
developed economies (e.g. within OECD).
The literature cannot resolve the issue of reverse causality. While it may be
true that lower regulations lead to higher growth, it is also possible that
reducing regulation is easier at higher levels of income.
Aggregate measures of regulation cannot provide any indication on the
specific individual mechanisms or types of regulations that affect growth.
Potential implications for policy development
The literature that uses aggregate measures of regulation cannot be used to
determine the impact of regulation on growth in the UK as most of the findings
apply to deregulation in highly regulated economies. The UK ranks 8th out of
183 countries on the 2012 Doing Business indicators and 7th out of 142
countries on the latest Fraser Institute of Economic Freedom Index. The
findings from the literature cannot be used to infer the impact of regulatory
reform that would change the UK’s rating within the top quartile.
22 Frontier Economics | May 2012
Product market regulation
3 Product market regulation
Product market regulation covers a broad range of rules that affect business
operations during the firm life cycle including start up, operation and expansion
and exit. This section deals with three types of regulations that all fall within the
wider definition of product market regulation: general product market regulation,
planning regulation and environmental regulation.
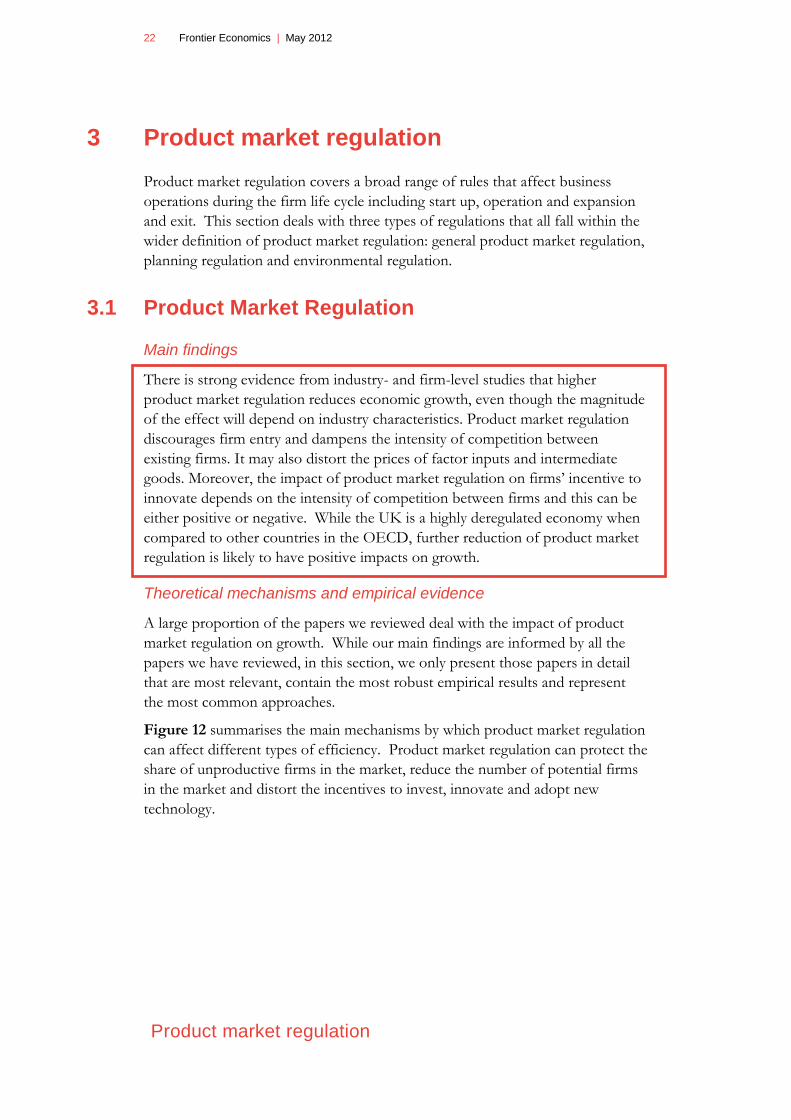
3.1 Product Market Regulation
Main findings
There is strong evidence from industry- and firm-level studies that higher
product market regulation reduces economic growth, even though the magnitude
of the effect will depend on industry characteristics. Product market regulation
discourages firm entry and dampens the intensity of competition between
existing firms. It may also distort the prices of factor inputs and intermediate
goods. Moreover, the impact of product market regulation on firms’ incentive to
innovate depends on the intensity of competition between firms and this can be
either positive or negative. While the UK is a highly deregulated economy when
compared to other countries in the OECD, further reduction of product market
regulation is likely to have positive impacts on growth.
Theoretical mechanisms and empirical evidence
A large proportion of the papers we reviewed deal with the impact of product
market regulation on growth. While our main findings are informed by all the
papers we have reviewed, in this section, we only present those papers in detail
that are most relevant, contain the most robust empirical results and represent
the most common approaches.
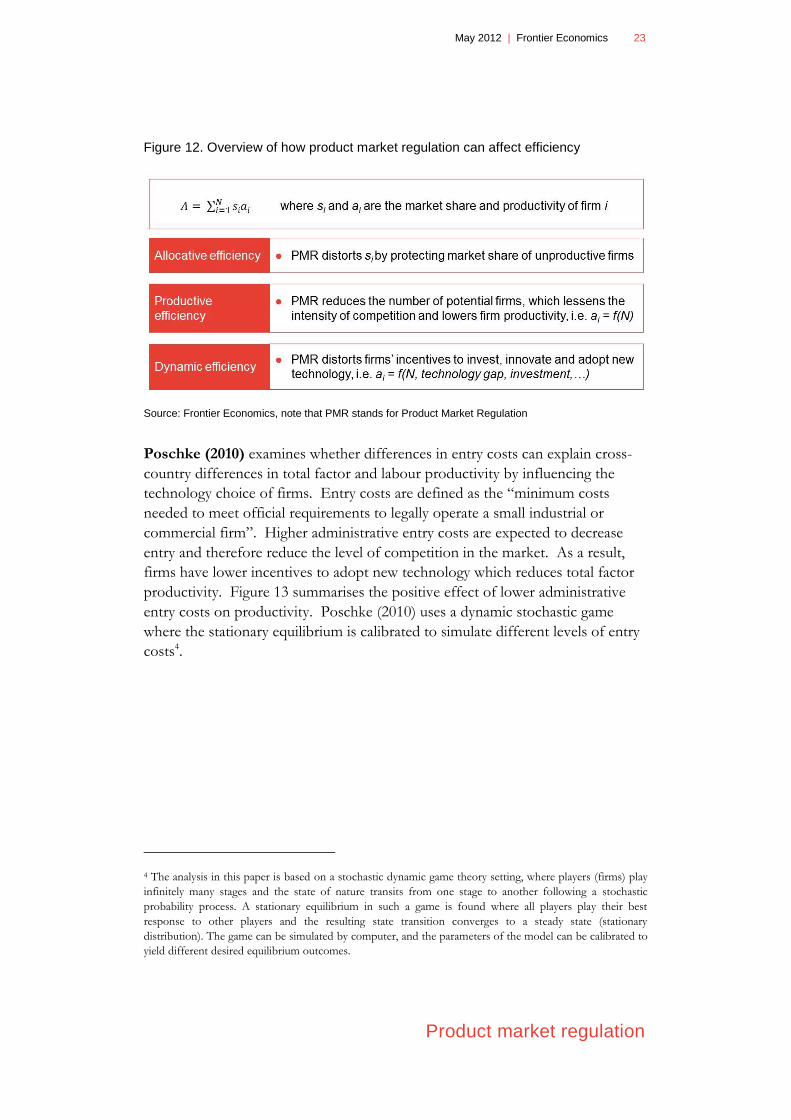
Figure 12 summarises the main mechanisms by which product market regulation
can affect different types of efficiency. Product market regulation can protect the
share of unproductive firms in the market, reduce the number of potential firms
in the market and distort the incentives to invest, innovate and adopt new
technology.
May 2012 | Frontier Economics 23
Product market regulation
Figure 12. Overview of how product market regulation can affect efficiency
Source: Frontier Economics, note that PMR stands for Product Market Regulation
Poschke (2010) examines whether differences in entry costs can explain cross-
country differences in total factor and labour productivity by influencing the
technology choice of firms. Entry costs are defined as the “minimum costs
needed to meet official requirements to legally operate a small industrial or
commercial firm”. Higher administrative entry costs are expected to decrease
entry and therefore reduce the level of competition in the market. As a result,
firms have lower incentives to adopt new technology which reduces total factor
productivity. Figure 13 summarises the positive effect of lower administrative
entry costs on productivity. Poschke (2010) uses a dynamic stochastic game
where the stationary equilibrium is calibrated to simulate different levels of entry
costs4.
4 The analysis in this paper is based on a stochastic dynamic game theory setting, where players (firms) play
infinitely many stages and the state of nature transits from one stage to another following a stochastic
probability process. A stationary equilibrium in such a game is found where all players play their best
response to other players and the resulting state transition converges to a steady state (stationary
distribution). The game can be simulated by computer, and the parameters of the model can be calibrated to
yield different desired equilibrium outcomes.

24 Frontier Economics | May 2012
Product market regulation
Figure 13. Theoretical mechanism based on Poschke (2010)
Source: Frontier Economics
Data on administrative costs of entry are based on an earlier paper by Djankov
(2002). Entry costs per firm are expressed as a proportion of GDP per capita.
They range from levels as low as 1.7% for the US to 463% for the Dominican
Republic with a cross-country average of 47%. Germany’s entry costs are
estimated as 32.5% of GDP per capita. Poschke (2010) simulates the effect of
the entry costs in the US changing from 1.7% of GDP per capita to 30% (which
is around the level of most of the European countries). This accounts for one-
third of the observed TFP difference between Germany and the US. Given that
administrative entry costs make up a small proportion of total start-up costs, the
results are relatively high. Poschke (2010) finds that an increase in administrative
entry costs from 1.7% to 10% of GDP per capita in the US reduces total factor
productivity by 0.8%. The empirical results cannot be compared directly to the
UK as Poschke simulates the effect of the administrative entry costs increasing in
the US. However, Djankov (2002)5 presents the administrative entry costs in the
UK as 3.3% of GDP which is much closer to the US than most European
countries. As a result, we can infer that total factor productivity in the UK is
likely to fall if the administrative entry costs were increased to the level of
Germany.
Griffith, Harrison and Simpson (2010) find that deregulation has had a
negative impact on profitability (due to an increase in the level of competition)
and a positive impact on innovation and total factor productivity. They use the
introduction of the Single Market Programme (SMP) as an exogenous change in
product market regulation and assess the impact of the SMP on firm profitability,
R&D expenditure and TFP.
5 See Djankov, S., La Porta, R., Lopez-de-Silanes, F. and Shleifer, A.(2002), The regulation of entry, Quarterly Journal of Economics, vol. 117(1), pp. 1–37.
May 2012 | Frontier Economics 25
Product market regulation
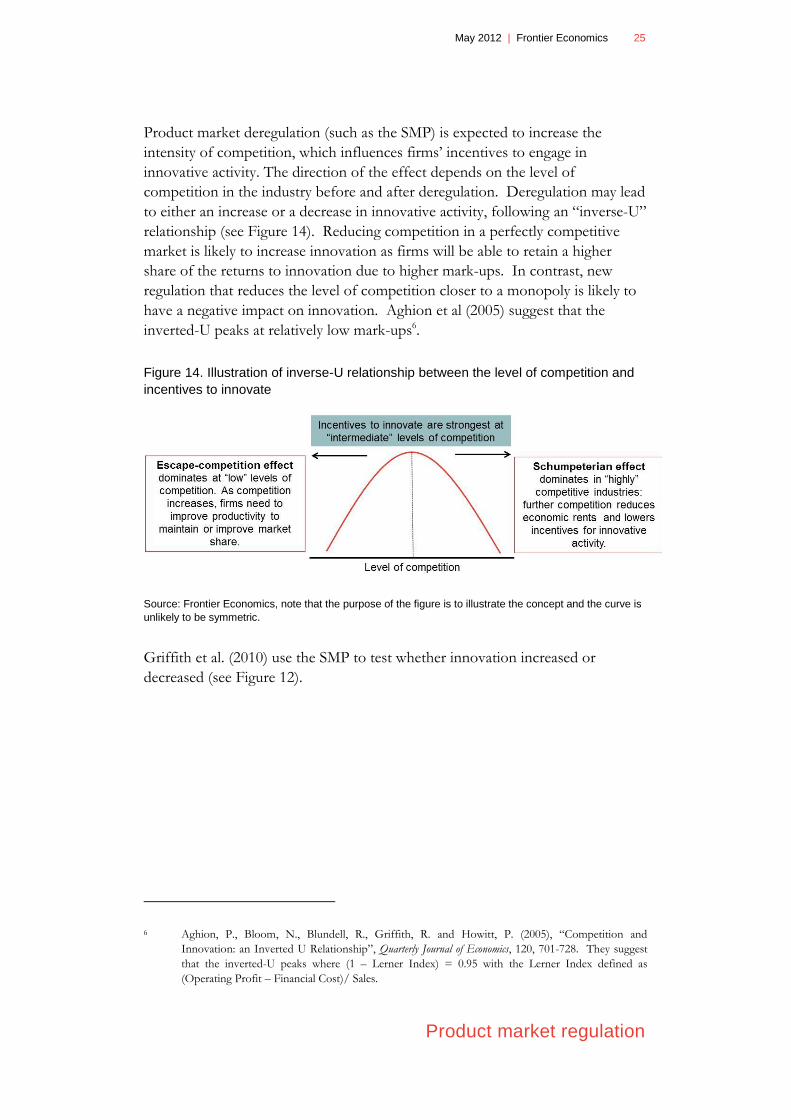
Product market deregulation (such as the SMP) is expected to increase the
intensity of competition, which influences firms’ incentives to engage in
innovative activity. The direction of the effect depends on the level of
competition in the industry before and after deregulation. Deregulation may lead
to either an increase or a decrease in innovative activity, following an “inverse-U”
relationship (see Figure 14). Reducing competition in a perfectly competitive
market is likely to increase innovation as firms will be able to retain a higher
share of the returns to innovation due to higher mark-ups. In contrast, new
regulation that reduces the level of competition closer to a monopoly is likely to
have a negative impact on innovation. Aghion et al (2005) suggest that the
inverted-U peaks at relatively low mark-ups6.
Figure 14. Illustration of inverse-U relationship between the level of competition and
incentives to innovate
Source: Frontier Economics, note that the purpose of the figure is to illustrate the concept and the curve is
unlikely to be symmetric.
Griffith et al. (2010) use the SMP to test whether innovation increased or
decreased (see Figure 12).
6 Aghion, P., Bloom, N., Blundell, R., Griffith, R. and Howitt, P. (2005), “Competition and
Innovation: an Inverted U Relationship”, Quarterly Journal of Economics, 120, 701-728. They suggest
that the inverted-U peaks where (1 – Lerner Index) = 0.95 with the Lerner Index defined as
(Operating Profit – Financial Cost)/ Sales.

26 Frontier Economics | May 2012
Product market regulation
Figure 15. Theoretical mechanisms based on Griffith et al (2010)
Source: Frontier Economics
Griffith et al (2010) examine the impact of the SMP on those industries that are
expected to be most affected. The empirical findings are summarised in Figure
16.
Figure 16. Empirical findings by Griffith et al (2010)
Source: Frontier Economics
Bourles et al (2010) focuses on the impact of regulation in upstream markets on
downstream sector productivity through input-output inter linkages. If
regulation reduces the level of competition in upstream markets, within-industry
effects alone do not provide the full range of impacts as it is also important to
address impacts on downstream sectors. Market power in upstream markets may

May 2012 | Frontier Economics 27
Product market regulation
reduce incentives to improve efficiency and curb productivity in downstream
sectors. For example, tight licensing requirements in retail trade or transport can
narrow access to distribution channels. Figure 17 summarises this mechanism.
Figure 17. Theoretical mechanisms based on Bourles (2010)
Source: Frontier Economics
Bourles et al (2010) uses data from the OECD (see box below) over the past two
decades to test the existence and magnitude of the potential negative impact of
upstream market product regulations on downstream market productivity. They
find that differences in regulation of non-manufacturing sectors that provide
intermediate inputs can partly explain the variance of multifactor productivity
(MFP) growth rates. The impact is higher for firms that are closer to the
technological frontier. The impact also increases over time with the diffusion of
ICT. Bourles et al (2010) find that over the 1995-2007 period (at the average
MFP gap) eliminating all regulatory burdens in upstream sectors could have
increased MFP growth by up to 1.7 percentage points per year.
OECD Product Market Regulation Indicators
The OECD maintains a comprehensive set of indicators related to product
market regulation. The OECD PMR indicators were designed to measure the
extent to which policy settings promote or inhibit competition in areas of the
product market where competition is viable. They include:
Economy-wide indicators: state control of enterprises; legal and
administrative barriers to entrepreneurship; barriers to trade and investment
Sector-specific: Professional Services; Retail Trade; Energy, Transport &
Communications
Regulatory Impact: map sector linkages in input-output markets to capture
‘knock-on’ effects of regulation on ‘downstream’ firms
Most of the indicators were estimated in 1998, 2003 and 2008. Inputs are
collected via questionnaires.

28 Frontier Economics | May 2012
Product market regulation
Our main findings are also supported by a range of papers that contain literature
reviews of the impact of regulation on growth. One of the most recent and most
relevant papers by Arnold et al (2011a) provides a review of a wide range of
papers that cover the link between product market regulation and growth. They
consider the same channels as suggested above: product market regulations
reduce the level of competition in markets which has an impact on the incentives
to innovate and/or adopt new technologies. Arnold et al (2011a) find that
countries and industries where direct and indicate regulatory burdens are
lighter have generally experienced the highest GDP per capita and
productivity growth rates;
evidence at the firm level suggests that where regulatory burdens are lighter
the reallocation of resources towards the highest productivity firms is
stronger.
the implications of inappropriate regulations for productivity performance
are estimated to be quantitatively important. Therefore, reforming such
regulations can provide a significant boost to potential growth in OECD
economies.
Limitations of the results
The key limitations of the results are:
While the direction of impact and key mechanisms are strongly supported by
evidence, the magnitude of the impact is context-specific.
It is possible that other factors that influence growth may interact with
product market regulation. In this case measures of product market
regulation may partly represent other factors that are not explicitly included
in the theoretical mechanisms.
Coverage of the product market regulation indicators is not complete as
some types of regulation are not included. For example, the indicators
generally do not represent measures of planning regulations (which is dealt
with separately in section 3.2)
The indicators represent product market regulation as stipulated by law and
therefore do not take into account enforcement and implementation.

May 2012 | Frontier Economics 29
Product market regulation
Potential implications for policy development
The theoretical mechanisms and empirical evidence provide strong evidence that
product market regulation has a negative impact on growth. Figure 18 shows
that the UK is the most deregulated economy in the OECD based on the
aggregate OECD indicators for product market regulation. This finding is
supported by the OECD estimates of mark-ups shown in Figure 19 as it suggests
that suggest price-cost margins are relatively low in the UK services sector.
Nevertheless, the literature suggests that the impact of further deregulation in
this area is likely to be positive as the impacts on the level of competition in
markets is likely to persist even at low levels of regulation.
Figure 18. 2008 OECD Product Market Regulation Indicator
Source: OECD, Indicators of Product Market Regulation, Available
http://www.oecd.org/document/36/0,3746,en_2649_37443_35790244_1_1_1_37443,00.html
30 Frontier Economics | May 2012
Product market regulation
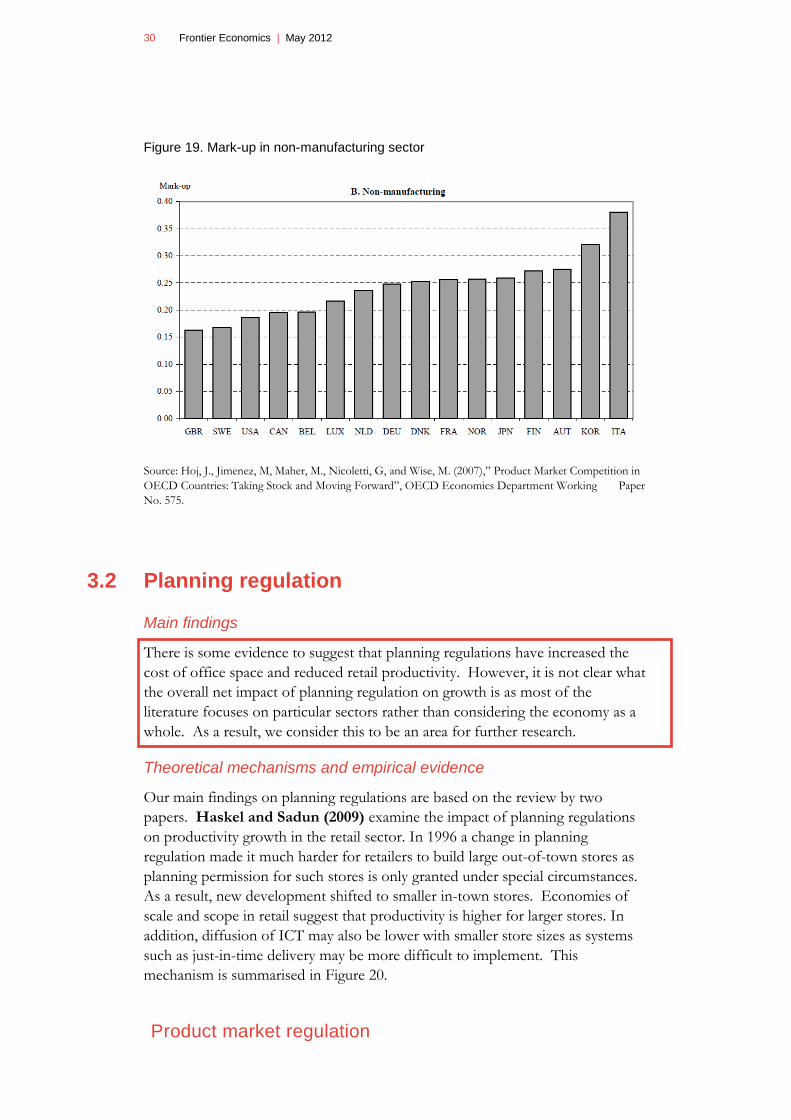
Figure 19. Mark-up in non-manufacturing sector
Source: Hoj, J., Jimenez, M, Maher, M., Nicoletti, G, and Wise, M. (2007),” Product Market Competition in
OECD Countries: Taking Stock and Moving Forward”, OECD Economics Department Working Paper
No. 575.
3.2 Planning regulation
Main findings
There is some evidence to suggest that planning regulations have increased the
cost of office space and reduced retail productivity. However, it is not clear what
the overall net impact of planning regulation on growth is as most of the
literature focuses on particular sectors rather than considering the economy as a
whole. As a result, we consider this to be an area for further research.
Theoretical mechanisms and empirical evidence
Our main findings on planning regulations are based on the review by two
papers. Haskel and Sadun (2009) examine the impact of planning regulations
on productivity growth in the retail sector. In 1996 a change in planning
regulation made it much harder for retailers to build large out-of-town stores as
planning permission for such stores is only granted under special circumstances.
As a result, new development shifted to smaller in-town stores. Economies of
scale and scope in retail suggest that productivity is higher for larger stores. In
addition, diffusion of ICT may also be lower with smaller store sizes as systems
such as just-in-time delivery may be more difficult to implement. This
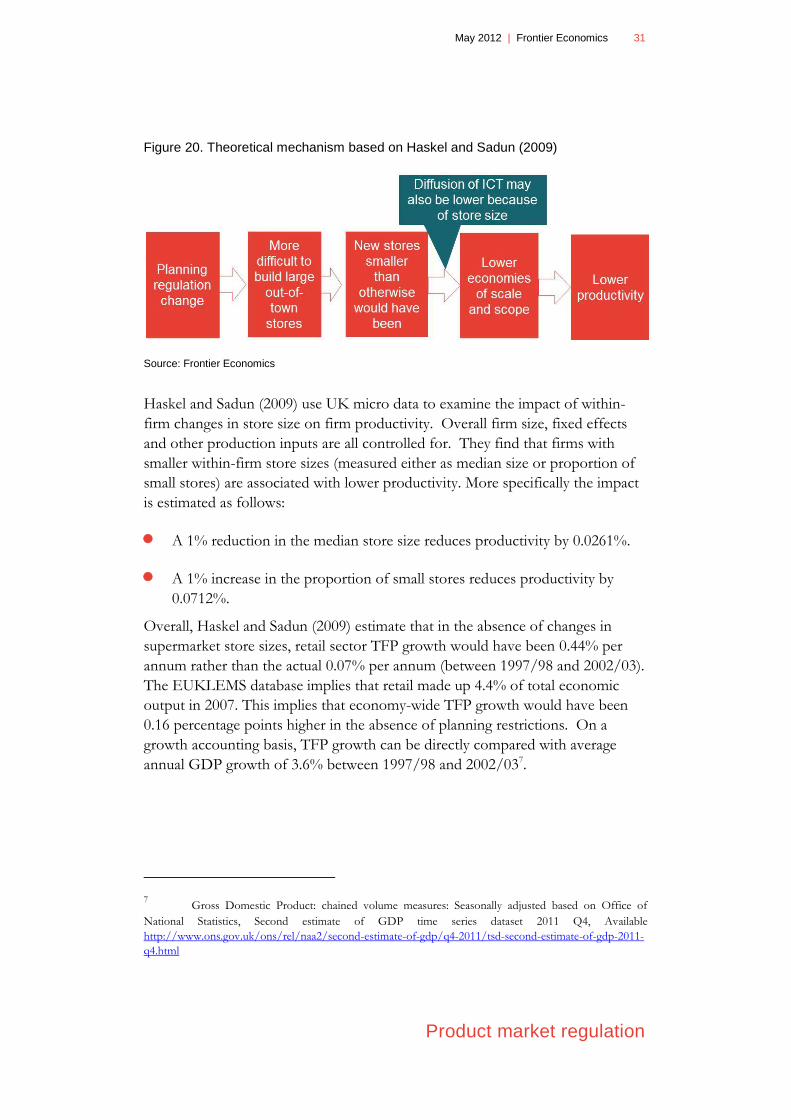
mechanism is summarised in Figure 20.
May 2012 | Frontier Economics 31
Product market regulation
Figure 20. Theoretical mechanism based on Haskel and Sadun (2009)
Source: Frontier Economics
Haskel and Sadun (2009) use UK micro data to examine the impact of within-
firm changes in store size on firm productivity. Overall firm size, fixed effects
and other production inputs are all controlled for. They find that firms with
smaller within-firm store sizes (measured either as median size or proportion of
small stores) are associated with lower productivity. More specifically the impact
is estimated as follows:
A 1% reduction in the median store size reduces productivity by 0.0261%.
A 1% increase in the proportion of small stores reduces productivity by
0.0712%.
Overall, Haskel and Sadun (2009) estimate that in the absence of changes in
supermarket store sizes, retail sector TFP growth would have been 0.44% per
annum rather than the actual 0.07% per annum (between 1997/98 and 2002/03).
The EUKLEMS database implies that retail made up 4.4% of total economic
output in 2007. This implies that economy-wide TFP growth would have been
0.16 percentage points higher in the absence of planning restrictions. On a
growth accounting basis, TFP growth can be directly compared with average
annual GDP growth of 3.6% between 1997/98 and 2002/037.
7 Gross Domestic Product: chained volume measures: Seasonally adjusted based on Office of
National Statistics, Second estimate of GDP time series dataset 2011 Q4, Available
http://www.ons.gov.uk/ons/rel/naa2/second-estimate-of-gdp/q4-2011/tsd-second-estimate-of-gdp-2011-
q4.html

32 Frontier Economics | May 2012
Product market regulation
Cheshire and Hilber (2008) examine the impact of planning regulations on the
cost of office space. They specifically estimate the “regulatory tax” on office
space as a result of restrictions of land supply and building height restrictions.
The regulatory tax is defined as the percentage difference between the market
value of an additional square metre of office space and the marginal construction
costs of adding one square metre of additional floor space. In the absence of any
planning regulations and with perfect competition in the property development
market, these values would be expected to be equal. Higher cost of office space
increases the cost to business and may also have an impact on agglomeration.
This mechanism is summarised in Figure 21.
Figure 21. Theoretical mechanism based on Cheshire and Hilber (2008)
Source: Frontier Economics
Cheshire and Hilber (2008) estimate the regulatory tax for different areas of
London, the UK and a number of international cities for different points in time.
Figure 22 provides the estimates for different parts of London between 1960 and
2005.

May 2012 | Frontier Economics 33
Product market regulation
Figure 22. Regulatory tax as estimated by Cheshire and Hilber (2008)
Source: Cheshire and Hilber (2008)
The regulatory tax rates in the City of London can be compared to other large
European cities. In 2005, the regulatory tax in the City of London is estimated at
8.89% compared to Frankfurt (3.31%), Stockholm (3.30%) and Milan (4.11%).
Limitations of the results
The key limitation of the literature that focuses on planning regulation is their
narrow focus on the impact of regulation on one particular sector. For example,
Haskel and Sadun (2009) focus on TFP growth in the retail sector without taking
into account potential upstream and downstream impacts of the planning
regulation. Their analysis takes the perspective of the store owners rather than
the store users. For example, it is likely that in-town stores had some positive
effect on store users’ time savings. Similarly, Cheshire and Hilber (2008) do not
consider wider impacts of planning regulation such as the potential impacts on
the transport network. Neither of the two papers tries to estimate the benefits of
planning regulations. If benefits of such regulations were estimated, it is not
clear that there would be a net negative impact on growth.
Moreover, a key omission regarding the literature on planning regulations is the
impact of planning regulations on restricting the size of agglomerations with
negative implications for productivity8.
8 See for example: Melo Patricia C. and Graham Daniel J. (2010), Agglomeration Economies and
Labour Productivity: Evidence from Longitudinal Worker Data for GB’s Travel-to- Work Areas.
34 Frontier Economics | May 2012
Product market regulation
In addition, Haskel and Sadun (2009) argue that the data demonstrates that larger
stores benefit from economies of scale and scope. However, it is possible that
the results represent a correlation of store size and location as larger stores are
more likely to be located in rural areas and smaller stores are more likely to be
located in urban areas. Larger stores that are located out of town are likely to
have fewer competing stores in the surrounding area. As a result, they are likely
to have higher sales density and higher productivity. The results in Haskel and
Sadun (2009) may therefore capture a competition effect rather than economies
of scale and scope.
Potential implications for policy development
Overall, we conclude that there is some evidence to suggest that productivity
growth in retail could have been higher in the absence of planning regulation that
favours in-town retail shops. There is also some evidence to suggest that
planning regulations increases the cost of office space. However, it is not clear
whether planning regulations have an overall net negative impact on economic
growth.
The literature in this area can therefore not be used to draw firm conclusions on
the impact of planning regulation on growth. As a result, we recommend further
research to be undertaken in this area that is based on a more holistic approach.
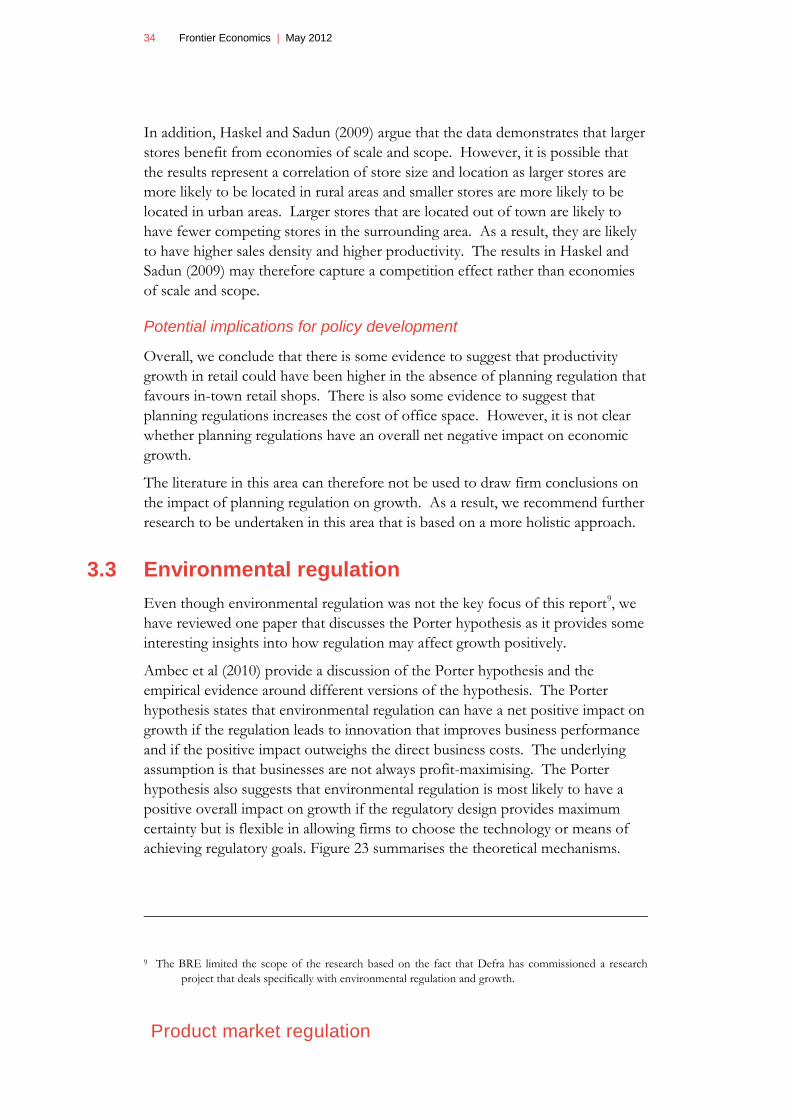
3.3 Environmental regulation
Even though environmental regulation was not the key focus of this report9, we
have reviewed one paper that discusses the Porter hypothesis as it provides some
interesting insights into how regulation may affect growth positively.
Ambec et al (2010) provide a discussion of the Porter hypothesis and the
empirical evidence around different versions of the hypothesis. The Porter
hypothesis states that environmental regulation can have a net positive impact on
growth if the regulation leads to innovation that improves business performance
and if the positive impact outweighs the direct business costs. The underlying
assumption is that businesses are not always profit-maximising. The Porter
hypothesis also suggests that environmental regulation is most likely to have a
positive overall impact on growth if the regulatory design provides maximum
certainty but is flexible in allowing firms to choose the technology or means of
achieving regulatory goals. Figure 23 summarises the theoretical mechanisms.
9 The BRE limited the scope of the research based on the fact that Defra has commissioned a research
project that deals specifically with environmental regulation and growth.

May 2012 | Frontier Economics 35
Product market regulation
Figure 23. Theoretical mechanisms based on Ambec et al (2010)
Source: Frontier Economics
Ambec et al (2010) does not provide original empirical research but reviews
empirical evidence on three hypotheses:
Hypothesis 1: There is a link between environmental regulation and
innovation;
Hypothesis 2: Environmental regulation improves business performance;
and
Hypothesis 3: Environmental regulation can enhance a country’s
competitiveness.
On hypothesis 1, a range of studies find a positive link between environmental
regulation and innovation but with varying degrees. Hypothesis two is not
supported by a number of papers that find a negative impact of environmental
regulation on productivity. However, more recent studies suggest that there are
some positive indirect impacts of environmental regulations as innovation
improves business performance. These positive impacts are not of sufficient size
to offset the direct negative impact of regulation. There is no strong evidence
that supports hypothesis 3 as the literature often considers the opposite impact.
Countries with stricter environmental regulation will induce firms to move to
countries with lower levels of environmental regulation.

36 Frontier Economics | May 2012
Product market regulation
Regulation creating new markets
Our literature review has generally indicated that the creation of new markets is
not a “standard” theoretical mechanism by which regulation may have an impact
on growth. However, according to the Porter Hypothesis, environmental
regulation may also lead to innovation that creates new markets, even though this
again depends strongly on the specific context. Overall, the literature suggests
that regulation has strong impact on the incentives to innovate but the specific
nature of the innovation depends on the sectors considered.
Alternatives to regulation
The impact of alternatives to regulation is not discussed in the literature that we
reviewed. The Porter hypothesis captures the importance of regulatory design
and suggests that regulation that allows firms to choose how to meet regulatory
outcomes is more likely to have a positive impact on innovation. Ambec (2010)
also discusses the potential for other government interventions such as training
to lower compliance costs and enhance the business performance. However, in
this context it is not viewed as an alternative but rather as a complement to
regulation.

May 2012 | Frontier Economics 37
Labour market regulation
4 Labour market regulation
Main findings
Most of the literature that investigates the link between labour market regulations
and growth focuses on employment protection legislation. The theoretical
mechanism between employment protection legislation and growth suggest that
there is both a positive and a negative impact:
EPL has a positive impact on investment in skills;
EPL has a negative impact as it creates high adjustment costs which can
constrain adaptation of new technologies such as information and
communication technologies.
Overall, the empirical evidence provides mixed results and it is not clear which
effect dominates. While this implies that there are no overall implications for
policy development in the UK can be derived, it is nevertheless important to
ensure that both theoretical mechanisms are considered when introducing new
types of regulation.
Theoretical mechanisms and empirical evidence
Our main findings are based on the review of four key papers. The first two
papers discussed in this section deal with the impact of employment regulation
on innovation. While they find that higher EPL can have both positive and
negative impacts on innovation, it is likely that the impact on overall productivity
growth is negative. The third paper discussed in this section finds a negative
relationship between higher EPL and investment. In contrast, the last paper
discussed in this section finds that the impact of lower EPL on skill investment
and subsequent total factor productivity is negative.
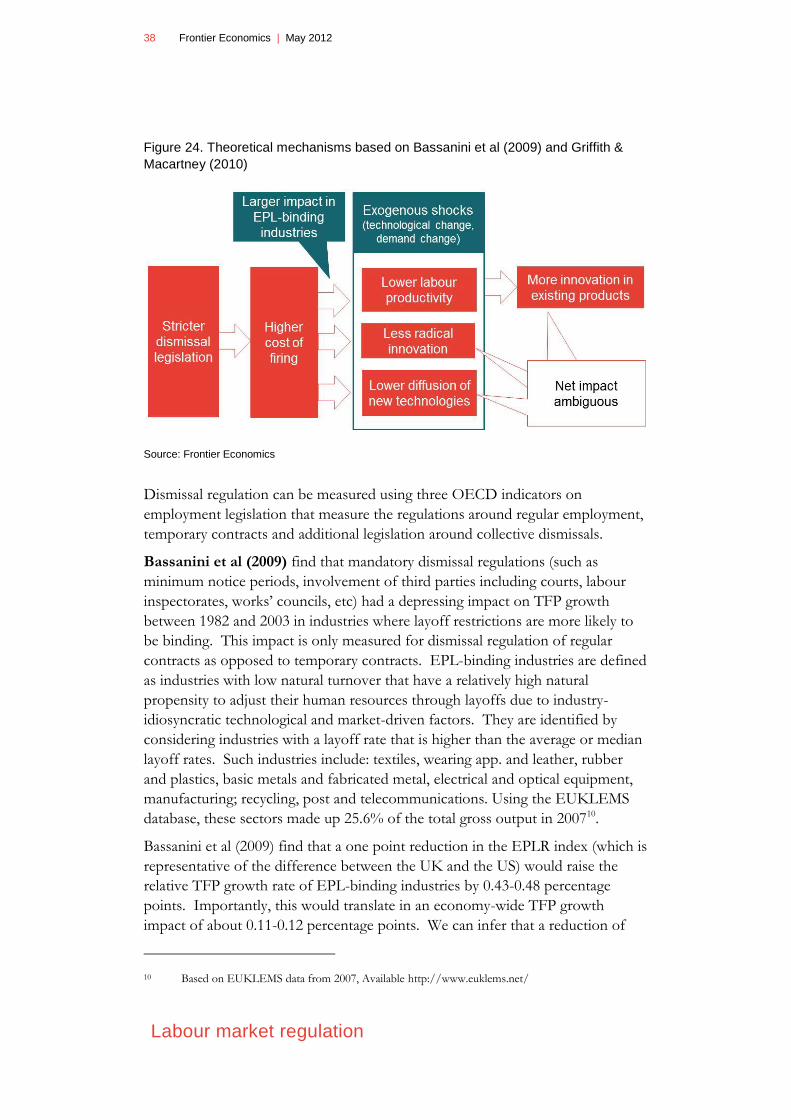
Bassanini et al (2009) and Griffith & Macartney (2010) examine the impact
of employment protection legislation on total factor productivity. Stricter
dismissal legislation will increase the cost of firing. This increases adjustment
costs so that firms are less likely to adjust to exogenous changes (such as
technological change or a change in demand) by adjusting their labour force. As
a result, labour productivity may be lower. Firms are also less likely to invest in
new technologies when these require significant adjustments in the labour force.
The same applies to radical innovation as this is more likely to involve higher
adjustment costs. However, firms have an increased incentive to invest in
incremental innovation that improves existing products as such innovation does
not require a change in the labour force. Overall the theoretical link between
stricter dismissal laws and total factor productivity demonstrate that there are
positive and negative impacts and it is not clear which impact dominates. The
theoretical mechanisms are summarised in Figure 24.
38 Frontier Economics | May 2012
Labour market regulation
Figure 24. Theoretical mechanisms based on Bassanini et al (2009) and Griffith &
Macartney (2010)
Source: Frontier Economics
Dismissal regulation can be measured using three OECD indicators on
employment legislation that measure the regulations around regular employment,
temporary contracts and additional legislation around collective dismissals.
Bassanini et al (2009) find that mandatory dismissal regulations (such as
minimum notice periods, involvement of third parties including courts, labour
inspectorates, works’ councils, etc) had a depressing impact on TFP growth
between 1982 and 2003 in industries where layoff restrictions are more likely to
be binding. This impact is only measured for dismissal regulation of regular
contracts as opposed to temporary contracts. EPL-binding industries are defined
as industries with low natural turnover that have a relatively high natural
propensity to adjust their human resources through layoffs due to industry-
idiosyncratic technological and market-driven factors. They are identified by
considering industries with a layoff rate that is higher than the average or median
layoff rates. Such industries include: textiles, wearing app. and leather, rubber
and plastics, basic metals and fabricated metal, electrical and optical equipment,
manufacturing; recycling, post and telecommunications. Using the EUKLEMS
database, these sectors made up 25.6% of the total gross output in 200710.
Bassanini et al (2009) find that a one point reduction in the EPLR index (which is
representative of the difference between the UK and the US) would raise the
relative TFP growth rate of EPL-binding industries by 0.43-0.48 percentage
points. Importantly, this would translate in an economy-wide TFP growth
impact of about 0.11-0.12 percentage points. We can infer that a reduction of
10 Based on EUKLEMS data from 2007, Available http://www.euklems.net/
May 2012 | Frontier Economics 39
Labour market regulation
EPL from UK to US levels would increase GDP growth by approximately 0.11
percentage points. The results can be compared against recent (real) GDP
growth of 1.3% in 201011.
Griffith and Macartney (2010) examine the impact of EPL on innovation.
They use within-firm data for multinationals to assess whether firms choose to
undertake incremental innovation versus radical innovation. Innovation activity
is measured by the number of patents with radical innovation defined by the
proportion of citations on a patent application made to scientific journals. EPL
is measured using the OECD indicators. Radical innovation is likely to be more
profitable but also requires higher adjustment costs whereas incremental
innovation requires lower adjustment costs but is likely to have a smaller impact
on overall profitability. Griffith and Macartney (2010) find that within
multinational firms more innovation is undertaken by subsidiaries in countries
with high EPL. They also find that the more technologically advanced
innovation is performed by subsidiaries in countries with a low level of EPL.
The research suggests that if Italy and Germany moved from an above-average
EPL level to the OECD average, this would result in a fall in overall patents by
20%. If Denmark moved from its below-average EPL level to the average EPL
level, overall patenting would increase by 37% but radical innovation would
reduce by 6%. The overall impact on EPL on growth can therefore be
disaggregated into a positive and a negative effect. It follows that EPL have both
a positive and negative effect on innovation and subsequently growth. The
literature is unable to distinguish the relative impact of the different types of
innovation on growth.
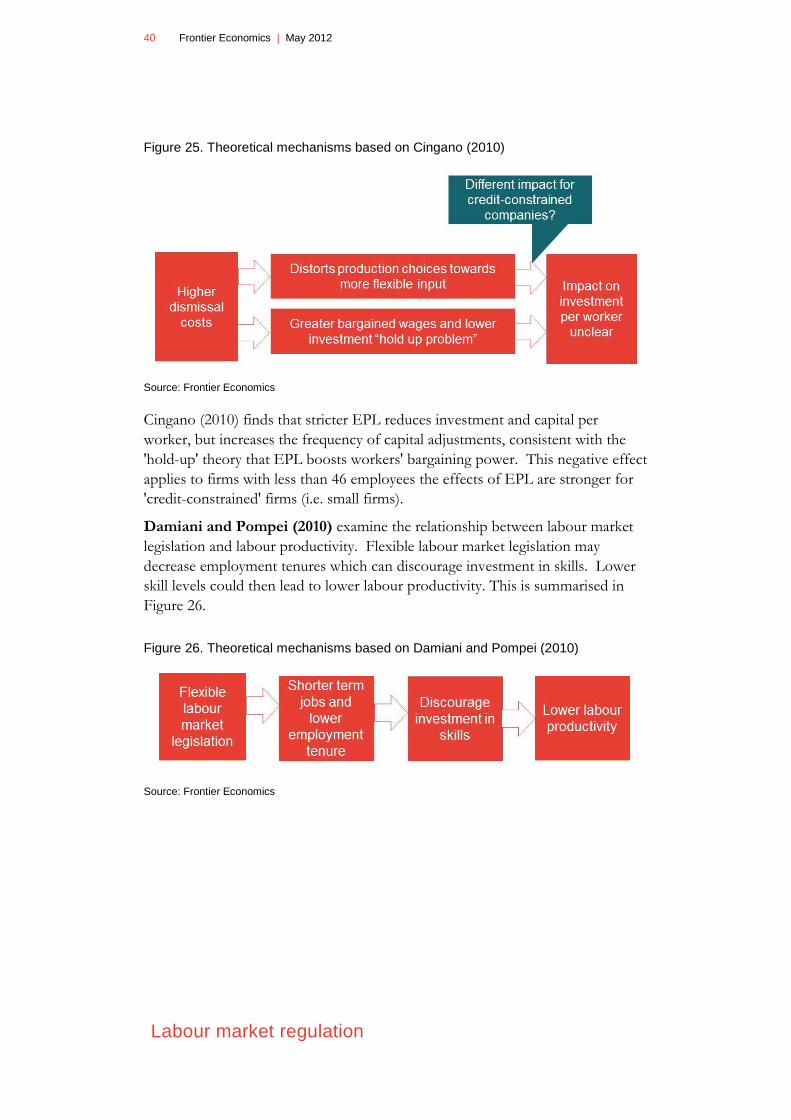
Cingano (2010) examines the impact of higher dismissal costs on the investment
per worker. On the one hand, higher dismissal costs can distort production
choices towards the more flexible input (i.e. capital) as they raise the costs of
adjusting the labour force. This would suggest that capital per worker is higher
with stricter dismissal laws. On the other hand, EPL may give workers more
bargaining power which creates a “hold up” problem. The “hold up” problem
occurs when a firms’ investment would increase productivity but also increases
workers’ bargaining power. Workers bargaining power can reduce the returns to
investments as strict EPL allows workers to bargain for a higher share of the
investment return. This would suggest that capital per worker is lower with
stricter dismissal laws. Cingano considers whether the impact of higher dismissal
laws on investment per workers is different for credit-constrained companies.
Cingano defines credit-constrained companies as companies with a small number
of employees in this paper.
11 Based on Office of National Statistics, (2011), Quarterly National Accounts 4th quarter 2010
40 Frontier Economics | May 2012
Labour market regulation
Figure 25. Theoretical mechanisms based on Cingano (2010)
Source: Frontier Economics
Cingano (2010) finds that stricter EPL reduces investment and capital per
worker, but increases the frequency of capital adjustments, consistent with the
'hold-up' theory that EPL boosts workers' bargaining power. This negative effect
applies to firms with less than 46 employees the effects of EPL are stronger for
'credit-constrained' firms (i.e. small firms).
Damiani and Pompei (2010) examine the relationship between labour market
legislation and labour productivity. Flexible labour market legislation may
decrease employment tenures which can discourage investment in skills. Lower
skill levels could then lead to lower labour productivity. This is summarised in
Figure 26.
Figure 26. Theoretical mechanisms based on Damiani and Pompei (2010)
Source: Frontier Economics
May 2012 | Frontier Economics 41
Labour market regulation
The empirical evidence suggests that “it seems likely that shorter term jobs and lower
employment tenures discourage investments in skills, while labour regulation, which sustain long
term relationships, may present some advantages and would seem to be preferable to short-term
arrangements in collaborative relations and bargaining governability” (Damiani and Pompei
2010). Growth in the proportion of fixed term contract by 1% appears to reduce
multi-factor productivity12 by up to 0.017 percentage points which directly
corresponds to GDP on a growth accounting basis. While the results are based
on a sample that includes 15 European countries, they can be compared to recent
(real) GDP growth in the UK of 1.3% in 2010. There is no significant impact of
the proportion of part-time contracts on multi-factor productivity.
Limitations of the results
The literature on the impact of labour market regulations on growth has a
number of limitations:
As the theoretical mechanism linking EPL and productivity and growth
suggest both positive and negative impacts, the empirical results have to be
interpreted with caution (i.e. statistical correlation should not be interpreted
as causality).
The impact of EPL cannot be measured in isolation as EPL may interact
with other types of regulation. For example, Damiani and Pompei (2010)
highlight the following limitation: The four better performers of the sample [in terms
of multi-factor productivity] (Ireland, UK, Finland and Sweden) all belong to different
varieties of capitalism and have neither the same market-reliant arrangements nor the same
sectoral fields of specialisation. This highlights that complementarities in labour, financial
and product market regulation should be taken into account.
Use of indices that translate legislation into quantitative measures can create
problems as they are ordinal instead of cardinal and do not capture
enforcement of regulations or unintended consequences.
Potential implications for policy development
The literature focuses on employment protection legislation and finds that such
regulations can have both a positive and a negative impact on growth. While each
of the theoretical mechanisms provides a valid link between employment
protection and growth it is therefore difficult to derive high level implications for
UK policy development. In addition, it is important to consider the relative
position of the UK with respect to employment protection in the OECD as
shown in Figure 27.
12 Multi factor productivity and total factor productivity can be used interchangeably.
42 Frontier Economics | May 2012
Labour market regulation
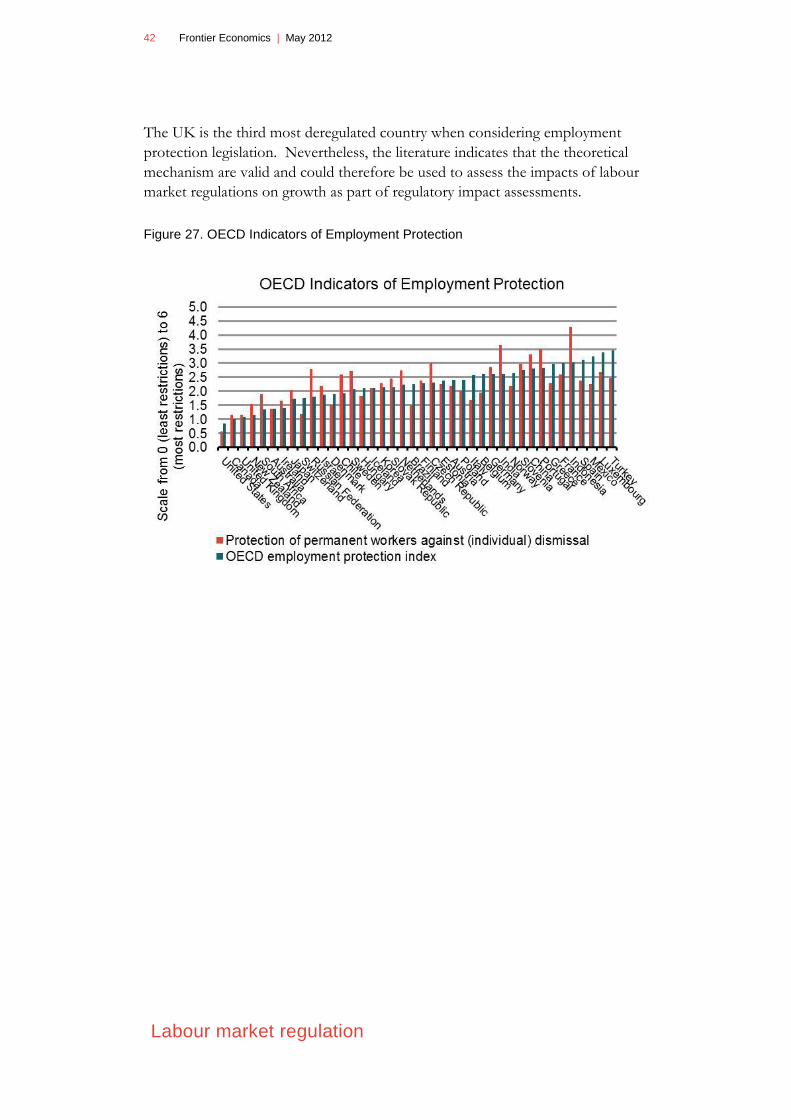
The UK is the third most deregulated country when considering employment
protection legislation. Nevertheless, the literature indicates that the theoretical
mechanism are valid and could therefore be used to assess the impacts of labour
market regulations on growth as part of regulatory impact assessments.
Figure 27. OECD Indicators of Employment Protection
May 2012 | Frontier Economics 43
Conclusion
5 Conclusion
Main findings
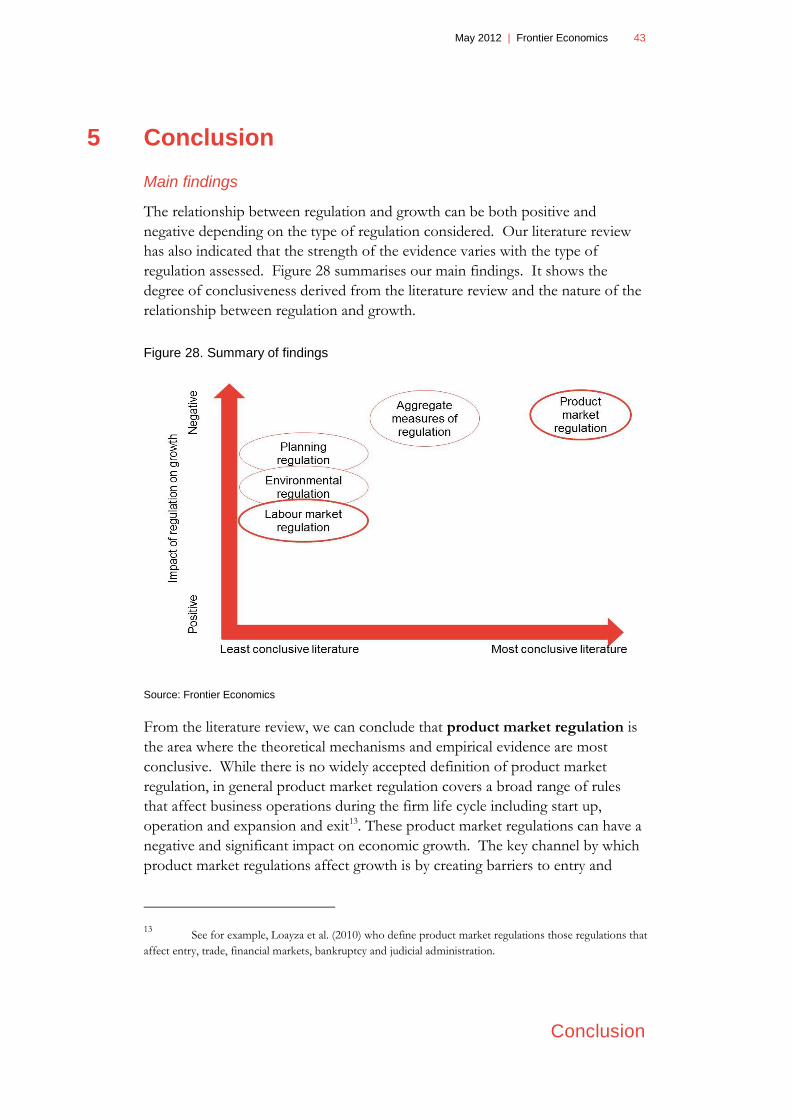
The relationship between regulation and growth can be both positive and
negative depending on the type of regulation considered. Our literature review
has also indicated that the strength of the evidence varies with the type of
regulation assessed. Figure 28 summarises our main findings. It shows the
degree of conclusiveness derived from the literature review and the nature of the
relationship between regulation and growth.
Figure 28. Summary of findings
Source: Frontier Economics
From the literature review, we can conclude that product market regulation is
the area where the theoretical mechanisms and empirical evidence are most
conclusive. While there is no widely accepted definition of product market
regulation, in general product market regulation covers a broad range of rules
that affect business operations during the firm life cycle including start up,
operation and expansion and exit13. These product market regulations can have a
negative and significant impact on economic growth. The key channel by which
product market regulations affect growth is by creating barriers to entry and
13 See for example, Loayza et al. (2010) who define product market regulations those regulations that
affect entry, trade, financial markets, bankruptcy and judicial administration.
44 Frontier Economics | May 2012
Conclusion
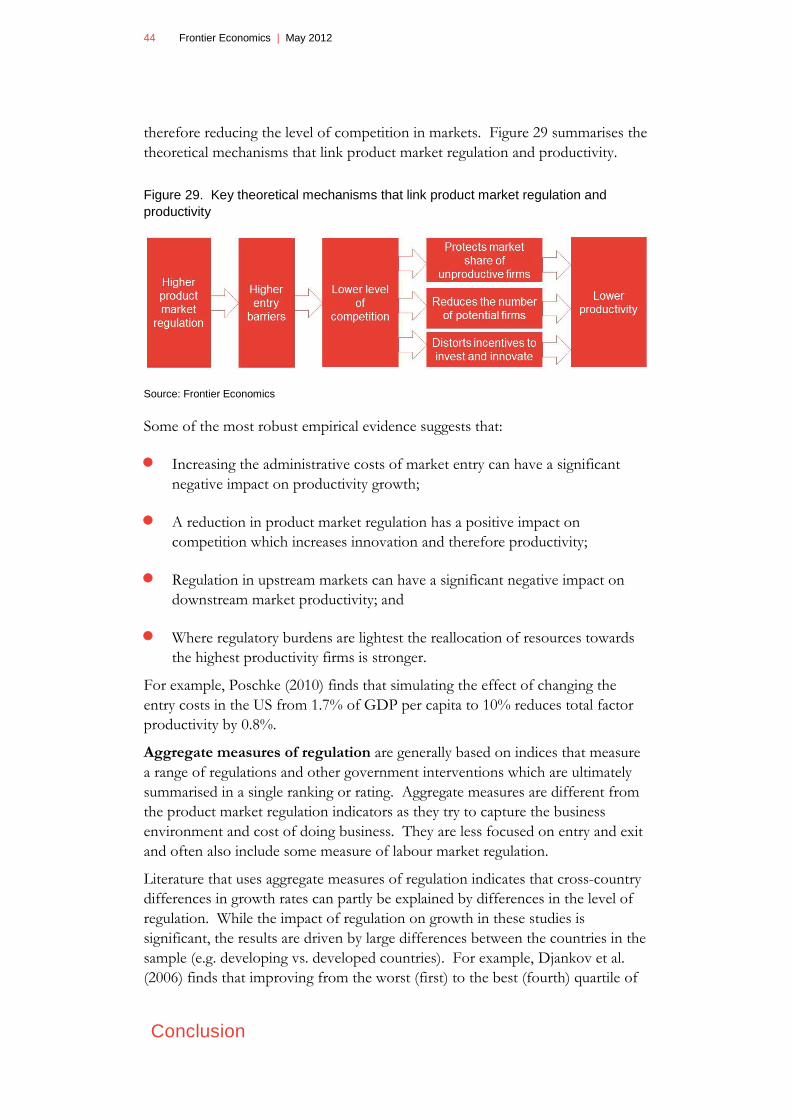
therefore reducing the level of competition in markets. Figure 29 summarises the
theoretical mechanisms that link product market regulation and productivity.
Figure 29. Key theoretical mechanisms that link product market regulation and
productivity
Source: Frontier Economics
Some of the most robust empirical evidence suggests that:
Increasing the administrative costs of market entry can have a significant
negative impact on productivity growth;
A reduction in product market regulation has a positive impact on
competition which increases innovation and therefore productivity;
Regulation in upstream markets can have a significant negative impact on
downstream market productivity; and
Where regulatory burdens are lightest the reallocation of resources towards
the highest productivity firms is stronger.
For example, Poschke (2010) finds that simulating the effect of changing the
entry costs in the US from 1.7% of GDP per capita to 10% reduces total factor
productivity by 0.8%.
Aggregate measures of regulation are generally based on indices that measure
a range of regulations and other government interventions which are ultimately
summarised in a single ranking or rating. Aggregate measures are different from
the product market regulation indicators as they try to capture the business
environment and cost of doing business. They are less focused on entry and exit
and often also include some measure of labour market regulation.
Literature that uses aggregate measures of regulation indicates that cross-country
differences in growth rates can partly be explained by differences in the level of
regulation. While the impact of regulation on growth in these studies is
significant, the results are driven by large differences between the countries in the
sample (e.g. developing vs. developed countries). For example, Djankov et al.
(2006) finds that improving from the worst (first) to the best (fourth) quartile of

May 2012 | Frontier Economics 45
Conclusion
business regulations (as measured by the World Bank Doing Business indicators)
implies a 2.3 percentage point increase in average annual growth. Some of the
research also finds a non-linear relationship between regulation and growth. This
implies that the benefits to reducing the level of regulation are larger for highly
regulated countries and diminishing with lower levels of regulation. As the UK is
among the top ten deregulated countries (as measured by the World Bank Doing
Business indicators and the Fraser Institute of Economic Freedom Index) the
main findings of these studies do not apply to the UK.
The impact of UK planning regulations on growth has not been studied widely
as the available literature focuses on the impact of planning regulations on
specific sectors. The literature indicates that planning regulation can change the
relative price of factor inputs (e.g. land, office space, etc.) and therefore have a
negative impact on productivity in specific sectors. For example, Haskel and
Sadun (2009) find that retail sector productivity growth would have been 0.44%
per annum rather than the actual 0.07% per annum (between 1997/98 and
2002/03). Using EUKLEMS data, we can infer that productivity growth in the
UK would have been 0.16 percentage points higher per annum in the absence of
changes in supermarket store sizes. On a growth accounting basis, TFP growth
can be directly compared with average annual GDP growth of 3.6% between
1997/98 and 2002/0314. However, none of the studies on planning regulation
use a holistic approach that includes all relevant sectors of the economy.
Environmental regulation may have a net positive impact on growth if positive
effects on firm innovation offset the compliance costs. However, the empirical
evidence appears to be mixed and the outcome depends on the regulatory design
and type of regulation.
In addition to product market regulation, labour market regulation is the other
important area that has an influence on growth. However, it is not clear whether
labour market regulation has a net positive or negative impact on growth. Most
of this literature focuses on the impact of employment protection legislation
(EPL) on growth. The key theoretical channels are:
Positive link: EPL increases employee’s job tenure and therefore encourages
investment in skills (both by the employer and employee) and which has a
positive impact on labour productivity and growth. EPL also increases the
incentives to invest in incremental innovation that improves existing
products.
14 Gross Domestic Product: chained volume measures: Seasonally adjusted based on Office of
National Statistics, Second estimate of GDP time series dataset 2011 Q4, Available
http://www.ons.gov.uk/ons/rel/naa2/second-estimate-of-gdp/q4-2011/tsd-second-estimate-of-gdp-2011-
q4.html
46 Frontier Economics | May 2012
Conclusion
Negative link: EPL increases the cost of adjusting the labour force in the case
of technological change. This makes it harder for firms to adopt new
technologies or respond to changes in demand and can therefore reduce
labour productivity and investment in new technologies that require
adjustments to the labour force. EPL can also reduce the amount of radical
innovation that firms engage in while increasing the amount of incremental
innovation as radical innovation requires an adjustment of the workforce.
This has a negative impact on growth as radical innovation is likely to have
higher pay-offs.
Figure 30 summarises the key theoretical channels.
Figure 30. Key theoretical mechanisms that link labour market regulation and
productivity
Source: Frontier Economics
The empirical evidence suggests that the theoretical links are valid (both those
indicating a positive and a negative relationship) even though the impact of EPL
may only have a strong effect in a small number of sectors where EPL is more
binding due to low natural turnover.
The majority of the literature does not consider small and medium enterprises
(SMEs) separately from other business. However, the following three findings
apply to SMEs in particular:
Regulation that increases the administrative costs of market entry can have a
particularly strong impact on market entry of small firms as these firms are
likely to be more credit constrained.

May 2012 | Frontier Economics 47
Conclusion
The Porter Hypothesis states that environmental regulation can have a net
positive impact on growth if the regulation leads to innovation that improves
business performance and if the positive impact outweighs the direct
business costs. Ambec et al (2010) argue that this may apply particularly to
SMEs as they may be less likely to be profit-maximising due to, for example,
a lack of time and technical expertise.
Employment Protection legislation may have a stronger impact on SMEs as
they are less able to substitute capital for labour due to credit constraints.
Implications for policy development
In general, the UK is a highly deregulated economy when compared to other
OECD countries. Against this background, the literature nevertheless indicates
that further reduction of product market regulation is likely to have a positive
impact on growth. It is more difficult to be certain about labour market
regulations. From a policy perspective we would argue that employment
protection legislation in particular, are carefully assessed in terms of costs and
benefits before considering deregulation. In the context of new employment
production regulation, it is important that regulatory impact assessments clearly
set the balance between the potential negative and positive growth effects. The
theoretical mechanisms described in this report could be used to undertake such
an assessment.
Based on our main findings, Figure 31 provides an overview of the key
implications for policy development in the UK in each of the areas of regulation.
Figure 31. Overview of key implications of findings
48 Frontier Economics | May 2012
Annexe 1: Methodology
Annexe 1: Methodology
Our approach
Our search focused on articles that deal with the relationship between regulation
and growth. We searched for articles covering a range of theoretical approaches,
including those that deal with the impact of regulation on other factors that can
be related to growth via standard growth models (such as productivity,
innovation, investment in physical and human capital).
We focused on articles that deal with the impact of regulation on growth in the
developed world (e.g. OECD countries). While we included articles that use
large multi-country datasets, we excluded articles that are solely focused on
developing countries. We also excluded any articles that date pre-2000 and
articles that focus on historic (e.g. pre-1970s) datasets. Our analysis mainly covers
studies published in English, though we also searched for relevant articles
published in German or French. Search terms included various combinations of
the following:
Regulation
Regulation, product market regulation, labour market regulation
Business regulation, environmental regulation, planning regulation
Compliance costs, trading standards
Alternatives to regulation, regulation and new markets
Growth
Growth
Productivity
Innovation
Human capital
Investment, FDI
Our long list of literature was developed on the basis of the following steps:
List of suggested articles from Professor Nicholas Crafts;
Searches of academic databases including EconLit;
Checking literature referred to in key articles (so-called snowballing);

May 2012 | Frontier Economics 49
Annexe 1: Methodology
Targeted search of respected organisations including OECD, World
Bank; and
Review of a range of sources for articles including SSRN, IBSS, EU,
IMF, UN, Government websites and relevant think tanks (CBI, TUC,
Chambers of Commerce, IPPR, Reform, Policy Exchange).
Selection criteria for long list
We have applied the following criteria to select articles for the long list:
Theoretical approach – Our search focused on articles that deal with the
relationship between regulation and growth and we are including articles
with a range of theoretical approaches. We also include articles that deal with
the impact of regulation on other factors (such as productivity, innovation,
investment) that can be related to growth via standard growth models.
Type of regulation
We include articles that deal with overall measures of regulation as well
as articles that deal with specific areas of regulation (e.g. labour market,
product market, health and safety).
We are not focusing on articles that deal with financial regulation,
regulated network utilities and regulation around agriculture.
Relevance to the UK/EU – we focus on articles that deal with the impact
of regulation on growth in the developed world (e.g. OECD countries).
While we include articles that are use large multi-country datasets, we
exclude articles that are solely focused on developing countries.
Quality – articles need to be produced by respected individuals such as
academics and experts in universities, research organisation and
consultancies
Date – we exclude any articles that date pre-2000 and articles that focus on
historic (e.g. pre-1970s) datasets.
Language – we exclude articles that are not published in English.

50 Frontier Economics | May 2012
Annexe 1: Methodology
Selection criteria for short list
We applied the following criteria to select articles for the short list:
Theoretical approach – the short list represents all major theoretical
approaches.
Type of regulation - the short list covers different measures of regulation
ranging from high level indices to specific measures.
Empirical studies – the short list contains a large proportion of articles
with empirical analysis.
Relevance to EU/UK – articles are relevant to developed economies, in
particular Europe and the UK. Our emphasis is on evidence from the UK
or EU, though many research studies are based on US data.
Date – we prioritise the most up to date list of relevant literature.
Review by Professor Nicholas Crafts – the short list has been reviewed by
Professor Nicholas Crafts to ensure that we capture the most important
academic articles.
Microbusinesses and SMEs – we have sought evidence on the impact of
regulation on growth in the context of microbusinesses and SMEs.
Overview of relevant literature
We compiled a comprehensive list of 94 articles with 36 “first-tier” articles
selected for further detailed review (see Table 2). We selected articles produced
by respected individuals such as academics and experts in universities, research
organisation and consultancies.
In addition, we also identified potentially relevant research published by
interested parties, including the British Chambers of Commerce (BCC),
Confederation of British Industries (CBI) and Trades Union Congress (TUC).
These articles provided useful context and helped identify issues relevant to
businesses that have not come up in our search of the academic literature.

May 2012 | Frontier Economics 51
Annexe 1: Methodology
Table 2. Types of publications included in the literature review
Examples Long list Short list
Academic
publications
Economic Journal, European
Economic Review 51 19
Academic working
papers
CEPR, IZA Discussion
Series 11 7
International
Institutes
OECD, World Bank, EC,
Bank of France 23 10
Think-tanks IPPR, Policy Exchange,
SBRC 4 0
Trade
organisations
British Chambers of
Commerce, TUC 5 0
TOTAL 94 36
Source: Frontier Economics

May 2012 | Frontier Economics 53
Annexe 2: List of literature reviewed
Annexe 2: List of literature reviewed
Alesina, A., Ardagna, S., Nicoletti, G. and Schiantarelli, F., (2005), Regulation and
Investment Journal of the European Economic Association, Vol 3, pp 791-825
Ambec, S., Cohen, M., Elgie, S. and Lamoie, P., (2010), The Porter Hypothesis at
20: Can Environmental Regulation Enhance Innovation and Competitiveness?
CIRANO Serie Scientifique No 29
Arnold, J., Nicoletti, G. and Scarpetta, S., (2011a), Regulation, Resource
Reallocation and Productivity Growth, Nordic Economic Policy Review Vol 2,
pp 61-97
Arnold, J., Nicoletti, G. and Scarpetta, S., (2011b), Does Anti-Competitive
Regulation Matter for Productivity? Evidence from European Firms, IZA
Discussion Paper No 5511
Barone, G. and Cingano, F., (2011) Service Regulation and Growth: Evidence
from OECD Countries, Economic Journal Vol 121, Issue 555, pp 913-957
Bassanini, A., Nunziata, L. and Venn, D., (2009) Job Protection Legislation and
Productivity Growth in OECD Countries Economic Policy Vol 24, pp 349-402
Brandt, N., (2004), Business Dynamics, Regulation and Performance OECD
working paper No 2004/3
Bourlès, R., Cette, G., Lopez, J., Mairesse, J., Nicoletti, G., (2009), Do product
market regulations in upstream sectors curb productivity growth? Panel data
evidence for OECD countries, Banque de France working paper No 283
Busse, M. and Groizard, J.L. (2008) Foreign Direct Investment, Regulations and
Growth, World Economy, Vol 31 Iss 7 pp 861-886
Cheshire, P. and Hilber, C., (2008), Office Space Supply Restrictions in Britain:
the Political Economy of Market Revenge Economic Journal Vol 118, pp F185-
F221
Chittenden, F., Kauser, S., Poutziouris, P., Sloan, B., (2005), Regulations and
Small Business in the EU, USA and UK: A Review, Wirtschaftspolitische Blatter
Vol 52, Iss 2, pp 230-244
Cincera, M., Galgau, O., (2005), Impact of Market Entry and Exit on EU
Productivity and Growth Performance, European Commission, Directorate-
General for Economic and Financial Affairs, Economic Paper No 222 ISSN
1725-3187
Cingano, F., Leonardi, M., Messina, J. and Pica, G., (2010), The Effects of
Employment Protection Legislation and Financial Market Imperfections on
Investment: Evidence from a Firm-Level Panel of EU Countries, Economic
Policy Vol 25, pp 117-163

54 Frontier Economics | May 2012
Annexe 2: List of literature reviewed
Conway, P., de Rosa, D., Nicoletti, G. and Steiner, F., (2006), Regulation,
Competition and Productivity Convergence, OECD Economics Department
Working Paper No 509
Conway, P. and Nicoletti, G., (2006), Product market regulation in the non-
manufacturing sectors of the OECD countries: measurement and highlights,
OECD Working Paper No. 530
Crafts, N., (2006), Regulation and Productivity Performance, Oxford Review of
Economic Policy Vol 22, No 2
Golec, J., Hegde, S. and Vernon, J., (2010), Pharmaceutical R & D Spending and
the Threat of Price Regulation, Journal of Financial and Quantitative Analysis
Vol 45, pp 239-264
Damiani, M., Pompei, F., (2010), Labour protection and productivity in EU
economies: 1995-2005, European Journal of Comparative Economics, Vol. 7, n.
2, pp. 373-411
Dar, A., Amir Khalkhali, S., (2011), On the Impact of Regulation on Economic
Growth in OECD Countries, 2011 Barcelona European Academic Conference
Djankov, S., McLeish, C., Ramalho, R., (2006), Regulation and Growth, World
Bank Working Paper
Fang, L. and Rogerson, R., (2011), Product Market Regulation and Market Work,
American Economic Journal: Macroeconomics, v. 3, iss. 2, pp. 163-88
Gorgens, T., Paldam, M., Wurtz, A., (2003), How does Public Regulation affect
Growth? University of Aarhus Department of Economics Working Paper,
Working Paper No 2003-14
Gorgens, T., Paldan, M. Wurtz, A., (2005), Growth, Income and Regulation: a
Non-Linear Approach
Griffith, R. and Harrison, R.2004The Link between Product Market Regulation
and Macroeconomic PerformanceEuropean Commission Economic PapersNo
209
Griffith, R. and Macartney, G., (2010) Employment Protection Legislation,
Multinational Firms and Innovation, CEPR Discussion Paper No 7628
Griffith, R., Harrison, R. and Simpson, H., (2010), Product Market Reform and
Innovation in the EU, Scandinavian Journal of Economics Vol 112, pp 389-415
Hansford, A., Hasseldine, J., Howorth, C., (2003), Factors Affecting the Costs of
UK VAT Compliance for Small and Medium-Sized Enterprises, Environment
and Planning C: Government and Policy, Vol 21 iss 4 pp 479-492
Haskel, J. and Sadun, R., (2009), Regulation and UK Retailing Productivity:
Evidence from Micro-Data, CEPR Discussion Paper No 7140

May 2012 | Frontier Economics 55
Annexe 2: List of literature reviewed
Jacobzone, S., Steiner, F., Lopez Ponton, E., Job, E., (2010), Assessing the
Impact of Regulatory Management Systems, OECD Working Paper on Public
Governance No 17
Klapper, L., Laeven, L. and Rajan, R., (2006), Entry Regulation as a Barrier to
Entrepreneurship Journal of Financial Economics Vol 82, pp 591-629
Loayza, N. V., Oviedo, A. M., and Serven, L., (2010), Regulation and
Macroeconomic Performance, Business Regulation and Economic Performance,
pp 65-117
Nicodeme, G., Sauner-Leroy, J., (2004), Product market reforms and
productivity: a review of the theoretical and empirical literature on transmission
channels, European Commission, Directorate-General for Economic and
Financial Affairs, European Economy, Economic Papers No. 218
Nicoletti, G. and Scarpetta, S., (2003), Regulation, Productivity and Growth
Economic Policy Vol 18, pp 9-72
Poschke, M., (2010), The Regulation of Entry and Aggregate Productivity
Economic Journal Vol 120, pp 1175-1200
Scarpetta, S., Tressel, T., (2002), Productivity and Convergence in a Panel of
OECD Industries: Do Regulations and Institutions Matter? OECD Economic
Working Paper No. 342
Schiantarelli, F., (2010), Product Market Regulation and Macroeconomic
Performance Business Regulation and Economic Performance, pp 23-63


May 2012 | Frontier Economics 57
Annexe 3: Detailed overview of selected
empirical evidence
Annexe 3: Detailed overview of selected
empirical evidence
This Annexe provides more detail on the empirical approach used in the main
articles referred to in Sections 2, 3 and 4.
Article
Arnold, J., Nicoletti, G., Scarpetta, S., (2011), "Regulation,
Resource Reallocation and Productivity Growth", Nordic Economic
Policy Review, Volume 2, pp 61-97
Data
Dependent variable: The Olley-Pakes indicator reflects the relative
contribution of allocative efficiency to the observed overall average
productivity level.
Firm-level data from Amadeus database. TFP is measured as a
residual, the part of output not explained by factor inputs. The
authors then decompose TFP into unweighted average of firm-level
TFP (productive efficiency) and a term capturing the degree to
which more productive firms have higher market shares (allocative
efficiency), following Olley and Pakes (1996).
Key explanatory variable: Regulation Impact indicator from OECD
International Regulation Database, to capture intersectoral impacts
on downstream industries.
Sample period: 1998-2004
Coverage: Austria, Belgium, Finland, France, Germany, Italy,
Portugal, Spain, Sweden, United Kingdom
Experimental set-up
Fixed-effect specification with time-varying country-specific and
sector-specific effects
Regress allocative efficiency indicator on sector-specific indicators
of regulatory impact (and country- and sector- fixed effects)
Hypothesis Anticompetitive regulations reduce the efficiency of the reallocation
process within industries
Robustness
Coefficients for regulation impact indicators are all significant at 5%
or 1%:
-0.33 for overall business sector (significant at 1%)
-0.37 for services sector (significant at 5%)
-0.30 for ICT using sectos (significant at 5%)

58 Frontier Economics | May 2012
Annexe 3: Detailed overview of selected
empirical evidence
Key findings
Regulatory burdens have a negative effect on the efficiency of
resource allocation in the overall business sector. This relationship
is driven by the services sector, and is stronger for sectors that rely
on ICT.
Limitations
The study provides evidence of a negative correlation between
anticompetitive regulation and allocative efficiency within industries,
but may reflect reverse causality.

May 2012 | Frontier Economics 59
Annexe 3: Detailed overview of selected
empirical evidence
Article
Bassanini, A., Nunziata, L. and Venn, D., (2009) Job Protection
Legislation and Productivity Growth in OECD Countries Economic
Policy Vol 24, pp 349-402
Data
Quantified degree of stringency of EPL(as defined by legislative
requirements) by using three OECD indicators: 1. Index for regular
employment 2. Index for temporary contracts 3. Index on additional
legislation. Indices range from 0 to 6, i.e. from least to most
restrictive.
EUKLEMS database with TFP growth for 16 OECD countries over
25 years (both a public and non-public version) as well as data on
value added, industry specific purchasing power parities, capital
service growth, employment, hours worked and labour composition
by skills, age and gender.
US layoff rates from 2004 CPS Displaced Workers Supplement to
identify baseline measures of industry layoff propensity: 1.
quantitative indicator equal to average industry layoff rate, 2.
qualitative indicator EPL-binding defined as those with a layoff rate
above the average for all industries over the three years. UK data
used as a sensitivity test (Quarterly labour force survey 1997-2003)
Experimental set-up
Industry level cross-country time-series evidence on the impact of
EPL on productivity, using difference-in-difference method
Hypothesis
Estimate the impact of the degree of stringency of individual dismissal regulations (EPLR) on cross-industry differences in ‘fully adjusted’ TFP as theory suggests that the net effect could be positive or negative.
Robustness Large number of robustness checks taking into account a range of potential issues
Key findings
A one point reduction in the EPLR index (which is representative of the difference between the UK and the US) would raise the relative TFP growth rate of EPL-binding industries by 0.43-0.48 percentage points.
Limitations Dataset based on translating legislation into quantified variables

60 Frontier Economics | May 2012
Annexe 3: Detailed overview of selected
empirical evidence
Article
Bourles, R., Cette, G., Lopez, J., Mairesse, J., Nicoletti, G., (2010),
"Do product market regulations in upstream sectors curb
productivity growth? Panel data evidence for OECD countries",
Banque de France Working Paper No 283
Data
Sample period: 1985-2007
Coverage: 15 OECD countries, 20 industries
Extent of upstream regulation: OECD Product Market Regulation
indicators, with input-output tables used to calculate the importance
of upstream industry j to downstream industry k
Authors report results for the full sample period, as well as two sub-
samples: 1985-1994 and 1995-2007. We report results for 1995-
2007.
Experimental set-up
Error-correction model specification:
Δln MFPcs,t = α1 Δln MFPFs,t + (1-α0) gapcs,t-1 + α3 REGcs,t-1 + α4
[REGcs,t-1•gapcs,t-1] + sector fixed effects + country-year fixed effects
+ random error term
where gapcs,t-1 is the country-industry pair distance from the industry
frontier
and REGckt = Σj NMRcjt • wcjk with 0 < wcjk < 1
NMR c j t : anti-competitive regulation in country c for non-
manufacturing sector j at time t, and weight wcjk is the total input
requirement of sector k for intermediate inputs from non-
manufacturing sector j
Hypothesis
Lack of upstream competition curbs downstream efficiency
improvements:
α3 + α4•gap < 0
If α3 < 0 and α4 < 0, then the negative effects of regulation on
productivity growth are stronger further away from the technology
frontier;
if α3 < 0 and α4 > 0, then the negative effects of regulation on
productivity growth are stronger near the technology frontier (and
there may be cases where upstream regulation has a net positive
effect on downstream productivity growth).
Robustness
Endogeneity: Changes in OECD measures of anti-competitive
regulation in non-manufacturing sectors can be considered
reasonably exogenous to productivity changes in individual
downstream manufacturing industries.
Omitted variables: Country-time fixed effects account for domestic
characteristics of labour or financial markets; sector fixed effects
account for structural differences between industries.
Measurement error: Estimation results robust to alternate
measures of key variables

May 2012 | Frontier Economics 61
Annexe 3: Detailed overview of selected
empirical evidence
Key findings
α3 = -0.124 (significant at 1%)
α4 = 0.132 (significant at 5%)
α4 is positive and significant for all estimation samples, suggesting
that lack of competition in upstream sectors is particularly
damaging for industries near the global technology frontier. α3 is
negative and significant for 1995-2007; it is not significantly
different from zero at 10% significance level for the full sample or
the earlier sub-sample 1985-1994.
Eliminating all regulatory burdens in upstream sectors from 1995-
2007 could have increased multi-factor productivity growth by up to
1.7 percentage points per year.
Limitations
The analysis is reported in a working paper from the Banque de
France from June 2010, with a slightly more recent version
published as an NBER working paper in November 2010. The
estimates may change as the authors refine their analysis.

62 Frontier Economics | May 2012
Annexe 3: Detailed overview of selected
empirical evidence
Article Busse, M. and Groizard, J.L. (2008) Foreign Direct Investment,
Regulations and Growth, World Economy, Vol 31 Iss 7 pp 861-886
Data
Real growth of GDP per capita in per cent World Bank
GDP per capita in international US$ (PPP) World Bank Foreign direct investment, net inflows in per cent of GDP UNCTAD Composite regulation index for business regulations, labour market regulations, contract regulations, creditor rights and insolvency regulations, January 2003 World Bank Composite regulation dummy for the 20/30/40/50 per cent most regulated countries in the sample, 0 and 1, January 2003 World Bank
Rule of law, 0–6 scale PRS Group (2007)
Change in consumer prices (CPI), computed as ln(1+CPI average inflation) World Bank
Population growth in per cent
Government consumption divided by GDP World Bank
Black market premium (BMP) for foreign currency (US$) in per cent, calculated as ln(1+BMP) World Bank
Total imports and exports divided by GDP World Bank Distance from the equator, measured as absolute value of latitude of capital city World Bank Fraction of population speaking a European language World Bank Legal origin dummies for British and French law, 0 and 1 World Bank
Average years of secondary schooling, ages 25+ Barro and Lee (2001)
Financial variables Beck et al (2000)
Experimental set-up
Generalised method of moments technique Regression of growth in the most recent 10-year period (1994–2003) on growth in the previous 10-year period (1984–93) and on changes from the previous to the current period in FDI and the other explanatory variables and an interactive term of regulation and FDI, Independent variables: FDI inflows (measured as annual average of net FDI inflows as a share of GDP), average investment share of GDP, average rate of population growth, schooling years at secondary level at the beginning of the current period and an indicator for the rule of law , dummy for top 20 per cent most regulated economies human capital levels, measured as average years of secondary schooling, imports and exports divided by GDP, total government consumption as a share of GDP, • changes in consumer prices in per cent, black market premium for foreign currency (US$), in per cent and a range of other variables
Hypothesis Regulation has a negative effect on the positive impact of FDI on
growth

May 2012 | Frontier Economics 63
Annexe 3: Detailed overview of selected
empirical evidence
Robustness Key results are statistically significant at 10% or better
Key findings
They find that FDI does not stimulate growth in economies with
excessive business and labour regulations. This finding applies to
the 20-30% most regulated countries. The indicator on starting a
business affects the impact of FDI on growth in particular. Overall,
Busse and Groizard (2008) find that there is a threshold effect
rather than a linear relationship between regulation and the impact
of FDI on growth.
Limitations Use of composite indicators that quantify a wide range of
regulations and legislation
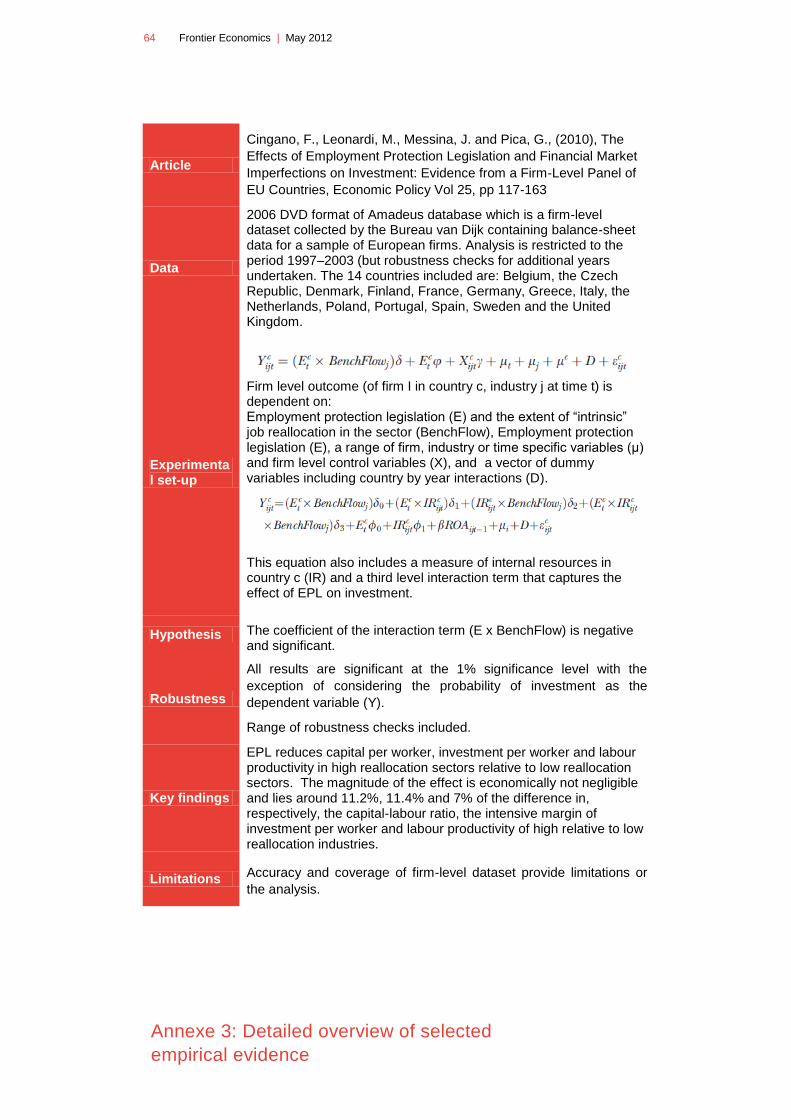
64 Frontier Economics | May 2012
Annexe 3: Detailed overview of selected
empirical evidence
Article
Cingano, F., Leonardi, M., Messina, J. and Pica, G., (2010), The
Effects of Employment Protection Legislation and Financial Market
Imperfections on Investment: Evidence from a Firm-Level Panel of
EU Countries, Economic Policy Vol 25, pp 117-163
Data
2006 DVD format of Amadeus database which is a firm-level dataset collected by the Bureau van Dijk containing balance-sheet data for a sample of European firms. Analysis is restricted to the period 1997–2003 (but robustness checks for additional years undertaken. The 14 countries included are: Belgium, the Czech Republic, Denmark, Finland, France, Germany, Greece, Italy, the Netherlands, Poland, Portugal, Spain, Sweden and the United Kingdom.
Experimental set-up
Firm level outcome (of firm I in country c, industry j at time t) is dependent on: Employment protection legislation (E) and the extent of “intrinsic” job reallocation in the sector (BenchFlow), Employment protection legislation (E), a range of firm, industry or time specific variables (μ) and firm level control variables (X), and a vector of dummy variables including country by year interactions (D).
This equation also includes a measure of internal resources in country c (IR) and a third level interaction term that captures the effect of EPL on investment.
Hypothesis The coefficient of the interaction term (E x BenchFlow) is negative and significant.
Robustness
All results are significant at the 1% significance level with the
exception of considering the probability of investment as the
dependent variable (Y).
Range of robustness checks included.
Key findings
EPL reduces capital per worker, investment per worker and labour productivity in high reallocation sectors relative to low reallocation sectors. The magnitude of the effect is economically not negligible and lies around 11.2%, 11.4% and 7% of the difference in, respectively, the capital-labour ratio, the intensive margin of investment per worker and labour productivity of high relative to low reallocation industries.
Limitations Accuracy and coverage of firm-level dataset provide limitations or
the analysis.

May 2012 | Frontier Economics 65
Annexe 3: Detailed overview of selected
empirical evidence
Article
Cheshire, P. and Hilber, C., (2008), Office Space Supply
Restrictions in Britain: the Political Economy of Market Revenge
Economic Journal Vol 118, pp F185-F221
Data
Davis Langdon: marginal cost of construction from estimated time-series of construction data (from Spon Handbook)
Gardiner and Theobald: (average) construction cost data for sample of continental European cities
CB Richard Ellis (CBRE): data on rents, yields, vacancies for British markets and total occupation cost data
Jones Lang LaSalle (JLL): data on rents, yields, vacancies for a number of British locations and all the continental European ones we and prime rent and equivalent yield data from 1990 to 2005 (continental European cities) and for 1987 to 2005 (British cities)
Office of the Deputy Prime Minister (ODPM): vacancy rate information from the
Investment Property Databank (IPD): national rental void (vacancies) data from
Experimental set-up
Regulatory tax is equal to market value of an additional square metre of office space divided by the marginal construction costs of adding one square metre of additional floor
Hypothesis The regulatory tax in the UK is higher when compared to other countries even when considering locations outside London
Robustness Some imputation of missing values required but overall the approach is relatively simple and therefore robust.
Key findings
The regulatory tax rates in the City of London can be compared to
other large European cities. For example, in 2005 the regulatory
tax in the City of London is estimated at 8.89% compared to
Frankfurt (3.31%), Stockholm (3.30%) and Milan (4.11%).
Limitations The approach does not consider the net impact of planning regulations.
Article Damiani, M., Pompei, F., (2010), Labour protection and productivity
in EU economies: 1995-2005, European Journal of Comparative

66 Frontier Economics | May 2012
Annexe 3: Detailed overview of selected
empirical evidence
Economics, Vol. 7, n. 2, pp. 373-411
Data
EU KLEMS accounts (MFP data), EUROSTAT (rate of change of employees with fixed-term and with part-time contracts and the rate of growth of weekly hours worked) and OECD databases (product market regulation indicators). Due to data availability the following countries were included: Austria, Belgium, the Czech Republic, Denmark, Spain, Finland, France, Germany, Hungary, Ireland, Italy, the Netherlands, Portugal, Slovenia, Sweden, and the United Kingdom.
Experimental set-up
The change in multi-factor productivity in 128 sector-country units (s) over 10 years (t from 1995 to 2005) is driven by index on the size of the labour flexibility component which is protected (Λ) interacted with a measure of labour protection (LP), organisational variables (OV), unmeasured innovative inputs (R&D), product market regulation (PMR), industry-by-time dummies (D) and country-by-time dummies (D).
Hypothesis Differences in flexible employment contracts and collective labour relationships can explain the ample MFP differentials recorded in the European economy.
Robustness Large proportion of variables tested are not significant, conclusions only based on significant variables.
Key findings
It seems likely that shorter term jobs and lower employment
tenures discourage investments in skills, while labour regulation
which sustain long term relationships, may present some
advantages and would seem to be preferable to short-term
arrangements in collaborative relations and bargaining
governability.
Limitations Inaccuracies associated with EU KLEMS dataset and measurement of regulatory indices

May 2012 | Frontier Economics 67
Annexe 3: Detailed overview of selected
empirical evidence
Article Gorgens, T., Paldan, M. Wurtz, A., (2005), Growth, Income and
Regulation: a Non-Linear Approach
Data
Fraser Institute of Economic Freedom Index From International Bank for Reconstruction and Development: Average real growth per capita Log GDP per capita in PPP prices
Experimental set-up
Semi-parametric estimation of fixed effects panel data regression model The regression function models expected growth conditional on the choice of regulation, fixed effects for countries and for years and the log GDP level
Hypothesis The relationship between regulation and growth is not linear
Robustness Includes 95% bounds which show that the form of the curve on the right (at higher levels of regulation) is statistically significant but on the left (at lower levels of regulation) it is not statistically significant
Key findings Aerts, Claeskens and Hart test for linearity 0.870, not rejected as 5% critical value is 4.18
Limitations Use of Fraser Institute of Economic Freedom Index to measure overall regulation as it includes a range of government interventions that may not necessarily be defined as regulation
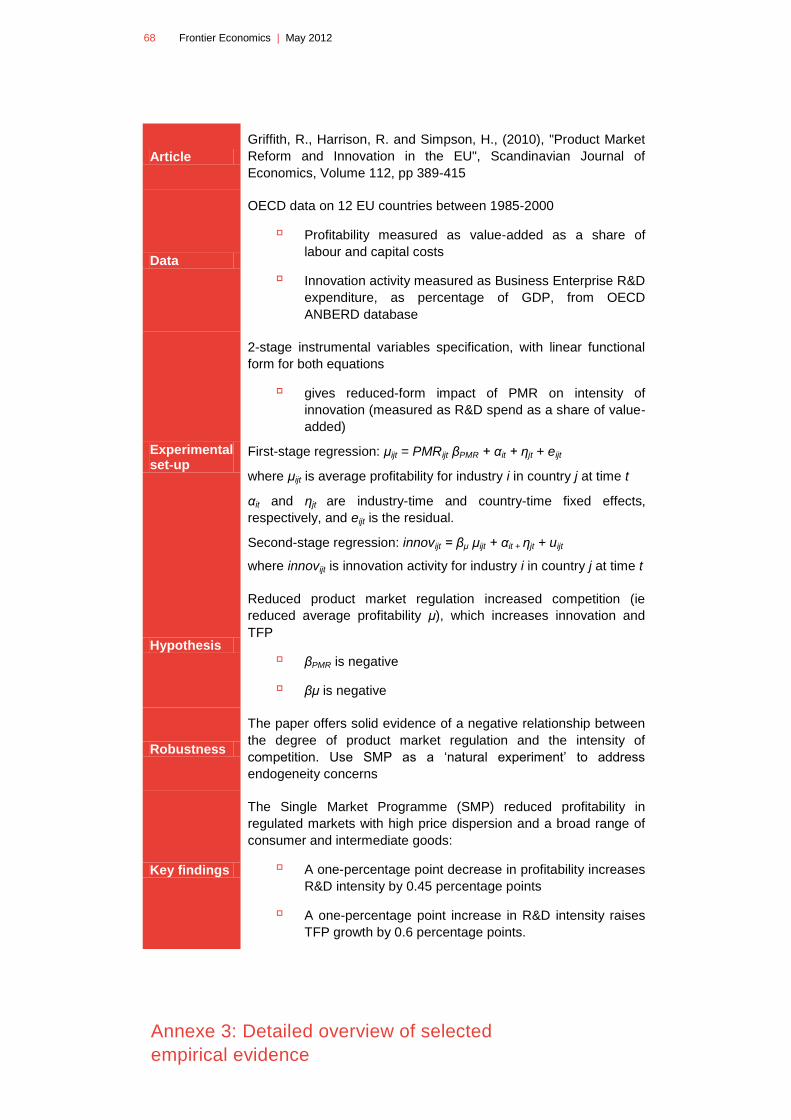
68 Frontier Economics | May 2012
Annexe 3: Detailed overview of selected
empirical evidence
Article
Griffith, R., Harrison, R. and Simpson, H., (2010), "Product Market
Reform and Innovation in the EU", Scandinavian Journal of
Economics, Volume 112, pp 389-415
Data
OECD data on 12 EU countries between 1985-2000
Profitability measured as value-added as a share of
labour and capital costs
Innovation activity measured as Business Enterprise R&D
expenditure, as percentage of GDP, from OECD
ANBERD database
Experimental set-up
2-stage instrumental variables specification, with linear functional
form for both equations
gives reduced-form impact of PMR on intensity of
innovation (measured as R&D spend as a share of value-
added)
First-stage regression: μijt = PMRijt βPMR + αit + ηjt + eijt
where μijt is average profitability for industry i in country j at time t
αit and ηjt are industry-time and country-time fixed effects,
respectively, and eijt is the residual.
Second-stage regression: innovijt = βμ μijt + αit + ηjt + uijt
where innovijt is innovation activity for industry i in country j at time t
Hypothesis
Reduced product market regulation increased competition (ie
reduced average profitability μ), which increases innovation and
TFP
βPMR is negative
βμ is negative
Robustness
The paper offers solid evidence of a negative relationship between
the degree of product market regulation and the intensity of
competition. Use SMP as a ‘natural experiment’ to address
endogeneity concerns
Key findings
The Single Market Programme (SMP) reduced profitability in
regulated markets with high price dispersion and a broad range of
consumer and intermediate goods:
A one-percentage point decrease in profitability increases
R&D intensity by 0.45 percentage points
A one-percentage point increase in R&D intensity raises
TFP growth by 0.6 percentage points.

May 2012 | Frontier Economics 69
Annexe 3: Detailed overview of selected
empirical evidence
Limitations
Estimates are specific to SMP reforms in affected industries in
affected countries and cannot be extrapolated to future reforms or
other industries.
"Administrative burden on business," our main variable of interest
measured as "time senior management spends with government
bureaucracy" from Fraser Institute (based on survey responses
from WEF Global Competitiveness Report) or "Percentage of
SMEs for which administrative burdens are a problem" based on
survey data from OECD International Regulation Database.

70 Frontier Economics | May 2012
Annexe 3: Detailed overview of selected
empirical evidence
Article
Griffith, R. and Macartney, G., (2010) Employment Protection
Legislation, Multinational Firms and Innovation, CEPR Discussion
Paper No 7628
Data
European Patent Office PATSTAT dataset (patents), accounts from
Amadeus database, index of EPL from OECD (preferred measure
is the indicators of the legislation relating to regular contracts).
Overall 1,378 subsidiaries of 343 multinational firms are included in
the analysis.
Experimental set-up
NPL is a weighted count of patents that gives a greater weight to
patents that are more technologically advanced.
EPL is the OECD index on employment protection legislation.
CITWP is the count of all patents weighted by all citations made, to
control for differences across patents in the amount of citations
made.
X contains a number of control variables such as capital per unit
output, natural log of the capital per worker in each country, the
skill intensity of each industry, the natural log of the proportion of
GDP spent on higher education in each country, and the working
population of each country averaged over the sample period.
η includes multinational effects.
Hypothesis
Multinational firms undertake more incremental innovation in high
EPL countries and radical innovation in low EPL countries
This is indicated by the sign and magnitude of β2 - a negative sign would indicate that higher technologically advanced patenting as a proportion of overall patenting is associated with lower EPL.
Robustness
The results are significant at 10% significant level as a minimum. A
range of tests for robustness are performed (including use of
different EPL indicators).
Key findings Multinational firms do more incremental patenting activity in high
EPL countries and more radical patenting activity in low EPL
countries
Limitations The main limitation is the method of defining incremental and
radical innovation.

May 2012 | Frontier Economics 71
Annexe 3: Detailed overview of selected
empirical evidence
Article Djankov, S., McLeish, C., Ramalho, R., (2006), Regulation and
Growth, World Bank Working Paper
Data
World Bank Doing Business indicators for 135 countries and in seven regulatory areas converted into an aggregate index of business regulations World Bank Development indicators used for GDP and other growth factors such as primary and secondary school enrolment in the initial period, absolute deviation from average deflator in initial period, a binary variable for civil conflict, 3 regional dummies (Sub Saharan Africa, Latin America, East Asia), average government consumption as percentage of GDP over the 10 year growth Period
Experimental set-up
OLS and 2-stage Regression analysis: Growth = α + βbusiness regulations + γLn(GDPpc93) + δX + ε, Growth is the annual average GDP per capita growth between 1993 and 2002 X is a set of control variables A range of variations of the model were estimated as different growth factors were controlled for. Main variations:
No growth factors included
Regional dummies included
School enrolment and average deflator included as well as regional dummies
Government consumption added
Hypothesis Regulation has a negative impact on growth
Robustness
R-Square between 0.04 and 0.36 Number of significant variables depends on model specification Business regulation index statistically significant at 5% in all OLS specifications, and statistically significant at 10% in all 2SLS specifications
Key findings
The relationship the relationship between more business-friendly regulations and higher growth rates is consistently significant in various specifications of standard growth models. Improving from the worst (first) to the best (fourth) quartile of business regulations implies a 2.3 percentage point increase in average annual growth.
Limitations Possibility of reverse causality Use of high level indicators

72 Frontier Economics | May 2012
Annexe 3: Detailed overview of selected
empirical evidence
Article
Haskel, J. and Sadun, R., (2009), Regulation and UK Retailing
Productivity: Evidence from Micro-Data, CEPR Discussion Paper
No 7140
Data
Micro data on retail firms and stores drawn from the official UK Office of National Statistics business surveys, including:
Interdepartmental Business Register
Annual Register Inquiry (ARI)
Annual Business Inquiry (ABI)
SIC industry classification
Experimental set-up
Regression of logarithm of gross output on standard store inputs, share of small and large stores, regional and industry dummies, dummy on whether store is part of a chain and fixed terms
Hypothesis A larger proportion of small stores reduces output at a chain level A greater proportion of employment in small stores reduces output at a chain level
Robustness Includes a range of robustness checks such as testing effects with vertical and horizontal integration
Key findings In the absence of changes in supermarket store sizes, retail sector TFP growth would have been 0.44% per annum rather than the actual 0.07% per annum (between 1997/98 and 2002/03).
Limitations Some data limitations around accuracy of micro business data Analysis does not consider the net impact on growth

May 2012 | Frontier Economics 73
Annexe 3: Detailed overview of selected
empirical evidence
Article Poschke, M., 2010, "The Regulation of Entry and Aggregate Productivity", Economic Journal Volume 120, pp 1175-1200
Data
Data on administrative entry costs from Djankov (2002). Minimum cost of meeting entry requirements in largest city, measured as percentage of per capita GDP. Other data from Groningen Growth and Development Centre's productivity level database (Inklaar and Timmer, 2008): TFP, labour productivity (output per hour), capital intensity (capital services flows per hour worked) for private sector in 1997, expressed in PPP terms relative to values for the US.
Experimental set-up
Dynamic stochastic model of heterogeneous firms, with technology choice. Firms produce intermediate goods under monopolistic competition. Set structural parameters of model and numerically solve for equilibrium values of key variables. Some parameters are evidenced from existing literature, others are jointly calibrated to values so that the model generates a distribution of firm productivity similar to that observed in the data. Then simulate policy experiments by changing particular structural parameters and numerically solve for new equilibrium values of key variables.
Hypothesis Administrative entry costs reduce entry and productivity.
Robustness
The model replicates key features of the distribution of productivity across firms reasonably well, but is not able to capture the turnover of young and small firms (i.e. the survival rates of new firms are higher than those observed in the data).
Key findings
Increasing administrative entry costs from 1.7% to 30% of per capita GDP accounts for one-third of the difference in Total Factor Productivity between Germany and the US. The relationship between administrative entry costs and total factor productivity is linear: introducing entry costs equivalent to an additional 10% of per capita GDP reduces TFP by 0.8%.
Limitations
The data is now fairly outdated and does not cover ongoing administrative costs to firms ("red tape") that are of particular concern to business groups. Moreover, administrative entry costs are measured for countries' largest city and may mask considerable variation within countries. The author employs a sophisticated theoretical approach and advanced quantitative methods generally covered in PhD-level macro courses, and is unlikely to be accessible to readers with broader economic and policy backgrounds.


Frontier Economics Limited in Europe is a member of the Frontier Economics network, which
consists of separate companies based in Europe (Brussels, Cologne, London & Madrid) and Australia
(Brisbane, Melbourne & Sydney). The companies are independently owned, and legal commitments
entered into by any one company do not impose any obligations on other companies in the network.
All views expressed in this document are the views of Frontier Economics Limited.

URN 12/821
FRONTIER ECONOMICS EUROPE
BRUSSELS | COLOGNE | LONDON | MADRID
Frontier Economics Ltd 71 High Holborn London WC1V 6DA
Tel. +44 (0)20 7031 7000 Fax. +44 (0)20 7031 7001 www.frontier-economics.com