Embed Size (px)
Citation preview
The Impact of Regulation on Financial Services Industry Groups: Evidence from the 2007-2009 Crisis
Anita Pennathura Florida Atlantic University
Deborah Smithb Florida Atlantic University
Vijaya Subrahmanyamc*
Mercer University-Atlanta
Preliminary Copy. Please do not cite
JEL Classification: G01, G20, G21, G22, G28,
Keywords: financial crisis, banking, S&Ls, insurance, REITs, systematic risk, regulation, financial services
a Department of Finance, College of Business, Florida Atlantic University, Boca Raton, FL 33421. Phone: 954-236-1272, Email: [email protected]
b Department of Finance, College of Business, Florida Atlantic University, Boca Raton, FL 33421, Email: [email protected]
cDepartment of Finance, Stetson School of Business and Economics, Mercer University, Atlanta, GA 30341;Phone: 678-547-6195; e-mail: [email protected]
* Contact author

2
Field Code Changed
The Impact of Regulation on Financial Services Industry Groups:
Evidence from the 2007-2009 Crisis
ABSTRACT
We examine the market reaction and shift in risk from nine prominent legislations passed in response to the crisis between February of 2007 and July of 2009 on four types of institutions – banks, S&Ls, insurance companies, and REITs. Overall, with the exception of TARP, the legislations were wealth-decreasing and risk-increasing events for financial institutions as a whole. Banking firms, leveraged firms, and firms with higher trading volumes earn significantly lower abnormal returns. For both during- and post-crisis periods, larger firms experience increases in systematic risk; non-U.S. firms and firms with higher trading volumes experience lower changes in systematic risk.
3
Field Code Changed
The Impact of Regulation on Financial Services Industry Groups: Evidence from the 2007-2009 Crisis
1. Introduction
The financial shocks of September and October 2008 impaired consumer and business
confidence and brought into question the viability of major financial institutions. “Commercial
and investment banks and insurance companies around the world reported more than $1.1
trillion of losses between the outbreak of the financial crisis in mid-2007 and March 2009”
(Wilmarth, Jr., 2009). The world bore witness to the failure of large banks and other financial
institutions in the United States and abroad that resulted in a financial meltdown followed by an
economic downturn. As a response to the crisis, the U.S. government took various measures,
famously known as the economic stimulus1 in order to stabilize the economy and increase the
safety and soundness of the financial markets. In addition to rebuilding the general public’s
confidence in U.S. financial markets, these stimuli were meant to improve the flow of
information to financial markets and to provide liquidity to the markets to ensure market
continuity. Yet, there has been spirited disagreement about the impact of such economic stimuli
and the regulations that followed2.
Our objective in this paper is to examine the impact of financial regulations (such as the
Emergency Economic Stabilization Act (EESA (2008) and American Recovery and
Reinvestment Act (ARRA (2009)) on commercial banks, savings and loans (S&Ls), insurance
1 http://www.economy.com/mark-zandi/documents/Economic_Stimulus_House_Plan_012109.pdf 2 In March 1999, Alan Greenspan appeared skeptical that the regulations would alleviate the problems facing the financial institutions industry. He states, “possibility of increased systemic risk does appear to be an issue that requires fuller understanding,” arguing that new regulations “would be a major mistake.” (What created this Monster? New York Times, March 23rd, 2008). Further, Mr. Nocera notes that support for regulation came from folks such asRep. Barney Frank and some of the most unexpected quarters on Wall Street –Byron Wien of Pequot Capital, Laurence Fink of BlackRock, the economist Alan Blinder, Allan Sinai of Decision Economics, Jamie Dimon of JPMorgan Chase, and even Larry Kudlow, the archconservative host of Kudlow & Company on CNBC”. (“A System Overdue for Reform,” Joe Nocera, New York Times,March 29, 2008)

4
Field Code Changed
companies and real estate investment trusts’ (REITs) stockholder returns. EESA (2008) and
ARRA (2009) represent the costliest pieces of legislation in the history of the US banking
industry. The legislations also have far reaching implications beyond providing funds for closing
and reorganizing the insolvent financial institutions since they alter the legal and regulatory
landscape for the industry. The changes in laws governing capital requirements, deposit
insurance for banks and S&Ls, products and services offered and mergers and acquisitions
fundamentally changes the future structure and operational dimensions of the industry from
within. Kauffman (2010) states in his policy brief on banking market crisis that designing and
enacting effective corrective public policies requires the correct identification and understanding
of the problems and the consequences. Griffiths, Kotomin, and Winters (2011) echo this view in
a recent paper and state that “analyses of financial crises allow researchers to determine what
market mechanisms went wrong so appropriate policies can be put in place going forward” (page
542).
This paper aims at a step in this direction and adds value to the literature on the financial
market crisis. This study also contributes to the literature on the impact of regulations on
financial institutions. We examine the market reaction and shift in risk from nine prominent
legislations passed between February of 2007 and July of 2009. Specifically, we examine the
abnormal returns in the financial sector with a focus on the differential impact of regulations on
four types of institutions – banks, S&Ls, insurance companies, and REITs. We also analyze the
changes in risk due to the passage of the legislations for these four groups of financial
institutions. Finally, we focus on the cross-sectional determinants of abnormal stock returns and
risk shifts for the financial institutions.

5
Field Code Changed
Examining the market reaction for 602 financial services firms as a whole, and for each
individual sub-group of firms, we find that seven of the nine regulatory events, on average, have
a highly significant negative market reaction. Interestingly, the one regulatory event which
resulted in a positive market reaction for all groups of firms was the October 3, 2008 legislation
which passed the Troubled Assets Repurchase Program (TARP). Among the industry groups
examined, our results confirm the market perception that the banking industry was the hardest hit
during the crisis. Moreover, we find that alphas for our firms decrease significantly in post-event
period, while betas increase for the sample of firms. Thus, overall, the legislations were wealth-
decreasing and risk-increasing events for financial institutions as a whole. On the individual
group level, we find that the passing of the legislations result in an increase of systematic risk for
banks, insurance companies and REITs. The results show that banking firms, leveraged firms,
and firms with higher trading volumes earn significantly lower period abnormal returns. We find
that larger firms experience increases in systematic risk while non-U.S. firms and firms with
higher trading volumes experience lower changes in systematic risk for both the during- and
post-crisis periods.
The remainder of the paper is as follows. We describe the background in section 2, while
we present the research hypothesis and method in section 3. Section 4 describes the empirical
results, and the conclusion is presented in section 5.
2. Background
The rumblings of the financial crisis3 were felt as far back as early FY 2007 when HSBC
announced losses linked to U.S. subprime mortgages and New Century Financial, which
3 The Global Economic & Financial Crisis: A Timeline by Mauro F. Guillén http://lauder.wharton.upenn.edu/pdf/Chronology%20Economic%20%20Financial%20Crisis.pdf
Field Code Changed

6
Field Code Changed
specialized in sub-prime mortgages, filed for Chapter 11 bankruptcy protection and cut half of its
workforce. However, these warning signs were ignored and not recognized as a problem of
avalanche proportions. But that did not last long. Soon after, in mid-2007, the trouble spread to
major Wall Street firms such as Lehman Brothers, Bear Stearns, Merrill Lynch, JPMorgan
Chase, Citigroup, and Goldman Sachs which led to a vortex of plunging prices in the financial
markets by early 2008. As Wilmarth Jr. (2009) points out, seventeen large universal banks
accounted for more than half of the $1.1 trillion of losses reported by the world’s banks and
insurance companies. The rest now is history.
The causes for the crises are manifold with a large convergence toward the following:
housing boom in the US, low interest rates that fueled the boom, careless lending and investment
decision-making, possible lack of oversight on the part of the regulators till after the collapse and
the underestimation of systemic risks emerging out of the housing and mortgage market (Basse
et al (2009), Wilmarth Jr. (2009), Kaufman (2010)). Furthermore, the international movement of
funds from those nations with a surplus balance to those with a deficit balance such as the U.S.
are often noted to have created macroeconomic imbalances which may have further deepened the
crisis (Frieden, 2009)). Securitization transformed relatively illiquid financial assets into
marketable capital market instruments via derivative financial instruments such as mortgage
backed securities (MBS) and collateralized debt obligations (CDOs) (Basse et al (2009)). The
nature of lucrative, albeit complex products attracted many participants including banks, savings
and loans, investment banks, mortgage banks, insurance companies, REITs and other financial
institutions into this market leading them down a slippery slope. By 2007, the weaknesses in
many of these instruments started to come undone. Alongside the weaknesses in the mortgage
markets with subprime lenders and fraud, banks and S&Ls had over-extended loans. As rates

7
Field Code Changed
rose and foreclosures increased, the real estate bubble burst, further intensifying the decline, thus
impacting all financial institutions directly or indirectly. The deepening crisis caused the failure
or near-failure of several financial institutions leading to a further financial panic (Basse et al.,
2009, Kaufmann, 2010).
Our analyses in this paper focuses on four major types of institutions, namely,
Commercial Banks, S&Ls (also called thrifts interchangeably in the paper), Insurance
companies, and REITS. Below, we discuss these institutions and the rationale behind their
inclusion in our analysis.
2.1 Banks and S&Ls
The amount and rate of losses suffered by bank and S&Ls in 2008 and 2009 and the
unprecedented levels of governmental assistance they received put them on the center of the map
in the crisis. As more was uncovered about their operations, they were also seen as the main
private-sector catalysts for the credit boom that further precipitated the crisis. Wilmarth, Jr., 2009
and Kauffman, (2010 provide excellent summaries of the role of banks in the financial crisis.
Even prior to the crisis, S&Ls were largely losing favor and declining with many thrifts
converting their charter to banks. This crisis is largely considered a banking centered crisis,
although “five of the seven biggest financial institution failures in 2007 and 2008 were OTS-
regulated thrifts” (McCoy 2009). A forensic analysis of the crisis brings memories of the now
infamous Countrywide, FSB and Wachovia, FSB that had shot-gun marriages with large bank
holding companies in FY 2008 and Washington Mutual Bank that was among the largest
financial institutions to fail. Unlike Wall Street banking conglomerates, thrifts primarily focus on
taking consumer deposits, selling mortgages and offering credit cards. They also have their own
8
Field Code Changed
regulator, Office of Thrift Supervision (OTS), their own charter, and, most importantly, their
own unique lending requirements. (see Donelson and Zaring, 2009 for a detailed legal
description of the working of thrifts and the regulations that surround them). The collapse of the
thrifts are blamed on “imprudent-home loans” (that later became famously known as “liar loans”
or “No-doc” loans) and some “fundamental regulatory lapses by OTS”. (McCoy, 2009).
Following the recent crisis, the efficacy and survival of OTS has been brought into question as
well. Moreover, AIG, an insurance company whose financial products unit division that
infamously had the largest bailout during the crisis held a thrift charter thus also linked to OTS.
From 1998-2008, OTS lost a net 45 institutions as an increasing number of thrifts converted to
banks (Wall Street Journal 2009).
In a series of two articles, DeYoung and Rice (2004a, 2004b) discuss the spectrum of
strategies on how banks make money from employing traditional banking to employing
nontraditional strategies. They note a remarkable increase in noninterest income at U.S.
commercial banks over the past two decades and argue that regulatory and technological changes
are catalysts for this historic change. Stiroh and Rumble (2006) note that while diversification
benefits exist for bank holding companies (BHCs) with expansion into non- interest generating
activities, they are also associated with increased volatility in returns and lower risk-adjusted
profits. Further, Stiroh (2006) in determining equity market risk for U.S. BHCs, finds that (1)
higher dependence on commercial and industrial loans, consumer loans and noninterest income
activities largely impel increases in risk in BHCs and (2) investment banking, servicing,
securitization income, gains from loan sales, gains from other asset sales and other non- interest
income largely produce the volatility in returns.

9
Field Code Changed
Along with banks’ investment decisions, many economists have blamed central bankers
and governmental policy makers for encouraging consolidation and conglomeration within the
financial services industry over the past two decades, thus serving as catalysts to this crisis.
Following the 1999 Financial Services Modernization Act (also known as the Gramm Leach
Bliley (GLB) Act), mergers among commercial and investment banks and other financial service
firms produced large financial conglomerates (or universal banks). In order to achieve economies
of scope, they offered the gamut of financial services under one umbrella from securities
underwriting, syndicated lending, asset backed securities (ABS), over-the-counter (OTC)
derivatives, to collateralized debt obligations (CDOs) among others. In order to maximize their
non-interest fee-related activity and decrease traditional lending (that is prone to capital
requirements, default risk and interest rate risk) and to circumvent regulation, most banks
pursued the securitization strategy (Wilmarth Jr., 2009, p. 995). Most of these loans were tied to
mortgages due to their homogeneous nature and ease of pooling into ‘tranches.’ Whether these
activities by financial conglomerates benefitted banks or increased risks is still inconclusive.
Mamun, Hassan, and Lai (2004) showed that the financial services industry reduced the exposure
of financial services to systematic risk by creating diversification opportunities that were
afforded to them due to the GLB Act of 1999. They note further that the banking industry and
especially larger banks benefitted most from the deregulations created by the GLB act. In
contrast, Rajan (2005) discusses the strategy of offloading more plain vanilla risks by banks from
their balance sheets into the balance sheets of investment managers, thus building-in an incentive
to originate more loans that allows them to shift risk and maximize fee generation (Rajan, 2005,
p. 5). Banks followed this strategy and offloaded much of their interest rate risk tied to fixed rate
loans (such as mortgage loans) and this was often to an insurance company or pension fund that
10
Field Code Changed
was looking for long term fixed income flows and less regulated than the originating banks.
(Rajan, 2005).
As a port-mortem analysis, Wilmarth, Jr., (2009) notes that while revenue generating,
these activities also significantly increased systemic risk in both U.S. and global financial
markets. Wilmarth, Jr., (2009) describes the mortgage market as akin to a giant Ponzi scheme
wherein nonprime borrowers had to keep taking out new loans to pay off their old ones. Thus,
when the housing market collapsed in 2007 and large numbers of nonprime borrowers could not
refinance, rapidly increasing defaults and foreclosures, the subprime crisis resulted. Thus, the
securitization strategy that banks adopted to reduce their capital requirements and increase
revenue exposed these institutions to credit risk, liquidity risk, market risk and finally led to
systemic risk.
2.2 Insurance companies
The effect of the financial crisis on the insurance industry has been mixed. With the
substantial number of bank failures, the housing market bust, and the Federal Reserve at the
epicenter of the crisis, the financial crisis has primarily been seen as a banking crisis or a real
estate crisis. While financial guarantee insurance companies in the United States and AIG in
particular have garnered considerable attention in the media worldwide, the arguments from
within the insurance industry regarding their vulnerability have come from both sides. One side
argues that insurance companies are minimally affected by the crisis. The argument is as follows.
Since insurance companies are largely long term investors with long-term investment horizons
compared to other financial institutions, such as commercial banks, they are not heavily
impacted by volatility in the markets. Furthermore, the argument pursues that since insurers were
11
Field Code Changed
not originators of subprime mortgages nor were they major investors in mortgage based financial
instruments; their risk exposure to the housing market collapse was minimal (Schich, 2009). The
flip side of the argument as discussed by Schich, 2009 emphasizes that certain segments of the
insurance industry (financial guarantee companies in particular) that are involved in investment-
bank like activities, valuations and financial transaction guarantees such as the now infamous
credit default swaps contributed to the risk that almost brought down the global economy thus
placing the insurance industry in the epicenter of the crisis in step with banks and thrifts.
In a 2009 report by Ernst & Young, model risk and regulatory intervention risk were
ranked as 2 of the 10 most severe risks facing the insurance industry4. The increase in credit and
market risks, especially for the US mortgage and financial guarantee insurance companies,
clearly points to systemic risks that affected the financial sector.
2.3 REITs
REITs invest their funds mainly in real estate assets. They receive special tax
considerations and typically offer investors high yields, as well as a highly liquid method of
investing in real estate which make them very attractive. In the U.S., REITs are also required to
designate 90% of their taxable income to shareholders via dividends in return for not having to
pay taxes on that money. Thus, investing in REITs is a liquid, dividend-paying means of
participating in the real estate market which makes them attractive. Equity REITs invest in and
own properties and Mortgage REITs deal in investment and ownership of property mortgages.
These institutions loan money for mortgages to owners of real estate, or purchase existing
mortgages or mortgage-backed securities. Their revenues are generated primarily by the interest
that they earn on the mortgage loans. Whether REITs and the real estate market are closely tied 4 http://www.insurancejournal.com/news/national/2009/06/23/101637.htm

12
Field Code Changed
is debated in the literature, but literature finds cointegration between REITs and house prices
implying tight co-movements and the existence of a stable long term relationship (Pagliari and
Webb, 1995; Gilberto, 1990; He, 2000; Glascock, Lu and So, 2000;Nishigaki, 2007). Taking
note that REITs behave like utility stocks and are often difficult to classify as stock market or
real estate investments, Basse, Friedrick and Bea (2009) examine the relationship between REITs
and utility stocks and show a massive structural break in February 2007. They conclude that
investing in REITs seems to have become more risky relative to investments in utility stocks.
A Ernst and Young Report ((E&Y Report, 2010) states that by end of 2008, US REITs
were deeply burdened with debt and combined with illiquidity in a falling real estate market
faced both increased cost of capital and difficulty in finding capital. Taking advantage of an IRS
ruling to help REITs survive the crisis, that allowed publicly traded REITs to pay up to 90% of
their dividends in stock, some REITs in 2009 in order to conserve cash paid part of their
dividends in stock. However, following a very successful capital-raising experience by Simon
Property Group Inc., the largest public US REIT, in early 2009, REIT share prices rose rapidly
and by the end of FY 2009 REIT shares overall were up about 90% compared to earlier that year
(E&Y report, 2010, p. 25-26).
2.4 Financial Regulation
In an unprecedented move due to the threatened failure of very large institutions, the U.S.
government had to intervene to mitigate the crisis by enacting several regulations, beginning in
2007. As Udell (2009) notes, “With only $50 billion in the FDIC funds, it is hard for this author
to see how the government was going to avoid injecting sizable amounts into the financial
13
Field Code Changed
system…in the face of impending losses in the U.S. residential mortgage, commercial mortgage,
construction and development loan, commercial loan, and consumer loan (including subprime)
markets …. Some of these losses on U.S. loans will be borne by foreign banks, and some by
nonbank financial institutions including life insurance companies and hedge funds.” Among the
more controversial regulations are the Emergency Economic Stabilization Act (EESA)5 in
October 2008, also commonly referred to as a bailout of the U.S. financial system and in the Feb
2009 American Recovery and Reinvestment Act (ARRA), both of which were passed with the
intent to further stabilize the economy. In an effort to restart money and credit markets, the
Federal Reserve has vastly expanded its role. The Fed adopted a zero interest rate policy, and in
an attempt to decrease long-term interest rates, it made clear that the funds rate will remain there
indefinitely. With $700 billion Troubled Asset Relief Program deployed, the government
injected capital and became a senior preferred stockholder in many banks, and thus gained
sizable ownership stakes in the nation's largest financial institutions6. (Gaby and Walker, 2011).
The interventions included nationalizing several of the banks and the takeover of Fannie Mae
and Freddie Mac, effectively suggesting that the government is implicitly involved in the nation's
mortgage lending (Nanto, 2009).
3. Research Hypothesis
An expansive body of literature surrounds the study of impact of regulation. The earliest
seminal work in the area is by Stigler (1971) who proposed that “regulation is typically sought
by the industry and designed primarily to better operations within”. Other studies have expanded
5 http://www.govtrack.us/congress/bill.xpd?bill=h110-1424 6 Congressional Research Service Report RL34730, Troubled Asset Relief Program: Legislation and Treasury Implementation, by Baird Webel and Edward V. Murphy
14
Field Code Changed
on Stigler’s arguments either supporting or opposing him (Peltzman, 1976; Needham, 1983).
Further, literature also focuses on factors that impact the differential effects of regulation such as
size, industry, geography etc (Stigler, 1971; Posner, 1974, Peltzman, 1976; Binder, 1985; Cornett
and Tehrenian, (1989, 1990); Goddard, Molyneux and Wilson, 2010).
A few papers examine the stock market impact and risk changes due to regulatory events.
Sundaram, Rangan and Davidson (1992) test a sample of banks and S&Ls to analyze the stock
market perception of the debate and passage of FIRREA of 1989. Their evidence suggested that
the FIRREA produced positive abnormal returns for both banks and S&Ls and the addition of
stricter capital standards produced positive returns for S&Ls. They also note the passage of the
Act increased the risk for both banks and S&Ls, perhaps due to increased costs of premiums for
both groups. Madura and Wiley (2000) study the impact of FIRREA on risk of savings
institutions and find that that a reduction in interest rate risk and real estate risk. They also find
that the results vary across savings institutions, and smaller institutions and institutions with
higher levels of capital exhibit a more marked reduction in risk. Mamun, Hassan, and Lai (2004)
find that the financial services industry gained by the passing of the GLB Act in 1999 and that
the exposure to systematic risk was significantly reduced in this industry. However risk
reduction, they note, was not uniform across the industry and they found that the banking sector
gained the most in terms of reduced risk followed by the insurance industry. More recently,
Naceur and Omran (2010) use bank-level data from ten countries to assess the impact of
financial development, bank regulations, market structure, and institutional factors on bank
efficiency and profitability for the 1989-2005 period. They fail to find any significant
relationship between macroeconomic variables and bank performance and note that banks
operating in a well-developed stock market environment tend to have greater profit

15
Field Code Changed
opportunities. They find that regulatory and institutional variables have an impact on bank
performance. Semaan and Drake (2011) study the market’s perception of risk associated with
deregulation using nine different industries, including financial services. They note that a
decrease in market risk of firms following deregulation, except in case of insurance brokers.
They also note that the security and commodity brokers’ industry and bank holding companies
experienced only a very short-term increase in industry-specific risk in comparison to industry
systematic risk, concluding that these industries learned faster to adapt to deregulation.
Two recent papers examine the impact of the financial market crisis on institutions.
Griffiths, Kotomin, and Winters (2011) examine the commercial paper market in the light of the
crisis of 2007-2009. Specifically, they ask whether the problems in the commercial paper market
were liquidity-based or credit- based. Using daily commercial paper data for the 1-day and 30-
day maturities, they conclude that an increase in perceived credit/counterparty risk was the
primary concern in the commercial paper market during the crisis. Liquidity was a secondary
concern. They suggest that merely increasing liquidity, therefore, is not an effective measure in
solving an issue which is more credit-based. Examining bank risk taking at the onset of the
crisis, Fortin, Goldberg, and Roth (2010) analyze the impact of various governance measures on
risk taking by bank holding companies. They find that higher managerial control through
governance mechanisms reduces the amount of risk undertaken by bank managers; CEOs who
achieve greater control through higher share ownership, higher base salaries reduce risk, while
those who receive higher options or bonuses increase risk. The authors conclude that their
evidence is consistent with the view that bank managers are generally more risk-averse than
outside shareholders.
16
Field Code Changed
While literature has largely focused on studying the impact of a legislation on a group or
sub-group of financial institutions, the recent crisis presents an opportunity to explore the impact
of a series of legislative changes that were enacted in a short span on the financial services
industry. The main objective of this paper is to test how the stock market perceived the passing
of financial regulations and the enactment of different pieces of financial legislation related to
the crisis over the period 2007-2009. Our first hypothesis therefore is as follows:
Hypothesis 1: H01: The average excess returns for banks, savings and loans, insurance companies and REITs during the announcement period is not significantly different from zero.
H01 is tested using a Seemingly Unrelated Regressions (SUR) model in which we regress the
returns for a portfolio of banks, savings and loans, insurance companies and REITs against the
market returns using a series of dummy variables to control for the release of information about
the legislations. In this model, the reaction of banks, savings and loans, insurance companies
and REITs to the financial legislations can be measured separately as the new legislations may
have impacted these different financial institution groups differently. Our next hypothesis further
addresses this issue.
Hypothesis 2: H02: The announcement period abnormal returns are not different for the four types of financial institutions.
Typically, literature has shown that besides intra-industry effects, the various legislations may
not impact the different institutions the same way due to their portfolio structure and the nature
of their business.
Changes in regulation also result in changes in risk of regulated firms. Recent regulations
pervaded all of the industry, but portfolio structure of firms may have caused different sub-

17
Field Code Changed
groups within the industry to have different risk impacts. In order to test for structural shifts in
risk, we test the following hypothesis.
Hypothesis 3: H03: The systematic risk remained the same for financial institutions during and after the regulatory period.
H03 can be examined in several ways. We test to determine if the slope coefficients for the four
types of financial institutions changed during the event period while the regulations was passed
and during the post-regulation period.
The next section describes the sample and the methodology utilized to test the above hypotheses.
4. Data and Methodology
4.1 Data
Our analysis requires identification of significant dates surrounding the legislations. As
Binder (1985b) notes, due to the complexity of the legislative process and the multiple
announcements made, it is often difficult to isolate exactly when new information reaches the
market. To identify dates for the regulations, we begin by using the timeline of the financial
crisis that is available at the Federal Reserve Bank of St. Louis in a chronological fashion. We
peruse this timeline and parse out the significant dates where laws were proposed (that later
became laws) or passed or some critical information was announced by the SEC, Treasury or the
Federal Reserve Board. Table 1 lists nine dates where significant new laws or information
regarding legislation following the crisis was received by the market.
[Table 1 about here]
The sample is comprised of all firms in the CRSP database with SIC codes from Banks
(6020, 6021, 6022, 6029), Savings and Loans (6035, 6036), Insurance (6311-6399), and Real

18
Field Code Changed
Estate Investment Trusts (6798). A total of 330 Banks, 67 S&Ls, 105 Insurance companies and
100 REITs included results in a total sample of 602 firms. The event period begins on October,
10, 2007 and ends on May 20, 2009 (see Table 1) which is a period of 406 trading days. The
sample period extends 100 trading days prior to and after the event period. In order to be
included in the final sample, firms must be active for the entire sample period of 606 trading
days. Cross-sectional data for our firms is obtained from the Compustat database. Thirteen
firms do not have complete cross-sectional data and are omitted from the cross-sectional tests.
We collect return data for all firms in the appropriate SIC code from CRSP. Firms that do
not have return data for the entire sample period are removed. The firms with complete returns
make up the final sample list of firms for each category. Firms are designated as REIT, S&L,
Insurance, or Banking according to their SIC code in CRSP. Financial data are obtained from
Compustat for Insurance, REIT, and Savings and Loan firms. Banking financial data are
obtained from Compustat Bank Annual. For all firms, financial data is taken from the fiscal year
end up to, but not exceeding the month of September, 2007, since the first event date is October
10, 2007.
Panel A of Table 2 presents some descriptive statistics on key variables for our sample.
The average firm size is $ 39.8 million with an average trading volume of 94.3 million shares
outstanding. Average ROE is about 10.73 percent, average profit margin of 13.92 percent, and
average ROA is 1.8 percent for the sample of firms. The average debt ratio for the sample is
about 68 percent. Panel B of Table 2 gives details on the breakdown of firms. For the 593 firms
with cross-sectional data, the sample comprises of 323 commercial banks, 66 S&Ls, 104
insurance companies, and 100 REITs. 25 firms are incorporated overseas while 26 firms trade
on smaller exchanges (OtherOTC). 318 firms use a Big 8 Auditor, with 132 banks using a Big 8
19
Field Code Changed
firm. We report the descriptive statistics by sub-group in Panel C of Table 2. On average,
banks comprise the largest firms in terms of total assets ($60.57 million), while insurance firms
report the highest mean trading volume (162.3), followed by REITs (101.9). Insurance
companies report the highest ROA and ROE (3.91% and 13.89% respectively), while REITs
report the highest profit margin (18.85%). The highest debt ratios are found for banks (90.75%)
followed by S&Ls (86.75%).
[Table 2 about here]
4.2 Methodology
4.2.1 Announcement Effects and Risk Shifts
One of the difficulties with examining the effect of regulation is to select appropriate
dates for when value relevant information about the proposed regulations actually became
available. Despite the difficulty in pin-pointing exact value-relevant dates, we use most of the
dates based on recent literature on the financial crisis that may mark key developments of the
regulations such as dates when laws were enacted or proposed and significant
announcements/events by the SEC, Treasury or the Fed. The method of analysis is discussed in
Binder (1985a,b) and Boardman et al (1997). The model is suitable to a regulatory event that
includes multiple event dates. The model is used in a number of studies that have examined
wealth effects surrounding regulatory changes including Mitchell and Mulherin (1988),
Sundaram et al (1992) and Chhaochharia and Grinstein (2007). We employ the same procedure
using portfolios which also alleviates the problem of event day clustering. Specifically, our
model is as follows:

20
Field Code Changed
rj,t = aj + a’j DP + bj rmt + b’j D0 rmt + b’’j DP rmt + ∑ Ckj Dik + ejt
rjt =portfolio return for day t
aj = regression constant
a’j = shift in regression constant after the event period
rmt = S&P 500 Index return
bj = coefficient representing beta
b’j = coefficient representing a shift in beta during the event period
b’’j = coefficient representing a shift in beta after the event period
D0 = dummy variable equal to 1 during the event period
DP = dummy variable equal to 1 after event period
Dik = dummy variable equal to 1 on the day prior to and the day of event i
Ckj = coefficient of the information dummy variable k for portfolio j
ejt = error term for portfolio j.
The variable Dik is a dummy variable equal to 1 for each of the dates corresponding to our
events and the day prior to each event. Nine dichotomous variables, D1 through D9, are created
marking each of the event dates and the date just prior equal to one. An additional dichotomous
variable, D10, is equal to one for all the event dates and all the dates just prior to the event date.
D1 through D9 produces the cumulative abnormal return for each event date, while D10 returns
the coefficient representing a cumulative abnormal return for all the event dates combined.
Dummy variables are also created equal to one for the period from the first event to the last event
(DurDummy), and for the period immediately after the last event to the end of the sample period
(PostDummy). The model described above also specifies the systematic risk (beta) and shift in

21
Field Code Changed
beta during and after the event period via the dummy variable D0 and estimates the beta
coefficient for the pre and post event periods.
4.2.2 Cross-sectional analysis:
We next examine the impact of firm-specific characteristics on our full sample of firms
via the following model
𝐷10 = 𝛽� + 𝛽�𝑆𝑖𝑧𝑒� + 𝛽�𝐵𝑖𝑔8𝐴𝑢𝑑𝑖𝑡𝑜𝑟� + 𝛽�𝐷𝑒𝑏𝑡𝑅𝑎𝑡𝑖𝑜� + 𝛽�𝑂𝑡ℎ𝑒𝑟𝑂𝑇𝐶� + 𝛽�𝑅𝑂𝐸�+ 𝛽�𝑁𝑜𝑛𝑈𝑆� + 𝛽�𝐿𝑛𝑉𝑜𝑙𝑢𝑚𝑒 + 𝛽�𝑆𝑖𝑧𝑒 ∗ 𝑂𝑡ℎ𝑒𝑟𝑂𝑇𝐶 + 𝛽�𝐵𝑎𝑛𝑘� + 𝑢�
Research shows that the presence of a Big 8 accounting firm has a reputation effect. For
example, Michaely and Shaw (1995) find that in the IPO market, the market perceives IPOs that
are associated with more prestigious auditors (Big 8 firms) to be less risky, and that the long-run
performance of IPOs is related to the prestige of the auditor used. In his study of the East Asian
Crisis of 1997-1998, Mitton (2002) finds that significantly better stock price performance is
associated with firms that had indicators of higher disclosure quality, namely auditors from Big
Six accounting firms. Thus, we posit a positive relation between auditor reputation (Big 8
Auditor) and abnormal return. Research on bank size and efficiency shows that banks from
about $100 million to about $25 billion in size are the most efficient (Berger, 1999). However,
Fok, Chang and Lee (2004) argue that large banks’ have larger market shares and better access to
capital and information which should lead to greater profitability. Hence the relationship
between size and abnormal return may be ambiguous. Nevertheless, much of the political debate
during the financial crisis focused on the twin issues of “moral hazard” and “systemic risk”, and
Too-Big-To-Fail became a rallying cry for both proponents and critics of the various legislations.
We thus expect to see a positive relation between size and abnormal return for this crisis period.
22
Field Code Changed
Extant agency theoretic perspectives argue that debt can have a monitoring effect and hence
higher leverage may align managers to act in the interest of shareholders (Jensen and Meckling
(1976), Wiliams (1987) . Berger and Bonarccorsi di Patti (2006) argue that the choice of
leverage may be based on the efficient-risk hypothesis or the franchise value hypothesis as
follows. More efficient firms (higher profitability or ROE) choose higher leverage since the
higher efficiency reduces the costs of bankruptcy and, thus increased profitability (from
increased efficiency) protects the firms from future crisis. The franchise value hypothesis is more
in line with the reputational capital idea and argues that more efficient firms choose lower
leverage (and higher capital) to protect their franchise value (reputation) to avoid any possibility
of liquidation. Margaritis and Psillaki (2010) who test these hypotheses find that more leveraged
firms have higher abnormal returns. Given the nature of the crisis and the bail outs that ensued
we predict a positive coefficient for more leveraged firms and a positive coefficient for Return
on Equity (ROE). We also predict a positive sign for non-U.S. firms as we expect that these
firms are somewhat sheltered from the impact of the regulations.
We also expect a positive coefficient on trading volume, as research shows that volume
increases due to informed trading. Research also discusses the role of trading volume as an
information variable and indicates a positive relationship between returns and trading volume
(Karpoff (1987), Stickel and Verrachhia, (1994), Brailsford (1996) and Lee and Rui (2002)).
Campbell, Grossman and Wang (1993) note that volume tends to be higher when stock prices are
increasing than when prices are falling. We predict a negative coefficient for firms that trade on
smaller exchanges (OtherOTC), and we also interact size and OtherOTC and posit that abnormal
performance is negatively related to larger firms that trade on smaller exchanges. Hegde, Lin and
Varshney (2008) find that NYSE spreads are smaller than NASDAQ (OTC) spreads and there

23
Field Code Changed
are a greater number of orders placed with NYSE. Besides, NYSE listed stocks can be traded on
other exchanges, while NASDAQ only began their dual listing program in 2004 that allows
companies to list on the NASDAQ in addition to the NYSE.
Finally, we estimate the model above for risk shifts in these financial services firms
during and after the event.
5. Results
5.1. Announcement Period Returns:
We begin our analysis by examining the overall results for all the regulations and present
the regression estimates of our model for each individual event in Table 3. Panel A presents the
results for all firms. We find negative and highly significant coefficients for the events D1, D3,
D7, D8, and D9 for our full sample of firms. Coefficients for D2 and D3 are also negative at the
10% and 5% level of significance. Only one event date, D5, is positive and highly significant.
Thus, our results for the full sample of banks show that the market views the announcements of
the various legislations as mostly negative events. We discuss the individual legislations and
their impact on the different industry groups in more detail below.
[Tables 3 and 3a about here]
Tables 3 and 3a also documents the regression estimates for the individual industry
groups. For the sub-sample of banks, events D1, D3, D4, D5, D6, D7, D8, and D9 have significant
coefficients, . With the exception of D1, which is marginally significant, the rest of the
coefficients for the banking sub-sample are highly significant at the 1% level. ; all of which
except for d1 are highly significant at the 1% level. The first event date, D1, in our timeline is
the October 10th, 2007 HOPE NOW initiative announced by then Treasury Secretary, Henry
24
Field Code Changed
Paulson along with Housing Secretary Jackson. The intent of HOPE NOW was to help
homeowners who may not be able to pay their mortgages. The alliance of credit and
homeowners’ counselors, mortgage services and mortgage providers was formed to explore
methods in which to reach at-reach homeowners, explain alternatives to at-risk borrowers, and to
develop standards for mortgage counseling for the same. However, this event results in a
marginally negative market reaction for the sub-sample of banks. It is to be noted that at this
time, there was just a hint of the financial crisis that was to unfold, and it seems that the market
did not want any regulatory interference at this time. While the HOPE NOW initiative had good
intentions to help mortgage owners, it seems that the market did not believe that this legislative
piece would be quite as beneficial to banks.
The next significant event date for banks, D3 (7/15/2008), signifies the passing of the
SEC emergency ban on the naked short-selling of Freddie Mac and Fannie Mae, along with other
extraordinary emergency measures including the public disclosure of short selling positions of
hedge funds and other institutional money managers. Because of the tenuous confidence in
financial companies at this time, the SEC also banned the naked short selling in the stock of 799
financial companies, in an attempt to curtail aggressive short selling of institutions which were
perceived to be especially fragile. While meant to boost the volatile markets during these
tumultuous times, this legislative announcement is again viewed negatively by the market as
evidenced by the negative and highly significant coefficient for the bank group. The next
negative events for banks are D6, D7, D8, and D9. The coefficients for these events are highly
significant at the 1% level. D6 (2/10/2009) marks the passage of the Financial Stability Act,
creating the Public-Private Investment fund, introduced by Treasury Secretary, Timothy
Geithner. Under this Act, the Treasury department, along with the FDIC and the Federal Reserve
25
Field Code Changed
Board, unveiled the Public-Private Investment Programs (PIPP) to buy troubled mortgage loans
and mortgage-backed securities from banks. D7 represents February 17th, 2009, the day that
marked the passing of the American Recovery and Reinvestment Act (ARRA), and D8 marks the
passing of the 3/25/09 legislation allowing troubled financial institutions to be put into
conservatorship or receivership by the U.S. Government. Finally, D9 marks the 5/20/09 Helping
Families Save their Homes legislation. The ARRA bill, also known as the Stimulus Act, was
one of the first major acts passed by President Obama and the new Democratic Congress.
ARRA was the focus of fierce partisan debates in Congress and ultimately passed the House with
no Republican votes and the Senate with merely three Republican votes. This massive economic
stimulus bill was estimated to cost $787 billion when it finally passed. All of these Acts were
the subject of bitter wrangling along party lines, and investors and the general public were also
suffering from legislative and “bail-out” fatigue by this time. There was also widespread
perception that this was mostly a “banking” crisis and it is not surprising to find significantly
negative coefficients for the sample of banks.
For banks, D4 and D5 are the only announcements which are met with a positive investor
reaction, at the 5% and 1% level respectively. D4 marks the passage of the Housing and
Economic Recovery Act (HERA). The intent of HERA was to address issues relating to the
mortgage market, specifically to the sub-prime crisis. Through HERA, the Federal Housing
Authority (FHA) was allowed to work with at risk borrowers to refinance into more affordable
government insured mortgages. HERA also injected capital into Fannie Mae and Freddie Mac
and led to government conservatorship of these two institutions. Given the major role of banks
in the sub-prime mortgage crisis, the positive market reaction to the passage of HERA is not
surprising for the banking industry sub-group. D5 marks 10/3/2008, the date when the

26
Field Code Changed
Emergency Economic Stabilization Act passed. Better known as TARP, this legislation created
the Troubled Assets Recovery Program, established to buy troubled assets from financial
institutions. Introduced in September, 2008 and signed by President Bush in October 2008,
TARP allowed the Treasury Department to spend up to $700 billion to purchase troubled assets
both domestically and internationally. At the time of the passage of TARP, the market was
reeling from the meltdown of Lehman Brothers. However, the initial attempt at passing TARP
failed, as the House rejected the first version of TARP on Monday, September 29th. Despite a
four-hour debate on TARP prior to the vote, the final vote of 228 to 205 against was 13 votes shy
of the 218 votes needed for the bill to pass. Stock markets reacted immediately to this and the
Dow Jones Industrial Average closed 778 points lower for the day. Leaders of both political
parties pleaded for the votes necessary for the bill to pass, and TARP finally passed on October
3rd, 2008, to the relief of investors and both political parties. It appears that the markets believed
that the passage of TARP would stem repercussions from the ongoing financial crisis. Our
results confirm this.
The banking group reports negative coefficients for six of the nine event dates, while
only two of the events have positive coefficients. The perception that this was very much a
“banking” crisis seems to be validated by the market reaction. We are not able to document a
significant abnormal reaction for only one date, the D2 (2/13/2008); the passing of the Economic
Stimulus Act. This Act passed by President Bush was treated as a catalyst to a weak economy
and largely included tax breaks for businesses and payments to select groups of low and middle
income individual tax payers who were expected to spend it on the economy and help revive it.
The market perception on the probability of the latter was mixed and hence D2 was not found
significant.
27
Field Code Changed
We next report the results for the sub-sample of S&Ls in Table 3. We find that market
reaction is much more muted for this group of firms, and only one event, D3, is strongly
negative. As mentioned earlier, D3 marks the date when the SEC announced stringent
restrictions in the short-selling of financial company stocks. Similar to the sample of banks, we
find that D5, the passing of TARP is viewed as good news by the market, albeit at the 10% level,
as is the event D6. As noted in Section 2.1, large thrifts such as Countrywide, FSB and
Wachovia, FSB were in trouble during the crisis and were merged into banks or were owned by
banks. Furthermore, over the 1998-2008 period a large number of S&Ls converted their charter
to banks (Wall Street Journal, 2009). Thus the market reaction to the regulations and the stimulus
may not distinctly be seen for the S&L group separately from the banks.
The results for Insurance Companies are reported next in Table 3a. We find significant
coefficients for two event dates: D2, D3, are viewed as negative events by investors (significant at
the 5% level). D2 marks the passage of the Economic Stimulus Act of 2008; one of the first of
several economic stimuli attempts to avert a recession and bolster the economy. As
aforementioned, the legislation provided business incentives and tax rebates for low and middle-
income taxpayers and market reaction toward it was perhaps just lukewarm consistent with our
findings. As mentioned earlier, D3 reflects the date of the SEC bank on short-selling of financial
company stock. Unlike the sample of banks, we find no significantly reaction to either the
passage of TARP or ARRA, two of the most controversial pieces of legislation during the crisis
period. As these two bills were largely for the benefit of banks, it appears that the market
perceives them as little benefit to insurance companies.
Finally, we report the reaction for REITs in Table 3a. The regression coefficients show
that five of the nine events results in a negative market reaction of REITs, namely D4, D5, D7,

28
Field Code Changed
D8, and D9. We find that all of these events are significant at the 1% level, except for D9, which
is significant at the 5% level. While it is not surprising to find negative coefficients for most of
these events, including D9; the passage of the very rancorous ARRA Economic Stimuli Bill, we
were not expecting a negative coefficient for D4 and D5. Page (2010, p 252) notes that a
substantial portion of HERA (D4) deals with helping families, to avoid foreclosure by providing
loans wherein lenders take deep discounts. The program was only for owner-occupants and not
investors and hence the market did not see this as beneficial for REITs. Similarly, Gaby and
Walker (2011, p. 76) discuss TARP (D5) as a program that was implemented to protect the US
and global banking systems during the crisis. We had mentioned earlier that the banking sub-
group reports a positive market reaction to D4, the passage of HERA, and to D5 (TARP). We
conjecture that investors in REITs were concerned that the federal aid packages were primarily
focused at helping banks at the expense of REIT investors.
In summary, we are unable to support Hypothesis H01 which posits no abnormal market
reaction for the announcement period returns. For the overall sample of firms, we find that eight
of the nine events have abnormal returns that are significantly different from zero. Three of the
sub-groups report more negative events than positive, and it appears that the markets do not
welcome legislations, despite the intent of these Acts to help the firms via economic stimuli.
Banks reports the most number of negative events (six), followed by REITs, which report five
negative events. Thus, it appears that the market is penalizing the two segments most closely
associated with the crisis – the banking industry and the real estate industry. The passage of
HERA, allowing for the government conservatorship of the mortgage finance giants, Freddie
Mac and Fannie Mae is viewed as a significantly positive event for banking firms and a negative
event for REITs. We find D3, the date the SEC announces a ban on short selling of financial

29
Field Code Changed
company stock is viewed negatively by our overall sample and by three of the four individual
industry sub-groups. Banks report only two positive events, while REITs, as a group, do not
report any significantly positive reaction to any of the legislations passed during this period.
We also report the F-tests for significance to examine difference in market reaction
among the four sub-industry groups in Table 3. A perusal of the F-test statistics shows that the
market reaction for each of the events D3 through D9 are significantly different for our four
groups. Thus, we do not find support for Hypothesis H02, which predicts that the abnormal
returns are not different among the four groups of firms.
5.2. Risk Shifts during and post crisis Hypothesis H03:
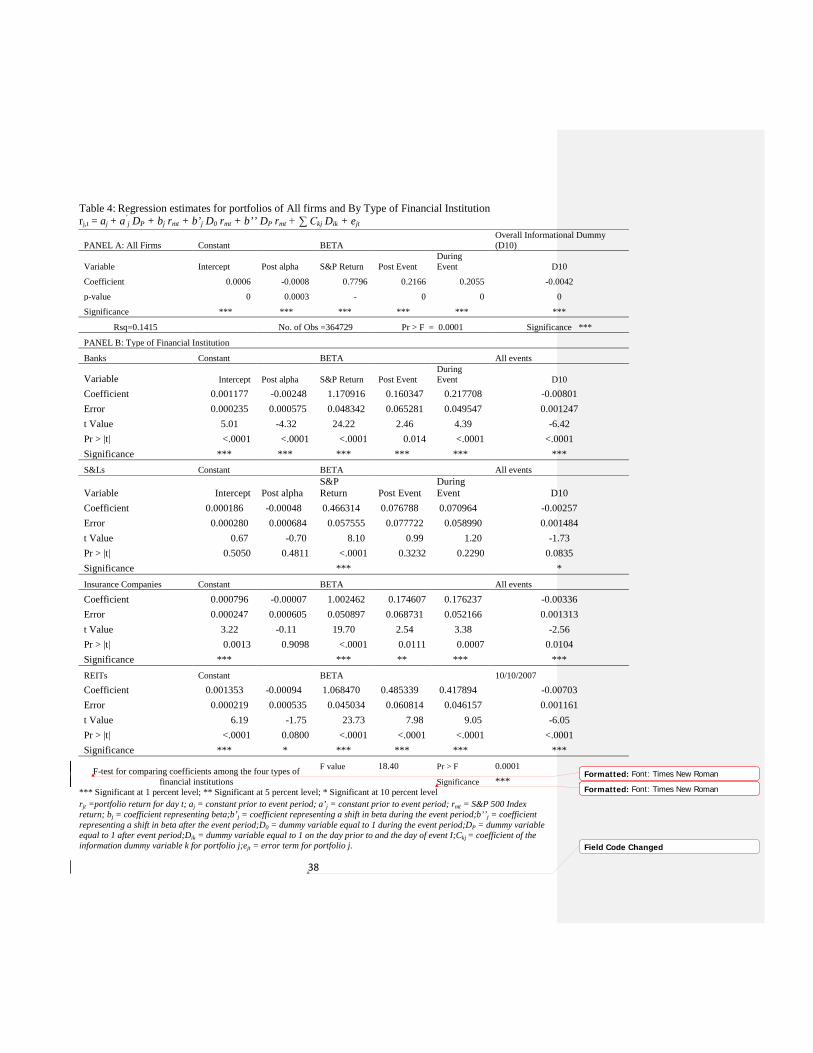
Table 4 reports the overall results for all events as measured by the variable D10 and also
the post-event shift in the alpha and beta for the entire sample, and for each group of firms.
[Table 4 about here]
Overall, the legislations passed during the financial crisis of 2008-2009 were viewed as bad news
by the market. An examination of the alpha (constant) shows that post-event alpha is negative
and highly significant for the full sample of 602 firms. Similarly, post-event beta shift is positive
and very significant for all firms. The pre-crisis beta for all firms is 0.7776, and beta increases
by 0.2055 during and by 0.2166 after the crisis. Thus, the cumulative effects of the legislative
actions are risk-increasing and value decreasing events for our sample. On the individual
industry group level, we find similar results for our sample of banks. The aggregate event
abnormal returns (D10) are negative and highly significant. The alpha for this group changes
from positive to negative and is highly significant. The beta increases during the event as does
the post-event beta, indicating that the legislations were not risk-reducing events for banks.
30
Field Code Changed
We find that the savings and loans, as a group, do not demonstrate much in terms of pre
and post-event shifts, and we find no significant change in alphas or betas, while the cumulative
event window return, D10, is negative and marginally significant. For the insurance industry, we
find a negative change in alpha after the financial crisis, while the cumulative abnormal return,
D10, is negative and highly significant. Examining the shift in beta, during and post-event shows
that the legislative actions ensuing from the crisis appear to be risk increasing events for this
industry. Finally, we find that for our sample of REITS, both during- and post-event beta
increases significantly, while post-event alpha decreases marginally. Once again, the aggregate
abnormal return during the crisis is negative and highly significant. Thus, we do not find support
for H03 and find significant differences in the risk shifts that are observed during and after the
financial market crisis.
5.3. Cross-sectional results
We report cross sectional results for our sample in Table 5. Panel A reports the results of
the coefficient estimates when D10 (cumulative abnormal return for all events) is the dependent
variable.
[ Table 5 about here]
We had hypothesized that firm size, auditor quality (Big 8 auditor), ROE, non-US firms, and
trading volume would be positively related to the abnormal return for the event windows. Our
cross-sectional results show that non-U.S. firms earn significantly higher abnormal returns (at the
1% level) over the crisis period. Our results do not show that firm size, auditor reputation, or
firm performance as measured by ROE impact the event period abnormal returns in any
significant manner. We had also predicted a positive relation between firm leverage and

31
Field Code Changed
abnormal return; but we do not find this for the sample. We find that firms with higher debt to
total assets ratio earn significantly lower abnormal returns (at the 1% level) in line with Berger
and Bonarccorsi di Patti’s (2006) franchise value argument that more efficient firms choose
lower leverage (higher capital) to protect their value and any hint of liquidation. We had also
posited that firms that trade on lesser exchanges (other OTC) will earn significantly lower
abnormal returns over the crisis legislative events; our results verify this prediction.
Although we had predicted a positive relation between trading volume and abnormal
return, our results document the opposite. Firms with higher trading volume earn significantly
lower abnormal returns over our event windows. We had also hypothesized that larger firms
which trade on smaller exchanges (size*non OTC) would earn significantly lower abnormal
returns. However, we report a positive coefficient for this interaction variable. It appears that
larger firms on the smaller exchanges are relatively sheltered from the effects of the crisis. Given
the fact that banks were at the nexus of this crisis, our hypothesis was that banks would
especially be hard hit during the crisis. The coefficient for our dummy variable, Bank, is
negative and significant at the 1% level, documenting that the banking firms in our sample
earned significantly lower abnormal returns over the crisis legislations.
Panel A of Table 6 reports the results for the cross-sectional determinants of risk shift
during (Beta Shift During Event) the period of the legislative announcements.
[Table 6 about here]
We had hypothesized a positive relation between size, debt to total assets, other OTC, banking
firms, and size*other OTC. We find that risk shift during the crisis period is very significantly
related to firm size, and bigger firms experience significantly higher increases in systematic risk,

32
Field Code Changed
as measured by the beta. We had also posited non-US firms and firms with higher trading
volume will be less risky. Our results show this to be true and we find that the change in
systematic risk during the event windows is significantly lower for non-U.S. firms (at the 1%
level) and for firms with higher trading volume (at the 5% level). We report the cross-sectional
impacts on risk shift after (Beta Shift Post Event) in Panel B of Table 6. Our results are similar
to those reported for the determinants of risk shift during the crisis; we find that larger firms
experience significantly higher increases in systematic risk, while non-U.S. firms and firms with
higher trading volume experience significantly lower shifts in beta. Our results do not find any
significant relation between auditor quality, firm leverage, other OTC, ROE and changes in
systematic risk. While we recognized earlier in Table 5 that banking firms earned significantly
lower abnormal returns during the event windows, our analysis of the shift in beta shows that
banking firms do not seem to be riskier than the other industry sub-groups.
6. Conclusion.
We examine the differential market reaction of financial services firms to a series of
regulatory events passed in response to the financial market crisis of 2007-2009. Using SUR
estimations, we examine market reaction separately for banks, S&Ls, insurance companies and
REITs for each of these events and also examine the aggregate market reaction. In addition, we
examine pre and post-event shifts in alphas and betas for the firms in our sample. We find that
on average, the event date market reaction is negative and significant for all firms in our sample
for seven of the nine legislative Acts. For the overall sample, we only find one date, October 3,
2008, passing of the TARP Act results in a positive market reaction. Parsing down by industry

33
Field Code Changed
sub-group, we find that crisis hits the banking industry the hardest; investor reaction for events
dates is negative for six out of the nine event dates for our sample of banks. Interestingly, we
find that the two event dates which result in positive market reaction for banks are met with the
opposite (negative) reaction for the sample of REITs. We conjecture that the investors in REITs
may fear that the economic stimuli aid packages benefit banks to the detriment of real estate
investors.
Our results also demonstrate a negative post-event shift in alpha for the firms in our
sample, along with an overall increased shift in beta. The aggregate event date abnormal returns,
D10, are significantly negative for our overall sample. Upon further parsing, we find that the
legislative acts are systematic risk increasing events for banks, insurance companies, and REITs.
Our cross-sectional analysis of the determinants of the abnormal returns for all event
windows shows that more banking firms, leveraged firms, and firms with higher trading volumes
earn significantly lower event period abnormal returns. We also find that non-U.S. firms appear
to be relatively sheltered from the impact of the legislative events, perhaps due to diversification.
Turning to the determinants of systematic risk shifts during- and post-crisis, we document that
larger firms experience significantly higher increases in beta, while non-U.S. firms and firms
with higher trading volumes report lower changes in systematic risk.
The implications of our study are as follows. As newer policies and regulations are being
deliberated about twin issues of moral hazard and systemic risk and the efficacy of TARP and
other legislative moves questioned, out study provides evidence of market reaction to such public
policy changes. As laws about capital requirements, especially for banks are being re-examined,
our study may point to evidence supporting the increased need for capital as a cushion especially
for banks and highly levered firms which clearly show increases in systematic risk.

34
Field Code Changed
Table1. Days of Significant news announcements regarding regulations surrounding the Financial Crisis
Event Number Event date and description D1 October 10, 2007 | Hope Now Press Release | Treasury Department Press Release
U.S. Treasury Secretary Paulson announces the HOPE NOW initiative, an alliance of investors, servicers, mortgage market participants, and credit and homeowners’ counselors encouraged by the Treasury Department and the Department of Housing and Urban Development
D2 February 13, 2008 | Public Law 110-185
President Bush signs the Economic Stimulus Act of 2008 (Public Law 110-185) into law.
D3 July 15, 2008 | SEC Press Release
The Securities Exchange Commission (SEC) issues an emergency order temporarily prohibiting naked short selling in the securities of Fannie Mae, Freddie Mac, and primary dealers at commercial and investment banks.
D4 July 30, 2008 | Public Law 110-289
President Bush signs into law the Housing and Economic Recovery Act of 2008 (Public Law 110-289), which, among other provisions, authorizes the Treasury to purchase GSE obligations and reforms the regulatory supervision of the GSEs under a new Federal Housing Finance Agency.
D5 October 3, 2008 | H.R. 1424 | Public Law 110-343
Congress passes and President Bush signs into law the Emergency Economic Stabilization Act of 2008 (Public Law 110-343), which establishes the $700 billion Troubled Asset Relief Program (TARP).
D6 February 10, 2009 | Treasury Department Press Release | Fact Sheet
U.S. Treasury Secretary Timothy Geithner announces a Financial Stability Plan involving Treasury purchases of convertible preferred stock in eligible banks, the creation of a Public-Private Investment Fund to acquire troubled loans and other assets from financial institutions, expansion of the Federal Reserve’s Term Asset-Backed Securities Loan Facility (TALF), and new initiatives to stem residential mortgage foreclosures and to support small business lending.
D7 February 17, 2009 | American Recovery and Reinvestment Act of 2009
President Obama signs into law the "American Recovery and Reinvestment Act of 2009", which includes a variety of spending measures and tax cuts intended to promote economic recovery.
D8 March 25, 2009 | Treasury Department Press Release | Draft Legislation
The U.S. Treasury Department proposes legislation that would grant the U.S. government authority to put certain financial institutions into conservatorship or receivership to avert systemic risks posed by the potential insolvency of a significant financial firm. The authority is modeled on the resolution authority that the FDIC has with respect to banks and that the Federal Housing Finance Agency has with regard to the GSEs. The authority would apply to non-bank financial institutions that have the potential to pose systemic risks to the economy but that are not currently subject to the resolution authority of the FDIC or the Federal Housing Finance Agency.
D9 May 20, 2009 | FDIC Press Release
President Obama signs the Helping Families Save Their Homes Act of 2009, which temporarily raises FDIC deposit insurance coverage from $100,000 per depositor to $250,000 per depositor. The new coverage at FDIC-insured institutions will expire on January 1, 2014, when the amount will return to its standard level of $100,000 per depositor for all account categories except IRAs and other certain retirement accounts. This action supersedes the October 3, 2008 changes.

35
Field Code Changed
Table 2. Sample Descriptive Statistics (As of October 2011) Panel A. Firm Characterisitics Variable N Mean Median Std. Dev Minimum Maximum Total Assets 593 39,837 1,747 202,208 18 1,965,159 Trading Volume 593 94,376 9,953 371,334 9 6,182,785 ROA 593 0.0180 0.0111 0.0246 -0.0936 0.1944 ROE 593 0.1073 0.1120 0.1476 -2.7586 1.0184 Profit Margin 593 0.1392 0.1340 0.1920 -3.0311 1.1753 Debt ratio 593 0.6818 0.8886 0.3392 0.0000 0.9801
Panel B. Number of Firms Variable Total Bank S&L Insurance REIT
Total Firms 593 323 66 104 100 Other OTC 26 19 5 1 1 Foreign Incorporated 25 24 0 1 0 Big 8 Auditor 318 132 14 94 78 Panel C. Banks Characteristics
Variable N Mean Median Std. Dev Minimum Maximum
Total Assets 323 60,570 1,644 264,554 117 1,965,159
Trading Volume 323 84,014 3,739 463,349 9 6,182,785
ROA 323 0.0099 0.0097 0.0050 -0.0237 0.0293
ROE 323 0.1146 0.1173 0.0584 -0.2263 0.2662
Profit Margin 323 0.1390 0.1396 0.0663 -0.4420 0.3336
Debt ratio 323 0.9075 0.9106 0.0284 0.7652 0.9801
Panel D. S&L Characteristics Total Assets 66 2,256 787 4,339 174 28,482
Trading Volume 66 26,560 1,175 90,056 26 581,568
ROA 66 0.0058 0.0058 0.0040 -0.0057 0.0143
ROE 66 0.0565 0.0497 0.0436 -0.0330 0.1907
Profit Margin 66 0.0912 0.0936 0.0625 -0.1039 0.1953
Debt ratio 66 0.8675 0.8822 0.0586 0.6645 0.9500
Panel D Insurance Characteristics Total Assets 104 34,207 4,322 112,299 114 979,414
Trading Volume 104 162,332 35,615 302,531 20 2,129,001
ROA 104 0.0391 0.0369 0.0287 -0.0487 0.1633
ROE 104 0.1389 0.1325 0.0898 -0.1337 0.7796
Profit Margin 104 0.1225 0.1083 0.0860 -0.0480 0.4384
Debt ratio 104 0.0544 0.0415 0.0604 0.0000 0.4921
Panel D REIT Characteristics Total Assets 100 3,530 2,032 4,566 18 30,716
Trading Volume 100 101,931 72,850 131,837 28 906,919
ROA 100 0.0306 0.0255 0.0415 -0.0936 0.1944
ROE 100 0.0848 0.1070 0.3257 -2.7586 1.0184
Profit Margin 100 0.1885 0.1848 0.4376 -3.0311 1.1753
Debt ratio 100 0.4824 0.4977 0.1914 0 0.8353

36
Field Code Changed
Table 3.: Regression estimates for portfolios of All firms and By Type of Financial Institution and by event
rj,t = aj + a’j DP + bj rmt + b’j D0 rmt + b’’ DP rmt + ∑ Ckj Dik + ejt
rjt =portfolio return for day t; aj = constant prior to event period; a’j = constant prior to event period; rmt = S&P 500 Index return; bj = coefficient representing beta;b’j = coefficient representing a shift in beta during the event period;b’’j = coefficient representing a shift in beta after the event period;D0 = dummy variable equal to 1 during the event period;DP = dummy variable equal to 1 after event period;Dik = dummy variable equal to 1 on the day prior to and the day of event I;Ckj = coefficient of the information dummy variable k for portfolio j;ejt = error term for portfolio j
Informational Dummy variables
All Firms Constant BETA 10/10/2007 2/13/200
8 7/15/200
8 7/30/200
8 10/3/200
8 2/10/200
9 2/17/200
9 3/25/200
9 5/20/2009
Variable Intercept Post alpha
S&P Return
Post Event
During Event D1 D2 D3 D4 D5 D6 D7 D8 D9
Coefficient 0.0006 -0.0008 0.7795 0.2167 0.2068 -0.004 -0.0025 -0.0166 -0.0029 0.0078 -0.0003 -0.008 -0.0039 -0.0074
p-value 0 0.0003 0 0 0 0.0053 0.0882 0 0.0445 0 0.8116 0 0.0071 0
Sig *** *** *** *** *** *** * *** ** ***
*** *** ***
Rsq 0.1419 N 364,729 Pr > F 0.0001 Significanc
e ***
Banks Constant BETA 10/10/2007 2/13/200
8 7/15/200
8 7/30/200
8 10/3/200
8 2/10/200
9 2/17/200
9 3/25/200
9 5/20/2009
Variable Intercept Post alpha
S&P Return
Post Event
During Event D1 D2 D3 D4 D5 D6 D7 D8 D9
Coefficient 0.0012 -0.0025 1.17 0.1613 0.2153 -0.0067 -0.0027 -0.029 0.0121 0.0173 -0.0149 -0.0138 -0.0114 -0.0232
Error 0.0002 0.0006 0.0483 0.0652 0.0495 0.0037 0.0037 0.0037 0.0037 0.0037 0.0037 0.0037 0.0037 0.003668
t Value 5.01 -4.33 24.21 2.47 4.35 -1.81 -0.74 -7.91 3.3 4.69 -4.05 -3.76 -3.1 -6.31
Pr > |t| <.0001 <.0001 <.0001 0.0134 <.0001 0.0698 0.4573 <.0001 0.001 <.0001 <.0001 0.0002 0.0019 <.0001
Sig *** *** *** *** *** *
*** *** *** *** *** *** ***
S&Ls Constant BETA 10/10/2007 2/13/200
8 7/15/200
8 7/30/200
8 10/3/200
8 2/10/200
9 2/17/200
9 3/25/200
9 5/20/2009
Variable Intercept Post alpha
S&P Return
Post Event
During Event D1 D2 D3 D4 D5 D6 D7 D8 D9
Coefficient 0.0002 -0.0005 0.4675 0.0756 0.0731 -0.0043 -0.0011 -0.0209 -0.005 0.0073 0.0075 -0.0015 -0.0022 -0.0028
Error 0.0003 0.0007 0.0576 0.0778 0.0591 0.0044 0.0044 0.0044 0.0044 0.0044 0.0044 0.0044 0.0044 0.0044
t Value 0.67 -0.71 8.11 0.97 1.24 -0.98 -0.24 -4.78 -1.13 1.66 1.71 -0.34 -0.5 -0.65
Pr > |t| 0.5004 0.4792 <.0001 0.3309 0.216 0.3293 0.8067 <.0001 0.2578 0.0974 0.0874 0.7339 0.6205 0.5171
Sig
***
***
* *

37
Field Code Changed
Table 3a: Regression estimates for portfolios of All firms and By Type of Financial Institution and by event
rj,t = aj + a’j DP + bj rmt + b’j D0 rmt + b’’ DP rmt + ∑ Ckj Dik + ejt
rjt =portfolio return for day t; aj = constant prior to event period; a’j = constant prior to event period; rmt = S&P 500 Index return; bj = coefficient representing beta;b’j = coefficient representing a shift in beta during the event period;b’’j = coefficient representing a shift in beta after the event period;D0 = dummy variable equal to 1 during the event period;DP = dummy variable equal to 1 after event period;Dik = dummy variable equal to 1 on the day prior to and the day of event I;Ckj = coefficient of the information dummy variable k for portfolio j;ejt = error term for portfolio j
Insurance Companies Constant BETA
10/10/2007
2/13/2008
7/15/2008
7/30/2008
10/3/2008
2/10/2009
2/17/2009
3/25/2009 5/20/2009
Variable Intercept Post alpha
S&P Return
Post Event
During Event D1 D2 D3 D4 D5 D6 D7 D8 D9
Coefficient 0.0008 -0.0001 1.003 0.174019 0.1791 -0.0042 -0.0095 -0.0075 -0.0042 0.0056 0.0034 -0.0045 -0.0027 -0.0063
Error 0.0002 0.0006 0.051 0.0688 0.0522 0.0039 0.0039 0.0039 0.0039 0.0039 0.0039 0.0039 0.0039 0.0039
t Value 3.23 -0.12 19.68 2.53 3.43 -1.09 -2.45 -1.95 -1.09 1.44 0.87 -1.17 -0.69 -1.64
Pr > |t| 0.0012 0.907 <.0001 0.0114 0.0006 0.2772 0.0141 0.0515 0.2736 0.1506 0.383 0.2433 0.4885 0.1018
Sig ***
*** ** ***
** **
REITs Constant BETA 10/10/200
7 2/13/200
8 7/15/200
8 7/30/200
8 10/3/200
8 2/10/200
9 2/17/200
9 3/25/200
9 5/20/2009
Variable Intercept Post alpha
S&P Return
Post Event
During Event D1 D2 D3 D4 D5 D6 D7 D8 D9
Coefficient 0.00135
3 -0.00094 1.065663 0.4881 0.4194 -0.00304 0.00057 -0.00359 -0.00947 -0.00926 0.001777 -0.01638 -0.01599 -0.00794
Error 0.00021
9 0.000535 0.045079 0.060841 0.046211 0.003426 0.003423 0.003423 0.003428 0.003432 0.003429 0.003432 0.003422 0.003421
t Value 6.18 -1.75 23.64 8.02 9.08 -0.89 0.17 -1.05 -2.76 -2.7 0.52 -4.77 -4.67 -2.32
Pr > |t| <.0001 0.0802 <.0001 <.0001 <.0001 0.3756 0.8679 0.294 0.0057 0.007 0.6043 <.0001 <.0001 0.0203
Sig *** * *** *** ***
*** ***
*** *** **
F test for comparing coefficients among the four types of financial institutions
F value 1.32 1.64 20.9 5.95 9.22 5.57 8.32 7.1 10.82
Pr > F 0.261 0.1622 0.0001 0.0001 0.0001 0.0002 0.0001 0.0001 0.0001
Sig
*** *** *** *** *** *** ***
38
Field Code Changed
Table 4: Regression estimates for portfolios of All firms and By Type of Financial Institution rj,t = aj + a’
j DP + bj rmt + b’j D0 rmt + b’’ DP rmt + ∑ Ckj Dik + ejt
PANEL A: All Firms Constant BETA Overall Informational Dummy (D10)
Variable Intercept Post alpha S&P Return Post Event During Event D10
Coefficient 0.0006 -0.0008 0.7796 0.2166 0.2055 -0.0042
p-value 0 0.0003 - 0 0 0
Significance *** *** *** *** *** ***
Rsq=0.1415 No. of Obs =364729 Pr > F = 0.0001 Significance ***
PANEL B: Type of Financial Institution
Banks Constant BETA All events
Variable Intercept Post alpha S&P Return Post Event During Event D10
Coefficient 0.001177 -0.00248 1.170916 0.160347 0.217708 -0.00801 Error 0.000235 0.000575 0.048342 0.065281 0.049547 0.001247 t Value 5.01 -4.32 24.22 2.46 4.39 -6.42 Pr > |t| <.0001 <.0001 <.0001 0.014 <.0001 <.0001 Significance *** *** *** *** *** *** S&Ls Constant BETA All events
Variable Intercept Post alpha S&P Return Post Event
During Event D10
Coefficient 0.000186 -0.00048 0.466314 0.076788 0.070964 -0.00257 Error 0.000280 0.000684 0.057555 0.077722 0.058990 0.001484 t Value 0.67 -0.70 8.10 0.99 1.20 -1.73 Pr > |t| 0.5050 0.4811 <.0001 0.3232 0.2290 0.0835 Significance *** * Insurance Companies Constant BETA All events
Coefficient 0.000796 -0.00007 1.002462 0.174607 0.176237 -0.00336 Error 0.000247 0.000605 0.050897 0.068731 0.052166 0.001313 t Value 3.22 -0.11 19.70 2.54 3.38 -2.56 Pr > |t| 0.0013 0.9098 <.0001 0.0111 0.0007 0.0104 Significance *** *** ** *** *** REITs Constant BETA 10/10/2007 Coefficient 0.001353 -0.00094 1.068470 0.485339 0.417894 -0.00703 Error 0.000219 0.000535 0.045034 0.060814 0.046157 0.001161 t Value 6.19 -1.75 23.73 7.98 9.05 -6.05 Pr > |t| <.0001 0.0800 <.0001 <.0001 <.0001 <.0001 Significance *** * *** *** *** ***
F-test for comparing coefficients among the four types of financial institutions
F value 18.40 Pr > F 0.0001
Significance ***
*** Significant at 1 percent level; ** Significant at 5 percent level; * Significant at 10 percent level rjt =portfolio return for day t; aj = constant prior to event period; a’j = constant prior to event period; rmt = S&P 500 Index return; bj = coefficient representing beta;b’j = coefficient representing a shift in beta during the event period;b’’j = coefficient representing a shift in beta after the event period;D0 = dummy variable equal to 1 during the event period;DP = dummy variable equal to 1 after event period;Dik = dummy variable equal to 1 on the day prior to and the day of event I;Ckj = coefficient of the information dummy variable k for portfolio j;ejt = error term for portfolio j.
Formatted: Font: Times New Roman
Formatted: Font: Times New Roman

39
Field Code Changed
Table 5: Cross-Sectional regressions of determinants of abnormal returns
𝐷10 = 𝛽� + 𝛽�𝑆𝑖𝑧𝑒� + 𝛽�𝐵𝑖𝑔8𝐴𝑢𝑑𝑖𝑡𝑜𝑟� + 𝛽�𝐷𝑒𝑏𝑡𝑅𝑎𝑡𝑖𝑜� + 𝛽�𝑂𝑡ℎ𝑒𝑟𝑂𝑇𝐶� + 𝛽�𝑅𝑂𝐸�+ 𝛽�𝑁𝑜𝑛𝑈𝑆� + 𝛽�𝐿𝑛𝑉𝑜𝑙𝑢𝑚𝑒 + 𝛽�𝑆𝑖𝑧𝑒 ∗ 𝑂𝑡ℎ𝑒𝑟𝑂𝑇𝐶 + 𝛽�𝐵𝑎𝑛𝑘� + 𝑢�
Dependent Variable: All event abnormal returns (D10)
Independent Variable Coefficient Standard Error t Value Pr > |t| Significance Intercept 0.00610 0.00199 3.07 0.0023 *** Size -0.00013833 0.00034959 -0.40 0.6925
Big8 -0.00082759 0.00098998 -0.84 0.4035 Debt to
Assets -0.00606 0.00237 -2.56 0.0108 *** Other OTC -0.04515 0.01145 -3.94 <.0001 *** ROE 0.00141 0.00261 0.54 0.5888
Banker -0.00373 0.00090257 -4.13 <.0001 *** Non US 0.00546 0.00214 2.55 0.011 *** Lnvol -0.00077469 0.00025161 -3.08 0.0022 *** Size_otc 0.00648 0.00156 4.15 <.0001 *** Rsq Adj R-Sq F-Value Pr > F Significance 0.0968 0.0829 6.95 <.0001 ***
*** Significant at 1 percent level; ** Significant at 5 percent level; * Significant at 10 percent level LnSize is Size of the Financial Institution; Big 8 Auditor is a proxy for auditor quality to see if the Financial institution uses a Big 8 Auditor or not; Debt to Total Assets ratio represents the debt ratio of the firm; Other OTC is if the firm is traded in any of the lesser exchanges, ROE is the Return on equity Non US is if the firm is a Non US firm or not; LnVol is trading volume; Size_OTC is an interaction variable to examine smaller firms that trade in small exchanges; Banker is if the firm is a bank or not.

40
Field Code Changed
Table 6: Cross-sectional determinants of risk shift
Beta shift (during/post)= 𝛽� + 𝛽�𝑆𝑖𝑧𝑒� + 𝛽�𝐵𝑖𝑔8𝐴𝑢𝑑𝑖𝑡𝑜𝑟� + 𝛽�𝐷𝑒𝑏𝑡𝑅𝑎𝑡𝑖𝑜� + 𝛽�𝑂𝑡ℎ𝑒𝑟𝑂𝑇𝐶� +𝛽�𝑅𝑂𝐸� + 𝛽�𝑁𝑜𝑛𝑈𝑆� + 𝛽�𝑇𝑟𝑎𝑑𝑖𝑛𝑔𝑉𝑜𝑙𝑢𝑚𝑒 + 𝛽�𝑆𝑖𝑧 ∗ 𝑂𝑡ℎ𝑒𝑟𝑂𝑇𝐶 + 𝛽�𝐵𝑎𝑛𝑘� + 𝑢�
Dependent Variable: Panel A: Beta Shift During Event Panel B: Beta Shift Post Event
Independent Variable Coefficient
p-value Significance Coefficient
p-value Significance
Intercept -0.37087 0.0019 *** -0.36145 0.0369 ** Size 0.10125 <.0001 *** 0.08229 0.0211 ** Big 8 Auditor -0.03326 0.5293 -0.03766 0.6252 Debt to Total Assets 0.04274 0.8995 0.27343 0.5794 OtherOTC -0.52205 0.3222 -0.50693 0.5096 ROE -0.53378 0.1906 -0.15615 0.7927 NonUS -0.39082 0.0003 *** -0.51815 0.001 *** LnVol -0.02898 0.0565 * -0.0155 0.4834 size_otc 0.08115 0.26 0.06255 0.5513 Bank 0.08415 0.1569 0.07704 0.3738 Rsq=0.0518 Rsq=0.0179
*** Significant at 1 percent level; ** Significant at 5 percent level; * Significant at 10 percent level Size of the Financial Institution is captured using LnAssets; Big 8 Auditor is a proxy for auditor quality to see if the Financial institution uses a Big 8 Auditor or not; Debt to Total Assets ratio represents the debt ratio of the firm; Other OTC is if the firm is traded in any of the smaller exchanges, ROE is the Return on equity Non US is if the firm is a Non US firm or not; Ln Vol is the Trading Volume; Size_OTC is an interaction variable to examine smaller firms that trade in small exchanges; Bank is if the firm is a bank or not.

41
Field Code Changed
References:
Basse, Tobias, Meik. Friedrich and Eduardo Vazquez.Bea, 2009. REITs and the Financial Crisis: Empirical Evidence from the US, International Journal of Business and Management, Nov, 4 (11), 3-10.
Berger, Allen.N., and Bonaccorsi di Patti, E., 2006. Capital structure and firm performance: a new approach to testing agency theory and an application to the banking industry. Journal of Banking and Finance 30, 1065–1102.
Binder, J.J., 1985a. On the use of multivariate regression model in event studies, Journal of Accounting Research, 23, 370-383. Binder, J.J., 1985b. Measuring the effects of regulation with stock price data, Rand Journal of Economics, 16, 167-183. Boardman, A., Vertinsly, I., Whistler, D., 1997. Using information diffusion model to estimate the impacts of regulatory events on publicly traded firms, Journal of Public Economics, 63, 283-300. Brailsford T.J., 1996. The empirical relationship between trading volume, returns and volatility, Accounting and Finance,35 (1), 89-111 Brunnermeier, M.K. 2009. Deciphering the liquidity and credit crunch 2007-08. Journal of Economic Perspectives, 23, pp.77-100. Campbell, John Y., Grossman, Sanford J. and Jiang Wang, 1993. Trading volume and serial correlation in stock returns. The Quarterly Journal of Economics, November 1993, 905-939 Chhaochharia, V., Grinstein, Y., 2007. Corporate governance and firm value—the impact of the 2002 governance rules. Journal of Finance, 62 (4), 1789-1825. Cornett, M.H. and H. Tehranian, 1989. Stock market reaction to the Depository Institutions Deregulation and Monetary Control Act of 1980, Journal of Banking and Finance, 13, 81-100. Cornett, M.H. and H. Tehranian, 1990. An examination of the impact of the Garn St. Germain Depository Institutions Act of 1982 on commercial banks and Savings and Loans, Journal of Finance, 45, 95-111. Donelson, Dain C. & David Zaring, 2009.Charter Switching and the Financial Crisis: Evidence from the Office of Thrift Supervision, Paper for Illinois Corporate Law Colloquium, October 13. Dwyer, Gerald P., 2009. What is systemic risk, anyway?, Macro blog by the Atlanta Federal Reserve, http://macroblog.typepad.com/macroblog/2009/11/what-is-systemic-risk-anyway.html

42
Field Code Changed
Ernst and Young, 2010. Against all odds: Global Real Estate Investment Trust Report, http://www.ey.com/Publication/vwLUAssets/Global-REIT-report-2010-Against-all-odds/$FILE/Global_REIT_report_2010_Against_all_odds.pdf Fama E.F., and French K.R, 1993. Common risk factors in the returns on stocks and bonds, Journal of Financial Economics, 33, 3-56. Fortin, Rich, Goldberg, Gerson M., and Greg Roth, 2010. Bank risk taking at the onset of the current banking crisis. Financial Review, 45, 891-913. Frieden, Jeffry A., 2009. Global Imbalances, National Rebalancing, and the Political Economy of Recovery, Center for Geoeconomic Studies and International Institutions and Global Governance Program, Working paper. Gaby, Max and David A. Walker, 2011. Impacts of TARP on Financial Institutions, Journal of Applied Finance, Vol 21 (2), 73-87. Gilberto, S.M., 1990. Equity real estate investment trusts and real estate returns, Journal of Real Estate Research, 5, 259-264. Glascock, J.L., Lu. C. and R.W. So, 2000. Further evidence on the integration of REIT, bond and stock returns, Journal of Real Estate Finance and Economics, 20, 177-194. Grant , Edward B., 1980. Market Implications of Differential Amounts of Interim Information, Journal of Accounting Research, 18 (1), Spring.
Griffiths, Mark D., Kotomin, Vladimir, and Drew Winters, 2011. The Fed and the 2007-2009 financial crisis. Treating a virus with an antibiotic? Evidence from the commercial paper market. Financial Review, 46 541-547.
He, L.T., 2000. Casual relationships between apartment REIT stock returns and unsecuritized real estate, Journal of Real Estate Portfolio Management, 6, 365-372. Hegde, Shantaram, Lin, Hao and Sanjay Varshney, 2008. Competitive Stock Markets: Evidence from Nasdaq Dual Listing, working paper, http://69.175.2.130/~finman/Reno/Papers/DualListing.pdf Jensen, M.C., and W. Meckling, 1976. Theory of the Firm: Managerial Behavior, Agency Costs, and Capital Structure, Journal of Financial Economics, 3, 305-360. Karpoff, Johnathan, M., 1987. The Relation between Price Changes and Trading Volume: A Survey, Journal of Financial and Quantitative Analysis, 22,109-126.
Kauffman, George, G., 2010. The Financial Turmoil of 2007-09: Sinners and Their Sins, Network Policy Brief, Indiana University, http://ssrn.com/abstract=1577264
43
Field Code Changed
Kaufman, George G., and Kenneth E. Scott. 2003. What is Systemic Risk, and Do Bank Regulators Retard or Contribute to It? Independent Review 7 (Winter),. 371-91.
Lee B-S, Rui OM, 2002. The dynamic relationship between stock returns and trading volume: Domestic and cross-country evidence, Journal of Banking and Finance, 26 (1): 51-78
Loomis, Carol J., 2009. AIG: The company that came to dinner, Fortune, Vol. 159, NO. 1 - January 19.
Madura, J., and M.K. Wiley, 2000. The impact of the Financial Insitutions Reform, Recovery and Enforcement Act on the risk of savings institutions, The Financial Review, 35, 145-168. Margaritis, D., and Psillaki, M., 2010. Capital Structure, equity ownership, and firm performance. Journal of Banking and Finance 34, 621-632. McCoy, Patricia, 2009. Prepared Statement of Patricia A. McCoy Before the U.S. Senate Committee on Banking, Housing, and Urban Affairs, Hearing on 'Consumer Protections in Financial Services,' http://papers.ssrn.com/sol3/papers.cfm?abstract_id=1367977 Michaely, R. and Shaw, W., 1995. Does the choice of auditor convey quality in an initial public offering? Financial Management 24(4), 15-30.
Mitchell, M.L., Mulherin, J.H., 1988. Finessing the political system: The cigarette advertising ban. Southern Economic Journal, 54, 855–862. Mitton, T., 2002. A cross-firm analysis of the impact of corporate governance on the East Asian financial crisis. Journal of Financial Economics 64(2), 215-241.
Myers, Stewart C., and Raghuram G. Rajan, 1998, The Paradox of Liquidity, The Quarterly Journal of Economics, Vol 113 (3), 733-771. Naceur, S. B and M. Omran, 2010. The Effects of Bank Regulations, Competition, and Financial Reforms on Banks’ Performance, IMF working paper.
Nanto, Dick, K., 2009. The Global Financial Crisis: Analysis and Policy Implications, Congressional Research Service Report, RL34742, October 2nd.
New York Times, 2010, Banks Likely to Offset Impact of New Law, Analysts Say, Christine Hauser, June 25.
Nishigake, H., 2007. An analysis of the relationship between US REIT returns, Economics Bulletin, 13, 1-7. Page, Evans, 2010. Federal housing help falls short: the Housing and Economic Recovery Act of 2008, Loyola Consumer Law Review, Vol. 21:2, 249-267. Pagliari, J.L. and J.R. Webb, 1995. A fundamental examination of securitized and unsecuritizeed real estate, Journal of Real Estate Research, 10, 381-426.
44
Field Code Changed
Peltzman, S., 1976, Toward a more general theory of regulation, The Journal of Law and Economics, 19, 211-241.
Rajan, Raghuram G., 2005. Has Financial Development Made the World Riskier? NBER Working Paper No. 11728. Also in Proceedings, Federal Reserve Bank of Kansas City, issue Aug, pages 313-369. http://www.kc.frb.org/publicat/sympos/2005/PDF/Rajan2005.pdf
Robert DeYoung and Tara Rice , 2004a, How do banks make money? The fallacies of fee income, Federal Reserve Bank of Chicago. Economic Perspectives, Fourth Quarter 34–51,
Robert DeYoung and Tara Rice , 2004b How do banks make money? A variety of business strategies, Federal Reserve Bank of Chicago. Economic Perspectives, Fourth Quarter 52–67
Schich, Sebastian, 2009. Insurance Companies and the Financial Crisis, OECD Journal: Financial market trends ,Vol 2., ISSN 1995-2864. Schwert, G.W., 1981. Using financial data to measure effects of regulation, The Journal of Law and Economics, 25, 121-158 Semaan, E. and P. Drake, 2011. Deregulation and Risk, Financial Management, Summer 2011.
Stickel. S, and Verrecchia, R., 1994. Evidence that volume supports price changes. Financial Analysts Journal, 57-67.
Stigler, G.J., 1971. Theory of Economic Regulation, Bell Journal of Economics and Management Science, 2, 3-21. Stiroh K.J. and Rumbel, A., 2006. The dark side of diversification: the case of U.S. financial holding companies, Journal of Banking and Finance, August, 30 (8), 2131-2161. Stiroh K.J., 2006. New evidence on the determinants of bank risk, Journal of Financial Services Research, 30, 237-263. Sundaram, S., N. Rangan and W.N. Davidson III., 1992. The market Valuation Effects of the Financial Institutions Reform, Recovery and Enforcement Act of 1989, Journal of Banking and Finance, 16, 1097-1122. Udell, Gregory, F., 2009. Wall Street, Main Street, and a credit crunch: Thoughts on the current financial crisis, Business Horizons, 52, 117—125
Wall Street Journal, 2009. US Thrift Charter May Be Hard To Kill
Williams, J., 1987. “Perquisites, Risk, and Capital Structure,” Journal of Finance, 42: 29-49.
Wilmarth, Jr., Arthur E., 2009. The Dark Side of Universal Banking: Financial Conglomerates and the Origins of the Subprime Financial Crisis, Connecticut Law Review, Vol. 41, No. 4. Also available at http://ssrn.com/abstract=1403973
Formatted: Font: (Default) Times New Roman