Embed Size (px)
Citation preview
1
1
2
The Impact of Recent Heat Waves on Human Health in 3
California 4
5
6
7
Kristen Guirguis1, Alexander Gershunov1, Alexander Tardy2 and Rupa Basu3 8
9
1Scripps Institution of Oceanography, University of California San Diego 10
2NOAA, National Weather Service, San Diego 11
3California Environmental Protection Agency, Office of Environmental Health Hazard 12
Assessment 13
14
15
16
17
18
Corresponding Author: 19
Guirguis, Scripps Institution of Oceanography, University of California, San Diego, 9500 20
Gilman Drive, La Jolla, CA 92093, Mail Code: 0224, 21
Email: [email protected]. 22
23
2
Abstract This study examines the health impacts of recent heat waves statewide and 24
for six subregions of California: the north and south coasts, Central Valley, Mojave, 25
southern deserts, and northern forests. Using Canonical Correlation Analysis applied to 26
daily maximum temperatures and morbidity data in the form of unscheduled 27
hospitalizations from 1999 to 2009, we identified 19 heat waves spanning 3-15 days in 28
duration that had a significant impact on health. On average, hospital admissions were 29
found to increase by 7% on the peak heat wave day, with a significant impact seen for 30
several disease categories including cardiovascular disease, respiratory disease, 31
dehydration, acute renal failure, heat illness and mental health. Statewide, there were 32
11,000 excess hospitalizations due to extreme heat over the period, yet the majority of 33
impactful events were not accompanied by a heat advisory or warning from the National 34
Weather Service. Regionally, the strongest health impacts are seen in the Central Valley 35
and the north and south coasts. The north coast contributes disproportionately to the 36
statewide health impact during heat waves with a 10.5% increase in daily morbidity at 37
heat wave peak, compared to 8.1% for the Central Valley and 5.6% for the south coast. 38
The temperature threshold at which an impact is seen varies by subregion and timing 39
within the season. These results suggest heat warning criteria should consider local 40
percentile thresholds to account for acclimation to local climatology as well as the 41
seasonal timing of a forecasted heat wave. 42
43
44
45
46
3
1. Introduction 47
The devastating effects of extreme heat events have been seen in recent years. The 48
2003 European heat wave and the 2010 Russian heat wave each resulted in tens-of-49
thousands of deaths (Agence Frence-Presse 2010, Robine et al. 2007) and the 2006 50
California heat wave killed more than 600 (Trent et al. 2006; Ostro et al. 2009) and 51
resulted in over 16,000 excess hospital emergency department visits (Knowlton et al. 52
2009). Adding to the tragedy of these losses is the fact that most heat-related deaths are 53
preventable with adequate warning tools and effective emergency planning. Since 54
climate change has the potential to increase the frequency of these types of events (Meehl 55
and Tebaldi 2004; IPCC 2007, 2012), improved heat warning systems are urgently 56
needed. This would require a better knowledge of the full impact of extreme heat on 57
morbidity and mortality. 58
California has unique challenges for heat wave preparedness owing to its diversity 59
of population and climate zones. Some residents live in desert conditions just inland of 60
coastal populations who are used to relatively mild temperatures. Additionally, many 61
residents lack air conditioning, especially along the coast, making them particularly 62
vulnerable during extreme heat events (Sailor and Pavlova 2003; Reid et al. 2009). This 63
vulnerability was apparent during the 2006 California heat wave that affected most of the 64
state. Health impact studies of that heat wave showed that while temperatures were hotter 65
inland, the health impacts were stronger along the coast (Knowlton et al. 2009; 66
Gershunov et al. 2011). The 2006 heat wave was unusually humid and nighttime 67
temperatures were unprecedented, therefore the nighttime recovery, typical for 68
California, was stifled. Recent work shows a clear trend in humid heat waves in the 69

4
Western US with a disproportionate increase in nighttime temperatures (Gershunov et al. 70
2009; Bumbaco et al. 2013). In fact, California coastal communities are becoming 71
increasingly susceptible to mid-summer, humid heat waves to which they are not 72
accustomed (Gershunov and Guirguis 2012, hereinafter GG2012). Thus, coastal 73
populations may be at a higher risk for heat-related illness in the short- and long-term 74
future, since they are neither physiologically nor technologically acclimatized to this type 75
of heat. 76
California heat alert criteria relies on the Heat Index, which is based on empirical 77
relationships between temperature/humidity thresholds and mortality in a few major US 78
cities. However, the National Heat Index threshold of 105 used by the National Weather 79
Service (NWS) to issue a heat warning does not work well in California. Desert 80
communities regularly exceed this threshold, but residents are well adapted to extreme 81
heat. Coastal communities rarely exceed this threshold but are much more vulnerable to 82
heat illness because they are accustomed to much milder conditions. For effective 83
weather warnings, events posing a danger to health should be identified locally with 84
higher or lower thresholds directed at populations living in hotter or cooler climates, 85
respectively (Robinson 2001). Additionally, mortality only accounts for a small portion 86
of acute health effects so for effective preparedness, nonfatal illness should also be 87
considered. Local NWS offices typically modify the alert criteria to better suit California 88
conditions, but these decisions are put in place with only limited information about local 89
heat-health relationships. Such information would be highly beneficial for making 90
informed decisions about when to issue a warning, which could prevent heat-related 91
illnesses and save lives. 92

5
There have been many studies investigating the impacts of extreme heat on 93
human health (e.g. Basu and Samet 2002; Martiello and Giacchi 2010). However, most 94
of this work has focused on health impacts related to daily ambient apparent temperatures 95
observed throughout the summer (e.g. Basu et al. 2009; Basu et al. 2012) with much less 96
attention given to health outcomes from one heat wave to another. Health impact studies 97
of heat waves (multiple days of hot weather) have primarily focused on a few notorious 98
heat waves such as Chicago 1995 (e.g. Kaiser et al. 2007), Europe 2003 (e.g. Le Terte et 99
al. 2006), or California 2006 (e.g. Knowlton et al. 2009). Long-term heat wave studies 100
require some definition of a heat wave, and there is no universal definition. Usually heat 101
waves are defined by magnitude as days exceeding a set temperature or percentile 102
threshold and may also include a duration requirement (e.g. Hajat et al. 2006; 103
Mastrangelo et al. 2007; Son et al. 2012; Vaneckova and Bambrick 2013) or by synoptic 104
weather type (e.g. Sheridan et al. 2012; Sheridan and Kalkstein 2010; Vaneckova et al. 105
2008) and the heat-health impact is subsequently quantified. Our methodology takes a 106
new approach by using health and meteorology data simultaneously to identify dangerous 107
historical heat waves occurring in California between 1999 and 2009. The advantage is 108
we make no a priori assumption about the kinds of conditions affecting human health. 109
This leaves open the possibility of detecting a health impact during events that might not 110
typically be considered extreme. Coastal communities who are not well acclimated to 111
heat, for example, may be adversely impacted during a heat wave at lower temperatures 112
than inland communities. 113
In addition to statewide impacts, this study also investigates regional impacts 114
using six regions defined empirically based on heat wave expression over the State’s 115

6
complex geography. These are the north and south coasts, Central Valley, Mojave, 116
southern deserts, and northern forests. Heat risk warnings issued by the NWS during 117
specific heat waves are considered in the context of actual health risks as measured by 118
excess hospitalizations. Beyond improved understanding of the meteorological impacts 119
on heat illness, we aim for the results presented below to be practical and useful for 120
optimizing the effectiveness of regional heat warnings. 121
122
2. Data 123
a. Climate and Weather Data 124
The daily maximum temperatures (Tmax) are from Maurer et al. (2002), 125
comprised of daily station data interpolated onto a regular 12x12 km grid with 126
temperature lapsed to grid cell center elevations. The source station data are from the 127
National Climatic Data Center (NCDC) first-order Automated Surface Observing System 128
(ASOS) and cooperative observer (coop) summary of the day (NCDC 2003). Grid to 129
station differences would depend on location with larger differences seen in areas of 130
complex elevation or strong spatial temperature gradients over relatively short distances. 131
For example, the 1999-2009 summertime temperature record from the downtown San 132
Francisco coop station is approximately 0.13 °C warmer than that of its nearest grid cell. 133
This is because the grid cell represents temperatures over a larger area including parts 134
immediately on the coast. For this study, grid cells that were co-located with the zip-135
code level health data (described below) were averaged over six pre-defined California 136
subregions to give regional daily maximum temperatures from 1999-2009. These 137
subregions were defined empirically using Principal Components Analysis applied to 138

7
temperature data as described in GG2012. As a result of the regionalization, localities 139
grouped within a given region exhibit a similar temporal variability in heat wave activity. 140
These six regions are shown in Figure 2b. 141
Daily specific humidity (SH) data are from the North American Regional 142
Reanalysis (NARR, Messinger et al. 2006). The SH data were processed just as for 143
Tmax to give daily, regional averages of specific humidity. 144
145
b. Health Outcome Data 146
Data were compiled from the Office of Statewide Health Planning and 147
Development (OSHPD) Patient Discharge (PD) Data for the warm season (May-Sept) 148
spanning 1999-2009. These data were limited to only include hospitalizations at acute 149
care facilities that were designated as unscheduled, so they would represent a subset of 150
emergency department visits in which conditions were serious enough to require 151
hospitalizations. The data were aggregated to zip code level to protect patient privacy 152
and include zip code, date of hospital admission, day of week, and counts for each health 153
outcome category and stratification by age and race/ethnicity. The outcome categories 154
(Table 2) included all cardiovascular diseases and cardiovascular subcategories (ischemic 155
heart disease, acute myocardial infarction, cardiac dysrythmias, and essential 156
hypertension), all respiratory diseases, acute renal failure, mental health, dehydration, and 157
heat illness. We also considered “all causes” as an outcome category, which was taken as 158
the sum of all the outcome categories listed in Table 2. 159
For the purposes of this study, the PD data were aggregated regionally in the same 160
regions as for Tmax. The regional PD data were then filtered to remove periodic signals 161

8
and long-term trends. Because of annual variation in viral activity and other causes, 162
morbidity is higher in spring and fall than in mid-summer. This annual and semiannual 163
harmonic seasonal cycle was removed using least squares regression analysis. 164
Hospitalizations are notably lower on weekends and holidays. The weekly cycle was 165
removed by subtracting the long-term day-of-the-week average from each daily 166
admissions count, and the holiday effect was removed by subtracting the average holiday 167
admission count from each Memorial Day, Labor Day, or July 4th holiday. Very low 168
admissions also occurred on July 5th when the July 4th holiday occurred on a Sunday, 169
since most Americans would have received a work holiday on that Monday. During 170
those years, July 5th was treated as a holiday. Finally, any long-term trend in the data 171
was removed using locally weighted scatterplot smoothing (LOWESS, Cleveland 1979), 172
which fits a quadratic curve to the nearest 30% of data points. Figure 1 provides an 173
illustration of the filtering process for the Coastal North region. 174
175
c. Historical Heat Alert/Advisory Information 176
Historical information about heat advisories or alerts issued by the National 177
Weather Service (NWS) was obtained from NOAA’s Hierarchical Data Storage System 178
(HDSS) available at 179
http://hurricane.ncdc.noaa.gov/pls/plhas/HAS.FileAppSelect?datasetname=9957ANX for 180
the non-precipitation warnings, watches and advisories category, as well as other internal 181
NWS communication. 182
183
d. Historical Electrical Alert Information 184

9
Information on historical power alerts issued by the California Independent System 185
Operator (ISO) was obtained from the ISO Alert, Warning, and Emergency Records from 186
1998 available at 187
http://www.caiso.com/Documents/Alert_WarningandEmergenciesRecord.pdf. Local 188
utilities generally follow the ISO recommendations and issue their own alerts to promote 189
conservation. However, occasionally a local utility may issue an alert unaccompanied by 190
the ISO. For this research we only had access to those alerts issued by the California 191
ISO. 192
193
3. Methods 194
a. Canonical Correlation Analysis 195
This study uses Canonical Correlation Analyses (CCA) to identify space-time 196
patterns of heat wave expressions optimally related to morbidity. CCA is a multivariate 197
statistical approach used to linearly summarize information contained in the cross-198
correlation matrix between two sets of variables, in this case daily maximum 199
temperatures and morbidity as represented by hospitalizations. CCA transforms the 200
original data pairs (x and y) into new variables called canonical variates defined as 201
vm = amT x ' = am,i xi
'
i=1
I
! (1) 202
wm = bmT y ' = bm, j y j
'
j=1
J
! (2) 203
where x (Tmax) and y (PD) are the centered data vectors (standardized for this study), I is 204
the number of elements in x, J is the number of elements in y and m is the number of 205
pairs of canonical variates that can be obtained from the two datasets and is equal to the 206

10
lesser of I and J. Each canonical variable v and w is a linear combination of elements of 207
the respective data vectors, or in other words a weighted average with weights given by a 208
and b in the above equations (Wilks, 2006). Pairs of canonical variates are ordered 209
sequentially by the degree of correlation between v and w, such that the first pair (CC1) 210
exhibits the maximum canonical correlation. CCA was originally developed by Hotelling 211
(1935, 1936) to identify and quantify associations between two sets of variables and was 212
initially used in the social sciences. In climate prediction, CCA has been used to match 213
patterns in two fields of variables, typically with the intention to forecast one with the 214
other, i.e. the predicted with the predictor (Barnett and Preisendorfer 1987; Gershunov 215
and Cayan 2003; Alfaro et al. 2006). Here, we use CCA as a purely diagnostic tool to 216
identify periods in the recent historical record when daily maximum temperatures and 217
morbidity were strongly correlated. We have previously used CCA to identify heat and 218
humidity effects on county-level emergency department (ED) visits over California in a 219
limited ED data set spanning only one year (2006) and resolving the impacts of only one 220
heat wave (Gershunov et al. 2011). Here, the daily input Tmax (x’) and PD (y’) data 221
arrays span 11 years, are regionally averaged, as well as filtered and standardized to filter 222
out local noise and remove population density bias, while focusing on meteorologically 223
relevant regions. For the purposes of discussion, we refer to the first canonical variable v1 224
as CC1Tmax and the first canonical variable w1 as CC1Health (Figure 2a). These variables 225
represent the simultaneous pattern of strongest linear co-evolution of temperature and 226
hospitalizations throughout California (Figure 2b). Higher order canonical modes were 227
poorly related to temperatures and health. So, while they do explain some heat-health 228

11
covariability, we focus our analysis on the primary mode, which best represents the 229
spatial-temporal pattern of heat-related health outcomes in California. 230
In preliminary analyses we tested our methodology using daily minimum 231
temperatures (Tmin). However, the Tmax results were found to be more robust both in 232
terms of the correlation between the canonical variable and the source data (i.e. the 233
correlation between CC1 and x’) and the correlation between the two canonical variables 234
(i.e. u and w). Therefore the results using Tmax were superior in describing the heat-235
health relationship in California. This is likely because California experiences both dry 236
and humid heat waves and Tmax is elevated during both varieties while Tmin may not be 237
strongly elevated during dry events. 238
239
b. Identifying Heat-Health Events 240
We identified those heat waves in the 11-year record having an impact on human 241
health by looking for cases where three criteria were met: (1) canonical variables 242
CC1Tmax and CC1Health (Figure 2a) were significantly correlated (at the 95% level, r>0.51) 243
using a running 15-day window, (2) a strong temperature anomaly was observed as 244
represented by canonical variable CC1Tmax crossing a 1 SD threshold and (3) a strong 245
health anomaly was observed as represented by canonical variable CC1Health crossing a 1 246
SD threshold. To allow for some flexibility in timing, a heat-health event (HHE) is 247
defined to span the full duration of the heat anomaly from when it first becomes warm 248
(CC1Tmax is positive), peaks (at least once) and then drops back to normal again. The 249
health impact can occur at any point within this heat event, so would allow for lags in 250

12
response and additionally allows us to quantify the full health impact of an individual 251
heat wave. 252
253
4. Results 254
a. Heat-Health Events 255
Figure 2a shows the first pair of canonical variates CC1Tmax and CC1Health. These 256
time series are only moderately, yet significantly, correlated (r=0.3) over the 11-year 257
record signifying that, as expected, disease processes associated with heat are not the 258
main cause of morbidity. However, over shorter intervals the relationship between heat 259
and illness can become much stronger than the long-term average (Figure 3). For 260
example, using a 15-day running window, the correlation reaches 0.79 and 0.82 during 261
the July 2006 and 2003 heat waves, respectively. Figure 2b gives the homogeneous 262
correlation maps showing how well each of the input data vectors are represented by their 263
canonical variates. CC1Tmax best represents Tmax on the Coastal North (r=0.94) and also 264
does reasonably well in capturing Tmax variability on the Coastal South (r=0.62), Central 265
Valley (r=0.55) and Southern Deserts (r=0.51) while the Mojave and Northern Forests 266
are weighted less strongly (r=0.41 and r=0.40, respectively). A similar regional pattern is 267
observed for the health results although with generally weaker correlations. CC1Health 268
best represents hospitalizations in the Coastal North (r=0.82) followed by the Coastal 269
South (r=0.62) and Central Valley (r=0.54) while hospitalizations in the Southern 270
Deserts, Mojave and Northern Forests are not well represented by CC1Health (r<0.23). 271
The heavy weighting of the Coastal North in both CC1Tmax and CC1Health highlights the 272
sensitivity/vulnerability of this region’s population to extreme heat. This is a region 273
13
where summers are typically cool due to the proximity of cool coastal Pacific waters, 274
which is further enhanced by marine layer clouds. Coastal heat waves therefore do not 275
need to be as hot as those over the hotter and air-conditioned inland to come as a stark 276
contrast to typical conditions and catch residents unprepared. This result is consistent 277
with recent studies that considered the health impacts of the 2006 heat wave, and also 278
found an increased sensitivity to heat in this region (Knowlton et al. 2009, Gershunov et 279
al. 2011). 280
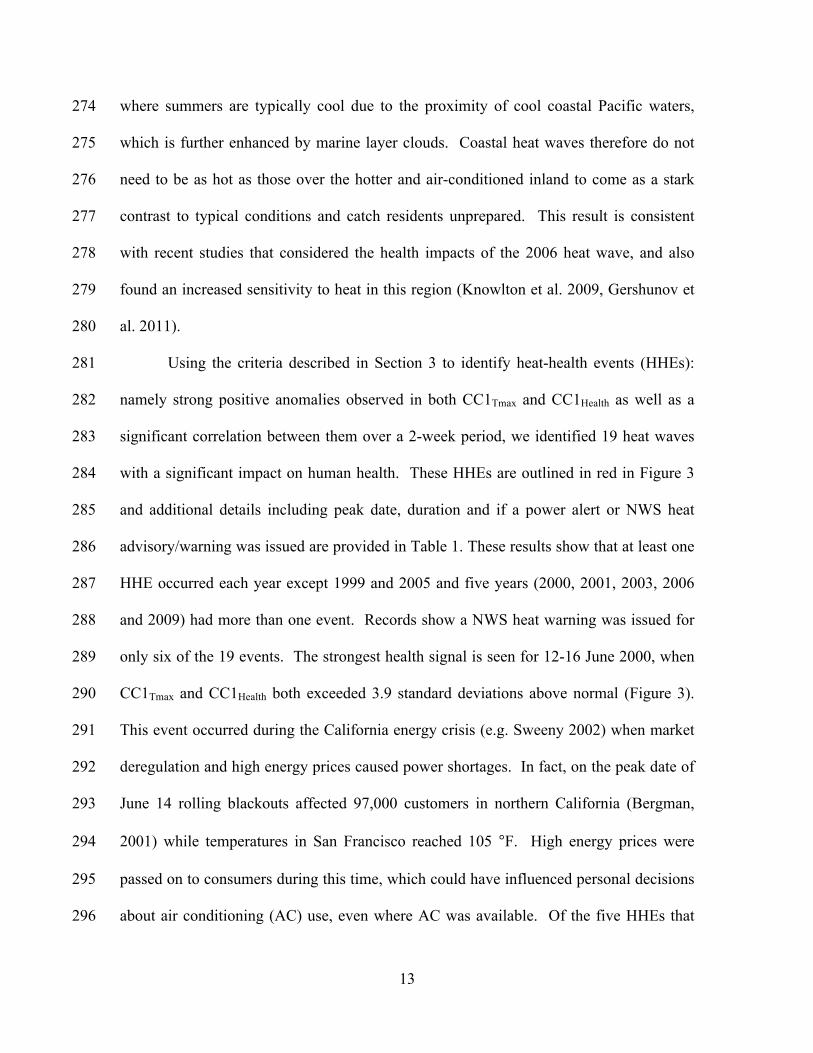
Using the criteria described in Section 3 to identify heat-health events (HHEs): 281
namely strong positive anomalies observed in both CC1Tmax and CC1Health as well as a 282
significant correlation between them over a 2-week period, we identified 19 heat waves 283
with a significant impact on human health. These HHEs are outlined in red in Figure 3 284
and additional details including peak date, duration and if a power alert or NWS heat 285
advisory/warning was issued are provided in Table 1. These results show that at least one 286
HHE occurred each year except 1999 and 2005 and five years (2000, 2001, 2003, 2006 287
and 2009) had more than one event. Records show a NWS heat warning was issued for 288
only six of the 19 events. The strongest health signal is seen for 12-16 June 2000, when 289
CC1Tmax and CC1Health both exceeded 3.9 standard deviations above normal (Figure 3). 290
This event occurred during the California energy crisis (e.g. Sweeny 2002) when market 291
deregulation and high energy prices caused power shortages. In fact, on the peak date of 292
June 14 rolling blackouts affected 97,000 customers in northern California (Bergman, 293
2001) while temperatures in San Francisco reached 105 °F. High energy prices were 294
passed on to consumers during this time, which could have influenced personal decisions 295
about air conditioning (AC) use, even where AC was available. Of the five HHEs that 296

14
occurred during the 2000-2001 crisis, four were accompanied by a power alert. Other 297
summers that stand out as remarkable are the summer of 2003, which had six HHEs of 298
varying strengths and duration, and the summer of 2006 for the duration and intensity of 299
the mid-summer heat wave. 300
Figure 4a (4b) shows the peak daily maximum and minimum temperatures 301
(standardized anomalies) for each HHE. Also in 4a are the number of days exceeding the 302
warm season (May-Sep) 95th percentile for each HHE and region, and an indicator of 303
whether the monthly 95th percentile was reached (*). From Figure 4a, the Central Valley 304
and Southern Deserts were hottest during all events, with daytime temperatures usually 305
exceeding 37°C (~98°F). From Figure 4b, the Coastal North tends to reach hotter 306
temperatures (especially daytime) relative to its climatology as compared to other 307
regions. This means that, while the temperatures may be lower, these coastal residents 308
are experiencing heat conditions that are very extreme relative to what they are used to 309
and may experience health impacts at lower temperatures than inland populations more 310
acclimatized to heat. This figure also highlights the notorious 2006 heat wave affecting 311
most of California, which was unprecedented in magnitude and spatial extent since at 312
least the late forties (Gershunov et al. 2009) and nighttime temperatures are shown to be 313
even more extreme than those experienced during the day. Figure 4b also shows that 314
during nighttime-accentuated events, when Tmin is extremely elevated, multiple regions 315
are impacted (e.g. July 2002, 2003, 2006) indicative of a particularly expansive heat 316
wave with the potential for large-scale, statewide impacts. 317
It is interesting that in terms of summertime temperatures, these events often do 318
not fall in the top 5% of daytime or nighttime highs, except in the Coastal North. 319

15
However if we look at monthly percentiles, the majority of events do fall in the top 5% 320
(above the 95th percentile) for all regions except the Coastal South. This means that, for 321
example, while a May event might not meet the summertime threshold for extreme 322
temperatures, it would be extremely hot for that time of year. This suggests populations 323
may be more heat sensitive during cooler parts of the season. An increased vulnerability 324
early in the season has also been found in other studies (e.g. Basu and Samet 2002, Ebi et 325
al. 1998). This is generally attributed to the loss of acclimatization that occurs during the 326
winter, as well as mortality displacement whereby the most vulnerable populations 327
succumb to the first dangerous event of the season (Basu and Malig 2011). 328
329
b. Statewide Health Impact 330
The statewide heat-health impacts are shown in Figure 5 and Tables 1 and 2. 331
Figure 5a shows the distribution of daily hospitalization anomalies during non-HHE days, 332
during the span of a HHE and during the peak HHE day for all causes. There is a 333
dramatic increase in hospitalizations during HHEs, especially at the peak day. This 334
difference is statistically significant at the 95% level using a two-sample t-test to compare 335
sample means. For all causes, there was an average daily increase of 102 hospitalizations 336
during the HHE span, which increased to 173 excess hospitalizations on the peak day. In 337
California during the 1999-2009 record there were, on average, 2519 hospitalizations per 338
day. Therefore, 173 excess hospitalizations at the peak represent nearly a 7% increase 339
above what would occur on an average day. 340
A similar comparison was done for each of the disease categories accounting for 341
unequal variances as necessary for some categories. A statistically significant increase in 342

16
hospitalizations was seen for all outcomes except essential hypertension, a cardiovascular 343
subcategory. This non-significant result for essential hypertension could be physiological 344
as blood pressure goes down with increased heat exposure (Basu et al. 2012), or due to 345
the small sample size (Table 2). Hospitalizations due to all cardiovascular diseases 346
increased by an average of 36 (49) per day for the HHE span (peak), or 3.5% (4.7%) 347
above the typical cardiovascular disease admission rate (Table 2). Admissions for 348
respiratory diseases, mental health, acute renal failure, dehydration, and heat illness 349
increased by 20 (42), 2 (6), 5 (10), 8(16), and 4 (10), respectively, on average per day for 350
HHE span (peak). Expressed as a percentage of daily mean hospitalizations during the 351
record for these disease categories, this translates to an increase of 7.7%, 9.8%, 17.7%, 352
22.5%, and 505% at the peak of the heat wave. 353
Figure 5b gives the cumulative statewide health impact for each of the 19 events. 354
To quantify the cumulative impact, hospitalization anomalies (y’) were summed over the 355
span of each event and this value was compared to all non-HHE days in the historical 356
record spanning the same duration. For example, the impact of the 2006 July 13-26 event 357
was determined by comparing that 14-day sum of hospitalization anomalies to those 358
obtained by resampling the record for all consecutive, non-HHE days spanning 14 days. 359
Similarly, the 2000 June 12-16 event was compared to non-HHE days spanning 5 days. 360
The health impact is said to be significant (using the 90th percent level for a one-sided 361
test) if it falls above the 95th percentile of the resampled distribution. From Figure 5b, a 362
significant statewide health impact is observed for 15 of the 19 HHEs identified. Taken 363
together, these 15 events are associated with more than 11,000 excess hospitalizations 364
statewide. The number of excess hospitalizations associated with each of these 15 365

17
events (Table 1) ranges from 367 for the short, 3-day 2006 HHE to 1657 for one 17-day, 366
heat wave in September 2004. During the notorious 14-day July 2006 heat wave 367
affecting most of the state, there were 1254 excess hospitalizations in California, a result 368
that is similar to Knowlton et al. (2009) which found 1182 excess hospitalizations and 369
16,166 excess emergency department visits. The magnitude of the impact from one event 370
to another is strongly associated with its duration. By looking at the health impact in 371
terms of quantiles of the resampled data, which accounts for duration, we see that the 372
health impact of these 15 events are all in the top 3%, with several in the top 1%, as 373
compared to non-HHE days spanning the same duration (Table 1), i.e. they are highly 374
significant. 375
376
c. Regional Health Impact 377
Table 3 shows the regional impacts for HHE span and peak for each of the six 378
California subregions using a two-sample t-test comparing non-HHE days with HHE 379
span and HHE peak (same methodology as for disease categories in Table 2). A 380
significant health impact is observed for four of the six regions. Daily admissions for the 381
Coastal South, Coastal North, Central Valley, and Southern Deserts increased by 50 (71), 382
23 (47), 24 (43), and 4 (9), respectively, for HHE span (peak). Expressed as a percentage 383
of average daily hospitalizations for these regions, this translates to an increase of 5.6%, 384
8.1%, 10.5%, and 6.3% at the peak of the heat wave. While the largest impact in terms 385
of total admissions is greatest for the Coastal South owing to its larger population, the 386
Coastal North contributes disproportionately to the health impact during heat waves. This 387
region represents 18% of all California hospitalizations during 1999-2009, but this 388

18
increases to 27% during heat waves. There are a few possible explanations for this. 389
First, a poor acclimation to extreme heat both physiologically and through air 390
conditioning use (air conditioning coverage is low in the Coastal North; for example, San 391
Francisco has only 21% air conditioning saturation, Sailor and Pavlova 2003). Second, 392
residents typically have easier access to hospitals and better insurance coverage than 393
other parts of the state making it more likely they would seek medical treatment. Third, 394
heat waves in the Coastal North are hotter relative to the mean climate (c.f. Figure 4b) 395
simply due to the regional temperature distribution. 396
Figure 6 gives the cumulative health impact of the 19 HHEs for each California 397
subregion using the same resampling method described above. Eighteen HHEs are 398
associated with a significant health impact in at least one subregion of California (7-17 399
Aug 2009 is the only exception). There is very little impact seen in the deserts with only 400
two (one) events associated with a significant health impact in the Southern Deserts 401
(Mojave). This result is likely due to the fact that CC1 does not well represent desert heat 402
waves, especially for the Mojave (c.f. Figure 2). CC1 also does poorly in representing 403
heat waves in the Northern Forests, and here we see only a modest impact (four 404
significant events). Our methodology is designed to explain the strongest co-405
relationships between heat and heath in California. However, not all heat waves are 406
represented. There are likely some additional, more regionally focused heat waves that 407
may have a regional health impact but these would need to be studied on a smaller spatial 408
scale. 409
For the remaining regions, there is a strong health signal. Morbidity in the 410
Central Valley was significantly impacted during 9 events and the Coastal North and 411
19
South each experienced 11 impactful heat waves. The Coastal South, the most populous 412
region, shows the strongest overall impact in terms of patient numbers, with excess 413
hospitalizations in the range 300 to more than 800 depending on event. In general, 414
excess hospitalizations in the Coastal South are 1.5-3 times those in the Coastal North or 415
Central Valley where the most intense heat waves cause typically 300-400 excess 416
hospitalizations. In terms of quantiles of historical observations (color scale, Figure 6), 417
which equalizes the regions in terms of population, the health impact is similar across the 418
three regions with a mean percentile rank of 86-89% for the 19 events, although the 419
coastal regions see a larger number of impacts in the top 5% (i.e. more are significant at 420
the 90% level). 421
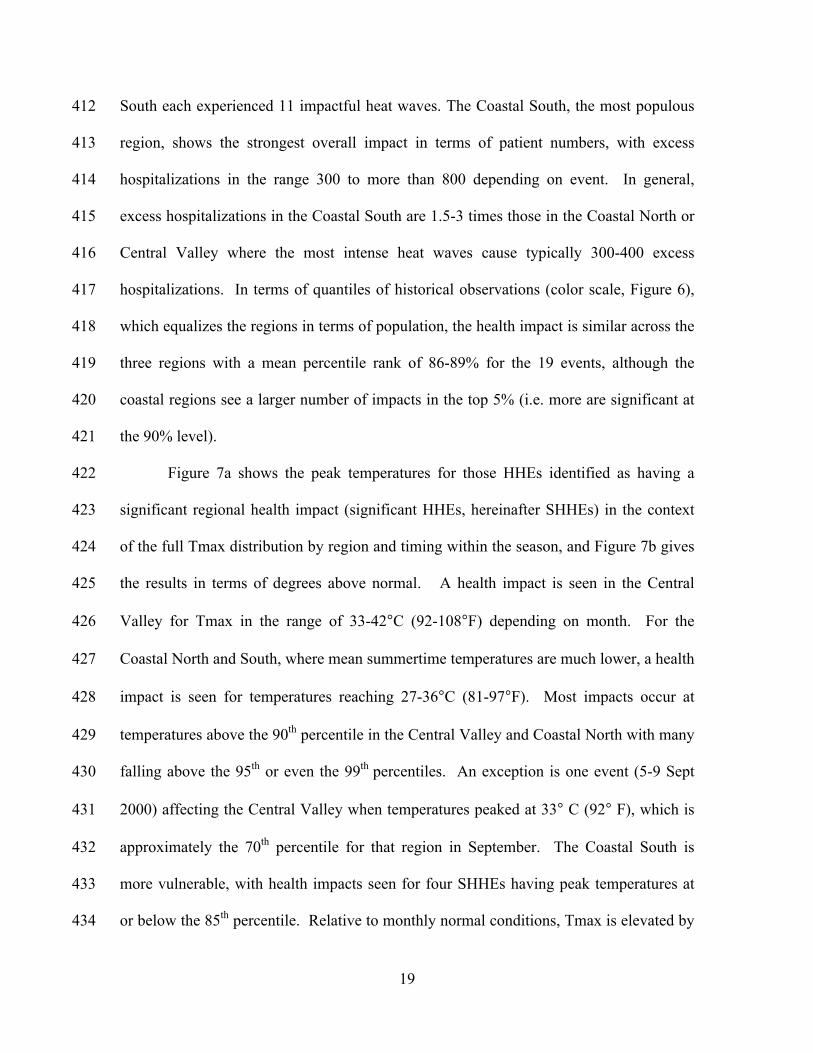
Figure 7a shows the peak temperatures for those HHEs identified as having a 422
significant regional health impact (significant HHEs, hereinafter SHHEs) in the context 423
of the full Tmax distribution by region and timing within the season, and Figure 7b gives 424
the results in terms of degrees above normal. A health impact is seen in the Central 425
Valley for Tmax in the range of 33-42°C (92-108°F) depending on month. For the 426
Coastal North and South, where mean summertime temperatures are much lower, a health 427
impact is seen for temperatures reaching 27-36°C (81-97°F). Most impacts occur at 428
temperatures above the 90th percentile in the Central Valley and Coastal North with many 429
falling above the 95th or even the 99th percentiles. An exception is one event (5-9 Sept 430
2000) affecting the Central Valley when temperatures peaked at 33° C (92° F), which is 431
approximately the 70th percentile for that region in September. The Coastal South is 432
more vulnerable, with health impacts seen for four SHHEs having peak temperatures at 433
or below the 85th percentile. Relative to monthly normal conditions, Tmax is elevated by 434

20
an average of 6.1°C in the Central Valley, 9.1°C in the Coastal North, and 4.5 °C in the 435
Coastal South. From Figure 7a there are several observations above the 99th percentile 436
including 11-year highs in the Coastal South that were not associated with a significant 437
health impact. We analyzed those 13 days, which spanned five separate events. Four of 438
the five events were not identified as a HHE by the CCA methodology, so were not 439
examined in terms of health impacts. The reason they did not meet the HHE criteria is 440
because on the large scale there was no strong correlation between temperatures and 441
health in California. However, it is possible there were more localized health impacts. 442
The fifth event (13-26 July 2006) was identified as a HHE but no significant health 443
impact was found for the Coastal South. This was a particularly impactful heat wave 444
statewide (c.f. Table 1), and in the south coast there were 3 days above the 99th percentile 445
and an 11-year high that occurred on July 22. While the health impact was not 446
statistically significant by our criteria, in the Coastal South there were 515 excess 447
hospitalizations during that 14-day period, which is above the 93rd percentile as compared 448
to all other 14-day periods in the record. 449
450
d. Effect of Humidity 451
Current heat warning systems attempt to account for the effect of humidity on 452
heat wave morbidity and mortality. The Heat Index uses relative humidity or dew point 453
temperature to estimate the human health impact based on empirical relationships with 454
mortality. More sophisticated systems use empirical relationships between morbidity and 455
forecasted synoptic air masses (e.g. Ebi et al. 2004). While quantifying the heat-456
humidity-health relationship is beyond the scope of this study, we attempt to describe the 457

21
relative impact of dry versus humid heat waves using regional anomalies in specific 458
humidity. An event is categorized as dry or humid depending on if the daily, regional 459
specific humidity was below or above normal, respectively. The anomalies are calculated 460
using the 1999-2009 May-September climatology. 461
Figure 8 shows the proportion of hospitalizations by month and heat wave type 462
for those HHEs found to have a significant regional impact on health. For the Central 463
Valley and Coastal North, humid heat waves account for 65% of the impactful heat 464
waves in each region (6 of 9 in the Central Valley and 7 of 11 in the Coastal North). In 465
terms of health impact, humid heat waves account for 66% of the hospitalizations in each 466
of these regions with no appreciable difference seen within our sample of impactful 467
events in terms of health outcome during dry versus humid heat waves. However, since 468
health data was used directly in the identification of these events, the fact that the 469
majority of impactful heat waves are humid suggests that humid heat waves are the more 470
dangerous variety in the Central Valley and Coastal North. For the Coastal South, dry 471
and humid events are approximately equal both in occurrence rate and health impact. In 472
terms of seasonal timing, mid-summer events have the strongest impact on health in the 473
Central Valley, but early-season heat waves have the strongest impact in the coastal 474
regions. In general, early and mid-season heat waves tend to be getting stronger and 475
more frequent in California due to climate change and specifically trending towards the 476
humid variety (GG2012). Since the coastal populations show more vulnerability early in 477
the season due to loss of acclimation over the winter and mortality displacement as 478
discussed above; and are more prone to heat illness during humid events (at least in the 479

22
northern part of coast), this means heat waves are changing towards the most dangerous 480
variety in terms of human health. 481
482
5. Discussion and Conclusions 483
This study investigated the health impacts of recent heat waves from 1999 to 484
2009. Using Canonical Correlation Analysis applied to daily maximum temperatures and 485
hospitalization data we identified 19 heat events spanning 3-15 days in duration that had 486
a significant impact on human health. Taken collectively, these events resulted in more 487
than 11,000 excess hospitalizations statewide. However, a heat advisory or warning from 488
the National Weather Service was only issued during six of them. In terms of individual 489
heat waves, the 17-day September 2004 heat wave showed the greatest impact, with 1657 490
excess hospitalizations. The 14-day July 2006 heat wave and the 15-day July 2003 heat 491
wave were also very harmful to health with 1254 and 1063 excess hospitalizations, 492
respectively. These events were not only long in duration, but were particularly extreme 493
with temperatures exceeding the 95th percentile for several days. The 2003 and 2006 494
events were additionally humid with very high nighttime temperatures that hindered 495
physiological recovery at night. Previous research has shown heat waves in the 496
Southwest are becoming more durable and spatially expansive, especially the humid 497
variety (Gershunov et al. 2009). Therefore local and statewide planning is needed to 498
adequately prepare for these types of events, which can be devastating in terms of health 499
impacts and can greatly strain resources designated for emergency response. 500
Regionally, the strongest health impacts were seen in the Central Valley and the 501
north and south coasts. While the largest impact in terms of patient numbers is greatest 502

23
for the Coastal South owing to its larger population, the Coastal North is 503
disproportionately affected by extreme heat. During heat waves, the Coastal South sees a 504
5.6% increase in hospitalizations on peak heat wave days while the Coastal North 505
experiences an increase of 10.5%. 506
In the Central Valley, temperatures in the range of 33-42°C (6.1°C above normal, 507
on average) were associated with a health impact while in both coastal regions we 508
detected an impact for temperatures in the range of 27-36°C (9.1°C and 4.5°C above 509
normal, on average, for the Coastal North and Coastal South, respectively). Generally 510
these temperatures are above the 90th percentile in the Central Valley and Coastal North, 511
while the Coastal South is more vulnerable with impacts occurring when temperatures are 512
at or below the 85th percentile. While the Coastal North appears most vulnerable in terms 513
of increased hospitalizations (10.5% increase on peak heat waves), the Coastal South 514
appears to be more vulnerable to lower temperatures. This could be due to differences in 515
demographics or access to care. Additionally, there are other factors possibly contributing 516
to the observed health effects other than high temperatures such as air pollution, Santa 517
Ana winds, or smoke from wildfires that often accompany dry, late-season heat waves in 518
the Coastal South. 519
The relative impact of dry versus humid heat waves was investigated using 520
regional anomalies in specific humidity. The results showed that humid heat waves have 521
a stronger impact on human health in the Central Valley and Coastal North, accounting 522
for 66% of heat-related excess hospitalizations in both regions. In the Coastal South 523
there was an approximately equal impact seen during humid and dry heat waves. In 524
terms of seasonal timing, mid-summer events have the strongest impact on health in the 525

24
Central Valley, but early-season heat waves have the strongest impact in the coastal 526
regions. Early in the season, coastal California experiences many cloudy and cool days 527
due to the prominent marine layer, often referred to as “May Grey” or “June Gloom”. 528
Therefore heat waves during this part of the season would come as a stark contrast to 529
typical conditions. 530
These results suggest local percentile thresholds that consider seasonal timing 531
would be more appropriate for use in issuing heat warnings than the current system, 532
which uses a single threshold throughout the summer and regional baselines that are 533
based on only very limited health impact information. New criteria developed by NWS 534
San Diego uses a temperature curve based on departures from normal for different 535
climate zones, therefore incorporating seasonality and local acclimatization. This 536
approach will address some of the geographic and population differences in vulnerability. 537
California could also benefit from a multi-tiered system that accounts for the 538
vulnerabilities of different populations such as outdoor agricultural workers, the elderly 539
and those with preexisting conditions who have been shown to be especially vulnerable 540
to heat (e.g. Trent et al. 2006). Lower threshold warnings could be issued for these 541
vulnerable populations. This type of analysis is beyond the scope of this study, but future 542
work will take a more localized focus and consider local differences in outcome based on 543
demographic and other risk factors or exasperating conditions such as air quality, 544
occurrence of Santa Ana winds or marine layer conditions. Given that heat waves are 545
expected to become more frequent and more severe, it is crucial to understand the impact 546
on human health now so public health officials can respond effectively and plan 547
adequately for the future. This is especially true for California, which has a population of 548

25
nearly 40 million with the majority living along the coast where heat acclimation is poor, 549
air conditioners in homes are sparse (especially in Northern California), and research 550
shows heat waves will continue to become more intense and more humid. 551
552
Acknowledgments 553
This work was supported by the University Corporation for Atmospheric Research 554
(UCAR) Postdocs Applying Climate Expertise (PACE) fellowship (#32947252), by DOI 555
via the Southwest Climate Science Center, by NOAA via the RISA program through the 556
California and Nevada Applications Center and by the National Science Foundation 557
awards ANT-1043435 and DUE-1239797. Any opinions, findings, and conclusions or 558
recommendations expressed in this material are those of the authors and do not 559
necessarily reflect the views of the funding sources. We would like to thank Mary Tyree 560
for data retrieval and handling. We thank two anonymous reviewers for helpful 561
comments during the evaluation of this paper. 562
563
References 564
Agence France-Press, 2010: “Russian heat wave caused 11,000 deaths in Moscow: 565
official”, Sept. 17, 2010 566
Alfaro, E., A. Gershunov and D.R. Cayan, 2006: Prediction of summer maximum and 567
minimum temperature over the Central and Western United States: The role of 568
soil moisture and sea surface temperature. J. Climate. 19, 1407-1421. 569

26
Barnett, T. P. and R. Preisendorfer, 1987: Origins and levels of monthly and seasonal 570
forecast skill for United States surface air temperatures determined by canonical 571
correlation analysis. Mon. Wea. Rev., 115, 1825-1850. 572
Basu R., 2009: High ambient temperature and mortality: a review of epidemiological 573
studies from 2001 to 2008. Environmental Health, 8(1):40, 2009. 574
Basu R., Feng W-Y, and B.D. Ostro, 2008; Characterizing temperature and mortality in 575
nine California counties. Epidemiology, 19(1):138-45. 576
Basu R and B. Malig, 2011: High ambient temperature and mortality in California: 577
Exploring the roles of age, disease, and mortality displacement? Environmental 578
Res., 111(8):1286-92. 579
Basu R., Pearson D., Malig B., Broadwin R., and S. Green, 2012: The effect of elevated 580
ambient temperature on emergency room visits, Epidemiology 23(6):813-20. 581
Basu, R. and J.M. Samet, 2002: Relation between elevated ambient temperature and 582
mortality: a review of the epidemiological evidence. Epidemiol. Rev., 24(2): 190-583
202. 584
Bergman, Lowell (Narr.), 2001: “Blackout”. Frontline. PBS. 15 June, 2001. Web 585
summary available at http://www.pbs.org/wgbh/pages/frontline/shows/blackout. 586
Bumbaco, K.A., K.D. Dello and N.A. Bond, 2013: History of Pacific Northwest Heat 587
Waves: Synoptic Pattern and Trends. J. Appl. Meteorol. Clim. 588
doi: http://dx.doi.org/10.1175/JAMC-D-12-094.1 589
Cleveland, William S., 1979: "Robust Locally Weighted Regression and Smoothing 590
Scatterplots". J. Amer. Statist. Assoc. 74 (368): 829–836. doi:10.2307/2286407 591
Ebi, K.L., T.J. Teisberg, L.S. Kalkstein, L. Robinson, and R.F. Weiher, 2004: Heat 592

27
Watch/Warning Systems Save Lives: Estimated Costs and Benefits for 593
Philadelphia 1995–98. Bull. Amer. Meteor. Soc., 85, 1067–1073. doi: 594
http://dx.doi.org/10.1175/BAMS-85-8-1067 595
Gershunov, A. and D. Cayan, 2003: Heavy daily precipitation frequency over the 596
contiguous United States: Sources of climatic variability and seasonal 597
predictability. J. Climate, 16, 2752-2765. 598
Gershunov, A., D.R. Cayan, and S.F. Iacobellis, 2009: The Great 2006 Heat Wave over 599
California and Nevada: Signal of an Increasing Trend. J. Climate, 22, 6181–6203. 600
Gershunov, A. and K. Guirguis, 2012: California heat waves in the present and future, 601
Geophys. Res. Lett, doi: 10.1029/2012GL05297 602
Gershunov, A., Z. Johnston, H. Margolis, and K. Guirguis, 2011: The California Heat 603
Wave 2006 with Impacts on Statewide Medical Emergency: A space-time analysis. 604
Geog. Res. Forum, 31, 53-69. 605
Hotelling, H., 1935: The most predictable criterion. J. Educ. Psychol., 26, 139-142. 606
Hotelling, H., 1936: Relations between two sets of variables. Biometrica, 28, 321-377. 607
IPCC, 2007: Climate Change 2007: The Physical Science Basis. Contribution of Working 608
Group I to the Fourth Assessment Report of the Intergovernmental Panel on 609
Climate Change., S. Solomon, D. Qin, M. Manning, Z. Chen, M. Marquis, K.B. 610
Averyt, M. Tignor and H.L. Miler (eds.). Editor. 2007. p. 996. 611
IPCC, 2012: Summary for Policymakers. In: Managing the Risks of Extreme Events and 612
Disasters to Advance Climate Change Adaptation [Field, C.B., V. Barros, T.F. 613
Stocker, D. Qin, D.J. Dokken, K.L. Ebi, M.D. Mastrandrea, K.J. Mach, G.-K. 614
Plattner, S.K. Allen, M. Tignor, and P.M. Midgley (eds.)]. A Special Report of 615

28
Working Groups I and II of the Intergovernmental Panel on Climate Change. 616
Cambridge University Press, Cambridge, UK, and New York, NY, USA, pp. 1-617
19. 618
Kaiser, R. A. Le Terte, J. Schwartz, C.A. Gotway, W. R. Daley, and C.H. Rubin, 2007: 619
The effect of the 1995 heat wave in Chicago on all-cause and cause-specific 620
mortality. Am. J. Public. Health. 97 (1): 158–162 621
Knowlton K., M. Rotkin-Ellman, G. King, H.G. Margolis, D. Smith, G. Solomon, R. 622
Trent, P. English, 2009: The 2006 California heat wave: impacts on 623
hospitalizations and emergency department visits. Environ Health Perspect, 624
117:61–67 625
Le Tertre A., A. Lefranc, D. Eilstein, C. Declercq, S. Medina, M. Blanchard, B. Chardon, 626
P. Fabre, L. Filleul, J.F. Jusot, L. Pascal, H. Prouvost, S. Cassadou, M. Ledrans, 627
2006: Impact of the 2003 heatwave on all-cause mortality in 9 French cities. 628
Epidemiology 17:75–79 629
Martiello M.A. and M.V. Giacchi, 2010: Review article: high temperatures and health 630
outcomes: a review of the literature. Scand J Public Health, 38:826–37 631
Mastrangelo G, Fedeli U, Visentin C, Milan G, Fadda E, et al., 2007: Pattern and 632
determinants of hospitalization during heat waves: an ecologic study. BMC Public 633
Health, 7: 200 634
Maurer, E.P., A.W. Wood, J.C. Adam, D.P. Lettenmaier, and B. Nijssen, 2002: A long-635
term hydrologically-based data set of land surface fluxes and states for the 636
conterminous United States. J. Climate, 15, 3237-3251. 637

29
Meehl G.A. and C. Tebaldi, 2004: More Intense, More Frequent, and Longer Lasting 638
Heat Waves in the 21st Century. Science, 305, 994-007 639
Mesinger, Fedor, and Coauthors, 2006: North American Regional Reanalysis. Bull. Amer. 640
Meteor. Soc., 87, 343–360. doi: http://dx.doi.org/10.1175/BAMS-87-3-343 641
NCDC (2003) Data documentation for data set 3200 (DSI-3200): Surface land daily 642
cooperative summary of the day. National Climatic Data Center, Asheville, NC. 643
[www.ncdc.noaa.gov/pub/data/documentlibrary/tddoc/td3200.pdf]. 644
Ostro B.D., Roth L.A., Green R.S., Basu R. Estimating the mortality effect the July 2006 645
California heat wave. Environ Res. 2009;109:614–619. 646
Reid, C.E., M.S. O’Neill, C.J. Gronlund, S.J. Brines, D.G. Brown, A.V. Diez-Roux, and 647
J. Schwartz, 2009: Mapping community determinants of heat 648
vulnerability. Environ. Health. Perspect., 117, 1730–1736 649
Robine, J.M, S.L. Cheung, S. Le Roy, H. Van Oyen, and F.R. Herrmann, 2007: Report on 650
excess mortality in Europe during summer 2003, EU Community Action 651
Programme for Public Health, Grant Agreement 2005114). 652
Robinson, P. J., 2001: On the definition of a heat wave. J. Appl. Meteor., 40, 762–775. 653 654 Sailor, D. and Pavlova, A., 2003: Air conditioning market saturation and long-term 655
response of residential cooling demand to climate change. Energy, 28,941-951. 656
Sheridan S.C., Kalkstein A.J., 2010: Seasonal variability in heat-related mortality across 657
the United States. Nat Hazards, 55(2):291–305 658
Sheridan S.C., Allen M, Lee C.C., Kalkstein L.S., 2012b: Future heat vulnerability in 659
California, part II: projecting future heat-related mortality. Clim Chang. 660
doi:10.1007/s10584-012-0437-1 661

30
Son, J-Y, J-T Lee, G. B. Anderson, and M.L. Bell, 2012: The Impact of Heat Waves on 662
Mortality in Seven Major Cities in Korea. Environ. Health. Perspect. 120(4): 663
566-571. 664
Sweeney, J.L. 2002. The California Electricity Crisis. Stanford, Calif.: Hoover Institution 665
Press. 666
Trent, R.B., 2006: Review of July 2006 Heat Wave Related Fatalities in California, 667
http://www.cdph.ca.gov/HealthInfo/injviosaf/Documents/HeatPlanAssessment-668
EPIC.pdf. 669
Vaneckova P., Bambrick H., 2013: Cause-Specific Hospital Admissions on Hot Days in 670
Sydney, Australia. PLoS ONE 8(2): e55459. doi:10.1371/journal.pone.0055459 671
Wilks, D. S., 2006: Statistical Methods in the Atmospheric Sciences. Academic Press, 672
648 pp. 673
674
675
676

31
Table 1: Heat Health Events and associated statewide health impact. Bold font indicates 677
statistical significance at the 90% level. 678
679
Year Event Span Peak
Date Duration Excess
Hosp. (Count)
Excess Hosp. (Quantile)
2000 S2May 18-24 May 21 7 217 73.4 S1*Jun 12-16 Jun 14 5 299 80.6
Sep 5-9 Sep 7 5 700 99.7
2001 S3May 2-11 May 8 10 959 93.1
S2May 29 - Jun 1 May 31 4 460 99.0 2002 S2*Jul 7-13 Jul 9 7 848 97.8
2003
May 19-22 May 20 4 845 99.5 S1May 27-29 May 28 3 454 99.1
Jun 24-30 Jun 27 7 717 98.3 *Jul 8-22 Jul 14 15 1063 97.5 Sep 10-15 Sep 13 6 629 98.5 Sep 17-23 Sep 22 7 839 99.0
2004 Sep 1-17 Sep 7 17 1657 99.8
2006 Jul 7-9 Jul 8 3 367 99.1 S2*Jul 13-26 Jul 23 14 1254 97.8
2007 May 6-9 May 7 4 327 99.0 2008 *May 13-18 May 16 6 903 99.2
2009 *May 15-18 May 17 4 160 88.5 Aug 7-17 Aug 10 11 228 78.4
* NWS Heat advisory or warning issued S1, S2, S3: Stage 1, 2, or 3 electrical alert issued by the California ISO
680 681

32
Table 2: Average daily increase in hospital admissions with confidence intervals for 682
HHE span and peak from a two-sample t-test. An asterisk indicates a non-significant 683
health impact (at the 95% level). Also shown are the daily average number of 684
hospitalizations in California over the 1999-2009 record, and the excess admissions seen 685
on peak heat wave days expressed as percent above normal. 686
Outcome Category ICD Code
Daily Average Hospital-izations
1999-2009
Average Excess Daily Morbidity (Count)
Average Excess Daily
Morbidity (Percent above
normal) HHE span HHE peak HHE peak All Causes 2519 102.2
(101.6-102.6) 172.8 (171.5-174.2)
6.9
Cardiovascular Diseases
All Cardiovascular diseases
390:459 1042 36.1 (35.8-36.3) 48.7 (48.1-49.3) 4.7
Ischemic heart disease
410:414 312 14.8 (14.7-15.0) 19.1 (18.7-19.6) 6.1
Acute myocardial infarction
410 137 3.9 (3.8-3.9) 6.8 (6.6-7.0) 5.0
Cardiac dysrythmias
427 127 2.9 (2.8-3) 6.4 (6.3-6.6) 5.0
Essential hypertension
401 15 *0.2 (0.17-0.22) *0.4 (0.4-0.4) 2.6
Ischemic stroke 433:436 151 5.9 (5.8-5.9) 7.4 (7.3-7.6) 4.9 Other Diseases Respiratory diseases
460:519 541 19.7 (19.5-19.9) 41.6 (41.1-42.1) 7.7
Acute renal failure 584 57 4.5 (4.4-4.5) 10.1 (9.9-10.3) 17.7 Mental Health 290:319 64 2.1 (2.1-2.2) 6.3 (6.2-6.4) 9.8 Dehydration 276.5 71 7.9 (7.8-7.9) 15.9 (15.7-16.0) 22.5 Heat illness 992 2 4.3 (4.2-4.3) 10.1 (9.8-10.4) 505 687 688
689
690
691
33
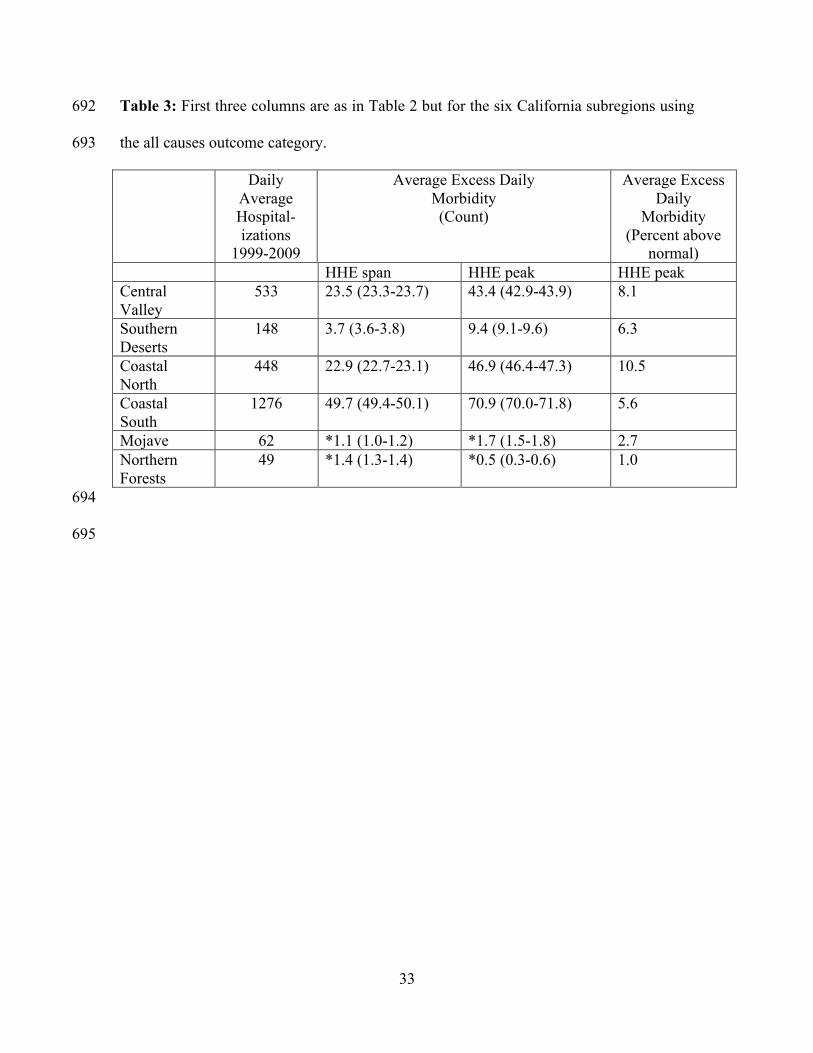
Table 3: First three columns are as in Table 2 but for the six California subregions using 692
the all causes outcome category. 693
Daily Average Hospital-izations
1999-2009
Average Excess Daily Morbidity (Count)
Average Excess Daily
Morbidity (Percent above
normal) HHE span HHE peak HHE peak Central Valley
533 23.5 (23.3-23.7) 43.4 (42.9-43.9) 8.1
Southern Deserts
148 3.7 (3.6-3.8) 9.4 (9.1-9.6) 6.3
Coastal North
448 22.9 (22.7-23.1) 46.9 (46.4-47.3) 10.5
Coastal South
1276 49.7 (49.4-50.1) 70.9 (70.0-71.8) 5.6
Mojave 62 *1.1 (1.0-1.2) *1.7 (1.5-1.8) 2.7 Northern Forests
49 *1.4 (1.3-1.4) *0.5 (0.3-0.6) 1.0
694
695

34
Figure Caption List 696
Figure 1. (a) PD data, (b) data and weekly+seasonal cycle for 2006, (c) filtered PD data 697
after removing trend, seasonal and weekly cycles and holiday effects shown for 2006. 698
699
Figure 2. (a) Canonical variables CC1Tmax and CC1Health and (b) homogeneous 700
correlation maps showing the correlation between the input data vectors and their 701
associated canonical variables (e.g. correlation between x’ and CC1Tmax and between y’ 702
and CC1Health). The input data were regionalized using empirically defined California 703
subregions: Central Valley (CV), Southern Deserts (SD), Coastal North (CN), Coastal 704
South (CS), Northern Forests (NF) and Mojave (MJ). 705
706
Figure 3. Green and black time series represent the canonical variables shown for each 707
year of the analysis period. The 15-day running correlation between CC1temp and CC1hosp 708
is shown in blue if statistically significant. Heat-Health Events are shown in red. 709
710
Figure 4. (a) Regionally averaged peak temperature for Tmax and Tmin during each 711
HHE, with the number of days exceeding the summertime 95th percentile shown in blue 712
text and an asterisk (*) indicating if the monthly 95th percentile was reached (b) 713
standardized Tmax and Tmin anomaly on peak day. Note here peak day is calculated 714
regionally for each variable (Tmin and Tmax do not necessarily peak on the same day) 715
and may vary slightly from the peak day given in Table 1. 716
717

35
Figure 5. (a) Boxplot showing statewide hospitalization anomalies for non-HHE days 718
(n=1544), HHE span (n=139) and HHE peak (n=19) and (b) morbidity associated with 719
each event using the resampling method (see text). In (b), the boxplots show the 720
distribution of historical non-HHE days spanning the same duration as the HHE and 721
green markers give the cumulative health impact for each HHE (filled markers indicate 722
statistical significance at the 90% level). 723
724
Figure 6. As in Figure 5b but for the six California subregions and with a color scale 725
showing the impact in terms of the percentile of the resampled distribution. 726
727
Figure 7. (a) Distribution of Tmax by region and season and showing Tmax on the peak 728
day of those HHEs identified as having a significant health impact, and (b) showing 729
results as °C above normal. 730
731
Figure8. Proportion of hospitalizations by month and heat wave type. Individual events 732
are separated by white horizontal lines. 733
734

36
735
736 737
738
Figure 1. (a) PD data, (b) data and weekly+seasonal cycle for 2006, (c) filtered PD data 739
after removing trend, seasonal and weekly cycles and holiday effects shown for 2006. 740
741

37
a)
b)
742
Figure 2. (a) Canonical variables CC1Tmax and CC1Health and (b) homogeneous 743
correlation maps showing the correlation between the input data vectors and their 744
associated canonical variables (e.g. correlation between x’ and CC1Tmax and between y’ 745
and CC1Health). The input data were regionalized using empirically defined California 746
subregions: Central Valley (CV), Southern Deserts (SD), Coastal North (CN), Coastal 747
South (CS), Northern Forests (NF) and Mojave (MJ). 748
749
CV
NF
MJ
SD CS
CN

38
750
Figure 3. Green and black time series represent the canonical variables shown for each 751
year of the analysis period. The 15-day running correlation between CC1temp and CC1hosp 752
is shown in blue if statistically significant. Heat-Health Events are shown in red. 753
754

39
a) Peak Temperature b) Standardized Anomaly
Figure 4. (a) Regionally averaged peak temperature for Tmax and Tmin during each 755
HHE, with the number of days exceeding the summertime 95th percentile shown in blue 756
text and an asterisk (*) indicating if the monthly 95th percentile was reached (b) 757
standardized Tmax and Tmin anomaly on peak day. Note here peak day is calculated 758

40
regionally for each variable (Tmin and Tmax do not necessarily peak on the same day) 759
and may vary slightly from the peak day given in Table 1. 760
761
762
763

41
a)
b)
Figure 5. (a) Boxplot showing statewide hospitalization anomalies for non-HHE days 764
(n=1544), HHE span (n=139) and HHE peak (n=19) and (b) morbidity associated with 765
each event using the resampling method (see text). In (b), the boxplots show the 766
distribution of historical non-HHE days spanning the same duration as the HHE and 767

42
green markers give the cumulative health impact for each HHE (filled markers indicate 768
statistical significance at the 90% level). 769
770

43
Figure 6. As in Figure 5b but for the six California subregions and with a color scale 771
showing the impact in terms of the percentile of the resampled distribution. 772
773

44
a)
b)
Figure 7. (a) Distribution of Tmax by region and season and showing Tmax on the peak 774
day of those HHEs identified as having a significant health impact, and (b) showing 775
results as °C above normal. 776
777
778

45
779
Figure 8. Proportion of hospitalizations by month and heat wave type. Individual events 780
are separated by white horizontal lines. 781
782


![Recent advancements in surface plasmon …cybermatics.org/lab/paper_pdf/2017/Recent advancements in...Bethe [28] in 1942, predicted that transmission intensity of EM waves through](https://img.pdfslide.us/doc/110x75/5f343ef7da1a7b41115cfbc7/recent-advancements-in-surface-plasmon-advancements-in-bethe-28-in-1942-predicted.jpg)