Embed Size (px)
Citation preview
Kathleen M. Vollman MSN, RN, CCNS, FCCM, FCNS, FAANClinical Nurse Specialist / Educator / Consultant
ADVANCING [email protected]
Northville, Michiganwww.vollman.com
The Impact of Patient Hygiene on Hospital Acquired Infections
©ADVANCING NURSING LLC 20212
26043B
Disclosures
Consultant-Michigan Hospital Association Keystone Center
Subject matter expert on CAUTI, CLABSI, HAPI, Safety culture for
AHA
Consultant and speaker bureau
△ Stryker’s Sage business
△ LaJolla Pharmaceutical
△ Baxter healthcare
△ Potrero Medical
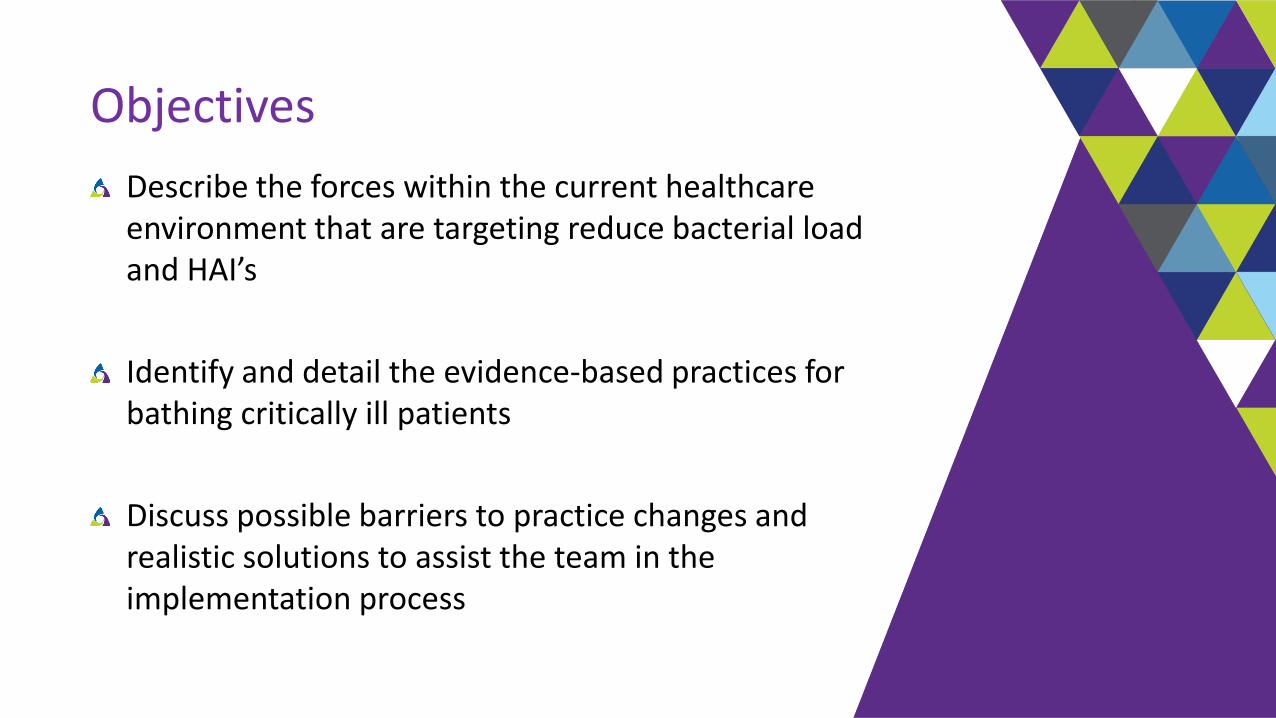
Objectives
Describe the forces within the current healthcare environment that are targeting reduce bacterial load and HAI’s
Identify and detail the evidence-based practices for bathing critically ill patients
Discuss possible barriers to practice changes and realistic solutions to assist the team in the implementation process
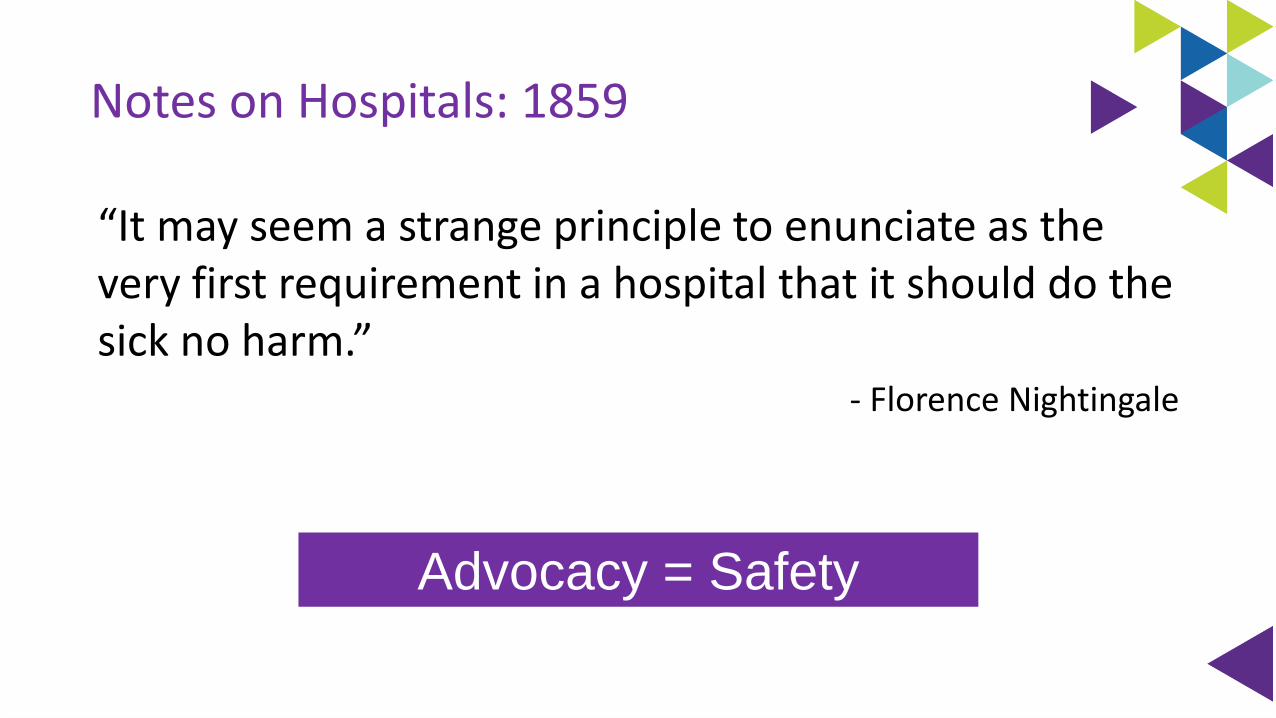
Notes on Hospitals: 1859
“It may seem a strange principle to enunciate as the very first requirement in a hospital that it should do the sick no harm.”
- Florence Nightingale
Advocacy = Safety
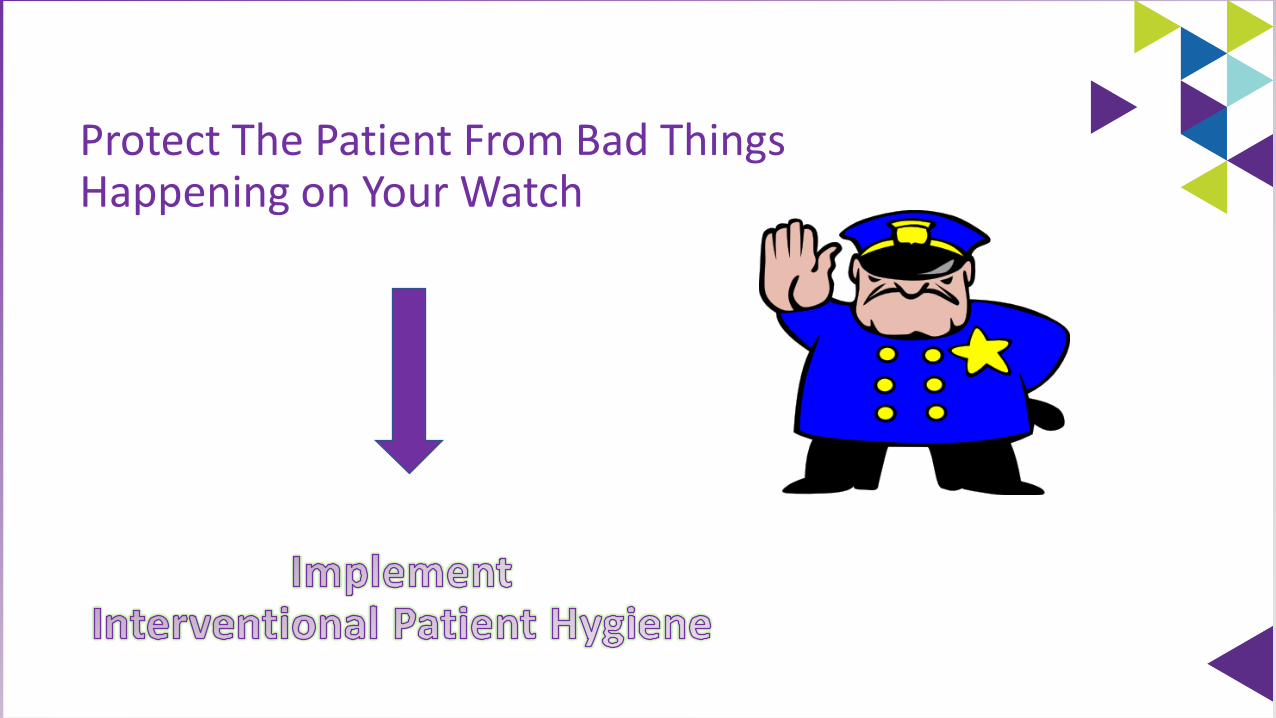
Protect The Patient From Bad Things Happening on Your Watch
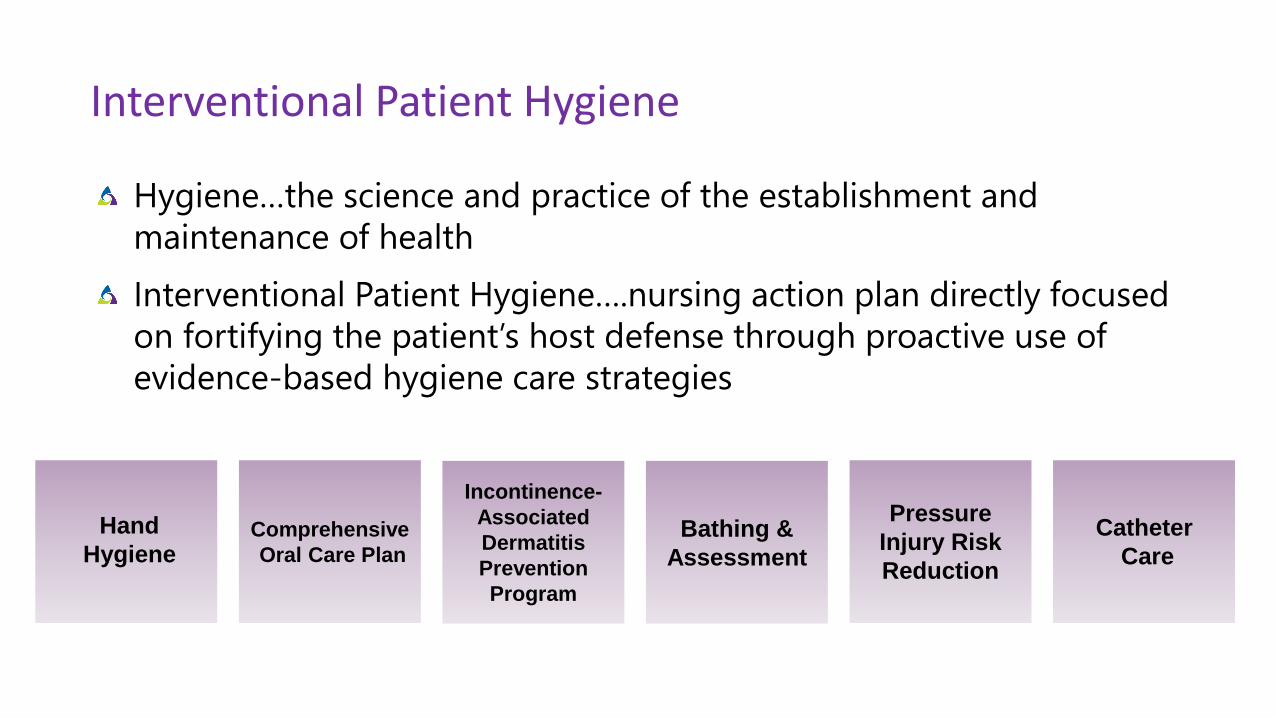
Interventional Patient Hygiene
Hygiene…the science and practice of the establishment and
maintenance of health
Interventional Patient Hygiene….nursing action plan directly focused
on fortifying the patient’s host defense through proactive use of
evidence-based hygiene care strategies
Hand
HygieneComprehensive
Oral Care Plan
Bathing &
Assessment
Incontinence-
Associated
Dermatitis
Prevention
Program
Catheter
Care
Pressure
Injury Risk
Reduction
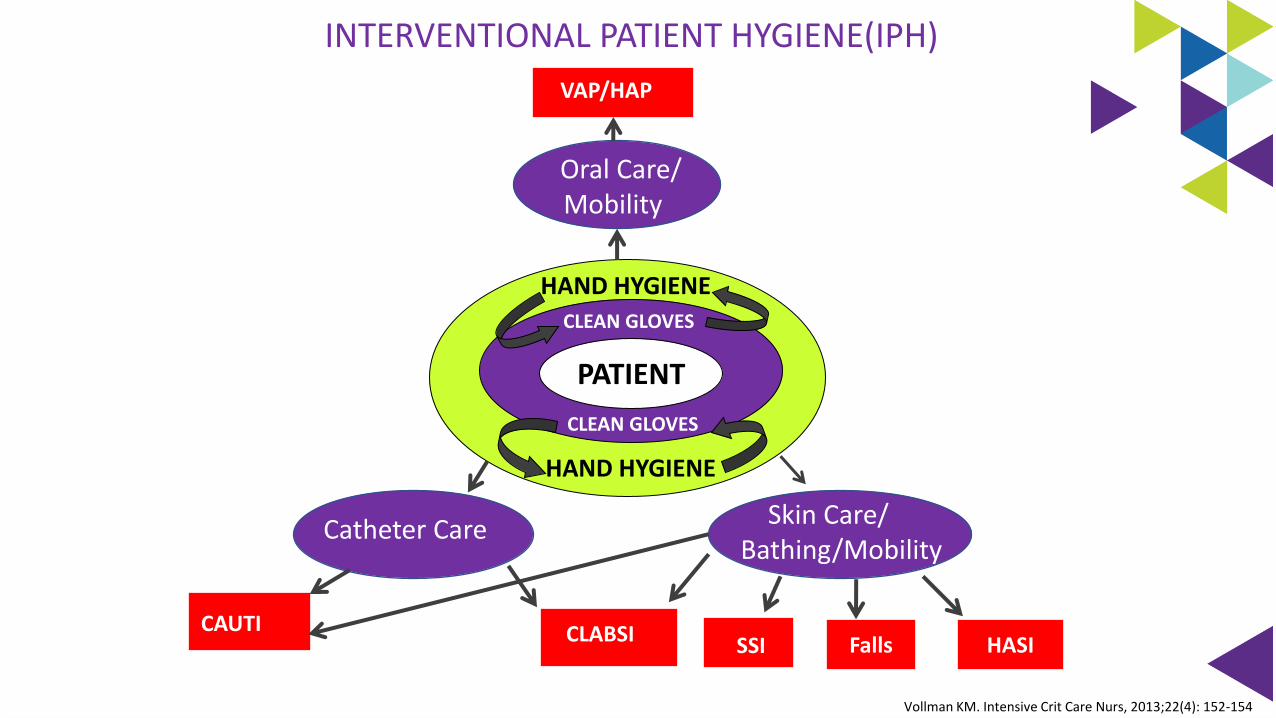
INTERVENTIONAL PATIENT HYGIENE(IPH)
HASI
Vollman KM. Intensive Crit Care Nurs, 2013;22(4): 152-154
Oral Care/ Mobility
VAP/HAP
Catheter Care
CAUTI CLABSI
Skin Care/ Bathing/Mobility
HASISSI
Patient
Falls
PATIENT
CLEAN GLOVES
CLEAN GLOVES
HAND HYGIENE
HAND HYGIENE
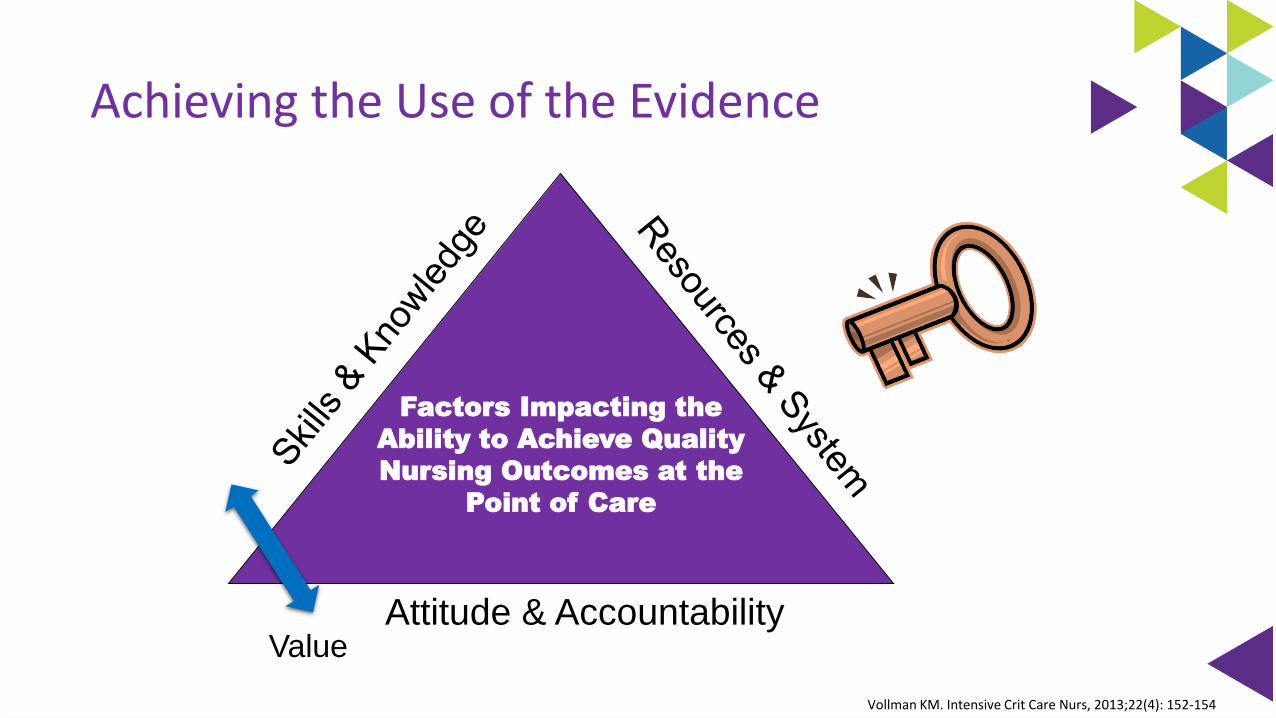
Achieving the Use of the Evidence
Vollman KM. Intensive Crit Care Nurs, 2013;22(4): 152-154
Attitude & Accountability
Factors Impacting the
Ability to Achieve Quality
Nursing Outcomes at the
Point of Care
Value
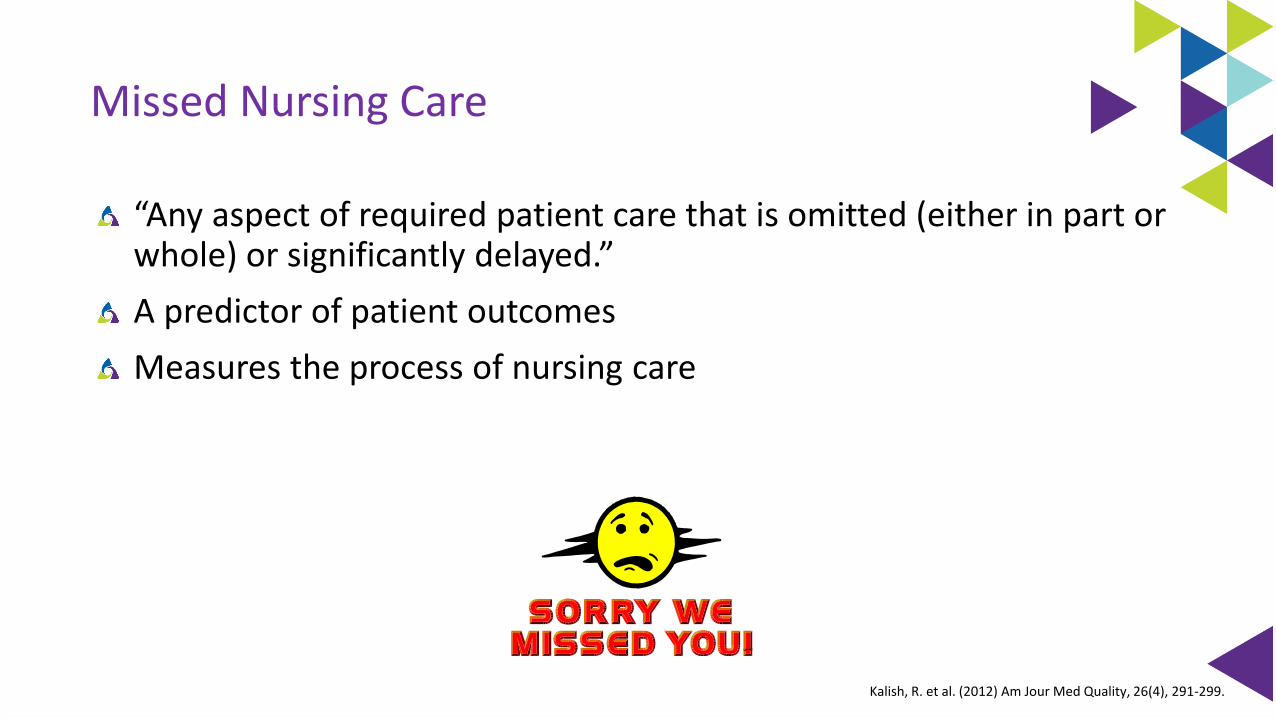
Missed Nursing Care
“Any aspect of required patient care that is omitted (either in part or whole) or significantly delayed.”
A predictor of patient outcomes
Measures the process of nursing care
Kalish, R. et al. (2012) Am Jour Med Quality, 26(4), 291-299.
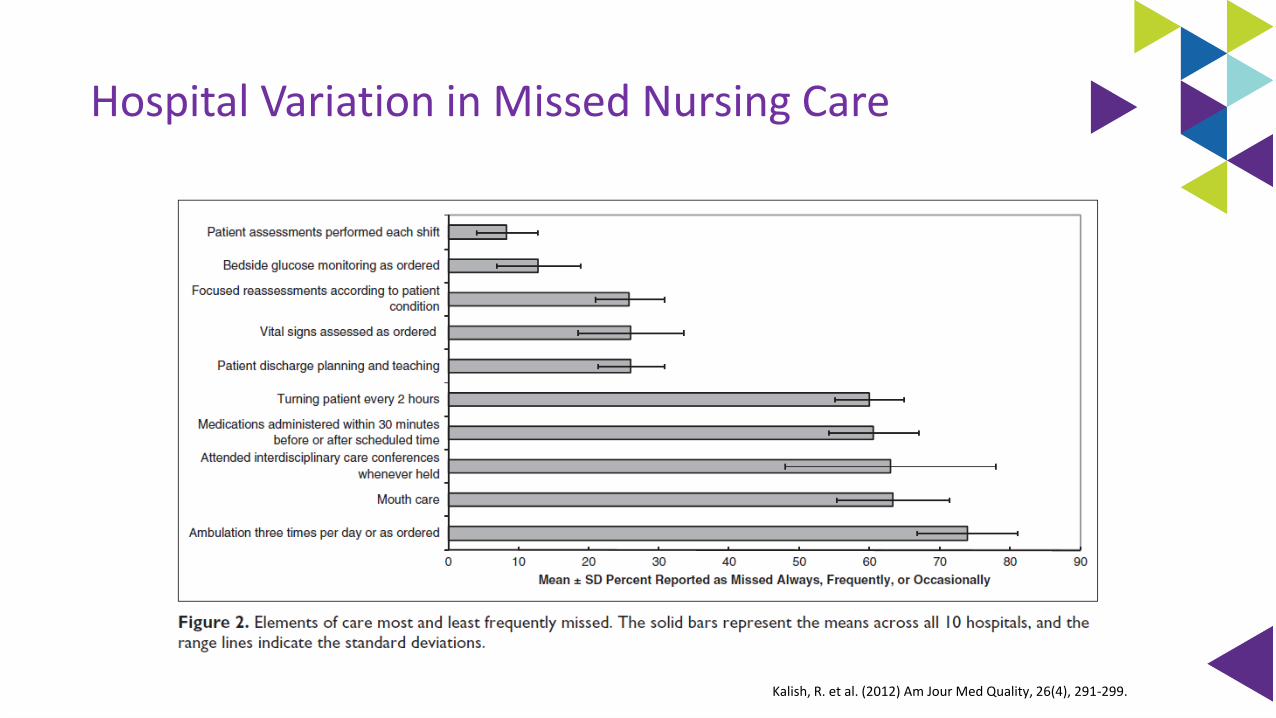
Hospital Variation in Missed Nursing Care
Kalish, R. et al. (2012) Am Jour Med Quality, 26(4), 291-299.
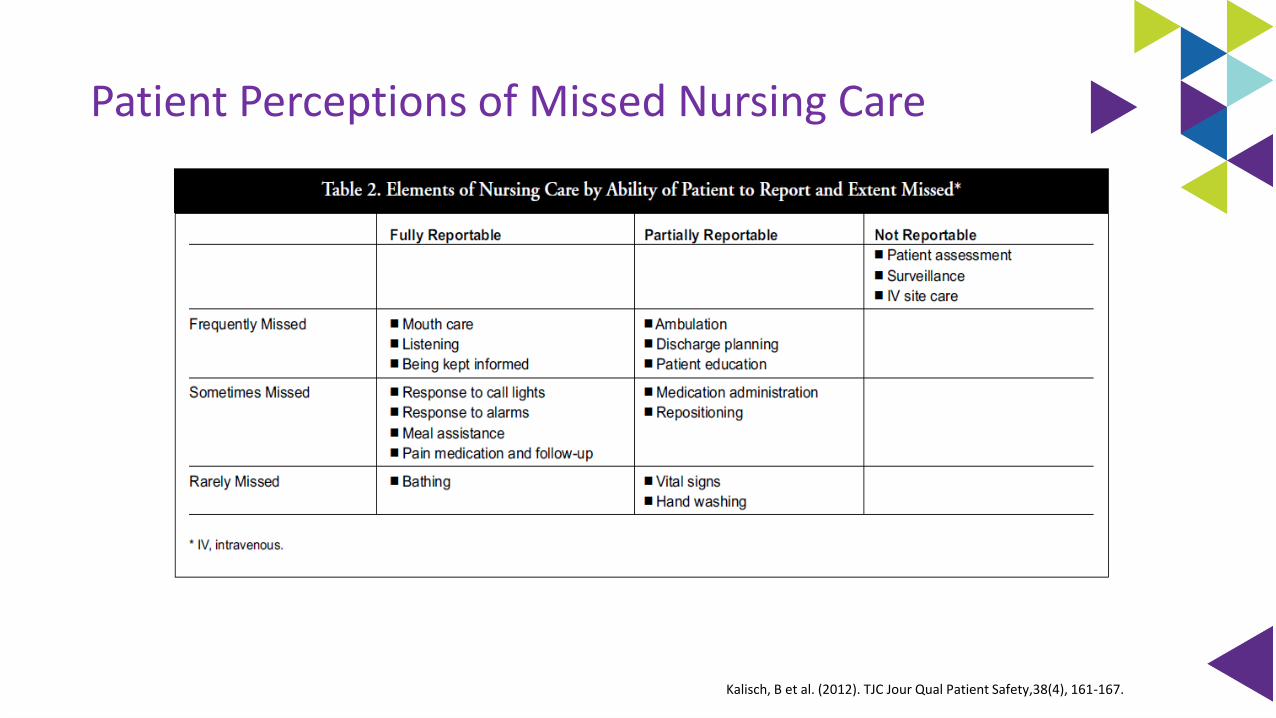
Patient Perceptions of Missed Nursing Care
Kalisch, B et al. (2012). TJC Jour Qual Patient Safety,38(4), 161-167.
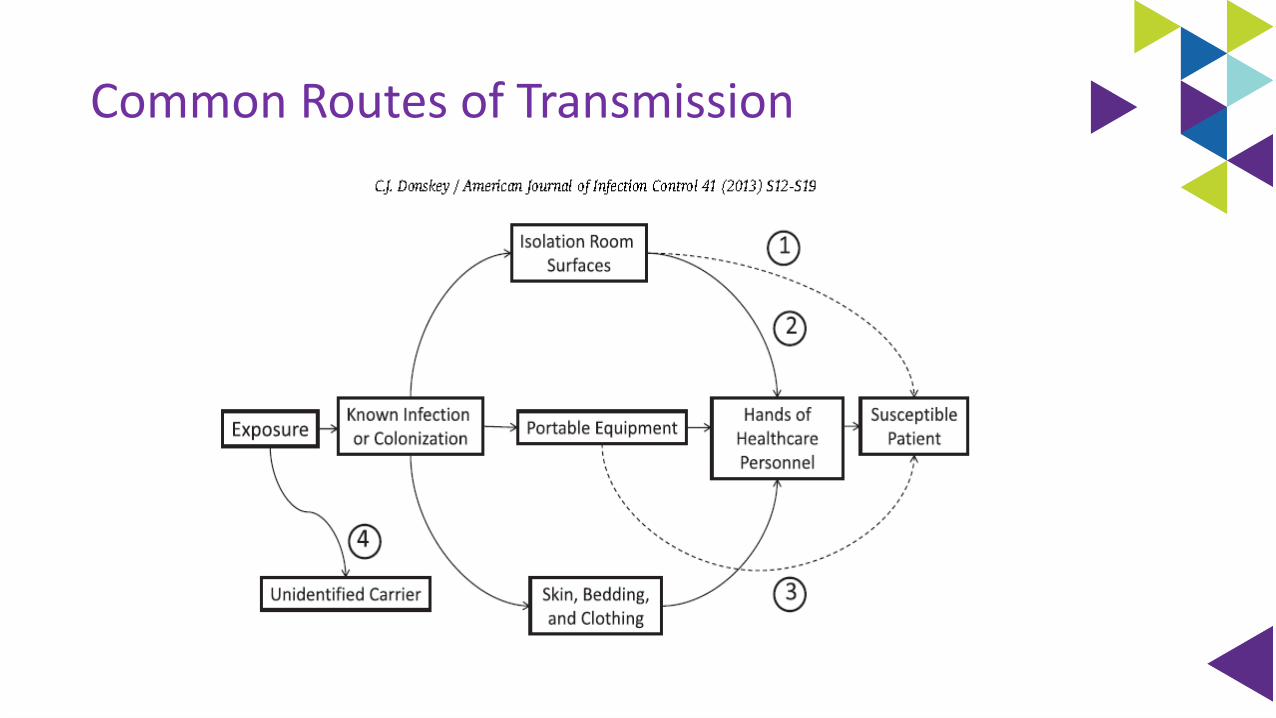
Common Routes of Transmission
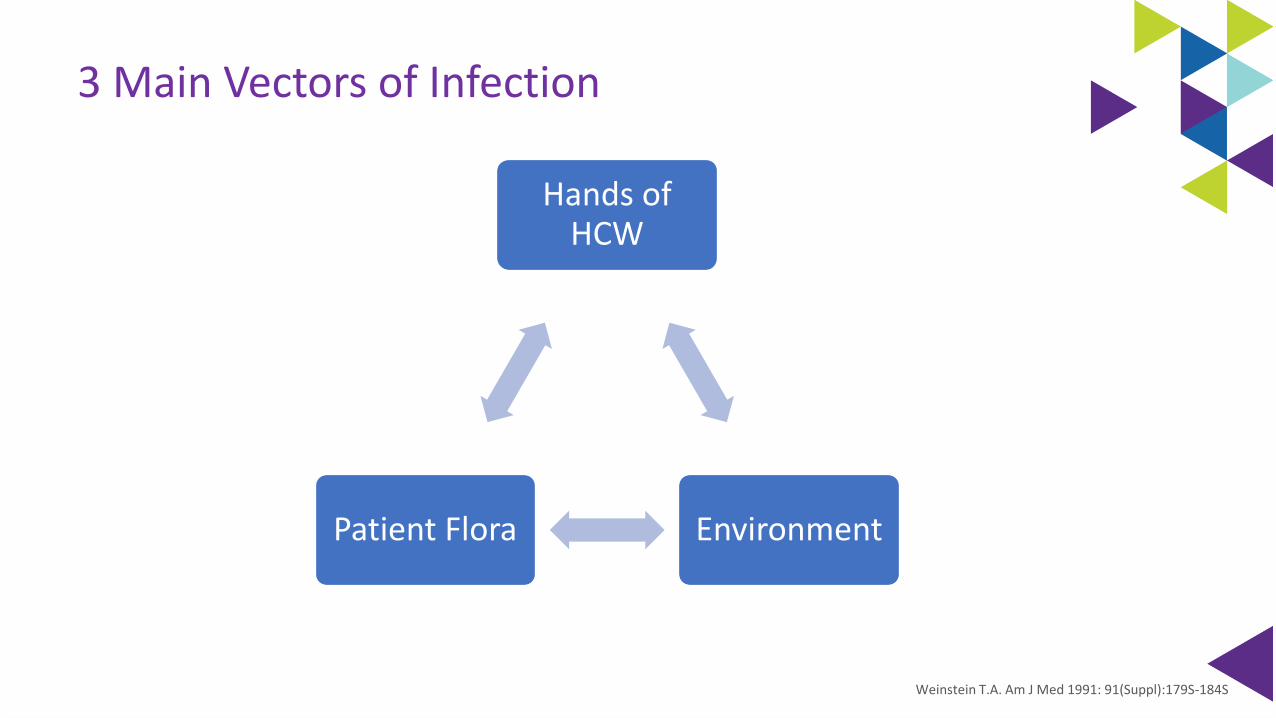
3 Main Vectors of Infection
Weinstein T.A. Am J Med 1991: 91(Suppl):179S-184S
Hands of HCW
EnvironmentPatient Flora
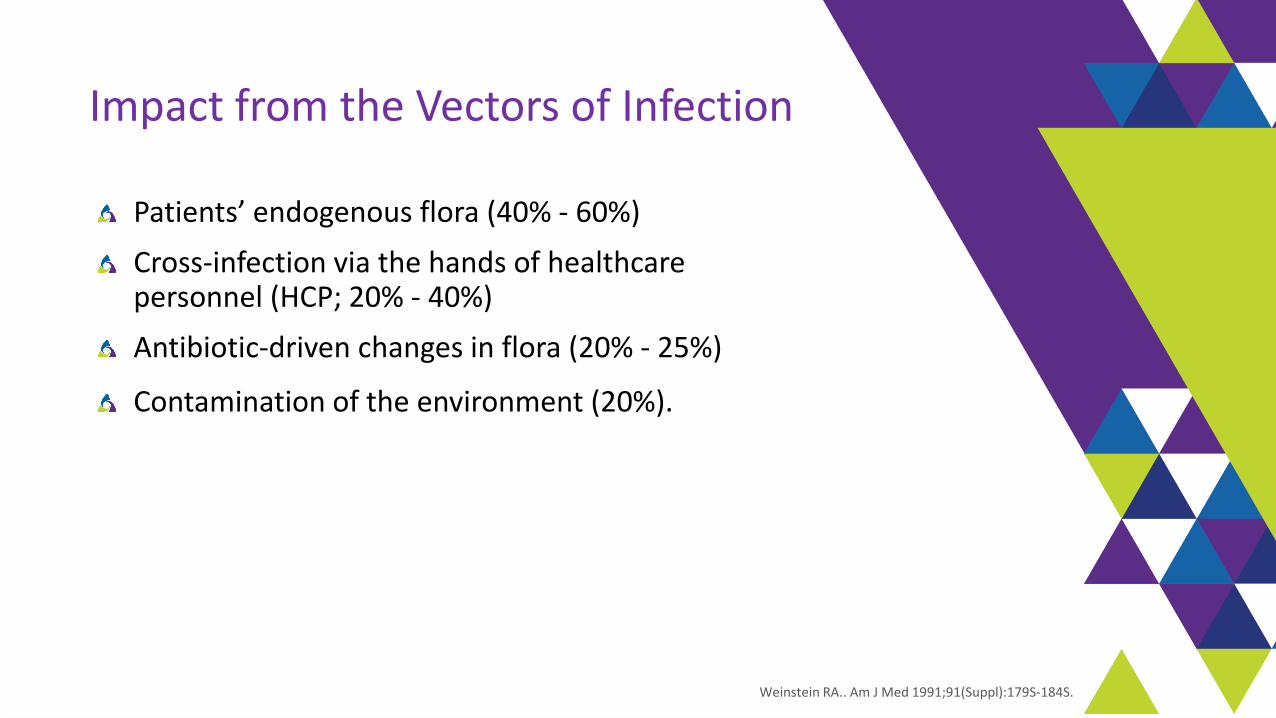
Impact from the Vectors of Infection
Patients’ endogenous flora (40% - 60%)
Cross-infection via the hands of healthcare personnel (HCP; 20% - 40%)
Antibiotic-driven changes in flora (20% - 25%)
Contamination of the environment (20%).
Weinstein RA.. Am J Med 1991;91(Suppl):179S-184S.
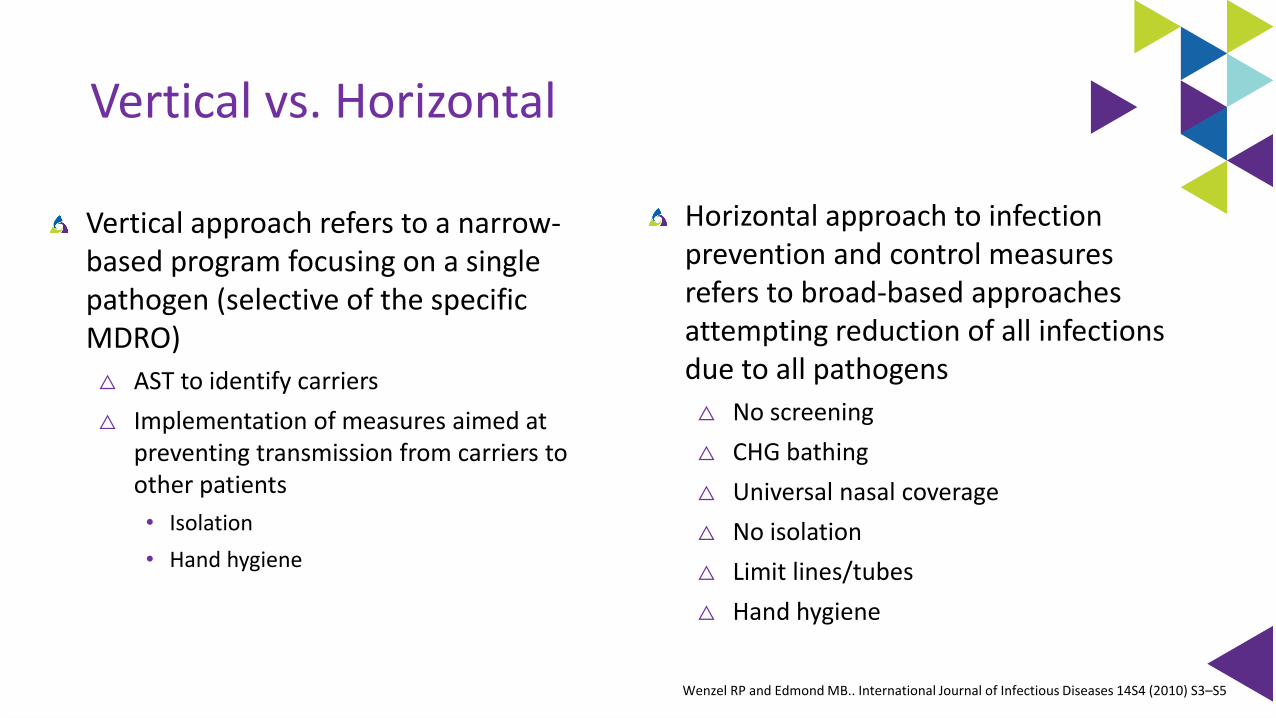
Vertical vs. Horizontal
Horizontal approach to infection prevention and control measures refers to broad-based approaches attempting reduction of all infections due to all pathogens
△ No screening
△ CHG bathing
△ Universal nasal coverage
△ No isolation
△ Limit lines/tubes
△ Hand hygiene
Vertical approach refers to a narrow-based program focusing on a single pathogen (selective of the specific MDRO)
△ AST to identify carriers
△ Implementation of measures aimed at preventing transmission from carriers to other patients
• Isolation
• Hand hygiene
Wenzel RP and Edmond MB.. International Journal of Infectious Diseases 14S4 (2010) S3–S5
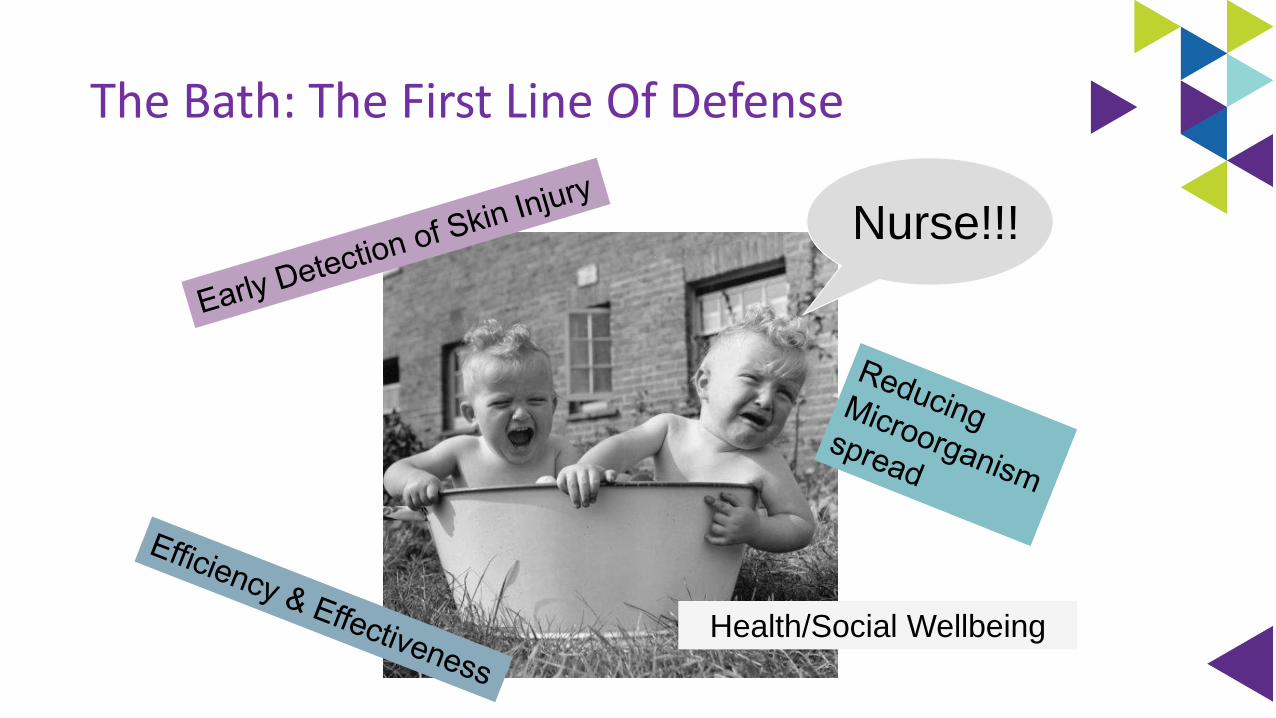
Nurse!!!
Health/Social Wellbeing
The Bath: The First Line Of Defense
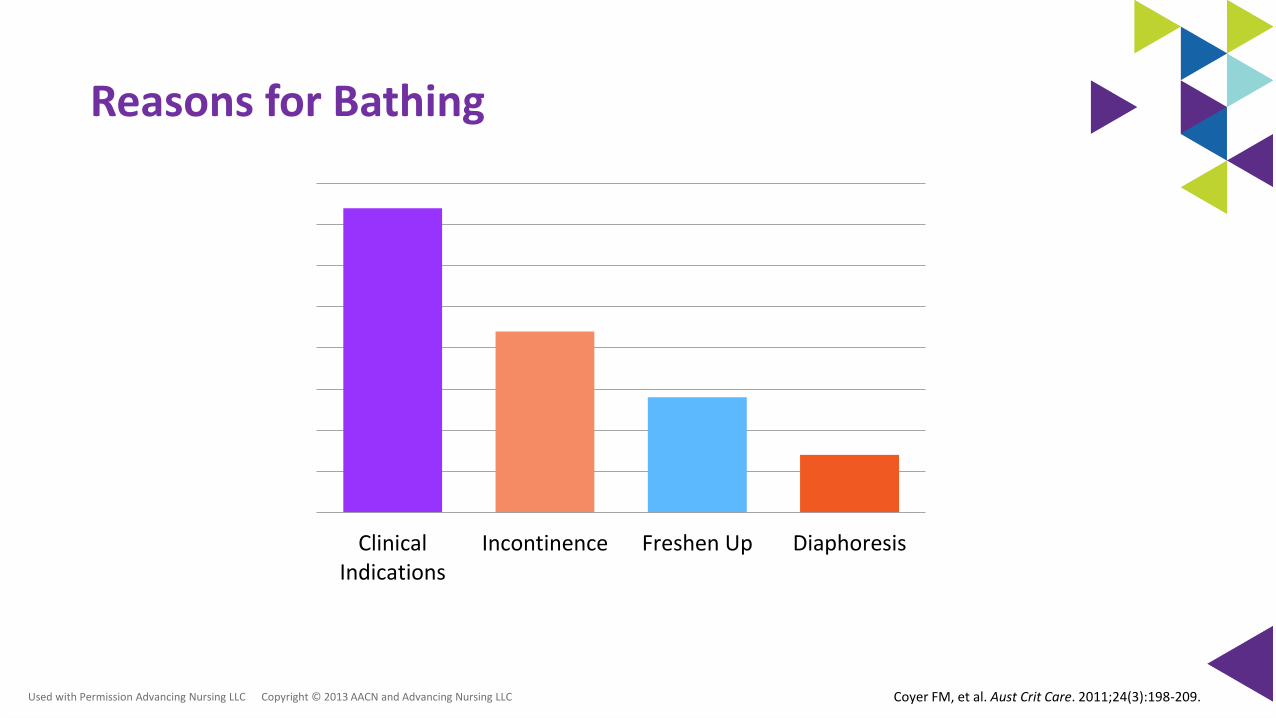
Reasons for Bathing
ClinicalIndications
Incontinence Freshen Up Diaphoresis
Used with Permission Advancing Nursing LLC Copyright © 2013 AACN and Advancing Nursing LLC Coyer FM, et al. Aust Crit Care. 2011;24(3):198-209.
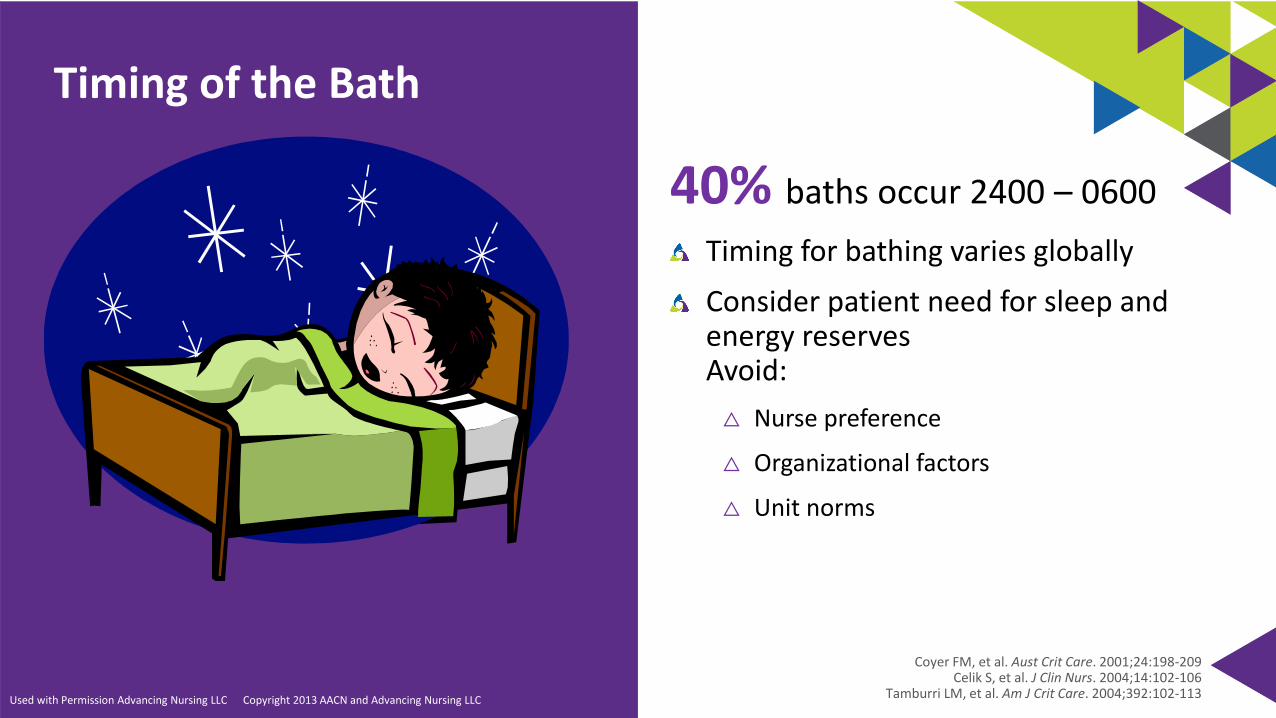
40% baths occur 2400 – 0600
Timing for bathing varies globally
Consider patient need for sleep and energy reserves Avoid:
△ Nurse preference
△ Organizational factors
△ Unit norms
Coyer FM, et al. Aust Crit Care. 2001;24:198-209Celik S, et al. J Clin Nurs. 2004;14:102-106
Tamburri LM, et al. Am J Crit Care. 2004;392:102-113
Timing of the Bath
Used with Permission Advancing Nursing LLC Copyright 2013 AACN and Advancing Nursing LLC
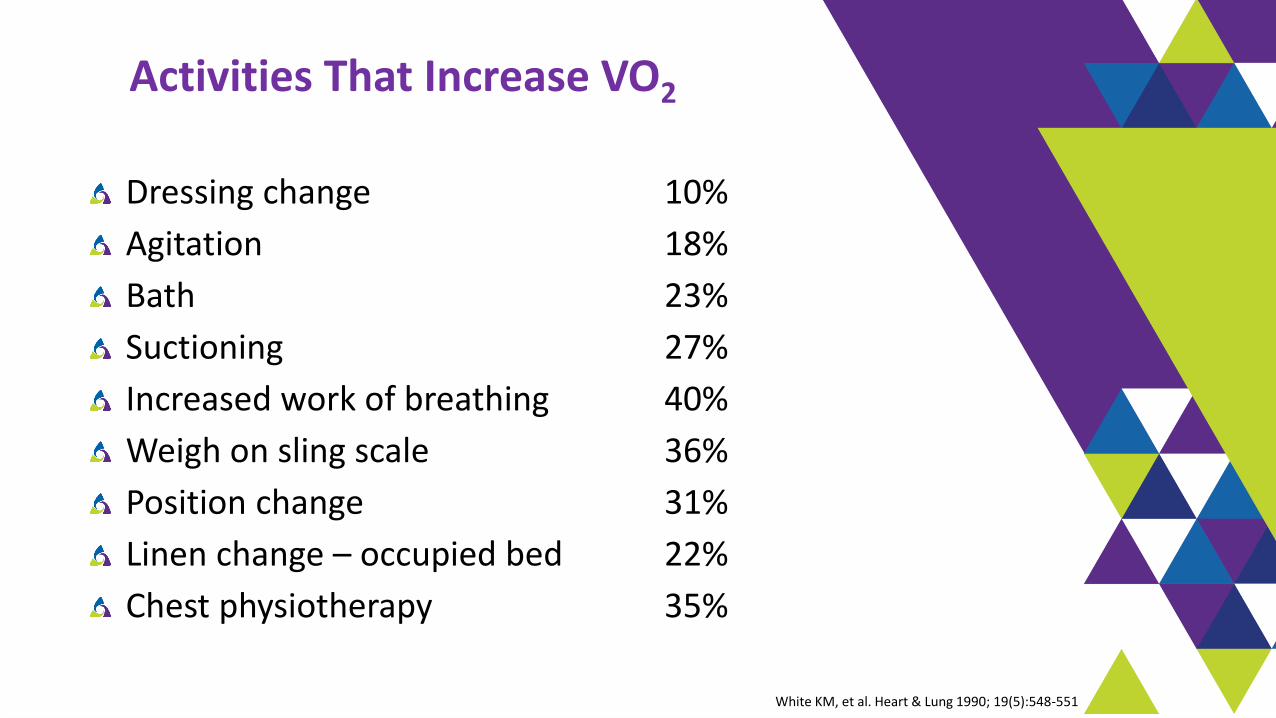
Activities That Increase VO2
Dressing change 10%
Agitation 18%
Bath 23%
Suctioning 27%
Increased work of breathing 40%
Weigh on sling scale 36%
Position change 31%
Linen change – occupied bed 22%
Chest physiotherapy 35%
White KM, et al. Heart & Lung 1990; 19(5):548-551
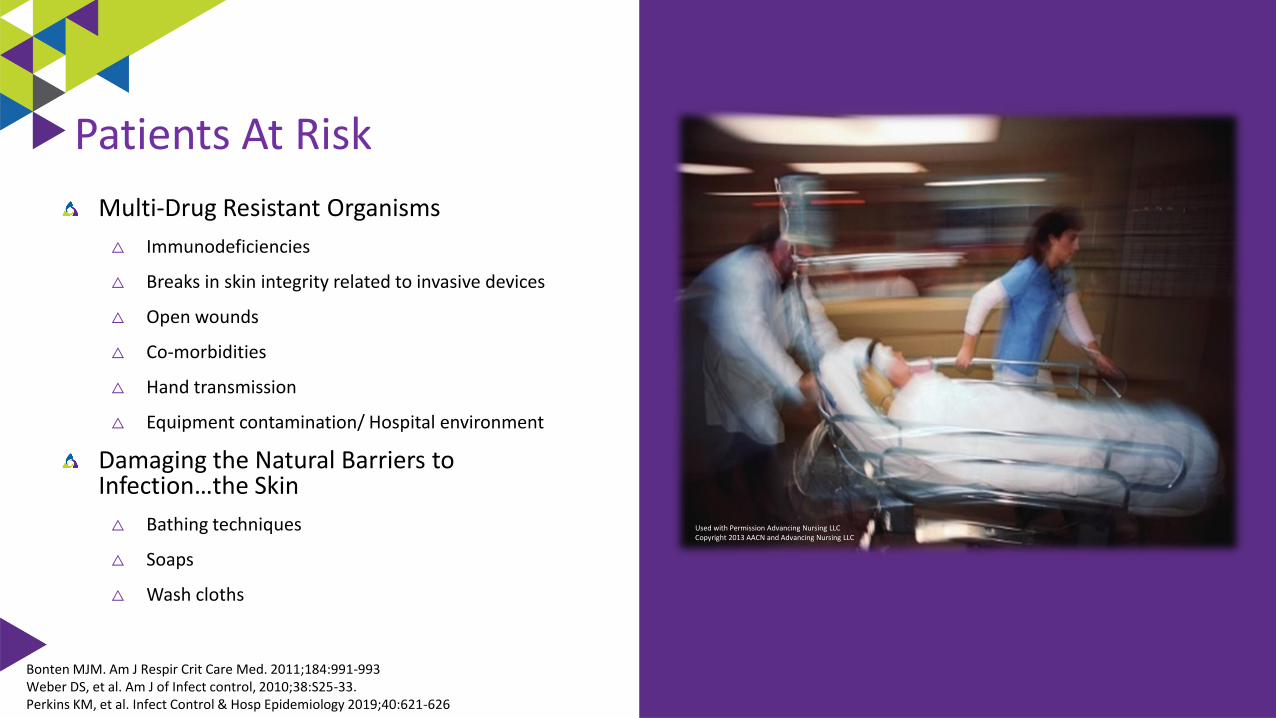
Multi-Drug Resistant Organisms
△ Immunodeficiencies
△ Breaks in skin integrity related to invasive devices
△ Open wounds
△ Co-morbidities
△ Hand transmission
△ Equipment contamination/ Hospital environment
Damaging the Natural Barriers to Infection…the Skin
△ Bathing techniques
△ Soaps
△ Wash cloths
Patients At Risk
Bonten MJM. Am J Respir Crit Care Med. 2011;184:991-993Weber DS, et al. Am J of Infect control, 2010;38:S25-33.Perkins KM, et al. Infect Control & Hosp Epidemiology 2019;40:621-626
Used with Permission Advancing Nursing LLC Copyright 2013 AACN and Advancing Nursing LLC
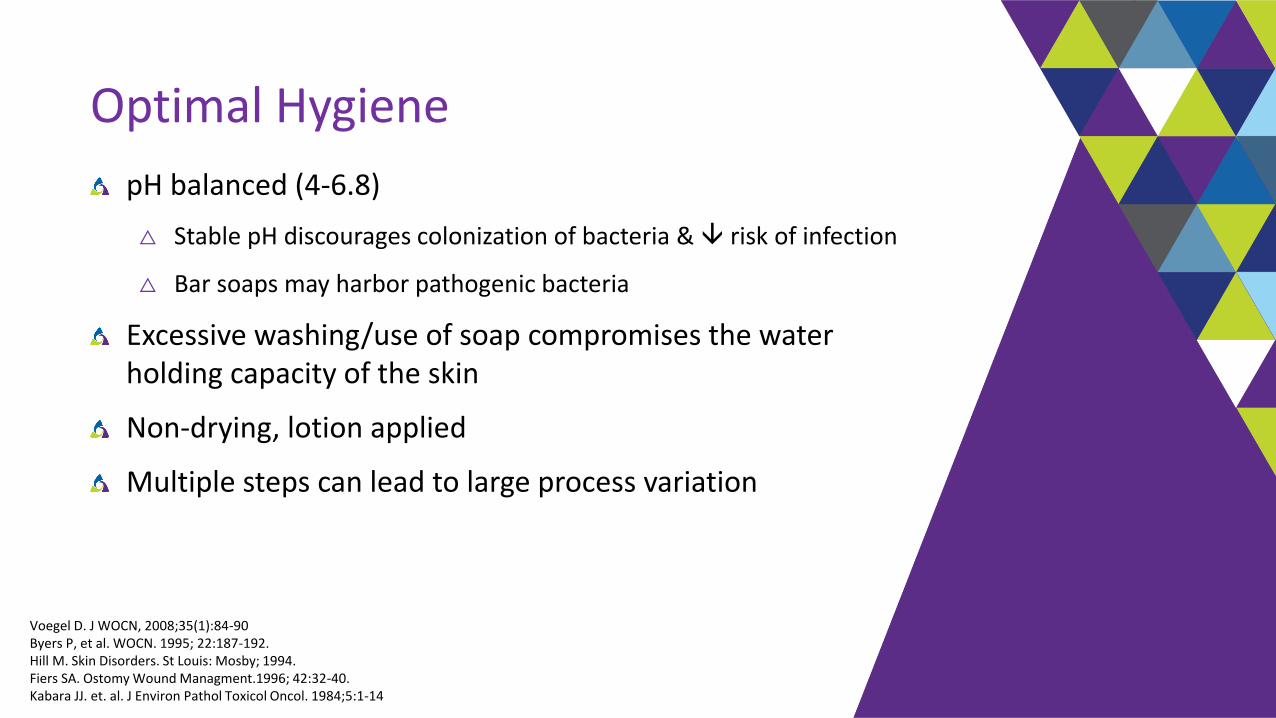
Optimal Hygiene
pH balanced (4-6.8)
△ Stable pH discourages colonization of bacteria & risk of infection
△ Bar soaps may harbor pathogenic bacteria
Excessive washing/use of soap compromises the water holding capacity of the skin
Non-drying, lotion applied
Multiple steps can lead to large process variation
Voegel D. J WOCN, 2008;35(1):84-90Byers P, et al. WOCN. 1995; 22:187-192.Hill M. Skin Disorders. St Louis: Mosby; 1994.Fiers SA. Ostomy Wound Managment.1996; 42:32-40.Kabara JJ. et. al. J Environ Pathol Toxicol Oncol. 1984;5:1-14
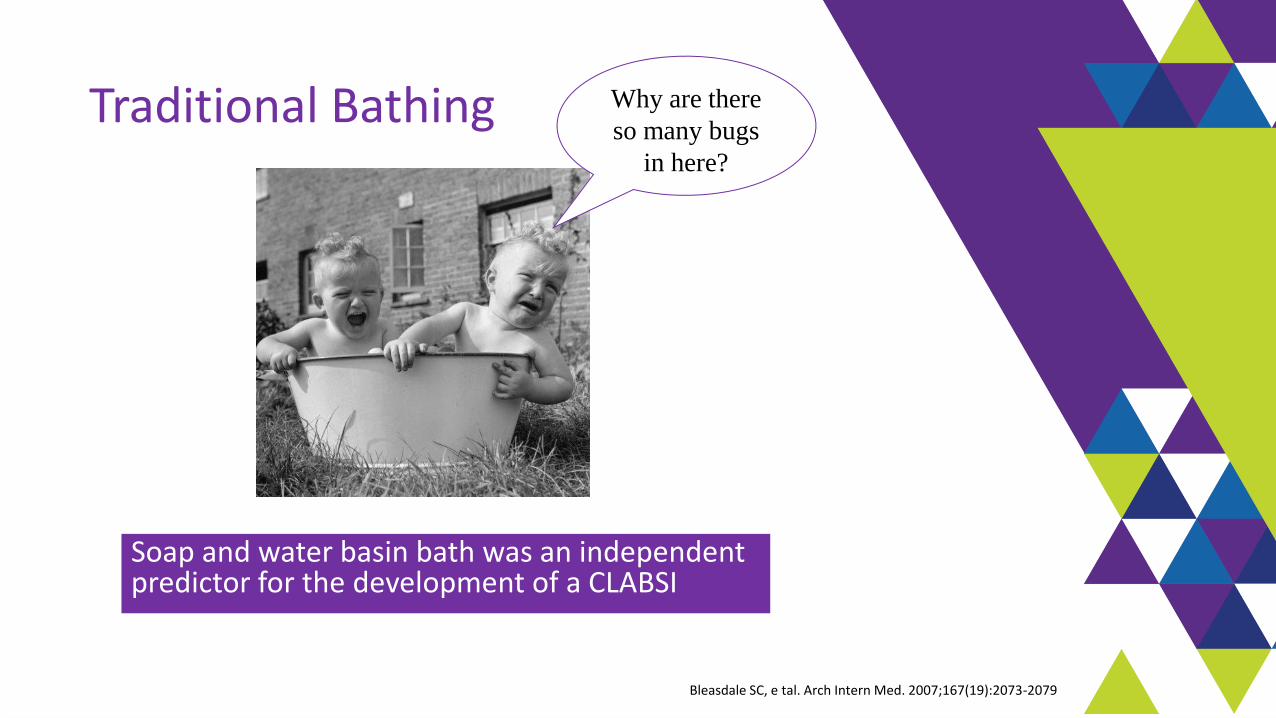
Traditional Bathing
Soap and water basin bath was an independent predictor for the development of a CLABSI
Why are there
so many bugs
in here?
Bleasdale SC, e tal. Arch Intern Med. 2007;167(19):2073-2079
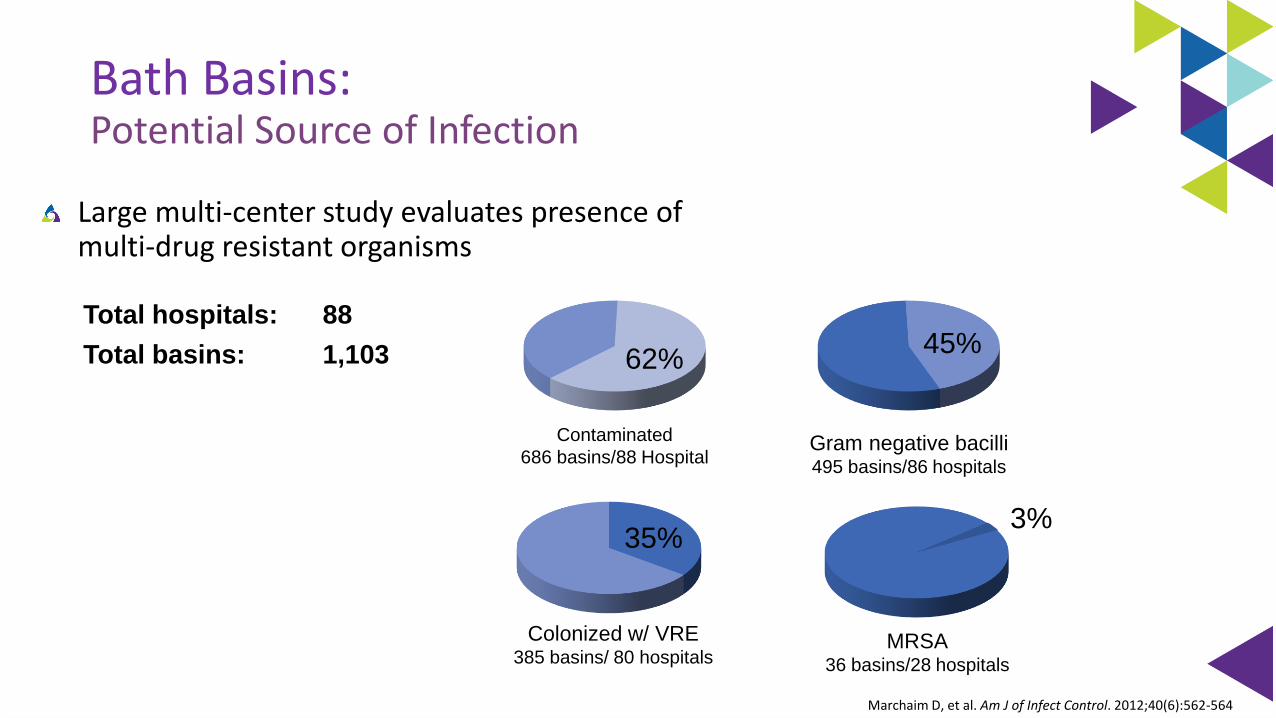
Bath Basins:Potential Source of Infection
Large multi-center study evaluates presence of multi-drug resistant organisms
Marchaim D, et al. Am J of Infect Control. 2012;40(6):562-564
Contaminated
686 basins/88 HospitalGram negative bacilli495 basins/86 hospitals
62%45%
Colonized w/ VRE385 basins/ 80 hospitals
35%
Total hospitals: 88
Total basins: 1,103
MRSA36 basins/28 hospitals
3%
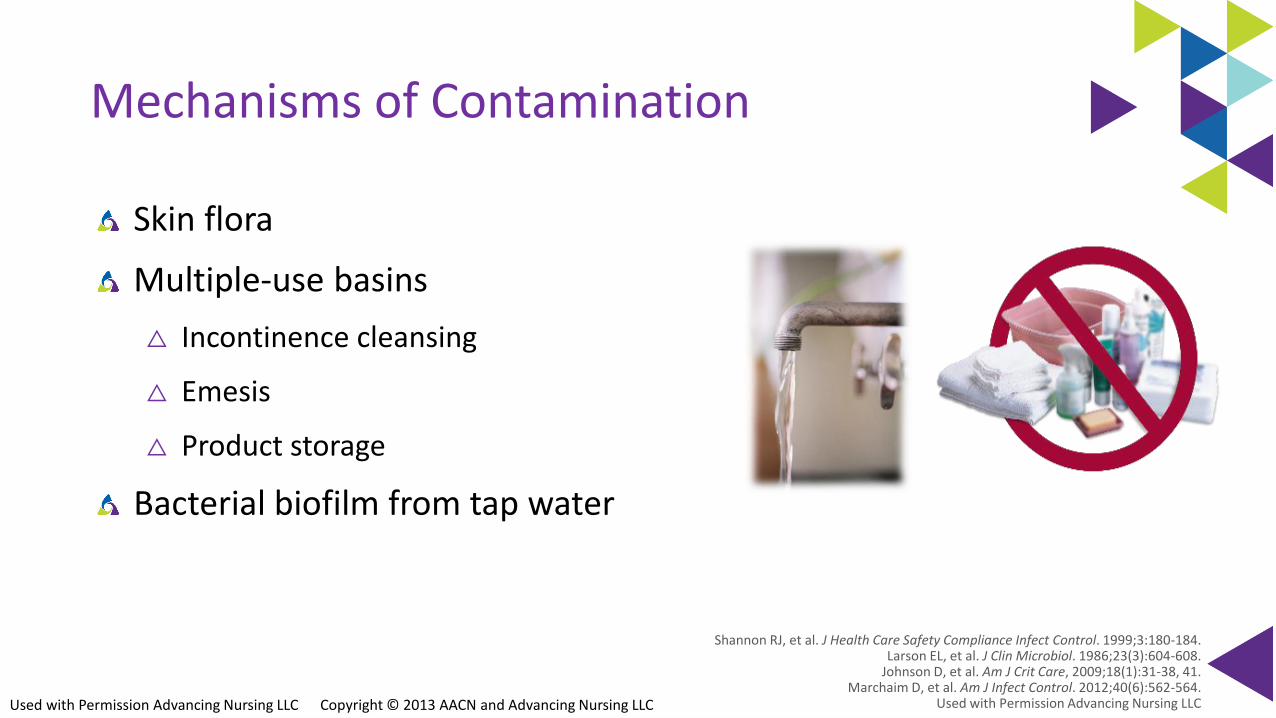
Mechanisms of Contamination
Skin flora
Multiple-use basins
△ Incontinence cleansing
△ Emesis
△ Product storage
Bacterial biofilm from tap water
Shannon RJ, et al. J Health Care Safety Compliance Infect Control. 1999;3:180-184.Larson EL, et al. J Clin Microbiol. 1986;23(3):604-608.
Johnson D, et al. Am J Crit Care, 2009;18(1):31-38, 41.Marchaim D, et al. Am J Infect Control. 2012;40(6):562-564.
Used with Permission Advancing Nursing LLCUsed with Permission Advancing Nursing LLC Copyright © 2013 AACN and Advancing Nursing LLC
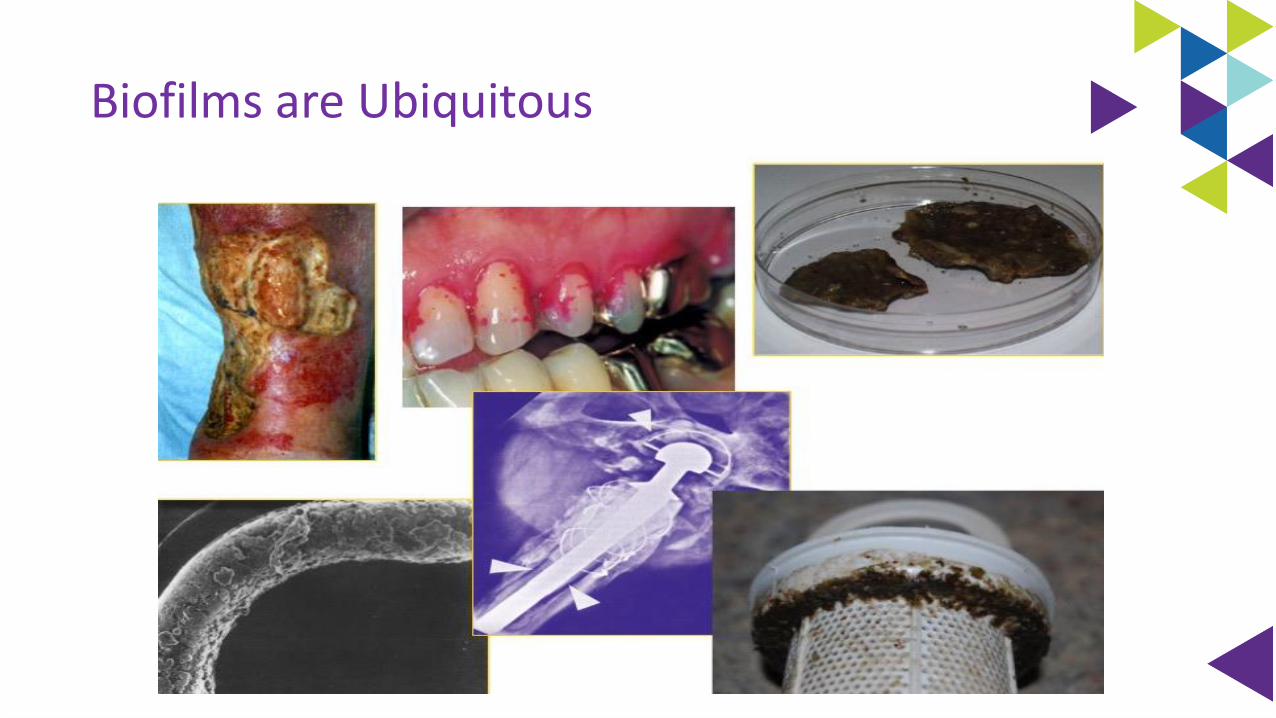
Biofilms are Ubiquitous
Understanding Water
All water with the exception of sterile water and filtered water is contaminated with microbes (eg, potable water, tap water, showers, and ice).
In healthy persons, contact or ingestion of such water rarely leads to infection.
However, contact or ingestion of such water may cause infection in immunocompromised persons or when applied to non-intact skin
Transmission of these pathogens from a water reservoir may occur by direct and indirect contact, ingestion and aspiration of contaminated water, or inhalation of aerosols*
Compared sink & water based care activities to non sink and non water based care activities on GNB colonization in ICU. Found rate dropped from 26.1 to 21.6 colonization pre 1000 ICU days. Greater reduction with longer ICU LOS’s
Presented at MSIPC October 6th, 2016, Lansing MI by Dorine Berriel‐Cass*Decker BK, et al. Opin Infect Dis 2013; 26:345–51
Hopman, J., et al. Antimicrob Resist Infect Control 6, 59 (2017).
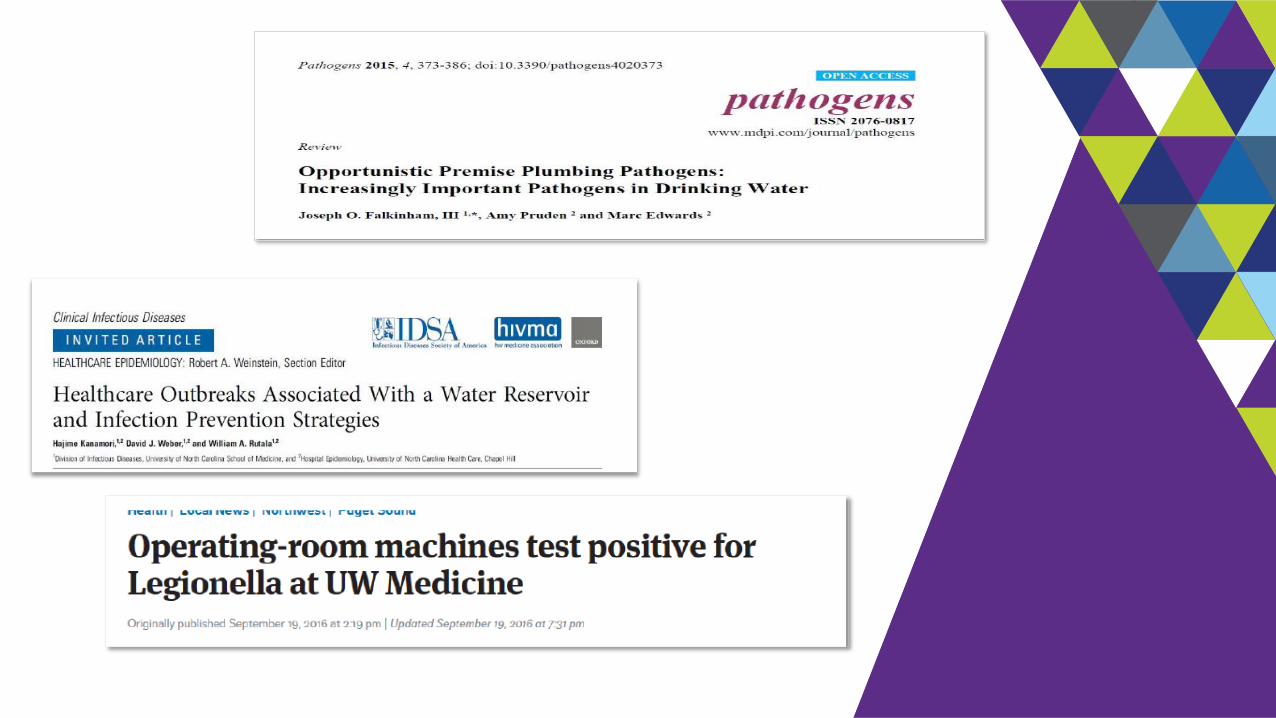
Waterborne Infection
Hospital Tap Water
Bacterial biofilm
Most overlooked source for pathogens
29 studies demonstrate an association with HAIs and outbreaks
Transmission:
△ Drinking
△ Sinks
△ Bathing
△ Rinsing items
△ Contaminated environmental surfaces
△ Contaminated ice machines
Immunocompromised patients at greatest riskAnaissie EJ, et al. Arch Intern Med. 2002;162(13):1483-1492.
Cervia JS, et al. Arch Intern Med, 2007;167:92-93Trautmann M, et al. Am J of Infect Control, 2005;33(5):S41-S49,
https://www.pinterest.com/pin/332914597437828576/?l=tKanwar A, et al. Am J Infect Control. 2017;45(11):1273-1275.
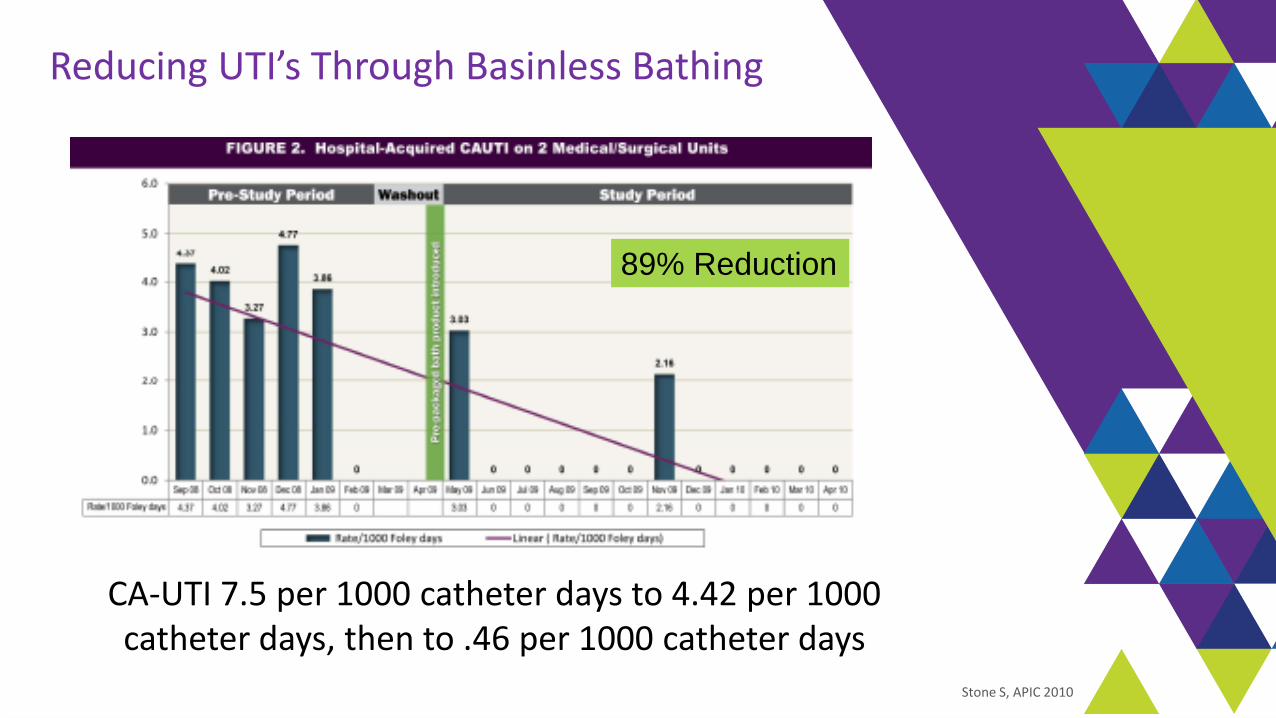
CA-UTI 7.5 per 1000 catheter days to 4.42 per 1000 catheter days, then to .46 per 1000 catheter days
89% Reduction
Reducing UTI’s Through Basinless Bathing
Stone S, APIC 2010
0
2
4
6
8
10
12
14
16
18
20
QTR 1
FY05
QTR 2
FY05
QTR 3
FY05
QTR 4
FY05
QTR 1
FY06
QTR 2
FY06
QTR 3
FY06
Ra
te/1
00
0 D
ev
ice
Da
ys
50th percentile
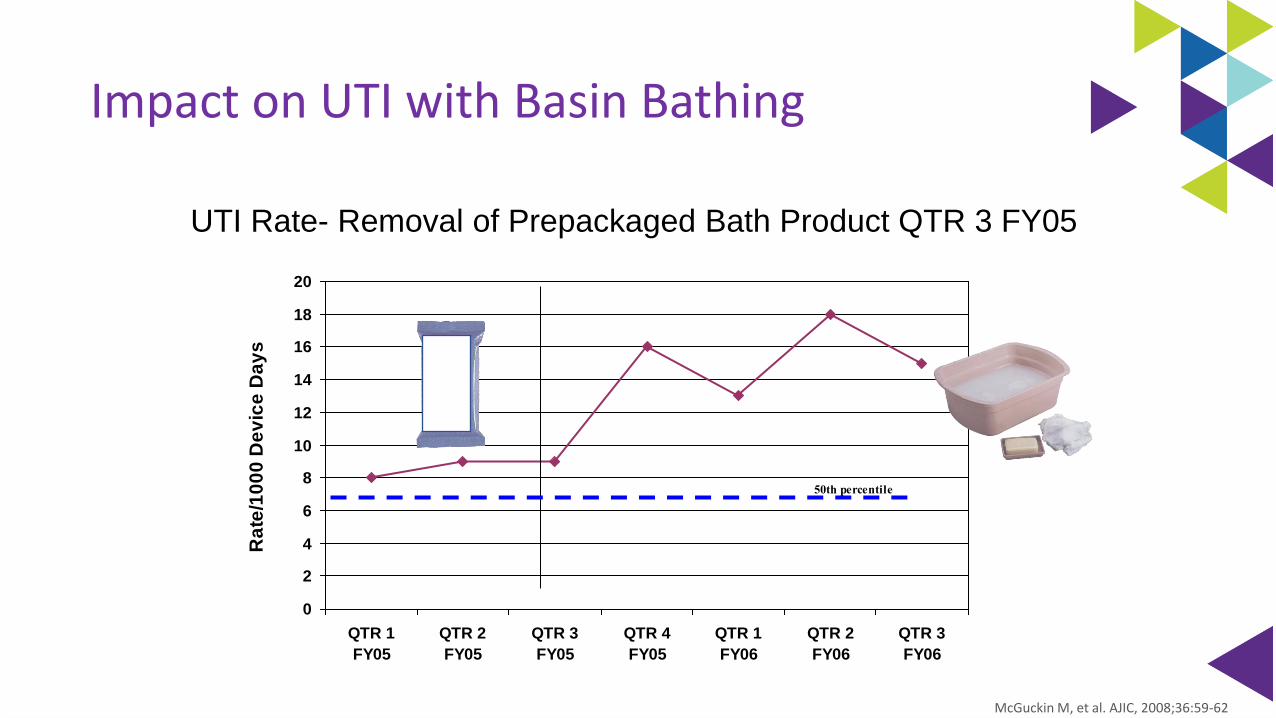
UTI Rate- Removal of Prepackaged Bath Product QTR 3 FY05
Impact on UTI with Basin Bathing
McGuckin M, et al. AJIC, 2008;36:59-62
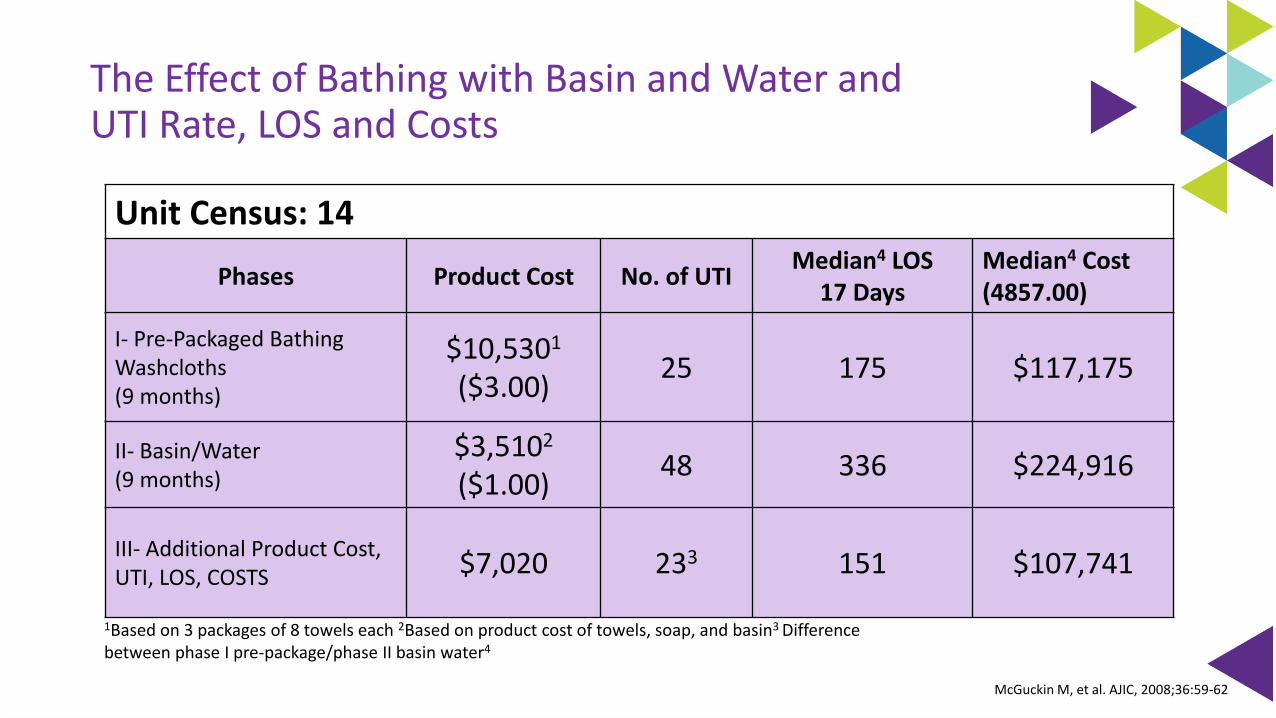
Unit Census: 14
Phases Product Cost No. of UTIMedian4 LOS
17 DaysMedian4 Cost(4857.00)
I- Pre-Packaged Bathing Washcloths(9 months)
$10,5301
($3.00)25 175 $117,175
II- Basin/Water(9 months)
$3,5102
($1.00)48 336 $224,916
III- Additional Product Cost, UTI, LOS, COSTS $7,020 233 151 $107,741
1Based on 3 packages of 8 towels each 2Based on product cost of towels, soap, and basin3 Difference between phase I pre-package/phase II basin water4
The Effect of Bathing with Basin and Water and UTI Rate, LOS and Costs
McGuckin M, et al. AJIC, 2008;36:59-62
Review of Literature: Bathing & CAUTI’s
Bacterial contamination of bath basins is common leading to the recommendation that bathing wipes replace bath basins to reduce HAI’s & CAUTI’s
Non medicated basin less bathing lowered the incidence of CAUTI’s, decreased bathing time and resulted in a cost savings
No data to support benefit of CHG wipes in reducing CAUTI’s
△ Studies on going
Strouse AC. Appraising the Literature On Bathing Practices And Catheter-Associated Urinary Tract Infection Prevention. Urol Nurs. 2015;35(1):11-17.
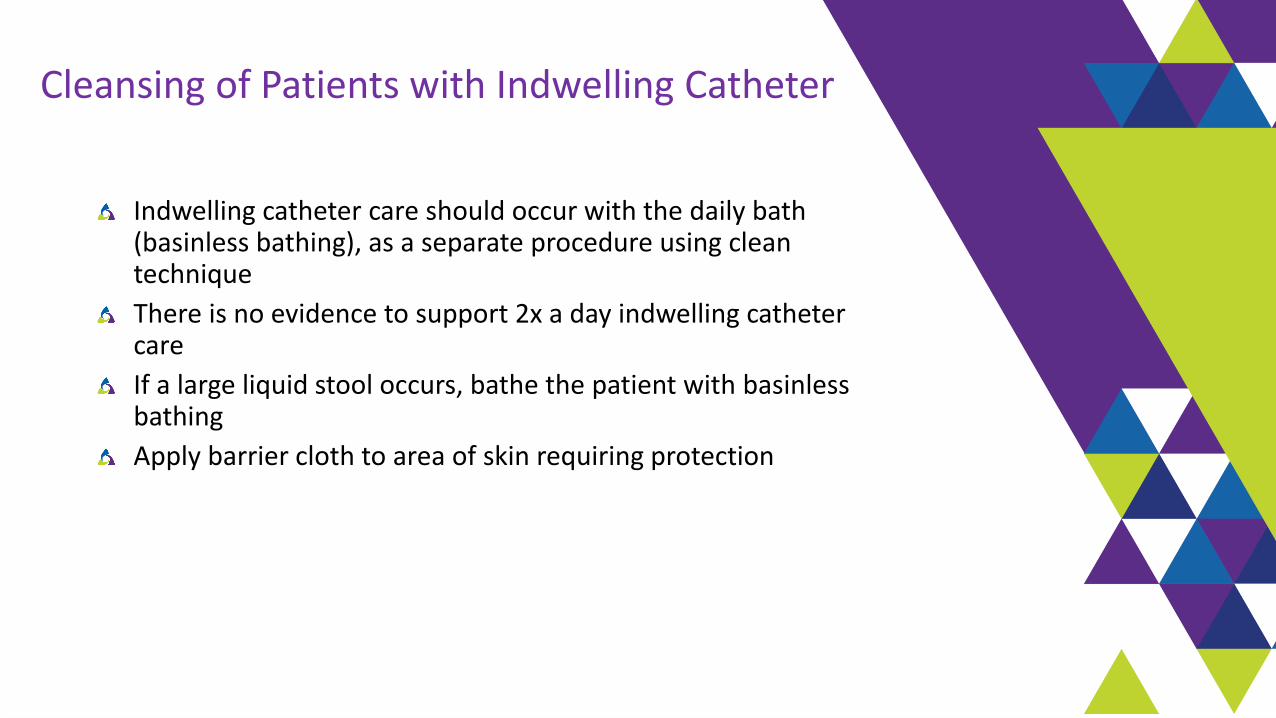
Cleansing of Patients with Indwelling Catheter
Indwelling catheter care should occur with the daily bath (basinless bathing), as a separate procedure using clean technique
There is no evidence to support 2x a day indwelling catheter care
If a large liquid stool occurs, bathe the patient with basinlessbathing
Apply barrier cloth to area of skin requiring protection
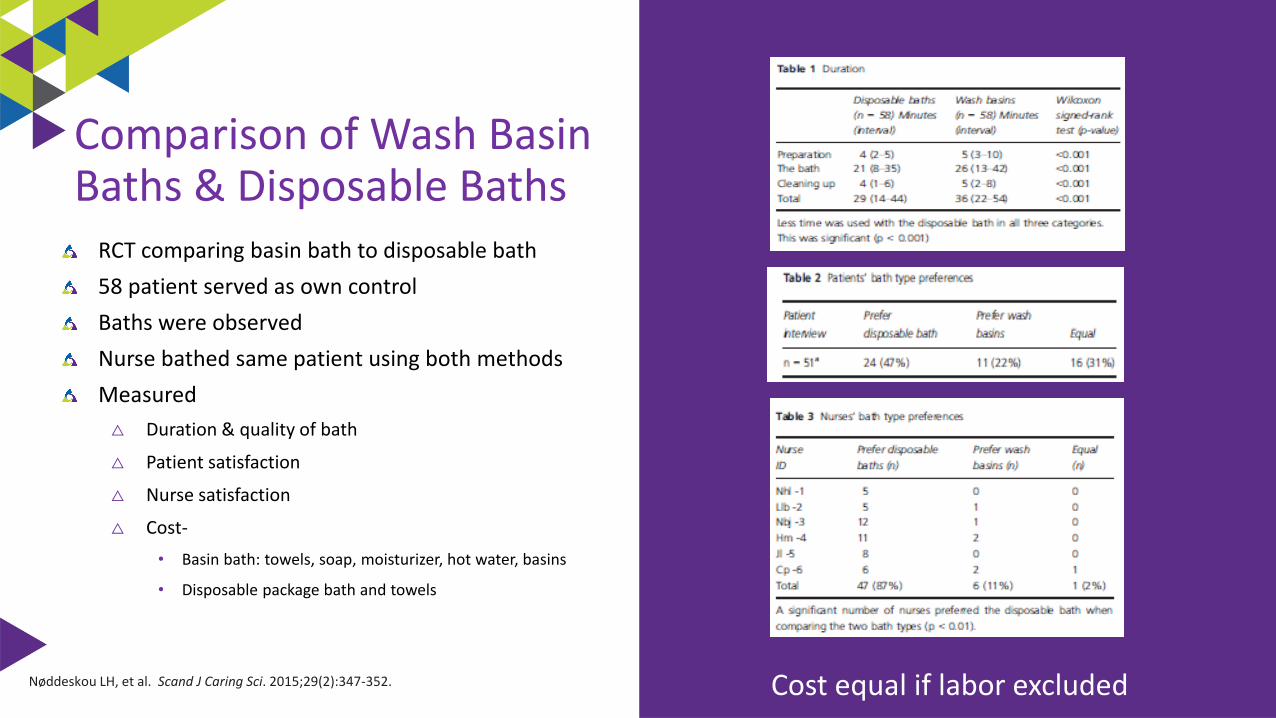
RCT comparing basin bath to disposable bath
58 patient served as own control
Baths were observed
Nurse bathed same patient using both methods
Measured
△ Duration & quality of bath
△ Patient satisfaction
△ Nurse satisfaction
△ Cost-
• Basin bath: towels, soap, moisturizer, hot water, basins
• Disposable package bath and towels
Nøddeskou LH, et al. Scand J Caring Sci. 2015;29(2):347-352.
Comparison of Wash Basin Baths & Disposable Baths
Cost equal if labor excluded
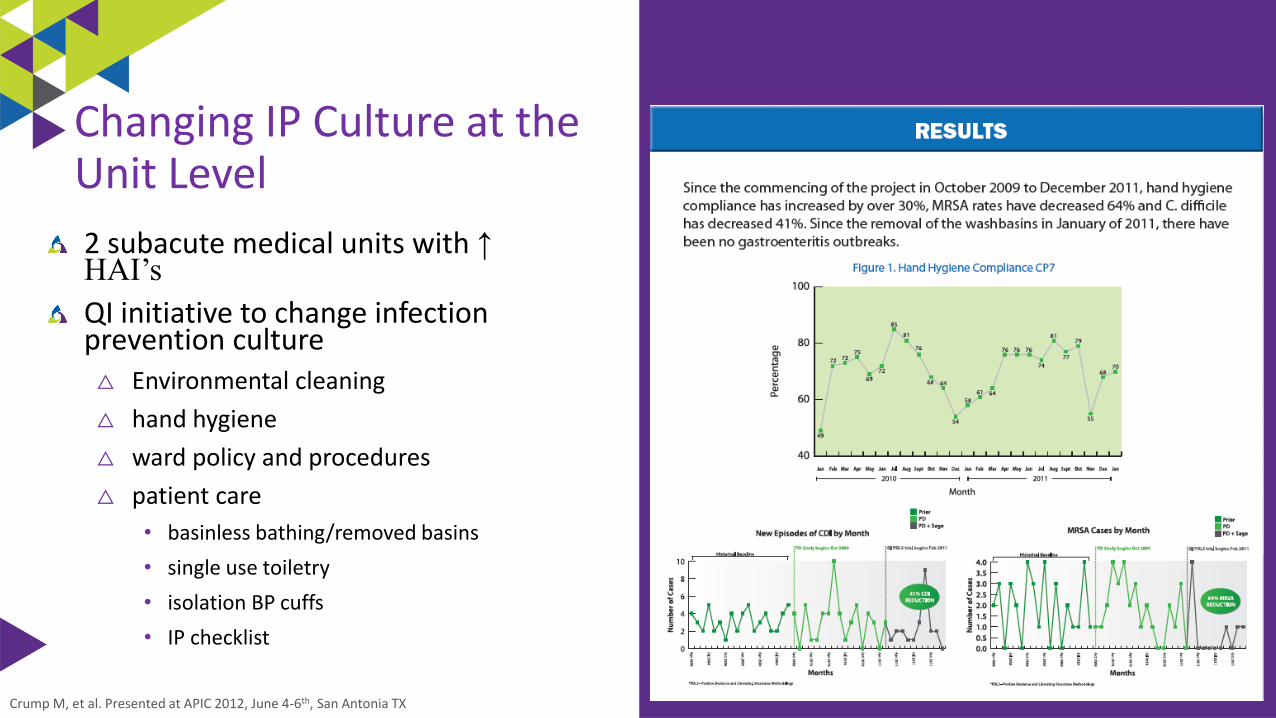
2 subacute medical units with ↑ HAI’s
QI initiative to change infection prevention culture△ Environmental cleaning
△ hand hygiene
△ ward policy and procedures
△ patient care
• basinless bathing/removed basins
• single use toiletry
• isolation BP cuffs
• IP checklist
Crump M, et al. Presented at APIC 2012, June 4-6th, San Antonia TX
Changing IP Culture at the Unit Level
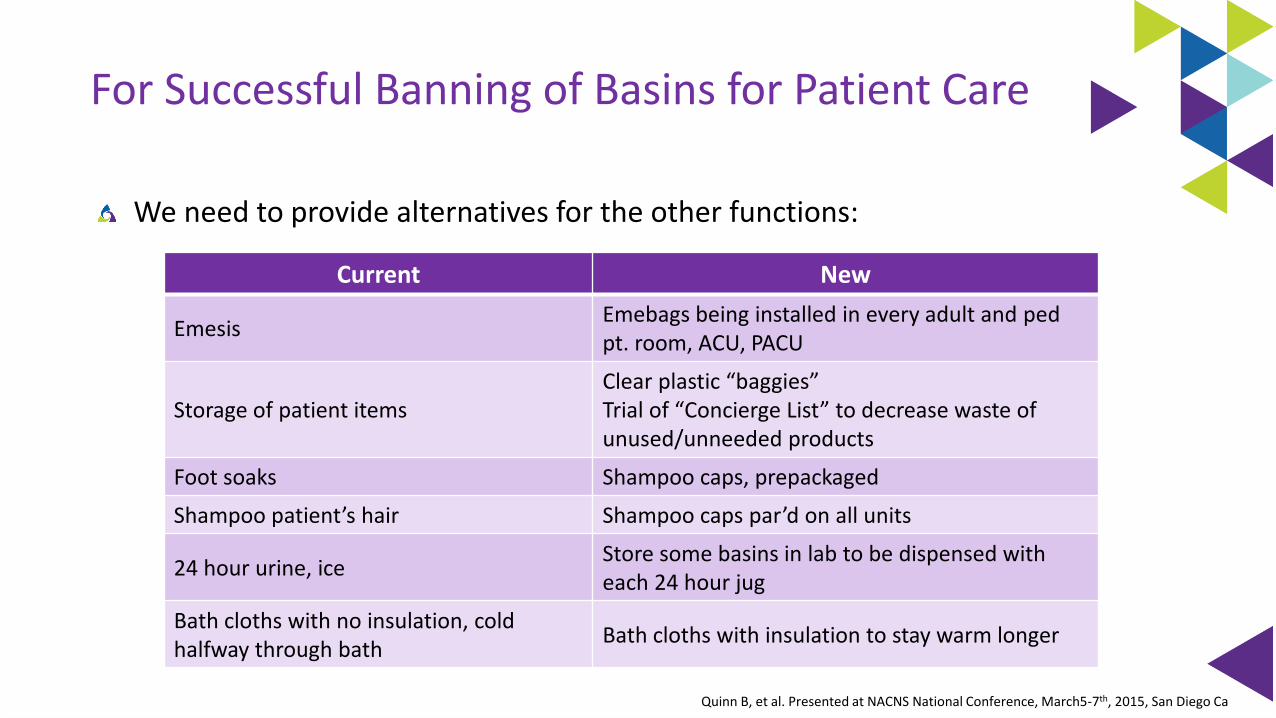
For Successful Banning of Basins for Patient Care
We need to provide alternatives for the other functions:
Current New
EmesisEmebags being installed in every adult and pedpt. room, ACU, PACU
Storage of patient itemsClear plastic “baggies” Trial of “Concierge List” to decrease waste of unused/unneeded products
Foot soaks Shampoo caps, prepackaged
Shampoo patient’s hair Shampoo caps par’d on all units
24 hour urine, iceStore some basins in lab to be dispensed with each 24 hour jug
Bath cloths with no insulation, cold halfway through bath
Bath cloths with insulation to stay warm longer
Quinn B, et al. Presented at NACNS National Conference, March5-7th, 2015, San Diego Ca
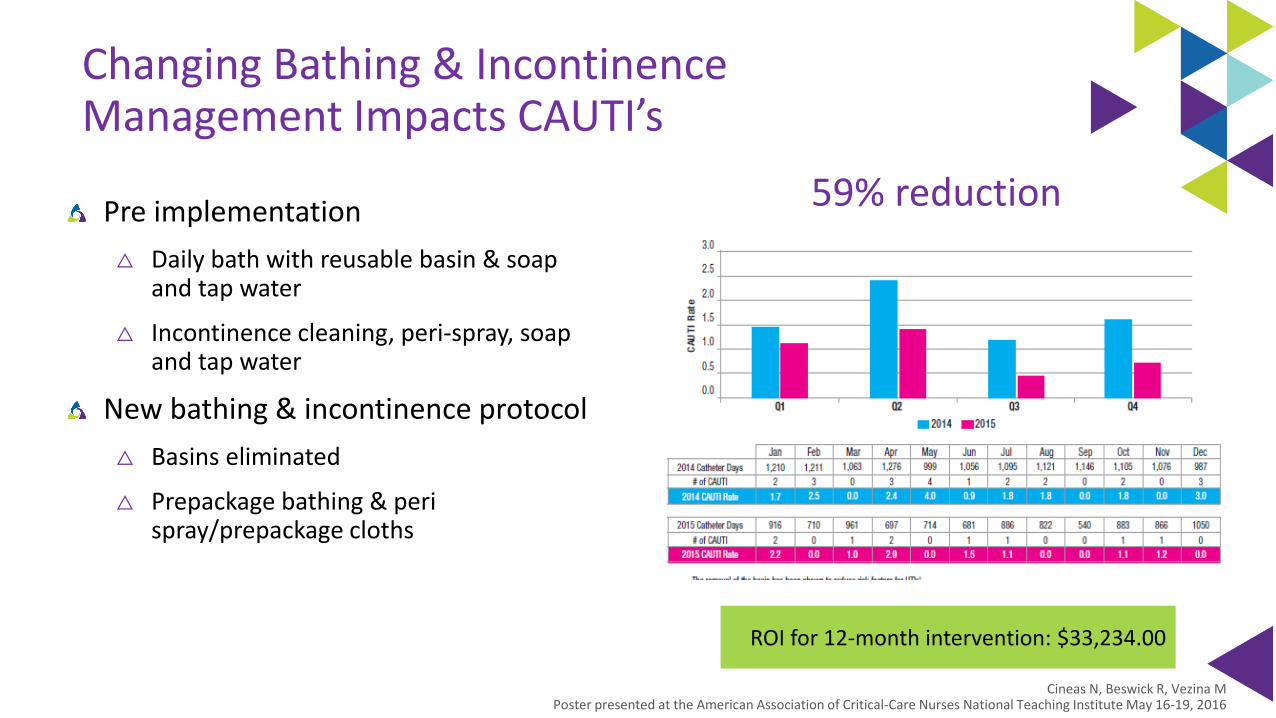
Changing Bathing & Incontinence Management Impacts CAUTI’s
Pre implementation
△ Daily bath with reusable basin & soap and tap water
△ Incontinence cleaning, peri-spray, soap and tap water
New bathing & incontinence protocol
△ Basins eliminated
△ Prepackage bathing & peri spray/prepackage cloths
Cineas N, Beswick R, Vezina MPoster presented at the American Association of Critical-Care Nurses National Teaching Institute May 16-19, 2016
59% reduction
ROI for 12-month intervention: $33,234.00
Non-Vent Pneumonia: Addressing Risk Factors
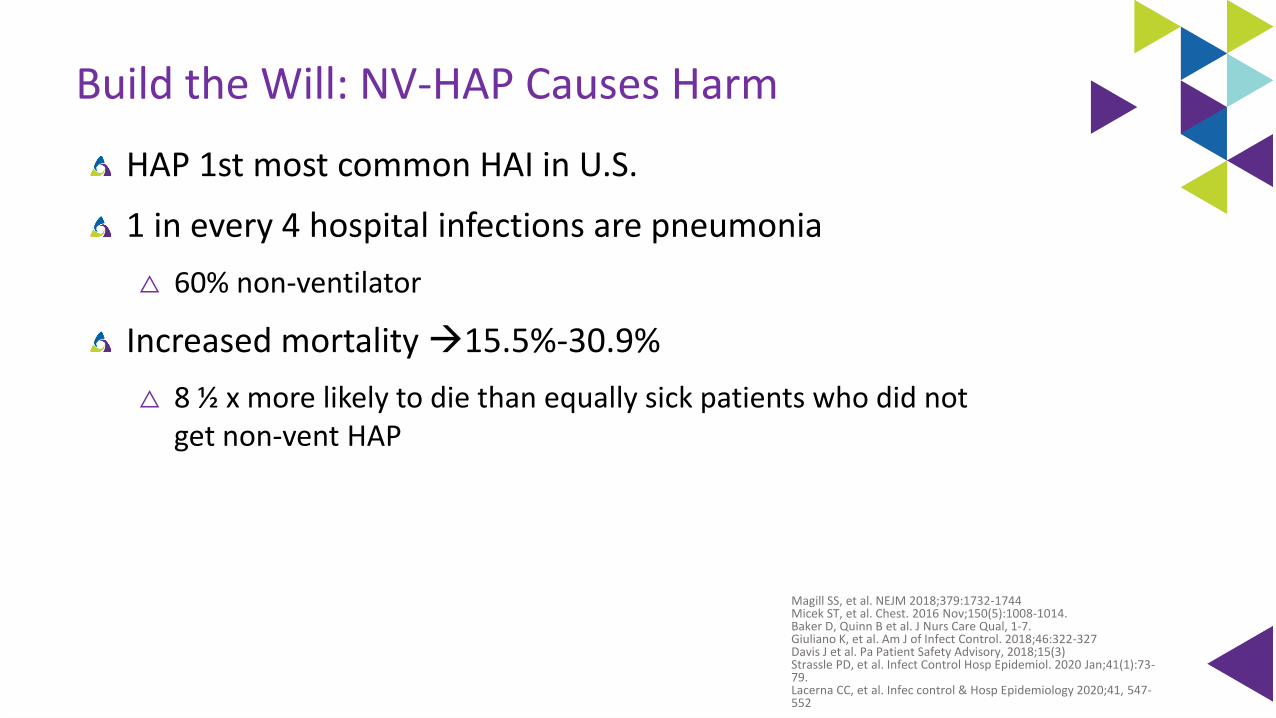
Build the Will: NV-HAP Causes Harm
HAP 1st most common HAI in U.S.
1 in every 4 hospital infections are pneumonia
△ 60% non-ventilator
Increased mortality →15.5%-30.9%
△ 8 ½ x more likely to die than equally sick patients who did not get non-vent HAP
Magill SS, et al. NEJM 2018;379:1732-1744Micek ST, et al. Chest. 2016 Nov;150(5):1008-1014.Baker D, Quinn B et al. J Nurs Care Qual, 1-7.Giuliano K, et al. Am J of Infect Control. 2018;46:322-327Davis J et al. Pa Patient Safety Advisory, 2018;15(3)Strassle PD, et al. Infect Control Hosp Epidemiol. 2020 Jan;41(1):73-79.Lacerna CC, et al. Infec control & Hosp Epidemiology 2020;41, 547-552
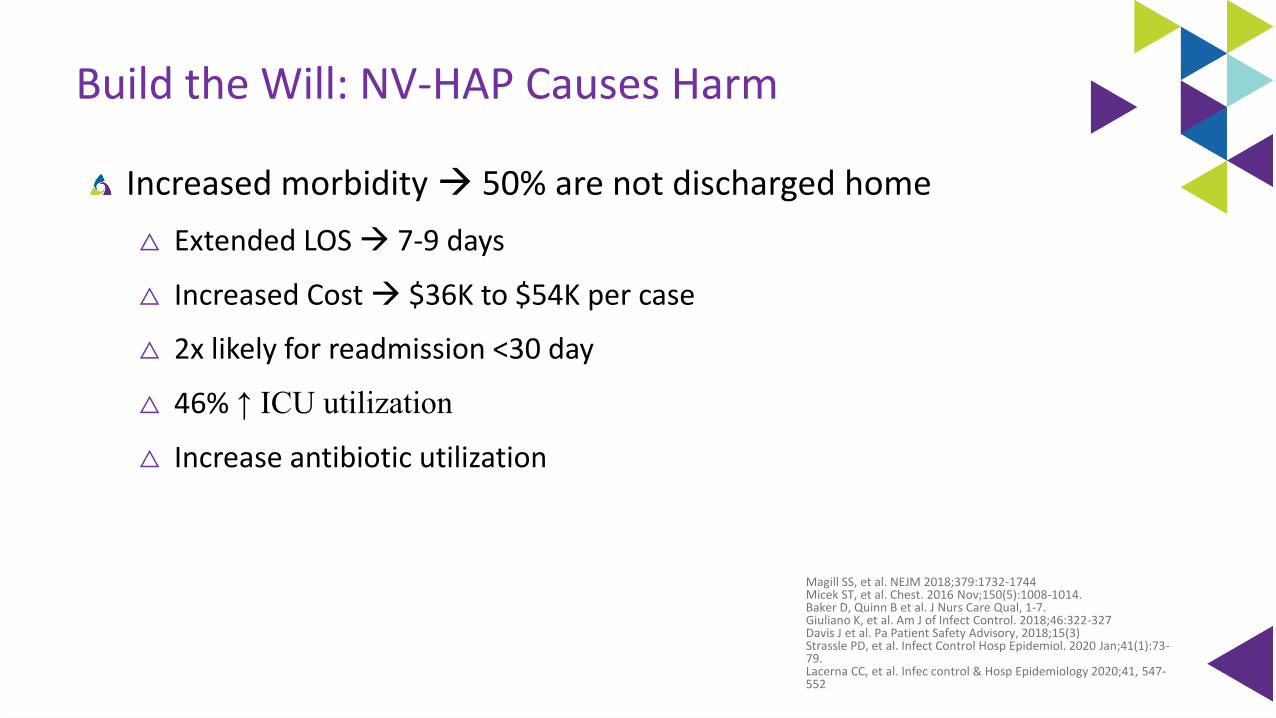
Build the Will: NV-HAP Causes Harm
Increased morbidity → 50% are not discharged home
△ Extended LOS → 7-9 days
△ Increased Cost → $36K to $54K per case
△ 2x likely for readmission <30 day
△ 46% ↑ ICU utilization
△ Increase antibiotic utilization
Magill SS, et al. NEJM 2018;379:1732-1744Micek ST, et al. Chest. 2016 Nov;150(5):1008-1014.Baker D, Quinn B et al. J Nurs Care Qual, 1-7.Giuliano K, et al. Am J of Infect Control. 2018;46:322-327Davis J et al. Pa Patient Safety Advisory, 2018;15(3)Strassle PD, et al. Infect Control Hosp Epidemiol. 2020 Jan;41(1):73-79.Lacerna CC, et al. Infec control & Hosp Epidemiology 2020;41, 547-552
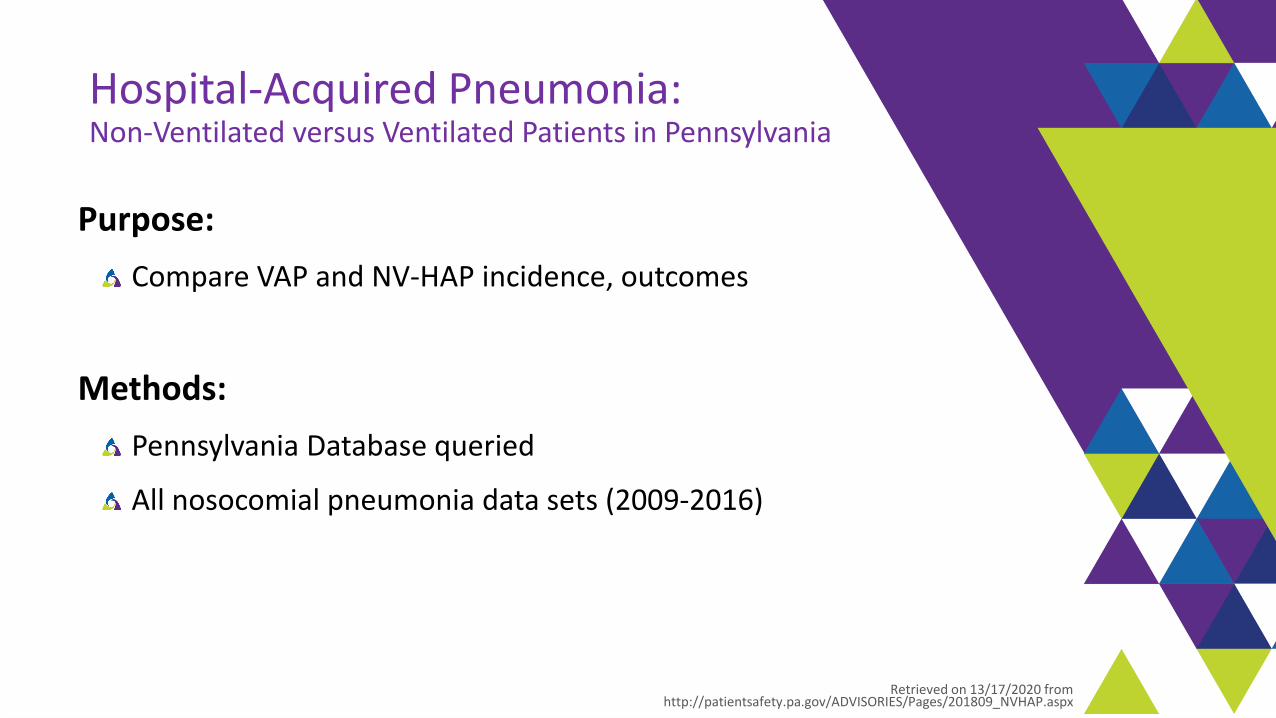
Hospital-Acquired Pneumonia:Non-Ventilated versus Ventilated Patients in Pennsylvania
Purpose:
Compare VAP and NV-HAP incidence, outcomes
Methods:
Pennsylvania Database queried
All nosocomial pneumonia data sets (2009-2016)
Retrieved on 13/17/2020 from http://patientsafety.pa.gov/ADVISORIES/Pages/201809_NVHAP.aspx
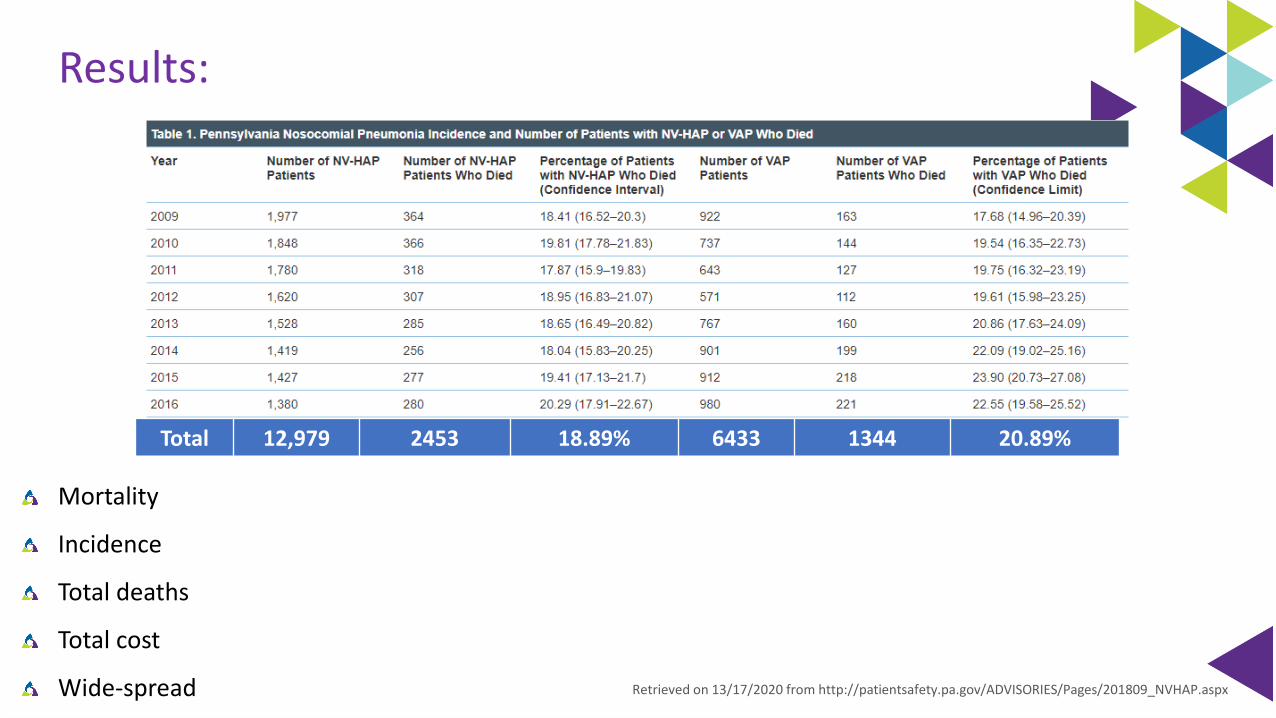
Results:
Mortality
Incidence
Total deaths
Total cost
Wide-spread Retrieved on 13/17/2020 from http://patientsafety.pa.gov/ADVISORIES/Pages/201809_NVHAP.aspx
Total 12,979 2453 18.89% 6433 1344 20.89%
Quinn, B. et al. Journal of Nursing Scholarship, 2014. 46(1):11-19
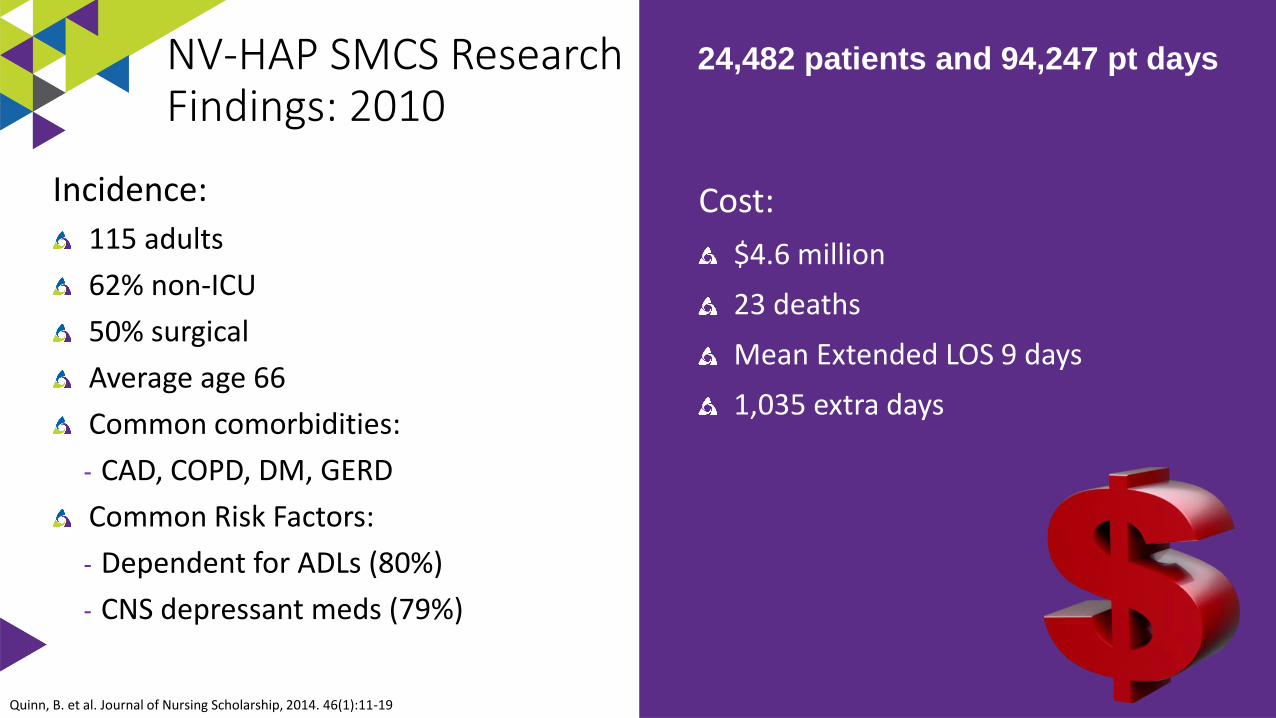
24,482 patients and 94,247 pt days
Cost:
$4.6 million
23 deaths
Mean Extended LOS 9 days
1,035 extra days
Incidence:
115 adults
62% non-ICU
50% surgical
Average age 66
Common comorbidities:
- CAD, COPD, DM, GERD
Common Risk Factors:
- Dependent for ADLs (80%)
- CNS depressant meds (79%)
NV-HAP SMCS Research Findings: 2010
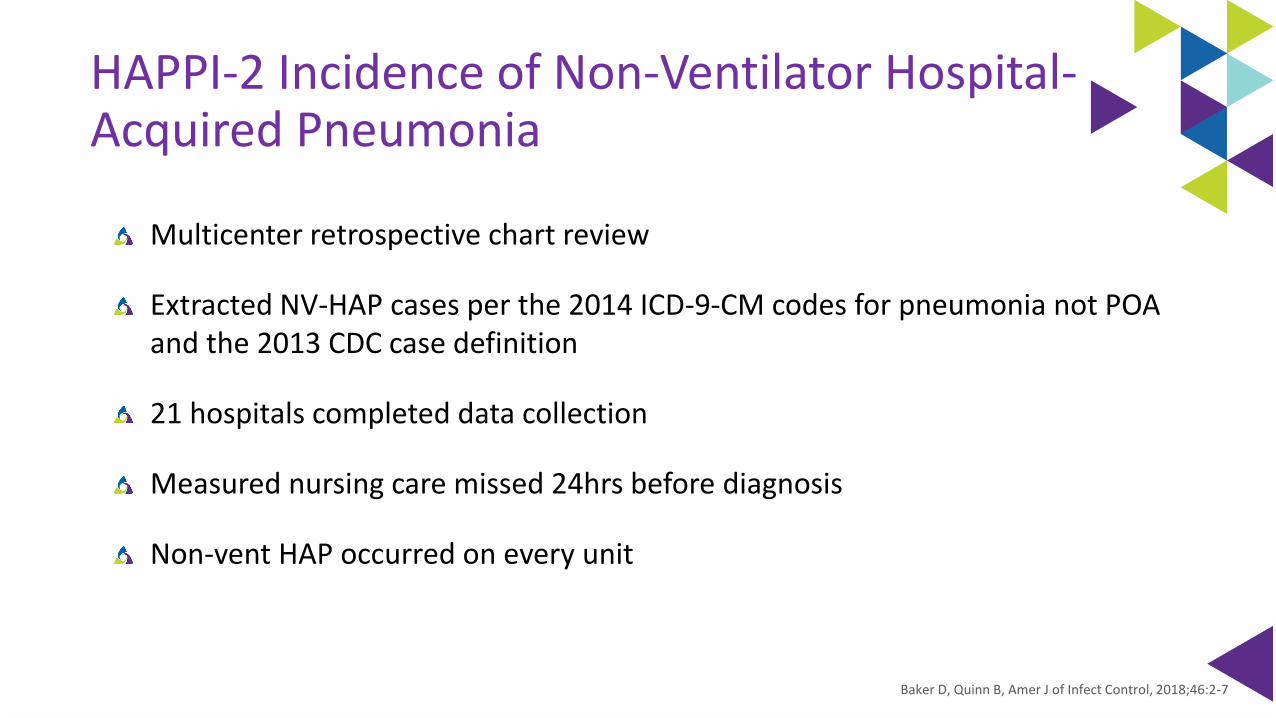
HAPPI-2 Incidence of Non-Ventilator Hospital-Acquired Pneumonia
Multicenter retrospective chart review
Extracted NV-HAP cases per the 2014 ICD-9-CM codes for pneumonia not POA and the 2013 CDC case definition
21 hospitals completed data collection
Measured nursing care missed 24hrs before diagnosis
Non-vent HAP occurred on every unit
Baker D, Quinn B, Amer J of Infect Control, 2018;46:2-7
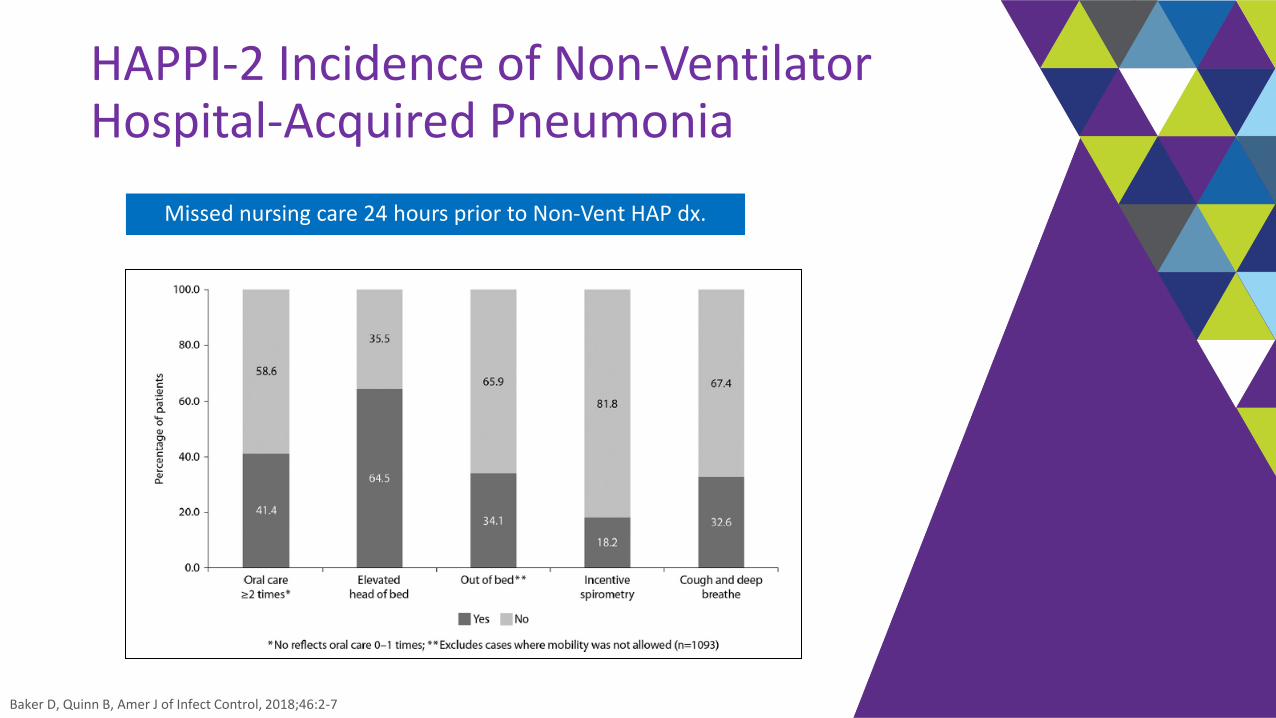
HAPPI-2 Incidence of Non-Ventilator Hospital-Acquired Pneumonia
Baker D, Quinn B, Amer J of Infect Control, 2018;46:2-7
Missed nursing care 24 hours prior to Non-Vent HAP dx.
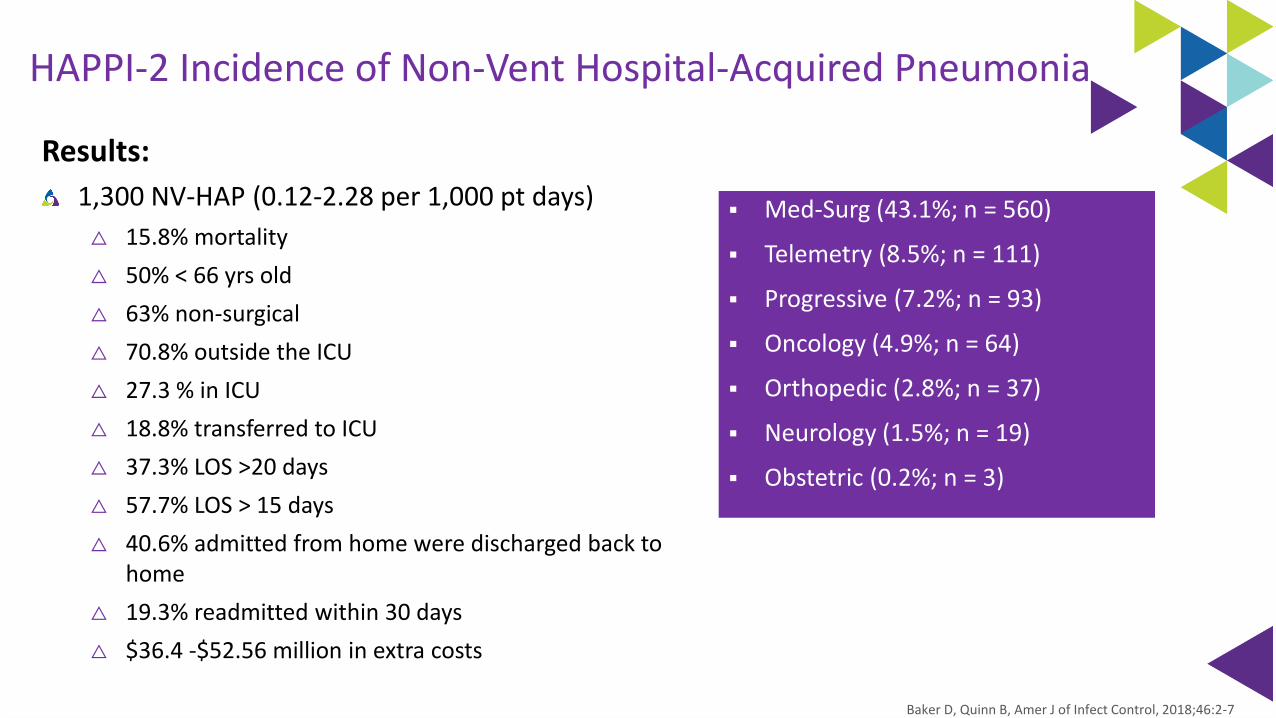
HAPPI-2 Incidence of Non-Vent Hospital-Acquired Pneumonia
Results:
1,300 NV-HAP (0.12-2.28 per 1,000 pt days)
△ 15.8% mortality
△ 50% < 66 yrs old
△ 63% non-surgical
△ 70.8% outside the ICU
△ 27.3 % in ICU
△ 18.8% transferred to ICU
△ 37.3% LOS >20 days
△ 57.7% LOS > 15 days
△ 40.6% admitted from home were discharged back to home
△ 19.3% readmitted within 30 days
△ $36.4 -$52.56 million in extra costs
▪ Med-Surg (43.1%; n = 560)
▪ Telemetry (8.5%; n = 111)
▪ Progressive (7.2%; n = 93)
▪ Oncology (4.9%; n = 64)
▪ Orthopedic (2.8%; n = 37)
▪ Neurology (1.5%; n = 19)
▪ Obstetric (0.2%; n = 3)
Baker D, Quinn B, Amer J of Infect Control, 2018;46:2-7
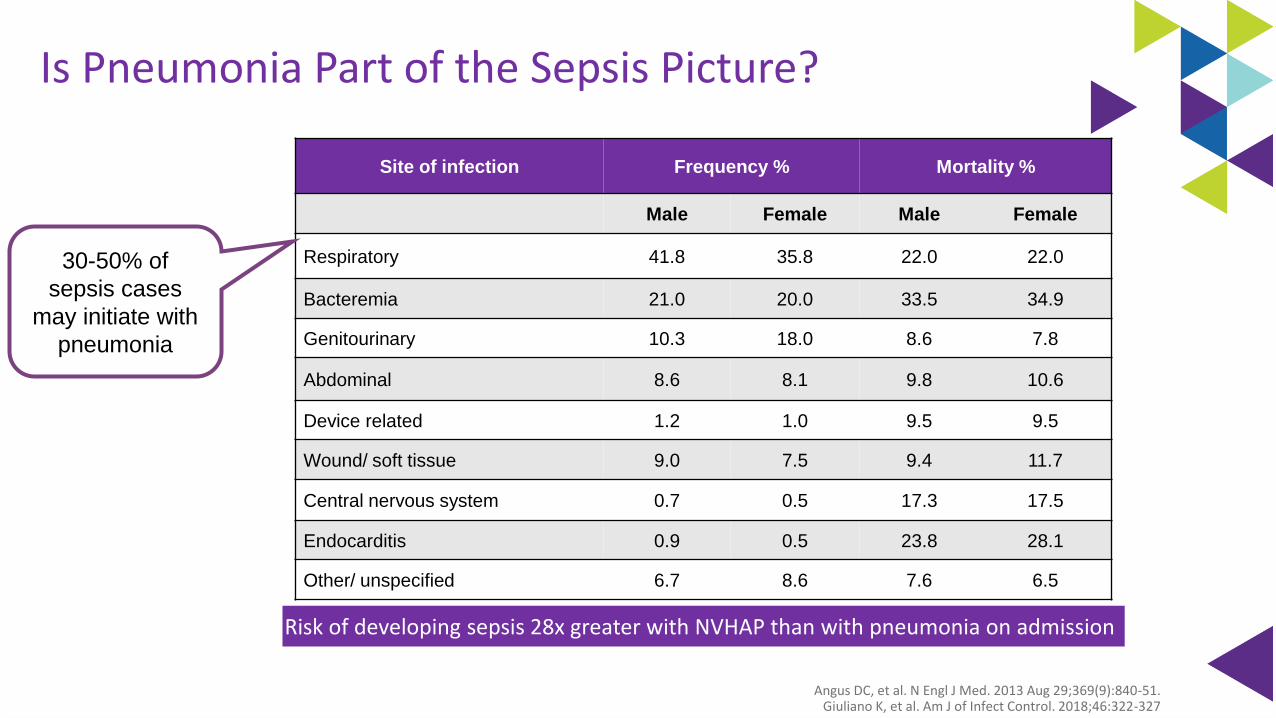
Is Pneumonia Part of the Sepsis Picture?
Site of infection Frequency % Mortality %
Male Female Male Female
Respiratory 41.8 35.8 22.0 22.0
Bacteremia 21.0 20.0 33.5 34.9
Genitourinary 10.3 18.0 8.6 7.8
Abdominal 8.6 8.1 9.8 10.6
Device related 1.2 1.0 9.5 9.5
Wound/ soft tissue 9.0 7.5 9.4 11.7
Central nervous system 0.7 0.5 17.3 17.5
Endocarditis 0.9 0.5 23.8 28.1
Other/ unspecified 6.7 8.6 7.6 6.5
30-50% of
sepsis cases
may initiate with
pneumonia
Angus DC, et al. N Engl J Med. 2013 Aug 29;369(9):840-51.Giuliano K, et al. Am J of Infect Control. 2018;46:322-327
Risk of developing sepsis 28x greater with NVHAP than with pneumonia on admission
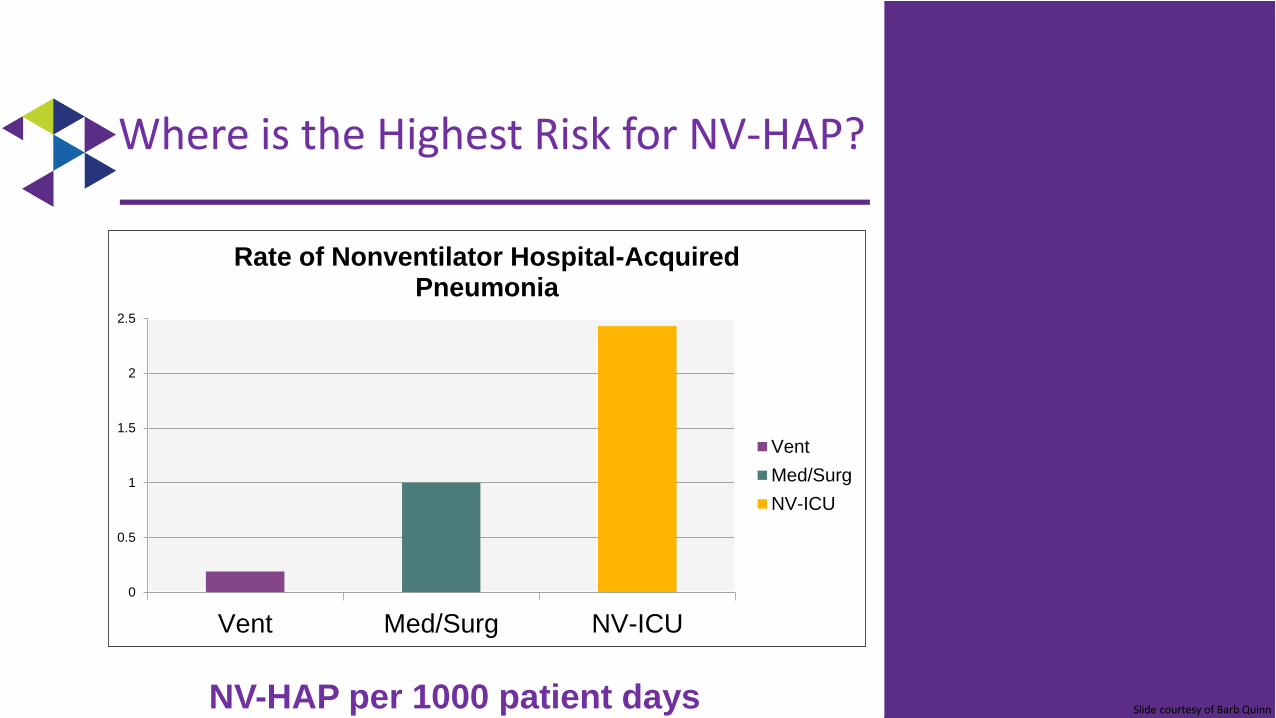
0
0.5
1
1.5
2
2.5
Vent Med/Surg NV-ICU
Rate of Nonventilator Hospital-Acquired Pneumonia
Vent
Med/Surg
NV-ICU
Where is the Highest Risk for NV-HAP?
NV-HAP per 1000 patient days Slide courtesy of Barb Quinn
Addressing the risk-factors associated with NV-HAP through evidence based
fundamental nursing care strategies
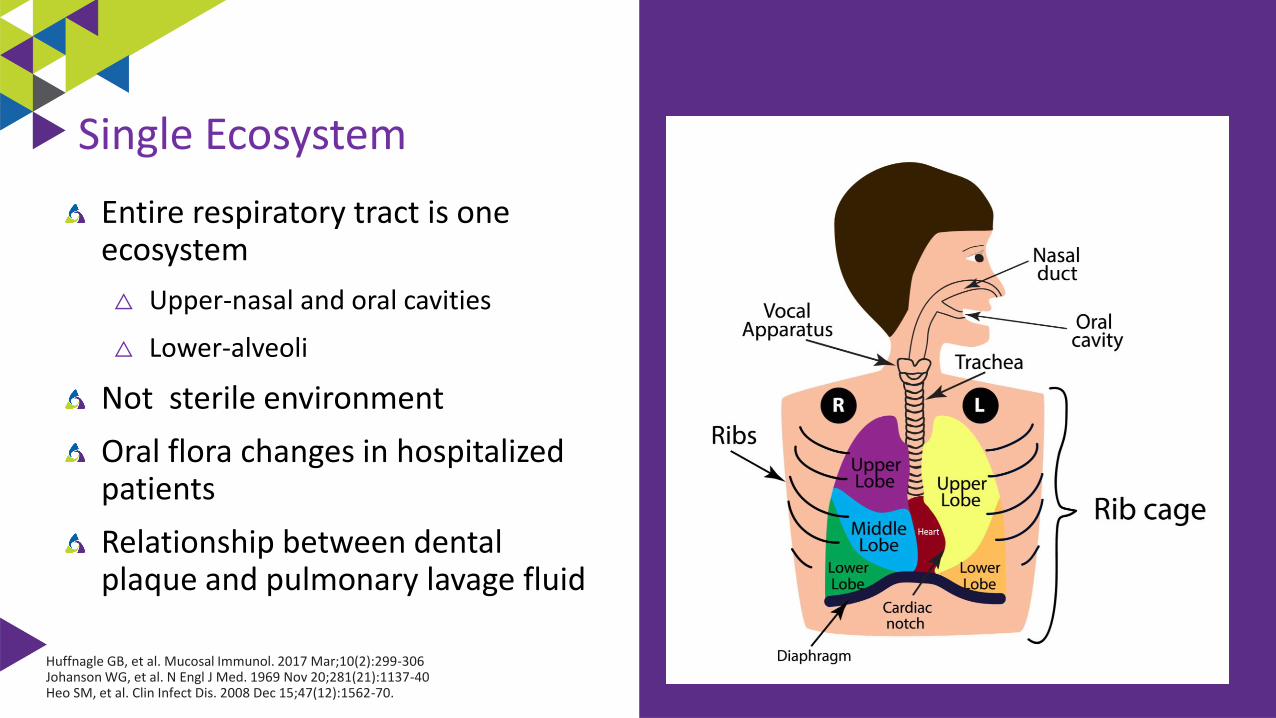
Entire respiratory tract is one ecosystem
△ Upper-nasal and oral cavities
△ Lower-alveoli
Not sterile environment
Oral flora changes in hospitalized patients
Relationship between dental plaque and pulmonary lavage fluid
Huffnagle GB, et al. Mucosal Immunol. 2017 Mar;10(2):299-306Johanson WG, et al. N Engl J Med. 1969 Nov 20;281(21):1137-40Heo SM, et al. Clin Infect Dis. 2008 Dec 15;47(12):1562-70.
Single Ecosystem
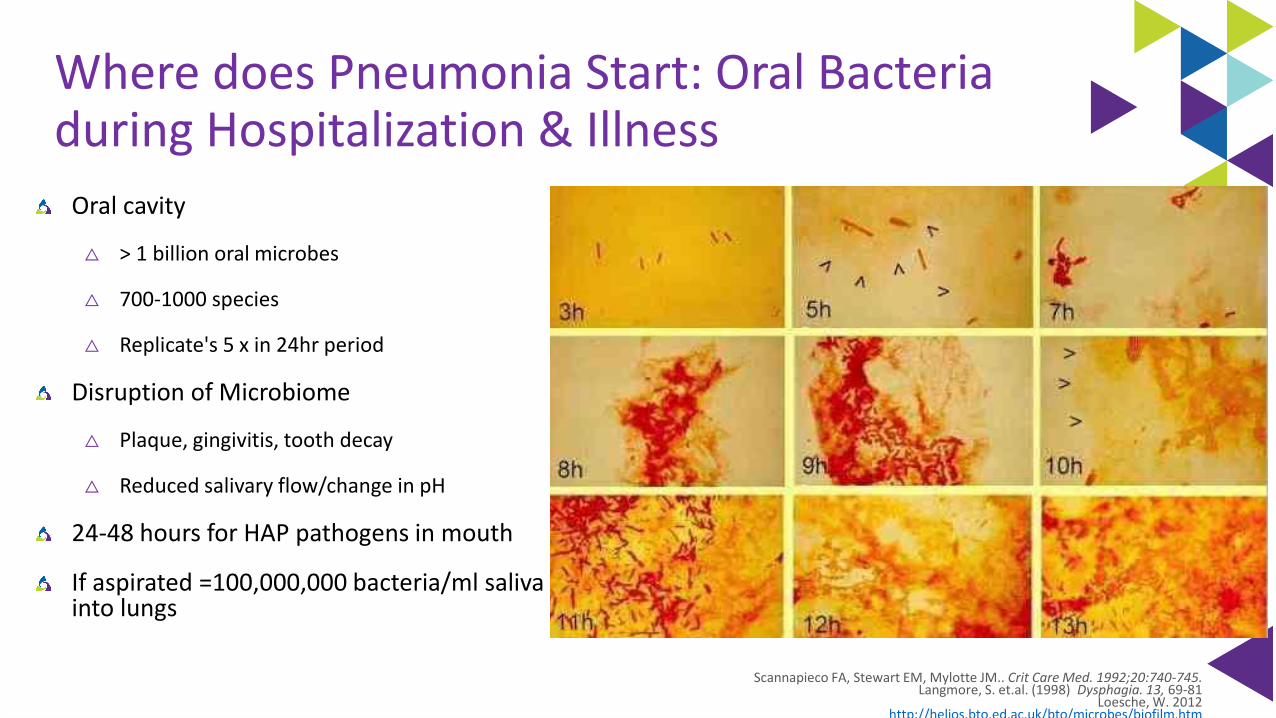
Where does Pneumonia Start: Oral Bacteria during Hospitalization & Illness
Oral cavity
△ > 1 billion oral microbes
△ 700-1000 species
△ Replicate's 5 x in 24hr period
Disruption of Microbiome
△ Plaque, gingivitis, tooth decay
△ Reduced salivary flow/change in pH
24-48 hours for HAP pathogens in mouth
If aspirated =100,000,000 bacteria/ml saliva into lungs
Scannapieco FA, Stewart EM, Mylotte JM.. Crit Care Med. 1992;20:740-745.Langmore, S. et.al. (1998) Dysphagia. 13, 69-81
Loesche, W. 2012http://helios.bto.ed.ac.uk/bto/microbes/biofilm.htm
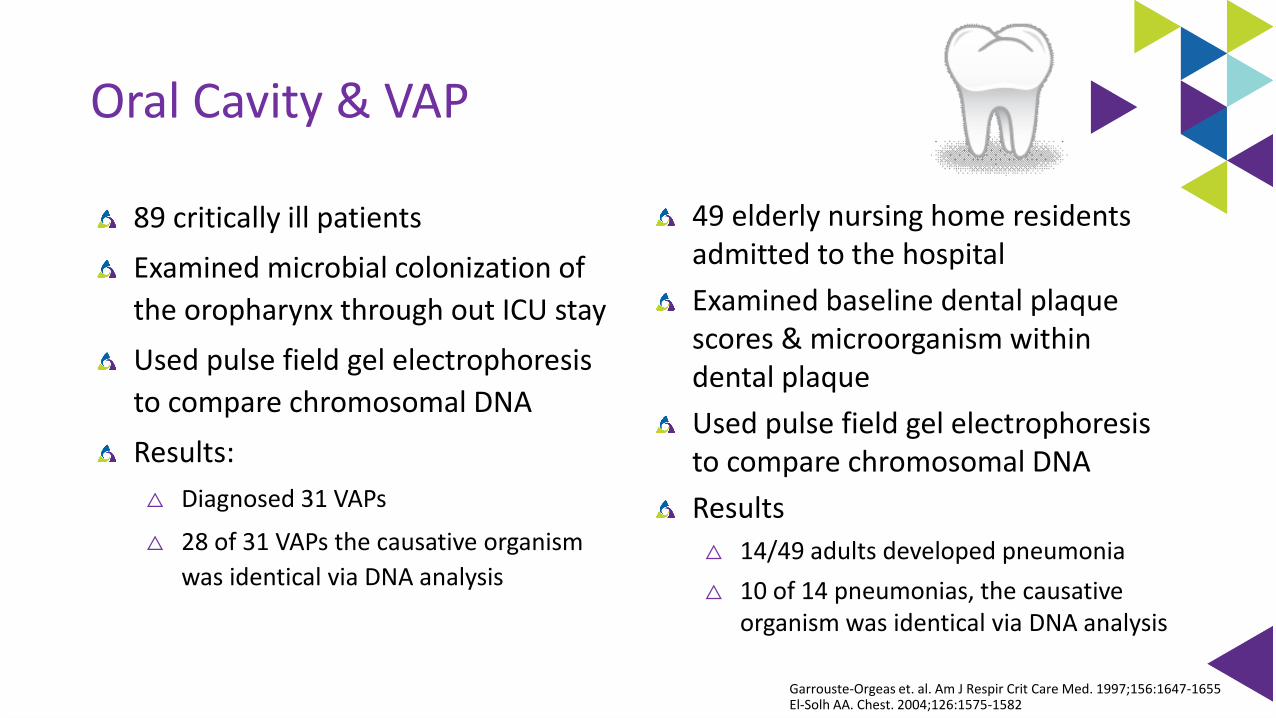
Oral Cavity & VAP
89 critically ill patients
Examined microbial colonization of
the oropharynx through out ICU stay
Used pulse field gel electrophoresis
to compare chromosomal DNA
Results:
△ Diagnosed 31 VAPs
△ 28 of 31 VAPs the causative organism
was identical via DNA analysis
49 elderly nursing home residents admitted to the hospital
Examined baseline dental plaque scores & microorganism within dental plaque
Used pulse field gel electrophoresis to compare chromosomal DNA
Results
△ 14/49 adults developed pneumonia
△ 10 of 14 pneumonias, the causative organism was identical via DNA analysis
Garrouste-Orgeas et. al. Am J Respir Crit Care Med. 1997;156:1647-1655El-Solh AA. Chest. 2004;126:1575-1582
Role of Salivary Flow
Provides mechanical removal of plaque and microorganisms
Innate & specific immune components (IgA, cortisol, lactoferrin)
Patients receiving mechanical ventilation have dry mouth which in turn contributes to accumulation of plaque & reduced distribution of salivary immune factors
Munro CL & Grap MJ. AJCC. 2004;13:25-34
Micro Aspiration during Sleep in Healthy Subjects
Prospective duplicate full-night studies
10 normal male’s 22-55 years of age
Methods:
• Radioactive 99 mTc tracer inserted into the nasopharynx
• Lung scans following final awakening
• No difference in sleep efficacy between 2 study nights
Results:
Gleeson K, et al. Chest. 1997;111:1266-72
In the lung parenchyma
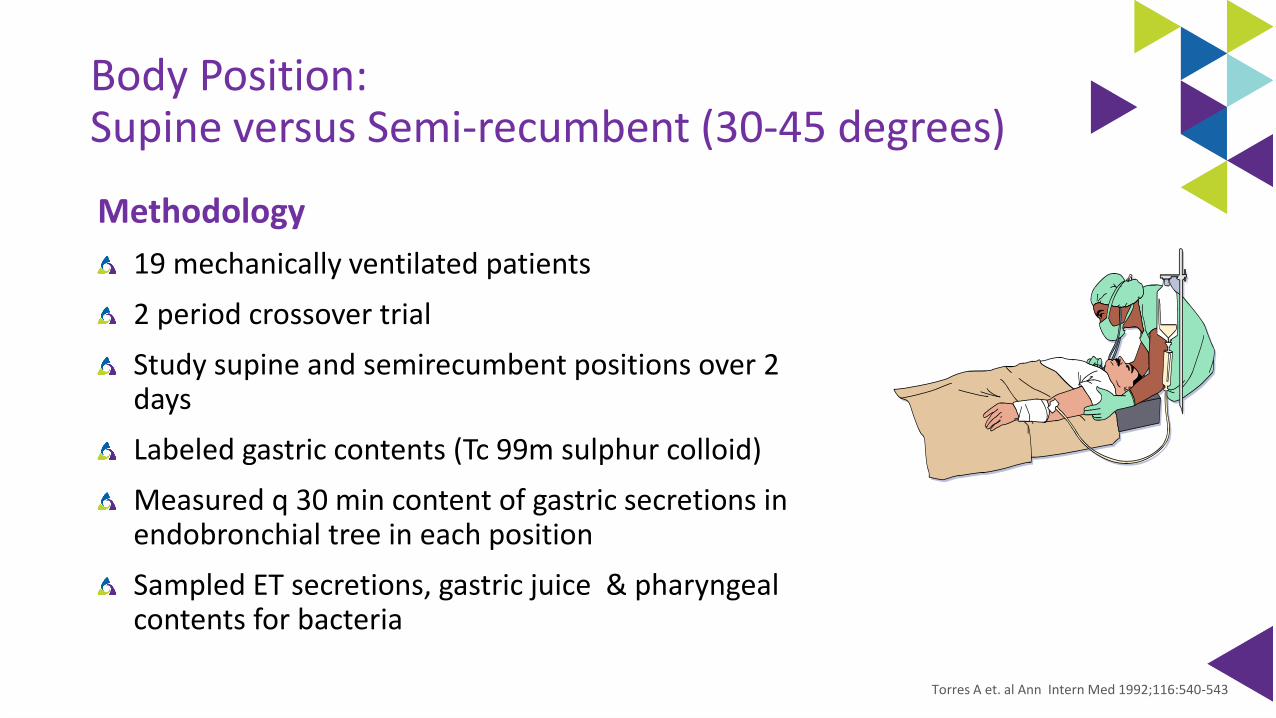
Body Position: Supine versus Semi-recumbent (30-45 degrees)
Methodology
19 mechanically ventilated patients
2 period crossover trial
Study supine and semirecumbent positions over 2 days
Labeled gastric contents (Tc 99m sulphur colloid)
Measured q 30 min content of gastric secretions in endobronchial tree in each position
Sampled ET secretions, gastric juice & pharyngeal contents for bacteria
Torres A et. al Ann Intern Med 1992;116:540-543
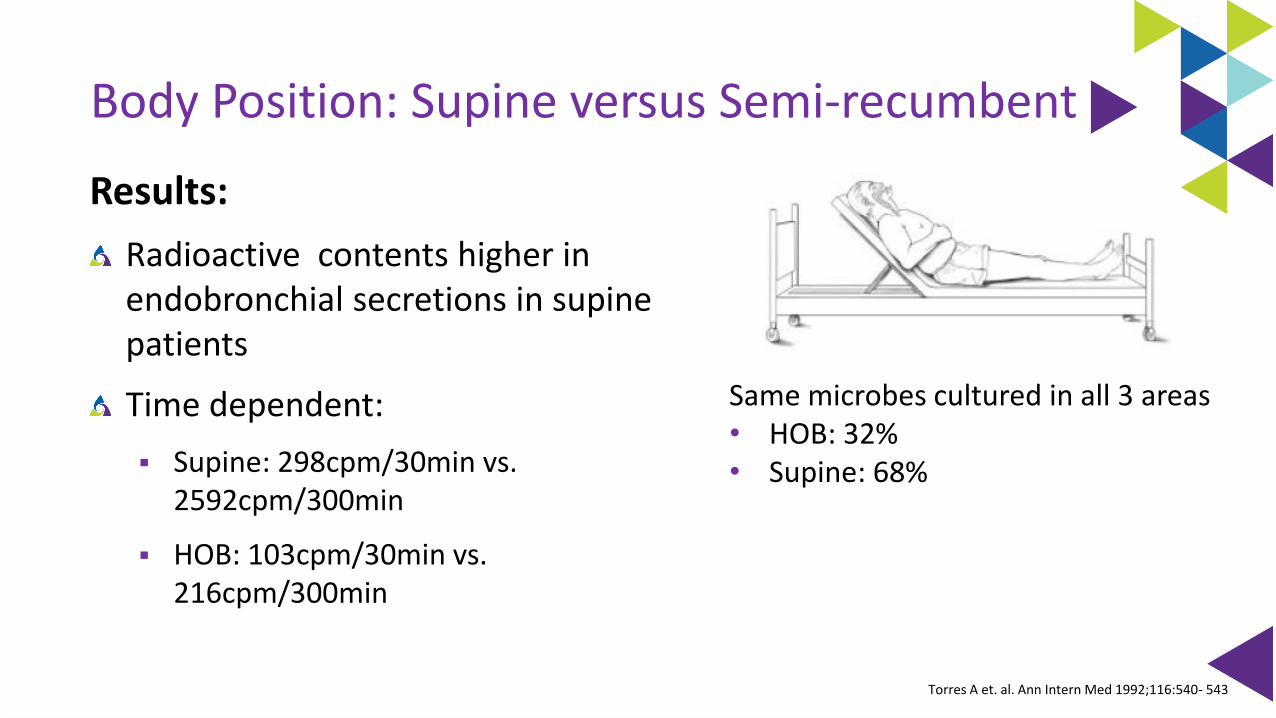
Body Position: Supine versus Semi-recumbent
Results:
Radioactive contents higher in endobronchial secretions in supine patients
Time dependent:
▪ Supine: 298cpm/30min vs. 2592cpm/300min
▪ HOB: 103cpm/30min vs. 216cpm/300min
Same microbes cultured in all 3 areas• HOB: 32% • Supine: 68%
Torres A et. al. Ann Intern Med 1992;116:540- 543
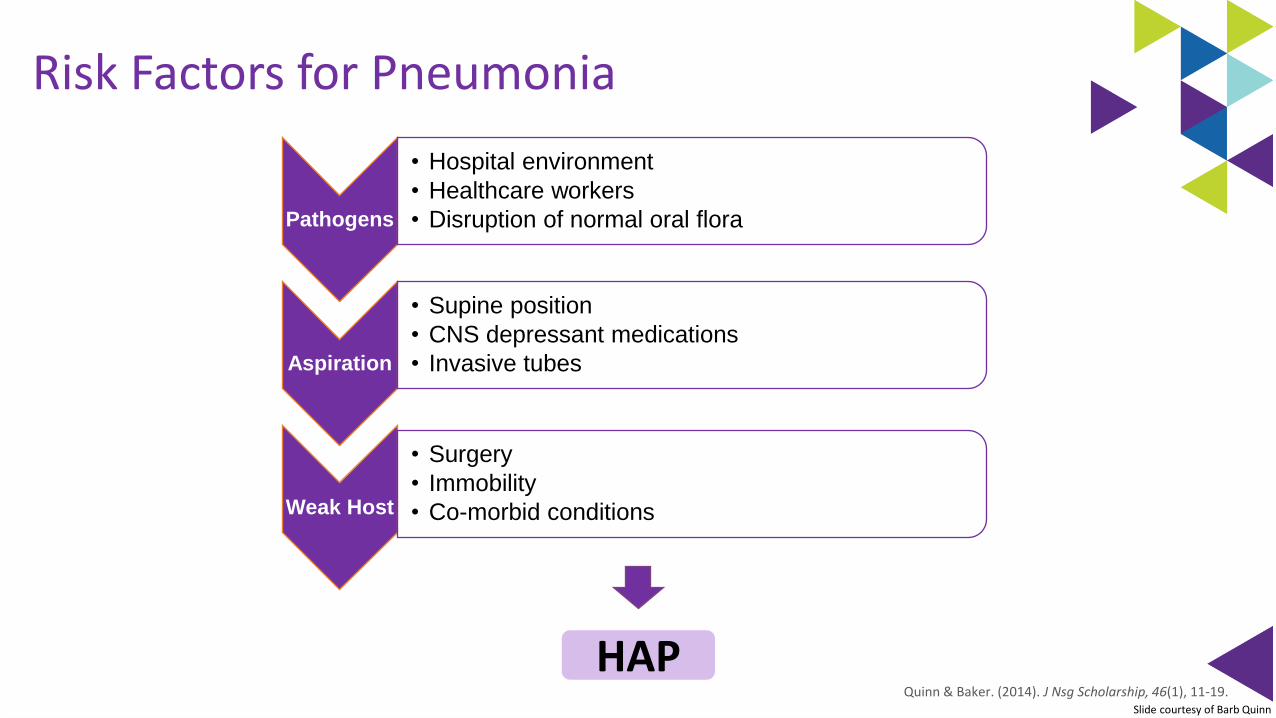
HAP
Pathogens
• Hospital environment
• Healthcare workers
• Disruption of normal oral flora
Aspiration
• Supine position
• CNS depressant medications
• Invasive tubes
Weak Host
• Surgery
• Immobility
• Co-morbid conditions
Risk Factors for Pneumonia
Quinn & Baker. (2014). J Nsg Scholarship, 46(1), 11-19.Slide courtesy of Barb Quinn
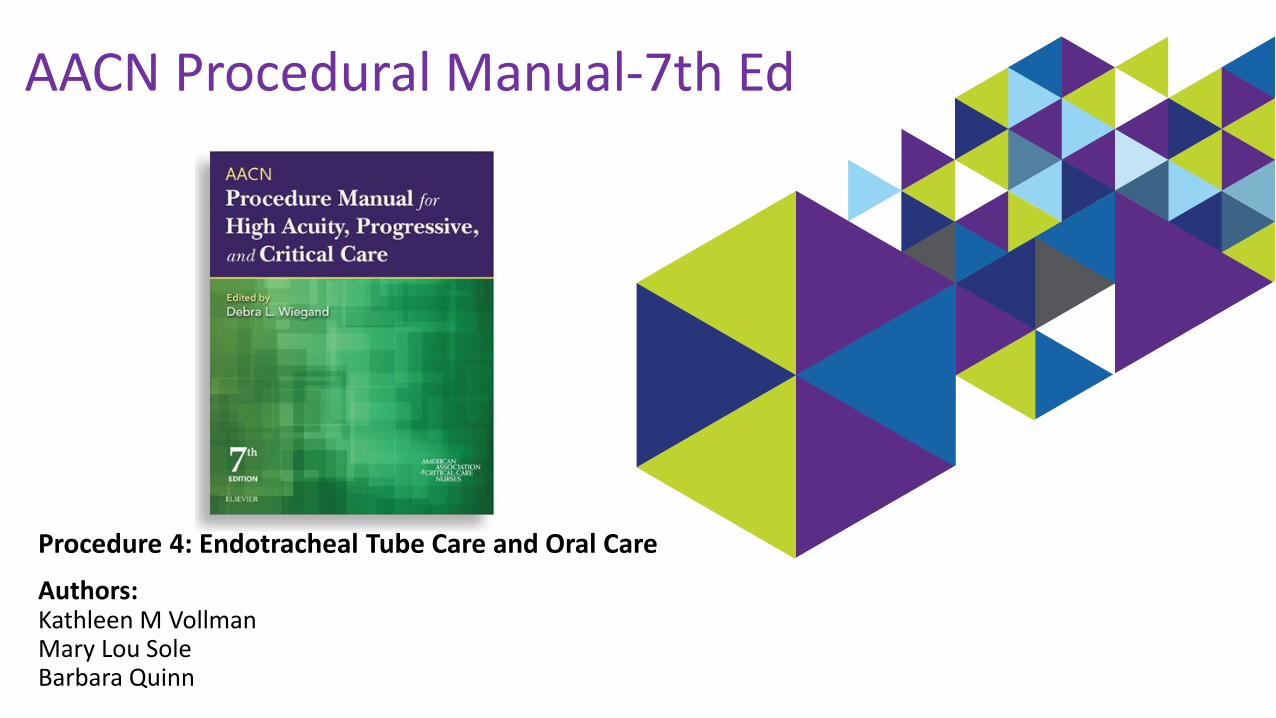
AACN Procedural Manual-7th Ed
Procedure 4: Endotracheal Tube Care and Oral Care
Authors: Kathleen M VollmanMary Lou SoleBarbara Quinn
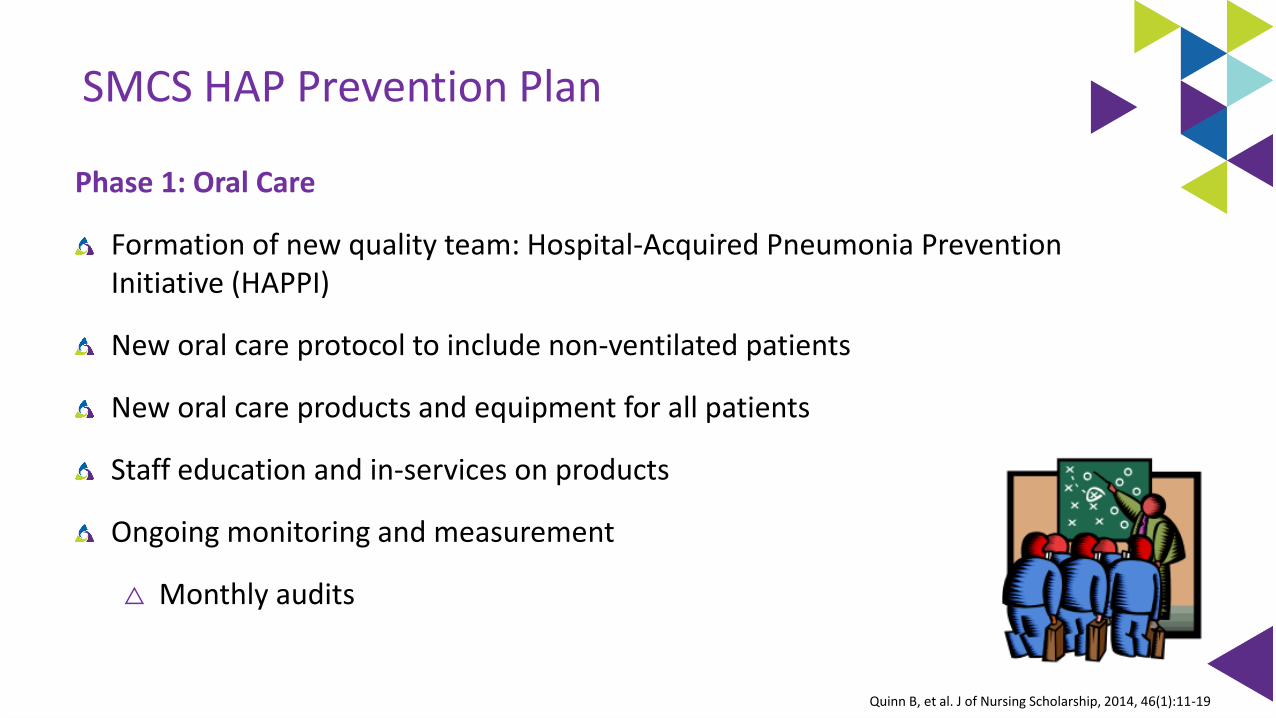
SMCS HAP Prevention Plan
Phase 1: Oral Care
Formation of new quality team: Hospital-Acquired Pneumonia Prevention Initiative (HAPPI)
New oral care protocol to include non-ventilated patients
New oral care products and equipment for all patients
Staff education and in-services on products
Ongoing monitoring and measurement
△ Monthly audits
Quinn B, et al. J of Nursing Scholarship, 2014, 46(1):11-19
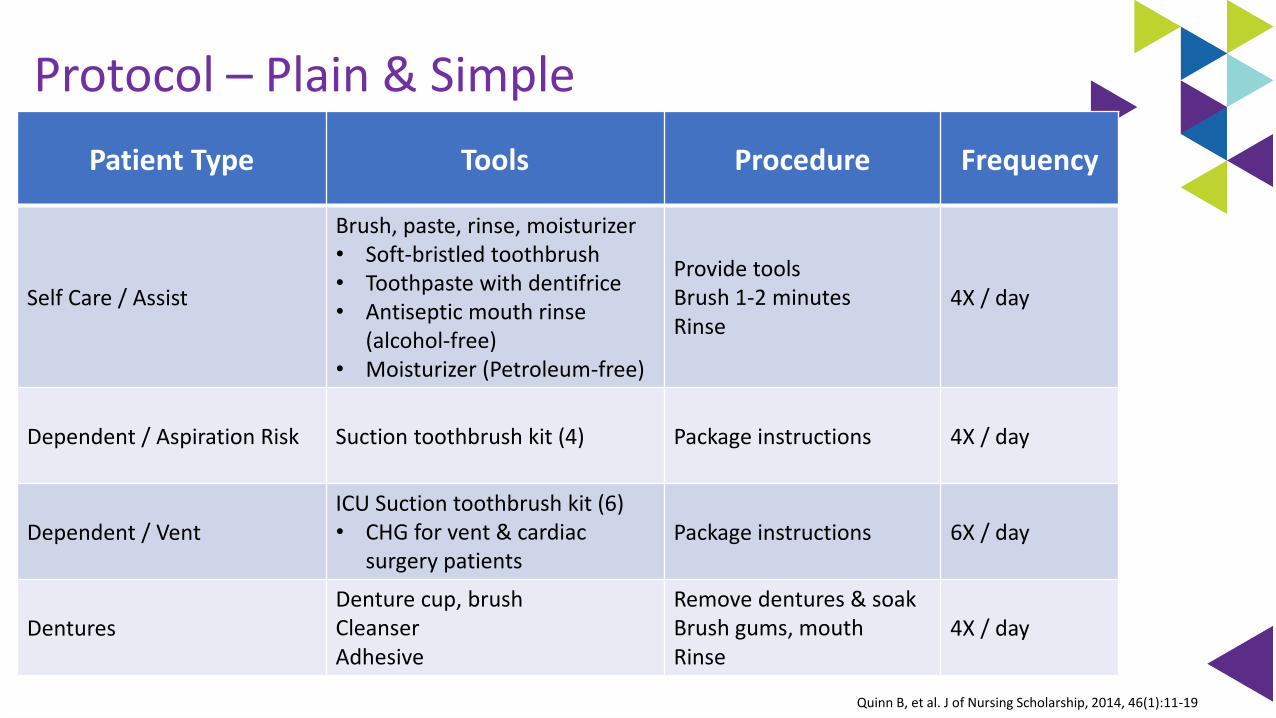
Protocol – Plain & Simple
Patient Type Tools Procedure Frequency
Self Care / Assist
Brush, paste, rinse, moisturizer• Soft-bristled toothbrush• Toothpaste with dentifrice• Antiseptic mouth rinse
(alcohol-free)• Moisturizer (Petroleum-free)
Provide toolsBrush 1-2 minutesRinse
4X / day
Dependent / Aspiration Risk Suction toothbrush kit (4) Package instructions 4X / day
Dependent / VentICU Suction toothbrush kit (6)• CHG for vent & cardiac
surgery patientsPackage instructions 6X / day
DenturesDenture cup, brushCleanserAdhesive
Remove dentures & soakBrush gums, mouthRinse
4X / day
Quinn B, et al. J of Nursing Scholarship, 2014, 46(1):11-19
0
0.5
1
1.5
2
2.5
3
0.0
1.0
2.0
3.0
4.0
Mean
Ora
l C
are
HA
P C
ases
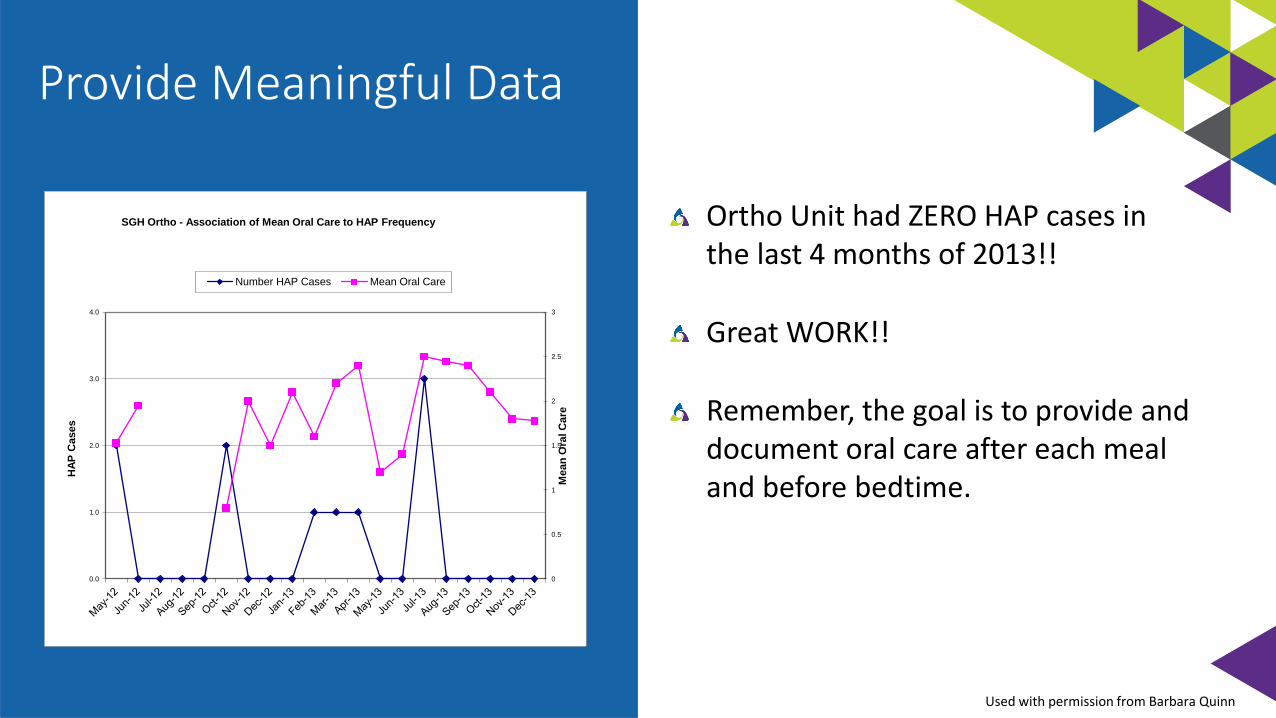
SGH Ortho - Association of Mean Oral Care to HAP Frequency
Number HAP Cases Mean Oral Care
Ortho Unit had ZERO HAP cases in the last 4 months of 2013!!
Great WORK!!
Remember, the goal is to provide and document oral care after each meal and before bedtime.
Provide Meaningful Data
Used with permission from Barbara Quinn
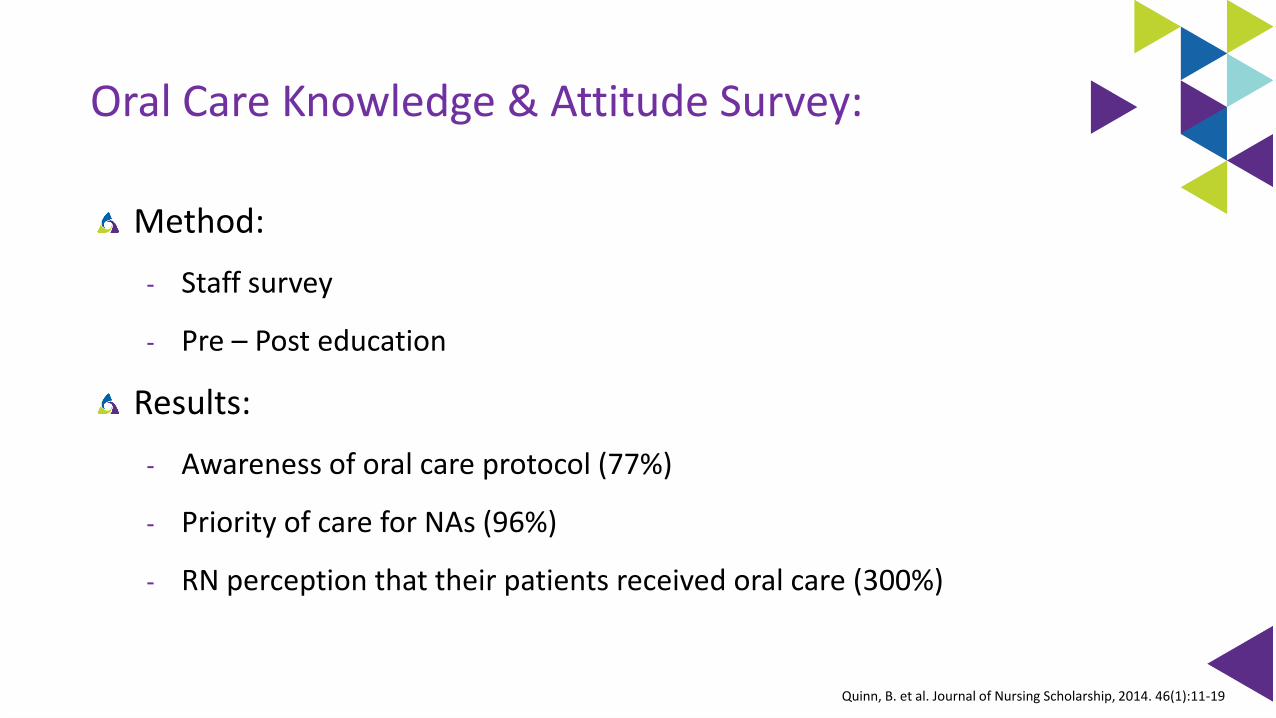
Oral Care Knowledge & Attitude Survey:
Method:
- Staff survey
- Pre – Post education
Results:
- Awareness of oral care protocol (77%)
- Priority of care for NAs (96%)
- RN perception that their patients received oral care (300%)
Quinn, B. et al. Journal of Nursing Scholarship, 2014. 46(1):11-19
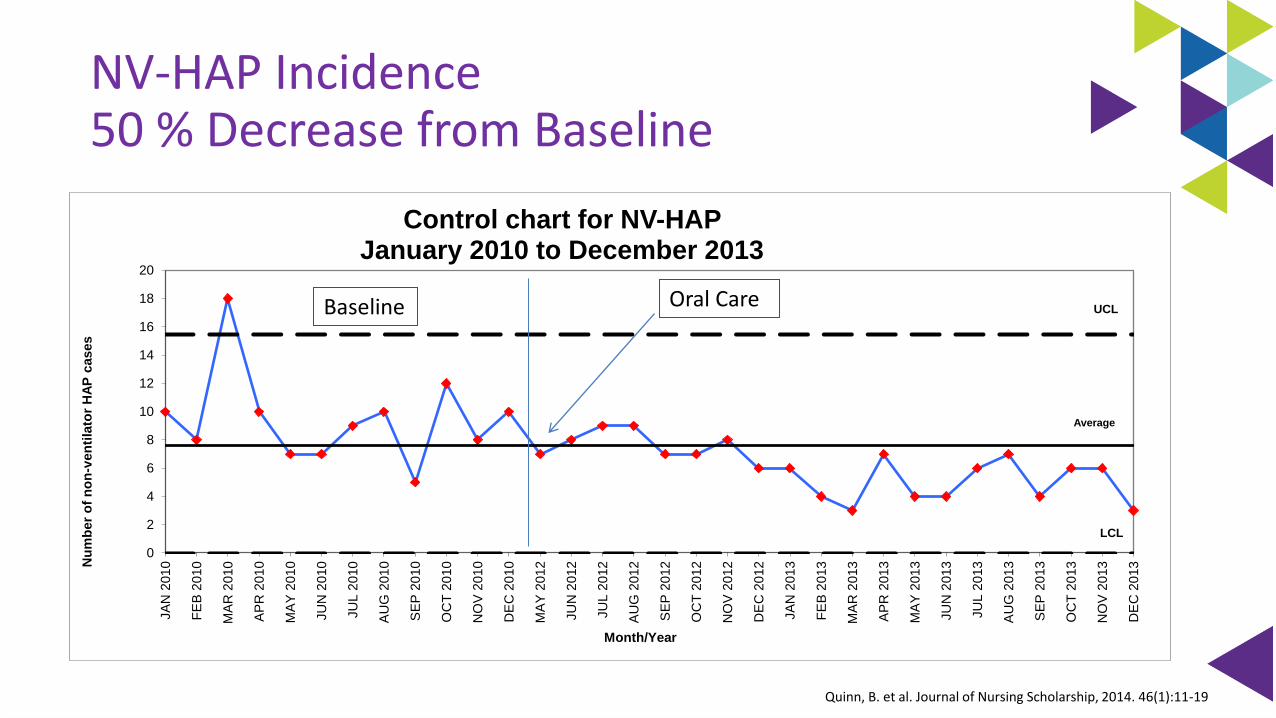
NV-HAP Incidence 50 % Decrease from Baseline
0
2
4
6
8
10
12
14
16
18
20
JA
N 2
01
0
FE
B 2
010
MA
R 2
010
AP
R 2
01
0
MA
Y 2
01
0
JU
N 2
010
JU
L 2
010
AU
G 2
01
0
SE
P 2
010
OC
T 2
010
NO
V 2
01
0
DE
C 2
010
MA
Y 2
01
2
JU
N 2
012
JU
L 2
012
AU
G 2
01
2
SE
P 2
012
OC
T 2
012
NO
V 2
01
2
DE
C 2
012
JA
N 2
01
3
FE
B 2
013
MA
R 2
013
AP
R 2
01
3
MA
Y 2
01
3
JU
N 2
013
JU
L 2
013
AU
G 2
01
3
SE
P 2
013
OC
T 2
013
NO
V 2
01
3
DE
C 2
013N
um
ber
of
no
n-v
en
tila
tor
HA
P c
ases
Month/Year
Control chart for NV-HAP January 2010 to December 2013
UCL
LCL
Average
Oral CareBaseline
Quinn, B. et al. Journal of Nursing Scholarship, 2014. 46(1):11-19
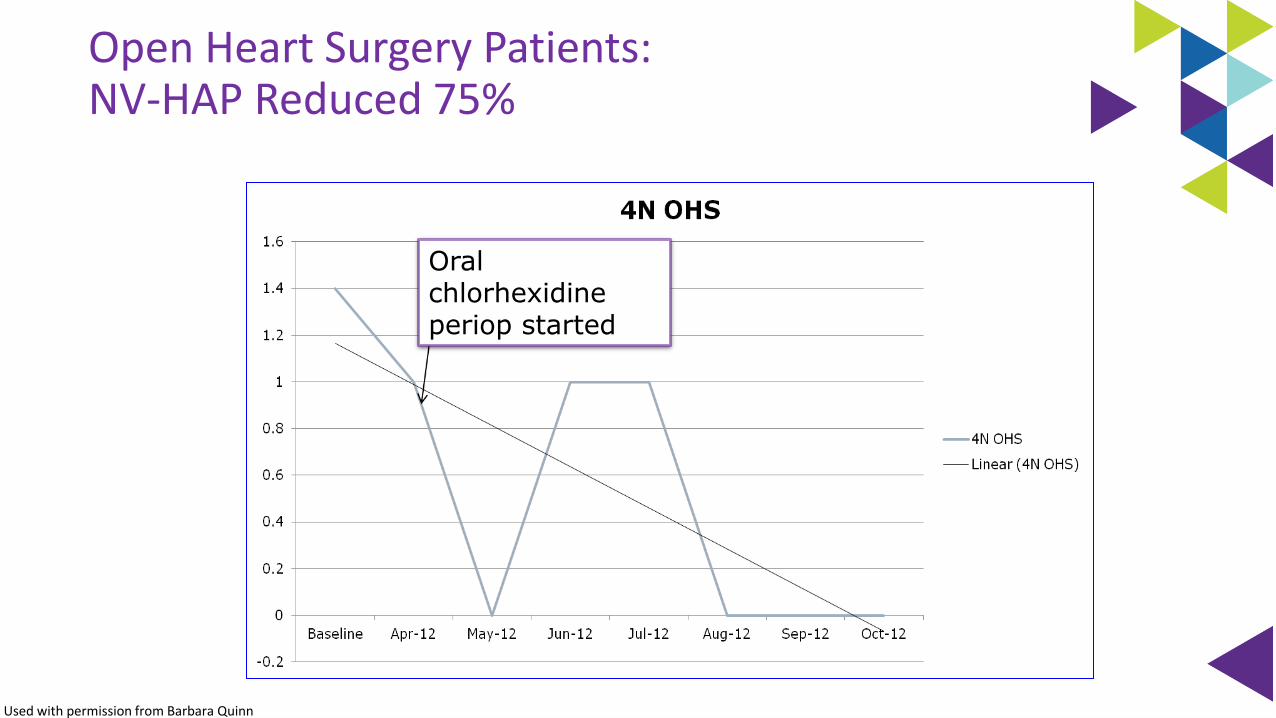
Oral chlorhexidine periop started
Used with permission from Barbara Quinn
Open Heart Surgery Patients: NV-HAP Reduced 75%
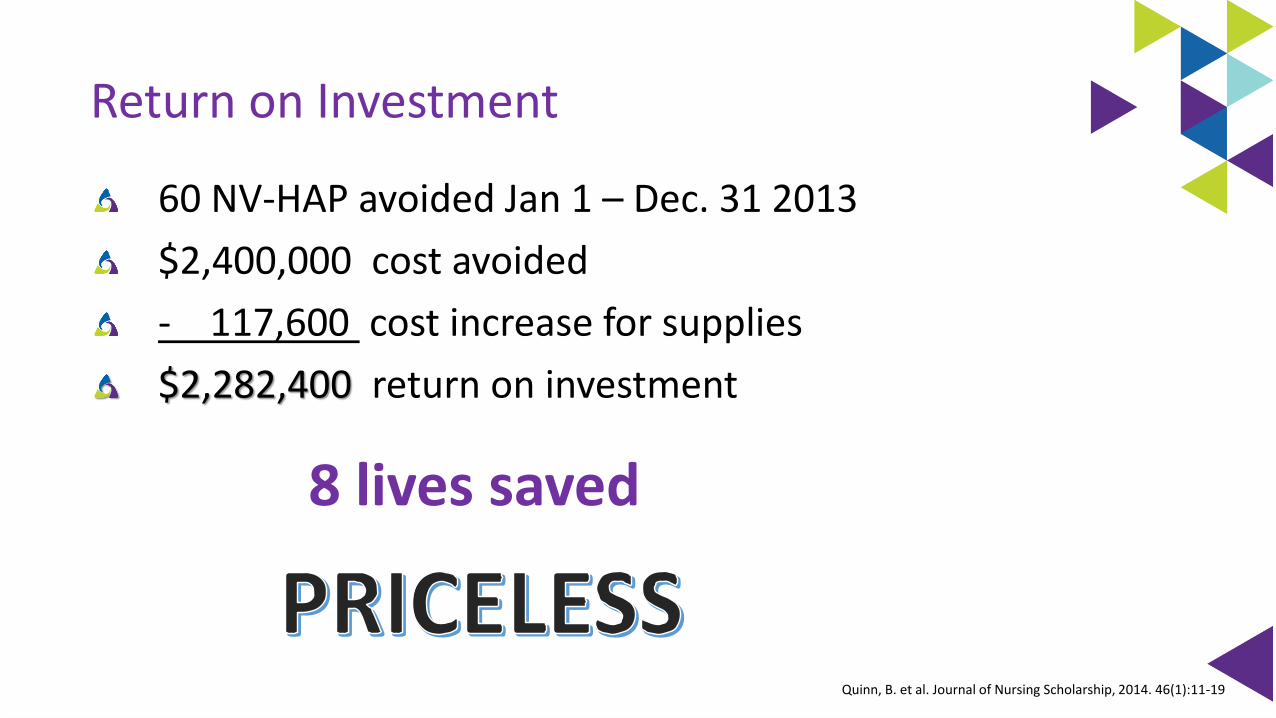
Return on Investment
60 NV-HAP avoided Jan 1 – Dec. 31 2013
$2,400,000 cost avoided
- 117,600 cost increase for supplies
$2,282,400 return on investment
8 lives saved
Quinn, B. et al. Journal of Nursing Scholarship, 2014. 46(1):11-19
NV-HAP ↓ 70% from baseline!
0
2
4
6
8
10
12
14
16
18
20
JA
N 2
01
0
FE
B 2
010
MA
R 2
010
AP
R 2
01
0
MA
Y 2
01
0
JU
N 2
010
JU
L 2
010
AU
G 2
01
0
SE
P 2
010
OC
T 2
010
NO
V 2
01
0
DE
C 2
010
MA
Y 2
01
2
JU
N 2
012
JU
L 2
012
AU
G 2
01
2
SE
P 2
012
OC
T 2
012
NO
V 2
01
2
DE
C 2
012
JA
N 2
01
3
FE
B 2
013
MA
R 2
013
AP
R 2
01
3
MA
Y 2
01
3
JU
N 2
013
JU
L 2
013
AU
G 2
01
3
SE
P 2
013
OC
T 2
013
NO
V 2
01
3
DE
C 2
013
JA
N 2
01
4
FE
B 2
014
MA
R 2
014
AP
R 2
01
4
MA
Y 2
01
4
JU
L 2
014
AU
G 2
01
4
SE
P 2
014
OC
T 2
014
NO
V 2
01
4
DE
C 2
014
Nu
mb
er
of
no
n-v
en
tila
tor
HA
P c
ases
Control chart for non-ventilator HAP January 2010 to December 2014
UCL
LCL
Mean
Oral care for
all adult pts
Started oral care
prior to surgery
Pharmacy
starts PPI
protocol
NGT
standards
revised
Baseline
Documentation
Mandatory Education
for Nurse Assistants
Quinn B, Presented at AACN NTI, Houston, Tx, 2017
Post-Operative NV-HAP (all adult inpatient surgery)Incidence 6 months Pre-Oral Care vs. 6 Months After
0
2
4
6
8
10
12
Mar- July 14 Aug14-Jan 15
Post Op NV-HAP
Quinn B, Presented at AACN NTI, Houston, Tx, 2017
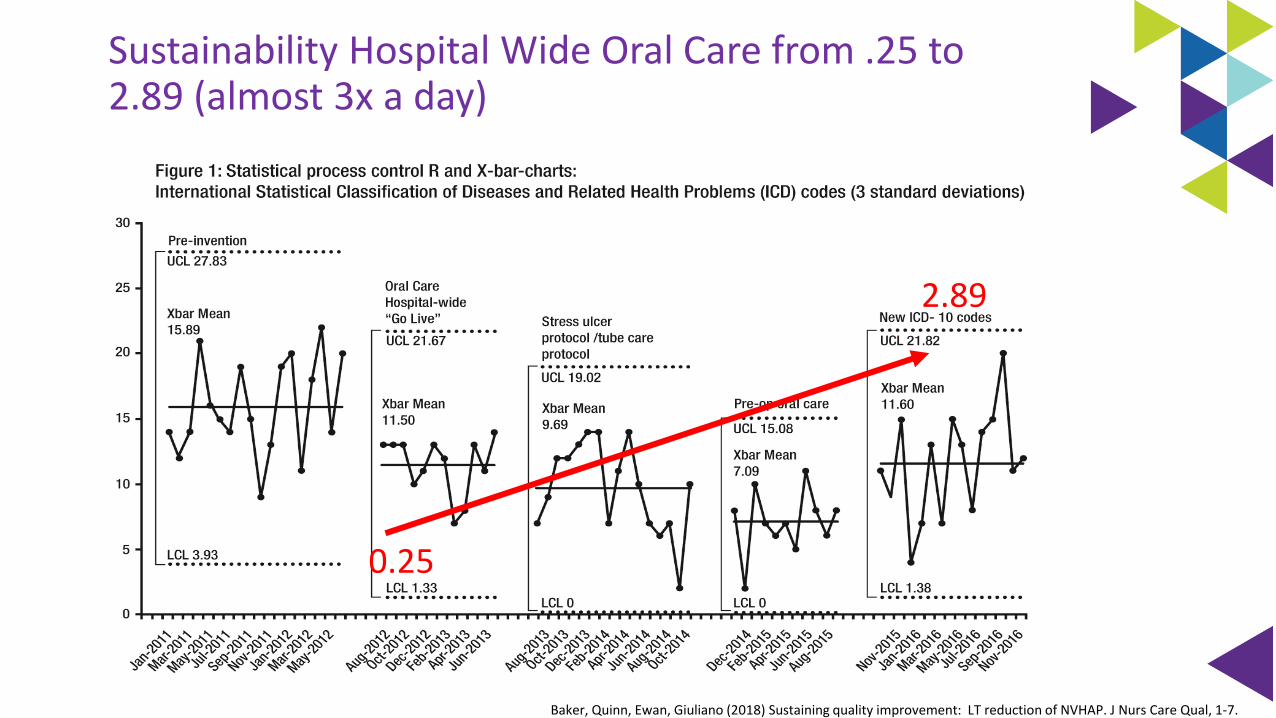
Sustainability Hospital Wide Oral Care from .25 to 2.89 (almost 3x a day)
Baker, Quinn, Ewan, Giuliano (2018) Sustaining quality improvement: LT reduction of NVHAP. J Nurs Care Qual, 1-7.
0.25
2.89
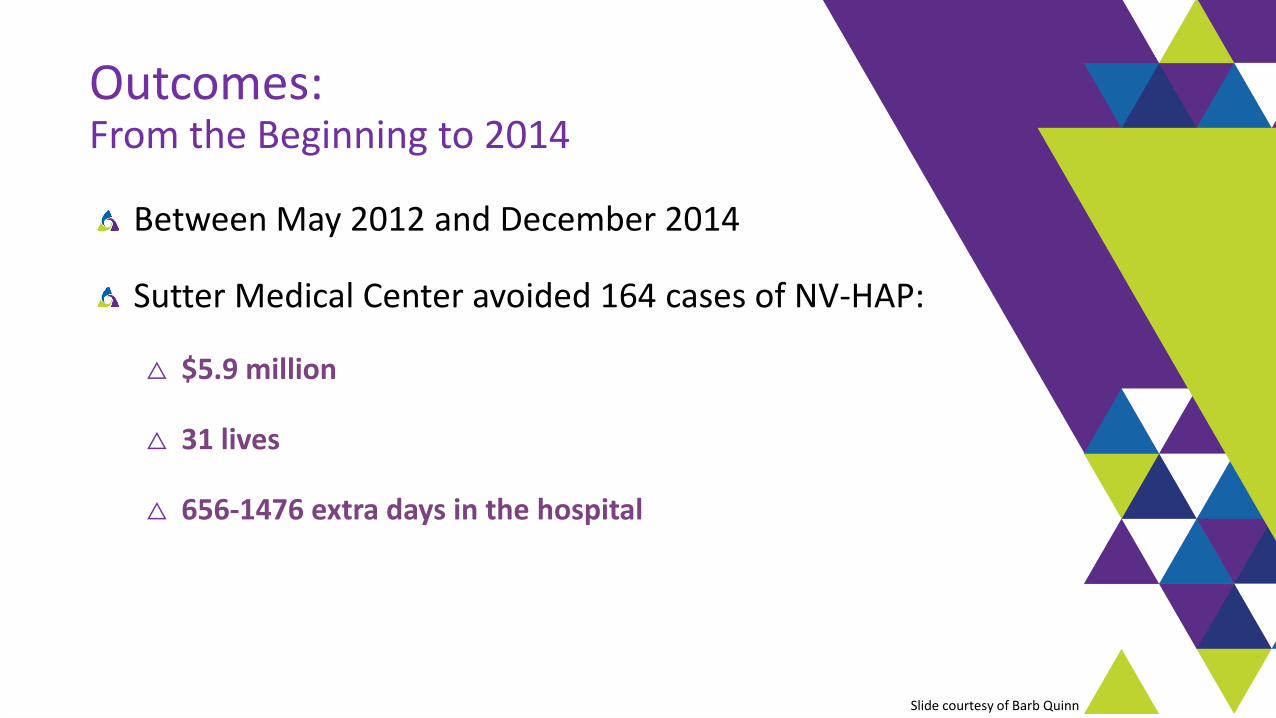
Outcomes: From the Beginning to 2014
Between May 2012 and December 2014
Sutter Medical Center avoided 164 cases of NV-HAP:
△ $5.9 million
△ 31 lives
△ 656-1476 extra days in the hospital
Slide courtesy of Barb Quinn
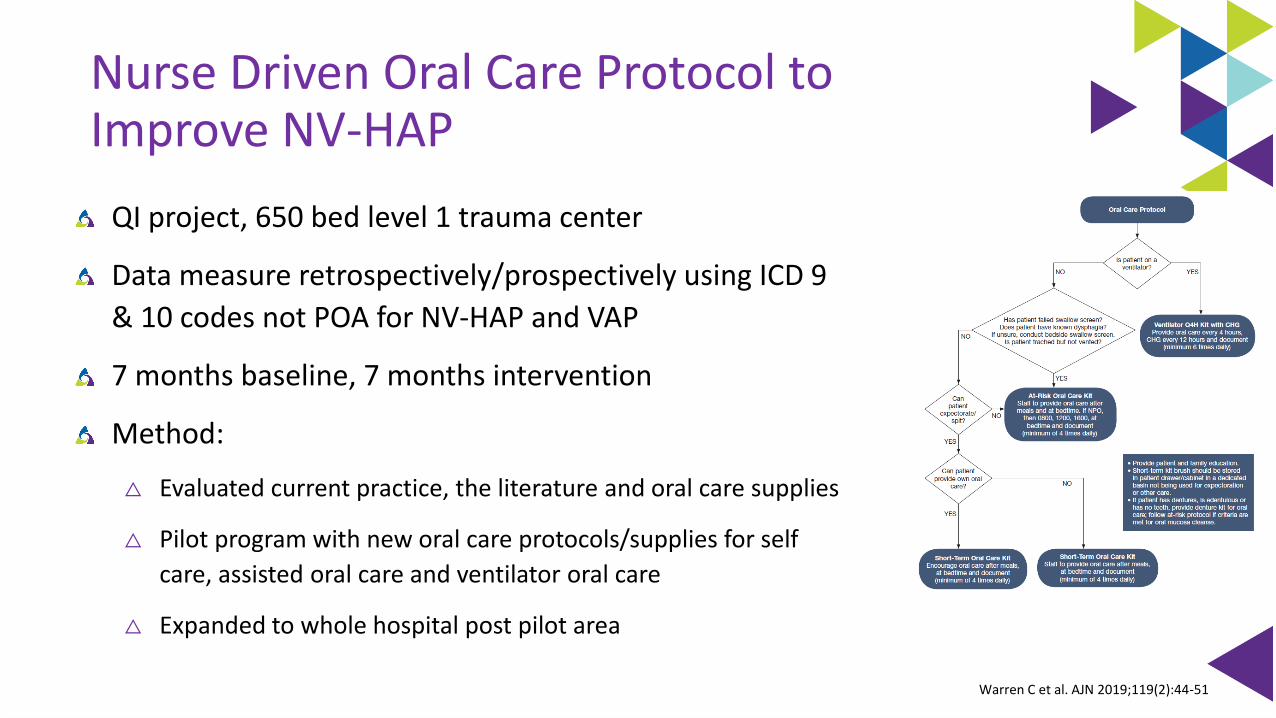
Nurse Driven Oral Care Protocol to Improve NV-HAP
QI project, 650 bed level 1 trauma center
Data measure retrospectively/prospectively using ICD 9
& 10 codes not POA for NV-HAP and VAP
7 months baseline, 7 months intervention
Method:
△ Evaluated current practice, the literature and oral care supplies
△ Pilot program with new oral care protocols/supplies for self
care, assisted oral care and ventilator oral care
△ Expanded to whole hospital post pilot area
Warren C et al. AJN 2019;119(2):44-51
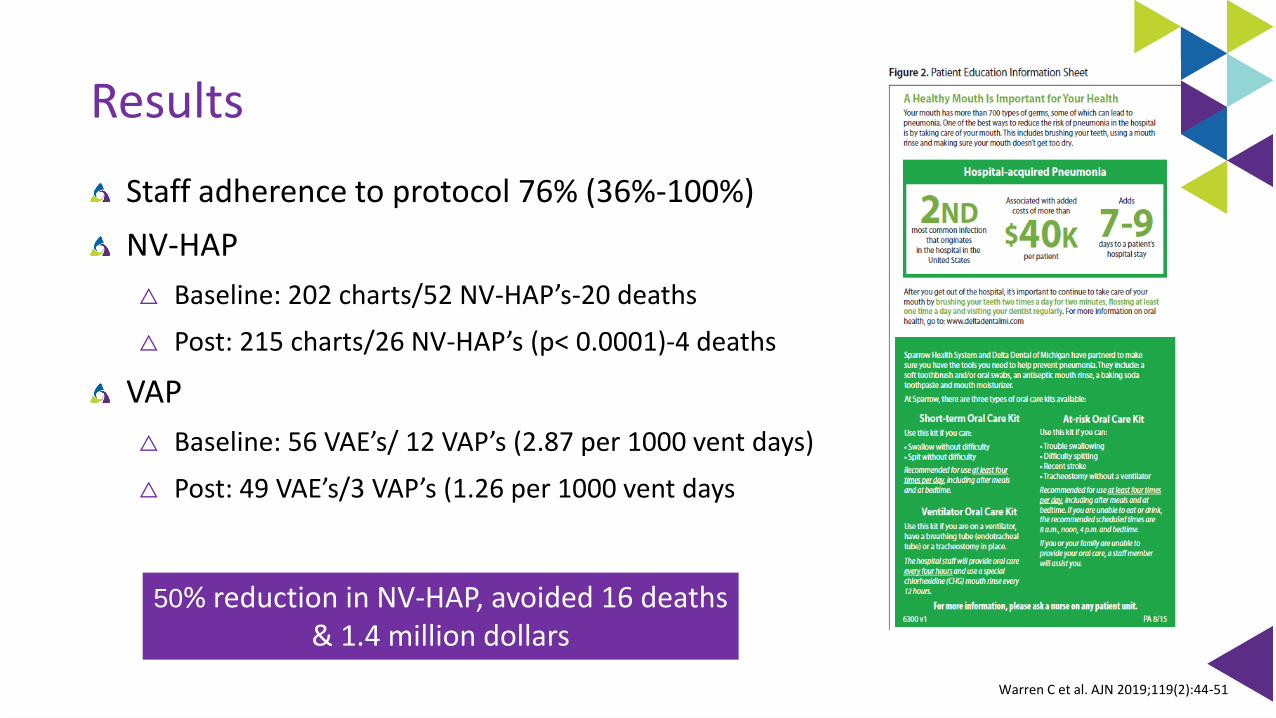
Results
Staff adherence to protocol 76% (36%-100%)
NV-HAP
△ Baseline: 202 charts/52 NV-HAP’s-20 deaths
△ Post: 215 charts/26 NV-HAP’s (p< 0.0001)-4 deaths
VAP
△ Baseline: 56 VAE’s/ 12 VAP’s (2.87 per 1000 vent days)
△ Post: 49 VAE’s/3 VAP’s (1.26 per 1000 vent days
50% reduction in NV-HAP, avoided 16 deaths & 1.4 million dollars
Warren C et al. AJN 2019;119(2):44-51
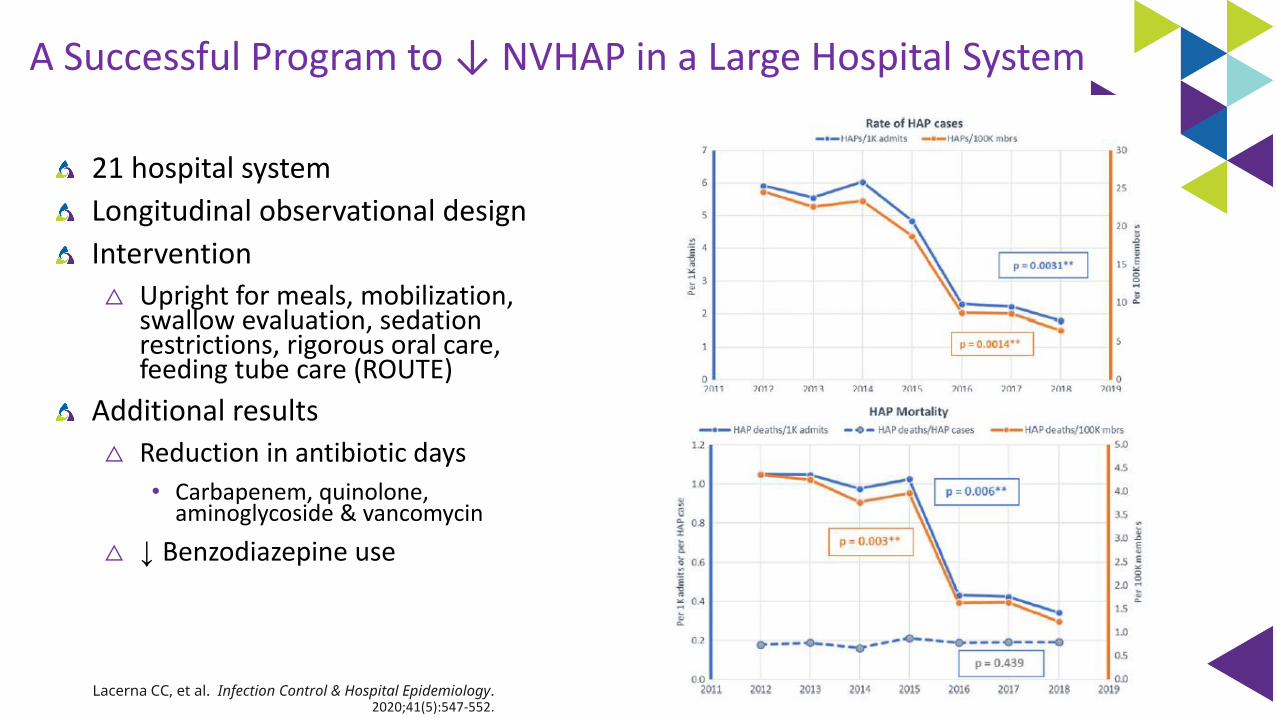
A Successful Program to ↓ NVHAP in a Large Hospital System
21 hospital system
Longitudinal observational design
Intervention
△ Upright for meals, mobilization, swallow evaluation, sedation restrictions, rigorous oral care, feeding tube care (ROUTE)
Additional results
△ Reduction in antibiotic days
• Carbapenem, quinolone, aminoglycoside & vancomycin
△ ↓ Benzodiazepine use
Lacerna CC, et al. Infection Control & Hospital Epidemiology. 2020;41(5):547-552.

It is not enough to do your best; you
must know what to do, and THEN do
your best.
~ W. Edwards Deming

Forbid yourself to be deterred by poor odds just because your mind has calculated that the
opposition is too great. If it were easy, everyone would do it.

Register on FocusRN.stryker.comPlease access on desktop, laptop, or tablet
To get started:
Check your email the week following your event. You’ll receive an evaluation to complete.
On your next visit to the website, you’ll see a message prompting you to complete your evaluation. This will allow you to access your downloadable certificate of completion.
FocusRN.stryker.com
Stryker is accredited as a provider of continuing education in nursing by the California Board of Registered Nursing (provider number CEP 15927).
Earn free CE credits
CMR 27582

Kathleen M. Vollman MSN, RN, CCNS, FCCM, FCNS, FAANClinical Nurse Specialist / Educator / ConsultantADVANCING [email protected], Michiganwww.vollman.com [email protected] | www.Vollman.com
https://www.medbridgeeducation.com/advancing-nursing
HAI prevention courses by Kathleen Vollman


![Hospital Acquired Infections, Sources, Route of …...hospital acquired infections worldwide is Enterococci [17]. Three to seven percent of hospital-acquired bacterial infections are](https://img.pdfslide.us/doc/110x75/5e8d2da3c3edfd174827a4ae/hospital-acquired-infections-sources-route-of-hospital-acquired-infections.jpg)