Embed Size (px)
Citation preview

1
THE IMPACT OF PATIENT HEALTH INSURANCE
COVERAGE AND LATENT HEALTH STATUS ON
HOSPITAL READMISSIONS
Sezgin Ayabakana, Indranil R. Bardhanb, and Zhiqiang (Eric) Zhengb
a University of Baltimore, Baltimore, Maryland b University of Texas at Dallas, Richardson, Texas
ABSTRACT
Hospital readmission rate is adopted as a key hospital quality metric by the Centers for
Medicare and Medicaid Services (CMS). In 2012, CMS began penalizing 2200 hospitals
with excess readmission rates for a total about $280 million in Medicare payments.
However, readmission rate may not be an appropriate quality metric because it may be
driven by factors other than the care given at hospitals. In this research, rather than treating
readmission as a consequence of a mere inpatient care quality, we investigate several other
important factors that may lead to readmission, such as insurance coverage and patient's
unobserved health status outside hospitals. We posit that generous insurance coverage may
result in higher readmission rates; and deteriorated health status, which is unobservable
most of the time, may result in higher readmission rates. We utilize a comprehensive
inpatient panel dataset of Congestive Heart Failure patient visits across 68 hospitals in
North Texas from 2005 to 2011. We apply a quasi-experimental approach to investigate
the impact of switching to Medicare plan on increasing readmission rate and develop a
Hidden Markov Model (HMM) to capture the unobservable health status and its impact on
the readmission rate. Our quasi-experimental results demonstrate that privately insured or
self-pay patients face higher readmission propensity after they enroll in Medicare. HMM
estimation results indicate that there is a substantial difference in the readmission rates
among different health states (e.g., less healthy had significantly higher readmission rates
compared to healthier), all of which reveals the association between level of unobserved
health status and readmission rate. This research sheds light onto debate over readmission
rate as a sole quality metric and tries to explain that unobservable health status and financial
risk borne by patients are likely causes of readmission.

2
1 INTRODUCTION
High hospital readmission rates, defined as patient’s admission to a hospital within 30-days of being
discharged from the same or another hospital (CMS 2014), have recently become the focus of clinicians,
healthcare leaders and policy makers, due to its prevalence and high cost on the United States (US)
healthcare system (McCarthy et al. 2013). Hospital Readmission Reduction Program (HRRP), established
by the Centers for Medicare and Medicaid Services (CMS) has set its initiative on reducing the frequency
of Medicare readmissions. In spite of recent improvements, the US still has the highest readmission rates
compared to other developed countries (Dorland Health 2014; Joynt and Jha 2013; Kociol et al. 2012).
While these findings suggest that readmission rates in the US are excessive and reducible, according to
Sommers and Cunningham (2011), until wide-spread efforts are made to prevent readmission, the US
healthcare system will shoulder a $16 billion burden.
In addition to severe financial implications, high readmission rates are also perceived to be a sign
of low hospital care quality (Benbassat and Taragin 2000). CMS has been promoting to use the reducible
readmission rate to assess the quality of care given in hospitals (Weissman et al. 1999). In 2013, CMS
began implementing a regulatory policy of the HRRP, which was developed and adopted by the Payment
Advisory Commission (PAC) in 2011, the goals of which are reduce, and ultimately prevent readmissions
(Medicare Payment Advisory Commission 2011). To that end, CMS will penalize hospitals with high 30-
day readmission rates for heart attack, heart failure, and pneumonia patients by reducing or withholding
reimbursements for services. Accordingly, two thirds of hospitals were issued a 1% reduction in Medicare
reimbursements in 2013, which resulted in a savings of 280 million dollars. Going forward, CMS will
increase this penalty to 2% in 2014, and to 3% in 2015 (Joynt and Jha 2013). Considering the fact that
hospitals operate on an aggregate margin of 4%-5% (American Hospital Association [AHA] 2013), the
financial penalty imposed by CMS will have a substantial impact on hospitals.
Recently, researchers and healthcare providers, e.g., Tsai et al. (2013), started questioning the
validity of using readmission rates as the sole measure of a hospital’s quality of care: readmission reduction
may need to go beyond factors associated to hospital care quality, such as patients receiving substandard
care during their index hospitalizations. Kangovi and Grande (2011) suggested that rates of readmission
alone do not even constitute a valid metric of quality, yet it is more of a measure of health service use,
which is a function of quality of care, patients’ health status, access to health services, and socio-economic
resources.
In this study our objective was to explore non-clinical factors that are not related to hospital quality
of care but explain potential risks to readmission. Mainly, we are interested in two non-clinical factors that
might be affecting the readmission process: (a) health status of patients outside the hospital, and (b) patients’
insurance coverage. First, patients’ health status might depend on personal factors such as unhealthy

3
lifestyle, alcohol or drug abuse, medical factors such as lack of access to outpatient facilities and primary
care providers, or social supports such as lack of family and friend attention. We assert that patients with
worsened health state outside the hospital will require readmission following a discharge. In addition, health
status is incorporated as an unobservable variant in our model, because neither can providers track nor do
hospitals include the health status of patients in discharge claim files. Second, socio-economic factors such
as financial factors and the resultant insurance coverage might impact the patient’s decision of re-
hospitalization. When a patient realizes his or her insurance coverage increases and their financial liability
decreases, a patient may decide to visit the hospital for previously undertreated health conditions, which
comes with an increased risk of readmission. Hence, we posit that lowered financial liability increases the
readmission propensity of patients as patients will be less reluctant to visit hospitals. This necessitates us
to analyze the impact of the change of insurance plans on the propensity of readmission rather than the
aggregated impact of individual insurance plans on readmissions. Overall, these two factors, health status
and insurance coverage, are neither controllable nor modifiable by hospitals. Thus, our research contributes
to settle the debate over whether readmission rates are really a valid measure of the level of quality of care
given at hospitals; or whether other non-clinical factors, such as health status and insurance coverage can
also explain readmission rates.
To test our hypotheses on the impact of health status and insurance policy change, as they relate to
readmission, we utilized a comprehensive inpatient panel dataset of Congestive Heart Failure (CHF) patient
visits across 68 hospitals in North Texas from 2005 to 2011. We extracted observations of patients with
given payer information as either private, or self-pay, or Medicare and created two full datasets consisting
of: (a) 828 observations for 305 privately insured and/or Medicare patients and (b) 1978 observations for
636 self-pay and/or Medicare patients. We apply a quasi-experiment approach to investigate the impact of
insurance policy change on readmission rate and model unobserved patient health status as a latent state via
a HMM approach. Our results demonstrate that privately insured or self-pay patients face higher
readmission propensity after they enroll in Medicare. HMM estimation results indicate that there is a
substantial difference in the readmission rates among different health states (e.g., less healthy had
significantly higher readmission rates compared to healthier), all of which reveals the association between
level of unobserved health status and readmission rate. This research sheds light on the growing debate over
readmission rate as a sole quality metric and explains that two non-clinical factors—health status and
financial risk borne by patients—are likely causes of readmission. Therefore, it is arguable that policy
makers should consider factors impacting patients’ readmission propensity outside the hospital, along with
clinical factors related to hospital quality of care. As these findings suggest, hospitals alone do not seem to
be the only source of accountability when analyzing the health outcomes of patients.

4
2 HYPOTHESES
In this section, we develop our hypotheses to investigate the implications of insurance policy change and
patient’s health status and their association to readmission event over the course of patient’s admission
history.
2.1 Insurance Policy Change
Literature on healthcare economics has studied the healthcare utilization with respect to various insurance
plans. Rand Corporation in 1970s conducted a randomized evaluation of healthcare utilization and found
that insurance type has a substantial effect on healthcare use and plans with lower co-insurance rate showed
greater expenditures (Manning and Marquis 1996). Doyle Jr (2005) finds that crash victims without
insurance have about 15% shorter hospital stays and facility charges, and 40% higher mortality rates than
those with private insurance suggesting that lack of insurance coverage causes discrepancies in the density
and quality of care. Massachusetts has been implementing a healthcare reform to achieve near universal
health insurance coverage since 2006 (Long and Masi 2009). Accordingly, it has been reported that
readmission rates has significantly increased from 14.3% to 14.5%, while other states have witnessed a
decrease of readmission from 19% to 17.9% in the meantime, as the reform unfolds and the number of
uninsured decreased (Lasser et al. 2014). Overall, Agency for Healthcare Research and Quality (AHRQ)
reports that Medicare patients have higher 30-day readmission rates (24%) compared to both uninsured
(13%) and privately insured patients (11%) in 2008 throughout the 15 states (Wier et al. 2011). All these
findings suggest that with a better health insurance plan, i.e., Medicare, patients will incur higher
readmission risks compared to patients who are privately insured or uninsured given that these types of
patients would face higher financial hardships if they were to visit hospitals.
The above literature suggests that different insurance plans may lead to different quality of care at
the aggregated level. Though, we are interested to examine how changes in insurance plans have a bearing
on the quality of care outcomes, i.e., readmission, because better access to insurance plans has impact on
the access to care and subsequently the health care resource utilization. In addition, the recent policy--
Affordable Care Act (ACA) requires patients to switch insurance plans, and become either privately insured
or covered by Medicaid. McWilliams et al. (2003) examine the changes in health care services in two
different groups of patients: people who had held health insurance coverage before reaching age 65 and
patients who are uninsured throughout the study period. Accordingly, McWilliams et al. (2003) conclude
that the rate of medical screening procedure use increases after age 65 for the uninsured group. In another
study on healthcare utilization, Lichtenberg (2002) shows that utilization of healthcare resources, e.g.,
inpatient care, increases abruptly at the age of 65 once patients become eligible for Medicare. As pointed
out previously, Medicare beneficiaries are entitled to Medicare benefits conditional on survival to age 65.

5
Hence, better coverage and potential improved health in old age might induce individuals in younger ages
to take better care of themselves before 65. On the other hand, this better coverage after age 65 might induce
elderly to participate in activities that reduces health quality and increases mortality risk, i.e., starting
smoking, eating unhealthy food (Khwaja 2010). Therefore, after the age of 65, elderly patients might start
using healthcare resources more because of the increased coverage and access to care. According to the
“Coverage Matters” report by the Institute of Medicine (2001), people without insurance are less likely to
see a doctor within a given year, have fewer visits annually and are less likely to have a regular source of
medical care. Thus once these underinsured patients enroll in Medicare, they might experience higher
number of visits to hospitals to reduce the health risks already accumulated up until the age of 65 (Card et
al. 2007; McWilliams et al. 2007). Therefore, we hypothesize that previously uninsured or privately insured
patients would face higher number of readmissions after they enroll in Medicare due to reduced financial
risks and increased coverage.
Hypothesis 1a: Patients who were privately insured previously and switch to Medicare are more
likely to exhibit higher readmission rate.
Hypothesis 1b: Patients who were uninsured previously and switch to Medicare exhibit higher
readmission rate.
2.2 Patient Health Status
One main reason why patients come back to hospitals and are readmitted in a short amount of time is the
need of care to improve their worsened health condition outside hospitals. Once patients are discharged
from hospitals, patients’ health status will be subject to various factors that providers might not have any
control on. Specifically, medical, personal and social disturbances alter the way how recovery of patient
proceeds outside hospitals (McCarthy et al. 2013). Unless health status is self-reported, it is unobservable
to care providers and researchers, or at least difficult to measure (Wolfe and Behrman 1984). Harris and
Remler (1998) suggest that patients are heterogeneous in terms of unobservable factors, in which health
status is one of them. In labor economics literature, health status has been investigated as a determinant of
retirement decisions extensively, where the treatment of health status constituted one big problem since it
was not directly observable (Dwyer and Mitchell 1999). People’s self-reported health statuses were only a
subjective measure because people used to mis-specify their health statuses in order to justify their early
retirement decisions (Dwyer and Mitchell 1999). Thus either in healthcare or labor economics, health status
is a complex measure, which is not directly observable. In our case, to analyze the impact of patient health
status on readmission, we first have to reveal the factors impacting patient’s health status—an unobservable
artifact for the researcher and an un-controllable artifact for the care providers.
One of the medical factors impacting patient’s recovery and health status is the level of access to
care. Patient’s health status, which could be negatively affected by his inability to receive treatment at

6
outpatient settings, is one important link that should not be excluded in readmission analyzes. In the case
of lack of outpatient clinics, such as nursing homes, general physician practices, or home care, patient will
not be able to receive timely treatment, which will aggravate a patient’s current health condition (Ferrer
2007) and eventually lead to the patient’s readmission to an inpatient setting. Goodman et al. (1994) find
that pediatric medical hospitalizations are positively associated to regions with high bed supply and
negatively associated to regions with high number of ambulatory care facilities—suggesting that supply of
inpatient and outpatient care are important factors in explaining pediatric medical hospitalizations. Another
medical factor that might have an impact on patient’s health status is the discharge destination. For instance,
patients can be discharged to either home care or nursing home. Nursing homes have better care
opportunities for patients in terms of treatment and support compared to home care. It has been found that
patients with chronic obstructive pulmonary disease or dementia experience lower likelihood of
readmission within 30 days if they are discharged to nursing homes rather than to personal homes (Camberg
et al. 1997). In addition, educational interventions and post-discharge follow-up care, i.e., RN telephoning
the patient or visiting at home, are found to have reducing effects on the readmission risk of CHF patients
(Gwadry-Sridhar et al. 2004), all of which can be considered as medical factors.
Another important group of factors impacting patient’s health condition is related to personal or
social factors. Patient’s inability to comply with discharge recommendation and medication regimen, lack
of transportation and social support have been cited as important determinants of health deterioration and
readmission risk (Annema et al. 2009; Kangovi et al. 2013a; Kangovi et al. 2013b; Retrum et al. 2013).
After discharge, patients begin to experience difficulties of performing discharge recommendations because
of various personal issues, such as sense of abandonment, dysfunctional emotional supportive social
networks, misaligned discharge goal-setting, external constraints and lack of family support (Kangovi et al.
2013a). Retrum et al. (2013) also cites that inadequate support or lack of resources, such as transportation
to medical appointments, lack of meals meeting diet restrictions, and self-care issues, such as inability to
check weight, non-compliance with medication and lack of exercise, were among the main issues CHF
patients self-reported after discharge from index hospitalization. Accordingly, patient’s health status will
deteriorate if the explained personal and social factors are detrimental for patient. As a consequence, patient
will need to be readmitted to hospital to improve his health, which will be achieved by using the resources
available in hospitals that are not available to patient otherwise.
Patients experience various factors and obstacles after discharge from hospitals, which affect
patients’ health condition and introduce heterogeneity among patients. Depending on the level of impact,
patients’ health statuses deteriorate over time and become impossible to measure for care providers and
researchers unless patients self-report in an ideal managed-care scenario. Though, Deb and Trivedi (2002)
argue that even these self-perceived health statuses may not fully capture population heterogeneity from

7
the source. Therefore, it becomes essential to reveal patient unobserved health status to assess its differential
impact on health outcomes.
We posit that the unobserved heterogeneity has a bearing on health outcomes to the extent that
patients in a poor health state will experience higher readmission risk compared to patients in a better health
state, in which patients’ health will deteriorate over time due to negative impacts of medical, personal and
social factors.
Hypothesis 2: Patient readmission rates are significantly associated with changes in patient health
status.
Based on these hypotheses, we depict our conceptual research model in Figure 1.
3 RESEARCH METHODOLOGY
Our conceptual research model given in Figure 1 is tested using the data obtained from Dallas-Fort Worth
Hospital Council (DFWHC) Research Foundation. We first explain the data and variables that we use to
set up our conceptual research model and test our research hypotheses H1a, H1b and H2.
3.1 Data
Data obtained from DFWHC is based on admission-level administrative claims in which each patient might
have multiple admissions to different hospitals in the North Texas region starting from 2005 to 2011. Each
patient is given a unique patient identifier number-- the regional master patient index (REMPI) by DFWHC
Foundation (Bardhan et al. 2011). With REMPI, each patient can be tracked over time and across all
hospitals in the region allowing us to obtain the patient’s entire visit and diagnosis history. In total there are
68 non-Federal hospitals with 26 different health systems that these hospitals belong to. Since CHF is one
of the three conditions with which CMS has been penalizing hospitals on according to the rate of
readmission these hospitals possess, CHF has constituted an important study area for researchers and policy
Figure 1 Conceptual Research Model
Readmission
Private Medicare
Unobserved Health
Status
H1a (+)
H2 (-)
ControlsPatient Demographics
Hospital CharacteristicsAdmission Characteristics
Selfpay Medicare H1b (+)

8
makers (Ross et al. 2008). Therefore, in this study we focus on inpatient admissions with CHF as the
principal diagnosis, i.e., patient admissions with ICD-9 code of “428.xx”. Focusing only on their principal
diagnosis alleviates possible patient heterogeneity arising from disease related treatment variations.
According to our conceptual model (Figure 1), we need to focus on patients with at least three
admissions1. We then drop the last admission of patients since it does not have any 30-day readmission risk
information for itself. Finally, we created two datasets; one dataset for private & Medicare (P&M) patients
and one dataset for selfpay & Medicare (S&M) patients. After the last admissions were dropped, we ended
up with two datasets having 828 observations (305 patients) and 1978 observations (676 patients) for private
& Medicare and selfpay & Medicare patients, respectively.
In observational studies, when it is impossible to randomly assign subjects into treatment and
control groups due to ethical or practical reasons, matching strategy is recommended2 (Rosenbaum 1989).
Rather than applying greedy algorithms, such as propensity score matching in the statistics literature,
Rosenbaum (1989) find that optimal matching algorithm based on network flow analysis gives closer and
more tolerable matches. Accordingly, we follow the algorithm developed by Rosenbaum (1989), and also
suggested by Cram et al 2009, to match patients from treatment to control groups. To match patients, we
used the SAS macro developed by Mayo Clinic (Bergstralh and Kosanke 1995) and included patient age,
sex, race, risk mortality and severity level as matching covariates.
3.2 Variables
We derive and calculate several variables using the DFWHC Foundation claims dataset at the admission,
patient, physician and hospital level. Our main variables of interest are readmission risk, insurance policy
change, operating physician experience and specialization, hospital congestion, comorbidities. We report
the definitions and the statistics of these variables in Table 1.3
1 (i) We need at least two admissions per patient in order to calculate the insurance policy change variable with respect to the
prior visit information, (ii) We again need at least two admissions per patient to calculate the (future) 30-day readmission risk
with respect to the future visit information. Therefore, at least three admissions per patient would suffice us to fully develop
insurance policy change and 30-day readmission risk variables together for one patient.
2 Conducting a quasi-experiment to test the change of insurance policy and its associated effect on readmission risk required us to
assign patients into treatment and control groups with respect to their insurance policy history. Patient who had stayed on the
same insurance policy, such as private or selfpay, constituted the control group for two datasets, P&M and S&M respectively,
whereas patients who had changed their insurance policy from private to Medicare or selfpay to Medicare constituted the
treatment group for two datasets, P&M and S&M respectively.
3 Due to space limitation, we skip the explanation of these variables and we report them in Table 1.
9
Table 1 Descriptive Statistics of Variables
Variable Definition Dimen.
P&M
(Private
Medicare)
N = 828
S&M
(Selfpay
Medicare)
N = 1978
Mean Std Dev Mean Std Dev
Admission Characteristics
Readmission 30-day Readmission event Binary 0.31 0.46 0.31 0.46
ComorbidityIndex Normalized comorbidity intensity
index out of 9 comorbidities [0, 1] 0.31 0.15 0.28 0.14
SourcePersPhys 1 = if patient is referred from his
personal physician Binary 0.39 0.49 0.25 0.43
DischargeNursingFac 1 = if patient is discharged to nursing
facility Binary 0.05 0.22 0.01 0.07
DischargeHomeCare 1 = if patient is discharged to home
care Binary 0.11 0.32 0.02 0.15
AdmissionEmergency 1 = if it is an emergency admission Binary 0.74 0.44 0.93 0.25
RiskMortality Risk mortality increases from 0 to 4 (0,..,4) 2.19 0.79 1.94 0.82
LOS Length of stay Cont’s 4.87 4.58 4.64 3.91
NumProc Number of procedures Count 0.86 1.54 0.76 1.56
NumDiag Number of diagnoses Count 12.12 5.15 11.65 4.96
Physician Characteristics
OprPhysExperience Number of patients seen so far Cont’s 81.54 75.68 90.36 78.92
OprPhysSpecialization Herfindahl Index wrt to performed
procedures [0, 1] 0.23 0.11 0.24 0.11
Hospital Characteristics
HospitalCongestion Number of patients / Max patients in
the hospital Cont’s 0.5 0.2 0.52 0.19
HsCMI Case mix index Cont’s 1.63 0.28 1.66 0.23
HsTeaching 1= if it is a teaching hospital Binary 0.34 0.47 0.6 0.49
HsUrban 1= if it is an urban hospital Binary 0.92 0.28 0.95 0.22
HsBedSize Hospital bed size Cont’s 362.35 277.53 483.98 322.68
Patient Demographics
Treatment 1 = If patient switches from Private
(Selfpay) to Medicare Binary 0.33 0.47 0.25 0.43
Control 1 = If patient stays on Private
(Selfpay) Binary 0.67 0.47 0.75 0.43
PtAge Patient age Cont’s 62.76 14.6 51.14 9.78
PtWhite 1 = if race is white Binary 0.61 0.49 0.41 0.49
PtFemale 1 = if gender is female Binary 0.39 0.49 0.33 0.47

10
4 MODEL SPECIFICATION
4.1 Quasi Experimental Setup
To examine if changing insurance policy is associated to a change in the patient outcomes, we utilize a
difference-in-difference (DID) specification which is extensively used in healthcare and management
literatures (Card et al. 2007; Currie and Gruber 1996; Kumar and Telang 2012; Lichtenberg 2002;
McWilliams et al. 2003; Meyer 1995). In our analysis, we run our experiment on two different datasets,
P&M and S&M, mainly focusing on patients whose insurance type changes from Private to Medicare in
P&M and Selfpay to Medicare in S&M (We refer to the first experiment as PM and the second
experiment as SM). For that reason our treatment group for the first dataset comprised of patients whose
insurance policy has changed from Private to Medicare. On the contrary, the Control group for the first
dataset comprised of patients whose insurance policy was Private for the full analysis period. Patients are
assigned to Treatment and Control groups following the matching strategy explained in the previous
section. Matching allowed us to create a binary variable Treatmenti specifying which group each patient
belongs to4.
In our quasi-natural experiment, we also incorporated the variables associated to our hypotheses,
such as physician (OprPhysExperience and OprPhysSpecialization) and hospital related factors
(HospitalCongestion). We also control for admission, patient and hospital specific factors. Accordingly, we
estimate the following DID model for 𝑅𝑒𝑎𝑑𝑚𝑖𝑠𝑠𝑖𝑜𝑛𝑖𝑡+1 for both datasets PM and SM. For
𝑅𝑒𝑎𝑑𝑚𝑖𝑠𝑠𝑖𝑜𝑛𝑖𝑡+1 variable, since it is a binary variable, we follow a logistic regression and specify Eq1
with respect to the effects of covariates on the log of odds of readmission. Logistic regression for
𝑅𝑒𝑎𝑑𝑚𝑖𝑠𝑠𝑖𝑜𝑛𝑖𝑡+1 (Eq1) is defined as follows:
𝐿𝑜𝑔𝑖𝑡(𝑅𝑒𝑎𝑑𝑚𝑖𝑠𝑠𝑖𝑜𝑛𝑖𝑡+1 )
= 𝛼0 + 𝛼1𝑇𝑟𝑒𝑎𝑡𝑚𝑒𝑛𝑡𝑖 + 𝛼2𝑃𝑜𝑠𝑡𝑖𝑡 + 𝛼3𝑇𝑟𝑒𝑎𝑡𝑚𝑒𝑛𝑡 ∗ 𝑃𝑜𝑠𝑡𝑖𝑡
+ 𝛼4𝑂𝑝𝑟𝑃𝑠𝑦𝐸𝑥𝑝𝑒𝑟𝑖𝑒𝑛𝑐𝑒𝑖𝑡 + 𝛼5𝑂𝑝𝑟𝑃𝑠𝑦𝑆𝑝𝑒𝑐𝑖𝑎𝑙𝑖𝑧𝑎𝑡𝑖𝑜𝑛𝑖𝑡 + 𝛼6𝐻𝑜𝑠𝑝𝑖𝑡𝑎𝑙𝐶𝑜𝑛𝑔𝑒𝑠𝑡𝑖𝑜𝑛𝑖𝑡
+ 𝐶𝑜𝑛𝑡𝑟𝑜𝑙𝑠 ∗ 𝛼𝑐 (𝐄𝐪𝟏)
where i denotes a patient and t denotes admission time index. 𝑇𝑟𝑒𝑎𝑡𝑚𝑒𝑛𝑡𝑖 equals one if patient i changes
his insurance policy from Private to Medicare (or Selfpay to Medicare) throughout his full admission
history. 𝑃𝑜𝑠𝑡𝑖𝑡 equals one if patient i’s admission time t is after the time of insurance change. The
coefficient estimate of 𝛼3 for 𝑇𝑟𝑒𝑎𝑡𝑚𝑒𝑛𝑡 ∗ 𝑃𝑜𝑠𝑡𝑖𝑡 is of our primary interest since it captures the change in
the quality outcome (either readmission risk or duration till the next admission) for patients whose insurance
type changes relative to patients whose does not. We also account for admission characteristics (emergency
4 After matching is complete, we synchronize the time of insurance change for a patient in a control group with the time when his
match in the treatment group changes his insurance. This allowed us to create the pre- and post-treatment binary variable Postit
for patients in the control group.

11
admission, length of stay, risk mortality), patient characteristics (patient age, gender, race) and hospital
characteristics (hospital CMI, teaching status, location of being urban vs suburban, bedsize) in our DID
estimation approach.
4.2 Hidden Markov Model Approach
We model unobserved patient health state as a latent state via a Hidden Markov Model (HMM). HMM
depicts the relationship between two stochastic processes: (1) an observed process and (2) an underlying
“hidden” or unobserved process (MacKay Altman 2004). HMM assumes a mixture distribution for its
observed outcomes’ marginal distribution—suggesting the existence of hidden discrete states that generate
these outcomes (Visser 2011). HMM models latent states as a Markov chain evolving over time and creating
serially dependent observations. With Markov property, serially dependent observations become
conditionally independent observation sequence given the state of the Markov chain at the time of the
observation (Ephraim and Merhav 2002). In our study, health states represent the latent states and constitute
a stochastic process since patients’ health states can change over time. Transitions among states may happen
at any discrete time interval (Rabiner 1989). The observable outcomes that depend on the latent health states
are defined by a readmission process of a patient. In our HMM, these observed outcomes as time dependent
sequences will reveal the latent health condition of patients.
Specifically, for a given patient, our model captures the dependence among health states of patients,
and readmission. Transitions among health states is explained by time-varying covariates such as the level
of care given to the patient in the previous admission as well as covariates specific to the hospital that the
patient was admitted to. This stochastic transition process is then transformed into the observed patient
readmission process in a probabilistic manner. By making the current admission event dependent on the
previous admission, correlations among admission events will be captured by our model. Different from
previous studies in the Management literature using HMM as their research model (Netzer et al. 2008;
Singh et al. 2011), our model considers a feedback loop between the previous time period’s outcome
variable and the current period’s unobserved state, suggesting that patient’s health status depends on the
previous period’s readmission event. The generic view of our model is depicted in Figure 2.
In the figure, the hidden health states are represented with darkened circles, readmission states are
represented with squares. A hidden health state takes a value from the set {1, 2, . . . , 𝑁𝑆}, each value
representing an unobserved state such as good, bad or other conditions where the optimal number of states
will be determined by the model. Readmission takes a value of either 0-no readmission, 1-readmission.
Straight links among different type of states represent the transition processes, i.e., health state transition,
whereas the dashed links represent the dependence among various types of states. In our model, we define
the health state sequence of a patient – p as 𝑆 = {𝑠0, … , 𝑠𝑡−1, 𝑠𝑡, 𝑠𝑡+1, … , 𝑠𝑇} and the readmission sequence
as 𝑅 = {𝑟0, … , 𝑟𝑡−1, 𝑟𝑡 , 𝑟𝑡+1, … , 𝑟𝑇} for a total duration of T periods. Here, health state sequence 𝑆, and 𝑅

12
constitute an HMM process. In addition, we define 𝑹𝑡 as a readmission history of patient p from time 1 up
to time t, and similarly for the unobserved health state 𝑺𝑡. To analyze the patient readmission problem, we
have to model Prp
( 𝑹𝑇) for each patient p and maximize the likelihood of observing 𝑹𝑇for patient p as:
𝐿𝑝𝑇 = Prp(𝑹𝑇) = ∑ Prp(𝑹𝑇 , 𝑺𝑇)
𝑺𝑇
Analyzing the directed graph in Figure 2 under the first order Markov property by checking the
parents of each node (dependencies), we can write 𝐿𝑝𝑇 with conditional probabilities as:
𝐿𝑝𝑇 = ∑ Prp(𝑹𝑇|𝑺𝑇)
𝑺𝑇
Prp(𝑺𝑇|𝑺𝑇−1, 𝑹𝑇−1)
𝐿𝑝𝑇 = ∑ Prp(S1 = 𝑠1)
𝑠1,𝑠2,…,𝑠𝑇
∏ Prp(Rt = 𝑟𝑡|St = 𝑠𝑡)
T
t=2
Prp(St = 𝑠𝑡|St−1 = 𝑠𝑡−1, Rt−1 = 𝑟𝑡−1)
As can be inferred from the likelihood function, HMM model requires specifying three types of
components: i) Initial state distributions at time t=1, Prp(S1), ii) The transition probabilities for example
Prp(St|St−1, Rt−1), iii) State dependent outcome probabilities, i.e., Prp(Rt|St ).
Now define the initial state distribution- the probability that patient p is in state s at t=1:
Prp(S1 = s) = 𝜋𝑝(𝑠), where 𝑠 ∈ {1, … , 𝑛}
The health state transition probability of patient p, where patient is in state s at time t-1, and
switching to state s’ at time t can be represented as:
Prp(St = s|St−1 = s′, Rt−1 = 𝑟𝑡−1) = qp,ts,s′
for 𝑠, 𝑠 ′ ∈ {1, … , 𝑆}
To move from one state to another, the care received in hospital h at time t-1 should be strong
enough to transition the patient to another health state. Therefore, this transition can be modeled as an
ordered multinomial logit model where:
Figure 2 HMM of the Readmission Process
13
for s → 1, qp,ts,1 =
exp (αs,1 − 𝐗ptβs)
1 + exp (αs,1 − 𝐗ptβs)
for s → s′, qp,ts,s′
= exp (α
s,s′ − 𝐗ptβs)
1 + exp (αs,s′ − 𝐗ptβs)
−exp (α
s,s′−1− 𝐗ptβs
)
1 + exp (αs,s′−1 − 𝐗ptβs)
for s → S, qp,ts,S = 1 −
exp (αs,S−1 − 𝐗ptβs)
1 + exp (αs,S−1 − 𝐗ptβs)
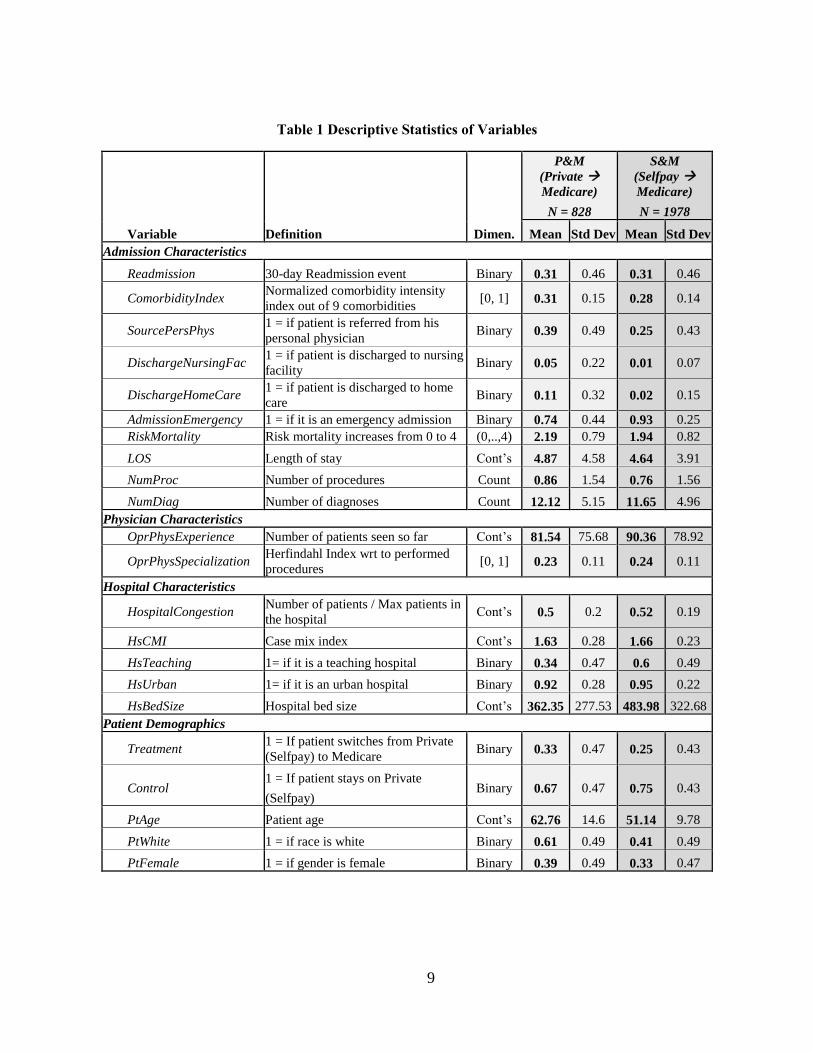
Here, 𝐗pt is the time varying covariate vector for patient p and βs
is a vector of parameters
capturing the impact of care being received for the propensity to transition from the health state s. In
addition, αs,s′ represents the s′ ordered logit threshold for being in state 𝑠 ∈ {1, … , 𝑆} with s′ ∈
{1, … , 𝑆 − 1}. 𝐗pt for hidden state transition probabilities may contain variables associated to patient’s
health. As discussed previously, these covariates might be related to medical, personal and social factors.
Hence, we include SourcePersPhyst, DischargeNursingFact, DischargeHomeCaret, Readmissiont-1, LOSt,
ComorbidityIndext, InsuranceMedicaret, and hospital and patient characteristics5.
Next is the state dependent outcome which is the readmission event of a patient. The probability
that a readmission of a patient will be modeled as a logit model assuming readmission events of a patient
are conditionally independent given the patient’s health state s.
Prp(𝑅𝑡 = 1 | 𝑆𝑡 = 𝑠) = 𝜌𝑝,𝑡𝑠 =
exp (𝒀𝑝𝑡𝛿𝑠)
1 + exp (𝒀𝑝𝑡𝛿𝑠)
Then;
Prp(𝑅𝑡 | 𝑆𝑡 = 𝑠) = �̃�𝑝,𝑡𝑠 = 𝜌𝑝,𝑡
𝑠 𝑟𝑡(1 − 𝜌𝑝,𝑡𝑠 )1−𝑟𝑡
Here, 𝒀𝑝𝑡 represents the time varying covariates for patient p associated to the readmission event.
𝛿𝑠 is a vector of state specific parameters. In our framework, 𝐘pt contains RiskMortalityt, NumProct,
NumDiagt, LOSt, ComorbidityIndext, InsuranceMedicaret, and hospital and patient characteristics. Since
readmission event might suggest how severe the patient’s condition is, related variables such as risk
mortality, number of procedures and diagnoses are included to differentiate readmission process from
hidden state transition process.
Finally, we can write the likelihood for patient p as:
𝐿𝑝𝑇 = ∑ 𝜋𝑝(𝑠1)𝑠1,𝑠2,…,𝑠𝑇
∏ �̃�𝑝,𝑡𝑠𝑡T
t=2 qp,tst,st−1 (Eq2)
5 These variables could also include zipcode based unemployment rate, median household income, number of
ambulatory care organizations (outpatient clinics within a specified radius). However, due to a possibility of collinearity among
these variables with patient’s insurance and demographics information, we did not include these variables as covariates.

14
One complication about Eq3 is that it has 𝑁𝑆𝑇 elements which are computationally intractable for
even modest values of T (Netzer et al. 2008). To simplify computation, we rewrite Eq3 in a matrix products
form as suggested by MacDonald and Zucchini (1997):
𝐿𝑝𝑇 = 𝜋𝑝�̃�𝑝,1𝑄p,1→2�̃�𝑝,2𝑄p,2→3 … 𝑄p,T−1→T�̃�𝑝,𝑇1′ (Eq3)
where �̃�𝑝,𝑡 is a 𝑁𝑆 × 𝑁𝑆 diagonal matrix with the elements of �̃�𝑝,𝑡𝑠𝑡 on the diagonal, 𝑄p,t−1→t is a transition
matrix containing the probabilities of qp,tst,st−1 for a patient p from time t-1 to t, and 1′ is a 𝑁𝑆 × 1 vector of
1s.
In developing HMM, number of latent states NS is not explicitly given or modeled. To select the
number of states, HMM scenarios with different number of states are estimated and each scenario’s model
fit is calculated for further comparison. There are various model criterions developed to compare the model
fit values, e.g., BIC, AIC (Zucchini 2000), each of which should be carefully implemented depending on
the model and data structure. Among these, Corrected Akaike Information Criterion (AICc) was first
introduced by Hurvich and Tsai (1989) as an alternative selection criterion, which was a version of general
Akaike Information Criterion (AIC). AICc was able to correct for small sample bias and shown to perform
well in shorter univariate time series, nonlinear regression and autoregression models (Costa and De
Angelis 2010; Hurvich et al. 1990). AICc also penalizes greater complexity, i.e., over-fitting, caused by the
increased number of parameters and hence values parsimonious models (Bebbington 2007). Lower values
of AICc are preferred in model selection. With respect to our model parameters (nVars) and number of
observations (nPatients), AICc is calculated as follows:
𝐴𝐼𝐶𝑐 = −2𝑙𝑛𝐿 + 2𝑛𝑉𝑎𝑟𝑠 ∗ 𝑛𝑃𝑎𝑡𝑖𝑒𝑛𝑡𝑠
𝑛𝑃𝑎𝑡𝑖𝑒𝑛𝑡𝑠 − 𝑛𝑉𝑎𝑟𝑠 − 1
where, L is the maximum likelihood of the model, nVars is the number of total parameters being estimated,
and nPatients is the number of patients in our model.
5 RESULTS
We now present our results for Eq1 with the quasi-experimental approach. The Logistic regression
estimation results for Eq1 are shown in the second and fourth columns of Table 2 for P&M and S&M
datasets respectively.
5.1 DID Results to Test Hypothesis 1a and 1b
We start by explaining the DID results obtained for P&M datasets to test Hypothesis 1a, in which we
explore the impact of changing insurance policy from Private to Medicare. Then we continue by showing
the DID results obtained for S&M dataset to test Hypothesis 1b, in which we analyze the impact of changing
insurance policy from Selfpay to Medicare.

15
Hypothesis 1a: From Private to Medicare
DID results for the impact of change of insurance from Private to Medicare on Readmission are reported in
the second column of Table 2. The coefficient for the interaction term (𝑇𝑟𝑒𝑎𝑡𝑚𝑒𝑛𝑡 ∗ 𝑃𝑜𝑠𝑡𝑖𝑡) is positive
and significant (𝛼3 = 0.584, 𝑝 < 0.10) suggesting a 79% increase in the odds of readmission for patients
switching to Medicare from a private insurance compared to patients who stay on their current private
insurance policies. On the other hand, when just the treatment (patients whose insurance types change) and
the control (patients whose insurance types stay as private) group of patients are compared, the propensity
to be readmitted is significantly lower for the treatment group (𝛼1 = −0.746, 𝑝 < 0.05). However, pre and
post-treatment periods for the whole data sample do not reveal any significant difference with respect to
the propensity to be readmitted. In addition, as the operating physician’s specialization increases, i.e.,
different types of procedures performed reduces, patient’s readmission risk increases significantly (𝛼5 =
1.697, 𝑝 < 0.05). Neither operating physician experience nor hospital congestion show a significant
association to the propensity of readmission.
The estimates of the interaction term, Treatment*Post, obtained from logistic regression suggest
that when patients change their insurance policies from private to Medicare, the propensity of readmission
increases significantly—supporting Hypothesis 1a.
Hypothesis 1b: From Selfpay to Medicare
The fourth column of Table 2 shows the results of DID estimation for the impact of change of insurance
from Selfpay to Medicare on readmission. Accordingly, the coefficient for the interaction term
(𝑇𝑟𝑒𝑎𝑡𝑚𝑒𝑛𝑡 ∗ 𝑃𝑜𝑠𝑡𝑖𝑡) is positive and significant (𝛼3 = 0.677, 𝑝 < 0.10) suggesting a 97% increase in the
odds of readmission for patients switching to Medicare from being a Selfpay patient compared to patients
who stay as Selfpay patients. On the other hand, when just the treatment (patients whose insurance types
change) and the control (patients whose insurance types stay as Selfpay) group of patients are compared,
the propensity to be readmitted is significantly lower for the treatment group (𝛼1 = −0.964, 𝑝 < 0.001).
However, pre and post-treatment periods for the whole data sample do not reveal any significant difference
for the propensity to be readmitted. In addition, as the operating physician’s specialization increases, i.e.,
different types of procedures performed reduces, patient’s readmission risk increases significantly (𝛼5 =
0.848, 𝑝 < 0.10). Neither operating physician experience nor hospital congestion shows a significant
association to the propensity of readmission. Among control variables, risk mortality is associated to a
significant and increasing impact on the readmission propensity, while hospitals with high number of beds
are associated to a decreasing effect on the readmission propensity.
The estimates of the interaction term, Treatment*Post, obtained from logistic regression suggest
that when previously uninsured patients switch to Medicare, the propensity of readmission increases
significantly—supporting Hypothesis 1b.

16
Robustness Check: Survival Analysis
We also wanted to analyze readmission event with a different model set up. Survival analysis has been
widely used in biostatistics and management literature due to its effectiveness in leveraging censored data
(Fisher and Lin 1999; Helsen and Schmittlein 1993)6. Basically, survival analysis models the time it takes
for an event to occur, which is going to be the readmission event in our case. Since survival can also be
depicted according to the hazard rate, we refer hazard rate, h(t), as the readmission rate of a patient per unit
of time in our case, where ℎ(𝑡) = limΔt→0
Pr(𝑡<𝑇<𝑡+𝛥𝑡 |𝑇>𝑡)
Δt . Mainly, h(t) models the instantaneous
readmission rate that a patient, who is not readmitted by time t, will be readmitted during the infinitesimally
small time interval, (t, t+Δt) (Bardhan et al. 2014). We apply one of the most commonly used survival
model Cox Proportional-Hazards model to examine the hazard rate of a readmission event (Cox 1972). In
a Cox model, where the effects of covariates on hazard rate are present, these effects multiply the hazard
rate by a function of the explanatory covariates. If ratio of two observations’ hazard rates is calculated, the
constant time varying effect diminishes. Therefore, the only effect left to explain the ratio of hazard rates
is the one associated to explanatory covariates’ (Fisher and Lin 1999). Accordingly, we specify a Cox
Proportional-Hazards model to analyze the relationship of 𝐷𝑢𝑟𝑎𝑡𝑖𝑜𝑛𝑇𝑖𝑙𝑙𝑁𝑒𝑥𝑡𝑖𝑡 (time to readmission) to
the covariates in Eq2:
log h𝑖(𝑡) = 𝜃(𝑡) + 𝜃1𝑇𝑟𝑒𝑎𝑡𝑚𝑒𝑛𝑡𝑖 + 𝜃2𝑃𝑜𝑠𝑡𝑖𝑡 + 𝜃3𝑇𝑟𝑒𝑎𝑡𝑚𝑒𝑛𝑡 ∗ 𝑃𝑜𝑠𝑡𝑖𝑡 + 𝜃4𝑂𝑝𝑟𝑃𝑠𝑦𝐸𝑥𝑝𝑒𝑟𝑖𝑒𝑛𝑐𝑒𝑖𝑡
+ 𝜃5𝑂𝑝𝑟𝑃𝑠𝑦𝑆𝑝𝑒𝑐𝑖𝑎𝑙𝑖𝑧𝑎𝑡𝑖𝑜𝑛𝑖𝑡 + 𝜃6𝐻𝑜𝑠𝑝𝑖𝑡𝑎𝑙𝐶𝑜𝑛𝑔𝑒𝑠𝑡𝑖𝑜𝑛𝑖𝑡 + 𝐶𝑜𝑛𝑡𝑟𝑜𝑙𝑠 ∗ 𝜃𝑐 (𝐄𝐪𝟒)
h𝑖(𝑡) in Eq2 represents the hazard function of readmission (t as time to readmission or
𝐷𝑢𝑟𝑎𝑡𝑖𝑜𝑛𝑇𝑖𝑙𝑙𝑁𝑒𝑥𝑡𝑖𝑡). 𝜃(𝑡) represents the baseline hazard rate that depends on time but cancels out during
estimation and hence need not be specified functionally.
DID results for the Cox Proportional-Hazard model involving the impact of change of insurance
from Private to Medicare on the duration to next admission are reported in the third column of Table 2. The
coefficient for the interaction term (𝑇𝑟𝑒𝑎𝑡𝑚𝑒𝑛𝑡 ∗ 𝑃𝑜𝑠𝑡𝑖𝑡) is positive and significant (𝜃3 = 1.976, 𝑝 <
0.001) suggesting an increase of more than 700% in the hazard rate after patients switch to Medicare from
a private insurance compared to patients who stay on their current private insurance policies. For S&M
dataset, the coefficient for the interaction term (𝑇𝑟𝑒𝑎𝑡𝑚𝑒𝑛𝑡 ∗ 𝑃𝑜𝑠𝑡𝑖𝑡) is again positive and significant (𝜃3 =
1.52, 𝑝 < 0.01) suggesting an increase of more than 450% in the hazard rate to be admitted after patients
switch to Medicare rather than staying as Selfpay patients. Cox Proportional-Hazard model results for both
6 Since survival analysis can handle right censored data, just for our case, we don’t have to exclude the last admissions of patients
due to unavailability of the readmission information. That also means that we can now include patients with at least two
observations, rather than three, and keep the last admissions of each patient. As can be seen in Table 2, for survival analysis,
we have 691 patients with 1916 observations for the P&M dataset, and 1236 patients with 3908 observations for the S&M
dataset.

17
P&M and S&M present similar results to our logistic regression results and provide evidence to support
Hypothesis 1a and 1b.
5.2 HMM Estimation
In this section, we use the P&M dataset to estimate the parameters of HMM, in which we create a new
variable to indicate whether patients are privately insured or Medicare beneficiaries (e.g.,
InsuranceMedicare = 1 if patient is a Medicare beneficiary, 0 if privately insured). To start our HMM
estimation, initial latent health state distribution has to be provided. We apply latent class regression to our
model in SAS (Lanza et al. 2007) and used the expected latent class membership rates as the initial health
state distribution in HMM. Then, the maximum likelihood estimation (MLE) method is used to estimate
the HMM parameters with the BFGS Newton-Raphson algorithm (Whittaker and Robinson 1967)7.
In developing HMM, we didn’t specify an exact value for the number of latent health states NS. To
select the number of states, we simulate HMM scenarios with different number of states and calculate a
selection criterion—AICc for each scenario. We report the results of HMM scenarios with different number
of states in Table 3. Accordingly, in Table 3, two-state HMM outperforms others with respect to the AICc.
Therefore, we select and continue with the two-state HMM estimation results. It is important to note that,
although the log-likelihood increases with the number of states and hence with the number of variables, the
model complexity increases more than twice when NS = 2 is compared to NS = 4 with respect to the number
of variables being estimated.
After incorporating the initial state distribution from latent class regression (0.383 and 0.617 for
two-states), the HMM estimation results obtained from MLE are reported in Table 4, Table 5, Table 6, and
Table 7 where the corresponding standard errors are shown in parentheses. The interpretation of the two
states is determined by the state-specific intrinsic propensity to be readmitted at the mean of covariates.
Accordingly, the propensity to be readmitted given state 1 is 100% and given state 2 is 0%. We label these
two states as “bad” and “good” health states, respectively.
7 We also run our model including two correlated patient random effects using a non-parametric estimation approach (Singh et al.
2011); one for readmission process, and one for the transition process. However, in each case when the model fit values, AICs,
are compared, no-random-effect models gave better results so we continued without expressing random effects. Interested
readers can contact authors to obtain the results of random effects model.

18
Table 2 DID Insurance Policy Change Results
Dataset P&M S&M
Model Eq1 Eq2 Eq1 Eq2
Estimation Logistic Cox PHR Logistic Cox PHR
Dependent Variable Readmission Duration Readmission Duration
Parameters Est
(StdErr)
Est
(StdErr)
[Hazard
Ratio]
Est
(StdErr)
Est
(StdErr)
[Hazard
Ratio]
Intercept -0.213 - - -1.835 - -
(1.445) (1.455)
Treatment
(1 = if PM or SM)
-0.746** -0.563*** [0.569]
-0.964*** -0.336*** [0.715]
(0.293) (0.08) (0.301) (0.059)
Post -0.125 -2.791*** [0.061]
-0.155 -1.98*** [0.138]
(0.179) (0.113) (0.114) (0.06)
Treatment * Post 0.584* 1.976*** [7.215]
0.677* 1.52*** [4.57]
(0.324) (0.141) (0.4) (0.091)
OprPhysExperience -0.026 0.087*** [1.091]
-0.048 0.083*** [1.086]
(0.112) (0.031) (0.061) (0.022)
OprPhysSpecialization 1.697** 0.504** [1.655]
0.848* 0.19 [1.209]
(0.711) (0.245) (0.47) (0.168)
HospitalCongestion 0.367 0.263* [1.301]
-0.191 -0.127 [0.881]
(0.418) (0.15) (0.278) (0.1)
EmergencyAdmission -0.03 -0.102 [0.903]
0.004 -0.194** [0.823]
(0.208) (0.074) (0.223) (0.081)
RiskMortality 0.189* 0.06 [1.062]
0.275*** 0.073*** [1.076]
(0.1) (0.039) (0.07) (0.025)
LOS -0.054 0.028 [1.028]
0.017 -0.003 [0.997]
(0.163) (0.054) (0.115) (0.04)
PtAge -0.244 0.002 [1.002]
-0.398 -0.097 [0.907]
(0.386) (0.143) (0.289) (0.11)
PtWhite 0.168 0.159 [1.172]
0.135 0.164*** [1.178]
(0.261) (0.1) (0.182) (0.061)
PtFemale 0.172 0.094 [1.098]
0.218 0.07 [1.072]
(0.314) (0.112) (0.295) (0.094)
HsCMI 0.038 -0.024 [0.976]
-0.082 -0.084** [0.92]
(0.146) (0.049) (0.118) (0.038)
HsTeaching -0.366 -0.166* [0.847]
0.422 -0.075 [0.928]
(0.276) (0.089) (0.32) (0.089)
HsUrban 0.231 -0.173*** [0.841]
-0.185 -0.09** [0.914]
(0.17) (0.063) (0.134) (0.042)
HsBedSize 0.203 0.023 [1.023]
-0.306** -0.021 [0.98]
(0.179) (0.059) (0.13) (0.041)
N obs / N patients 828 / 305 1916 / 691 1978 / 636 3908 / 1236
QIC / -2LogL for PHR 1038.12 16038.56 2448.85 39137.25
QICu / AIC for PHR 1034.44 16070.56 2438.53 39169.25 Standard errors in parentheses.
Hazard ratios are reported inside the brackets for Eq2 estimation * p < 0.10, ** p < 0.05, *** p < 0.01

19
Table 3 HMM Scenario Comparison
Number of States Log-Likelihood AICc Number of Variables
1 -1347.00 2746.428 24
2 -1300.58 2721.976 50
3 -1263.53 2739.853 78
4 -1201.59 2745.084 108
5.3 HMM Results
For any given time period, we can reveal the health state a patient is most likely to observe. Filtering
approach (Hamilton 1989) is one of the commonly used methods in recovering the hidden states of subjects
in HMM studies (Netzer et al. 2008; Singh et al. 2011). Filtering approach uses the information based on
the history of the subject up to time t to unravel the subject’s hidden state at time t. Probability of being in
state s condition on the subject’s history of readmissions is calculated as:
Prp(St = s|R1, R2, … , Rt) = 𝜋𝑝�̃�𝑝,1𝑄p,1→2�̃�𝑝,2𝑄p,2→3 … 𝑄p,t−1→t|s�̃�𝑝,𝑡𝑠 /𝐿𝑝
𝑡 (Eq5)
where 𝑄p,t−1→t|s is the sth column of the transition matrix 𝑄p,t−1→t and 𝐿𝑝𝑡 is the likelihood of the observed
sequence of readmissions up to time t.
After each patient’s hidden state is recovered using Eq5, we made a comparison on the mean
readmission rates at each health state—bad and good. Results of this comparison are used to test our
Hypothesis 2, which stated that readmission rates should differ across health states. In other words, health
states impose unobserved heterogeneity in the readmission of patients to hospitals. We present the mean,
standard deviation of readmissions per each state in Table 4. Accordingly, difference between the
readmission rates of latent states is statistically significant with p < 0.001—supporting our hypothesis 2.
Table 4 T-Test for the Readmission-by-State Mean Difference
State Bad Good Mean(Bad – Good) = 0.270
StdErr(Bad - Good) = 0.033
t = 8.28 with p < 0.001
Mean Readmission 0.502 0.232
StdDev Readmission 0.501 0.423
N 313 509
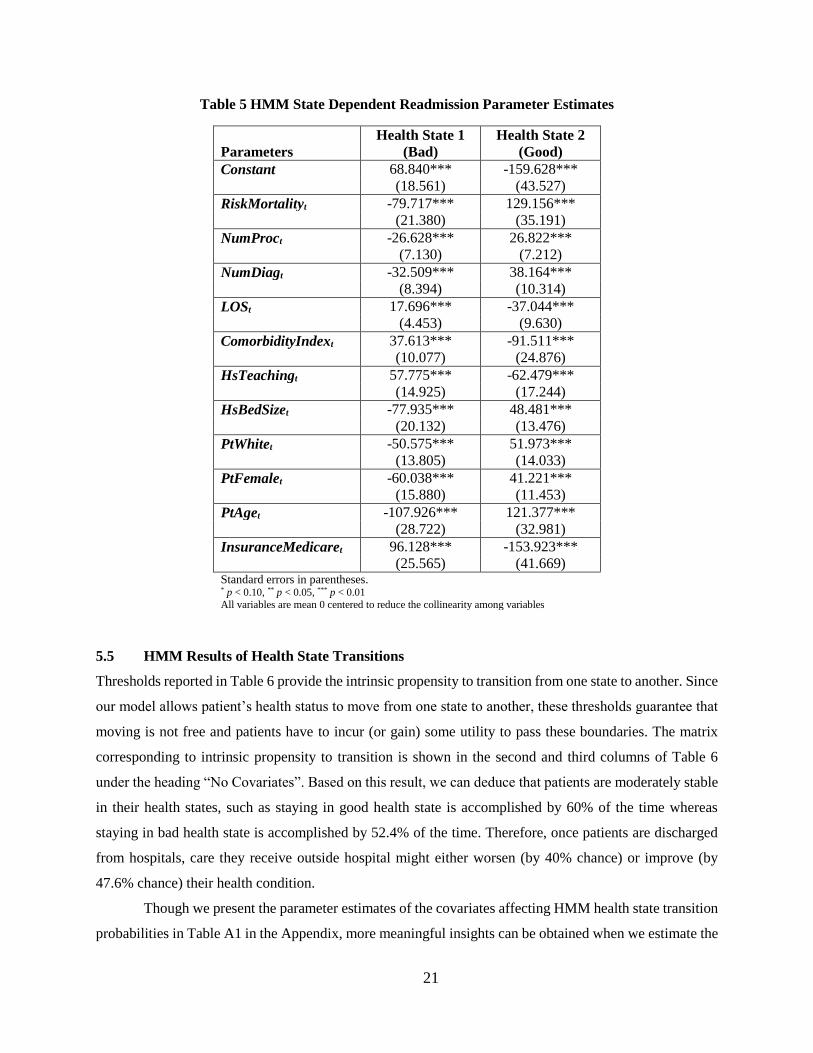
5.4 HMM Results of State Dependent Readmission
Table 5 presents the estimated parameters for the state dependent readmission process. The variation in the
coefficients of a variable across states indicates that a change in the health state causes a change in the
readmission propensity. Accordingly, patients in bad health state with high risk mortality (-79.717, p<0.01)
have lower readmission propensity in the next admission compared to patients in good health state (129.156,
p<0.01), suggesting that risk mortality starts increasing readmission risk as patient’s health condition
20
improves from bad to good. Similarly, number of procedures is effective in reducing the readmission
propensity if patient is in a bad health state rather than a good health state (-26.628, p<0.01 in bad vs 26.822,
p<0.01 in good). Again, as a patient becomes sicker, i.e., patient’s health deteriorates, number of diagnoses
starts reducing the readmission propensity (-32.509, p<0.01 in bad vs 38.164, p<0.01 in good). Therefore
the number of procedures and diagnoses help patient to receive better care during hospitalization, which
results in reduced readmission risk of the patient. Conversely, LOS increases the readmission propensity if
a patient is in bad health state (17.696, p<0.01) whereas it reduces the readmission propensity if a patient
is in a good health state (-37.044, p<0.01). One explanation could be that LOS might increase the probability
of hospital-acquired adverse events (Bueno et al. 2010) and might lead to an increase in the readmission
rates of patients in bad health state. Yet, patients in good health state might benefit from staying longer in
the hospital to have further diagnoses and treatments as well as receive social support from providers that
will not be possible after discharge if these patients are unable to reach their family and friends. As a patient
becomes sicker and admitted, the known comorbidities are found to increase patient’s readmission risk in
the next admission (37.613, p<0.01 in bad vs -91.511, p<0.01 in good). Patients admitted to teaching
hospitals with bad health status will have higher propensity to be readmitted in the next admission compared
to patients admitted to teaching hospitals with good health status (57.775, p<0.01 in bad and -62.479,
p<0.01 in good). High number of bed size is associated with lower readmission risk if the patient is in a bad
health state compared to being in a good health state (-77.935, p<0.01). Among patient demographics, being
white, female and old comes with an increasing effect on the readmission propensity if patient is in a good
health state. In our dataset we only used Medicare and private insurance admissions. To compare the impact
of these two insurance types, we check the coefficient of the InsuranceMedicare variable. Accordingly,
admissions with Medicare insurance type have higher propensity to be readmitted if the patient is in bad
health state (96.128, p<0.01) relative to patients in good health state. Thus as patients move to a better
health state, impact of Medicare insurance on readmission risk reduces.
21
Table 5 HMM State Dependent Readmission Parameter Estimates
Parameters
Health State 1
(Bad)
Health State 2
(Good)
Constant 68.840*** -159.628***
(18.561) (43.527)
RiskMortalityt -79.717*** 129.156***
(21.380) (35.191)
NumProct -26.628*** 26.822***
(7.130) (7.212)
NumDiagt -32.509*** 38.164***
(8.394) (10.314)
LOSt 17.696*** -37.044***
(4.453) (9.630)
ComorbidityIndext 37.613*** -91.511***
(10.077) (24.876)
HsTeachingt 57.775*** -62.479***
(14.925) (17.244)
HsBedSizet -77.935*** 48.481***
(20.132) (13.476)
PtWhitet -50.575*** 51.973***
(13.805) (14.033)
PtFemalet -60.038*** 41.221***
(15.880) (11.453)
PtAget -107.926*** 121.377***
(28.722) (32.981)
InsuranceMedicaret 96.128*** -153.923***
(25.565) (41.669) Standard errors in parentheses. * p < 0.10, ** p < 0.05, *** p < 0.01
All variables are mean 0 centered to reduce the collinearity among variables
5.5 HMM Results of Health State Transitions
Thresholds reported in Table 6 provide the intrinsic propensity to transition from one state to another. Since
our model allows patient’s health status to move from one state to another, these thresholds guarantee that
moving is not free and patients have to incur (or gain) some utility to pass these boundaries. The matrix
corresponding to intrinsic propensity to transition is shown in the second and third columns of Table 6
under the heading “No Covariates”. Based on this result, we can deduce that patients are moderately stable
in their health states, such as staying in good health state is accomplished by 60% of the time whereas
staying in bad health state is accomplished by 52.4% of the time. Therefore, once patients are discharged
from hospitals, care they receive outside hospital might either worsen (by 40% chance) or improve (by
47.6% chance) their health condition.
Though we present the parameter estimates of the covariates affecting HMM health state transition
probabilities in Table A1 in the Appendix, more meaningful insights can be obtained when we estimate the

22
transition matrix using the estimated values of each variable one at a time. We included the matrices derived
by variables which had a substantial impact on the base transition matrix—intrinsic propensity to transition
matrix in Table 6, heading “Base Transition Matrix”. To generate the transition matrices given in Table 6,
we plugged in the values of two focal variables, e.g., Readmissiont-1 and LOSt, one at a time and calculate
the transition propensity for each observation of a patient, while the values of the other variables are set at
zero. Hence, we were able to calculate the 95% confidence intervals for transition probabilities overall for
all of the sample points in our dataset.
Columns four and five of Table 7 under the heading “Base Transition Matrix with Readmissiont-
1” show the transition matrix after the previous period’s readmission information, Readmissiont-1, is
incorporated into the base transition matrix. If a patient is in bad health state at time t-1 and had a
readmission in the previous period then his likelihood of getting into a good health state increases from
47.6% to 48.3% significantly at time t. Similarly, if a patient is in good health state at time t-1 and was
readmitted in the previous period then his likelihood of getting into a good health state significantly
increases from 60% to 64.5% at time t. Therefore, these results suggest that readmission in the previous
period helps patients move to a better health state in the current period, maybe through better inpatient care
if outpatient resources and personal capabilities are not sufficient.
We also look at the impact of LOS on the health state transition probabilities. The effect of LOS
on the base transition matrix is provided under the heading “Base Transition Matrix with LOSt” in Table 7.
If a patient is in bad health state and had a long LOS at time t-1 then his likelihood of getting into a good
health state significantly decreases from 47.6% to 47.3% at time t. Similarly, if a patient is in good health
state and had a long LOS at time t-1 then his likelihood of getting into a good health state significantly
reduces from 60% to 58.9% at time t. Hence, patients who stay for an excess period of time as an inpatient
will tend to have reduced health condition in the next admission. Healthcare literature also suggest that
patients with excess LOS are prone to acquiring infections and experiencing injuries during their
hospitalizations—posing threats to health condition of the patients (Pittet et al. 1994; Zhan and Miller
2003), which might, of course, come at a cost of readmission.
Table 6 HMM Health State Transition Thresholds—α’s
Health State 1
(Bad)
Health State 2
(Good)
Health State 1
(Bad)
0.000 0.097 (0.227)
Health State 2
(Good)
-0.407* 0.000 (0.237)
Standard errors in parentheses. * p < 0.10, ** p < 0.05, *** p < 0.01

23
Table 7 HMM Estimation Transition Matrices
Base Transition Matrix
(No Covariates)
Base Transition Matrix
with Readmissiont-1
Base Transition Matrix
with LOSt
t-1 t Badt Goodt Badt Goodt Badt Goodt
Badt-1 52.4% 47.6% 51.7% 48.3% 52.7% 47.3%
[51.6% - 51.8%] [48.2% - 48.4%] [52.5% - 52.8%] [47.2% - 47.5%]
Goodt-1 40.0% 60.0% 35.5% 64.5% 41.1% 58.9%
[34.9% - 36.1%] [63.9% - 65.1%] [40.5% - 41.7%] [58.3% - 59.5%]
95% Confidence interval values are inside the brackets
6 DISCUSSION AND CONCLUSION
In this study, we analyzed the determinants of readmission risk by following a novel conceptual framework.
Mainly, we looked into the impact of two non-clinical factors—change of patient’s insurance policy and
unobserved patient health status— on the readmission risk. These non-clinical factors were discussed in
prior studies, however, as of yet, their causal link to readmission has not been established empirically. Thus,
we contribute to the overall healthcare literature, as well as the policy debates on whether readmission rates
are really a valid measure of the level of quality of care given at hospitals by suggesting that: (1) once a
patient’s financial liability reduces through a change in patient’s insurance policy, patient’s readmission
risk increases, (2) patient’s health condition might worsen after discharge due to medical, personal and
social factors which might induce patient to re-visit hospital and possibly increasing patient’s readmission.
Our results show that when patients change their insurance policies from private to Medicare, the
odds of readmission increases by 79% compared to patients who stay on private insurances. Similarly,
patients who switch from selfpay to Medicare experience 97% increase in the odds of readmission relative
to patients who are selfpay throughout their admission history. Our robustness check with survival analysis
also gave similar results. Accordingly, we find a 700% increase in the hazard rate of admission when
patients change their insurance policy from private to Medicare while this increase was 450% for patients
switching from selfpay to Medicare. Therefore, this increase in the hazard rate of admission would
eventually lead to an increase in the readmission rate. Second part of our study showed that the best model
fit was given by a two-state HMM rather than a one-state HMM—no heterogeneity case. We labeled these
two hidden states as bad and good health status states. After recovering each patient’s health status states,
the comparison of the mean readmission rates revealed that patients in bad health status are readmitted
significantly higher than patients in good health status. Our result suggested the presence of unobserved
patient heterogeneity due to varying levels of health status.
Our main results suggest that there are factors which cannot be controllable or modifiable by the
index hospitals after patients are discharged. Hospitals inadvertently admitting patients that soon to be

24
changing their insurance policies or admitting patients that lack medical, personal, and social support
outside hospitals would have higher risk of readmitting these patients within 30-days. These hospitals would
be penalized by CMS if they had higher than national-average readmission rates. Therefore, it is arguable
that policy makers should consider non-clinical factors causally linking to patients’ readmission risk, as
these findings suggest, hospitals alone do not seem to be the only source of accountability when analyzing
the health outcomes of patients.
6.1 Policy Implications
Affordable Care Act (ACA)
The full implementation of ACA has started in the beginning of 2014. ACA will impact various parts of
US healthcare system and nation as a whole. Among various implications of ACA, Medicaid expansion
will be the most likely to be of importance for both patients and hospitals in the short run (Rosenbaum
2011). With the implementation of ACA, people having incomes at or below 138% of Federal Poverty
Level (FPL) will be eligible to enroll in Medicaid, which would then decrease the uninsured population by
16-17 million (Congressional Budget Office [CBO] 2012). In literature and practice, there is lack of
evidence on how providers and patients would be affected from this significant increase in the Medicaid
population. Nevertheless, our study results on the insurance policy change for patients switching to
Medicare, who were uninsured (self-pay) previously, indicate that patients facing with less obstacles in
financial eligibility would start using healthcare resources immediately, which is evident from increased
readmission rates. Medicaid population expansion due to ACA would also result in higher readmission
rates for previously underserved population—uninsured citizens. Therefore, unless necessary precautions
are taken, overall healthcare cost and resource utilization would increase in the US in which hospitals would
be penalized for uncontrollable readmissions due to patient-specific factors, i.e., lowered financial
liabilities.
Accountable Care Organizations (ACO)
ACOs are proposed as a solution to the fragmented nature of the US healthcare system (Berwick 2011).
Under the Medicare Shared Savings program, which was established through the Section 3022 of the ACA,
providers as part of an ACO will assume the responsibility for the quality and cost of care delivered to a
population of patients (Berenson 2010). These providers may consist of integrated delivery systems,
primary care medical groups, hospital-based systems, and virtual networks of physicians, which are jointly
held accountable for achieving measured quality improvements and reductions in the rate of spending
growth (McClellan et al. 2010). Although there is a big skepticism on the premises of ACOs, i.e., healthcare
cost reduction (Crosson 2011; Devers 2009; Fisher and Shortell 2010), we believe that our HMM results
reveal supports for an ACO-like-system to achieve reduction in the unnecessary cost through reduced
readmission rates. Second part of our study found that a patient’s health status is unobservable to the

25
providers, which might lead to an increase in the readmission rate if patient’s health was subject to
deterioration outside the hospital. Crosson (2011) commented that ACO would encourage healthy behaviors
in its patients by preventing and detecting diseases early where possible, and by aggressively managing
costly chronic illnesses that would lead to better quality and lower cost. Therefore, if there was a possibility
to coordinate and monitor patient’s care by various stakeholders in continuum, patient could get timely
appointments, visit ambulatory facilities if needed, receive preventive care, and get support before an urge
to re-visit an inpatient setting had aroused, which would reduce the readmission rate eventually. In addition,
current policies, e.g., CMS’s HRRP, acknowledge poor performance as a consequence of individual failure,
rather than flawed systems (Fisher and Shortell 2010). Hence, ACOs would establish the platform, where
hospitals and various other types of providers would have to share the accountability of care all together.
That would also help resolve the uncertainties about whether readmission is a hospital quality metric.
Health Information Technologies (HITs)
Following the non-clinical factors that might be impacting the readmission rate, one other aspect is to
understand how coordinated care could leverage the continuum of care of patients and lead to improved
quality outcomes, i.e., reduction in readmission rates. In doing so, the dependency of coordinated care on
the use of HITs should not be left out. HITs are not only embedded into clinical and diagnostic equipment,
but they are also developed to capture, store, process, and communicate timely information to providers
with the goal of coordinating the whole healthcare system together with providers and patients (Fichman et
al. 2011). For instance, Venkatesh et al. (2011) suggest that e-healthcare systems help patients envision
their current and long-term health outside the hospital setting by enabling the communication between
providers and patients, and informing patients about diagnoses, tests, and follow-up care. In that regard,
Telehealth and/or Telemedicine would resort an important HIT application through establishing
communication between patients and providers at a distance. As the U.S. Department of Health and Human
Services defines; Telehealth is the use of technology to deliver health care, health information or health
education at a distance including teleradiology, continuing professional education and home monitoring.
Although there is still a need to empirically reveal the true potential of Telehealth and Telemedicine in
terms of their impact on patient’s health and quality outcomes at the patient level, some studies suggest that
Telehealth may improve care delivered to chronically ill patients, e.g., CHF and COPD, by sending early
warning messages of health status deterioration (LaFramboise et al. 2009; Rahimpour et al. 2008; Whitten
et al. 2009) and may reduce the rate and cost of readmissions (Finkelstein et al. 2006; Gorst et al. 2014;
Myers et al. 2006; Sorknæs et al. 2011). However, Anker et al. (2011) argue that revealing the potential of
Telehealth in managing patients with CHF is challenging because of the varying capabilities of Telehealth
approaches, as well as varying needs of CHF patients. Hence, the profile of patients, who can potentially
benefit from telemedicine, is unknown, and more research is required to uncover the true impact of

26
Telehealth on patient outcomes (Anker et al. 2011). Although we haven’t tested yet, the impact of
Telemedicine on patient’s health status and readmission is left for future research. We comment that
Telemedicine would reduce the readmission risk of patients in bad health status and we would like to reveal
this association in the extension of this study.
6.2 Limitations and Future Directions
Our study is subject to a few limitations. First, we studied the patients whose principal diagnoses were CHF.
For a more comprehensive analysis, myocardial infarction and pneumonia patients should also be included
in this type of analysis, in which different disease related effects should also be controlled for. Second,
dataset size could have been increased by obtaining information on private, selfpay and Medicare patients
from other geographic regions. However, it was impossible for us to achieve this since DFWHC gathers
discharge claims data only from North Texas region hospitals. Third, although we examined the HMM with
two patient random effects, we couldn’t find an improvement in our model fit measures compared to no
random effect case. Future research should incorporate patient random effects.
In future, we would like to assess the importance of using HITs in our HMM framework. Mainly,
we would like to observe how telemedicine would impact patient’s unobserved health status and
subsequently the readmission risk. We believe that telemedicine would have an improving impact on
patient’s health outside hospitals and therefore would reduce the preventable readmission rates. We are
planning on getting hospital level data from HIMSS Analytics on telemedicine. This database is one of the
most widely used data sources with respect to the adoption and usage of HIT systems in US hospitals.

27
7 REFERENCES
American Hospital Association [AHA]. 2013. "Trendwatch Chartbook 2013: Trends in Hospital
Financing," AHA.
Anderson, M.A., Clarke, M.M., Helms, L.B., and Foreman, M.D. 2005. "Hospital Readmission from
Home Health Care before and after Prospective Payment," Journal of Nursing Scholarship (37:1),
pp. 73-79.
Anker, S.D., Koehler, F., and Abraham, W.T. 2011. "Telemedicine and Remote Management of Patients
with Heart Failure," The Lancet (378:9792), pp. 731-739.
Annema, C., Luttik, M.-L., and Jaarsma, T. 2009. "Reasons for Readmission in Heart Failure:
Perspectives of Patients, Caregivers, Cardiologists, and Heart Failure Nurses," Heart & Lung:
The Journal of Acute and Critical Care (38:5), pp. 427-434.
Arbaje, A.I., Wolff, J.L., Yu, Q., Powe, N.R., Anderson, G.F., and Boult, C. 2008. "Postdischarge
Environmental and Socioeconomic Factors and the Likelihood of Early Hospital Readmission
among Community-Dwelling Medicare Beneficiaries," The Gerontologist (48:4), pp. 495-504.
Bardhan, I.R., Kirksey, K., Oh, J.-h., and Zheng, Z. 2014. "A Predictive Model for Readmission of
Patients with Congestive Heart Failure: A Multi-Hospital Perspective," Information Systems
Research (Fortcoming).
Bebbington, M.S. 2007. "Identifying Volcanic Regimes Using Hidden Markov Models," Geophysical
Journal International (171:2), pp. 921-942.
Benbassat, J., and Taragin, M. 2000. "Hospital Readmissions as a Measure of Quality of Health Care:
Advantages and Limitations," Archives of Internal Medicine (160:8), pp. 1074-1081.
Berenson, R. 2010. "Shared Savings Program for Accountable Care Organizations: A Bridge to
Nowhere?," The American journal of managed care (16:10), p. 721.
Bergstralh, E.J., and Kosanke, J.L. 1995. "Computerized Matching of Cases to Controls," Mayo Clinic.
Berwick, D.M. 2011. "Launching Accountable Care Organizations—the Proposed Rule for the Medicare
Shared Savings Program," New England Journal of Medicine (364:16).
Bindman, A.B., Grumbach, K., Osmond, D., Komaromy, M., Vranizan, K., Lurie, N., Billings, J., and
Stewart, A. 1995. "Preventable Hospitalizations and Access to Health Care," Jama (274:4), pp.
305-311.
Blomström, M. 1986. "Foreign Investment and Productive Efficiency: The Case of Mexico," The Journal
of Industrial Economics), pp. 97-110.
Bueno, H., Ross, J.S., Wang, Y., Chen, J., Vidán, M.T., Normand, S.-L.T., Curtis, J.P., Drye, E.E.,
Lichtman, J.H., and Keenan, P.S. 2010. "Trends in Length of Stay and Short-Term Outcomes
among Medicare Patients Hospitalized for Heart Failure, 1993-2006," Jama (303:21), pp. 2141-
2147.
Camberg, L.C., Smith, N.E., Beaudet, M., Daley, J., Cagan, M., and Thibault, G. 1997. "Discharge
Destination and Repeat Hospitalizations," Medical care (35:8), pp. 756-767.
Card, D.E., Dobkin, C., and Maestas, N. 2007. The Impact of Health Insurance Status on Treatment
Intensity and Health Outcomes. RAND.
CMS. 2014. "Readmissions Reduction Program." Retrieved 05/15/2014, 2014, from
http://www.cms.gov/Medicare/Medicare-Fee-for-Service-
Payment/AcuteInpatientPPS/Readmissions-Reduction-Program.html
Congressional Budget Office [CBO]. 2012. "Updated Estimates for the Insurance Coverage Provisions of
the Affordable Care Act." Retrieved 11/23/2013, from
http://www.cbo.gov/sites/default/files/cbofiles/attachments/03-13-Coverage%20Estimates.pdf
Corrigan, J.M., and Martin, J.B. 1992. "Identification of Factors Associated with Hospital Readmission
and Development of a Predictive Model," Health Services Research (27:1), p. 81.
Costa, M., and De Angelis, L. 2010. "Model Selection in Hidden Markov Models: A Simulation Study,").
Cox, D.R. 1972. "Regression Models and Life Tables," JR stat soc B (34:2), pp. 187-220.

28
Crosson, F.J. 2011. "The Accountable Care Organization: Whatever Its Growing Pains, the Concept Is
Too Vitally Important to Fail," Health Affairs (30:7), pp. 1250-1255.
Currie, J., and Gruber, J. 1996. "Health Insurance Eligibility, Utilization of Medical Care, and Child
Health," The Quarterly Journal of Economics (111:2), pp. 431-466.
Davis, K., Schoen, C., Doty, M., and Tenney, K. 2002. "Medicare Versus Private Insurance: Rhetoric and
Reality," HEALTH AFFAIRS-MILLWOOD VA THEN BETHESDA MA- (21:6), pp. 11-11.
Deb, P., and Trivedi, P.K. 2002. "The Structure of Demand for Health Care: Latent Class Versus Two-
Part Models," Journal of health economics (21:4), pp. 601-625.
Devers, K.J. 2009. "Can Accountable Care Organizations Improve the Value of Health Care by Solving
the Cost and Quality Quandaries?,").
Donzé, J., Lipsitz, S., Bates, D.W., and Schnipper, J.L. 2013. "Causes and Patterns of Readmissions in
Patients with Common Comorbidities: Retrospective Cohort Study," BMJ: British Medical
Journal (347).
Dorland Health. 2014. "U.S. Readmission Rates Dwarf Foreign Countries, Says Jama." Retrieved
05/15/2014, 2014, from http://www.dorlandhealth.com/dorland-health-articles/u-s-readmission-
rates-dwarf-foreign-countries-says-jama
Doyle Jr, J.J. 2005. "Health Insurance, Treatment and Outcomes: Using Auto Accidents as Health
Shocks," Review of Economics and Statistics (87:2), pp. 256-270.
Dwyer, D.S., and Mitchell, O.S. 1999. "Health Problems as Determinants of Retirement: Are Self-Rated
Measures Endogenous?," Journal of health economics (18:2), pp. 173-193.
Elixhauser, A., Steiner, C., Harris, D.R., and Coffey, R.M. 1998. "Comorbidity Measures for Use with
Administrative Data," Medical care (36:1), pp. 8-27.
Emedicine Health. 2014. "Types of Outpatient Services." Retrieved 06.01.2014, 2014, from
http://www.emedicinehealth.com/outpatient_services-health/page2_em.htm#Types of Outpatient
Services
Ephraim, Y., and Merhav, N. 2002. "Hidden Markov Processes," Information Theory, IEEE Transactions
on (48:6), pp. 1518-1569.
Ferrer, R.L. 2007. "Pursuing Equity: Contact with Primary Care and Specialist Clinicians by
Demographics, Insurance, and Health Status," The Annals of Family Medicine (5:6), pp. 492-502.
Fichman, R.G., Kohli, R., and Krishnan, R. 2011. "Editorial Overview-the Role of Information Systems
in Healthcare: Current Research and Future Trends," Information Systems Research (22:3), pp.
419-428.
Finkelstein, S.M., Speedie, S.M., and Potthoff, S. 2006. "Home Telehealth Improves Clinical Outcomes
at Lower Cost for Home Healthcare," Telemedicine Journal & e-Health (12:2), pp. 128-136.
Fisher, E.S., and Shortell, S.M. 2010. "Accountable Care Organizations: Accountable for What, to
Whom, and How," JAMA (304:15), pp. 1715-1716.
Fisher, L.D., and Lin, D.Y. 1999. "Time-Dependent Covariates in the Cox Proportional-Hazards
Regression Model," Annual review of public health (20:1), pp. 145-157.
Forster, A.J., Stiell, I., Wells, G., Lee, A.J., and Van Walraven, C. 2003. "The Effect of Hospital
Occupancy on Emergency Department Length of Stay and Patient Disposition," Academic
Emergency Medicine (10:2), pp. 127-133.
Friedman, B., and Basu, J. 2004. "The Rate and Cost of Hospital Readmissions for Preventable
Conditions," Medical Care Research and Review (61:2), pp. 225-240.
Fuller, R.L., Atkinson, G., McCullough, E.C., and Hughes, J.S. 2013. "Hospital Readmission Rates: The
Impacts of Age, Payer, and Mental Health Diagnoses," The Journal of ambulatory care
management (36:2), pp. 147-155.
Goodman, D.C., Fisher, E.S., Gittelsohn, A., Chang, C.-H., and Fleming, C. 1994. "Why Are Children
Hospitalized? The Role of Non-Clinical Factors in Pediatric Hospitalizations," Pediatrics (93:6),
pp. 896-902.

29
Gorst, S.L., Armitage, C.J., Brownsell, S., and Hawley, M.S. 2014. "Home Telehealth Uptake and
Continued Use among Heart Failure and Chronic Obstructive Pulmonary Disease Patients: A
Systematic Review," Annals of Behavioral Medicine), pp. 1-14.
Gwadry-Sridhar, F.H., Flintoft, V., Lee, D.S., Lee, H., and Guyatt, G.H. 2004. "A Systematic Review and
Meta-Analysis of Studies Comparing Readmission Rates and Mortality Rates in Patients with
Heart Failure," Archives of Internal Medicine (164:21), pp. 2315-2320.
Hamilton, J.D. 1989. "A New Approach to the Economic Analysis of Nonstationary Time Series and the
Business Cycle," Econometrica: Journal of the Econometric Society), pp. 357-384.
Handel, B.R., and Kolstad, J.T. 2013. "Health Insurance for “Humans”: Information Frictions, Plan
Choice, and Consumer Welfare," National Bureau of Economic Research.
Hannan, E.L., Racz, M.J., Walford, G., Ryan, T.J., Isom, O.W., Bennett, E., and Jones, R.H. 2003.
"Predictors of Readmission for Complications of Coronary Artery Bypass Graft Surgery," Jama
(290:6), pp. 773-780.
Harris, K.M., and Remler, D.K. 1998. "Who Is the Marginal Patient? Understanding Instrumental
Variables Estimates of Treatment Effects," Health services research (33:5 Pt 1), p. 1337.
Hasan, O., Meltzer, D.O., Shaykevich, S.A., Bell, C.M., Kaboli, P.J., Auerbach, A.D., Wetterneck, T.B.,
Arora, V.M., Zhang, J., and Schnipper, J.L. 2010. "Hospital Readmission in General Medicine
Patients: A Prediction Model," Journal of general internal medicine (25:3), pp. 211-219.
Helsen, K., and Schmittlein, D.C. 1993. "Analyzing Duration Times in Marketing: Evidence for the
Effectiveness of Hazard Rate Models," Marketing Science (12:4), pp. 395-414.
Hurvich, C.M., Shumway, R., and Tsai, C.-L. 1990. "Improved Estimators of Kullback–Leibler
Information for Autoregressive Model Selection in Small Samples," Biometrika (77:4), pp. 709-
719.
Hurvich, C.M., and Tsai, C.-L. 1989. "Regression and Time Series Model Selection in Small Samples,"
Biometrika (76:2), pp. 297-307.
Joynt, K.E., and Jha, A.K. 2013. "A Path Forward on Medicare Readmissions," New England Journal of
Medicine (368:13), pp. 1175-1177.
Kangovi, S., Barg, F.K., Carter, T., Levy, K., Sellman, J., Long, J.A., and Grande, D. 2013a. "Challenges
Faced by Patients with Low Socioeconomic Status During the Post-Hospital Transition," Journal
of general internal medicine), pp. 1-7.
Kangovi, S., Barg, F.K., Carter, T., Long, J.A., Shannon, R., and Grande, D. 2013b. "Understanding Why
Patients of Low Socioeconomic Status Prefer Hospitals over Ambulatory Care," Health Affairs
(32:7), pp. 1196-1203.
Kangovi, S., and Grande, D. 2011. "Hospital Readmissions—Not Just a Measure of Quality," Jama
(306:16), pp. 1796-1797.
Khwaja, A. 2010. "Estimating Willingness to Pay for Medicare Using a Dynamic Life-Cycle Model of
Demand for Health Insurance," Journal of Econometrics (156:1), pp. 130-147.
Kociol, R.D., Lopes, R.D., Clare, R., Thomas, L., Mehta, R.H., Kaul, P., Pieper, K.S., Hochman, J.S.,
Weaver, W.D., and Armstrong, P.W. 2012. "International Variation in and Factors Associated
with Hospital Readmission after Myocardial Infarction," JAMA (307:1), pp. 66-74.
Kumar, A., and Telang, R. 2012. "Does the Web Reduce Customer Service Cost? Empirical Evidence
from a Call Center," Information Systems Research (23:3-part-1), pp. 721-737.
LaFramboise, L.M., Woster, J., Yager, A., and Yates, B.C. 2009. "A Technological Life Buoy: Patient
Perceptions of the Health Buddy," Journal of Cardiovascular Nursing (24:3), pp. 216-224.
Lanza, S.T., Collins, L.M., Lemmon, D.R., and Schafer, J.L. 2007. "Proc Lca: A Sas Procedure for Latent
Class Analysis," Structural Equation Modeling (14:4), pp. 671-694.
Lasser, K.E., Hanchate, A.D., McCormick, D., Manze, M.G., Chu, C., and Kressin, N.R. 2014. "The
Effect of Massachusetts Health Reform on 30 Day Hospital Readmissions: Retrospective
Analysis of Hospital Episode Statistics," BMJ: British Medical Journal (348).
Levy, H., and Meltzer, D. 2004. "What Do We Really Know About Whether Health Insurance Affects
Health," Health policy and the uninsured), pp. 179-204.

30
Lichtenberg, F.R. 2002. "The Effects of Medicare on Health Care Utilization and Outcomes," Frontiers in
health policy research (5:3).
Long, S.K., and Masi, P.B. 2009. "Access and Affordability: An Update on Health Reform in
Massachusetts, Fall 2008," Health Affairs (28:4), pp. w578-w587.
MacDonald, I.L., and Zucchini, W. 1997. Hidden Markov and Other Models for Discrete-Valued Time
Series. CRC Press.
MacKay Altman, R. 2004. "Assessing the Goodness‐ of‐ Fit of Hidden Markov Models," Biometrics
(60:2), pp. 444-450.
Manning, W.G., and Marquis, M.S. 1996. "Health Insurance: The Tradeoff between Risk Pooling and
Moral Hazard," Journal of health economics (15:5), pp. 609-639.
McCarthy, D., Johnson, M.B., and Audet, A.-M. 2013. "Recasting Readmissions by Placing the Hospital
Role in Community Context," JAMA (309:4), pp. 351-352.
McClellan, M., McKethan, A.N., Lewis, J.L., Roski, J., and Fisher, E.S. 2010. "A National Strategy to
Put Accountable Care into Practice," Health Affairs (29:5), pp. 982-990.
McWilliams, J.M., Meara, E., Zaslavsky, A.M., and Ayanian, J.Z. 2007. "Use of Health Services by
Previously Uninsured Medicare Beneficiaries," New England Journal of Medicine (357:2), pp.
143-153.
McWilliams, J.M., Zaslavsky, A.M., Meara, E., and Ayanian, J.Z. 2003. "Impact of Medicare Coverage
on Basic Clinical Services for Previously Uninsured Adults," JAMA (290:6), pp. 757-764.
Medicare Payment Advisory Commission. 2011. "Report to the Congress: Medicare Payment Policy,"
Washington, D.C.
Meltzer, D., Manning, W.G., Morrison, J., Shah, M.N., Jin, L., Guth, T., and Levinson, W. 2002. "Effects
of Physician Experience on Costs and Outcomes on an Academic General Medicine Service:
Results of a Trial of Hospitalists," Annals of Internal Medicine (137:11), pp. 866-874.
Meyer, B.D. 1995. "Natural and Quasi-Experiments in Economics," Journal of business & economic
statistics (13:2), pp. 151-161.
Mudge, A.M., Kasper, K., Clair, A., Redfern, H., Bell, J.J., Barras, M.A., Dip, G., and Pachana, N.A.
2011. "Recurrent Readmissions in Medical Patients: A Prospective Study," Journal of Hospital
Medicine (6:2), pp. 61-67.
Myers, S., Grant, R.W., Lugn, N.E., Holbert, B., and Kvedar, J.C. 2006. "Impact of Home-Based
Monitoring on the Care of Patients with Congestive Heart Failure," Home Health Care
Management & Practice (18:6), pp. 444-451.
Netzer, O., Lattin, J.M., and Srinivasan, V. 2008. "A Hidden Markov Model of Customer Relationship
Dynamics," Marketing Science (27:2), pp. 185-204.
Novotny, N.L., and Anderson, M.A. 2008. "Prediction of Early Readmission in Medical Inpatients Using
the Probability of Repeated Admission Instrument," Nursing research (57:6), pp. 406-415.
Parker, J.P., McCombs, J.S., and Graddy, E.A. 2003. "Can Pharmacy Data Improve Prediction of
Hospital Outcomes?: Comparisons with a Diagnosis-Based Comorbidity Measure," Medical care
(41:3), pp. 407-419.
Pittet, D., Tarara, D., and Wenzel, R.P. 1994. "Nosocomial Bloodstream Infection in Critically Iii
Patientsexcess Length of Stay, Extra Costs, and Attributable Mortality," Jama (271:20), pp. 1598-
1601.
Rabiner, L.R. 1989. "A Tutorial on Hidden Markov Models and Selected Applications in Speech
Recognition," Proceedings of the IEEE (77:2), pp. 257-286.
Rahimpour, M., Lovell, N.H., Celler, B.G., and McCormick, J. 2008. "Patients’ Perceptions of a Home
Telecare System," International journal of medical informatics (77:7), pp. 486-498.
Retrum, J.H., Boggs, J., Hersh, A., Wright, L., Main, D.S., Magid, D.J., and Allen, L.A. 2013. "Patient-
Identified Factors Related to Heart Failure Readmissions," Circulation: Cardiovascular Quality
and Outcomes (6:2), pp. 171-177.
Rosenbaum, P.R. 1989. "Optimal Matching for Observational Studies," Journal of the American
Statistical Association (84:408), pp. 1024-1032.

31
Rosenbaum, S. 2011. "The Patient Protection and Affordable Care Act: Implications for Public Health
Policy and Practice," Public Health Reports (126:1), p. 130.
Ross, J.S., Mulvey, G.K., Stauffer, B., Patlolla, V., Bernheim, S.M., Keenan, P.S., and Krumholz, H.M.
2008. "Statistical Models and Patient Predictors of Readmission for Heart Failure: A Systematic
Review," Archives of internal medicine (168:13), pp. 1371-1386.
Shea, S., Misra, D., Ehrlich, M.H., Field, L., and Francis, C.K. 1992. "Predisposing Factors for Severe,
Uncontrolled Hypertension in an Inner-City Minority Population," New England journal of
medicine (327:11), pp. 776-781.
Silverstein, M.D., Qin, H., Mercer, S.Q., Fong, J., and Haydar, Z. 2008. "Risk Factors for 30-Day
Hospital Readmission in Patients≥ 65 Years of Age," Proceedings (Baylor University. Medical
Center) (21:4), p. 363.
Singh, P.V., Tan, Y., and Youn, N. 2011. "A Hidden Markov Model of Developer Learning Dynamics in
Open Source Software Projects," Information Systems Research (22:4), pp. 790-807.
Sommers, A., and Cunningham, P.J. 2011. "Physician Visits after Hospital Discharge: Implications for
Reducing Readmissions," National Institute for Health Care Reform, Research Brief:6).
Sorknæs, A.D., Madsen, H., Hallas, J., Jest, P., and Hansen‐Nord, M. 2011. "Nurse Tele‐Consultations
with Discharged Copd Patients Reduce Early Readmissions–an Interventional Study," The
clinical respiratory journal (5:1), pp. 26-34.
Starfield, B., Shi, L., and Macinko, J. 2005. "Contribution of Primary Care to Health Systems and
Health," Milbank quarterly (83:3), pp. 457-502.
Strauss, M.J., LoGerfo, J.P., Yeltatzie, J.A., Temkin, N., and Hudson, L.D. 1986. "Rationing of Intensive
Care Unit Services: An Everyday Occurrence," Jama (255:9), pp. 1143-1146.
Thalken, M.K. 2014. "4 Steps to Maintaining Communication after Discharge." Retrieved 6/14/2014,
from http://www.healthcareitnews.com/blog/4-steps-maintaining-communication-after-discharge
Timms, J., Parker, V.G., Fallat, E.H., and Johnson, W.H. 2002. "Documentation of Characteristics of
Early Hospital Readmission of Elderly Patients: A Challenge for Inservice Educators," Journal
for Nurses in Professional Development (18:3), pp. 136-143.
Tsai, T.C., Joynt, K.E., Orav, E.J., Gawande, A.A., and Jha, A.K. 2013. "Variation in Surgical-
Readmission Rates and Quality of Hospital Care," New England Journal of Medicine (369:12),
pp. 1134-1142.
Venkatesh, V., Zhang, X., and Sykes, T.A. 2011. "“Doctors Do Too Little Technology”: A Longitudinal
Field Study of an Electronic Healthcare System Implementation," Information Systems Research
(22:3), pp. 523-546.
Vest, J.R., Gamm, L.D., Oxford, B.A., Gonzalez, M.I., and Slawson, K.M. 2010. "Determinants of
Preventable Readmissions in the United States: A Systematic Review," Implementation Science
(5:1), p. 88.
Visser, I. 2011. "Seven Things to Remember About Hidden Markov Models: A Tutorial on Markovian
Models for Time Series," Journal of Mathematical Psychology (55:6), pp. 403-415.
Weeks, W.B., Lee, R.E., Wallace, A.E., West, A.N., and Bagian, J.P. 2009. "Do Older Rural and Urban
Veterans Experience Different Rates of Unplanned Readmission to Va and Non‐ Va Hospitals?,"
The Journal of Rural Health (25:1), pp. 62-69.
Weissman, J.S., Ayanian, J.Z., Chasan-Taber, S., Sherwood, M.J., Roth, C., and Epstein, A.M. 1999.
"Hospital Readmissions and Quality of Care," Medical care (37:5), pp. 490-501.
Whittaker, E.T., and Robinson, G. 1967. The Calculus of Observations: An Introduction to Numerical
Analysis. Dover Publications.
Whitten, P., Bergman, A., Meese, M.A., Bridwell, K., and Jule, K. 2009. "St. Vincent’s Home Telehealth
for Congestive Heart Failure Patients," Telemedicine and e-Health (15:2), pp. 148-153.
Wier, L.M., Barrett, M., Steiner, C., and Jiang, H.J. 2011. "All-Cause Readmissions by Payer and Age,
2008,").

32
Wolfe, B.L., and Behrman, J.R. 1984. "Determinants of Women's Health Status and Health-Care
Utilization in a Developing Country: A Latent Variable Approach," The Review of Economics
and Statistics), pp. 696-703.
Wolinsky, F.D., Overhage, J.M., Stump, T.E., Lubitz, R.M., and Smith, D.M. 1997. "The Risk of
Hospitalization for Congestive Heart Failure among Older Adults," Medical care (35:10), pp.
1031-1043.
Zekry, D., Loures Valle, B.H., Graf, C., Michel, J.-P., Gold, G., Krause, K.-H., and Herrmann, F.R. 2012.
"Prospective Comparison of 6 Comorbidity Indices as Predictors of 1-Year Post-Hospital
Discharge Institutionalization, Readmission, and Mortality in Elderly Individuals," Journal of the
American Medical Directors Association (13:3), pp. 272-278.
Zhan, C., and Miller, M.R. 2003. "Excess Length of Stay, Charges, and Mortality Attributable to Medical
Injuries During Hospitalization," Jama (290:14), pp. 1868-1874.
Zucchini, W. 2000. "An Introduction to Model Selection," Journal of Mathematical Psychology (44:1),
pp. 41-61.

33
APPENDIX
Table A 1 HMM Health State Transition Parameter Estimates
Parameters Health State 1
(Bad) Health State 2
(Good) SourcePersPhyst -0.192 0.087
(0.187) (0.260)
DischargeNursingFact-1 -0.091 -0.031
(0.329) (1.301)
DischargeHomeCaret-1 -0.035 -0.090
(0.707) (0.137)
Readmissiont-1 0.146 1.140***
(0.867) (0.390)
LOSt -0.126 -0.613*** (0.167) (0.232)
ComorbidityIndext -0.132 0.102 (0.132) (0.750)
HsTeachingt -0.162 0.217 (0.207) (0.766)
HsBedSizet -0.125 -0.529 (0.507) (0.546)
PtWhitet -0.133 -0.640**
(0.151) (0.262)
PtFemalet 0.186 -0.026
(0.472) (0.511)
PtAget 0.124 -0.344** (0.222) (0.159)
InsuranceMedicaret 0.141 0.455*
(0.706) (0.273)
Standard errors in parentheses. * p < 0.10, ** p < 0.05, *** p < 0.01 All variables are mean 0 centered to reduce the collinearity among variables