Embed Size (px)
DESCRIPTION
free
Citation preview
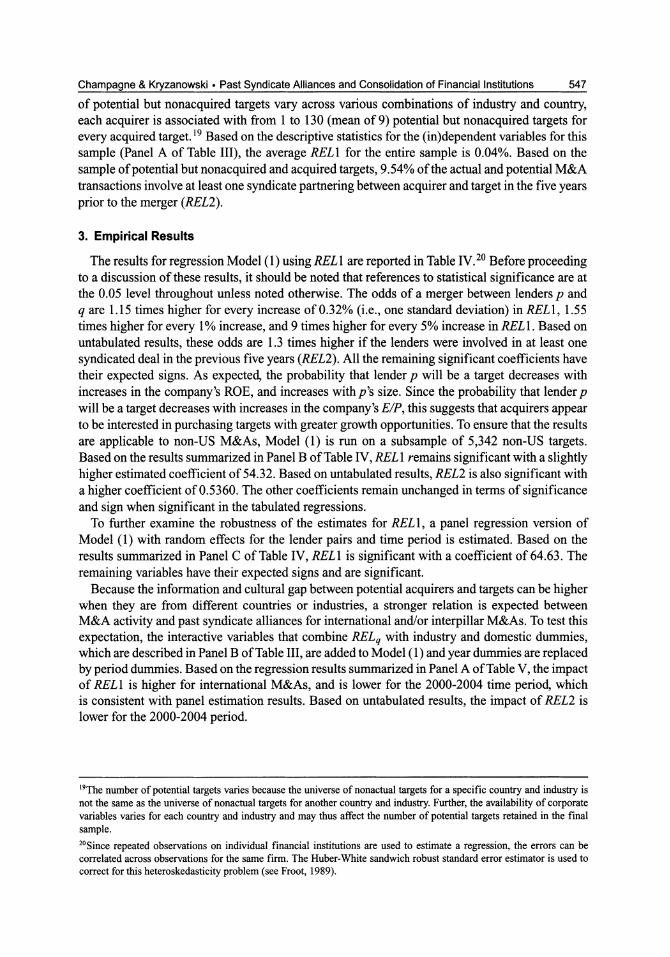
The Impact of past Syndicate Alliances on the Consolidation of Financial InstitutionsAuthor(s): Claudia Champagne and Lawrence KryzanowskiReviewed work(s):Source: Financial Management, Vol. 37, No. 3 (Autumn, 2008), pp. 535-569Published by: Blackwell Publishing on behalf of the Financial Management Association InternationalStable URL: http://www.jstor.org/stable/20486667 .Accessed: 25/07/2012 04:33
Your use of the JSTOR archive indicates your acceptance of the Terms & Conditions of Use, available at .http://www.jstor.org/page/info/about/policies/terms.jsp
.JSTOR is a not-for-profit service that helps scholars, researchers, and students discover, use, and build upon a wide range ofcontent in a trusted digital archive. We use information technology and tools to increase productivity and facilitate new formsof scholarship. For more information about JSTOR, please contact [email protected].
.
Blackwell Publishing and Financial Management Association International are collaborating with JSTOR todigitize, preserve and extend access to Financial Management.
http://www.jstor.org

The Impact of Past Syndicate Alliances
on the Consolidation
of Financial Institutions
Claudia Champagne and Lawrence Kryzanowski*
The impact ofpast syndicate alliances on the consolidation offinancial institutions is examined. The odds of two lenders combining increases with the intensity and exclusivity of their prior syndicated loan alliances. The impact is higherfor international mergers and acquisitions (M&As) andfor prior syndicate co-relationships where the acquirer and target were participant and lead, respectively. The odds of a particular lender being a target decreases as its return on equity (ROE) and earnings/price (E/P) ratios increase and as its size and growth opportunities decrease. The intensity and exclusivity of the syndicated loan alliances leading up to M&A announcements are significantly higher for non-US versus US M&As. The significantly lower short- and long-term performances for both acquirers and targets with prior syndicate co-involvements disappear in the presence of control variables that account for the less frequent use of cash payments, the
greater incidence of divestitures, and the higher percentage of shares acquired through their M&As. Acquirers with versus those without past syndicate target co-involvements exhibit greater outperformancefor control-firm benchmarked ROEs and lower underperformancefor control-firm and prior-to-M&A benchmarked ROEs.
The ongoing consolidation of financial institutions within and across national boundaries has generated considerable interest among academics and practitioners due to the size, importance, and role of such institutions in the economy of most countries. A growing body of literature deals with mergers and acquisitions (M&As) in the financial services industry.1 Rhoades (2000) finds that approximately 8,000 M&As involving about $2.4 trillion in acquired assets occurred in the
United States between 1980 and 1998 (about half during the 1995-1998 period) and that several mergers during the 1990s were the largest bank M&As in US history. A report by the Group of
Financial support from the Concordia University Research Chair in Finance, National Research Program on Financial
Services & Public Policy at York University Dissertation Grant, IFM2, SSHRC, and SSQRC-CIRP?E are gratefully
acknowledged. We would like to thank Bryan Campbell, Ed Kane, Jean Roy, Ian Rakita, and the discussant (Jacques
Pr?fontaine) and participants at the presentation of an earlier version of this paper at the 2006 meetings of the NFA
(Montreal) and FMA (Salt Lake City, "top 10% "
session) for their many helpful comments. We are thankful to the editor
and an anonymous referee for their perceptive comments and recommendations that greatly improved the contents of the
paper. We also thank Sybil Murray-Denis for her excellent professional editing. The usual disclaimer applies.
*Claudia Champagne is an Assistant Professor of Finance at Sherbrooke University in Sherbrooke, Canada. Lawrence
Kryzanowski is the Concordia University Research Chair in Finance at Concordia University in Montreal,Canada.
1 Some recent examples include: Amel, Barnes, Panetta, and Salleo (2004) who provide a review of the extensive literature
on the efficiency gains from bank M&As; Karceski, Ongena, and Smith (2005) who examine the impact of M&As on
corporate bank borrowers in Norway; Black, Bostic, Robinson, and Schweitzer (2005) who examine the market and
profitability impact of M&As between bank holding companies; Ismail and Davidson (2005) who examine the market
impact of intra- and cross-pillar bank M&As in Europe; and Buch and DeLong (2004) who analyze the determinants of
international bank mergers.
Financial Management . Autumn 2008 * pages 535 - 569

536 Financial Management * Autumn 2008
Ten in 2001 documents a high and increasing level of M&A activity in the 1990s for 13 countries
(the 11 GI 0 countries plus Spain and Australia) with about 60% of such activity in the financial
sector involving banking firms and domestic M&A transactions. Financial institutions wishing to engage in M&A activities need to gather information about
potential target firms before starting the consolidation process. Such knowledge may be even
more crucial for cross-border transactions, which are usually considered harder to conclude and
maintain because of cross-cultural differences. A prior alliance with the target through syndication
may help with the evaluation of the target, facilitate the merger, and reduce subsequent integration
costs. Similarly, firms with repeat alliances may perceive a full-blown merger as a next logical
step and decide to consolidate.
Although the study of inter-bank relationships over the past decade has documented some of the
benefits and costs of temporary alliances (such as loan syndications), much remains unknown.2
For instance, do financial institutions consider syndicated loans as pure business transactions,
or do they also benefit from their relational nature in other ways? What are the effects and
consequences of alliances formed through banking syndicates? Specifically, do these alliances
lead to more formal alliances between syndicate participants, such as M&As? Do the M&As
involving parties with previous syndicate co-alliances perform better than those without such previous co-alliances?
Given these deficiencies in the literature, the primary purpose of this paper is to provide the
first test of whether banks that co-participate in loan syndicates are more likely to subsequently
co-engage in M&As. A further objective is to examine the relative terms of the M&As and their
postmerger performance, as conditioned by the past alliances of the acquirer with the target.
This paper contributes to the M&A and banking literatures by providing evidence on the
relationship between the odds that two lenders will merge and their past syndicate alliances. All
else held equal, the odds are 1.15 times higher for every one standard deviation increase in the
weighted-average participation fraction between the two parties (1.5 times higher for every 1%
increase). The impact of the relative number of past syndicate alliances between the merging
parties is higher for international transactions and in cases where past syndicate relationships
involved the acquirer and target as participant and lead, respectively. The latter finding indicates
that participants in lending syndicates learn more and gather more information about each other
than do leads, even though leads are usually the larger firms and are more likely to be acquirers
in future M&As.
This paper provides some first-test evidence on how M&A terms and post-M&A wealth and
operating-performance effects are influenced by past syndicate alliances between the acquirer
and the target, thus furthering our understanding of M&A decisions and of market perceptions of
M&A activities. Based on wealth effects, any informational advantages gained through loan syn
dication appear to be lost to greater agency costs. As a result, in the absence of control variables,
both the short- and long-term market performances of the acquirer and the target are significantly
lower if they partnered in past loan syndicates. Such performance differences become insignifi cant in the presence of control variables designed to account for the differences in the samples of
M&As that (do not) involve parties that were previously co-involved in loan syndications. These
differences include a lower frequency of cash payments, a greater frequency of divestitures, and
a higher percentage of shares having been acquired when the two M&A parties were previously
co-involved in loan syndications. Acquirers undifferentiated by past syndicate co-involvements
2The literature on lending syndicates is growing quickly. This includes the ongoing relationships between syndicate
participants (Champagne and Kryzanowski, 2007), the structure of commercial lending syndicates (Lee and Mullineaux,
2004), and the pricing of syndicated loans (e.g., Harjoto, Mullineaux, and Yi, 2006).
Champagne & Kryzanowski * Past Syndicate Alliances and Consolidation of Financial Institutions 537
with targets outperform post-M&A in terms of control-firm benchmarked ROEs. This outperformance is significantly higher for those with past syndicate co-involvements with targets, although such acquirers rely more on the share payment method. However, post-M&A operating performances, which are control-firm and pre-M&A-year benchmarked, tend to deteriorate rela tively more for acquirers without past syndicate co-involvements with targets than for those with such involvements.
The article is organized as follows. Section I reviews the literature on the relationship between syndication and financial sector consolidation and performance. Section II describes the samples
and data sets used herein. Tests of the relationship between current M&A activity and past syndi
cate alliances are examined in Section III. Sections IV and V examine the relationships between
the terms of M&As and post-M&A wealth and operating performance effects, respectively, with past syndicate alliances between the merging parties. Section VI concludes the paper.
1. Literature Review
A. Formal Alliances and M&As
While the literature on the relationship between bank syndicates and subsequent M&As is
sparse, whether viewed from a leading-indicator or consequential perspective, some interesting
articles on the link between strategic alliances and M&As do provide some basis for understanding
such relationships. Buchheit (1985) reviews previous US Supreme Court decisions that find syndicated lending to be a joint venture requiring consent by a majority of lenders before a
single bank may take legal action to recover from a borrower. Das and Teng (1998) define
alliances as inter-firm cooperative arrangements aimed at achieving the strategic objectives of
the partners. Alliances are equity-based arrangements that involve the transfer or creation of
equity or nonequity based alliances (such as loan syndicates) that include a wide variety of
contractually based arrangements or contracts.
Wright and Lockett (2003) define syndicates in the venture capital industry as inter-firm alliances where at least two firms co-invest in investee firms and share joint payoffs. Finally,
a syndicate can be viewed as a team or strategic alliance formed for the purpose of providing
finance to a particular borrower.
Pichler and Wilhelm (2001) view syndicates as a unique type of team formed to complete well
defined functions. Although syndicates are dissolved upon completion of the deal, the authors
argue that the stability of their membership across deals represents a barrier to entry that permits
the capture of quasi-rents and that this strengthens the incentive to cultivate relationships. Porrini
(2004) argues that an acquirer's previous alliances with a target may help it obtain target-specific
information and experience that aid in the selection, valuation, and integration of targets. Bleeke
and Ernst (1991) show that 75% of all alliances end with one partner acquiring the cooperation
unit. The main benefit of gradual acquisition or sale is that the parties benefit from information
about the actual value of the business in the new holding company through the intermediate
process of cooperation. This helps them negotiate fairer purchase prices and also simplifies the
integration of the target into the surviving entity.
Kogut (1991) examines the possibility that joint ventures are created as real options for expan
sion. He finds that companies that build trust based on their joint partnering experience engage in
additional joint ventures. In contrast, Gulati (1995) concludes that the larger the number of prior
co-alliances, the less current alliances are likely to be equity based. Hagedoorn and Sadowski
(1996) conclude that transformations from strategic technology alliances to M&As are rare.
538 Financial Management . Autumn 2008
The amount and quality of information gathered may be limited due to the well-specified
dimensions of the contract, such as fees, share, and so forth. Anand and Khanna (2000a, 2000b)
argue that greater opportunities for learning are provided by less specific alliance types with
more contractual ambiguity or relatively less strict criteria. Nevertheless, syndicate relationships, especially those between lead and participant banks, may be more general and informative, particularly for participants.
B. M&A Performance
Econometric evidence of efficiency gains following financial sector M&As is surprisingly weak, and this evidence differs somewhat depending on the type of financial institution, its home
country, and the international scope of its transactions. Empirical studies of M&A performance
look at event studies examining stock-price impacts on the targets and acquirers involved in M&A
announcements, and at analyses of postmerger firm performance using accounting data.
1. Stock Market Performance
The literature on stock market reactions to M&A announcements generally finds abnormal returns that are positive for target shareholders and zero or negative for acquirers. Houston
and Ryngaert (1994) and Pilloff (1996) report no significant aggregate value effect. Madura and
Wiant (1992) observe a negative cumulative abnormal return or CAR for the 36-month postmerger
period. DeLong (2001) compares diversifying and focusing acquisitions and concludes that M&A value is created for banks that are geographically or product-space concentrated but not for those
that diversify. Cybo-Ottone and Murgia (2000) report positive and significant value gains from
domestic but not cross-border bank mergers in Europe. Cornett, Hovakimian, Palia, and Tehranian
(2003) find no [negative] AR for the acquirer of a focusing [diversifying] M&A. In contrast, Zhang (1995) finds value creation for out-of-market M&As, which is consistent with a diversification
hypothesis. Finally, Amihud, Delong, and Saunders (2002) find no decrease in the banking risk
associated with international M&As of financial institutions.
2. Firm Performance Based on Accounting Numbers
The literature examining firm performance as measured by accounting data generally finds more benefits associated with M&As. Studies in the 1980s report that only relatively small banks gain any efficiency from an increase in size and that higher banking concentration leads to less favorable conditions for consumers, especially for those seeking small business loans, retail deposits and payment services. More recently, changes in technology and market structure
have been affecting the scale and scope of economies (Hughes, Mester, and Moon, 2001),
and the presence of nonbank loan institutions tends to offset the reduction in credit supply to small businesses (Mester, 1999). The evidence on the effects of M&As on cost efficiency varies by country. Post-M&A, cost efficiency or operating income improves for some European
markets (especially between equals, Vennet, 1996) but not for the United States (Pilloff, 1996).
Furthermore, accounting performance is generally the poorest for cross-border transactions. Focarelli, Panetta, and Salleo (2002) conclude that bank mergers in Italy result in an increase in
the return on equity due to the more efficient use of capital and a reduction in the tax burden, while bank acquisitions in Italy increase profitability due to loan portfolio improvements. DeLong (2003) finds a positive market reaction to the announcement of US bank mergers that give more
focus to activities, geographic location, and partners' earnings streams, but reports that only the
latter focus enhances long-term performance.

Champagne & Kryzanowski * Past Syndicate Alliances and Consolidation of Financial Institutions 539
Papers using frontier methodology to assess postmerger bank performance often find no effi
ciency gains. For instance, Berger and Humphrey (1992) find no significant gains in x-efficiency from bank consolidation.3 Akhavein, Berger, and Humphrey (1997) report no improvement in return on assets (ROA) and return on equity (ROE) post-M&A. Based on a review of the interna
tional evidence, Amel, Barnes, Panetta, and Salleo (2004) conclude that there is little evidence showing that financial-sector M&As yield economies of scope or gains in managerial efficiency.
3. Factors Explaining Market and Firm Performance Results
One explanation for the lack of efficiency gains is related to the performance measurement
methods employed. Their shortcomings include selection biases and the use of time-periods that
are too short to effectively capture the full extent of the efficiency gains. However, as noted by
Pilloff and Santomero (1997), it is improbable that these biases and errors affect all papers written
on the subject. Given the inverse relation between premiums and the returns obtained by acquiring share
holders, authors wonder why premiums averaging as much as 41% were paid between 1976 and
1990 (Jensen, 1993). Roll (1986) and Pilloff and Santomero (1997), among others, argue that the
absence of efficiency gains from bank consolidation can be blamed on the hubris of overconfident
acquiring managers who overpay for targets.
Another possible reason, specifically for international M&As, is efficiency barriers. Berger, DeYoung, and Udell (2001) and Buch and Delong (2004) suggest that constraining factors (such as geographical distance, different languages and cultures, or adverse regulatory and supervisory
structures) offset some of the gains of cross-border consolidations by impeding cross-border
activity.
II. Sample Description
A. Sample of Syndicates
An international sample consisting of (non)public lending institutions participating in loan syndicates between 1987 and 2004 has been generated from DealScan, a database of loans to large
firms maintained by the Loan Pricing Corporation (LPC).4 The database includes information on various deal-related variables, such as the market of syndication, distribution method, lender
role, and the numbers of arrangers and lenders.
The initial sample consists of 60,692 syndicate deals after excluding club deals and all bilateral
loans between single banks and borrowers.5 Overall, 6,363 distinct lenders participated in at
least one syndicated loan during the period studied. In order to study specific lenders within
3X-efficiency is the effectiveness with which a given set of inputs are used to produce outputs. If a firm is producing the
maximum output given the resources it employs (such as men and machinery) while using the best technology available, then the firm is said to be x-efficient.
4A syndicate is defined herein as an agreement involving at least two financial institutions to extend a loan to a single borrower. DealScan enters the name of the bank as its main identifier. Since names are not always consistent throughout the database or even spelled identically for the same financial institution, a unique identifier is added manually for each
syndicate member (i.e., parent and all subsidiaries) in our sample, and the Bloomberg ISIN number is manually added
for each publicly traded syndicate member. Thus, if the parent of a non-publicly traded lender is itself publicly traded, then the ISIN of the parent is used as the identifier for the lender.
5 Club deals are removed from the sample because they are loan agreements in which the syndicate participants are
specifically requested by the borrower. Therefore, alliances and relationships between banks have a lesser role in syndicate formation.

540 Financial Management * Autumn 2008
the syndicates, each deal is separated across members to generate 496,242 distinct bank-deal
observations where a different entry is created for each lender in each deal for every deal in the
sample.6 This allows us to match up all possible pairs of financial institutions having participated
in syndicates together. The distribution of deals and bank-deals between 1987 and 2004 is summarized in Table I.
The number of deals has increased almost yearly, and almost half of these deals, or 47.73%,
occurred in the 2000-04 period. Based on the syndication market's definition of the region of
loan arrangement, 62.26% of the deals were arranged in the United States or Canada (see Panel
B of Table I). About 20% of the deals were arranged in Asia, 11.82% in Western Europe, and the
others were scattered over the rest of the world.
The number of lenders in syndicated deals ranges from 2 to 159 lenders.7 Half the deals have
between two and five lenders, 42.08% have between 6 and 20 lenders, and only 0.37% involve
more than 50 banks (see Panel C of Table I). While LPC does not provide the number of arrangers
for most of the deals in the sample, 16.53% of the deals with such information have only one
arranger and 13.70% have between two and five arrangers (see right-hand side of Panel C in
Table I). Lead banks are defined herein as banks that retain administrative, monitoring, or contract
enforcement responsibilities for the lending relationships with the borrower. More precisely, they must be in charge of pricing loans, of dividing them into shares, and/or of inviting other
institutions to participate in the syndicates. Armstrong's (2003) definitions of the different roles within a syndicate are used to classify syndicate participants as either leads or participants.8
B. Sample of M&As
All M&As (domestic and international) between two financial institutions for the 1992-2004 pe
riod are drawn from SDC Platinum, generating a detailed list of 63,808 transactions. The database
also provides detailed information on a number of M&A terms, such as premium, payment method,
acquisition technique, and percentage of shares acquired. Although intrafirm equity restructur
ings (such as stake repurchases) are defined as M&As in the database, they have been removed
from the initial sample because they take place within the same organizational structure. Transac
tions under the umbrella of the same parent (i.e., so-called roll-ups involving subsidiaries of the
same parent where multibank organizations consolidate their charters) are also removed from the
sample.9 Thus, all the M&As with Stock Exchange Daily Official List (SEDOL) numbers for the
parents of both targets and acquirers in SDC are retained The Datastream ISIN numbers are used
to identify the M&A participants so as to maximize matches with the sample of syndicated deals.
6If the same lender plays more than one role as a member of a specific deal, only the entry with the most important role
is retained.
7The number of lenders used in the descriptive statistics is that provided by LPC. Since we do not count financial
institutions from the same parent, our average number of lenders of 8.17 is lower than the 8.25 obtained when using the
numbers recorded in the LPC database.
8Banks categorized as leads are those labeled by LPC as lead role, agent, bookrunner, co-lead manager, lead manager, lead arranger, lead underwriter, mandated arranger, senior arranger, senior lead, and underwriter. Banks categorized as participants are labeled by LPC as participant, publicity, offshore booking, global coordinator, and other similar
designations.
9This is important in the United States due to the passage of two acts. The 1994 Riegle-Neal Interstate Banking and
Branching Efficiency Act (IBBEA) permits bank holding companies to acquire banks in any state after September 30, 1995 (Nippani and Green, 2002). Similarly, the 1999 Gramm-Leach-Bliley Financial Services Modernization Act (GLBA)
permits the consolidation of commercial and investment banks (www.en.wikipedia.org/wiki/Gramm-Leach-Bliley_Act). This removes 450 transactions involving both a US target and acquirer from the sample.

Champagne & Kryzanowski * Past Syndicate Alliances and Consolidation of Financial Institutions 541
Table 1. Number of Syndicated and Bank-Deals Annually, Market of Syndication, and Number of Lenders and Arrangers in the Deals
This table presents the distribution of the loan facilities between 1987 and 2004. A syndicated deal is defined as a loan agreement between at least two lenders and a borrower and may include more than one loan facility. Bank-deal observations are defined as a lender participating in a specific syndicated deal.
Lenders can appear more than once in the sample if they participated in more than one deal. Lenders are identified, when possible, by their parent, to avoid counting more than one subsidiary from the same holding in the same syndicated deal. The market of syndication is the place of origination of the syndicated deal, as defined by the Loan Pricing Corporation (LPC). The numbers of lenders and arrangers per deal are provided by LPC.
Panel A. Number of Deals and Bank-Deals per Year
Year Syndicate Deals Bank-Deals Year Syndicate Deals Bank-Deals
No. % No. % No. % No. % 1987 373 0.61 3,356 0.68 1997 5,218 8.60 45,348 9.14 1988 740 1.22 6,259 1.26 1998 4,334 7.14 33,936 6.84 1989 781 1.29 7,194 1.45 1999 4,910 8.09 40,720 8.21 1990 931 1.53 8,318 1.68 2000 5,569 9.18 44,985 9.07 1991 862 1.42 7,126 1.44 2001 5,327 8.78 43,389 8.74 1992 1,389 2.29 10,625 2.14 2002 5,621 9.26 43,001 8.67 1993 2,096 3.45 17,454 3.52 2003 6,188 10.20 48,102 9.69 1994 2,727 4.49 24,439 4.92 2004 6,255 10.31 45,630 9.20 1995 3,123 5.15 28,673 5.78 Total 60,692 100.00 496,242 100.00 1996 4,248 7.00 37,687 7.59
Panel B. Market of Syndication of the Different Deals
Market of Syndication Deals % Market of Syndication Deals %
US/Canada 37,787 62.26 Middle East 796 1.31 Asia Pacific 11,529 19.00 Africa 299 0.49 Westem Europe 7,174 11.82 Other 138 0.23 Latin America/Caribbean 1,745 2.88 N/A 44 0.07 Eastern Europe/Russia 1,180 1.94 Total 60,692 100.00
Panel C. Number of Lenders and Number ofArrangers per Syndicated Deal
Number of Lenders No. % Number of Arrangers No. %
[2, 5] 30,424 50.13 1 10,035 16.53 [6, 10] 14,655 24.15 [2,5] 8,315 13.70 [11, 20] 10,881 17.93 [6,10] 1,340 2.21 [21, 50] 4,510 7.43 [11,20] 438 0.72 > 50 222 0.37 >20 37 0.06 N/A 0 0.00 N/A 40,527 66.77 Total 60,692 100.00 Total 60,692 100.00
Min; average; max 2; 8.35; 159 Min; average; max 1; 2.49; 36 SD 8.21 SD 2.66
The event-time distribution of this interim sample of 5,014 M&As having occurred between
1992 and 2004 is reported in Table II. Almost half of the transactions occur in the 2000
04 period. Based on Panel B of Table IL, approximately 75% of the targets and acquirers are
North American or Western European financial institutions. Asian firms represent 18.63% and
542 Financial Management . Autumn 2008
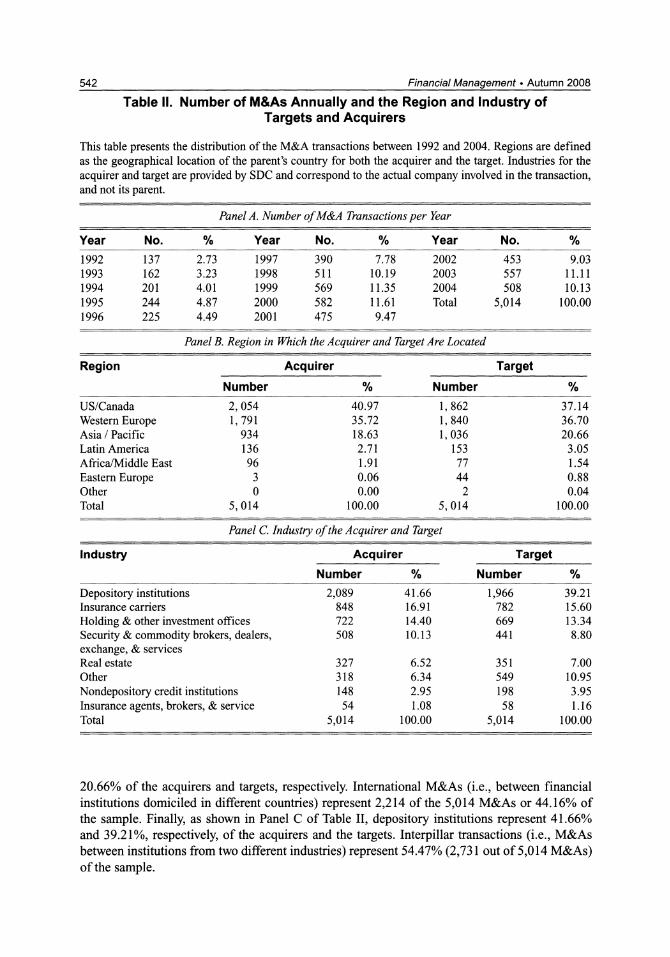
Table 11. Number of M&As Annually and the Region and Industry of Targets and Acquirers
This table presents the distribution of the M&A transactions between 1992 and 2004. Regions are defined as the geographical location of the parent's country for both the acquirer and the target. Industries for the acquirer and target are provided by SDC and correspond to the actual company involved in the transaction, and not its parent.
Panel A. Number of M&A Transactions per Year
Year No. % Year No. % Year No. % 1992 137 2.73 1997 390 7.78 2002 453 9.03 1993 162 3.23 1998 511 10.19 2003 557 11.11 1994 201 4.01 1999 569 11.35 2004 508 10.13 1995 244 4.87 2000 582 11.61 Total 5,014 100.00 1996 225 4.49 2001 475 9.47
Panel B. Region in Which the Acquirer and Target Are Located
Region Acquirer Target
Number % Number % US/Canada 2, 054 40.97 1, 862 37.14 Western Europe 1, 791 35.72 1, 840 36.70 Asia / Pacific 934 18.63 1, 036 20.66 Latin America 136 2.71 153 3.05 Africa/Middle East 96 1.91 77 1.54 Eastern Europe 3 0.06 44 0.88 Other 0 0.00 2 0.04 Total 5, 014 100.00 5, 014 100.00
Panel C. Industry of the Acquirer and Target
Industry Acquirer Target
Number % Number %
Depository institutions 2,089 41.66 1,966 39.21 Insurance carriers 848 16.91 782 15.60
Holding & other investment offices 722 14.40 669 13.34 Security & commodity brokers, dealers, 508 10.13 441 8.80 exchange, & services Real estate 327 6.52 351 7.00 Other 318 6.34 549 10.95 Nondepository credit institutions 148 2.95 198 3.95 Insurance agents, brokers, & service 54 1.08 58 1.16 Total 5,014 100.00 5,014 100.00
20.66% of the acquirers and targets, respectively. International M&As (i.e., between financial
institutions domiciled in different countries) represent 2,214 of the 5,014 M&As or 44.16% of
the sample. Finally, as shown in Panel C of Table II, depository institutions represent 41.66%
and 39.21%, respectively, of the acquirers and the targets. Interpillar transactions (i.e., M&As
between institutions from two different industries) represent 54.47% (2,731 out of 5,014 M&As)
of the sample.

Champagne & Kryzanowski * Past Syndicate Alliances and Consolidation of Financial Institutions 543
111. Tests of the Relationship between Current M&A Activity and Past Alliances and Roles in Loan Syndications
A. Relationship between M&As among Financial Institutions and Past Loan Syndicate Alliances
1. Hypothesis and Test Methodology
The literature on integration problems following M&As is large and unanimous in its con clusion: the more information acquired about a potential target, then the more well advised the
decision to go ahead with the M&A; the more precise the evaluation, the easier the transition, the
lower the integration costs, and the fewer the problems. To function properly and meet its desired objectives and payoffs, every alliance calls for
cooperation and coordination among the parties involved. This cooperation and coordination inevitably generates information about the parties. Consequently, a previous alliance with a target (via a loan syndicate) allows the acquirer to elicit very specific information about the
target's potential compatibility and resources. Although each syndicate is temporary in nature, with a financing structure tailored specifically to the transaction at hand, participating banks
typically resyndicate as leads or participants with a network of partners over time. Therefore, the
expectation is that M&As are more likely among those banks with higher repeat syndications and
more exclusive relationships. This is embodied in the following hypothesis:
Ho: The relation between M&As and past syndication activities among financial institutions grows stronger with more frequent and exclusive past same-syndicate involvements.
A logit model is used to test the above hypothesis, where the probability that institution p
will be the target of an M&A by acquirer q is regressed on their past syndicated alliances
and on various factors that are hypothesized as affecting this likelihood. The model is used to
motivate subsequent analyses and is not a model for the acquirers' selection of targets. 10 Specif
ically, the logit model estimated with year dummy variables that are suppressed for compactness sl
TARGETp = h8o + PI * RELq + 2 * ACTIVq + 83 * SIZEp + /4 * M/Bp
+85 * LEVp + 6 * MGNTp + ?7 * E/Pp + ...+ s. (1)
In Equation (1), the dummy variable TARGETp equals 1 if financial institution p is the actual
M&A target that was acquired by acquirer q and is 0 if it was one of the financial institutions
considered to be a potential or possible target that could have been acquired by acquirer q. The
research designs used herein to select the sample of potential but nonacquired targets for each
acquired target are discussed after we examine the other variables in Model (1).
RELq is the generic variable for four measures of the strength and/or exclusivity of the rela
tionship between acquirer q and its acquired target and other potential but nonacquired targets
10The selection model would represent the acquirer's decisions by modeling each acquirer's selection from the entire
universe of potential target syndicate relationships. The authors would like to thank an anonymous referee for this
observation.
11 To control for factors that theoretically and empirically affect the probability of being a target, we follow Palepu (1986)
but add a slightly lower number of variables to proxy for the characteristics of target firms implied by the different merger
hypotheses in the literature. Specifically, some of the variables identified for other industries do not apply to the financial
sector or are not available in the database or no equivalent proxy is available.

544 Financial Management . Autumn 2008
represented byp. The first measure of the exclusivity of the relationship withp from the perspec tive of q is given by
REL1Iq: Im
1 D1. (2) Mr Eki'r(2
where r is a point in time one day prior to the M&A announcement, MT is a five-year moving
window of the number of syndications that acquirer q participated in up to time T, Di, is a dummy
variable that is equal to 1 if lenderp participated in syndicate i and is equal to 0 otherwise, kiT is
the number of lenders participating in syndicate i, and i is an index for the loan syndicates that
acquirer q participated in over the five-year moving window up to time T. 12
The second relationship measure REL2'qP is a dummy variable that is equal to 1 if the acquirer q
was in at least one syndicate with the acquired or potential targetp during the past five years. The
third measure REL3 qTp is the relative frequency of past syndicate activities between the acquirer q and the acquired or potential targetp, as measured by dividing the number of syndicated loans
involving the two parties by the total number of syndicated loans that the acquirer participated
in over the five-year window preceding the deal active date. The fourth and final measure of
relationship exclusivity with p from the perspective of q is given by
REL4q:p - elVl~ * 109 (3) TotalDealfVal, L DealVal*1
where DealValpi, is the dollar value of p's participation in the loan for syndicate i within the
moving five-year window up to time T, which is assumed to be an equal share if not reported in
DealScan; DealVali, is the dollar value of the loan for syndicate i within the moving five-year
window up to time T; TotalDealVal, is the total dollar value of all the syndicated loans that
acquirer q participated in within the moving five-year window up to time t; 109 is a scaling factor; and all the other terms are as defined earlier. Since no deal shares are reported for most of
the syndicated loans in DealScan, this fourth measure embodies considerable measurement error. Although the results presented herein tend to concentrate on the first measure of relationship
exclusivity, any untabulated results are generally robust for REL2 qTP and somewhat less robust
for the other two measures that have greater measurement error (i.e., REL3q :P and REL4NqP).
Because RELIq Pcan equal zero if the acquirer has never partnered with the acquired or potential
target nor participated in the syndicated loan market during the past five years, the dummy
variable (DUMq) is added, which equals 1 if the acquirer has no prior deals and is 0 otherwise.
Every past syndicate alliance is considered in the light of the different roles played by the two
lenders. ACTIVJ is the M&A intensity of acquirer q, measured by the number of acquisitions by the
acquirer in the calendar year prior to the current M&A announcement. 13
12No empirical evidence exists on the current effect of the vintage of past syndicate relationships on how alliances are
formed. A five-year period appears to be long enough to capture past pairwise syndication activity and to give lenders the
time to gather information about other members, but short enough to guard against distortions from stale and outdated
data due to regime shifts in bank characteristics (e.g., managers, ranking, size, and reputation). Further, as a test of
robustness, the end of the month prior to the M&A announcement is also used to define r with no significant differences
in the results.
13 Time periods for ACTIV that range between one and five years have been tested, with no significant changes in the
results.

Champagne & Kryzanowski * Past Syndicate Alliances and Consolidation of Financial Institutions 545
SIZEp is the log of the book value of assets for the acquired or potential target p, as drawn
from the annual financial statements at the latest date prior to the merger and converted into US
dollars. Because of several size-related transaction costs associated with firm acquisition (such as those associated with the absorption of a target or legal costs), larger firms may become less
attractive to potential acquirers, ceteris paribus. However, larger-sized transactions may be more
attractive for acquirers interested in building up size to better meet international competition. Thus, the sign of this variable is indeterminate.
M/Bp is the ratio of the market-to-book value for target p, as measured at the fiscal year-end
preceding the M&A announcement date. Acquirers supposedly can buy undervalued targets at bargain prices. If the market-to-book-value ratio is low (e.g., less than one), the target's assets may
be undervalued. Thus, a negative relationship is expected between the probability of a merger
and this ratio.
LEV is the target's ratio of total liabilities to common equity observed at the latest date prior
to the merger based on the annual financial statements. 14 Since firm consolidation should reduce the risk of default, the new entity should have a higher debt capacity and benefit from certain tax
advantages, thus increasing the value of the new firm. The acquiring firm may also take advantage
of a low target leverage to finance the takeover directly. Thus, a negative sign is expected for this
variable. MNGTp is the target's ROE observed at the latest date prior to the merger based on the annual
financial statements. Since the corporate control market acts as a mechanism for controlling
agency problems, managers who fail to maximize firm value should be replaced when the target
is acquired. Thus, the expected sign of this variable is negative.
E/Pp is the last earnings per share value available at the announcement date divided by the stock
price of the target one month before the announcement date. Although questionable economically, its inverse (the price-earnings (P/E) ratio) remains a popular explanation for takeovers. Firms with low P/E ratios are likely acquisition targets because they generate an "instantaneous capital gain"
for the acquirer. On the other hand, acquirers interested in external growth opportunities prefer to
acquire firms with high P/E ratios. Thus, the expected sign of this variable is indeterminate. The
inverse of the P/E ratio is used herein in order to limit the tendency of the P/E ratio toward infinity
when earnings are very small and to allow for its interpretation when earnings are negative. To
limit possible outliers or errors in the database, the E/P ratio is restricted to [-1, 1]. 15
YEAR is a set of indicator variables used to control for general trends in the M&A market
between 1992 and 2004.
2. Research Design for Selection of Sample of Potential but Nonacquired Targets
The choice of the potential but nonacquired target or targets, an issue of debate in the literature, is
further complicated herein because of the need to capture the syndicate interrelationships between
each acquirer q and its possible targets p (including the target p that was actually acquired and
those targets that could have been acquired but were not acquired). For example, the typical
procedure used in acquisition studies is to draw a "state-based" sample with an approximately
equal number of targets and nontargets; however, that may lead to biased and incorrect inferences
14The leverage ratio as calculated directly by Datastream is used herein. Because the interpretation of leverage and ROE
are ambiguous when equity is negative, cases with negative leverage ratios are removed from the sample.
15If no restriction is imposed on the range of values of E/P or if the ratio is restricted to [0, 1], the coefficient for E/P
becomes insignificant. However, all the other coefficients are similar in sign and magnitude to those from the original
regression.

546 Financial Management * Autumn 2008
because the sample of nontargets is not a truly random sample (Palepu, 1986).16 Alderson and
Betker (2006) conclude that it is very important to match each sample firm with a control group
rather than with a single firm that shares similar pre-event characteristics since the commonly used
(even random) research designs yield test statistics that are misspecified for the methods used to
measure abnormal changes in capital expenditures. Another possible sample selection approach is the "nonacquired, end-of-test-period surviving firm" sample, which uses, as its control sample (as in Palepu, 1986), the universe, or some subset thereof, of all the financial institutions that
were not acquired as of the end of the test period (in this case 2004). In general, this approach
introduces survivorship and selection biases into the analyses since potential targets that did not make it to the end of the test period were likely considered as potential targets by one or more
acquirers. Furthermore, in order to capture all of the syndicate loan relationships between each
actual acquirer and each of the potential but nonacquired targets, the nonacquired targets would
need to be included more than once in the sample (albeit with different relationship data). Thus,
the research strategy adopted herein is to present the findings for one of the methods of selecting
the sample of potential targets and then to conduct a number of untabulated tests of robustness
using other methods of selecting the sample of potential targets.
Our chosen method of selecting the sample of potential but nonacquired targets for presentation
purposes is the "nonacquired, end-of-test-period surviving firm" sample. To form this sample, the population of potential but nonacquired financial institutions as of the end of 2004 includes
all lenders involved in at least one syndicated loan between 1987 and 2004. Each actual acquired
target p is first matched with all financial institutions, with the exception of itself, from the
same country and industry to obtain an initial sample of potential but nonacquired targets (for
which TARGETp will be equal to 0) for this actual acquired targetp. Measures of past syndicated
alliances between each acquirer q and its acquired target and the potential but nonacquired targets
are then estimated. Since all the acquired targets from a specific country and industry for any
given year are matched with the same sample of potential but nonacquired targets, the same
financial institution can appear more than once in the final sample. However, this does not result
in duplicate observations for the acquirer (e.g., for ACTIV) nor for the relationship measures
between it and each potential but nonacquired target. 17 Because the M&A announcement dates
also differ across the M&A transactions, other independent variables, such as E/P, also differ.
After removing all the observations for cases involving acquired as well as potential but
nonacquired targets where data are missing for one or more independent variables, the final
sample consists of 18,561 actual acquired and potential targets that can be associated with the
actual acquirers. Thus, unlike the actual acquirers and actual targets, the potential targets are drawn
from those financial institutions in the DealScan database. As a result, only the potential targets
have been in at least one loan syndicate in the overall sample period. 18 Given that the numbers
16In their criticism of the "paired sample" statistical design used by Lev and Mandelker ( 1975), Reid ( 1975), and Honeycutt
(1975) argue that such a design is applicable only if the merging firms have engaged in only a single acquisition during the period examined and if the control firms have made no acquisitions over that period. In response, Lev and Mandelker
(1975, p. 281) note that "the set of candidates satisfying such a requirement is almost a null one." Barber and Lyons
(1996) examine the impact of commonly used research designs for matching firms to control firms on the test statistics
designed to detect abnormal operating performance. 17
If the same acquirer is involved in more than one merger with actual targets from the same country and industry during the same year, then only the first transaction in each calendar year is retained. This affects 213 acquirers and removes 279
acquirer-target pairs from the sample. 18
Since the actual acquirers and actual targets are drawn from SDC Platinum, they may not have participated in a syndicate loan in the sample period. Nevertheless, over 90% of the actual acquirers participated in at least one syndicated loan in
the overall sample period according to DealScan. Also, the results reported herein are very similar when the sample is
constrained so that it contains only actual acquirers and actual targets that are in DealScan.
Champagne & Kryzanowski * Past Syndicate Alliances and Consolidation of Financial Institutions 547
of potential but nonacquired targets vary across various combinations of industry and country,
each acquirer is associated with from 1 to 130 (mean of 9) potential but nonacquired targets for
every acquired target. 19 Based on the descriptive statistics for the (in)dependent variables for this
sample (Panel A of Table III), the average REL1 for the entire sample is 0.04%. Based on the
sample of potential but nonacquired and acquired targets, 9.54% of the actual and potential M&A
transactions involve at least one syndicate partnering between acquirer and target in the five years
prior to the merger (REL2).
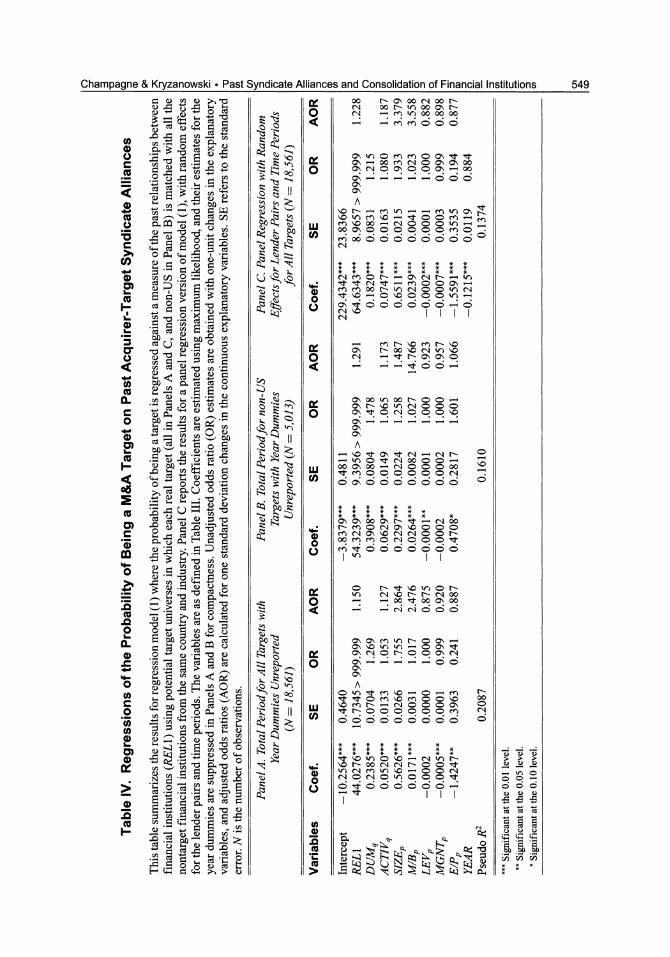
3. Empirical Results
The results for regression Model (1) using REL1 are reported in Table IV.20 Before proceeding to a discussion of these results, it should be noted that references to statistical significance are at
the 0.05 level throughout unless noted otherwise. The odds of a merger between lenders p and
q are 1.15 times higher for every increase of 0.32% (i.e., one standard deviation) in REL 1, 1.55
times higher for every 1% increase, and 9 times higher for every 5% increase in REL 1. Based on
untabulated results, these odds are 1.3 times higher if the lenders were involved in at least one
syndicated deal in the previous five years (REL2). All the remaining significant coefficients have
their expected signs. As expected, the probability that lender p will be a target decreases with
increases in the company's ROE, and increases with p's size. Since the probability that lender p
will be a target decreases with increases in the company's E/P, this suggests that acquirers appear
to be interested in purchasing targets with greater growth opportunities. To ensure that the results are applicable to non-US M&As, Model (1) is run on a subsample of 5,342 non-US targets.
Based on the results summarized in Panel B of Table IV, REL1 remains significant with a slightly
higher estimated coefficient of 54.32. Based on untabulated results, REL2 is also significant with a higher coefficient of 0.5360. The other coefficients remain unchanged in terms of significance
and sign when significant in the tabulated regressions.
To further examine the robustness of the estimates for REL1, a panel regression version of
Model (1) with random effects for the lender pairs and time period is estimated. Based on the
results summarized in Panel C of Table IV, REL1 is significant with a coefficient of 64.63. The
remaining variables have their expected signs and are significant.
Because the information and cultural gap between potential acquirers and targets can be higher
when they are from different countries or industries, a stronger relation is expected between
M&A activity and past syndicate alliances for international and/or interpillar M&As. To test this
expectation, the interactive variables that combine RELq with industry and domestic dummies,
which are described in Panel B of Table III, are added to Model (1) and year dummies are replaced
by period dummies. Based on the regression results summarized in Panel A of Table V, the impact
of REL1 is higher for international M&As, and is lower for the 2000-2004 time period, which
is consistent with panel estimation results. Based on untabulated results, the impact of REL2 is
lower for the 2000-2004 period.
19The number of potential targets varies because the universe of nonactual targets for a specific country and industry is
not the same as the universe of nonactual targets for another country and industry. Further, the availability of corporate variables varies for each country and industry and may thus affect the number of potential targets retained in the final
sample. 20
Since repeated observations on individual financial institutions are used to estimate a regression, the errors can be
correlated across observations for the same firm. The Huber-White sandwich robust standard error estimator is used to
correct for this heteroskedasticity problem (see Froot, 1989).

548 Financial Management * Autumn 2008
Table Ill. Descriptive Statistics for Variables Used in Tests of the Relation between M&A Activity with Past Syndicated Loan Alliances
This table presents summary statistics for the dependent and various explanatory variables used in regression model (1). The samples in Panels A and B consist of 18,561 and 12,824 M&As (actual and potential) that were originated between 1992 and 2004.
Variables Variable Description Mean SD
Panel A. Final Sample of 18,561 Real and Potential M&As
TARGETp Dummy = {0 or 1 if lender is M&A targetp} 0.1068 0.3088 REL1 Weighted average of sum of participation ratio in each 0.0004 0.0032
deal for target p divided by total number of deals by acquirer q
REL2 Dummy = {0 or 1 if targetp and acquirer q in > 1 0.0954 0.2938 syndicated deal in past five years}
REL3 Relative frequency of past syndicate activities between 0.0057 0.0392 q andp
REL4 Weighted average of sum of the dollar participation 0.0009 0.0141 ratio in each deal for target p divided by total value of all deals by acquirer q
DUMq Dummy = {0 or 1 if acquirer q has no syndicated deals 0.6065 0.4885 in previous five years}
ACTIVq Number of mergers by acquirer q in year before the 1.2594 2.2960 M&A
SIZEp Log of the book value for target p 15.5213 1.8700
M/Bp Market-to-book value ratio for targetp 2.8870 53.1046
LEVERAGEp Debt-to-equity ratio for target p 287.0048 534.9600
MGNTp Return on equity ratio for target p 16.5897 160.9354
E/Pp Earnings yield for target p 0.0589 0.0840 RELl q - LP REL1 where acquirer q was lead and targetp was 0.0002 0.0027
participant in past alliances REL1q - PL REL1 where acquirer q was participant and targetp was 0.0001 0.0022
lead in past alliances REL1q - LL REL1 where acquirer q and targetp were leads in past 0.0001 0.0019
alliances
Panel B. Subsample of 12,824 Real and Potential M&As
CROSSJINDUSpq Dummy = {O or 1 if targetp and acquirer q are from 0.3688 0.4825 different industries}
INTERNTLpq Dummy = {0 or 1 if target p and acquirer q are from 0.2820 0.4500 different countries}
REL1-INDUS Interactive variable combining REL1 with 0.0001 0.0011 CROSS-INDUSpq
REL1/INTERNTL Interactive variable combining REL1 with INTERNTLpq 0.0002 0.0015 REL1-1996-1999 Interactive variable combining REL1 with a 1996-1999 0.0001 0.0016
period dummy REL1-2000-2004 Interactive variable combining REL1 with a 2000-2004 0.0003 0.0029
period dummy
Champagne & Kryzanowski * Past Syndicate Alliances and Consolidation of Financial Institutions 549
0 U -n 0 >, cp , 00 ?- C 00 __ __ ooo
n ; m =, ff = m to 4 b en t ?:: W) 0 0 0 0 0
sa cS E , x,
A:1 45m YntN
4 ; _' :;a2*
? ? > 2 r e t 5 p < S 1l tn | t > :0 > ' : C) > > ? en
n~~~~~~~~~~~~~~~~~4 Yn m0. 00 t- =60| ec >: 0 . .; . .> . . .X . . . 1 tSS 10

550 Financial Management - Autumn 2008
>1 0 rA 0 r- kr) 00 O'? 00
ci
kn kn N
C,3 A A A
ct cn
C) o LU tn m c 0 0 0 C> 0 N
0
cn ct cn
4) .5 7?
0 Cd C)
cn tn r- co tn c 00 tn C) N V) N
co j r- ?10 C? "t 'IC 00 'IT r- c 0 r +-? ct r- C'? kn 1,0 \0 It ":t C) C> ',C 4) 'C' ct -0 4) C? cl? 't W-) N 0 tn C) 0 m CM 0 C? C-6 4 'r; 6 6 6 6 6 6
0 7? 1-4 lt:? 0
cr U) Z 17? 0 0 " kn
0 co C", co 01? r > U)
0 iL
0 0 ?3 0 r "t O 00 N C C) Cr,? C,\ C? - - CIS ON CN W 0? C'? 0 0
CN (01? ON v v
A A A Cd
CZ
-..4 m m 00 M 00 1,0 00 00 kn W) W) C>
C> C) 0 1,0 ?,o C) ,C ":t o CO
+C? > u +Z
cd
0 Z 4-4
0 0 ?p ?? +..? m
v) 00 N N C) r- 0 en r 0 4) C) N C,, C? - C,? 0 - tn
C-O 00 CD m ?10 N 00 m tn r 4) CL 0 O? 'IR O? lc? 0 ;3 C", 1?0 C> 0 C? C> C> CD C 0 C? 0 W) O C? 00
40, CV "::$ I N I I rn 00 0 cj 0 --4 1 1
cn cn 0
-? C?, ct 0 ;:: " 0 > >
.r ct
N n =' '+.,- "(::$ C)
m 0 4-3 F -,;:: C'n cn E? P. - U a) CIN C> CIC cd
Ln 6 6 ct
&4 C-, 5 L4 0 (Z) p
N F &-4 94
T:? lz? 0 > CL, CL,
Champagne & Kryzanowski * Past Syndicate Alliances and Consolidation of Financial Institutions 551
Similarly, to test whether the relationship between M&As and past co-syndications depends upon the roles played by the merging parties in these past syndicated loans, Regression (1) is run
with RELq measuring past syndicate alliances in which acquirer q and target p play the specific
roles described further in Table III. Based on the regression results summarized in Panel B of Table V, the largest RELq coefficient of 94.46 is for Pq-Lp alliances (i.e., alliances where the
acquirer was the participant and the target was the lead). RELq coefficients for Lq-Lp and Lq-Pp
of 25.56 and 8.99 are significant and insignificant, respectively.
4. Tests of Robustness Based on Alternative Research Designs for Potential
Target Selection
Three alternative research designs for selecting the sample of potential but nonacquired targets are tested to assess the robustness of the results presented above. In the first alternative research
design for the selection of potential but nonacquired targets, a matched sample is drawn that
consists of two financial institutions with the closest sizes straddling the size of the actual target
being drawn from the universe of potential but nonacquired financial institutions as of year-end
2004 for each acquired target. This research design partially addresses the recommendation by
Alderson and Betker (2006) that a control sample and not a control firm should be selected for
each acquired target, while ensuring that more syndicate relationships between actual acquirers
and various potential targets are captured. The matching begins with the target acquired earliest
in the period studied and ends with the most recently acquired target in the period studied. Once
matched with an actual target, each potential financial institution is no longer available to be
matched with another actual target. This research design feature helps to alleviate any statistical problems caused by including the same potential financial institution more than once in the sample. In the second alternative research design for the selection of potential but nonacquired
targets, only the potential but nonacquired targets from the same country and industry are selected
for only one of the acquired targets, whenever two or more acquired targets occur in the same
country and same industry in the same year.21 This research design further implements the
recommendation by Alderson and Betker (2006) that a control sample and not a control firm
should be selected for each acquired target, while ensuring that a more representative number of
syndicate relationships between actual acquirers and various potential targets are captured. It also
addresses any statistical problems that might arise from including the same potential target more
than once in the sample but at the expense of not considering the full sample of acquired targets.
Two different approaches are used to select the acquired targets to be retained: one that selects
the first target acquired in that country and industry during that year and the other that selects at
random one of the targets in that country and industry during that year. In the third alternative
research design for the selection of the sample of nonacquired targets, the sample of nonacquired
targets for each acquired target is drawn from the universe of nonacquired targets, which consists
of all the financial institutions that have not been acquired as M&A targets up to that point in
time. This research design alleviates the selection and survivorship biases associated with the use
of the "nonacquired, end-of-test-period surviving firm" sample. Based on untabulated results,
the inferences obtained from regressions based on the samples using these alternative research
designs for the selection of potential but nonacquired targets are qualitatively the same as those
reported herein.
2'The test is implemented using two different ways of selecting the actual target retained: 1) the first actual target in terms
of time is retained or 2) one randomly selected actual target is retained.

552 Financial Management . Autumn 2008
IV. M&A Terms and Past Syndicate Alliances
Given the finding reported earlier that the odds of an M&A between acquirer and target
increases significantly when they co-participated in syndicated loans, we now examine sum mary statistics on the terms of financial-sector M&As, as conditioned on the existence of such
co-participations. Significant differences are observed for payment method, acquisition tech nique, and the percentage of shares acquired (see Table VI). Specifically, 29.07% of the trans
actions with past alliances are paid in cash compared to 47.40% for the no-alliance subgroup.
A divestiture is involved in 65.02% and 47.94% of the M&As with and without past syndi
cate co-participations, respectively.22 Finally, the percentage of shares acquired is significantly
higher, on average, for M&As between those with past syndicate co-participations (88.38% vs. 77.08%).
V. M&A Wealth Effects and Past Syndicate Alliances
As discussed earlier, a previous alliance with a target through loan syndications allows the
acquirer to elicit very specific information about the target's potential compatibility and resources
and enables the acquirer to determine whether an offer will be perceived as hostile or friendly.
If banks purposefully select targets and if the responses of potential targets to M&A overtures
draw on their past relationships to capture informational advantages, then M&As between parties
with past alliances should yield higher performance gains than those without such past alliances.
If the M&A is a cross-border transaction, this may create value for acquirers by building on the
target's expertise and knowledge in specific markets (internalization theory of Rugman, 1981), by lowering the risk of failure through further diversification of income (French and Poterba, 1991),
or by using financial market imperfections to lower operating and financing costs (Aliber, 1978).
Furthermore, past alliances may create value by facilitating firm integration, and this value may
be captured by the target shareholders.
In contrast, agency theory predicts that such M&As destroy value. If managerial prerequisites
are tied to firm size (Jensen and Meckling, 1976) and ownership diffusion and if managerial
entrenchment is enhanced by slanting investments toward opportunities that make the specific
skills of management harder to replace (Shleifer and Vishny, 1989), then the managements of both
acquirers and targets may engage in M&As that are less favorable financially. Furthermore, M&As
between parties previously co-involved in syndications are likely to be friendly and relatively less
contested. In turn, this may result in smaller expected premiums (although the results reported in
the previous section are inconclusive). These expectations are captured by the following hypotheses, which are tested on samples
based on whether or not the merging parties co-engaged in loan syndicates during the five-year
period prior to the M&A:
Ho: All else held equal, the M&A's impact on the wealth of the acquirer's shareholders will
be the same whether or not the merging parties co-engaged in past syndicate alliances.
H3: All else held equal, the M&A's impact on the wealth of the target's shareholders will be
the same whether or not the merging parties co-engaged in past syndicate alliances.
22 More than one acquisition technique can be entered for each transaction.

Champagne & Kryzanowski * Past Syndicate Alliances and Consolidation of Financial Institutions 553 Q ct 00 * * * * * * * * * * *
v~~~~~~~~~~t C ? * ~~~- (NOW0~ 1C (N 0 1 0v
o~~~~~C r _ ~ *~~>
) ci
) 0 @ * * *** ** * ** * * O 0c ' "It 0 't "t
4)
~~)O 000~0~~i~ci0 0 En = (I1 ( NmbF
> m
e < Z b~~~~(- N m o 0 b N N N o
= - c I c O - m C o o o o o n 6 ~~~~~~~~~ '- 6C 4 t 640 ._) ol 00t ^ ? r N 0o
(U ~ ~ ~ (
C.) 00 0 ~ N~
cr 0 0 C- O2 N (N o
Q .~~ o o o o t o o b N
m (7^
0 M e m o. b-o. O N t N o . t
.> o u 0 0 \
0 0 nrnC
C a) (Nr N(No 00S NS S0
; =~~~~~~I m 0 0 (71 (01 01 o I (7 (ZI r m
(UX = > 0. 0 O~ 00 o. t0 ? O~ Cl N 0
0e _ . z < C^ () nO0o t 0 tN t o
0~~~~~~~~~~~-0 e O.>~~~~~~~~~~~~~O ._<Qt?o o 'c- a aN ?
Z~~~~ ~ ~~~~~
m kn m
oON ) C) " 2 0 - N 0t 0 r N
q 40 t) 000Xl0 Cl o ~~~ Cl)~ - C) 6666oooo . 00
* 0) 0 ( ^ N lO 0 0 k tr 0N _ <> 0 - O0 00 1 C 00 ?O C 00 Nl
o 6 0 N bNO?mttoc
Q- -
F ~ ~ ~ ~~~~1 ' 1- (N N N '* 'I m It 00mm Q ~_ O000?? mr m0
i* 0 O t
S X; E ? S i r mx t i .~~~~C; .c 6 0 c
2 2 66 6 m
554 Financial Management * Autumn 2008
A. Announcement-Day Effects
To determine market- and risk-adjusted abnormal returns (ARs) around each M&A announce
ment date (AD), the following dummy variable version of a single-factor market model, which
allows for an event-induced beta change, is used:
Rit = ?i + PliRmt + P2iRmt DI + L TinD2r + sit, (4) n
where Rit is the return for firm i on day t, Rmt is the rate of return for the market m on day t,23 cai is
the intercept for firm i, ft Ii and P82i are the pre-AD beta and the change in beta on and subsequent
to the M&A AD for firm i, D1 is a dummy variable with zeros before the M&A AD and ones
on and after the M&A AD, T is iS the parameter (measure of AR) for firm i on date n relative to
the AD, D2n is a dummy variable that is equal to 1 on date n relative to the AD and 0 otherwise,
and Eit is the disturbance term of the relationship at time t for firm i, which is assumed to be
distributed normally with mean equal to zero, constant variance, and zero correlation between
residuals across and over time.
The regression results for tests of H2 for the acquirers are summarized in Panel A of Table VII.
Overall, the average CAR around the announcement date is significant, although very small at
0.13% for the [-1, 1] window. The median and mean differences in the announcement-window
wealth effects for the M&As between lenders with and without past syndicate co-involvements are
statistically different and favor those without such involvements. The small positive wealth impact
is present only for the M&As with no previous syndicate co-alliances.
Panel B of Table VII reports the results for tests of H3. The mean cumulative abnormal
performance for the [-1, 1] announcement window is 2.87% for the targets. The mean CAR is
significantly higher for targets without prior alliances with the acquirers than for those with prior
alliances (3.15% vs. 0.87%). Although smaller in magnitude, the same inferences are drawn based
on the medians.
B. Longer-Run Wealth Effects
Longer-run wealth effects are measured using buy-and-hold returns, measured using monthly ARs, over holding periods of 12, 24, or 36 months. To control for risk, ARs are measured using
the Jensen a that is obtained from
Rit - Rft
= ai + pi (RMt -
Rft) + Fit, (5)
where Rit is the return for acquiring firm i for month t within the postacquisition period ending at
T, RMt is the rate of return for the benchmark for month t, Rft is the risk-free return as proxied by
the monthly rate based on the three-month Treasury Bill rate for month t within the postacquisition
period, ,Pi is the beta for firm i, and ei is the error term of the relationship for month t for firm i,
which is assumed to exhibit the traditional properties. To test whether the abnormal performances
of the acquiring firms differ from zero or between the two subgroups, the mean and median
alphas are tested using t- and Wilcoxon tests, respectively.
Four different types of benchmarks or control portfolios are used in Model (5). The first one is
based on Datastream's financial sector indices. For every country, indices are constructed using
23 The index returns used for each institution are specific to the stock exchange on which the stock is traded. When
unavailable, a Datastream-constructed value-weighted index for the relevant country is used.

Champagne & Kryzanowski * Past Syndicate Alliances and Consolidation of Financial Institutions 555
E~~~~~~~V D oo CD 00 N m -q _O r- c) 0 ,v
0 ,
10. N - 0 e m
(U.
> ON N 3 ' O I 1N C
X E (< I * III "w e oo_'* II
> C) LU >2 eO en - 00 $7~ CT g( fo 0_ o
,, I ;- ;c ; gv c ;o
-W 0 0W U - -k 0~
m ,, 4> N r fll- r 0(U ClN 00N
4) LO~~~~~~~~ C)6e~0CC 0
.O o * *
0 i 000l 0) (U C 00 00NCl 0 00 *6666oo ? 0 0N l N cs v, W0 I
o , en 01 1 |co 0 666666
M "O IC r m , _ ^t o o _ < ? o t )0 -
@ ~ ~ ~ ~ I II
I > 12 ?>0??10 0S
IL -5 :R L ( 0000e r
t i | (U... 1 1 ,, * *9 *-,
ad ?4 -4. LIn w, 0 0 w N Em-O at
aX cD - 2 r f 0l -l 000 ~ ?- C) 0t
0 ? ?t
O
o 6666666. 8 N ? Um | * t j s2> | N n CS 0N tn CN X
.4 tEn=
o) ~-0
4 )0 0
>E co N00N o 0 S C5C5D C;C
0 1.0 C0 0000000
W 0) -
00 Cd I 1111 1 00
U) 0 >1 C ;ciCi C
CO) ~** 'T.!
0 00 0-lI. *** 00
-c~~~~~~~~-0o~~~C)- I W
(U 00f~~~~~~~-ClCl~IC -
0
E C; - CU, NCA q 0' N 1111 l 6l
0 ~~~~~~~~~~~~N 0 ~~ ..o (N * * * * * *
ooooo-o ~~~~~~ (U rl-0 0~0 'CC00OCI 0
C 6666600-
t W 00
lu > en IC tCA -00 0 >.
C~~~ Qo (U 00-~~~~~~~~roo0Cl~~rq0 66
(U o Oooo-- I- 0 t -0 N0 O
F-D 0 I ~ . i00L.0 I *

556 Financial Management * Autumn 2008
a varying number of institutions that are representative of the sector.24 The second set of control
portfolios are obtained by selecting institutions that did not acquire other financial institutions (or were not the target of such acquisitions) during the assessment period for each sample firm.
Actual acquirers are then compared to (different-sized) portfolios of same-country nonacquirers. The third type of control portfolio combines nonacquirers in value- and equal-weighted world portfolios. The fourth type of benchmark consists of control firms not involved in M&As as
either acquirers or targets but from the same country as the lender studied and approximately
of the same size.25 Individual acquirer or target returns are regressed against the appropriate
benchmark returns for the first three types of benchmarks, and the returns of equal-weighted
portfolios of targets and acquirers are regressed against the appropriate returns for the fourth
type of benchmark. Thus, the latter test provides an additional test of robustness but is not an
investable strategy, since it is implemented in relative time. Regression results for tests of H2 using longer-term abnormal financial performance are
summarized in Table VIII.26 The buy-and-hold abnormal (percentage) returns (BHAR) for one-,
two-, and three-year periods for the full sample are all highly significant. Not unexpectedly, the
magnitudes of the mean abnormal performances vary by benchmark, and range from 13.57%
to 18.31% for the three-year BHAR for the full sample of M&A acquirers. These values lie
between the overperformance of 57.3% that Boubakri, Dionne, and Triki (2006) document for
acquirers over the three years following insurance company M&As and the small and generally
insignificant long-term abnormal return performances documented by Loughran and Vijh (1997), Rau and Vermalen (1998), and Mitchell and Stafford (2000) for their full samples of M&As that
exclude financial institutions and insurance companies. Interestingly, M&As with past alliances
generally underperform those without such alliances for most benchmarks. One notable exception
is the 24-month BHARs based on the world-control portfolio where the median is significantly
higher for M&As with previous syndicate co-involvements.
C. Wealth Effects and Past Alliance Strength between Merging Parties
Because the abnormal performance around or following the event date can be caused by a
number of factors aside from the past alliances between the two merging lenders, various cross
sectional regressions of the ARs on a number of variables that are known to affect such ARs are
run in this section of the paper. The specific model used is
AP = Po + P1 * REL + P2 * REL-SIZE + P3 * SIZE + P4 * B/M
+ P5 * E/P + f6 *PAYMENT + P7 * DOM + P8 * TECHNIQ
+ 9 * BIDDERS + plo * YEAR + E. (6)
In Equation (6), AP is the abnormal performance of the acquirer or the target, which is measured
as the CAR over the [-1, 1] announcement window in order to examine the short-term effect
and as the three-year BHAR to measure a longer-term impact. REL and DOM are as defined
earlier. REL-SIZE is the relative size of the target, which is obtained by dividing the target's
24For instance, the US and Canadian indexes are composed of 58 and 7 value-weighted banks, respectively. 25
Since the control firms need at least the same amount of stock return data as the sample firms during the assessment
period, any survivorship bias will benefit the control firms. Also, to reduce cross-sectional dependence, each control firm
is used only once in a control group.
26Because the results are very similar for the equal- and value-weighted benchmark returns, only the results for the
equal-weighted benchmarks are reported herein.

Champagne & Kryzanowski - Past Syndicate Alliances and Consolidation of Financial Institutions 557
rA cd
Co W 00 00 0 4) U) In
4 73 2 0 C) C) a) >% 1*-# M 4 4w
U) 4) U) 4)
cr r Cr o en 0 LU ui 4) >
4)
4)
-W cq N CIN U) Nt en IRT m 0 oc W,) 4w U) 4) N
rz 00 N Cd
4)
m 06 4)
4) 4)
M r-- ?10 C) 00 E rf) O W) cn W) OC)
Cr
4) m C,? 00
N r- ?,) 4) O en J? as 9! en 00 OC) kn +--? ?L) 4) Is
U) cq 2 r-? 1, 4 -W rs < llz?
0 IZ ?4) 06 cl? -W ?10 m
E W CN CN 0? 4) 4w . 0
U) C', I > N
0 0 CL N
V-) 00 OC)
00 4) 00 4)
4) C5
4) 4)
rl- cn 00 C-4 0 In 0 00 C
W > 1?6 4 CO) (j)
E 4) m z c
CL m 4) 4) r- OC) OC)
m OC) r 0 06 C3 ?16 4 1-4
a) 4) C) C? - F4 00 r- 0
01? [-- "It U) co
E 4 0 0 It cd 4) > v- m
\10 N 00 [L V) 00 -0 kn 00
C5 4) 4) 1 1--4 2 le - I - In J o 4)
0 4) CL CL = E IRt
?16 4 C? E 00 > U)
co 0 IS-C INC 0
O W') OC) r- tn -4 m
C,3 O en en ON kn
06 116
0 'IC I 120 2 cn

558 Financial Management Autumn 2008
* 0~~~~~N0
m 0
0 W~~0 00V r
c~~~~~) ~ ~ ~ ~ ~~4 (I) II 4 -W m
U w 0
0 0m rn0
e10 n0 r
m 00~~~~~~~ (U
4) 4~~~) C0
0-2 * * 0.* *
>-> * - >t 1: oo*
4) = = 'hi j fc
4.() ~ ,6 0
U))
0 1~ 1
II 0 00
N OC) tl-~ ~ ~ m
0 0 0
(U ~ ~~~~ 0Itc1 I- ~~~~~C~0 O D" 00 CD rn ~ ~ ~ ~ ~ ~ ~ ~ c~C
U) OU) 000tl
0 ~ ~ ~

Champagne & Kryzanowski * Past Syndicate Alliances and Consolidation of Financial Institutions 559
market value by the acquirer's market value. A positive relationship is expected between the
relative size of the target and the impact of the merger announcement for the acquirer, and the
inverse is expected for the target. SIZE is the acquirer's or target's size, as measured by the market
value of equity. B/M is the acquirer or target's book to market value ratio, which is found in the
literature as being positively related to long-term stock performance.27 E/P is the acquirer's or target's earnings yield, measured as before. PAYMENT is a dummy variable that is equal to 1 if
the payment method is cash and is equal to 0 otherwise.28 A positive coefficient is expected for
this variable because empirical studies find that M&As with cash payment are associated with
positive CARs because of the positive signal sent to investors.29 The TECHNIQ dummies are for
tender offers (TENDER), divestitures (DIVEST), open market purchases (OMP), and privately negotiated purchases (PRIVATE). BIDDERS is the number of bidders that were involved in the
M&A contest for the target.30
Three reformulations of Model (6) are examined. Descriptive statistics on the dependent and explanatory variables are presented in Table IX. The average abnormal performance is -0.06%
for the acquirer and 1.43% for the target around the event date and is 11.25% for the acquirer for
the three-year post-event window. The percentage of M&As with past alliances (REL2) ranges
from 9.03% to 17.88%. Because we work with parent companies, the average relative size of the
target is high (from 69.09% to 92.31%). Slightly less than 50% of the transactions involve cash
payments. The majority of the transactions are divestitures, and most transactions involve only
one bidder. The regression results for the three reformulations of Model (6) are summarized in Table X.
The announcement-window abnormal returns of targets and the three-year post-M&A abnormal
returns of acquirers are not related to REL1 or REL2 but are negatively and significantly related
to the respective sizes of the acquirers and targets. The ARs for acquirers for the announcement
window are negatively and significantly related to the presence of past alliances (REL2).
A possible explanation for the results above is that the benefits of previous teamwork between
two lenders is already reflected in equity returns far in advance of the actual M&A, so that
the M&A is just a certification of their partnership.31 To see whether intensity or exclusivity
between the acquirer and target is rising over time prior to the M&A or whether intensity or
exclusivity differs based on the nationality of the M&A, the behaviors of REL 1 (times 100)
and REL3 are assessed at a semi-annual frequency over the six semi-annual periods prior to the
M&A announcements for the subsample of mergers involving past syndicate alliances. Based on the results that are reported in Table XI, the exclusivity and intensity of the syndicated lending
relationship between the M&A parties (undifferentiated by whether the M&As are US or non
US), as measured by the average REL1 and REL3, exhibit slight downward and upward trends,
respectively, over the five half-years leading up to the M&A announcements. When differentiated
by the nationalities of the M&As, the average prior syndicate relationships, as measured by REL1
or REL3, increase for US M&As and decrease for non-US M&As over the five half-years leading
up to the M&A announcements. Although these trends are not statistically significant, the mean
27Rau and Vermaelen (1998) find a positive relationship between the book-to-market ratio and long-term stock perfor mance, reflecting the dominance of value acquirers over glamour acquirers.
28The payment method is deemed to be cash if 50% or more of the transaction price involves a cash payment. 29
See Travlos (1987), among others. For the long-term performance effects, Loughran and Vijh (1997) find that long-run stock performance is better for cash acquirers than stock acquirers. 30 Although the percentage of shares acquired during the M&A transaction is a potential explanatory variable, it is not
included in the regression because it is not available for most studied M&As.
31 We thank an anonymous referee for this insightful comment and follow-up suggestion.

560 Financial Management * Autumn 2008
Table IX. Summary Statistics for the Measures and Potential Determinants of M&A Performance
This table presents summary statistics for the dependent and explanatory variables used in regression Model (6). AP is the abnormal performance measured by CAR for the [-1, 1] event window or by the three-year post-M&A BHAR. The following are measured over the five-year pre-M&A window: REL1 is the exclusivity of the relationship between targetp and acquirer q, and REL2 is a dummy variable that equals 1 if both acquirer q and targetp were in at least one syndicated deal together during the five-year pre-M&A
window and is equal to 0 otherwise. REL-SIZE is the relative size of the target, obtained by dividing the target's market value by the acquirer's market value. The following three variables are measured for the acquirer (Panels A and C) and the target (Panel B): SIZE or the size of lenderj (where j = p or q), B/M or
lenderj's book-to-market value ratio, and E/P or lenderj's earnings yield. PAYMENT is a dummy variable that is equal to 1 if the payment method is cash and is 0 otherwise. DOM is a dummy variable that is equal to 1 if the acquirer and the target are from the same country and is 0 otherwise. TECHNIQ is a set of dummy variables to indicate the acquisition technique, namely, tender offers (TENDER), divestitures (DIVEST), open market purchases (OMP), and privately negotiated purchases (PRIVATE). BIDDERS is the number of bidders for target p. The YEAR dummy variables are suppressed for compactness. N is the number of observations.
Panel A. CAR-Acquirers Panel B. CAR-Targets Panel C. 3-Year BHAR (N= 2,300) (N= 1,588) Acquirers (N= 631)
Variables Mean SD Mean SD Mean SD AP -0.0618 3.7118 1.4289 10.8828 11.2507 62.0562 REL1 0.0014 0.0051 0.0016 0.0053 0.0010 0.0044 REL2 0.1548 0.3618 0.1788 0.3833 0.0903 0.2869 REL-SIZE 0.6909 0.9916 0.9231 1.1507 0.8231 1.0608 ACQ-SIZE 8.8381 2.0919 7.8263 2.1822 7.6623 2.0337 B/M 0.7624 0.6417 0.8149 0.8476 0.8143 0.7992 E/P 0.0501 0.0991 0.0332 0.1456 0.0515 0.1057 PAYMENT 0.4709 0.4993 0.4855 0.4999 0.4723 0.4996 DOM 0.5330 0.4990 0.4736 0.4995 0.6862 0.4644 TENDER 0.0491 0.2162 0.0157 0.1245 0.0586 0.2351 DIVEST 0.5230 0.4996 0.6574 0.4747 0.4834 0.5001 OMP 0.0583 0.2343 0.0529 0.2239 0.0792 0.2703 PRIVATE 0.0991 0.2989 0.1115 0.3148 0.0824 0.2752 BIDDERS 1.0200 0.1576 1.0031 0.0663 1.0269 0.1806
REL1 and REL3 are significantly higher for non-US versus US M&As for all six half-year periods
leading up to the M&A announcements.
D. Operating Performance and Past Alliance Strength between Merging Parties
Thus, the results reported and discussed in the previous section may indicate that the market
already incorporated any expected benefits of the previous alliance into stock prices. Therefore,
the major benefits of the merger may be increased operating efficiencies and reduced integra
tion costs and uncertainties, as discussed earlier. To examine if this is the case, a comparison
of the operating performance of the acquirer conditional on past loan syndication alliances
with the target is undertaken. To this end, the sample of acquirers is subdivided into two sub
samples conditional on the presence of past alliances, and statistical tests are performed to
examine if operating performance is significantly different between the two groups around the
M&As.

Champagne & Kryzanowski * Past Syndicate Alliances and Consolidation of Financial Institutions 561 - 0O - o 0 C 0 t N e r m o00
_ F e 't N 0 O ' ot ^ -00 U) 0 N m 00 t t N 0 ? b o N 0
=~~~~~~~~U Vn C' IT M r, r- ": t cn "O ̂
tn ws m N N t
v) ? N m 0 o 0 x *
_ 0 . . ? 00N O - ? 00 f -~~~~~~~~~~~r ,_ c v? 00 00 - b o?Ch ._ " ._ O 00 00 m 00 b t N ^ O 0 - -
*. 0~~~~~ E
$
Ct I oo~~~~~~~~0 N - n t- tn o t tc m
00 0C) 00 ; N
0 0c O 00 ( i UJ 1. 0 0- 0
n U)~~ e-; it t- -
0 "0 m 0 L =~~~~" u * * N00 0 C 0 * * *0
U) X r > "0 0m O C 00 C', - e It 00 en ON 0) 0 . . t 0 oo t O - O
X o tt e n ^~~~~~otr 0~~~~ > o ^ a * olW < D*D N N t- kn oo N M
) NQ ON N m O0 CN 000 CN 1 . C0 ._W~ = v O X? s- ot?^No'
0) 00 + cnN m N O O 0 ~~~~ 00*0
* * * * 0
r 3O so 0 o
0. O- + 6 ~o ~ 0 ' N 0 e ?N o e ' o " 0 -m m N F O
0 i-t z < ??00
E 00o E + e e * ** * * * o. h C, ? Y t. \, C ?C 0 N 0 0 r ? ? W o ? 0'
~~~~~~~~~~~~%o -- s; - m oo~ n o t- m Ch -
<' I I I I l l? ? l?t i i i
0 eV = T W~~0 k
_N N to X 00 O~~~ "0 N 00 00 fCeo bNN '00-o
._ EY a X W o 0 0 m ? N ee W~~~~~~~~~~~0
c n \% C9 nn .~ en . ~ .0 . . . .
0 .oc + + - * ** * * * 00> C ; r en rn"UN ) l 0'00 O- , o
- rn-4 N t S * . t ? ? ^ o N m m O 'R - C) C)o
O e ? S N ^ ._ w 00 0NONN
'I- E 0 o oo06o7000000
c oo 9 $o
3 - *) O 0
* .4., I
C + !4 w >\ , 0 m
0 * * ] * 000 1
+ C) C) C) C) - m ?* O C) C) C) C) OC) pB
E m * 0 () Q . o _ 0 00c O (e- 0 0 00O
>e on2 00 0t w " N t m - IO 0
0 C%~~~~~ II ~ ~ ~ ~ 0 U)C
0 0
@ a^ <+ fi <? ??l< ?? > ?UrIHQ
U) = -S e :i>i!;gB|3|i
$-40
Ho C1 1 r >4 n0W) NNC

562 Financial Management . Autumn 2008
Table Xl. Time-Series Behavior of the Relationship between the Acquirer and the Target Prior to the M&A Announcement
This table presents summary statistics for REL1 and REL3 for six different time periods prior to the M&A announcement. Panel A presents statistics for all mergers involving past syndicate alliances. Panel B presents statistics differentiated by the country of the target. All measures are calculated for the subsample of pairs that were previously involved in syndicate alliances.
Panel A . Statistics for All Mergers Involving Previous Syndicate Alliances
Months Prior RELI (x100) REL3 to the M&A
Mean Median SD Min Max Mean Median SD Min Max
[-6,0] 0.6240 0.2279 1.0871 0.0035 11.1111 0.0595 0.0092 0.1202 0 1 [-12, -6] 0.6035 0.2368 0.9179 0.0034 8.3333 0.0558 0.0082 0.1116 0 1 [-18,-12] 0.6545 0.2116 1.3976 0.0027 25.0000 0.0542 0.0075 0.1155 0 1 [-24, -18] 0.6650 0.2202 1.3564 0.0024 16.6667 0.0574 0.0074 0.1227 0 1 [-30, -24] 0.5996 0.2273 1.0504 0.0027 16.6667 0.0542 0.0057 0.1144 0 1 [-36, -30] 0.6691 0.2352 1.3482 0.0043 19.2308 0.0542 0.0059 0.1200 0 1
Panel B. Statistics Differentiated by US vs. non-US Mergers
Months Prior RELI REL3 Equality of Means to the M&A US Non-US US Non-US REL1 REL3
Mean Mean Mean Mean t-Value t-Value
[-6, 0] 0.5210 0.7945 0.0445 0.0856 3.92*** 5.97*** [-12, -6] 0.4895 0.8052 0.0416 0.0808 5.06*** 6.14*** [-18, -12] 0.5007 0.9363 0.0388 0.0823 4.06*** 6.32*** [-24, -18] 0.4734 0.9957 0.0402 0.0894 4.95*** 6.75*** [-30, -24] 0.4504 0.8494 0.0376 0.0880 5.08*** 6.93*** [-36, -30] 0.5061 0.9463 0.0357 0.0898 4.59*** 7.35***
Significant at the 0.01 level.
The first set of tests examines the operating performances of the acquirers in each of the four post-M&A years relative to that of a control sample. Specifically, the relative performance of acquirer q for an M&A in year t is measured using:
RELPERFq, t+r = PERFq, t+T - PERFnonq, t+r, (7)
where PERFq, t+? is the performance of the acquirer for year T (r = 1, 2, 3, and 4) following the M&A in year t, and PERFnonq, t+T is the average performance of a portfolio of nonacquirers (control sample) from the same country for the same year. Three measures of performance (PERF) are used, namely, ROE, ROA, and an operating expense ratio measured by dividing the total operating expenses by net revenues (EXP).
Based on the results presented in Table XII for RELPERF, acquirers undifferentiated by past syndicate target co-involvements exhibit significantly higher mean ROA than their controls only in the first and second years post-M&A. Similarly, acquirers without past syndicate target co involvements exhibit significantly higher mean ROA than their controls in years 1, 2, and 4
post-M&A. In contrast, acquirers with past syndicate target co-involvements exhibit significantly different mean ROA than their controls in all four post-M&A years, but only the value in year

Champagne & Kryzanowski * Past Syndicate Alliances and Consolidation of Financial Institutions 563
@ 4 O oS v = E I I I I 0
3 = z m o tc~~~~~~~~~( ** *** * * * * * * *
cd 0
sO Co e N o00 o 0 F 00f 0O b
X *! = = b; u wU ? o o o ? o " t
(n 06 ?-~ *6 V: 06 0oI I I I I III
U)
C cd "O~~~0
C O ***(a
Q t'QO~O) W (Uo 0 C . * * * * *
O . uo= * * * * * * * * * * * *
<~~~~~~~
rA ,4 * _~ _- *- eo o o to o o o o "o o- N wn 4- a) "C W0 sv O- _ - 1 't m N cr z
wX gz i t t Y r _ I I I -II
0 ~ ~
X~~~~~~~~~~~~~~~~~~~~~ C) C) ot 0 0, 0
4w ?~ .t -t r- N ,. .O (7- o o) "t 0 No O Q i t o S S 0 n X ? N N tA m tO "O -..
Cu Ei aR W = W 5 4)37777
o)4 r - S I b I I I I Ie IN . OL
a.2 O Y = ;,> E !* * * * * * 6 * ** * * * C
: o a * * * * * * * * * * 4) -U,O e - 0M0 e
0C
C = - Z (U o 0,, _ 0 J)
0 E C
0 C., PO ~~~~0************
CU 00~O~ 0O ;q.) z C",~~0 N r0 000 00 (-N e1 - 0 0 en ~
0 (U +
C. a) c
I-~~~~~~~~~C -- 0.0 1 0 00 00 C0 Nent- ON C) o r d tO -0C1- 0 C ' 0
0 0 a
C
I.. kn a) Cen c 0 C.) m r- 1 -
0 ~~~~~ Ea~j
0 a)~~~~~~ U OI
.0 ".
-E) g m~~a I. L
E L ~Q
C)~~~~a
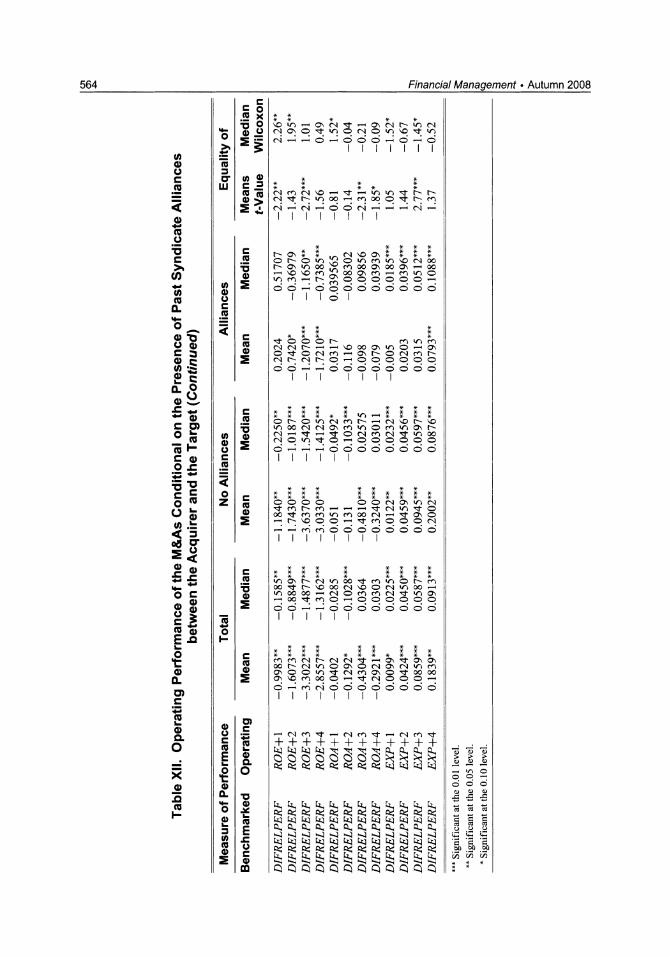
564 Financial Management . Autumn 2008
c o (UX * *
o @ N Cr) o 't kf Co N Co ', I t
X~~ ~~ .> ._ .? 7 . . . . 7
~ L(~ - 0~Cl C) Cl t- LI Cl
C.) C 0 U * * (U W e * *
._ u_N ^N
tM m N
C ) > > - 00- e- 000 C t 'I r _
C.)~~ *o ~ ~
~~~~~ * * * * * =5~ ~ 0NV
e OOCl m?N00 C CD r- Co ) C) ') V) 'IC rq o0 o
t r ON ̂ 0n V 00 Co 00 0 ) 6 A 6ooo Oo6 O O O OO
0U C.)2 ? I l O 7 0 700 0 0 4
Oa) < ** Q It )CC 00>0 0 O o
0 -@ - 5 00000 t0 C O OO
a) - ) (
, im . ) 00 oo N cn tn V" o ~ ^ m O L. e N C lt o C cq t - oo
_ X @ @ N o. m W) o o Co o o. o o
Ca) C 111 =
CC 0_* * * o M Z - o o o o o o N cr
L.::
a) )
'-W l~~
a) 4 * * * * s @ e *~~~~(U * * * * * * * * ** kn m o N n oo m tn C) o - Fn
._ oot r- 'I ooN IN Co N ) oo - OC LCt 00 00 o N en ̂ N lt m 0 C
oo 00,t C> O) O) O) O O OO c) 3 c7 t70000000
En * 0 C * * * * * * * **
^ e N > N " t (U t cr o a) a) ~
o -"tnC C >cqC q )c 0) 0- C Co 0 0000 00N 0 t 0 0
C C, ., n 00 CD N 0 0 -
C r + + + + + + + + + + + + CU C
0)
o o E EEStt t
0~~~~~~~~~~~~~~~~~~~~ .x 0.. o o~ Y aaaakk
E 4-44
U) . a) C tE ctSc,E! ,)
en a) ?- -- - * * * ? Q =.
X m qqqqqqqqqqqq>>m
Champagne & Kryzanowski * Past Syndicate Alliances and Consolidation of Financial Institutions 565
2 is positive. Also, all three samples exhibit significantly lower median ROA and EXP and higher mean and median ROE than their controls for all four post-M&A years. In addition,
all three samples exhibit significantly lower mean EXP than their controls for all four post M&A years, except for year 4 for the undifferentiated sample and for the sample without past
syndicate co-involvements with their targets. Thus, the sample of (un)differentiated bank mergers is characterized by significantly lower operating expense ratios and higher returns on equity post-M&A relative to their control samples.
A comparison of the RELPERF values in Table XII for acquirers differentiated by past syndicate
co-involvements with their targets reveals that those with such involvements exhibit significantly lower mean and median ROA and higher mean and median ROE, respectively, relative to their
controls (i.e., excess ROE) for each of the four post-M&A years. The mean and median EXP
relative to their controls are not significantly different for all four years for acquirers with or without past syndicate target co-involvements, with the exception of year 3 where acquirers with
such co-involvements exhibit a significantly higher reduction in the operating expense ratio. Thus, acquirers with past syndicate target co-involvements outperform those without such co involvements from what is (arguably) the primary perspective of shareholders-that is, in terms of
ROE. This occurs even though acquirers with past syndicate target co-involvements rely more on shares as the payment method (71% vs. 53% for their counterparts without such co-involvements).
While the previous test benchmarks the performance of acquirers against a control sample, it
does not benchmark the control-benchmarked performances of the acquirers against their per
formances in the year prior to their M&As. Thus, the next set of tests examines each of the
three measures of the acquirer's operating performance relative to its control sample in each of
the four post-M&A years, minus the corresponding measure of the acquirer's operating perfor mance relative to its control sample in the year prior to the M&A. Specifically, time differences
in the following differenced measure are examined for the sample of acquirers differentiated by prior syndicate relationships between the merging parties for an M&A involving acquirer q in
year t:
DIFRELPERFq, t+r = RELPERFq, t+r - RELPERFq, t -1, (8)
where -r = 1, 2, 3, and 4, and all the other terms are as defined earlier.
Based on the results presented in Table XII for DIFRELPERF, the means (not medians) for
DIFRELPERF for ROA are negative and significant for the undifferentiated sample and the
sample of acquirers without past syndicate target co-involvements in years 3 and 4 post-M&A, and the difference in the means between the two differentiated samples is (marginally) significant in year 3 (4). All of the median DIFRELPERF for EXP are positive and significant for the
(un)differentiated samples and all of the mean DIFRELPERF for EXP are positive and significant for the undifferentiated sample and for the sample of acquirers without past syndicate target co
involvements. In contrast, only the mean for DIFRELPERF for EXP in year 4 is significant
(positive) for the sample of acquirers with past syndicate target co-involvements, and only the
difference in mean DIFRELPERF for EXP in year 3 is significant (higher for the sample of
acquirers without past syndicate target co-involvements). Thus, we observe deteriorations in the
operating performances of acquirers, which are benchmarked to the performances of samples of
control firms and to pre-M&A performances, in the four years following the M&As. We also
observe that the deteriorations in the operating performances of acquirers are higher for acquirers without past syndicate target co-involvements than those with such involvements.

566 Financial Management * Autumn 2008
VI. Conclusion
This paper has provided empirical evidence on the relationship between M&As and past
syndication activity in the financial sector. The probability of an M&A between two lenders
increases significantly when the institutions partnered in the five-year period before the M&A, and the odds of a merger are higher for every percent increase in the relative importance of the
past alliances. The impact of past relationships between the acquirer and the target is stronger
for international alliances and cross-industry mergers as well as for cases where the acquirer and
target are participant and lead, respectively, in these past alliances.
When the two merging parties have been engaged in past alliances, the method of payment is less
often cash, the transactions more often hinge on divestitures, and the percentage of shares acquired
is significantly higher. Although the short- and longer run market performances of acquirers are
significantly lower for merging parties co-involved in past syndicated loans, the impact of past
syndicated alliances becomes insignificant when various control variables are considered. In
terms of return on equity, acquirers with and without past syndicate target co-involvements both
outperform post-M&A, when their operating performance is benchmarked solely to control firms. Furthermore, although acquirers with past syndicate target co-involvements rely more on the share payment method, they outperform acquirers without past syndicate target co-involvements
in terms of return on equity when their operating performance is benchmarked solely to control
firms. However, when the operating performance of acquirers is benchmarked to both control
firm performances and pre-M&A performances, post-M&A operating performances tend to deteriorate relatively more for acquirers without past syndicate target co-involvements than for
those with such involvements. Whether or not these market and accounting effects are due to
the impact of differential earnings management (i.e., earnings overstatement prior to M&As as
reported by Louis, 2004) along with the greater use of the share payment method for acquirers
without past syndicate target co-involvements is a matter left for future study.E
References
Akhavein, J., A. Berger, and D. Humphrey, 1997, "The Effects of Megamergers on Efficiency and Prices:
Evidence from a Bank Profit Function," FEDS Paper Number 97-9 (January).
Alderson, MJ. and B.L. Betker, 2006, "The Specification and Power of Tests to Detect Abnormal Changes
in Corporate Investment," Journal of Corporate Finance 12, 738-760.
Aliber, R.Z., 1978, Exchange Risk and Corporate International Finance, New York, MacMillan Press.
Amel, D., C. Barnes, F. Panetta, and C. Salleo, 2004, "Consolidation and Efficiency in the Financial Sector:
A Review of the International Evidence," Journal of Banking and Finance 28, 2493-2519.
Amihud, Y., G. DeLong, and A. Saunders, 2002, "The Effects of Cross-Border Bank Mergers on Bank Risk
and Value," Journal of International Money and Finance 21, 857-877.
Anand, B.N. and T. Khanna, 2000a, "Do Firms Learn to Create Value? The Case of Alliances," Strategic
Management Journal 21, 295-315.
Anand, B.N. and T. Khanna, 2000b, "The Structure of Licensing Contracts," Journal ofIndustrial Economics
48, 103-135.
Armstrong, J., 2003, "The Syndicated Loan Market: Developments in the North American Context," Bank
of Canada Working Paper 2003-2015.

Champagne & Kryzanowski * Past Syndicate Alliances and Consolidation of Financial Institutions 567
Barber, B.M. and J.D. Lyon, 1996, "Detecting Abnormal Operating Performance: The Empirical Power and
Specification of Test Statistics," Journal of Financial Economics 41, 359-399.
Berger, A.N., R. DeYoung, and G.F. Udell, 2001, "Efficiency Barriers to the Consolidation of the European
Financial Services Industry," European Financial Management 7, 117-130.
Berger, A.N. and D. Humphrey, 1992, "Megamergers in Banking and the Use of Cost Efficiency as an
Antitrust Defense," The Antitrust Bulletin 37, 541-600.
Black, H.A., R.W. Bostic, B.L. Robinson, and R.L. Schweitzer, 2005, "Do CRA-Related Events Affect
Shareholder Wealth? The Case of Bank Mergers," The Financial Review 40, 575-586.
Bleeke, J. and D. Ernst, 1991, "The Way to Win in Cross-Border Alliances," Harvard Business Review 69,
127-135.
Boubakri, N., G. Dionne, and T. Triki, 2006, "Consolidation and Value Creation in the Insurance In
dustry: The Role of Governance," HEC Montreal Working Paper. Available at: http://neumann.hec.ca/
gestiondesrisques/dim/Papers/Boubakri-Dionne-Triki.pdf.
Buch, CM. and G. DeLong, 2004, "Cross-Border Bank Mergers: What Lures the Rare Animal?" Journal
of Banking and Finance 28, 2077-2102.
Buchheit, L.C., 1985, "Is Syndicated Lending a Joint Venture?" International Financial Literature Review
4,12-15.
Champagne, C. and L. Kryzanowski, 2007, "Are Current Syndicated Loan Alliances Related to Past Alliances?" Journal of Banking and Finance 31,3145-3161.
Cornett, M.M., G. Hovakimian, D. Palia, and H. Tehranian, 2003, "The Impact of the Manager-Shareholder
Conflict on Acquiring Bank Returns," Journal of Banking and Finance 27, 103-131.
Cybo-Ottone, A. and M. Murgia, 2000, "Mergers and Shareholder Wealth in European Banking," Journal
of Banking and Finance 24, 831-859.
Das, T.K. and B.-S. Teng, 1998, "Between Trust and Control: Developing Confidence in Partner Cooperation
in Alliances," Academy of Management Review 23, 491-512.
DeLong, G.L., 2001, "Stockholder Gains from Focusing Versus Diversifying Bank Mergers," Journal of Financial Economics 59, 221-252.
DeLong, G.L., 2003, "Does Long-Term Performance of Mergers Match Market Expectations? Evidence
from the US Banking Industry," Financial Management 32, 5-25.
French, K.R. and J.M. Poterba, 1991, "Investor Diversification and International Equity Markets," American
Economic Review 81, 222-226.
Focarelli, D., F. Panetta, and C. Salleo, 2002, "Why Do Banks Merge?" Journal of Money, Credit and
Banking 34, 1047-1066.
Froot, K.A., 1989, "Consistent Covariance Matrix Estimation with Cross-Sectional Dependence and Het
eroskedasticity in Financial Data," Journal of Financial and Quantitative Analysis 24, 333-355.
Group of Ten, 2001, Report on Consolidation in the Financial Sector (January).
Gulati, R., 1995, "Does Familiarity Breed Trust? The Implications of Repeated Ties for Contractual Choice in Alliances," Academy of Management Journal 38, 85-112.
Hagedoorn, J. and B. Sadowski, 1996, "Exploring the Potential Transition from Strategic Technology Partnering to Mergers and Acquisitions," Maastricht Economic Research Institute on Innovation and
Technology Working Paper.

568 Financial Management . Autumn 2008
Harjoto, M., DJ. Mullineaux, and H.-C. Yi, 2006, "A Comparison of Syndicated Loan Pricing at Investment
and Commercial Banks," Financial Management 35, 49-70.
Honeycutt, T.C., 1975, "The Microeconomic Consequences of Corporate Mergers: A Comment," Journal
of Business 48, 261-21 A.
Houston, J.F. and M.D. Ryngaert, 1994, "The Overall Gaining from Large Bank Mergers," Journal of
Banking and Finance 18, 1155-1176.
Hughes, J.P., L.J. Mester, and C. Moon, 2001, "Are Scale Economies in Banking Elusive or Illusive?
Incorporating Capital Structure and Risk into Models of Bank Production," Journal of Banking and Finance 25,2169-2208.
Ismail, A. and I. Davidson, 2005, "Further Analysis of Mergers and Shareholder Wealth Effects in European Banking," Applied Financial Economics 15, 13-30.
Jensen, M.C., 1993, "The Modern Industrial Revolution, Exit and the Failure of Internal Control Systems,"
Journal of Finance 48, 831-880.
Jensen, M.C. and W.H. Meckling, 1976, "Theory of the Firm: Managerial Behavior, Agency Costs and
Ownership Structure," Journal of Financial Economics 3, 305-360.
Karceski, J., S. Ongena, and D.C. Smith, 2005, "The Impact of Bank Consolidation on Commercial Borrower
Welfare," Journal of Finance 60, 2043-2082.
Kogut, B., 1991, "Joint Ventures and the Option to Expand and Acquire," Management Science 37, 19-33.
Lee, S.W. and D.J. Mullineaux, 2004, "Monitoring, Financial Distress, and the Structure of Commercial
Lending Syndicates," Financial Management 33, 107-130.
Lev, B. and G. Mandelker, 1975, "Rejoinder to Reid and Honeycutt," Journal of Business 48, 281-282.
Loughran, T. and A. Vijh, 1997, "Do Long-Term Shareholders Benefit from Capital Acquisitions?," Journal
of Finance 52, 1765-1790.
Louis, H., 2004, "Earnings Management and the Market Performance of Acquiring Firms," Journal of Financial Economics 74, 121-148.
Madura, J. and K.J. Wiant, 1992, "Long-Term Valuation Effects of Bank Acquisitions," Journal of Banking and Finance 18, 1135-1154.
Mester, L.J., 1999, "Banking Industry Consolidation: What's a Small Business to Do?" Business Review,
Federal Reserve Bank of Philadelphia, (January/February) 3-16.
Mitchell, M.L. and E. Stafford, 2000, "Managerial Decisions and Long Term Stock Price Performance,"
Journal of Business 73, 287-329.
Nippani, S. and K.W Green, Jr., 2002, "The Banking Industry after the Riegle-Neal Act: Re-Structure and
Performance," Quarterly Review of Economics and Finance 42, 901-909.
Palepu, K.G., 1986, "Predicting Takeover Targets; A Methodological and Empirical Analysis," Journal of Accounting and Economics 8, 3-35.
Pichler, P. and W Wilhelm, 2001, "A Theory of the Syndicate: Form Follows Function," Journal of Finance
56, 2237-2264.
Pilloff, S.J., 1996, "Performance Changes and Shareholder Wealth Creation Associated with Mergers of
Publicly Traded Banking Institutions," Journal of Money, Credit and Banking 28, 294-310.
Pilloff, S.J. and A.M. Santomero, 1997, "The Value Effects of Bank Mergers and Acquisitions," Wharton
Financial Institutions Center Paper 97-107.

Champagne & Kryzanowski * Past Syndicate Alliances and Consolidation of Financial Institutions 569
Porrini, P., 2004, "Can a Previous Alliance between an Acquirer and a Target Affect Acquisition Perfor
mance?," Journal of Management 30, 545-562.
Rau, P. and T. Vermaelen, 1998, "Glamour, Value, and the Post-Acquisition Performance of Acquiring
Firms," Journal of Financial Economics 49, 223-253.
Reid, S.R., 1975, "The Microeconomic Consequences of Corporate Mergers: A Comment," Journal of
Business 48, 275-280.
Rhoades, S.A., 2000, "Bank Mergers and Banking Structure in the United States, 1980-98," Board of
Governors of the Federal Reserve System, Staff Study No. 174 (August).
Roll, R., 1986, "The Hubris Hypothesis of Corporate Takeovers," Journal of Business 59, 197-217.
Rugman, A., 1981, Inside the Multinationals: The Economics of Internal Markets, London, Croom Helm.
Shleifer, A. and R.W Vishny, 1989, "Management Entrenchment: The Case of Manager-Specific Invest
ments," Journal of Financial Economics 25, 123-139.
Travlos, N.G., 1987, "Corporate Takeover Bids, Methods of Payment and Bidding Firms Stock Returns," Journal of Finance 42, 943-963.
Vennet, R.V, 1996, "The Effects of M&As on the Efficiency and Profitability of EC Credit Institutions," Journal of Banking and Finance 20, 1531-1558.
Wright, M. and A. Lockett, 2003, "The Structure and Management of Alliances: Syndication in the Venture
Capital Industry," Journal of Management Studies 40, 2073-2102.
Zhang, H., 1995, "Wealth Effects of U.S. Bank Takeovers," Applied Financial Economics 5, 329-336.