Embed Size (px)
Citation preview
34 ISSN 1849-5664 (online) http://researchleap.com/category/international-journal-of-management-science-and-business-administrationISSN 1849-5419 (print) International Journal of Management Science And Business Administration Vol. 1, No. 11, October 2015, pp. 34-46
International Journal of Management Science and
Business Administration
The Impact of Oil and Gold Prices on the GDP Growth: Empirical
Evidence from a Developing Country
Haroon ur Rashid KhanKing AbdulAziz University, Jeddah, Kingdom of Saudi Arabia
Email (corresponding author): [email protected]
Abstract: The global hike in the prices of gold and oil made an impact in the economy of the countries around the
globe. The impact has varied in the developing and developed countries. The research is a preliminary investigation
into the subject matter. It has plunged into the relation of these two commodities prices with the GDP of an emerging
economy of Pakistan. The findings give a compelling insight into the subject matter. The study used the stock market
data with the average Gold and Oil prices from the period of 1997 to 2014. The data analysis results show that gold and
oil prices have a significant impact on GDP.
Key words: Oil and gold prices, Impact on GDP, Emerging economies, Pakistan
1. IntroductionGlobally economic downturn redirected the inventory marketplaces to excessive movements and to problems especially
in the last two decades. The inventory exchange risks negatively affect marketplaces and push the financial industry,
which in the end cause problems in the real economy. The stock industry activity is the result of variation in supply and
demand of the actual resources, comprising the value having of the organization by the traders. The company's earning
design, profit edge, cash flows treams, new technology, business having and the company's development with regard to
the geographic and product profile variation along with management popularity, are the major internal aspects
impacting the company's inventory price. Pakistan with a in habitants of more than 150 thousand has been on the
direction of increasing GDP growth in the last few decades, but since the last financial season the scenario is not very
audio. The ongoing increase in oil costs in the last few decades is regarded as one of the contributory aspect Power
industries has a direct link with the financial growth of a nation. In range with the increasing amount of growth of
GDP, requirement for energy has also expanded quickly. In the power mix for the year 2005-06, oil records for 32 % of
the complete energy used in Pakistan. Although the energy with which oil is used in complete energy intake has
dropped in the last few decades but still it is the second biggest resource of your used after organic gas, which records
for 39percent.In Pakistan there are currently three Inventory exchanges: Karachi Stock Lahore Stock Return and the
Islamabad Stock Return. Among these three inventory marketplaces Karachi inventory Return is the biggest with
regards to its industry capital and number of detailed organizations. However, governmental uncertainty has always
been the distressing factor for the Karachi Stock Market. Up to2010, KSE has number of US$ 12 billion dollars and
industry Capitalization US$ 32.5 billion dollars (Karachi Stock Exchange, 2011).The investment market performs a
prominent part in the financial growth because it exchanges the resources from the saving bed to the debtors, but it is
only possible if it works efficiently. Oil cost volatility has taken the attention of the scientists as an essential
determinant impacting the macroeconomic activities and eventually the inventory industry spiders in different styles in
various parts of the world particularly since the experience of first oil problems in 1973.The creating nation like
Pakistan is intensely reliant on the oil as an feedback for almost every commercial industry, for instance: transport
industry, concrete industry, power creation industry etc. In other creating nations power is produced mainly from
inexpensive and alternative sources like water, breeze, atomic energy etc but in Pakistan more than 50% of power is
Haroon ur Rashid KhanThe Impact of Oil and Gold Prices on the GDP Growth: Empirical Evidence from a Developing Country
35 ISSN 1849-5664 (online) http://researchleap.com/category/international-journal-of-management-science-and-business-administrationISSN 1849-5419 (print) International Journal of Management Science And Business Administration Vol. 1, No. 11, October 2015, pp. 34-46
produced by using oil, therefore increase in oil costs, improves feedback costs, consequently leading to the
development of manufacturing cost and lack of employment rate (Loungani, 1986).In Pakistan it is noticed that price of
production is straight affected by the changes in the oil costs. Oil costs are constantly controversial and stay an
important varying in identifying the business activities of any nation. The size of oil costs improve relies on the i)-
discuss of the cost of oil in overall GDP, ii)- the level of dependency on oil (total value of transfer oil) and iii)- intake
of oil locally, and iv)- dependency on substitute resources of energy. Improved in oil cost causes different results
together on net oil importers and net oil exporters (combining both raw and products).Consequently, the oil cost
surprise has an essential impact on development around the globe financial systems due to restricted buying energy by
oil importers. Oil cost is essential aspect to determine the industrial production which eventually results in equity
market costs. Surge in Gold Costs in Pakistan was caused by development of gold prices in worldwide value market.
However, it is difficult to separate the separated impact of change in gold prices due to worldwide development of gold
cost and other aspects. Gold is regarded as a store of value (without escalation) whereas shares are regarded as come
back on value (escalation from potential real price increase plus dividends).In 2005 before the international economic
downturn, the cost of gold was around at the stage US$415 per ounces which surpassed the restrict of US$1000 per
ounces in Goal 2008 while currently it has achieved at the history size of US$1421 per ounces in Nov 2010 (Forex,
2011).The relationship between affordable interest rate and gold cost with inventory cost are negative. Gold costs have
not been integrated into rising costs characteristics, nor has the connection between rising costs and resource costs been
carefully researched., With the large use of gold in Pakistan1 and the incorporation of its marketplaces with worldwide
marketplaces, it is affordable to believe that both factors may contain some details about rising costs. The theoretical
connection between resource costs (gold and other stocks) and rising costs can be analyzed through a wide range of
programs. Marx‟s concept of cash was important in describing this connection before the adopting of a fiat cash
program. Gold works as a good store of value that is predicted to impact the amount of rising prices favorably. If we
talk about the connection between oil costs and gold costs there seems to are available no direct connection. However,
if we analyze this connection in an inflationary environment, the connection becomes clear. In fact common price range
is straight changed with the changes in the oil costs.It is claim that any increase in costs of oil costs will eventually
increases the costs of gold.GDP (gross domestic product) is most prominent and one of the main signs used to evaluate
the situation of any nation's economic system. The financial worth of all the services and completed products created
enclosed by a nation's boundaries in a accurate time frame is known as GDP. It is normally calculated in yearly
foundation. The financial commitment plays a crucial role in economic development. The Trade Balance (balance of
trade) also known as net exports, is the difference among the financial principles of country‟s exports and country‟s
imports of outcome over a certain interval in an economic system. Business balance (Balance of trade) is the significant
aspect of balance of expenses in a nation's. A nation has a situation of trade lack when their import is more than it
exports; the opposite situation is known as trade excess. Pakistan has to need a ongoing long lasting financial
development of 7 % to increase its common living requirements and significance full financial development. But it is
noticed that Pakistan‟s economic system hardly ever develop more than 5 % since its freedom. The financial
development of Pakistan has dropped since 2008 and considered at 2.6 %. The predicted development this year is
around 3 % which is low then the focused development 4.2 % and meanwhile the navigator Japan is predicted to
develop more than 7.5 % in that year. Low financial development is primary barrier to reduced hardship in the country.
It is considered that from 2008 to 2010 Pakistan‟s hardship is improved from 22.3 % to 37 %.Pakistan‟s also reduced
its worldwide competition by decreasing from 92nd place from 142 nations to 118th place revealed by World
Economic Community (Amjad Bashir, 2012).Pakistan total obligations such as financial obligations are over Rs. 12
Billion which highest possible involve public financial obligations. Government of Pakistan also obtained Rs. 615
billion dollars from private industry investment. Pakistan‟s exterior financial obligations and obligations improved and
approximated that if that pattern ongoing it achieved at US $ 73 billion dollars in 2015. The average interest amount in
Pakistan is around 12.75 % but at the same time the rising prices is standing at 14 % which also effect the financial
growth of Pakistan. Restoration of its financial development and getting back its aggressive position, is highly rely that
Pakistan is known as the smallest tax to GDP percentages among all other creating financial systems and status at
153rd from total 154 nations (Pakistan Economic outlook, 2010).how Pakistan perform its serious macro-economic
movements due to financial slippages, energy downturn and low business. The long term improve in the oil costs in the
past few years is regarded as one of the causative factors. Power department has a directly organization with the
financial progression of a financial system. In comparison, with the improving development speed of GDP,
requirement for oil as well as has also designed easily.%). Reduce in energy focus is calculated as the mainly able way
for losing vulnerability to oil movements (Bacon, 2005).The oil being the second significant source of energy used
along through roughly a constant speed of its manufacturing. Pakistan is seriously a few the oil imports from the Center
Haroon ur Rashid KhanThe Impact of Oil and Gold Prices on the GDP Growth: Empirical Evidence from a Developing Country
36 ISSN 1849-5664 (online) http://researchleap.com/category/international-journal-of-management-science-and-business-administrationISSN 1849-5419 (print) International Journal of Management Science And Business Administration Vol. 1, No. 11, October 2015, pp. 34-46
Eastern exporters (Saudi Arabic have a important role). Approximately 82 % of the oil and oil items requirement in the
nation is provide through imports. Governmental uncertainty in oil generating areas has affected on oil cost that‟s why
the political condition in the Middle Eastern is of globally anxiety. It is noticed that the time sequence data of separate
varying and depending varying (Oil cost, Oil supply, oil requirement, Total Household manufacturing of Pakistan,
Community industry financial commitment, personal industry financial commitment and Trade balance) have a pattern
and also not fixed. The straight line regression design is used to find out the impact of oil cost movements and the other
macroeconomic factors on the GDP. Trade Stability has important impact on Total domestic manufacturing at 5%
stage of importance. Meanwhile, the personal industry financial commitment has a minimal impact on Total domestic
manufacturing of at 10% stage of importance but oil cost movements and public financial commitment is not important
impact on the Total domestic manufacturing. The Linear Regression Model explain that these separate varying
determine 90% about the reliant varying Report consists of three chapters, having the essential data and conversation
concerning to the study objectives. A brief feature of the every of the chapter is as under:
2. Literature ReviewLee et al. (1995) exposed the balance of asymmetric results in the interval before and after 1985 and whether or not it
relied on other factors. The consequences of this literary works are that oblique transmitting systems may be the
essential indicates by which oil cost bumps macroeconomic results have.
Federer (1996) targeted on three possible ways to focus on the asymmetric relationship: reverse inflationary financial
plan, sectoral bumps, and doubt, besides some direct programs that contains the designs of actual levels out (supposes
that oil cost improves lead to rising prices which reduces the quality of actual levels out in the systems), the earnings
exchange design (describing earnings exchange between oil publishing and oil dispatching countries) and the potential
outcome design (suggesting that oil and capital are enhanced, so that an increasing oil cost reduces the economy's
effective capacity). He assumed that since the last three designs have a symmetrical regards between oil cost changes
and outcome development, therefore they can be omitted as there is asymmetry in the oil costs. At the same time oil
cost improves help estimate outcome development regardless of financial plan factors. In addition, financial plan
reaction to the loss of actual oil costs bears much resemblance to the financial plan reaction to oil cost increase.
Therefore, asymmetric financial plan reactions can only describe an aspect of the asymmetric oil price-output
connection. Further, sectoral bumps and doubt programs could account for aspect of the asymmetry effects. Graham
(2001) analyzed how there is short-term connections and long-term stability between the gold cost and inventory
values. According to this study there is no apparent connection in the lengthy run, but in the brief run, the gold cost is
suffering from the inventory cost.
Cruz (2002) assessments the short-run and long-run relationship of gold costs and inventory market profits adducing a
weak negative regards between inventory spiders and gold costs in the short-run and no regards in the long-run. Azizi
(2004) analyzed relationship between rising prices, come back and Inventory cost catalog in Iran, by using econometric
methods. The researchers results indicate that rising prices describes money come back catalog and complete come
back (price and cash) but it does not describe the stock cost catalog. On the other hand, money profits, complete profits
(price and cash) and stock cost catalog do not describe rising prices.
Quiros (2005) analyzed the relationship between oil cost bumps and commercial manufacturing and also between the
oil cost bumps and inventory profits. The results revealed that the increases in oil cost adversely impacts the inventory
profits and commercial manufacturing, and such impacts are also mathematically significant but affect is stronger on
inventory profits than on commercial manufacturing.
Basher and Sadorsky (2006) found strong evidence that oil cost risk effects inventory cost profits in growing
marketplaces although the exact connection somewhat is dependent upon the information frequency being used. The
depending connection is not, however, shaped. The study revealed that oil cost increases have a beneficial impact on
excess inventory exchange profits for daily and per month information, in growing marketplaces, whereas for every
week and per month information, oil cost reduces have beneficial and significant effects on growing industry profits.
Eric et al. (2006) indicates that there is a long-term connection between the cost of gold and the US cost range. Second,
the US cost range and the cost of gold move together in a mathematically significant long-run connection assisting the
view that a one % improve in the common US cost range results in a one % improve in the cost of gold. There was a
positive connection between gold cost motions and changes in the US rising prices, US rising prices motions and credit
Haroon ur Rashid KhanThe Impact of Oil and Gold Prices on the GDP Growth: Empirical Evidence from a Developing Country
37 ISSN 1849-5664 (online) http://researchleap.com/category/international-journal-of-management-science-and-business-administrationISSN 1849-5419 (print) International Journal of Management Science And Business Administration Vol. 1, No. 11, October 2015, pp. 34-46
risk. The study also found a damaging connection between changes in the gold cost and changes in the US money
trade-weighted exchange amount and the gold rental amount.
Ghani (2007) examined that we created about 20 % of our oil specifications. Due to drawback initiatives to excellent
new supplies and higher intake, this amount will drop arriving next years which will outcome in quantitative demands.
H-Kazim (2007) examined that Pakistan's daily raw oil manufacturing has stayed considerably low as opposed to
demand. To accomplish development of alternative resources of energy, the create nations are trying to keep raw oil
costs above $50 a gun barrel. However, the fault OPEC for increasing raw oil costs. Saleem (2007) analyzed that the
government opinions energy costs every two several weeks, but despite improving in international oil costs, energy
costs did not improve in the nation during the last 19 several weeks to preserve the community from additional
financial pressure. According to nanny Fund Reverend Dr. Salman Shah, the energy costs modification will not be
done in one go.
Liao and Chen (2008) analyzed the effect of oil and gold costs on personal sectors rather than the whole industry and
discovered that both the digital and rubberized commercial sub-indices are affected by the variation in oil costs and the
connections among oil costs, digital commercial sub- spiders and rubberized commercial sub-indices are determined to
be beneficial. Malik, (2008) analyzed the possible results and faces provided of improving in oil costs in Pakistan. The
ongoing improve in the worldwide oil costs had impacted adversely the BOP (balance of payment) and the budgeting
place of Pakistan and included inflationary demands on the economic system. In a less western world like Pakistan,
most of the energy is used by transporters, farm owners and large devices and ultimately customers have to pay, which
results their houses price range through the improve in the meals costs. Asghar (2008) considered and known as winter
energy supply crisis for the year 2008, for such a huge cost of $100 a gun barrel in early 2008, rather ongoing increase
in the cost of oil and making new information every next day, passionate by an expansive money, governmental
uncertainty. A slither in the money was one aspect behind the conference in oil prices. Some customers purchased oil in
variety to secure themselves against the consistently decline money. The ongoing growth in cost of oil designed
problems for oil publishing nations as they have to keep the high economic cost.
Malik (2008) the government presented a Price Differential Declare (PDC) on Aug 16, 2004, the purpose was to
compensate oil companies for the subsidy to customers, thus having a damaging effect on government exchequer.
Secondly, oil petroleum industry and together records for a significant discuss of government earnings. Taxation on oil
products is the biggest resource of oblique tax earnings in Pakistan. With the development of international oil prices
government modified its oil development impose (major resource of oblique taxes) thus having a damaging effect on
total earnings.
Ramos and Veiga (2010) analyzed the asymmetric results of oil cost variations in worldwide inventory market places
and found that oil cost rises push worldwide inventory marketplaces, but the falls in oil cost do not necessarily increase
inventory exchange profits. The study further revealed that the movements of oil cost have a negative impact on
worldwide inventory exchange profits. Both of these results apply only to inventory marketplaces of the western world
and emerging industry profits are not proved to be sensitive to oil cost variations. Sharma & Mahendru (2010) analyzed
the impact of Macro-Economic factors on inventory values in India and used the macroeconomic factors like change in
return amount, forex trading supplies, inflation rates and gold costs. This study covers the period of Jan 2008 to Jan
2009 and results revels that return amount and gold costs highly affect the inventory values.
Zang et al. (2010) evaluate the co integration connection and causality between gold and raw oil prices. The research
discovers that there are reliable styles between the raw oil cost and gold cost with significant positive connection
during the testing period. The research further indicates that long lasting stability between the two marketplaces and the
raw oil cost change linearly Granger causes the movements of gold cost. Based on the common effective cost between
the two marketplaces, the participation of the raw oil cost seems bigger than that of gold cost. Mu Lan et al. (2010) uses
daily data and time sequence method to discover the effects of variations in raw oil cost, gold cost. The results show
that there exist co integrations among variations in oil cost, gold cost and forex prices of the money vs. various foreign
returns, and the inventory marketplaces in Malaysia, Asia, Taiwan and Chinese suppliers. Thai-Ha Le and Youngho
Alter (2011) made a research on “Dynamic Connections between the Cost of Oil, gold and Financial Factors in Japan:
A Range Examining Approach” and they verified that the cost of gold and inventory, among others, can help type
objectives of higher rising prices over time. In the short run, only gold price affects the interest rate in Asia. Overall the
Haroon ur Rashid KhanThe Impact of Oil and Gold Prices on the GDP Growth: Empirical Evidence from a Developing Country
38 ISSN 1849-5664 (online) http://researchleap.com/category/international-journal-of-management-science-and-business-administrationISSN 1849-5419 (print) International Journal of Management Science And Business Administration Vol. 1, No. 11, October 2015, pp. 34-46
results of this research could benefit both the Japanese people financial power and traders who keep the Japanese
people yen in their domain portfolios.
Yen-Hsien Lee (2012) analyzed the asymmetric long-run connection between raw oil and gold futures trading. This
research utilizes the strength limit error-correction design with general autoregressive depending hetero skedastic town
to examine asymmetric cointegration and causal connections between Western Florida Advanced Crude Oil and gold
costs in the futures trading market. From the research it is obvious that an asymmetric long-run modification prevails
between gold and oil.
Guo and Kliesen (2005) also found the adverse and important effect of oil futures trading prices on upcoming GDP,
and this effect becomes more important after oil cost changes are also involved in the regression to control for the
symmetrical effect. Oil cost bumps and movements and financial actions have been performed in the perspective of
designed financial systems. Analysis concerning the effect of oil cost movements in the perspective of creating nations
is very restricted. The reason for the lack of research on the creating nations is may be their less dependency on oil. It is
only lately, that these nations are suffering from improved requirement for energy.
3. Research MethodologyThe main goal of methodology is to describe various tools and techniques employed for the collection, analysis and
interpretation of data, related to the study under investigation.
1.1. Collection of Data This study use secondary data and data collection from different websites, journals, books, also from different media
reports. The collection of data which include with humans beings, which are mainly responsive in personality. Further
and sharp procedures are necessary to obtain information from them. In such studies it is fairly vital that through
progress of dimension tool, all aspects of information value and person character must be in use into report. As the
current study was planned to gather information during field survey, Karachi stock exchange, Lahore stock exchange,
Islamabad stock exchange get data year and monthly and a feedback form comprised of closed and open-ended data.
This study is used the monthly stock values of KSE100 return (Pakistan) and monthly average gold prices (measured in
grams) and oil prices for the period of 1997 to 2014.
3.2 Variables Anything in the experiment that could be altered and influence the results of the investigation is a variable. Setups of an
experiment should have only one variable that is changed at a time. By having only one variable that is changed, you
can be somewhat certain that the results of the experiment were effected by that one variable. They have used four
variables gold, oil and stock market return, GDP. The gold prices or oil prices are independent variables and the stock
market return or GDP is dependent variables.
3.2.1 Gold Prices In Pakistan Gold Costs has proven ongoing improve from last many decades. Gold Costs in Pakistan has surpassed the
restrict of Rs. 40 million truly and later on it went to above Rs. 55 million per Tola. This impact of improving in gold
prices was also seen in worldwide gold market places in these decades.
3.2.3 Oil Prices It is observed that oil costs in its industry went down but meanwhile, in the perspective of Saudi its earnings went way
up due to oil removal and household low cost. OPEC had set an oil cost at 18 money per package in Dec, 1986, but that
cost was not ongoing for years and decreased in the begin of 1987. After that Iraqi and Kuwait war pay a crucial part to
improved oil costs due to the uncertainty of oil provide in 1990. But after Beach war (Kuwait and Iraqi war) the oil cost
was observed a significant decreased until 1994 and achieved at the same cost which was in 1973. Later then in 1998,
the cost improved and goes toward resurgence due to decreased oil provide by OPEC and managed at the stage of 1.72
thousand bins in Apr, 1999. This plan made oil cost at 25 money per package.
Haroon ur Rashid KhanThe Impact of Oil and Gold Prices on the GDP Growth: Empirical Evidence from a Developing Country
39 ISSN 1849-5664 (online) http://researchleap.com/category/international-journal-of-management-science-and-business-administrationISSN 1849-5419 (print) International Journal of Management Science And Business Administration Vol. 1, No. 11, October 2015, pp. 34-46
3.2.3 Stock Market Return The performance of inventory return is a controversial issue in any nation because it plays a crucial role in global
financial aspects and markets due to its impact on corporate finance and business activities. The efficient inventory
return diversifies the domestic funds and triggers the productive investment projects, which flourish the financial
activities in a nation, but this is only possible if the inventory return has significant relationship with the
macroeconomic variables.
Rt = ( Pn - Po) x 100
Po
3.2.4 Gross Domestic Product (GDP) Gross Domestic Product GDP is the market value of goods and services produced within a selected geographic area
(usually a country) in a selected interval in time (often a year).
3.3 Hypothesis Ho1: There is no significant relationship b/w Gold prices and GDPs Stock Index
H1: There is significant relationship between gold prices and GDPs stock index
HO2: There is no significant relationship between oil on GDPs stock Market
H2: There is significant relationship between oil on GDPs stock Market
3.4 Equations Gold = αO + β1 GDP + β2 Market Index + ԐO
Oil = αO + β1 GDP + β2 Market Index + ԐO
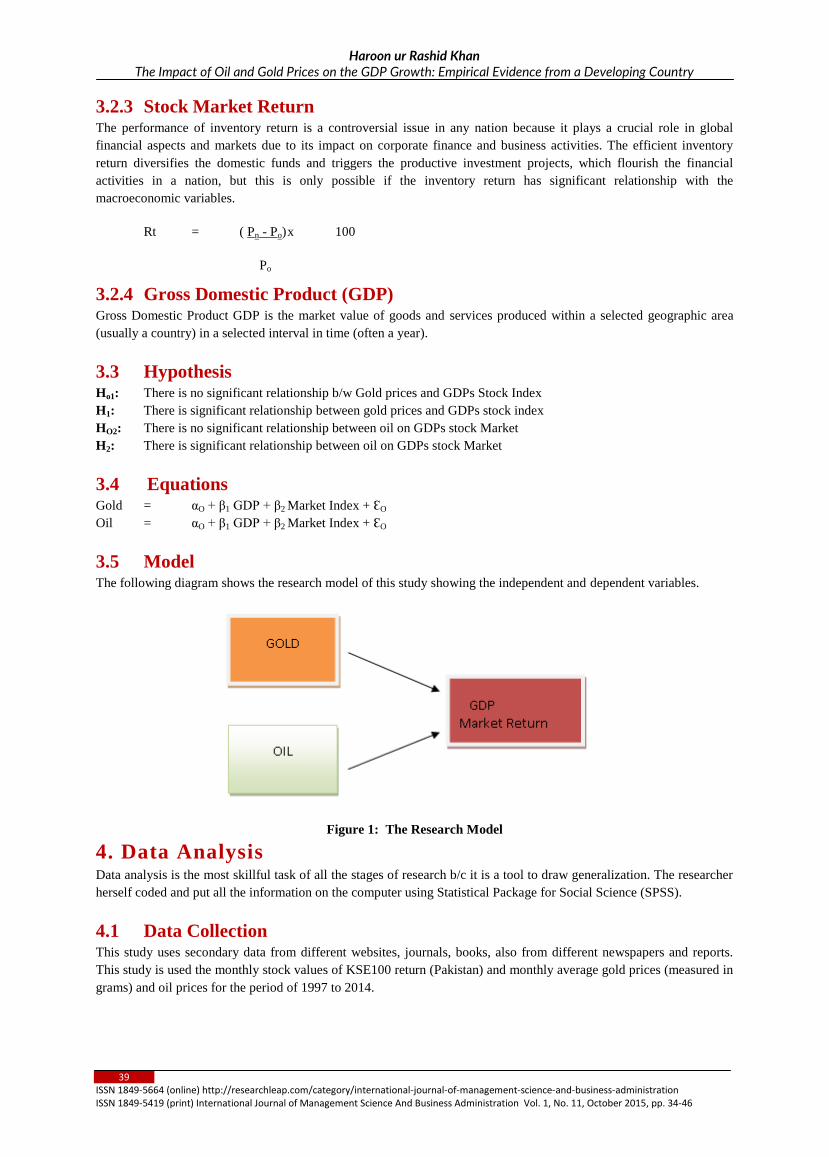
3.5 Model The following diagram shows the research model of this study showing the independent and dependent variables.
Figure 1: The Research Model
4. Data AnalysisData analysis is the most skillful task of all the stages of research b/c it is a tool to draw generalization. The researcher
herself coded and put all the information on the computer using Statistical Package for Social Science (SPSS).
4.1 Data Collection This study uses secondary data from different websites, journals, books, also from different newspapers and reports.
This study is used the monthly stock values of KSE100 return (Pakistan) and monthly average gold prices (measured in
grams) and oil prices for the period of 1997 to 2014.
Haroon ur Rashid KhanThe Impact of Oil and Gold Prices on the GDP Growth: Empirical Evidence from a Developing Country
40 ISSN 1849-5664 (online) http://researchleap.com/category/international-journal-of-management-science-and-business-administrationISSN 1849-5419 (print) International Journal of Management Science And Business Administration Vol. 1, No. 11, October 2015, pp. 34-46
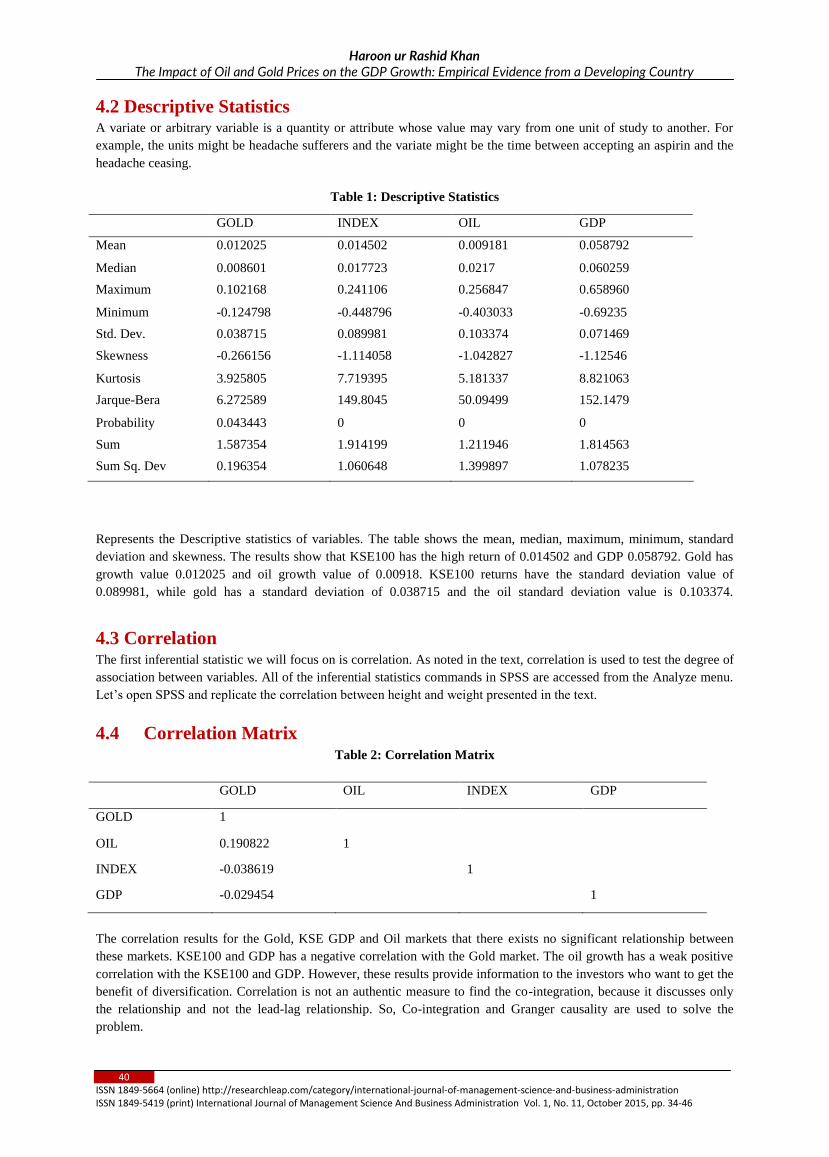
4.2 Descriptive Statistics A variate or arbitrary variable is a quantity or attribute whose value may vary from one unit of study to another. For
example, the units might be headache sufferers and the variate might be the time between accepting an aspirin and the
headache ceasing.
Table 1: Descriptive Statistics
GOLD INDEX OIL GDP
Mean 0.012025 0.014502 0.009181 0.058792
Median 0.008601 0.017723 0.0217 0.060259
Maximum 0.102168 0.241106 0.256847 0.658960
Minimum -0.124798 -0.448796 -0.403033 -0.69235
Std. Dev. 0.038715 0.089981 0.103374 0.071469
Skewness -0.266156 -1.114058 -1.042827 -1.12546
Kurtosis 3.925805 7.719395 5.181337 8.821063
Jarque-Bera 6.272589 149.8045 50.09499 152.1479
Probability 0.043443 0 0 0
Sum 1.587354 1.914199 1.211946 1.814563
Sum Sq. Dev 0.196354 1.060648 1.399897 1.078235
Represents the Descriptive statistics of variables. The table shows the mean, median, maximum, minimum, standard
deviation and skewness. The results show that KSE100 has the high return of 0.014502 and GDP 0.058792. Gold has
growth value 0.012025 and oil growth value of 0.00918. KSE100 returns have the standard deviation value of
0.089981, while gold has a standard deviation of 0.038715 and the oil standard deviation value is 0.103374.
4.3 Correlation The first inferential statistic we will focus on is correlation. As noted in the text, correlation is used to test the degree of
association between variables. All of the inferential statistics commands in SPSS are accessed from the Analyze menu.
Let‟s open SPSS and replicate the correlation between height and weight presented in the text.
4.4 Correlation Matrix Table 2: Correlation Matrix
GOLD OIL INDEX GDP
GOLD 1
OIL 0.190822 1
INDEX -0.038619 1
GDP -0.029454 1
The correlation results for the Gold, KSE GDP and Oil markets that there exists no significant relationship between
these markets. KSE100 and GDP has a negative correlation with the Gold market. The oil growth has a weak positive
correlation with the KSE100 and GDP. However, these results provide information to the investors who want to get the
benefit of diversification. Correlation is not an authentic measure to find the co-integration, because it discusses only
the relationship and not the lead-lag relationship. So, Co-integration and Granger causality are used to solve the
problem.
Haroon ur Rashid KhanThe Impact of Oil and Gold Prices on the GDP Growth: Empirical Evidence from a Developing Country
41 ISSN 1849-5664 (online) http://researchleap.com/category/international-journal-of-management-science-and-business-administrationISSN 1849-5419 (print) International Journal of Management Science And Business Administration Vol. 1, No. 11, October 2015, pp. 34-46
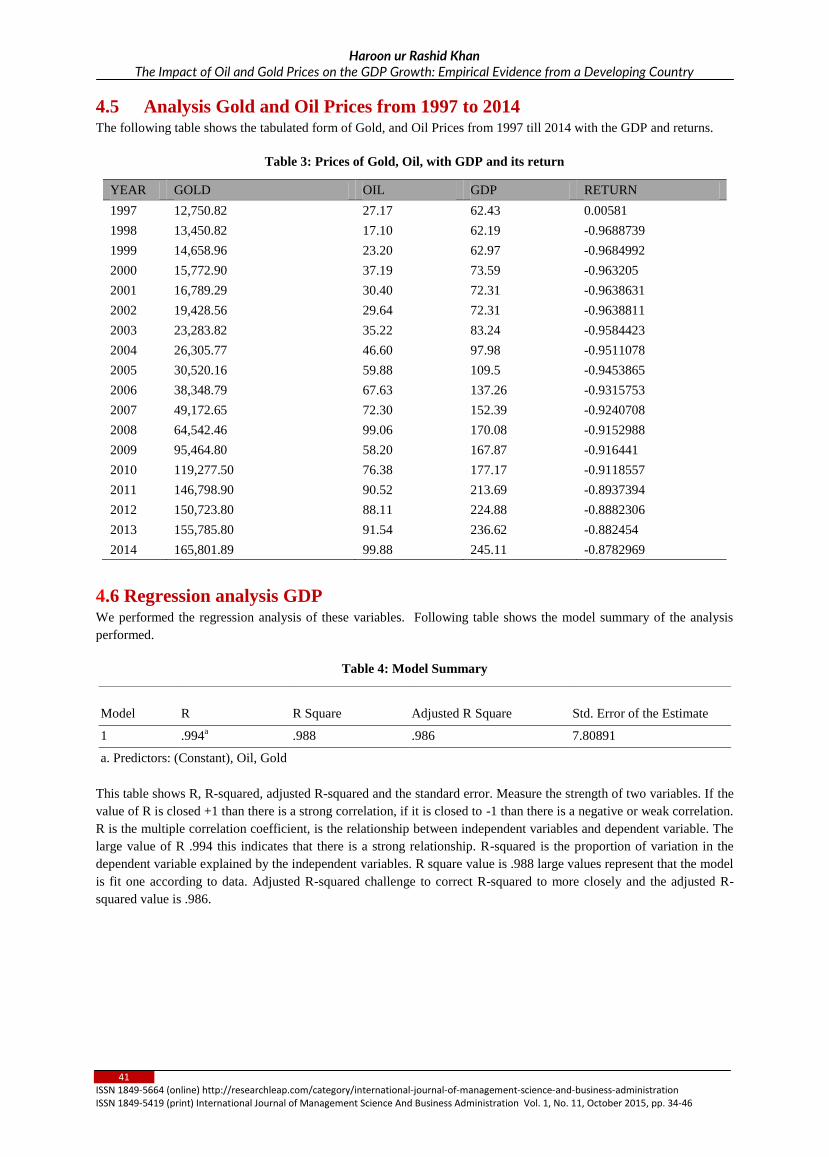
4.5 Analysis Gold and Oil Prices from 1997 to 2014 The following table shows the tabulated form of Gold, and Oil Prices from 1997 till 2014 with the GDP and returns.
Table 3: Prices of Gold, Oil, with GDP and its return
YEAR GOLD OIL GDP RETURN
1997 12,750.82 27.17 62.43 0.00581
1998 13,450.82 17.10 62.19 -0.9688739
1999 14,658.96 23.20 62.97 -0.9684992
2000 15,772.90 37.19 73.59 -0.963205
2001 16,789.29 30.40 72.31 -0.9638631
2002 19,428.56 29.64 72.31 -0.9638811
2003 23,283.82 35.22 83.24 -0.9584423
2004 26,305.77 46.60 97.98 -0.9511078
2005 30,520.16 59.88 109.5 -0.9453865
2006 38,348.79 67.63 137.26 -0.9315753
2007 49,172.65 72.30 152.39 -0.9240708
2008 64,542.46 99.06 170.08 -0.9152988
2009 95,464.80 58.20 167.87 -0.916441
2010 119,277.50 76.38 177.17 -0.9118557
2011 146,798.90 90.52 213.69 -0.8937394
2012 150,723.80 88.11 224.88 -0.8882306
2013 155,785.80 91.54 236.62 -0.882454
2014 165,801.89 99.88 245.11 -0.8782969
4.6 Regression analysis GDP We performed the regression analysis of these variables. Following table shows the model summary of the analysis
performed.
Table 4: Model Summary
Model R R Square Adjusted R Square Std. Error of the Estimate
1 .994a .988 .986 7.80891
a. Predictors: (Constant), Oil, Gold
This table shows R, R-squared, adjusted R-squared and the standard error. Measure the strength of two variables. If the
value of R is closed +1 than there is a strong correlation, if it is closed to -1 than there is a negative or weak correlation.
R is the multiple correlation coefficient, is the relationship between independent variables and dependent variable. The
large value of R .994 this indicates that there is a strong relationship. R-squared is the proportion of variation in the
dependent variable explained by the independent variables. R square value is .988 large values represent that the model
is fit one according to data. Adjusted R-squared challenge to correct R-squared to more closely and the adjusted R-
squared value is .986.
Haroon ur Rashid KhanThe Impact of Oil and Gold Prices on the GDP Growth: Empirical Evidence from a Developing Country
42 ISSN 1849-5664 (online) http://researchleap.com/category/international-journal-of-management-science-and-business-administrationISSN 1849-5419 (print) International Journal of Management Science And Business Administration Vol. 1, No. 11, October 2015, pp. 34-46
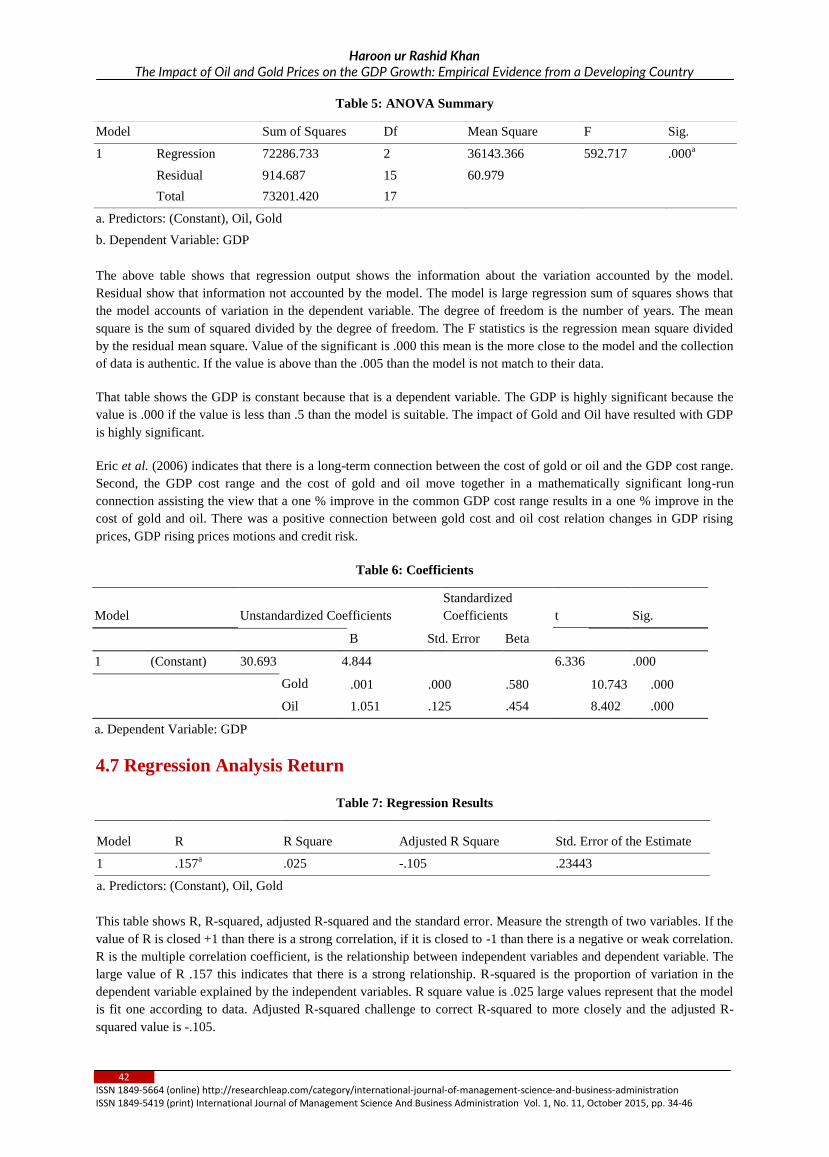
Table 5: ANOVA Summary
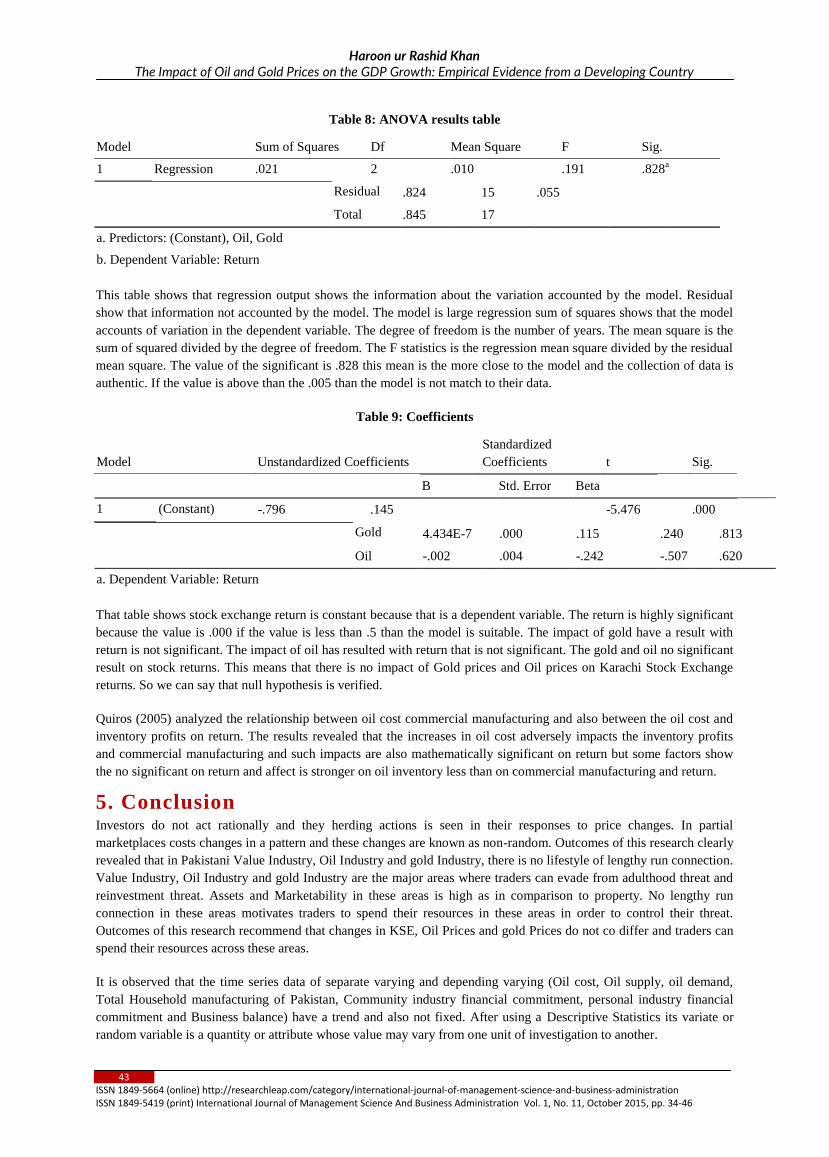
The above table shows that regression output shows the information about the variation accounted by the model.
Residual show that information not accounted by the model. The model is large regression sum of squares shows that
the model accounts of variation in the dependent variable. The degree of freedom is the number of years. The mean
square is the sum of squared divided by the degree of freedom. The F statistics is the regression mean square divided
by the residual mean square. Value of the significant is .000 this mean is the more close to the model and the collection
of data is authentic. If the value is above than the .005 than the model is not match to their data.
That table shows the GDP is constant because that is a dependent variable. The GDP is highly significant because the
value is .000 if the value is less than .5 than the model is suitable. The impact of Gold and Oil have resulted with GDP
is highly significant.
Eric et al. (2006) indicates that there is a long-term connection between the cost of gold or oil and the GDP cost range.
Second, the GDP cost range and the cost of gold and oil move together in a mathematically significant long-run
connection assisting the view that a one % improve in the common GDP cost range results in a one % improve in the
cost of gold and oil. There was a positive connection between gold cost and oil cost relation changes in GDP rising
prices, GDP rising prices motions and credit risk.
Table 6: Coefficients
B Std. Error Beta
Gold .001 .000 .580 10.743 .000
Oil 1.051 .125 .454 8.402 .000
4.7 Regression Analysis Return
Table 7: Regression Results
This table shows R, R-squared, adjusted R-squared and the standard error. Measure the strength of two variables. If the
value of R is closed +1 than there is a strong correlation, if it is closed to -1 than there is a negative or weak correlation.
R is the multiple correlation coefficient, is the relationship between independent variables and dependent variable. The
large value of R .157 this indicates that there is a strong relationship. R-squared is the proportion of variation in the
dependent variable explained by the independent variables. R square value is .025 large values represent that the model
is fit one according to data. Adjusted R-squared challenge to correct R-squared to more closely and the adjusted R-
squared value is -.105.
Model Sum of Squares Df Mean Square F Sig.
1 Regression 72286.733 2 36143.366 592.717 .000a
Residual 914.687 15 60.979
Total 73201.420 17
a. Predictors: (Constant), Oil, Gold
b. Dependent Variable: GDP
Model Unstandardized Coefficients
Standardized
Coefficients t Sig.
1 (Constant) 30.693 4.844 6.336 .000
a. Dependent Variable: GDP
Model R R Square Adjusted R Square Std. Error of the Estimate
1 .157a .025 -.105 .23443
a. Predictors: (Constant), Oil, Gold
Haroon ur Rashid KhanThe Impact of Oil and Gold Prices on the GDP Growth: Empirical Evidence from a Developing Country
43 ISSN 1849-5664 (online) http://researchleap.com/category/international-journal-of-management-science-and-business-administrationISSN 1849-5419 (print) International Journal of Management Science And Business Administration Vol. 1, No. 11, October 2015, pp. 34-46
Residual .824 15 .055
Total .845 17
This table shows that regression output shows the information about the variation accounted by the model. Residual
show that information not accounted by the model. The model is large regression sum of squares shows that the model
accounts of variation in the dependent variable. The degree of freedom is the number of years. The mean square is the
sum of squared divided by the degree of freedom. The F statistics is the regression mean square divided by the residual
mean square. The value of the significant is .828 this mean is the more close to the model and the collection of data is
authentic. If the value is above than the .005 than the model is not match to their data.
Table 9: Coefficients
B Std. Error Beta
Gold 4.434E-7 .000 .115 .240 .813
Oil -.002 .004 -.242 -.507 .620
That table shows stock exchange return is constant because that is a dependent variable. The return is highly significant
because the value is .000 if the value is less than .5 than the model is suitable. The impact of gold have a result with
return is not significant. The impact of oil has resulted with return that is not significant. The gold and oil no significant
result on stock returns. This means that there is no impact of Gold prices and Oil prices on Karachi Stock Exchange
returns. So we can say that null hypothesis is verified.
Quiros (2005) analyzed the relationship between oil cost commercial manufacturing and also between the oil cost and
inventory profits on return. The results revealed that the increases in oil cost adversely impacts the inventory profits
and commercial manufacturing and such impacts are also mathematically significant on return but some factors show
the no significant on return and affect is stronger on oil inventory less than on commercial manufacturing and return.
5. ConclusionInvestors do not act rationally and they herding actions is seen in their responses to price changes. In partial
marketplaces costs changes in a pattern and these changes are known as non-random. Outcomes of this research clearly
revealed that in Pakistani Value Industry, Oil Industry and gold Industry, there is no lifestyle of lengthy run connection.
Value Industry, Oil Industry and gold Industry are the major areas where traders can evade from adulthood threat and
reinvestment threat. Assets and Marketability in these areas is high as in comparison to property. No lengthy run
connection in these areas motivates traders to spend their resources in these areas in order to control their threat.
Outcomes of this research recommend that changes in KSE, Oil Prices and gold Prices do not co differ and traders can
spend their resources across these areas.
It is observed that the time series data of separate varying and depending varying (Oil cost, Oil supply, oil demand,
Total Household manufacturing of Pakistan, Community industry financial commitment, personal industry financial
commitment and Business balance) have a trend and also not fixed. After using a Descriptive Statistics its variate or
random variable is a quantity or attribute whose value may vary from one unit of investigation to another.
Table 8: ANOVA results table
Model Sum of Squares Df Mean Square F Sig.
1 Regression .021 2 .010 .191 .828a
a. Predictors: (Constant), Oil, Gold
b. Dependent Variable: Return
Model Unstandardized Coefficients
Standardized
Coefficients t Sig.
1 (Constant) -.796 .145 -5.476 .000
a. Dependent Variable: Return
Haroon ur Rashid KhanThe Impact of Oil and Gold Prices on the GDP Growth: Empirical Evidence from a Developing Country
44 ISSN 1849-5664 (online) http://researchleap.com/category/international-journal-of-management-science-and-business-administrationISSN 1849-5419 (print) International Journal of Management Science And Business Administration Vol. 1, No. 11, October 2015, pp. 34-46
Correlation is used to test the degree of association between variables. The design is used to find out the impact of oil
cost movements and the other macroeconomic factors on the GDP. KSE100 and GDP have a negative correlation with
the Gold market. The oil growth has weak positive correlation with the KSE100 and GDP. This study has used the
monthly stock values of KSE100 return (Pakistan) and monthly average gold prices (measured in grams) and oil prices
for the period of 1997 to 2014. Business Stability has an important impact on GDP manufacturing at 5% stage of
importance. Meanwhile, the personal industry financial commitment has a minimal impact on Total domestic
manufacturing of at 10% stage of importance but oil cost movements and public financial commitment is not important
impact on the GDP manufacturing. The data analysis results shows that gold and oil prices have a significant impact on
GDP. Our result is the same as of Eric et al. (2006). The results shows that gold and oil prices have no significant
impact on Return. Our results are the same as of Quiros (2005).
RecommendationsIn Pakistan, there is a need to re-view the infrastructure of investment in Gold and Oil.
I recommend to investment in Gold and Oil in Pakistan because it has a positive impact on the performance of the
Stock Market Returns and GDP Sectors.
References Afia Malik (2008). “How Pakistan is Coping with the Challenge of High Oil Prices”, MPRA Paper.
Ali, I., Rehman, K.U., Yilmaz, A.K., Khan, M.A., and Afzal, H. (2010).Causal relationship between macro-
economic indicators and stock exchange prices in Pakistan.African Journal of Business Management, 4(3),
312-319.
Amjad Bashir (2012). “Macroeconomic Stability and Growth: Building Competitiveness in Pakistan”, LCCI
Research Economic note.
Asghar, Arooj (2008), “Oil Prices- International Scenario” , Pakistan and Gulf Economist, 27 Oct-2 Nov,
2008.
Azizi, F., 2004. Empirical test of the relationship between influence & stock return in Tehran Stock Market,
Journal of economic researches, pp: 11-12.
Babaie A (2012). Macroeconomic Variables and Stock Price: New Evidence from Iran, Middle- East Journal
of Scientific Research, 11 (4): 408-415.
Bacon, Robert (2005) The Impact of High Oil Prices on Low Income Countries and the Poor. UNDP/ESMAP
(United Nation Development Programme/ World Bank.
Balasubramanian K (2004). "Supply Chain M anagement in Oil Management Distribution Business: A
Perspective on IT Alternatives and Issues", Whitepaper Infosys Technologies Ltd.
Banerjee, A., &Marcellino, M. (2006). Are there any reliable leading indicators for US inflation and GDP
growth? International Journal of Forecasting, 22, 137–151.
Bashar , Amanullah (2008), ““Interview: Muhammad Wasi Khan President and CEO Bosicar Pakistan LTD;
Huge Currence Developing Hurt Margins of Refining Sectoral Government Should Reduce Taxes to Check
Price Inflation”, 27 Oct-2 Nov, 2008.
Bashar ,Amanullah (2008), “Interview: Muhammad Wasi Khan President and CEO Bosicar Pakistan LTD;
Weaking of Us Dollar is the Major Factor for Oil Price Hike” Pakistan and Gulf Economist, Dec3-9, 2007.
Basher, S.A. and Sadorsky, P. (2006).Oil Price Risk and Emerging Stock Markets.Global Finance Journal.17,
224-251.
Cobo-Reyes, R., and Quiros, G. P. (2005).The Effect of Oil Price on Industrial Production and on Stock
Returns.Working Paper 05/18.Departamento de Teoria e HistoriaEconómica, Universidad de Granada.
Cynthia.-Y.-C. Lin (2011), „„ESTIMATING SUPPLY AND DEMAND IN THE WORLD OIL MARKET,‟‟
The Journal of Energy and Development, Vol. 34, Nos. 1 and 2, 2011.
Edward Morse and James Richard, (2002). “Alternative energy investments cause Saudi Arabia to flood the
market to tank oil prices”. The Battle for Energy Dominance, Foreign Affairs 81.2, Ebsco.
Eric J. Levin & Robert E. Wright, (2006), Short Run and Lon Run Determinants of the Price of Gold , World
Gold Council Research Study No. 32.
Federer, J. (1996) Oil Price Volatility and Macroeconomy, Journal of Macroeconomics, Vol. 18, pp.1-26
Forex (2011), available at: www.forex.pk/bullion-rates.php (accessed 06 January 2011)
Haroon ur Rashid KhanThe Impact of Oil and Gold Prices on the GDP Growth: Empirical Evidence from a Developing Country
45 ISSN 1849-5664 (online) http://researchleap.com/category/international-journal-of-management-science-and-business-administrationISSN 1849-5419 (print) International Journal of Management Science And Business Administration Vol. 1, No. 11, October 2015, pp. 34-46
Graham, S. (2001). “The Price of Gold and Stock Price Indices for the United States”, Adrienne Roberts FT
Personal Finance, pp.14 Karachi Stock Exchange (2011), „„Karachi Stock Exchange website‟‟, available at:
http://www.kse.com.pk/ (accessed 29 September 2011)
Guo, Hui and Kevin l. Kliesen (2005) Oil price Volatility and US Macroeconomic Activity, Federal Reserve
Bank of St. Louis Review, Vol. 86, No. 6, pp. 669-683
H-Kazami (2008), “ Country Needs Uninterrupted Supplies of Energy Products, Use f Indigenous Fuel Should
be Encouraged to Contain of Erosion of Foreign Exchange Reserves”, Pakistan and Gulf Economist, Dec3-9,
2007.
H-Kazim, Shabbir (2007), “Baluchistan‟s‟ Long Standing Claims over PPL”, Pakistan and Gulf Economist,
Dec3-9, 2007.
Hunt, B., Isard, P., and Laxton, D. (2001). “Macroeconomic Effects of Higher Oil Prices”.IMF Working Paper
No.WP/01/14.
InayatUllahMangla (2011). “Reconstructing the Performance of Pakistan‟s Political Economy: Another
Paradigm”, The Lahore Journal of Economics 16 : SE (September 2011): pp. 31-70.
Ishaque, Fozia (2007), “Sky rocking Oil Prices; A Challenge for Economic Managers”, Pakistan and Gulf
Economist, Dec 3-9, 2007.
Ishaque, Fozia (2008), “Oil Prices Hike; Pakistan Facing the Music” Pakistan and Gulf Economist, Dec3-9,
2007.
Kilian, L. (2009b), “Comment on „Causes and Consequences of the Oil Shock of 2007-08‟ by James D.
Hamilton,” Brookings Papers on Economic Activity, 1, Spring 2009, 267-278.
Lee, K. S. Ni, and R. A. Ratti (1995) oil Shocks and Macroeconomy: The Role of Price Variability, Energy
Journal, Vol. 16, No. 4, pp.39-56.
Levin, E.J. and Wright, R.E (2006). „„Short-Run and Long-Run Determinants of the Price of Gold‟‟, Study
No.32, World Gold Council Research, London, June 2006.
Liao, S.J. and Chen, J.T. (2008).The Relationship among Oil Prices, Gold Prices, and the Individual Industrial
Sub- Indices in Taiwan. Working Paper presented at International Conference on Business and Information
(BAI2008). Seoul, South Korea.
Loungani, P. (1986), Oil price shocks and the dispersion hypothesis, Review of Economics and Statistics,
Vol.58, pp.536–539.
Mahdavi, S., & Zhou, S. (1997). Gold and commodity prices as leading indicators of inflation: Tests of long-
run relationship and predictive performance. Journal of Economics and Business, 49(5), 475–489.
Malik, A. (2007) How is Pakistan coping with the Challenge of High oil prices? The Pakistan Development
Review, Vol. 46, No. 4 (Forthcoming)
Malik, Afia (2008), “How Pakistan Is Coping with the Challenges of High Oil Prices”, Pakistan Institute of
Development Economics, 2008.
Mashayekh, S. Moradkhani, H.H. and Jafari, M. (2011). Impact of Macroeconomic Variables on Stock
Market: The Case of Iran, 2nd International Conference on Business and Economic Research (2nd ICBER
2011) Proceeding, 350-361.
Mohammad, S.D., Hussain, A., Jalil, M.A., and Ali, A. (2009). Impact of Macroeconomics Variables on Stock
Prices: Empirical Evidence in Case of KSE (Karachi Stock Exchange). European Journal of Scientific
Research, 38(1), 96-103.
Muhammad BachalJamali, Asif Shah, Hassan JawadSoomro, Kamran Shafiq and FaizM.Shaikh, (April 2011).
“Oil Price Shocks: A Comparative Study on the Impacts in Purchasing Power in Pakistan”. Modern Applied
Science Journal.Vol.5, No. 2.
Mu-Lan Wang, Ching-Ping Wang Tzu-Ying Huang, (2010), Relationships among Oil Price, Gold Price,
Exchange Rate and International Stock Markets International Research Journal of Finance and Economics,
Issue 47 Euro Journals Publications.
NooreenMujahid, Roohi Ahmed and Khalid Mustafa, 2007.“Does Oil Price Transmit to Emerging Stock
Returns: A case study of Pakistan Economy”.
Pakistan Economic outlook, 2010.Viewed on http://spearheadresearch.org/SR _CMS/wp-
content/uploads/2011/02/PAKISTAN_ECONOMIC_OUTLOOK.pdf.
Pakistan Economic Survey 2010-2011.
Haroon ur Rashid KhanThe Impact of Oil and Gold Prices on the GDP Growth: Empirical Evidence from a Developing Country
46 ISSN 1849-5664 (online) http://researchleap.com/category/international-journal-of-management-science-and-business-administrationISSN 1849-5419 (print) International Journal of Management Science And Business Administration Vol. 1, No. 11, October 2015, pp. 34-46
Ramos, S., and Veiga, H. (2010).Asymmetric effects of Oil Price Fluctuations in International Stock
Markets.UC3MWorking Papers, Statistics and Econometrics.
Saleem, Kanwal (2007), “Fuel Prices to Push Inflation; Hit Economic Growth, Pakistan and Gulf Economist,
Dec3-9, 2007.
Sharma, G.D., Mahendru, M. (2010). „„Impact of Macro-Economic Variables on Stock Prices in India‟‟,
Global Journal of Management and Business Research, Vol. 10 Issue 7, pp.19-26
Siddiqui, R and A. Malik (2001) Debt and Economic growth in South Asia, The Pakistan Development
Review, Vol. 40, No 4.
Smith, G. (2002), The Price of Gold and Stock Price Indices in Europe and Japan
www.gold.org/value/stats/research/pdf/gold&eujpstockindicesfeb2002.pdf
Sohail, N., and Hussain, Z. (2009). Long-Run and Short-Run Relationship between Macroeconomic Variables
and Stock Prices in Pakistan: The Case of Lahore Stock Exchange. Pakistan Economic and Social Review,
47(2), 183-198.
Tetsuya NAKANISHI & Ryoichi KOMIYAMA, (2006)."Supply and Demand Analysis on Petroleum
Products and Crude Oils for Asia and the World” IEEJ.
Thai-Ha Le ,Youngho C(2011). Dynamic Relationships between the Price of Oil, Gold and Financial
Variables in Japan: A Bounds Testing Approach, Online at http://mpra.ub.uni-muenchen.de/33030/ MPRA
Paper No. 33030. The Evidence from Thailand. Int. J. Financ. Res 3(2): 105-114.
Zhang, Yue-Jun, Wei Yi-Ming (2010), The Crude Oil Market and the Gold Market: Evidence for co
integration, Causality and Price Discovery, Resource Policy, Sep, Vol. 35 Issue 3, p. 168-177, 10p.