Embed Size (px)
Citation preview
HAL Id: hal-00301049https://hal.archives-ouvertes.fr/hal-00301049
Submitted on 12 May 2003
HAL is a multi-disciplinary open accessarchive for the deposit and dissemination of sci-entific research documents, whether they are pub-lished or not. The documents may come fromteaching and research institutions in France orabroad, or from public or private research centers.
L’archive ouverte pluridisciplinaire HAL, estdestinée au dépôt et à la diffusion de documentsscientifiques de niveau recherche, publiés ou non,émanant des établissements d’enseignement et derecherche français ou étrangers, des laboratoirespublics ou privés.
The impact of monsoon outflow from India andSoutheast Asia in the upper troposphere over the
eastern MediterraneanH. A. Scheeren, J. Lelieveld, G. J. Roelofs, J. Williams, H. Fischer, M. de
Reus, J. A. de Gouw, C. Warneke, R. Holzinger, H. Schlager, et al.
To cite this version:H. A. Scheeren, J. Lelieveld, G. J. Roelofs, J. Williams, H. Fischer, et al.. The impact of monsoonoutflow from India and Southeast Asia in the upper troposphere over the eastern Mediterranean.Atmospheric Chemistry and Physics Discussions, European Geosciences Union, 2003, 3 (3), pp.2285-2330. �hal-00301049�

ACPD3, 2285–2330, 2003
Impact of monsoonoutflow from India
and Southeast Asia
H. A. Scheeren et al.
Title Page
Abstract Introduction
Conclusions References
Tables Figures
J I
J I
Back Close
Full Screen / Esc
Print Version
Interactive Discussion
c© EGU 2003
Atmos. Chem. Phys. Discuss., 3, 2285–2330, 2003www.atmos-chem-phys.org/acpd/3/2285/c© European Geosciences Union 2003
AtmosphericChemistry
and PhysicsDiscussions
The impact of monsoon outflow fromIndia and Southeast Asia in the uppertroposphere over the easternMediterraneanH. A. Scheeren1, J. Lelieveld2, G. J. Roelofs1, J. Williams2, H. Fischer2, M. deReus2, J. A. de Gouw1, 3, C. Warneke1, 3, R. Holzinger2, H. Schlager4, T. Klupfel2,M. Bolder1, C. van der Veen1, and M. Lawrence2
1Institute for Marine and Atmospheric Research Utrecht (IMAU), Utrecht University, theNetherlands2Max Planck Institute for Chemistry, Mainz, Germany3now at NOAA Aeronomy Laboratory, Boulder, Colorado, USA4Institute for Atmospheric Physics, DLR, Oberpfaffenhofen, Germany
Received: 5 February 2003 – Accepted: 8 April 2003 – Published: 12 May 2003
Correspondence to: H. A. Scheeren ([email protected])
2285

ACPD3, 2285–2330, 2003
Impact of monsoonoutflow from India
and Southeast Asia
H. A. Scheeren et al.
Title Page
Abstract Introduction
Conclusions References
Tables Figures
J I
J I
Back Close
Full Screen / Esc
Print Version
Interactive Discussion
c© EGU 2003
Abstract
A major objective of the Mediterranean INtensive Oxidant Study (MINOS) was to in-vestigate long-range transport of pollutants (notably ozone precursor species). Herewe present trace gas measurements from the DLR (German Aerospace Organization)Falcon aircraft in the eastern Mediterranean troposphere. Ten day backward trajecto-5
ries and a coupled chemistry-climate model (ECHAM4) were used to study the natureand origin of pollution observed in the upper troposphere between 6 and 13 km altitude.We focus on a large pollution plume encountered over the eastern Mediterranean be-tween 1 and 12 August originating in South Asia (India and Southeast Asia), referred toas the Asian plume, associated with the Asian Summer Monsoon. Vertical as well as10
longitudinal gradients of methane, carbon monoxide, hydrocarbons including acetone,methanol, and acetonitrile, halocarbons, ozone and total reactive nitrogen (NOy) arepresented, showing the chemical impact of the Asian plume compared to westerly airmasses containing pollution from North America. The Asian plume is characterizedby enhanced concentrations of biomass burning tracers (acetylene, methyl chloride,15
acetonitrile), notably from biofuel use. Concentrations of the new automobile coolingagent HFC-134a were significantly lower in the Asian plume than in air masses fromNorth America. Relatively high levels of ozone precursors (CO, hydrocarbons) werefound in both air masses, whereas lower ozone concentrations in the Asian plume sug-gest NOx-limited conditions. Consistently, ECHAM model simulations indicate that the20
expected future increase of NOx-emissions in Asia enhances the photochemical ozoneproduction in the Asian plume. The size and location of the Asian plume near thetropopause provides an important potential for pollution transport into the lowermoststratosphere. We present observations indicative of Asian pollution transport into thelower stratosphere.25
2286
ACPD3, 2285–2330, 2003
Impact of monsoonoutflow from India
and Southeast Asia
H. A. Scheeren et al.
Title Page
Abstract Introduction
Conclusions References
Tables Figures
J I
J I
Back Close
Full Screen / Esc
Print Version
Interactive Discussion
c© EGU 2003
1. Introduction
Observations and model work have indicated that the summertime Mediterraneanstands out as one of the most polluted regions on earth in terms of photochemicalozone formation and aerosol loading (Kouvarakis et al., 2000; Lelieveld and Den-tener, 2000). The MINOS project (Mediterranean Intensive Oxidant Study) was initiated5
to improve our understanding of the transport processes, chemical mechanisms andmain pollution sources that determine the chemical composition in the eastern Mediter-ranean troposphere. As a result, an intensive field campaign was carried out from Creteduring August 2001 involving a ground station (Finokalia; 35.19◦ N, 25.40◦ E) and twoaircraft to perform measurements of a wide range of trace gases and aerosols. An10
overview of major findings of MINOS is presented by Lelieveld et al. (2002).A major objective of MINOS was to examine the role of long-range transport of
pollutants into the region, notably to observe outflow from the southern Asian Sum-mer Monsoon (ASM hereafter) over the eastern Mediterranean. The Asian plume,which also influences the Indian Ocean troposphere as found during the 1999 Indian15
Ocean Experiment (INDOEX) (Lelieveld et al., 2001), contains high concentrations ofozone precursors (e.g. carbon monoxide (CO), non-methane hydrocarbons (NMHC)),partly oxidized hydrocarbons (POH, e.g. acetone (CH3COCH3), methanol (CH3OH)))and chlorocarbons (notably methyl chloride (CH3Cl)) (Scheeren et al., 2002), as wellas aerosols from fossil fuel and biomass burning emissions from the densely popu-20
lated South Asian region. The less soluble species can be effectively transported tothe upper troposphere by deep convection in the ASM. High altitude easterlies cancarry Asian pollution across northern Africa and the Mediterranean. Indeed, back-trajectories (Traub et al., this issue) and model simulations (Lawrence et al., this issue;Roelofs et al., this issue) indicate that the eastern Mediterranean upper troposphere25
(> 9 km altitude) was dominated by a southeasterly flow originating over India andsoutheast Asia during the first half of August. During the second half of August theeasterly flow weakened, after which a westerly flow dominated the upper troposphere,
2287

ACPD3, 2285–2330, 2003
Impact of monsoonoutflow from India
and Southeast Asia
H. A. Scheeren et al.
Title Page
Abstract Introduction
Conclusions References
Tables Figures
J I
J I
Back Close
Full Screen / Esc
Print Version
Interactive Discussion
c© EGU 2003
advecting air masses from the Atlantic region and North America to the MINOS region.Furthermore, the middle to upper tropospheric westerlies appeared to be regularly af-fected by downward transport of ozone-rich air from stratospheric origin (Roelofs et al.,this issue; Heland et al., this issue).
Here we report on trace gas measurements performed with a German Falcon jet air-5
craft, which operated from Heraklion airport (35◦ N, 25◦ E). A total of 14 flights wasconducted from the boundary layer up to 13 km, mainly over the Aegean Sea. Inthis study we focus on the eastern Mediterranean upper troposphere between 6 and13 km altitude. The measurement techniques are described in Sect. 2. We discussthe dynamics of the eastern Mediterranean troposphere during MINOS in Sect. 3. In10
Sect. 4 we show tropospheric distributions of C2 − C7 NMHC, halocarbons (includ-ing new anthropogenic halocarbons HFC-134a (CH2FCF3), HCFC-141b (CH3CCl2F),and HCFC-142b (CH3CClF2)), CO, CO2, CH4, O3 organic species (acetone, methanoland acetonitrile (CH3CN)) and NOx (NO + NO2) and NOy (sum of reactive oxidizednitrogen; mainly NO + NO2 + NO3 + N2O5 + HNO4 + HNO3 + RONO2 + peroxy acetyl15
nitrate (PAN)). We examine the upper tropospheric chemistry in the Asian plume andcompare this with westerly air masses originating over the Atlantic and North Ameri-can region and with results from INDOEX. Furthermore, observations of Asian pollutiontransport into the lower stratosphere are presented in Sect. 5.
In addition, we use a coupled tropospheric chemistry-climate model (ECHAM4; see20
Roelofs et al., this issue) to analyze contributions of the different origins or sourceregions of ozone, CO, and NMHC in the upper troposphere during MINOS presentedin Sect. 6. Finally, the possible impact of future Asian emissions of NMHC, CO andNOx on tropospheric ozone is discussed.
2. Measurements techniques25
First we summarize the measurements techniques employed and report the uncer-tainty and precision of the data presented. The in-situ measurements and air sample
2288

ACPD3, 2285–2330, 2003
Impact of monsoonoutflow from India
and Southeast Asia
H. A. Scheeren et al.
Title Page
Abstract Introduction
Conclusions References
Tables Figures
J I
J I
Back Close
Full Screen / Esc
Print Version
Interactive Discussion
c© EGU 2003
collection were performed on-board the German Falcon twin-jet research aircraft (oper-ated by the German Aerospace Center (DLR)), using forward facing inlets on top of theaircraft fuselage. The Max-Planck Institute for Chemistry (MPI-C) provided the TunableDiode Laser Spectrometry (TDLAS) instrument to measure CO, CO2 and CH4 with a1 s time resolution, at 1σ precision of 1.6 ppmv (µmol mol−1), 1.5 ppbv (nmol mol−1),5
and 16.5 ppbv, respectively and an absolute accuracy of ±1% for all species (Wienholdet al., 1998).
The DLR performed the measurements of NO, NOy (total oxidized nitrogen species)as well as O3, which are described in detail by Heland et al. (this issue). Ozonewas detected by means of UV absorption using a modified Thermo Environmental 4910
monitor from the DLR at a time resolution of 4 s. Accuracy and 1σ precision are ∼1 ppbvand ±5%, respectively. NO is measured with a well characterized ECO Physics CLD790 SR chemiluminescence detector (CLD), NOy is measured with a second CLD incombination with a gold converter at 300◦ C with CO (0.2%) as the reduction agent(Ziereis et al., 1999). Both NO and NOy were measured at a 1 Hz time resolution. The15
detection limits of the instruments are 5 pptv for NO, and 15 pptv for NOy. The nominalaccuracies of the NO and NOy measurements are 5% and 15%, respectively.
The measurements of acetone, methanol and acetonitrile reported here, were car-ried out using a Proton-Transfer-Reaction Mass-Spectrometer (PTR-MS) from NOAAAeronomy Laboratory (Boulder, Colorado) with a 12 s time resolution. A precision of20
±30% and a calibration uncertainty better than ±20% were achieved. Peroxy acetylnitrate (PAN) was detected with an additional PTR-MS operated by the MPI-C at andan uncertainty of ∼50%. For details about the PTR-MS technique we refer to Lindingeret al. (1998) and de Gouw et al. (this issue).
Non-methane hydrocarbons and halocarbons were detected in whole air samples25
collected in 2.4 L electropolished pre-cleaned stainless steel canisters equipped withNupro SS4H valves. An automated airborne sampling system suitable for filling 11canisters per flight, resulted in a time resolution of about 1 air sample per 15 min offlight (Scheeren et al., 2002). A total of 103 canisters were filled on flight 2 to 11 and
2289

ACPD3, 2285–2330, 2003
Impact of monsoonoutflow from India
and Southeast Asia
H. A. Scheeren et al.
Title Page
Abstract Introduction
Conclusions References
Tables Figures
J I
J I
Back Close
Full Screen / Esc
Print Version
Interactive Discussion
c© EGU 2003
13 (no canisters were filled on flight 1 (1 August) due to a system malfunctioning, andon flight 12 and 14 (22 August) because of a limited amount of canisters). To limitstorage artifacts, the air samples were analyzed within a few weeks after collection.The analysis was performed at the IMAU laboratory using a gas chromatograph (GC;Varian star 3600 CX) equipped with a CP-Sil 5 CB pre-column (WCOT Fused Silica,5
0.53 mm I.D.; 10 m long) in series with a CP-SilicaPLOT column (PLOT Fused Silica,0.53 mm I.D.; 60 m long) and detection by Flame Ionization Detection (hydrocarbonsand CH3Cl) and Electron Capture Detection (halocarbons). We note that we used theFID instead of the ECD for quantitative evaluation of CH3Cl to improve the precision.Pre-concentration of a 1-L sample was done with a Varian Sample Pre-concentration10
Trap (SPT) at a freeze-out temperature of −170◦ C at a flow rate of 33 ml min−1 reg-ulated by a mass flow controller. The reproducibility of the SPT with standard gas isbetter than 2% (1σ). Before entering the STP, water was removed from the samplestream by passing it through a Nafion drier tube mounted inside a countercurrent flowof purified dry nitrogen. Here we show results for C2 − C5 hydrocarbons, benzene and15
toluene, and halocarbons CH3Cl, dichloromethane (CH2Cl2), trichloromethane (chlo-roform, CHCl3), tetrachloroethylene (C2Cl4), CFC-12 (CF2Cl2), CFC-11 (CFCl3), HFC-134a (CH2FCF3), HCFC-141b (CH3CCl2F), and HCFC-142b (CH3CClF2). The detec-tion limit for hydrocarbons is < 3 pptv (pmol mol−1), for CH3Cl (on the FID) and CH2Cl2< 10 pptv, and for the other halocarbons < 0.1 pptv. Calibration was performed on20
a routine basis, using commercial gravimetrically prepared standard gas mixtures ofhydrocarbons and halocarbons in nitrogen gas (PRAXAIR) as reference air with an ac-curacy of < 3% for hydrocarbons and < 2% for halocarbons. The halocarbons standardmixture has been additionally calibrated against primary standards at the NetherlandsMetrology Institute (NMI). The halocarbons HFC-134a, HCFC-141b and HCFC-142b25
were detected and calibrated on the basis of reference samples provided by S. A.Montzka of NOAA, CMDL (Boulder, CO, USA) resulting in an accuracy < 5%.The over-all precision was < 10% for the NMHC and < 3% for the remaining halocarbons exceptfor CH2Cl2 (<15%) due to its poor detector response.
2290

ACPD3, 2285–2330, 2003
Impact of monsoonoutflow from India
and Southeast Asia
H. A. Scheeren et al.
Title Page
Abstract Introduction
Conclusions References
Tables Figures
J I
J I
Back Close
Full Screen / Esc
Print Version
Interactive Discussion
c© EGU 2003
3. Free tropospheric meteorology
We used 10-day back trajectories calculated by the Royal Netherlands MeteorologicalInstitute (KNMI) to study long-range transport routes and the origin of the encounteredair masses. The trajectory model uses analyzed (6-hour averaged) 3-D wind fieldsfrom the European Centre for Medium-range Weather Forecast (ECMWF) (Scheele et5
al., 1996; Stohl et al., 2001). Back trajectories were computed for each time a canistersample was taken, resulting in a set of trajectories that indicate the major transportpathways into the region. Here, we focus on the middle to upper troposphere between6 to 13 km altitude dominated by long-range transport. For an outline of transport path-ways and chemical characteristics of air masses encountered in the entire troposphere10
including the boundary layer we refer to Lelieveld et al. (2002) and Traub et al. (thisissue).
An overview of 10-day back trajectories for air masses encountered above 6 km al-titude between 3 and 22 August (flight 2 to 11 and 13) is presented in Fig. 1. Shownare trajectories as a function of latitude and longitude (panel A) and as a function of15
pressure and longitude (panel B). Between 6 and 9 km we occasionally found pollutedair (purple trajectories) originating below 700 hPa over the eastern United States andthe eastern Atlantic region (roughly between 60◦ and 90◦ W), 5 to 10 days prior to theflight. These polluted layers (discussed in Sect. 4.1) appear to be the results of fastupward motion associated with warm conveyor belt (WCB) transport ahead of a cold20
front (Stohl and Trickl, 1999). In green are tropospheric air masses encountered be-tween 8 and 12 km altitude, which were dominated by westerlies from North Americaand the North Atlantic region up to about 9 km. Above 9 km altitude a south-easterlyflow prevailed during the first two weeks of August, originating in South Asia (India andSoutheast Asia), which is referred to as the Asian plume, shown as orange trajectories25
(superimposed dashed lines denote 5 days back in time).During July and August the South Asian region (India, Pakistan, and the Bay of Ben-
gal area) is subject to the Asian summer monsoon (ASM). Satellite images (GOES-
2291

ACPD3, 2285–2330, 2003
Impact of monsoonoutflow from India
and Southeast Asia
H. A. Scheeren et al.
Title Page
Abstract Introduction
Conclusions References
Tables Figures
J I
J I
Back Close
Full Screen / Esc
Print Version
Interactive Discussion
c© EGU 2003
5 visible and infrared channel; http://www.eumetsat.de/en/dps/archive/historic.html)show a strong monsoonal activity through the presence of large clusters of convec-tive clouds over India and the Bay of Bengal 10–15 days prior to the easterly plumein the Mediterranean upper troposphere between 1 and 12 July 2001. The ASM isassociated with one of the largest upper tropospheric anti-cyclones on earth present5
from May to September. It has been the subject of intense study for over 150 years(Hastenrath, 1991; Hsu et al., 1999). The ASM is triggered in May. The Tibetanplateau starts to heat up after winter and an upper tropospheric anti-cyclone is formedthrough upward motion of warm air over the Central Asian mountain range. The warm-ing causes a reversal of the meridional temperature gradient towards the Indian Ocean10
region, which redirects the low-level north-easterly winds into a southwesterly directionand the upper tropospheric subtropical westerly jet into an easterly direction (Hsu etal., 1999). Deep convection associated with the ASM can carry polluted Asian bound-ary layer air into the upper tropospheric anti-cyclonic circulation. Thus, pollution fromSouth Asia is transported in the upper troposphere over Africa and the Mediterranean15
along with the easterly tropical jet (Fig. 1; orange trajectories), in conjunction with anupper tropospheric anticyclone over the Arabian Peninsula. During the second half ofAugust 2001, the position of the Arabian anticyclone shifted to the southeast, reducingthe influence of the Asian plume over the eastern Mediterranean.
Model work indicates that stratosphere-to-troposphere-exchange (STE) associated20
with the passing of cold fronts over the North Atlantic may contribute about 30% of theozone in the westerlies (Roelofs et al., this issue). Air mass trajectories associatedwith STE are shown in blue, where we assume that a potential vorticity value thatexceeds 3.0 potential vorticity (PV) units (1 PV-unit = 10−6 km2 kg−1 s−1) anywherealong the 10-day trajectory in combination with ozone concentrations larger than 9025
ppbv, indicates a STE event.An additional potential source of pollution in the Mediterranean free troposphere is
convection of polluted air boundary layer air over continental areas to the free tropo-sphere, associated with synoptic disturbances or with thunderstorms. An event of fresh
2292

ACPD3, 2285–2330, 2003
Impact of monsoonoutflow from India
and Southeast Asia
H. A. Scheeren et al.
Title Page
Abstract Introduction
Conclusions References
Tables Figures
J I
J I
Back Close
Full Screen / Esc
Print Version
Interactive Discussion
c© EGU 2003
pollution lifted up to an altitude of 6 km, associated with thunderstorm activity over east-ern Turkey was encountered on 3 August (flight 2) and will be discussed in more detailin Sect. 4.1. An unique example of deep convective injection of polluted air into thetropopause region has been observed on 22 August and is described in detail by Fis-cher et al. (this issue). Here, sharp increases of tropospheric pollutants (e.g. CO,5
acetone, methanol and acetonitrile) were detected during ascent into the lower strato-sphere above the anvil of a large thunderstorm system. Apart from these examples,the impact of deep convective events over the Mediterranean during MINOS in the up-per troposphere appears to be rather small compared to the long-range transport ofpollution into the region. This is caused by prevailing large scale subsidence in the10
descending branch of the Hadley circulation, which lies directly over the region and therelative stability of the free troposphere induced by the UT anti-cyclone (Roelofs et al.,this issue).
3.1. Air mass classification
Air masses have been classified according to their geographical location 7–10 days15
back in time deduced from the 10-day backward trajectories presented in Fig. 1. Airmasses originating between 50◦ to 170◦ W and 20◦ to 50◦ N were classified as NorthAmerican; those with an origin between 0◦ to 50◦ W and 10◦ to 30◦ N as (sub-tropical)North Atlantic, and air masses coming from 40◦ to 110◦ E and 5◦ to 40◦ N were classifiedas South Asian. A stratospheric origin was determined by a PV> 3 along the trajectory20
in combination with an ozone concentration exceeding 90 ppbv.A general point of concern is the accuracy of computed trajectories, which decreases
with time and increasing geographical scales (Scheele et al., 1995; Stohl, 1998). Forinstance, Stohl (1998) estimated position errors up to 20% of the travel distance. In thisstudy we focus on, however, large-scale motions in the middle to upper troposphere25
as well as large-scale lifting events associated with the ASM and the WCB in orderto distinguish between easterly or westerly air mass origin. In addition, we find goodagreement with another more detailed trajectory analysis of the MINOS flights by Traub
2293

ACPD3, 2285–2330, 2003
Impact of monsoonoutflow from India
and Southeast Asia
H. A. Scheeren et al.
Title Page
Abstract Introduction
Conclusions References
Tables Figures
J I
J I
Back Close
Full Screen / Esc
Print Version
Interactive Discussion
c© EGU 2003
et al. (this issue), who computed 5-day backward trajectories at an one minute timeresolution along the flight track.
Based on the number of selected trajectories (55) for air masses between 6 and13 km altitude in Fig. 1, we could classify 38% of the air masses as North American,14% as North Atlantic, 24% as South Asian, and 14% as stratospheric. The remaining5
9% were associated with other source regions. Hence, we can distinguish two majorsource regions, i.e., the South Asian and the North American/North Atlantic region withpossible pollution transport towards the eastern Mediterranean upper troposphere. Inthe following sections we will focus on the comparison of the chemical characteristicsof the Asian plume and the westerly air masses of North American and North Atlantic10
origin.
4. Chemical characteristics of the free troposphere
4.1. Vertical distribution of trace gases
We present altitude profiles of a number of gaseous trace species measured between3 and 22 August over the eastern Mediterranean from the boundary layer to about15
13 km altitude in Fig. 2. All data points, except for NMHC and halocarbons from thecanister analysis, correspond to the mean of ∼5 min in-situ measurements coincidingwith the filling of a canister (1–2 per flight level of ∼15 min), while the error bars reflectthe measured variability (1σ standard deviation). Color coding denotes the air massorigin above 6 km altitude based on 10-day backward trajectories (Sect. 3). Air masses20
from South Asia are depicted in orange, dark green relates to the North Atlantic re-gion, light green squares show the air masses originating over North America, purplesquares correspond to air masses in the WCB over the eastern North Atlantic region(see plate b, Fig. 1) and in red pollution from local deep convection is shown (explainedin more detail later). Air masses below ∼6 km are depicted in gray. They have not been25
classified with respect to their origin, but back-trajectory analysis by Traub et al. (this
2294

ACPD3, 2285–2330, 2003
Impact of monsoonoutflow from India
and Southeast Asia
H. A. Scheeren et al.
Title Page
Abstract Introduction
Conclusions References
Tables Figures
J I
J I
Back Close
Full Screen / Esc
Print Version
Interactive Discussion
c© EGU 2003
issue) shows that European emissions play an important role. For a detailed chemicalcharacterization of boundary layer pollution from European sources during MINOS werefer to Gros et al. (this issue). Gray squares in the upper troposphere relate to airmasses, which have been influenced by stratosphere-troposphere exchange. Table 1gives an overview of mean concentrations (and 1σ standard deviation) in the upper5
troposphere (≥ 6 km) of the data presented in Fig. 1 for air masses originating in theNorth American/North Atlantic region and the South Asian region. Detailed aerosolproperties in the troposphere during MINOS are addressed by Minikin et al. (this is-sue) and are therefore not included here. We note that aerosol number concentrationswere not particularly enhanced in the upper troposphere, although relatively high num-10
ber concentrations of freshly produced Ultrafine Condensation Nuclei (UCN; between5 and 14 nm particle diameter) of 1000 to 4000 particle cm−3 (stp) were encounteredin the Asian plume and occasionally in the North American plume.
Figure 2 shows that the lower atmosphere in the eastern Mediterranean region con-tained the highest concentrations of CO, NMHC and oxidized organic species asso-15
ciated with pollutant emissions from Europe. CO2, however, shows somewhat lowerconcentrations in the boundary layer than aloft, which is related to enhanced uptake bythe vegetation during summer (Strahan et al., 1998). Although large-scale subsidenceprevails during the Mediterranean summer, enhanced concentrations of reactive pollu-tant tracer species such as PAN, acetone, methanol, acetylene, propane and benzene20
were detected in the lower free troposphere up to 6 km altitude. Convective transportis the most probable mechanism for mixing of polluted boundary layer air to the freetroposphere, partly associated with land-sea breezes and orographic effects (Millanet al., 1997). A pronounced layer of relatively fresh pollution was encountered on 3August (flight 2) at an altitude of 6 km (depicted as red squares in Fig. 2). This pol-25
lution plume was most likely related to outflow from a band of convective clouds andassociated thunderstorm activity, which occurred over western Turkey and the BlackSea upwind of the flight track 1–2 days prior to the flight. Figure 3 shows an AVHRRthermal infrared image (NOAA 16 satellite) of this convective system close to the flight
2295

ACPD3, 2285–2330, 2003
Impact of monsoonoutflow from India
and Southeast Asia
H. A. Scheeren et al.
Title Page
Abstract Introduction
Conclusions References
Tables Figures
J I
J I
Back Close
Full Screen / Esc
Print Version
Interactive Discussion
c© EGU 2003
track were the pollution was observed. In addition, this polluted layer has been repro-duced in model simulations by Lawrence et al. (this issue) and Good et al. (this issue),pointing to a well mixed plume of a few days old of regional origin.
Above ∼6 km altitude, long-range transport of pollution from outside Europe to theregion appears to determine the vertical tracer concentration gradients. Between 6 and5
9 km westerlies carry pollution from the North American continent to the region, mainlyassociated with the warm conveyor belt in synoptic disturbances (e.g. Cooper et al.,2001). As such, moist air containing pollution from the North American east coast canreach Europe in 3 to 5 days as shown by Stohl and Trickl (1999). Air masses associ-ated with North American pollution (purple squares) contained relatively high benzene10
concentrations, probably related to traffic emissions, as well as high concentrationsof the air conditioning agent HCFC-134a (discussed further in 4.2.4). An example ofrapid uplifting of polluted air advected from the North American east coast is depictedby the back-trajectory in Fig. 4 (see also the purple trajectories in Fig. 1). The WCB isvisible in the cloud band along the North American east coast taken from a GOES 8 in-15
frared satellite image (courtesy of METEOFRANCE) on 15 August 2001, at 12:00 UTC.The trajectory relates to a strongly polluted air mass encountered on 19 August 2001,at about 8 km altitude containing high NMHC (notably benzene and propane), halo-carbons as well as high ozone (∼80 ppbv) most likely resulting from photochemicalproduction. Higher in the upper troposphere at 10–13 km the South Asian plume, de-20
noted by the orange squares in Fig. 2, is associated with a strong signature of biomassburning, i.e. enhanced concentrations of CO, acetylene, benzene, acetone, acetoni-trile, methyl chloride, and chloroform. This relates to the extensive use of biofuels inAsia, consistent with INDOEX measurements over the Indian Ocean (e.g. Lelieveld etal., 2001; de Gouw et al., 2001; Scheeren et al., 2002).25
4.2. Longitudinal tracer gradients in the upper troposphere
Complementary to the vertical gradients in Figs. 2, Fig. 5 shows observed upper tropo-spheric concentrations of several trace species (between 6 and 13 km) as a function of
2296

ACPD3, 2285–2330, 2003
Impact of monsoonoutflow from India
and Southeast Asia
H. A. Scheeren et al.
Title Page
Abstract Introduction
Conclusions References
Tables Figures
J I
J I
Back Close
Full Screen / Esc
Print Version
Interactive Discussion
c© EGU 2003
longitude of origin. The latter is deduced from the 10-day back-trajectory analysis. Forthis we applied the geographical end-point of the 10-day backward trajectories, whichappeared to be representative of the travel distance and position of an air parcel be-tween 7 to 10 days back in time. In addition, 7 to 10 days agree well with the traveltimes of pollution from the major source regions to Mediterranean as indicated by the5
trajectories. We note that the latitudinal variability of the air mass origins varied be-tween 20◦ and 50◦ N for the Westerlies and between 5◦ and 40◦ N for the easterlies. Ananalysis of latitudinal gradients showed no significant relationships and is therefore notshown here.
We applied a least squares linear fit on the data to illustrate the significance of the10
gradient (when present). Air masses with a recent stratospheric input (blue squares)were excluded from the linear fit (PV > 3.0 along the 10-days back trajectory in com-bination with observed ozone exceeding 90 ppbv), because we are interested in thetropospheric origin of the species. Air masses that could be related to pollution lifted-up from the North American east coast (WCB) and advected across the Atlantic to15
Europe (based on the purple trajectories in Fig. 1) are marked as purple squares.
4.2.1. O3, CO, NOy and NMHC
The longitudinal gradients and mean values (Table 1) show that O3, NO and NOy con-centrations were generally lower in the Asian plume than in the westerly air masses,while PAR (C2 − C5 alkanes or paraffin’s) and CO were similar or higher. This points to20
NOx-limited conditions for photochemical O3 production in the Asian plume and there-fore a suppressed OH regeneration by NO (Lelieveld et al., 2001). The ratio of an-thropogenic NOx emissions to the total CO and hydrocarbon emissions is estimated tobe smaller for Asia than for Europe and North America (Olivier et al., 1996), which isassociated with less efficient combustion processes. In addition, the lifetime of NOx in25
the tropical boundary layer is very short (< 1 day) due to efficient reaction to HNO3 andsubsequent removal through wet and dry deposition (Lelieveld and Dentener, 2000).The lower NOy in the Asian plume may be partly related to the efficient removal of
2297

ACPD3, 2285–2330, 2003
Impact of monsoonoutflow from India
and Southeast Asia
H. A. Scheeren et al.
Title Page
Abstract Introduction
Conclusions References
Tables Figures
J I
J I
Back Close
Full Screen / Esc
Print Version
Interactive Discussion
c© EGU 2003
HNO3 in deep convection in the ASM.Furthermore, the role of lightning produced NOx, which provides a fresh source of
NOx in the free troposphere, where the lifetime of NOx is longer (up to about a 1 week),is still poorly understood. In particular over the North Atlantic the lightning fraction ofNOx in the westerlies might be relatively large (Jeker et al., 2000). Relatively high5
CO and PAR in the westerlies originated from the North American east coast and areassociated with WCB transport (purple squares). The influence of stratosphere-to-troposphere transport, shown as blue squares in Fig. 5, is absent in the Asian plumebut increases significantly towards more westerly air mass origins. In these air parcelsozone is significantly enhanced, while concentrations of CO, higher hydrocarbon and10
oxidized organic tracer species are lower. This strongly influences the observed longi-tudinal trend of CO and O3. The longitudinal gradients of O3, CO, NOy and NMHC arefurther investigated in Sect. 5 using the ECHAM 4 general circulation model.
4.2.2. Methanol and acetone
Both methanol and acetone depict a negative east-west trend as function of longitude.15
The main terrestrial sources of atmospheric methanol are plant emissions, and to alesser extent emissions from plant decay, industrial production and biomass burning,making it an abundant organic species in the background atmosphere (Galbally andKirstine, 2002). The chemical lifetime of methanol in the free troposphere based onreaction with OH is of the order of 2 weeks (Singh et al., 1995), suggesting that the20
mean age of the plumes we encountered is shorter than that. The release of methanolfrom biomass burning is typically associated with oxygen deficient smoldering fires,e.g. in the domestic and small industrial use of biomass fuel in Asia (Scheeren et al.,2002), resulting in an enhancement in the Asian plume. Similar to methanol, acetonehas large natural sources (vegetation and oceans), is emitted by biomass burning but25
it is also formed in the atmosphere by hydrocarbon oxidation (Singh et al., 1995; Jacobet al., 2002). The chemical lifetime of acetone in the free troposphere as determinedby photolysis and reaction with OH is of the order of 10–15 days, which is close to the
2298

ACPD3, 2285–2330, 2003
Impact of monsoonoutflow from India
and Southeast Asia
H. A. Scheeren et al.
Title Page
Abstract Introduction
Conclusions References
Tables Figures
J I
J I
Back Close
Full Screen / Esc
Print Version
Interactive Discussion
c© EGU 2003
chemical age of the upper tropospheric plumes. Nevertheless, the acetone concen-tration in the Asian and North American plumes of about 1 ppbv significantly exceededthe ∼0.5 ppbv representative of the background upper troposphere (Jacob et al., 2002).Acetone and methanol correlated well (r ≥ 0.7) with CO and total C2 − C7 NMHC in theupper troposphere, shown in Fig. 6, suggesting that primary combustion sources and5
in situ photochemical production explain the general enhancement above backgroundlevels. Holzinger et al. (this issue) analyzed the biomass burning influence on acetone,methanol, CO and PAN over the eastern Mediterranean during MINOS. They foundstrong indications of secondary photochemical production of acetone and methanol, inagreement with our analyses. Relatively high concentrations of ∼2.5 ppbv of acetone10
and methanol in the free troposphere have been observed in fresh pollution on 2 Au-gust at 6 km altitude, most probably related to convection over northern Turkey (Fig. 3),described in Sect. 4.1.
4.2.3. CH4 and CH3Cl
Both CH4 and CH3Cl are enhanced in the Asian plume, resulting in a negative longitudi-15
nal east-west gradient. Methane may be enhanced in the northern mid-latitude bound-ary layer (relative to a mid-latitude Northern Hemispheric background of ∼1800 ppbvfrom AGAGE, Prinn et al., 2000) from the production and use of natural gas (see Fig. 2),while enhancements in tropical air masses most likely relate to emissions from ricepaddies and natural wetlands (Houweling et al., 2000). Methyl chloride has strong ter-20
restrial (vegetation and soils) and oceanic sources (Yokouchi et al., 2001; Lee-Tayloret al., 2001) contributing to the global background of ∼550 pptv. An additional largesource in South Asia is biofuel burning (Scheeren et al., 2002), leading to the largeenhancement observed in the Asian plume. During the northern mid-latitude summeremissions from natural forest fires at mid-latitudes could also play a role, as can be de-25
duced from the average concentration of 576±19 pptv, which is somewhat higher thanthe CH3Cl background.
2299

ACPD3, 2285–2330, 2003
Impact of monsoonoutflow from India
and Southeast Asia
H. A. Scheeren et al.
Title Page
Abstract Introduction
Conclusions References
Tables Figures
J I
J I
Back Close
Full Screen / Esc
Print Version
Interactive Discussion
c© EGU 2003
4.2.4. HFC-134a, HCFC-141b and HCFC-142b
The relatively new fluorocarbon HFC-134a (in use since 1990) shows a consistentlylower concentration in the Asian plume (19±2 pptv) compared to westerly air masses(25±3). Highest concentrations were detected in the European boundary layer (27±5)and in air masses associated with WCB transport from the North American east coast5
(29±1). At present, HFC-134a is mainly used as cooling agent in automobile air-conditioning systems as a replacement of CFC-11 (AFEAS, 2002). Mobile air condi-tioning is considered as one of the major sources of fluorocarbons with annual leakagerates up to 10% per year (EIA, 2002). Emissions of HFC-134a are concentrated inthe US and Europe with vehicle numbers of about 200 million each in the year 2000,10
whereas the number of registered vehicles in India and China is presently of the or-der of ∼20 million (WRI, 2002). It is estimated that presently ∼35% of European and∼90% of all American motor vehicles are equipped with air-conditioning. The HFC-134a chemical lifetime of ∼14 years (Kanakidou et al., 1995) has caused an accumula-tion of HFC-134a to its present background level of ∼20 pptv. HFC-134a can serve as15
a tracer for western pollution, so that enhanced concentrations suggest North Ameri-can or European pollution. The chlorofluorocarbons HCFC-142b and HCFC-141b, notshown in Fig. 5, are mainly used as industrial solvents and for long-life applications as ablowing agent for closed-cell foams (in use since 1981 and 1990, respectively (AFEAS,2002)). Emissions of HCFC-141b and HCFC-142b to the atmosphere are therefore20
smaller than of HFC-134a and not so wide-spread, while their chemical lifetimes aresimilar (∼10 and ∼20 years, respectively (Kanakidou et al., 1995)), explaining theirlower atmospheric variability (see Table 1).
4.2.5. CO2
The longitudinal gradient of CO2 shows a strong positive tendency from east to west.25
Model and measurement based studies have shown that the seasonality of CO2 atthe surface has a larger amplitude in the extra-tropics than in the tropics (Strahan et
2300

ACPD3, 2285–2330, 2003
Impact of monsoonoutflow from India
and Southeast Asia
H. A. Scheeren et al.
Title Page
Abstract Introduction
Conclusions References
Tables Figures
J I
J I
Back Close
Full Screen / Esc
Print Version
Interactive Discussion
c© EGU 2003
al., 1998; Matsueda et al., 2002). Therefore, during summer CO2 concentrations arelower at high latitudes. In the upper troposphere, however, the CO2 seasonal cycleis less pronounced and has approximately the same amplitude and phase in both theextra-tropics and the tropics (Strahan et al., 1998). This would not lead to the observedlongitudinal CO2 gradient, which points to pollution sources in the westerlies. Up-5
per tropospheric CO2 concentrations have been correlated with concurrent HFC-134a,CH4, CH3Cl and CH3CN to investigate possible sources, presented in Fig. 7. We finda significant positive correlation between CO2 and HFC-134a (at the 95% significancelevel), a tracer for pollution from North American continent, and a negative correlationbetween CO2 and CH4, and the biomass burnings tracers CH3Cl and CH3CN. Our10
measurements thus indicate that pollution originating from the North American eastcoast is enriched in CO2, most likely from fossil fuel burning.
4.3. Chemical age of the Asian plume
The age of the Asian pollution detected in the upper troposphere refers to the traveltime of pollutant species away from their sources. We estimate the air mass age from15
the enhancement or emission ratio (ER) of biomass burning species with different pho-tochemical lifetimes relative to CO, that will change as function of travel time. The ERof species X can be determined as the slope of a linear regression fit (∆X/∆CO). Wefocus on typical biomass burning species methyl chloride, acetonitrile, acetylene andbenzene that are chemically removed by the OH radical only. We compared ER’s from20
MINOS measurements (ERt) in the Asian plume with ER’s from INDOEX 1999 mea-surements obtained over the Indian Ocean reported by de Gouw et al. (2001) andScheeren et al. (2002), which we consider as source ER’s (ER0). The INDOEX ER0are typical for pollution from the Indian continent, which is considered as one of themain source regions for the Asian plume pollution, dominated by emissions from the25
industrial and residential use of biofuels. The MINOS ER’s (ERt) were taken as theslope from a linear regression fit performed on the hydrocarbon to CO relationship inthe Asian plume, depicted in Fig. 8. Depending on the reactivity of the species relative
2301

ACPD3, 2285–2330, 2003
Impact of monsoonoutflow from India
and Southeast Asia
H. A. Scheeren et al.
Title Page
Abstract Introduction
Conclusions References
Tables Figures
J I
J I
Back Close
Full Screen / Esc
Print Version
Interactive Discussion
c© EGU 2003
to CO, the source ratio ER0 changes as a function of transport time or chemical age∆t and the mean OH radical concentration. The relationship between the ER0 and theERt can be described by:
ER0 = ERt/e(kCO−kS)[OH]∆t, (1)
where kCO and kS are the OH reaction rate coefficients for CO and emission species5
S taken from Atkinson et al. (1997), respectively, (OH) is the diurnal mean OH radicalconcentration in molecules cm−3. The chemical age ∆t can be determined from Eq. (1).
We assumed mean temperature and pressure conditions of 235 K and 225 hPameasured in the Asian plume and a daily mean OH concentration of 1.0±0.2×10⁶
molecules cm−3 taken from the ECHAM4 general circulation model (described in more10
detail in Sect. 5) for 6 to 12 km altitude. Using Eq. (1), we derived a best match of theMINOS ER, apart from acetylene, with the INDOEX ER0 values at a ∆t of about 13days presented in Table 2. The low acetylene ER from INDOEX might be related toadditional breakdown away from combustion sources in the Asian boundary layer priorto deep convection into the upper troposphere. A better agreement is found with the15
mean biomass burning ER of 8±4 pptv ppbv−1 for acetylene found in fresh biomassburning emissions from various studies reported by Veldt and Berdowski (1995).
Based on the back trajectory analysis (shown in Fig. 1), the transport times fromSouth Asia towards the Mediterranean are 5–10 days in the upper troposphere. Traubet al. (this issue) present 20-day forward trajectories with starting points in two West20
Indian cities (Madras, 80.76◦ E/13.85◦ N; Patna, 85.72◦ E/26.01◦ N) for July 2001, in-dicating travel times of 2–5 days for deep convection from the boundary layer to theupper troposphere over India. Hence, combining these back and forward trajectories,we can deduce travel times from the Asian boundary layer to the Mediterranean uppertroposphere ranging from 7 to 15 days. In spite uncertainties involved in estimating the25
chemical age (Jobson et al., 1998), the chemical age of the encountered pollution inthe Asian plume seems to be quite realistic and in agreement with trajectory analysis.
2302

ACPD3, 2285–2330, 2003
Impact of monsoonoutflow from India
and Southeast Asia
H. A. Scheeren et al.
Title Page
Abstract Introduction
Conclusions References
Tables Figures
J I
J I
Back Close
Full Screen / Esc
Print Version
Interactive Discussion
c© EGU 2003
5. Asian pollution observed in the lowermost stratosphere
Besides the global impact of the ASM dynamics, model studies indicate an impor-tant potential for pollution transport into the lower stratosphere (Chen, 1995; Dethofet al., 2000). Deep convection in the ITCZ (InterTropical Convergence Zone) overSouth Asia adds pollution to the upper tropospheric anti-cyclonic circulation. The as-5
sociated upward motion pushes the subtropical tropopause to ∼16 km altitude over arelatively large region (Roelofs et al., this issue). The subtropical tropopause slopesdown to about 11 km towards higher latitudes, providing favorable conditions for isen-tropic cross-tropopause transport. The potential impact of the Asian plume for pollutiontransport into the lower stratosphere is large because of its high pollution level, large10
scale and its persistent presence between June and September.The tropopause over the MINOS measurement area was generally located above
the maximum flight altitude of the Falcon aircraft of ∼13 km. Fortunately, on 16 and17 August, a trough located north of Crete lowered the tropopause to about 10–11 kmaltitude providing an opportunity to sample the upper tropopause/lower stratosphere15
over the region. Hence, on 16 August (flight 8) the aircraft first crossed the tropopauseat about 10.5 km altitude measuring ozone values of ∼100 ppbv. It then climbed toabout 12.5 km and traversed the trough again observing ozone values > 150 ppbv. Sixair samples were collected in the trough and the air mass origin was analyzed with 10-day backward trajectories depicted in Fig. 9. It shows that air masses with a westerly20
component (green) converged with air masses with an easterly component (orange),coming from the (shaded) region affected by the Asian plume (northern Africa andthe tropical North Atlantic). Measurements in the trough of CO, O3, NMHC, CH3Cl,acetone and methanol, along with PV from the ECMWF analysis are presented inTable 3. We found enhanced concentrations of CO, NMHC, CH3Cl and methanol in air25
masses with an easterly component, that closely resemble the chemical characteristicsof the Asian plume in presented in Table 1 and Fig. 2. These results provide firstindications that troposphere-to-stratosphere exchange of Asian pollution affects the
2303
ACPD3, 2285–2330, 2003
Impact of monsoonoutflow from India
and Southeast Asia
H. A. Scheeren et al.
Title Page
Abstract Introduction
Conclusions References
Tables Figures
J I
J I
Back Close
Full Screen / Esc
Print Version
Interactive Discussion
c© EGU 2003
lowermost stratosphere over the Mediterranean. Clearly, dedicated measurements andmodel work are needed to quantitatively asses TSE of Asian pollution associated withthe ASM.
6. Model simulations of the upper troposphere
We used the ECHAM4 general circulation model (European Centre Hamburg Model5
version 4) to simulate observed gradients of CO, O3, NOy and total carbon from thesum of C2 − C5 alkanes (PAR) to help us better understand the characteristics of theupper troposphere during MINOS. The model has a T63 horizontal resolution of ap-proximately 1.9◦ × 1.9◦, a time step of 15 min, and has 19 vertical levels up to 10 hPa(the troposphere between 5 and 14 km consists of 6 model layers). The model has10
been initiated from January 2001 and uses analyzed ECMWF winds fields similar tothe trajectory analysis. For more details about the model we refer to Roelofs andLelieveld (2000).
6.1. Simulated longitudinal gradients of O3, CO, NOy and NMHC
Figure 10 shows the qualitative agreement between simulated and observed longitu-15
dinal gradients of CO, O3, NOy and C2 − C5 alkanes (parafines; PAR). For clarity, aweighted fit through the model output is shown, leaving out the individual data points.In addition, the mean model and measurement results for westerly air masses (NorthAmerican and North Atlantic) and the Asian plume as well as the mean model to mea-surement ratio are presented in Table 4. The mean model to measurement ratio rep-20
resents an attempt to compare model and measurements in a more quantitative way.Measured and modeled mean NO concentrations (not shown in Fig. 10) are also in-cluded in Table 4.
Looking at CO and O3 gradients, it appears that the general agreement betweenmodeled and measured values in the upper troposphere is quite good, which is re-25
2304

ACPD3, 2285–2330, 2003
Impact of monsoonoutflow from India
and Southeast Asia
H. A. Scheeren et al.
Title Page
Abstract Introduction
Conclusions References
Tables Figures
J I
J I
Back Close
Full Screen / Esc
Print Version
Interactive Discussion
c© EGU 2003
flected in a mean model/measurements ratio close to 1. A closer look shows thatenhanced CO associated with WCB uplifting of North American pollution (purple dots)is not well reproduced by the model. Hydrocarbons (C2 − C5 alkanes) are reasonablywell simulated in the Asian plume (mean model/measurement ratio of 1.3) but under-estimated by factor of 2.4 in the westerly air masses. Here, the stratospheric influence5
appears to be overestimated while the contribution of North American pollution, in-cluding CO, is underestimated. The ECHAM4 model tends to overestimate the roleof downward tracer transport, notably of stratospheric ozone across the tropopause(Roelofs et al., this issue). In addition, the relatively coarse vertical resolution of themodel allows more efficient mixing between shallow layers of pollution than might be10
realistic. For example, the WCB transports fresh North American pollution plumes toan altitude of 6 to 9 km across the Atlantic, which were typically encountered as distinctlayers of a few hundreds of meters thick. As a result, modeled hydrocarbons (PAR)and CO can be underestimated, while the stratospheric influence is overestimated atthe expense of photochemically produced ozone. Indeed, for the selected WCB data15
points the model/measurement ratio for O3 and PAR is 1.2 and 0.2, respectively.NOy is reasonably well simulated in the Asian plume, but misses most of the en-
hanced NOy concentrations observed in the westerlies. NO is underestimated by afactor of 3 in the Asian plume and by a factor of 1.8 in the westerlies (Table 4). Theobserved enhanced tropospheric NOy (and NOx) values are most probably related to20
lightning produced NOx over the Atlantic, not well represented in the model. Recentobservations of NOx in the tropopause region over the United States and the North-ern Atlantic have shown that in-situ lightning production is as important as convectivetransport from the polluted boundary layer for the NOx budget during summer (Jeker etal., 2000; Brunner et al., 2001).25
In summary, the Asian plume chemistry is reasonably well simulated by the model,whereas in the westerlies the influence of stratosphere-to-troposphere exchange tendsto be overestimated, while the influence of North American pollution is underestimated.
2305

ACPD3, 2285–2330, 2003
Impact of monsoonoutflow from India
and Southeast Asia
H. A. Scheeren et al.
Title Page
Abstract Introduction
Conclusions References
Tables Figures
J I
J I
Back Close
Full Screen / Esc
Print Version
Interactive Discussion
c© EGU 2003
6.2. Simulated source contributions to O3 and CO
In Roelofs et al. (this issue) ECHAM4 is used to investigate contributions to upper tro-pospheric (6–13 km altitude) concentrations of O3 from different source regions, beingeastern and western Europe, Africa, India, South Asia, North America, lightning andthe stratosphere. Here we extend the analysis to CO. The simulated source contri-5
butions are shown as function of longitude of origin derived from the ECMWF 10-dayback trajectory analysis in Fig. 11. Older air masses that could not be attributed to oneof the source regions are defined as “background”, which also contributes up about25% to the tropospheric ozone column. We focus specifically on the contributions ofSouth Asia (India and Southeast Asia) to O3 and CO in the Asian plume. About 10 to10
16 ppbv or 20–30% of total O3 and 28 to 44 ppbv or 30–40% of CO in the Asian plumecan be attributed to recent emissions from South Asia. The second largest contributorto ozone in the Asian plume appears to be lightning NOx associated with the ASM,contributing 6 to 11 ppbv (10–20%) to total O3 in the plume. In the westerlies, the sim-ulated ozone concentration variability appears to be associated with downward mixing15
of stratospheric air. The NMHC concentration in the westerlies is underestimated bythe model (see Table 4). As mentioned earlier, the simulated stratospheric contributionmay be overestimated thereby artificially reducing the photochemical ozone productionin polluted air masses from the North American continent.
6.3. Impact of increasing Asian NOx emissions on tropospheric ozone20
South Asia (notably India and China) is the fastest growing region in the world in termsof population and economic development. This may have a significant impact on ahemispheric scale on the atmospheric levels of ozone and ozone precursors (Lelieveldet al., 2001; Lelieveld and Dentener, 2000; Hauglustaine and Brasseur, 2001). Arelatively large increase is expected for Asian NOx-emissions in the next 25 years,25
due to the expected strong increase of fossil fuel use replacing biofuels (wood, dungand agricultural waste). Fossil fuel combustion generally produces lower CO and un-
2306
ACPD3, 2285–2330, 2003
Impact of monsoonoutflow from India
and Southeast Asia
H. A. Scheeren et al.
Title Page
Abstract Introduction
Conclusions References
Tables Figures
J I
J I
Back Close
Full Screen / Esc
Print Version
Interactive Discussion
c© EGU 2003
burned hydrocarbon emissions than smoldering biofuel burning, but is more stronglyNOx-producing because of higher temperature and pressure conditions. Assuming theIPCC IS92a growth emission scenario for a future (2025) atmospheric chemistry simu-lation with the ECHAM4 model, it was found that O3 in the Asian plume increases with∼7 ppbv, which is ∼14% of the present concentration. We note that this increase is only5
≤ 1 ppbv larger than in a future model run in which only NOx emissions are assumedto increase, illustrating again the NOx-limited conditions for photochemical ozone pro-duction in the Asian plume. Consistently, the correlation between observed ozone andtotal C2 − C7 NMHC concentrations is insignificant in the Asian plume, whereas in thewesterly plume a hydrocarbon-limited regime appears to dominate, as can be seen in10
Fig. 12.Our results agree with the model study of Stevenson et al. (2002), who simulated
an ozone increase around 20% in the Asian plume over the Mediterranean for ozoneprecursor emissions representative of 2030. Tropospheric ozone is an effective green-house gas accounting currently for ∼0.4 W m−2 of the global mean radiative forcing15
of climate, which is about 25% of the forcing by CO2 (Lelieveld and Dentener, 2000).This is relatively small compared to the radiative forcing due to the backscatter of solarradiation caused by anthropogenic aerosols over the eastern Mediterranean resultingin a cooling of about 6.6 W m−2 at the top of the atmosphere (Lelieveld et al., 2002;Markovic et al., 2002). While the radiative forcing of tropospheric ozone is likely to in-20
crease in the future, the aerosol radiative effect might decrease as result of the imple-mentation of cleaner combustion and fuel technologies and emission reduction mea-sures in Europe. On the other hand, higher ozone levels in the future Asian plume affectthe tropospheric ozone budget over Northern Africa and the (sub-)tropical Atlantic aswell, contributing to the oxidizing capacity of the atmosphere over these regions.25
2307

ACPD3, 2285–2330, 2003
Impact of monsoonoutflow from India
and Southeast Asia
H. A. Scheeren et al.
Title Page
Abstract Introduction
Conclusions References
Tables Figures
J I
J I
Back Close
Full Screen / Esc
Print Version
Interactive Discussion
c© EGU 2003
7. Summary and conclusions
Deep convection associated with the Asian summer monsoon followed by long-rangetransport carries Asian pollution towards the eastern Mediterranean and northernAfrica. Model studies indicate that this Asian plume is a yearly recurrent phenomenonover the Mediterranean. We present observations of trace species during MINOS in5
August 2001, showing that the Asian plume has a large impact on the chemical com-position of the upper troposphere over the eastern Mediterranean. Enhanced levelsof CO, and hydrocarbons were found to be comparable to or higher than those foundin westerly air masses, containing pollution from the North American continent. TheAsian plume shows a signature of biomass burning (notably from the use of biofuels)10
by enhanced concentrations of CO, acetylene, benzene, acetone, acetonitrile, methylchloride and chloroform, in agreement with observations from the 1999 INDOEX cam-paign in outflow from India. The mean photochemical age of the encountered Asianpollution is estimated to be about 2 weeks, based on the comparison of emission ra-tios relative to CO from MINOS with ER’s derived from INDOEX results, consistent15
with trajectory analysis. Acetone levels in the Asian plume are of the same magnitudeas those observed in the westerlies, exceeding upper tropospheric background levels.On the other hand, methanol levels are higher in the Asian plume, probably related toemissions from Asian biofuel use. The new automobile air conditioning agent HFC-134a was significantly enhanced above background values in air masses originating20
from North America, serving as a tracer for western pollution. The extensive fossilfuel use in North America is associated with relatively large CO2 concentrations in thewesterlies, correlating with enhanced HFC-134a.
In spite of high pollution levels in the Asian plume, ozone concentrations are stillrelatively low (∼55 ppbv) and show no clear relationship with higher hydrocarbons. This25
suggests a NOx-limited photochemical ozone production regime. Model simulations,carried out with a tropospheric chemistry-climate model, indicate that the expectedincrease of Asian emissions in the next few decades may enhance photochemically
2308

ACPD3, 2285–2330, 2003
Impact of monsoonoutflow from India
and Southeast Asia
H. A. Scheeren et al.
Title Page
Abstract Introduction
Conclusions References
Tables Figures
J I
J I
Back Close
Full Screen / Esc
Print Version
Interactive Discussion
c© EGU 2003
produced ozone in the Asian plume by about 14%.The influence of recent stratosphere-to-troposphere exchange is absent in the Asian
plume, but appears to have affected the chemical composition of air masses from west-erly origin. STE causes a significant enhancement of ozone concentrations while CO,and hydrocarbon concentrations are decreased. The Asian plume, on the other hand,5
represents a large reservoir of pollutants near the tropopause. Observations in the low-ermost stratosphere over the Aegean Sea suggest that troposphere-to-stratospheretransport of Asian pollution may have occurred during MINOS.
Acknowledgement. We gratefully acknowledge the excellent cooperation with the DLR Falconteam. We thank R. Scheele from the KNMI for computing the 10-day back trajectories. We are10
grateful to S. A. Montzka of NOAA/CMDL for providing halocarbon reference measurements.
References
Alternative Fluorocarbons Environmental Acceptability Study (AFEAS): Production and Salesof Fluorocarbons on http://www.afeas.org/production and sales.html, Arlington, VA, USA,2002.15
Atkinson, R. A., Baulch, D. L., Cox, R. A., Hampson-Jr., R. F., Kerr, J. A., Rossi, M. J., andTroe, J.: Evaluated kinetic, photochemical data and heterogeneous data for atmosphericchemistry – Supplement V, J. Phys. Chem. Ref. Data, 21, 521, 1997.
Brunner, D., Staehelin, J., Jeker, D., Wernli, H., and Schumann, U.: Nitrogen oxides and ozonein the tropopause region of the Northern Hemisphere: Measurements from commercial air-20
craft in 1995 / 1996 and 1997, J. Geophys. Res., 106, 27 673–27 699, 2001.Chen, P.: Isentropic cross-tropopause mass exchange in the extratropics, J. Geophys. Res.,
100, 16 661–16 673, 1995.Cooper, O. R., Moody, J. L., Parrish, D. D., Trainer, M., Ryerson, T. B., Holloway, J. S., Hubler,
G., Fehsenfeld, F. C., Oltmans, S. J., and Evans, M. J.: Trace gas signatures of the airstreams25
within North Atlantic cyclones: Case studies from the North Atlantic Regional Experiment(NARE’97) aircraft intensive, J. Geophys. Res., 106, 5437–5456, 2001.
de Gouw, J. A., Warneke, C., Scheeren, H. A., van der Veen, C., Bolder, M., Scheele, M. P.,Williams, J., Wong, S., Lange, L., Fischer, H., and Lelieveld, J.: Overview of the measure-
2309

ACPD3, 2285–2330, 2003
Impact of monsoonoutflow from India
and Southeast Asia
H. A. Scheeren et al.
Title Page
Abstract Introduction
Conclusions References
Tables Figures
J I
J I
Back Close
Full Screen / Esc
Print Version
Interactive Discussion
c© EGU 2003
ments onboard the Citation aircraft during the Intensive Field Phase of INDOEX, J. Geophys.Res., 106, 28 453–28 467, 2001.
Dethof, A., O’Neill, A., and Slingo, J.: Quantification of the isentropic mass transport across thedynamical tropopause, J. Geophys. Res., 105, 12 279–12 293, 2000.
Energy Information Administration (EIA): ’Emissions of Greenhouse gases in the United5
States 1997 – Halocarbons and Other Gases’ on http://www.eia.doe.gov/oiaf/1605/gg98rpt/halocarbons.html, Washington, DC, USA.
Fischer, H., de Reus, M., de Gouw, J., Warneke, C., Schlager, H., and Minikin, A.: Deepconvective injection of boundary layer air into the lowermost stratosphere at mid-latitudes,Atmos. Chem. Phys. Discuss., 2, 2003–2019, 2002.10
Fischer, H., Kormann, R., de Reus, M., Lawrence, M., Bruhl, C., von Kuhlmann, R., Warneke,C., de Gouw, J. Holzinger, R., Williams, J., and Lelieveld, J.: Formaldehyde over the EasternMediterranean during MINOS: Comparison of Airborne In-situ Measurements with 3D-ModelResults, Atmos. Chem. Phys., this issue, 2003.
Galballi, I. E. and Kirstine, W.: The production of methanol by flowering plants and the global15
cycle of methanol, J. Atmos. Chem., 3, 195–229, 2002.Good, P., Giannakopoulos, C., O’Connor, F. M., Arnold, S. R., de Reus M., and Schlager,
H.: Constraining tropospheric mixing timescales using airborne observations and numericalmodels, Atmos. Chem. Phys., this issue, 2003.
Gros, V., Williams, J., Krol, M., Berresheim, H., Salisbury, G., Hofmann, R., and Lelieveld, J.:20
Investigating source origins and photochemical processing of the VOCs during the MINOS-2001 campaign, Atmos. Chem. Phys., this issue, 2003.
Hastenrath, S.: Climate dynamics of the tropics, Atmospheric Sciences Library, volume 8,Kluwer Acadamic Publishers, Dordrecht, the Netherlands, 1991.
Hauglustaine, D. A., and Brasseur, G. P.: Evolution of tropospheric ozone under anthropogenic25
activities and associated radiative forcing of climate, J. Geophys. Res., 106, 32 337–32 360,2001.
Heland, J., Ziereis, H. Schlager, H., Hauser, C., Stock, P., Roiger, A., de Reus, M., Traub, M.,and Roelofs, G. -J.: Aircraft observations of trace gas correlations during MINOS 2001 - casestudies on the origin of air masses, Atmos. Chem. Phys., this issue, 2003.30
Holzinger, R., Klupfel, T., Salisbury, G., Williams, J., de Reus, M., Fischer, H., Traub, M.,Crutzen, P. J., and Lelieveld, J.: Assessing the biomass burning contribution to the tropop-sheric burden of CO, acetone, methanol and PAN over the eastern Mediterranean, Atmos.
2310

ACPD3, 2285–2330, 2003
Impact of monsoonoutflow from India
and Southeast Asia
H. A. Scheeren et al.
Title Page
Abstract Introduction
Conclusions References
Tables Figures
J I
J I
Back Close
Full Screen / Esc
Print Version
Interactive Discussion
c© EGU 2003
Chem. Phys., this issue, 2003.Houweling, S., Dentener, F., Lelieveld, J., Walter, B, and Dlugokencky, E.: The modeling of
tropospheric methane: How well can point measurements be reproduced by a global model?,J. Geophys. Res., 105, 8981–9002, 2000.
Hsu, H., Terng, C., and Chen, C.: Evolution of Large-Scale Circulation and Heating during the5
first transition of Asian summer monsoon, J. Climate, 12, 793–810, 1999.Jacob, D. J., Field, B. D., Jin, E. M., Bey, I., Li, Q., Logan, J. A., and Yantosca, R. M.: Atmo-
spheric budget of acetone, J. Geophys. Res., 107, doi: 10.1029/201JD000694, 2002.Jeker, D. P., Pfister, L., Thompson, A. M., Brunner, D., Boccipio, D. J., Pickering, K. E., Wernli,
H., Kondo, Y., and Staehelin, J.: Measurements of nitrogen oxides at the tropopause: At-10
tribution to convection and correlation with lightning, J. Geophys. Res., 105, 3679–3700,2000.
Jobson, B. T., Parrish, D. D., Goldan, P., Kuster, W., Fehsenfeld, F. C., Blake, D. R., Blake, N.J., and Niki, H.: Spatial and temporal variability of non-methane hydrocarbon mixing ratiosand their relation to photochemical lifetime, J. Geophys. Res., 103, 13 557–13 567, 1998.15
Kanakidou, M., Dentener, F. J., and Crutzen, P. J.: A global three-dimensional study of the fateof HCFCs and HFC-134a in the troposphere, J. Geophys. Res., 100, 18 781–18 880, 1995.
Keene, W. C., Khalil, M. A. K., Erickson, D. J., McCulloch, A., Greadel, T. E., Lobert, J. M.,Aucott, M. L., Gong, S. -L., Harper, D. B., Kleinman, G., Midley, P., Moore, R. A., Seuzaret,C., Sturges, W. T., Benkovitz, C. M., Koropalov, V., Barrie, L. A., and Li, Y. -F.: Composite20
global emissions of reactive chlorine from anthropogenic and natural sources: The ReactiveChlorine Emissions Inventory, J. Geophys. Res., 104, 8429–8440, 1999.
Kouvarakis, K., Tsigaridis, K., Kanakidou, M., and Mihalopoulos, N.: Temporal variations ofsurface regional background ozone over Crete island in the southeast Mediterranean, J.Geophys. Res., 105, 4399–4407, 2000.25
Lawrence, M. G., Rasch, P. J., von Kuhlmann, R., Williams, J., Fischer, H., de Reus, M.,Lelieveld, J., Crutzen, P. J., Huntrieser, H., Heland, J., Stohl, A., Forster, C., Schultz, M.,Stier, P., and Dickerson, R.: Chemical weather forecasting as a tool for field campaign plan-ning: Predictions and observations of large-scale features during INDOEX, MINOS, andCONTRACE, Atmos. Chem. Phys. Discuss., 2, 1545–1597, 2002.30
Lee-Taylor, J. M., Brasseur, G. P., and Yokouchi, Y.: A preliminary three-dimensional globalmodel study of atmospheric methyl chloride distributions, J. Geophys. Res., 106, 34 221–34 233, 2001.
2311

ACPD3, 2285–2330, 2003
Impact of monsoonoutflow from India
and Southeast Asia
H. A. Scheeren et al.
Title Page
Abstract Introduction
Conclusions References
Tables Figures
J I
J I
Back Close
Full Screen / Esc
Print Version
Interactive Discussion
c© EGU 2003
Lelieveld, J. and Dentener, F. J.: What controls tropospheric ozone?, J. Geophys. Res., 105,3531–3551, 2000.
Lelieveld, J., Crutzen, P. J., Ramanathan, V., Andreae, M. O., Brenninkmeijer, C. A. M., Cam-pos, T., Cass, G. R., Dickerson, R. R., Fischer, H., de Gouw, J. A., Hansel, A., Jefferson,A., Kley, D., de Laat, A. T. J., Lal, S., Lawrence, M. G., Lobert, J. M., Mayol- Bracero, O.,5
Mitra, A. P., Novakov, T., Oltmans, S. J., Prather, K. A., Reiner, T., Rodhe, H., Scheeren, H.A., Sikka, D., and Williams, J.: The Indian Ocean Experiment: widespread air pollution fromSouth and South-East Asia, Science, 291, 1031–1036, 2001.
Lelieveld, J., Berresheim, H., Bormann, S., Crutzen, P. J., Dentener, F. J., Fischer, H., Feichter,J., Flatau, P. J., Heland, J., Holzinger, R., Kormann, R., Lawrence, M. G., Levin, Z., Markow-10
icz, K. M., Mihalopoulos, N., Minikin, A., Ramanathan, V., de Reus, M., Roelofs, G. -J.,Scheeren, H. A., Scaire, J., Schlager, H., Schultz, M., Siegmund, P., Steil, B., Stephanou,E. G., Stier, P., Traub, M., Warneke, C., Williams, J., and Ziereis, H.: Global air pollutioncrossroads over the Mediterranean, Science, 298, 794–799, 2002.
Lindinger, W., Hansel, A., and Jordan, A.: On-line monitoring of volatile organic compounds15
at pptv level by means of Proton-Transfer-Reaction Mass Spectrometry (PTR-MS) – Medi-cal applications, food control, and environmental research, Int. J. Mass Spectrom. Ion Pro-cesses, 173, 191–241, 1998.
Markowicz, K. M., Flatau, P. J., Ramana, M. V., Crutzen, P. J., and Ramanathan, V.: Absorb-ing Mediterranean aerosols lead to a large reduction in the solar radiation at the surface,20
Geophys. Res. Lett., 29, 20, 1968, doi: 10.1029/2002GL015767, 2002.Matsueda, H., Inoue, H. Y., and Ishii, M.: Aircraft observation of carbon at 8–13 km altitude over
the western Pacific from 1993 to 1999, Tellus, 54B, 1–21, 2002.Millan, M. M., Salvador, R., Mantilla, E., and Kallos, G.: Photo-oxidant dynamics in the Mediter-
ranean basin in summer: Results from European research projects, J. Geophys. Res., 102,25
8811–8823, 1997.Minikin, A., Mihalopolous, N., Economou, C., Sciare, J., Schneider, J., Levin, Z., Teller, A.,
Ganor, E., Stein, C., Berresheim, H., de Reus, M., Rasch, P., Chourdakis, G., and Papayan-nis, A.: Tropospheric vertical profiles of aerosol properties in the eastern Mediterraneanregion in summer 2001 (MINOS campaign), Atmos. Chem. Phys., this issue, 2003.30
Olivier, J. G. J, Bouwman, A. F., van der Maas, C. W. M., M. Berdowski, J. J., Veldt, C., Bloos,J. P. J., Visschendijk, A. J. H., Zandveld P. Y. J., and Haverlag, J. L.,: Description of EDGARversion 2.0. Report No. 771060 002. Bilthoven (The Netherlands), RIVM, 1996.
2312

ACPD3, 2285–2330, 2003
Impact of monsoonoutflow from India
and Southeast Asia
H. A. Scheeren et al.
Title Page
Abstract Introduction
Conclusions References
Tables Figures
J I
J I
Back Close
Full Screen / Esc
Print Version
Interactive Discussion
c© EGU 2003
Prinn, R. G, Weiss, R. F., Fraser, P. J., Simmonds, P. G., Cunnold, D. M., Alya, F. N., O’Doherty,S., Salameh, P., Miller, B. R., Huang, J., Wang, R. H. J., Harley, D. E., Harth, C., Steele,L. P., Sturrock, G., Midley, P. M., and McCulloch, A.: A history of chemically and radiativelyimportant gases in air deduced from ALE/GAGE/AGAGE, J. Geophys. Res., 105, 17 751–17 792, 2000.5
Roelofs, G.-J. and Lelieveld, J.: Tropospheric ozone simulation with a global chemistry-climatemodel: Influence of higher hydrocarbon chemistry, J. Geophys. Res., 105, 22 697–22 711,2000.
Roelofs, G. -J., Scheeren, H. A., Kentarchos, T., and Lelieveld, J.: Distribution and origin ofozone in the eastern Mediterranean free troposphere, Atmos. Chem. Phys., this issue, 2003.10
Scheele, M. P., Siegmund, P. C., and van Velthoven, P. F. J.: Sensitivity of trajectories to dataresolution and its dependence on the starting point: In or outside a tropopause fold, Meteorol.Appl., 3, 267–273, 1996.
Scheeren, H. A., Lelieveld, J., de Gouw, J. A., van der Veen, C., and Fischer, H.: Methylchloride and other chlorocarbons in polluted air during INDOEX, J. Geophys. Res., 107, doi:15
10.1029/2001JD001121, 2002.Singh, H. B., Kanakidou, M., Crutzen, P. J., and Jacob, D. J.: High concentrations and pho-
tochemical fate of oxygenated hydrocarbons in the global troposphere, Nature, 378, 50–54,1995.
Stevenson, D., Johnson, C., Collins, B., and Derwent, D.: Projected changes in global tro-20
pospheric ozone to 2030, poster at the International Global Atmospheric Chemistry (IGAC)conference, Crete, Greece, 2002.
Stohl, A. and Trickl, T.: A textbook example of long-range transport: Simultaneous observationsof ozone maxima of stratospheric and North American origin in the free troposphere overEurope, J. Geophys. Res., 104, 30 445–30 462, 1999.25
Stohl A., Haimberger, L., Scheele M. P., and Wernli H.: An intercomparison of results fromthree trajectory models, Meteorol. Appl., 8, 127–135, 2001.
Strahan, S. E., Douglas, A. R., Nielsen, J. E., and Boering, K. A.: The CO2 seasonal cycle asa tracer of transport, J. Geophys. Res., 103, 13 729–13 741, 1998.
Traub, M., Fischer, H., de Reus, M., Kormann, R., Heland, J., Ziereis, H., Schlager, H.,30
Holzinger, R., Williams, J., Warneke, C., de Gouw, J., and Lelieveld, J.: Chemical char-acteristics assigned to trajectory clusters during the MINOS campaign, Atmos. Chem. Phys.,this issue, 2003.
2313

ACPD3, 2285–2330, 2003
Impact of monsoonoutflow from India
and Southeast Asia
H. A. Scheeren et al.
Title Page
Abstract Introduction
Conclusions References
Tables Figures
J I
J I
Back Close
Full Screen / Esc
Print Version
Interactive Discussion
c© EGU 2003
Veldt, C. and Berdowski, J. J. M.: GEAI-note on the combustion of biomass fuels (emissionfactors for CO, CH4 and NMVOC), TNO Rep. R94/218, Inst. Of Environ. Sci., Neth. Org. forAppl. Sci. Res., Delft, The Netherlands, 1995.
Wienhold, F. G., Fischer, H., Hoor, P., Wagner, V., Konigstedt, R., Harris, G. W., Anders, J.,Grisar, R., Knothe, M. Riedel, W. J. Lubken, F. -J., and Schilling, T.: TRISTAR – a tracer5
in-situ TDLAS for atmospheric research, Appl. Phys. B, 67, 411–417, 1998.World Resources Institute (WRI): Global Motor Vehicle Fleet on http://www.wri.org/wr-98-99/
autos2.htm, Washington DC, USA, 2002.Yokouchi, Y., Nojiri, Y., Barrie, L. A., Toom-Sauntry, D., Machida, T., Inuzka, Y., Akimoto, H., Li,
H. -J., Fujinuma, Y., and Aoki, S.: A strong source of methyl chloride to the atmosphere from10
tropical coastal land, Nature, 403, 295–298, 2000.Ziereis, H., Schlager, H., Schulte, P., Kohler, I., Marquardt, R., and Feigl, C.: In situ measure-
ments of the NOx distribution and variability over the eastern North Atlantic, J, Geophys.Res., 104, 16 021–16 032, 1999.
2314

ACPD3, 2285–2330, 2003
Impact of monsoonoutflow from India
and Southeast Asia
H. A. Scheeren et al.
Title Page
Abstract Introduction
Conclusions References
Tables Figures
J I
J I
Back Close
Full Screen / Esc
Print Version
Interactive Discussion
c© EGU 2003
Table 1. Means and 1σ standard deviation of trace gas concentrations observed in the up-per troposphere (6–13 km altitude) for different air mass origins based on 10-day backwardtrajectory analysis. Air masses with a recent history of stratosphere-to-troposphere exchangewere excluded from the data set. The regions of origin are 0◦–170◦ W by 20◦–50◦ N for NorthAmerica/North Atlantic and 40◦–110◦ E by 5◦–40◦ N for South Asia
34
Tables
Table 1. Means and 1s standard deviation of trace gas concentrations observed in the upper
troposphere (6 - 13 km altitude) for different air mass origins based on 10-day backward
trajectory analysis. Air masses with a recent history of stratosphere-to-troposphere
exchange were excluded from the data set. The regions of origin are 0∞ - 170∞ W by 20∞ -
50∞ N for North America/North Atlantic and 40∞ - 110∞ E by 5∞ - 40∞N for South Asia.
Species
North America/
North Atlantic
South Asia
O3 ppbv 73 (18) 57 (8)
CO ppbv 74 (12) 102 (4)
CO2 ppmv 368 (3) 362 (2)
CH4 ppbv 1819 (26) 1882 (21)
NO ppbv 0.1 (0.08) 0.1 (0.05)
NOy ppbv 0.75 (0.34) 0.59 (0.14)
PAN pptv 278 (144) 328 (71)
H2O–vapor g/kg 0.23 (0.27) 0.05 (0.04)
CH3OH pptv 610 (308) 1006 (199)
CH3CN pptv 126 (12) 168 (32)
CH3COCH3 pptv 957 (331) 1093 (106)
C2H6 pptv 319 (72) 448 (57)
C2H2 pptv 44 (36) 186 (44)
C3H8 pptv 54 (39) 58 (13)
n-C4H10 pptv 12 (11) 8 (2)
n-C5H12 pptv 6 (8) 2 (1)
C6H6 pptv 11 (19) 14 (5)
C7H8 pptv 3 (3) 1 (1)
C2-C7 ppbC 1.15 (0.48 1.65 (0.26)
CH3Cl pptv 576 (19) 675 (22)
CH2Cl2 pptv 20 (6) 23 (3)
CHCl3 pptv 5.4 (1.4) 7.6 (1.0)
C2Cl4 pptv 1.8 (1.3) 1.0 (0.3)
CFC-12 pptv 561 (12) 551 (5)
CFC-11 pptv 263 (8) 270 (3)
HFC-134a pptv 25.0 (3.4) 19.0 (2.2)
HCFC-142b pptv 13.6 (1.7) 13.0 (1.7)
HCFC-141b pptv 14.0 (4.7) 13.5 (2.4)
2315

ACPD3, 2285–2330, 2003
Impact of monsoonoutflow from India
and Southeast Asia
H. A. Scheeren et al.
Title Page
Abstract Introduction
Conclusions References
Tables Figures
J I
J I
Back Close
Full Screen / Esc
Print Version
Interactive Discussion
c© EGU 2003
Table 2. Comparison between biomass burning Emission Ratios (ER) relative to CO fromINDOEX (ER0) with ER’s derived for the MINOS Asian plume (ERt). Standard deviation (1σ)of ER between parentheses. A best match is achieved when assuming a photochemical ageof the Asian plume of ∼13 days (at mean temperature and pressure of 235 K and 225 hPameasured in the Asian plume and a diurnal mean OH concentration of ∼ 1 × 10⁶ moleculescm−3 estimated by the ECHAM model for 6–12 km altitude)
35
Table 2. Comparison between biomass burning Emission Ratios (ER) relative to CO from
INDOEX (ER0) with ER’s derived for the MINOS Asian plume (ERt). Standard deviation (1s)
of ER between parentheses. A best match is achieved when assuming a photochemical age
of the Asian plume of ~13 days (at mean temperature and pressure of 235 K and 225 hPa
measured in the Asian plume and a diurnal mean OH concentration of ~1 ¥ 106 molecules
cm-3 estimated by the ECHAM model for 6 - 12 km altitude).
Emission species ER0
pptv ppbv-1
MINOS ERt
pptv ppbv-1
MINOS ERt at
-5 days -10 days -13 days
CH3CNa 1.1(0.4) 1.5 (0.3) 1.44 1.36 1.31
CH3Clb 1.98 (0.24) 2.32 (0.28) 2.17 2.05 1.98
C2H2a 3.3 (0.2) 5.1(0.3) 5.9 6.8 7.4
C6H6a 0.95 (0.05) 0.32 (0.08) 0.48 0.72 0.92
ade Gouw et al. (2001)
bScheeren et al. (2002)
Table 3. Indications of Asian pollution observed in the upper tropopause/lower stratosphere
region (PV > 3.0) on August 16, 2002 over the eastern Mediterranean at an altitude of 10.5 -
12.8 km. Shown are mean values and 1s standard deviation.
Air mass
origin
PV
PV-units
O3
ppbv
CO
ppbv
NMHC
ppbC
CH3Cl
pptv
Acetone
pptv
Methanol
pptv
Westerly 3.8 (0.2) 149 (6) 51 (1) 0.54 (0.02) 571 (4) 522 (65) 100 (128)
Easterly 3.2 (0.6) 103 (5) 60 (1) 0.71 (0.07) 600 (10) 412 (61) 263 (126)
2316

ACPD3, 2285–2330, 2003
Impact of monsoonoutflow from India
and Southeast Asia
H. A. Scheeren et al.
Title Page
Abstract Introduction
Conclusions References
Tables Figures
J I
J I
Back Close
Full Screen / Esc
Print Version
Interactive Discussion
c© EGU 2003
Table 3. Indications of Asian pollution observed in the upper tropopause/lower stratosphereregion (PV > 3.0) on 16 August 2002 over the eastern Mediterranean at an altitude of 10.5–12.8 km. Shown are mean values and 1σ standard deviation
35
Table 2. Comparison between biomass burning Emission Ratios (ER) relative to CO from
INDOEX (ER0) with ER’s derived for the MINOS Asian plume (ERt). Standard deviation (1s)
of ER between parentheses. A best match is achieved when assuming a photochemical age
of the Asian plume of ~13 days (at mean temperature and pressure of 235 K and 225 hPa
measured in the Asian plume and a diurnal mean OH concentration of ~1 ¥ 106 molecules
cm-3 estimated by the ECHAM model for 6 - 12 km altitude).
Emission species ER0
pptv ppbv-1
MINOS ERt
pptv ppbv-1
MINOS ERt at
-5 days -10 days -13 days
CH3CNa 1.1(0.4) 1.5 (0.3) 1.44 1.36 1.31
CH3Clb 1.98 (0.24) 2.32 (0.28) 2.17 2.05 1.98
C2H2a 3.3 (0.2) 5.1(0.3) 5.9 6.8 7.4
C6H6a 0.95 (0.05) 0.32 (0.08) 0.48 0.72 0.92
ade Gouw et al. (2001)
bScheeren et al. (2002)
Table 3. Indications of Asian pollution observed in the upper tropopause/lower stratosphere
region (PV > 3.0) on August 16, 2002 over the eastern Mediterranean at an altitude of 10.5 -
12.8 km. Shown are mean values and 1s standard deviation.
Air mass
origin
PV
PV-units
O3
ppbv
CO
ppbv
NMHC
ppbC
CH3Cl
pptv
Acetone
pptv
Methanol
pptv
Westerly 3.8 (0.2) 149 (6) 51 (1) 0.54 (0.02) 571 (4) 522 (65) 100 (128)
Easterly 3.2 (0.6) 103 (5) 60 (1) 0.71 (0.07) 600 (10) 412 (61) 263 (126)
2317

ACPD3, 2285–2330, 2003
Impact of monsoonoutflow from India
and Southeast Asia
H. A. Scheeren et al.
Title Page
Abstract Introduction
Conclusions References
Tables Figures
J I
J I
Back Close
Full Screen / Esc
Print Version
Interactive Discussion
c© EGU 2003
Table 4. Comparison between measurements (MINOS) and model simulations (ECHAM) forO3, CO, C2 − C5 alkanes (PAR) and NOy species. Mean concentrations (and 1σ standarddeviation) and the model/measurement ratios R are shown for the Asian plume and westerlyair masses > 6 km altitude (includes North American and North Atlantic air masses)
36
Table 4. Comparison between measurements (Obs.) and model simulations (Model) for O3,
CO, C2-C5 alkanes (PAR) and NOy species. Mean concentrations (and 1s standard
deviation) and the model/measurement ratios R (Model/Obs.) are shown for the Asian
plume and westerly air masses >6 km altitude (includes North American and North Atlantic
air masses).
O3 ppbv CO ppbv PAR ppbC NO pptv NOy ppbv
MINOS Asian plume 57 (8) 102 (4) 1.12 (0.15) 0.11 (0.05) 0.59 (0.14)
ECHAM Asian plume 51 (3) 111 (6) 1.41 (0.17) 0.03 (0.01) 0.47 (0.03)
MINOS westerlies 73 (18) 74 (12) 0.91 (0.32) 0.11 (0.08) 0.76 (0.34)
ECHAM westerlies 76 (17) 73 (7) 0.34 (0.14) 0.04 (0.02) 0.49 (0.06)
R-Asia 0.90 (0.14) 1.11 (0.09) 1.27 (0.17) 0.31 (0.08) 0.83 (0.20)
R-westerlies 1.10 (0.34) 1.01 (0.18) 0.42 (0.24) 0.57 (0.44) 0.79 (0.44)
2318

ACPD3, 2285–2330, 2003
Impact of monsoonoutflow from India
and Southeast Asia
H. A. Scheeren et al.
Title Page
Abstract Introduction
Conclusions References
Tables Figures
J I
J I
Back Close
Full Screen / Esc
Print Version
Interactive Discussion
c© EGU 2003
-10
0
10
20
30
40
50
60
70
-200 -150 -100 -50 0 50 100 150
PV > 3; O3 > 90 ppbvwesterlieswesterlies; WCBSouth Asia
latit
ude
longitude
NorthAmerica
(Sub-tropical) North Atlantic
South Asia
200
400
600
800
1000-200 -150 -100 -50 0 50 100 150
Pre
ssur
e (h
Pa)
longitude
North America (Sub-tropical) North Atlantic
South Asia
Crete
Fig. 1. Results from a 10-day backward trajectory analysis based on ECMWF wind fields. Thetrajectories were computed for the times and locations of air samples collected during 2 and22 August (1 to 2 trajectories per flight level of ∼15 min). The shaded areas denote the airmass origins, being North America, the (subtropical) North Atlantic and South Asia. Orangetrajectories relate to South Asia (dashed lines denote 5 days backward), in light green westerlytrajectories ending between 8 and 13 km altitude are shown, in purple between 6 and 8 km. Bluetrajectories indicate air masses which have been subject to stratosphere-troposphere exchangebased on their PV-history.
2319

ACPD3, 2285–2330, 2003
Impact of monsoonoutflow from India
and Southeast Asia
H. A. Scheeren et al.
Title Page
Abstract Introduction
Conclusions References
Tables Figures
J I
J I
Back Close
Full Screen / Esc
Print Version
Interactive Discussion
c© EGU 2003
50 100 150
N. AtlanticN. AmericaWCBEuropeS. Asia
0
2
4
6
8
10
12
ppbv
O3
Alti
tude
[km
]
50 100 150 200ppbv
CO
0.1 0.2 0.3 0.4ppbv
NO
1 2 3ppbv
NOy
200 400 600 800 1000 1200pptv
PAN
350 355 360 365 370 3750
2
4
6
8
10
12
ppmv
CO2
Alti
tude
[km
]
1800 1900 2000
ppbv
CH4
100 200 300 400 500pptv
C2H2
100 200 300 400 500
pptv
C3H8
50 100 150 200 250pptv
n-C4H10
0 20 40 60 80 100 120 1400
2
4
6
8
10
12
pptv
C6H6
Alti
tude
[km
]
150 200 250pptv
CH3CN
1000 2000 3000 400pptv
CH3COCH
3
1500 3000 4500
pptv
CH3OH
550 600 650 700pptv
CH3Cl
10 20 30 40 50 600
2
4
6
8
10
12
pptv
CH2Cl2
Alti
tude
[km
]
2 4 6 8 10 12 14pptv
CHCl3
2 4 6 8 10 12 14pptv
C2Cl4
15 20 25 30 35pptv
HFC-134a
10 15 20pptv
HCFC-142b
Alti
tude
[km
]A
ltitu
de [k
m]
Alti
tude
[km
]A
ltitu
de [k
m]
Fig. 2. Altitude profiles of gases measured between 3 and 22 August over the eastern Mediter-ranean. The data points (other than C2 − C6 NMHC) correspond to the mean of ∼5 min in-situmeasurements coinciding with the collection of an air samples (1–2 per flight level of ∼15 min),while the error bars reflect the variability (1σ standard deviation). Color coding denotes theair mass origin (light green: North America, dark green: North Atlantic, orange: South Asia,purple: WCB pollution transport from eastern North America, red: southern European pollutionfrom deep convection). 2320
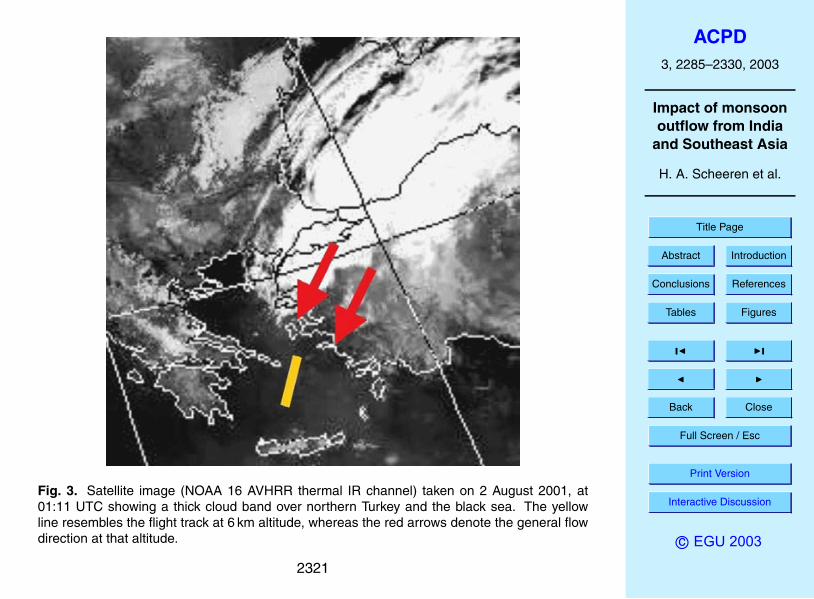
ACPD3, 2285–2330, 2003
Impact of monsoonoutflow from India
and Southeast Asia
H. A. Scheeren et al.
Title Page
Abstract Introduction
Conclusions References
Tables Figures
J I
J I
Back Close
Full Screen / Esc
Print Version
Interactive Discussion
c© EGU 2003
Fig. 3. Satellite image (NOAA 16 AVHRR thermal IR channel) taken on 2 August 2001, at01:11 UTC showing a thick cloud band over northern Turkey and the black sea. The yellowline resembles the flight track at 6 km altitude, whereas the red arrows denote the general flowdirection at that altitude.
2321
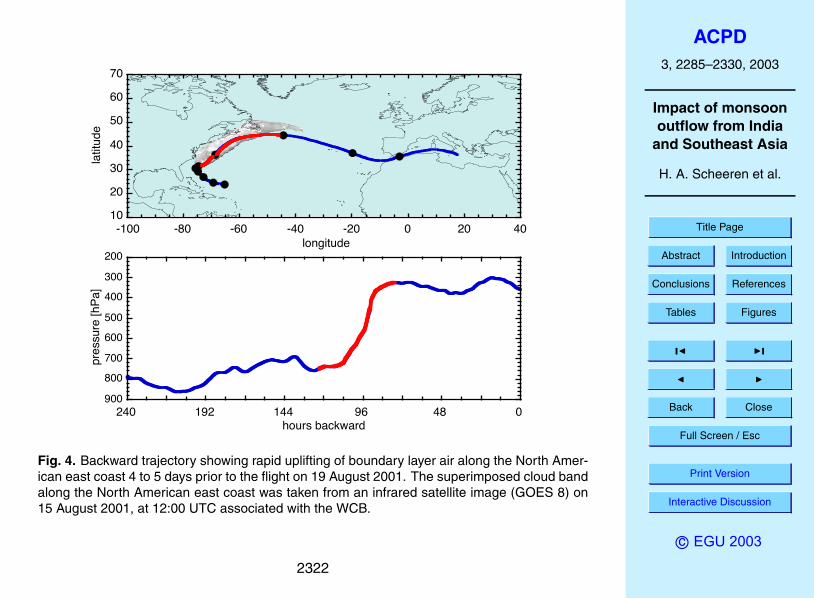
ACPD3, 2285–2330, 2003
Impact of monsoonoutflow from India
and Southeast Asia
H. A. Scheeren et al.
Title Page
Abstract Introduction
Conclusions References
Tables Figures
J I
J I
Back Close
Full Screen / Esc
Print Version
Interactive Discussion
c© EGU 2003
10
20
30
40
50
60
70
-100 -80 -60 -40 -20 0 20 40
latit
ude
longitude200
300
400
500
600
700
800
90004896144192240
pres
sure
[hP
a]
hours backward
Fig. 4. Backward trajectory showing rapid uplifting of boundary layer air along the North Amer-ican east coast 4 to 5 days prior to the flight on 19 August 2001. The superimposed cloud bandalong the North American east coast was taken from an infrared satellite image (GOES 8) on15 August 2001, at 12:00 UTC associated with the WCB.
2322
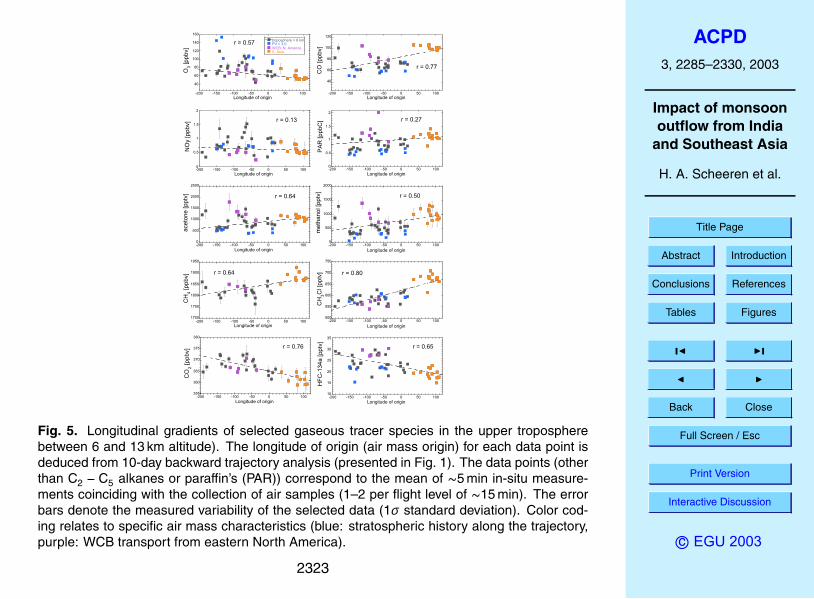
ACPD3, 2285–2330, 2003
Impact of monsoonoutflow from India
and Southeast Asia
H. A. Scheeren et al.
Title Page
Abstract Introduction
Conclusions References
Tables Figures
J I
J I
Back Close
Full Screen / Esc
Print Version
Interactive Discussion
c© EGU 2003
40
60
80
100
120
140
160
-200 -150 -100 -50 0 50 100
troposphere > 6 km PV > 3.0WCB; N. AmericaS. Asia
O3
[ppb
v]
Longitude of origin
r = 0.57
40
60
80
100
120
-200 -150 -100 -50 0 50 100
CO
[ppb
v]
Longitude of origin
r = 0.77
0
0.5
1
1.5
2
-200 -150 -100 -50 0 50 100
NO
y [p
pbv]
Longitude of origin
r = 0.13
0
0.5
1
1.5
2
-200 -150 -100 -50 0 50 100
PA
R [p
pbC
]
Longitude of origin
r = 0.27
0
500
1000
1500
2000
2500
-200 -150 -100 -50 0 50 100
acet
one
[ppt
v]
Longitude of origin
r = 0.64
0
500
1000
1500
2000
-200 -150 -100 -50 0 50 100
met
hano
l [pp
tv]
Longitude of origin
r = 0.50
1700
1750
1800
1850
1900
1950
-200 -150 -100 -50 0 50 100
CH
4 [p
pbv]
Longitude of origin
r = 0.64
500
550
600
650
700
750
-200 -150 -100 -50 0 50 100C
H3C
l [pp
tv]
Longitude of origin
r = 0.80
355
360
365
370
375
380
-200 -150 -100 -50 0 50 100
CO
2 [p
pbv]
Longitude of origin
r = 0.76
10
15
20
25
30
35
-200 -150 -100 -50 0 50 100
HF
C-1
34a
[ppt
v]
Longitude of origin
r = 0.65
Fig. 5. Longitudinal gradients of selected gaseous tracer species in the upper tropospherebetween 6 and 13 km altitude). The longitude of origin (air mass origin) for each data point isdeduced from 10-day backward trajectory analysis (presented in Fig. 1). The data points (otherthan C2 − C5 alkanes or paraffin’s (PAR)) correspond to the mean of ∼5 min in-situ measure-ments coinciding with the collection of air samples (1–2 per flight level of ∼15 min). The errorbars denote the measured variability of the selected data (1σ standard deviation). Color cod-ing relates to specific air mass characteristics (blue: stratospheric history along the trajectory,purple: WCB transport from eastern North America).
2323

ACPD3, 2285–2330, 2003
Impact of monsoonoutflow from India
and Southeast Asia
H. A. Scheeren et al.
Title Page
Abstract Introduction
Conclusions References
Tables Figures
J I
J I
Back Close
Full Screen / Esc
Print Version
Interactive Discussion
c© EGU 2003
0
500
1000
1500
2000
20 40 60 80 100 120
methanol; r = 0.89acetone; r = 0.80
mix
ing
ratio
[ppt
v]
CO [ppbv]
0
500
1000
1500
2000
0.5 1 1.5 2 2.5 3
methanol; r = 0.65acetone; r = 0.82
mix
ing
ratio
[ppt
v]
C2 - C7 NMHC [ppbC]
Fig. 6. Correlation of methanol and acetone with CO and C2 − C7 NMHC in the free tropo-sphere (> 6 km) during MINOS (r at the 95% significance level). The error bars show the 1σstandard deviation of the data points.
2324

ACPD3, 2285–2330, 2003
Impact of monsoonoutflow from India
and Southeast Asia
H. A. Scheeren et al.
Title Page
Abstract Introduction
Conclusions References
Tables Figures
J I
J I
Back Close
Full Screen / Esc
Print Version
Interactive Discussion
c© EGU 2003
350 355 360 365 370 375 38010
15
20
25
30
35
S. AsiaN. AtlanticN. America
CO2 [ppmv]
HC
F-1
34a
[ppt
v]
r = 0.61
350 355 360 365 370 375 3801750
1800
1850
1900
1950
CO2 [ppmv]
CH
4 [ppb
v]
r = 0.62
350 355 360 365 370 375 380520
560
600
640
680
CO2 [ppmv]
CH
3Cl [
pptv
]
r = 0.59
350 355 360 365 370 375 38080
100
120
140
160
180
200
220
240
CO2 [ppmv]
CH
3CN
[ppt
v]
r = 0.52
Fig. 7. Correlation of HCF-134a (North American pollution tracer), CH4 (tropical air masstracer), CH3Cl and CH3CN (biomass burning tracers) with CO2 (r at the 95% significance level)in the upper troposphere (> 6 km). Orange dots relate to a South Asian origin, blue to the (sub-tropical) northern Atlantic, and green to North America. The error bars denote the measuredvariability of the data points (1σ standard deviation).
2325
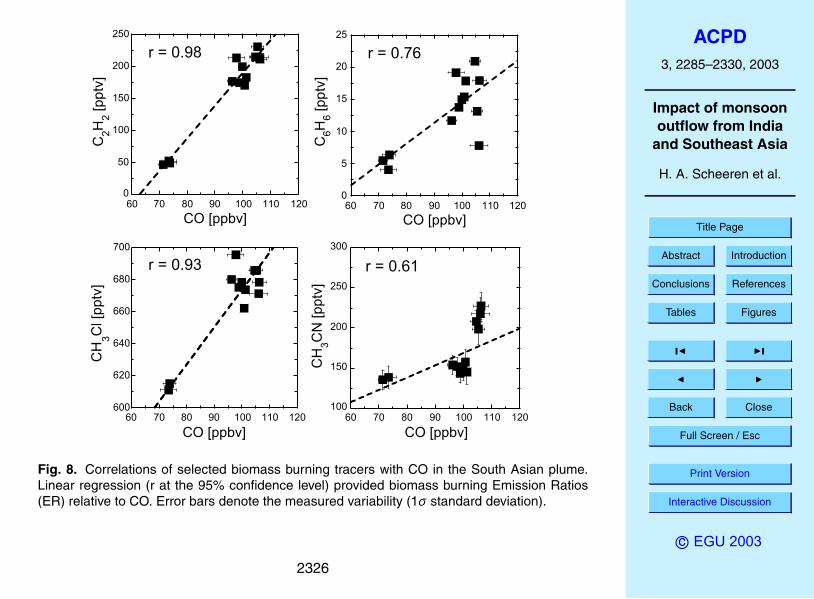
ACPD3, 2285–2330, 2003
Impact of monsoonoutflow from India
and Southeast Asia
H. A. Scheeren et al.
Title Page
Abstract Introduction
Conclusions References
Tables Figures
J I
J I
Back Close
Full Screen / Esc
Print Version
Interactive Discussion
c© EGU 2003
0
50
100
150
200
250
60 70 80 90 100 110 120
C2H
2 [ppt
v]
CO [ppbv]
r = 0.98
0
5
10
15
20
25
60 70 80 90 100 110 120
C6H
6 [p
ptv]
CO [ppbv]
r = 0.76
600
620
640
660
680
700
60 70 80 90 100 110 120
CH
3Cl [
pptv
]
CO [ppbv]
r = 0.93
100
150
200
250
300
60 70 80 90 100 110 120
CH
3CN
[ppt
v]
CO [ppbv]
r = 0.61
Fig. 8. Correlations of selected biomass burning tracers with CO in the South Asian plume.Linear regression (r at the 95% confidence level) provided biomass burning Emission Ratios(ER) relative to CO. Error bars denote the measured variability (1σ standard deviation).
2326

ACPD3, 2285–2330, 2003
Impact of monsoonoutflow from India
and Southeast Asia
H. A. Scheeren et al.
Title Page
Abstract Introduction
Conclusions References
Tables Figures
J I
J I
Back Close
Full Screen / Esc
Print Version
Interactive Discussion
c© EGU 2003
0
10
20
30
40
50
60
70
-132 -88 -44 0 44
latit
ude
longitude
Asian plume
100
120
140
160
180
200
22004896144192240
pres
sure
[hP
a]
hours backward
Fig. 9. Ten-day backward trajectories for air masses sampled in the tropopause/lower strato-sphere region during 16 August (flight 8) over the eastern Mediterranean. The shaded areadenotes the geographical range where the Asian plume affects atmospheric chemistry duringAugust 2001, based on model simulations.
2327

ACPD3, 2285–2330, 2003
Impact of monsoonoutflow from India
and Southeast Asia
H. A. Scheeren et al.
Title Page
Abstract Introduction
Conclusions References
Tables Figures
J I
J I
Back Close
Full Screen / Esc
Print Version
Interactive Discussion
c© EGU 2003
40
60
80
100
120
140
-200 -150 -100 -50 0 50 100
ECHAM simulation measurementsPV > 3.0WCB; N. America S. Asia
CO
[ppb
v]
Longitude of origin
Asian plume
20
40
60
80
100
120
140
160
-200 -150 -100 -50 0 50 100
O3
[ppb
v]
Longitude of origin
Asian plume
0
0.5
1
1.5
2
-200 -150 -100 -50 0 50 100
NO
y [p
pbv]
Longitude of origin
Asian plume
0
0.5
1
1.5
2
-200 -150 -100 -50 0 50 100
PA
R [p
pbv]
Longitude of origin
Asian plume
Fig. 10. Comparison between simulated and observed longitudinal gradients of CO, O3, NOyand C2 − C5 alkanes (paraffin’s; PAR). The model output is shown by the solid line (weightedfit through the model output). The error bars on the measurement points of CO, O3 and NOydepict the measured variability (1σ standard deviation).
2328

ACPD3, 2285–2330, 2003
Impact of monsoonoutflow from India
and Southeast Asia
H. A. Scheeren et al.
Title Page
Abstract Introduction
Conclusions References
Tables Figures
J I
J I
Back Close
Full Screen / Esc
Print Version
Interactive Discussion
c© EGU 2003
0
20
40
60
80
100
120
140
-200 -150 -100 -50 0 50 100
ECHAM total CO South AsiaAfricaNorth AmericaEuropebackground
CO
[ppb
v]
Longitude of origin
Asian plume
0
20
40
60
80
100
120
140
160
-200 -150 -100 -50 0 50 100
ECHAM total O3stratosphereSouth AsiaAfrica
North America Europelightningbackground
O3 [p
pbv]
Longitude of origin
Asian plume
Fig. 11. Simulated source contributions to CO and O3 as function of longitude of origin (de-duced from 10-day backward analysis) computed for the times and locations of air samplescollected during 2 and 22 August in the upper troposphere (>6 km). Shown is a weighted fitthrough the model data.
2329
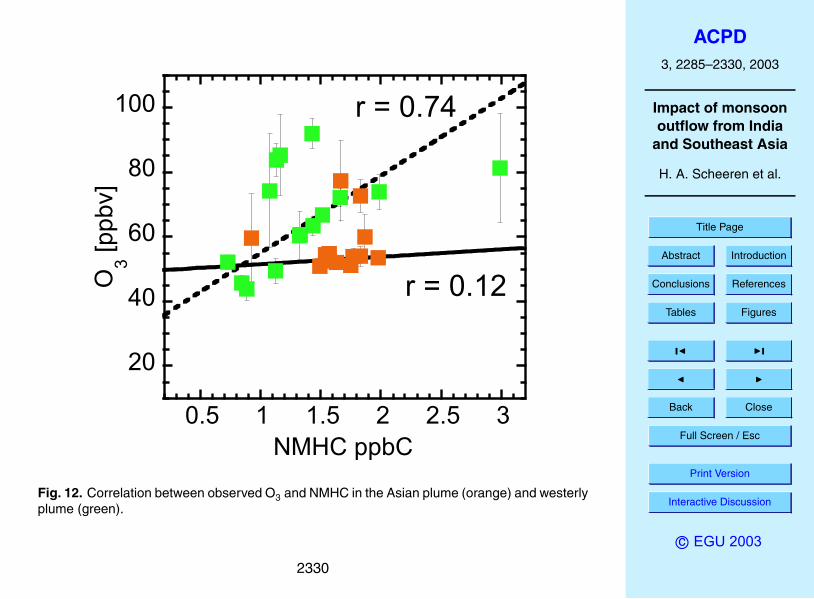
ACPD3, 2285–2330, 2003
Impact of monsoonoutflow from India
and Southeast Asia
H. A. Scheeren et al.
Title Page
Abstract Introduction
Conclusions References
Tables Figures
J I
J I
Back Close
Full Screen / Esc
Print Version
Interactive Discussion
c© EGU 2003
20
40
60
80
100
0.5 1 1.5 2 2.5 3
O3 [p
pbv]
NMHC ppbC
r = 0.12
r = 0.74
Fig. 12. Correlation between observed O3 and NMHC in the Asian plume (orange) and westerlyplume (green).
2330