Embed Size (px)
Citation preview
The Impact of Missing Trader Intra-Community Fraud on
Trade Statistics
Sandra TudorHead of Statistics and Analysis of Trade Unit
• Increasing problem since the introduction of the single market
• Takes advantage of VAT system, where goods are zero rated on transactions between EU Member States
• Missing traders charge for VAT on sales but do not pay the tax to government
Missing Trader Intra-Community Fraud
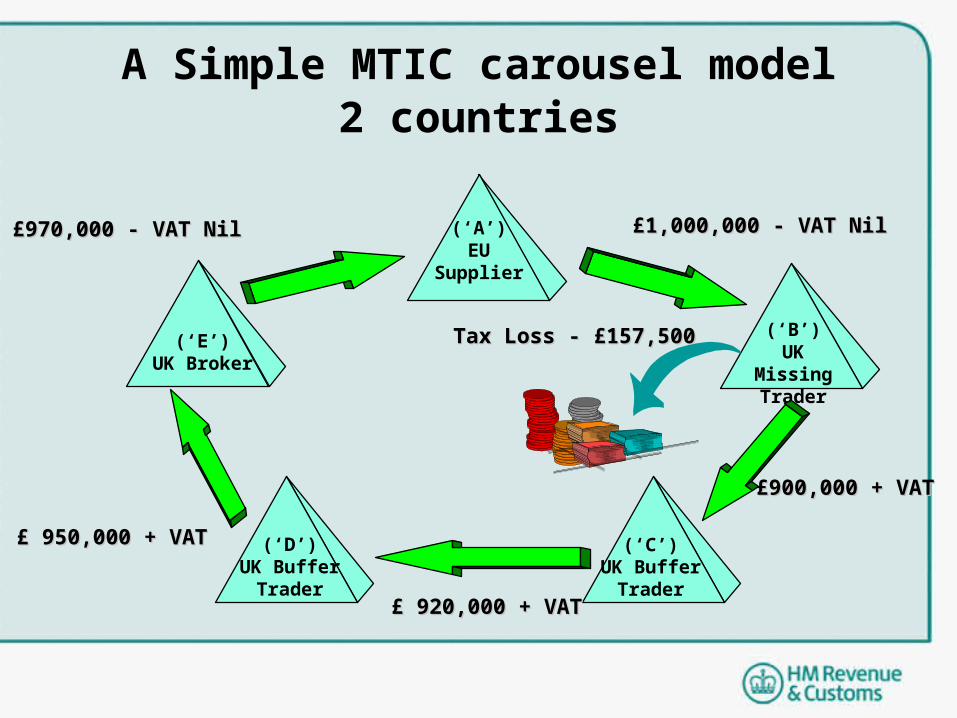
A Simple MTIC carousel model2 countries
£ 950,000 + VAT£ 950,000 + VAT
(‘A’)EU
Supplier
(‘B’)UK Missing
Trader
(‘C’)UK Buffer
Trader
£900,000 + VAT£900,000 + VAT
(‘D’)UK Buffer
Trader£ 920,000 + VAT£ 920,000 + VAT
(‘E’)UK Broker
Tax Loss - £157,500Tax Loss - £157,500
£970,000 - VAT Nil£970,000 - VAT Nil £1,000,000 - VAT Nil£1,000,000 - VAT Nil
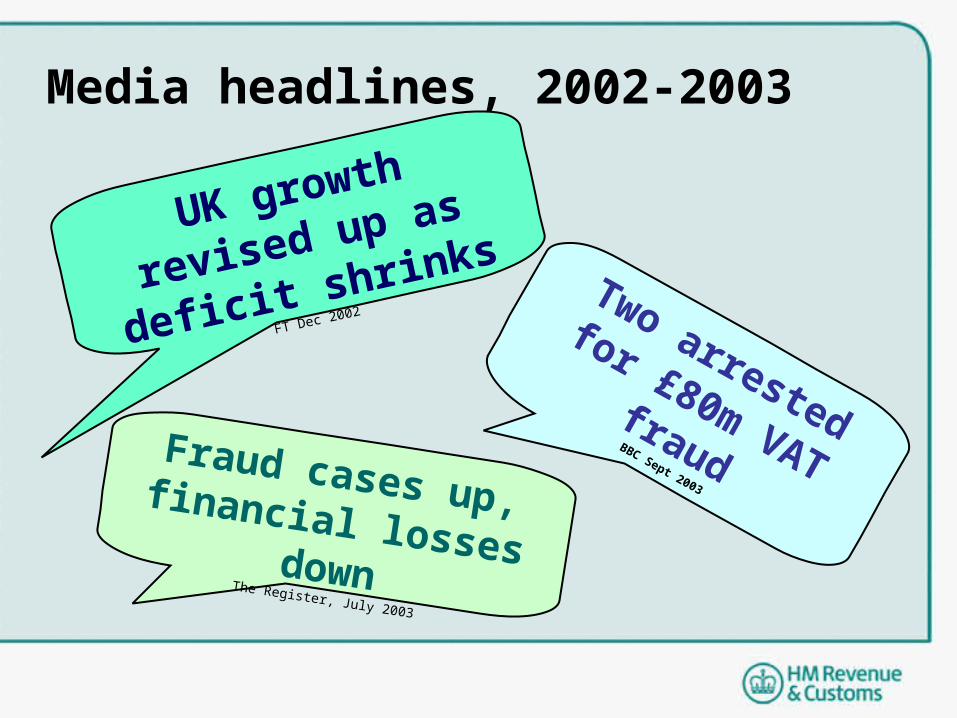
Media headlines, 2002-2003
UK growth
revised up as
deficit shrinksFT Dec 2002
Fraud cases up, financial losses downThe Register, July 2003
Two arrested
for £80m VAT
fraudBBC Sept 2003
Original work for Balance of Payments
2002 - July 2003
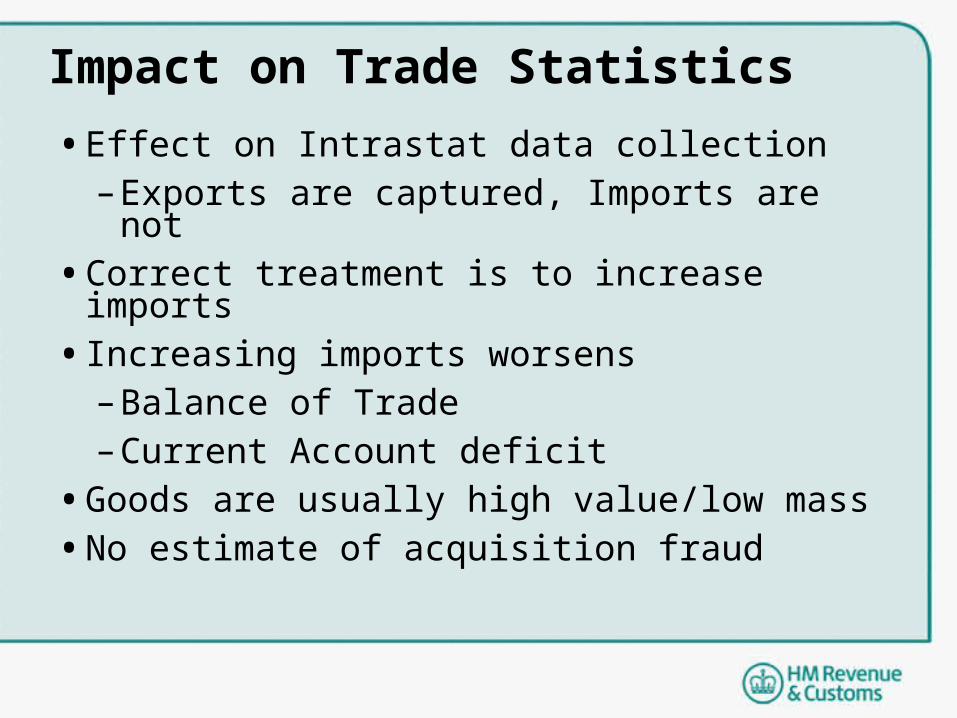
• Effect on Intrastat data collection– Exports are captured, Imports are not
• Correct treatment is to increase imports
• Increasing imports worsens – Balance of Trade– Current Account deficit
• Goods are usually high value/low mass
• No estimate of acquisition fraud
Impact on Trade Statistics
The adjustments
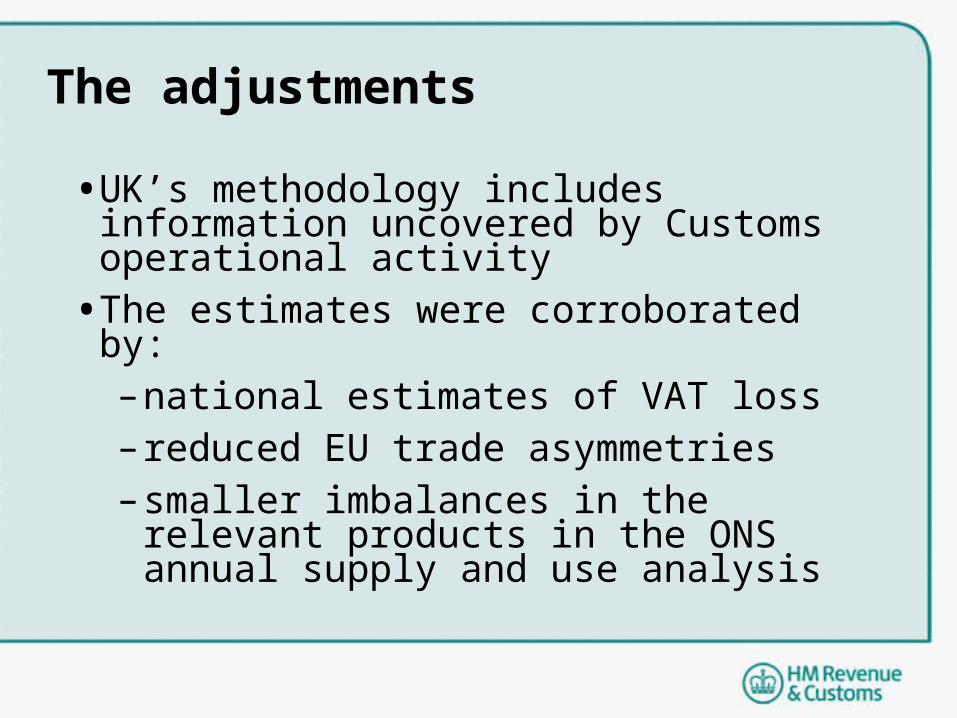
• UK’s methodology includes information uncovered by Customs operational activity
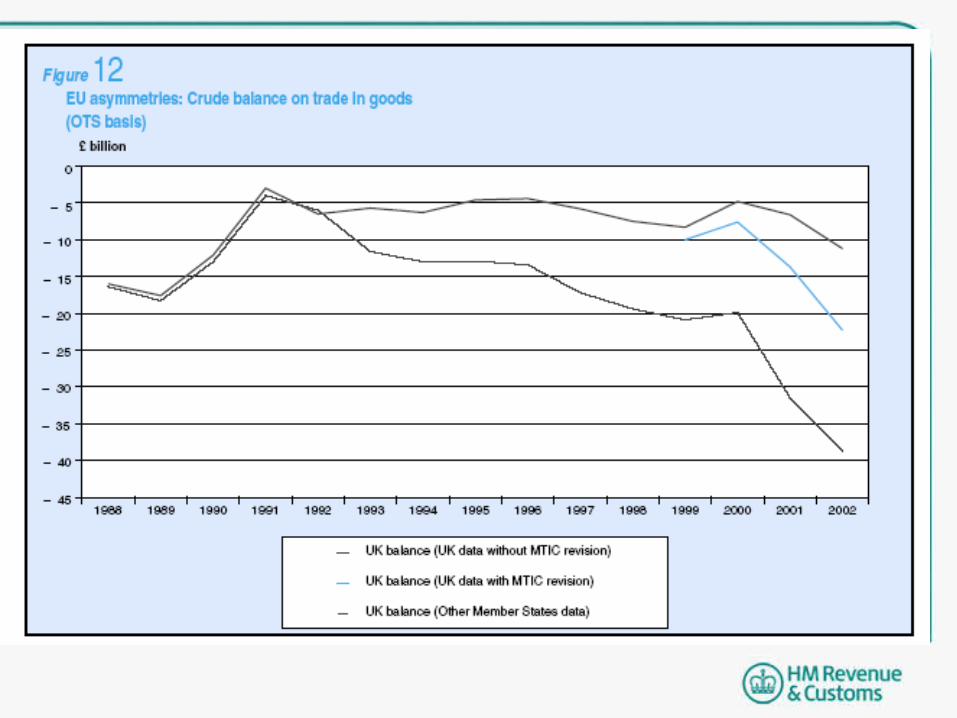
• The estimates were corroborated by:–national estimates of VAT loss– reduced EU trade asymmetries –smaller imbalances in the relevant
products in the ONS annual supply and use analysis

Next StepsAugust 2003 to Feb 2005
Project 2
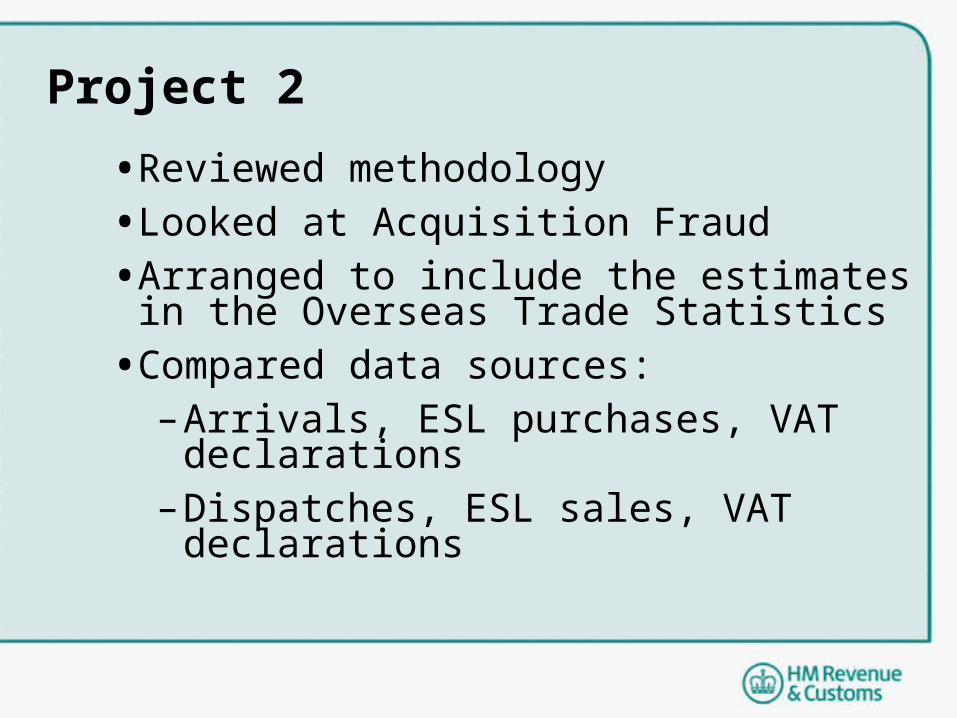
• Reviewed methodology
• Looked at Acquisition Fraud
• Arranged to include the estimates in the Overseas Trade Statistics
• Compared data sources:– Arrivals, ESL purchases, VAT declarations– Dispatches, ESL sales, VAT declarations
Project 2
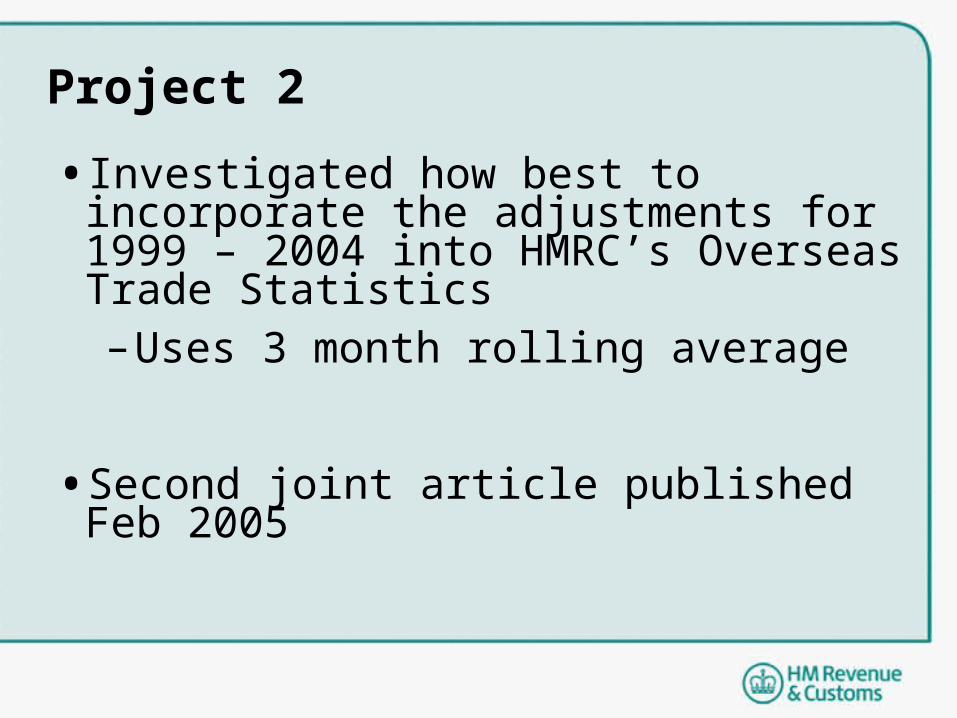
• Investigated how best to incorporate the adjustments for 1999 – 2004 into HMRC’s Overseas Trade Statistics–Uses 3 month rolling average
• Second joint article published Feb 2005
Further developmentsNon-EU trade
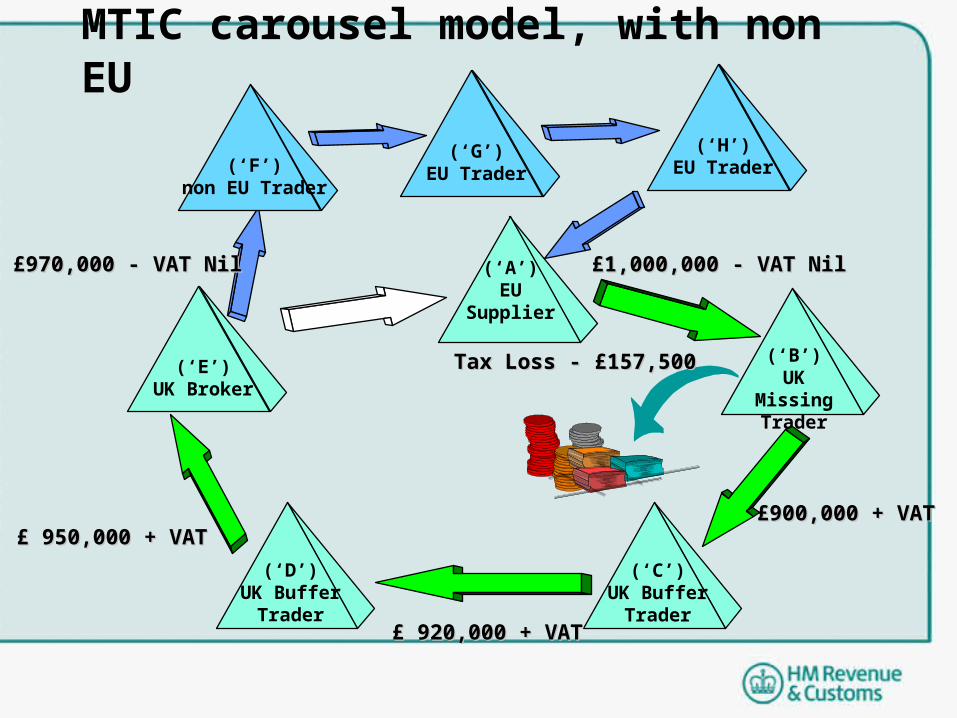
MTIC carousel model, with non EU
(‘A’)EU
Supplier
(‘B’)UK Missing
Trader
(‘C’)UK Buffer
Trader
£900,000 + VAT£900,000 + VAT
(‘D’)UK Buffer
Trader£ 920,000 + VAT£ 920,000 + VAT
(‘E’)UK Broker
£ 950,000 + VAT£ 950,000 + VAT
Tax Loss - £157,500Tax Loss - £157,500
£970,000 - VAT Nil£970,000 - VAT Nil £1,000,000 - VAT Nil£1,000,000 - VAT Nil
(‘F’)non EU Trader
(‘G’)EU Trader
(‘H’)EU Trader

Third Project
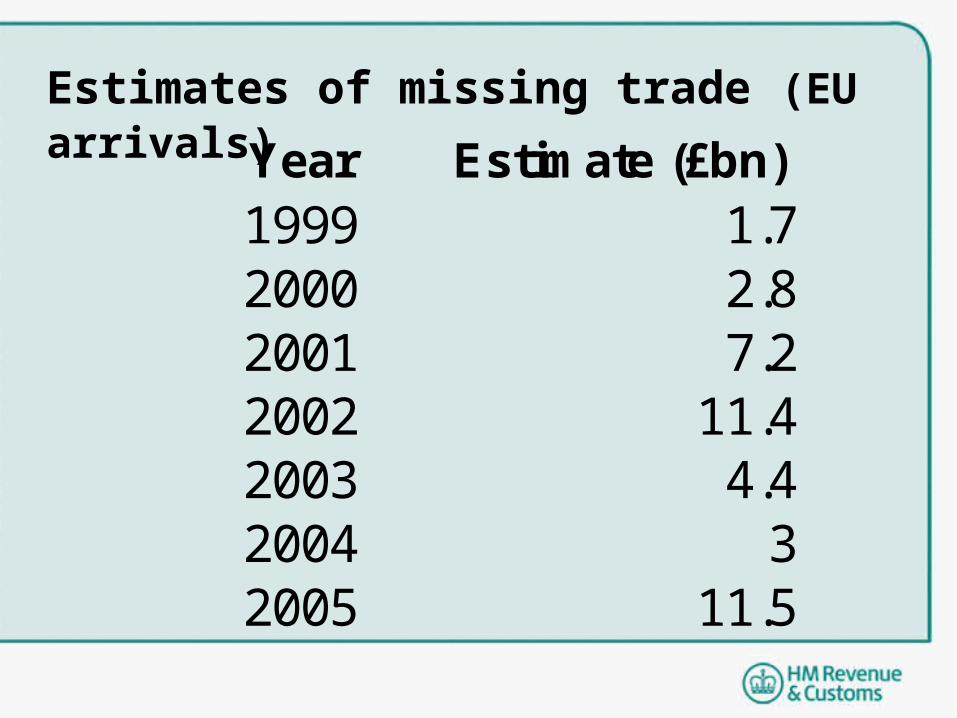
Estimates of missing trade (EU arrivals)
Year Estimate (£bn) 1999 1.72000 2.82001 7.22002 11.42003 4.42004 32005 11.5
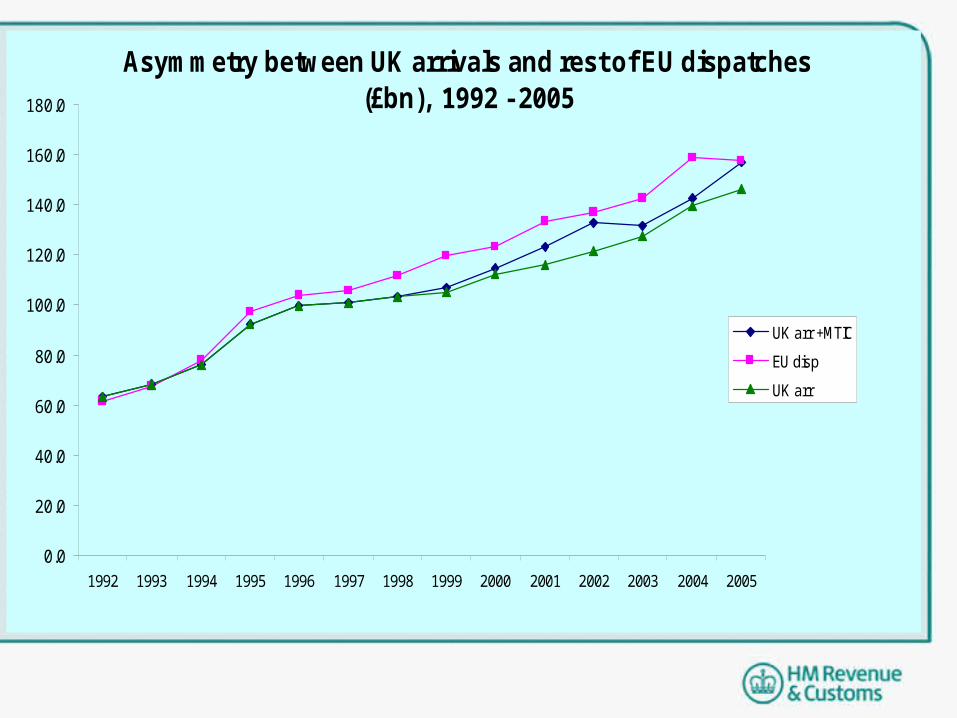
Asymmetry between UK arrivals and rest of EU dispatches (£bn), 1992 - 2005
0.0
20.0
40.0
60.0
80.0
100.0
120.0
140.0
160.0
180.0
1992 1993 1994 1995 1996 1997 1998 1999 2000 2001 2002 2003 2004 2005
UK arr +MTIC
EU disp
UK arr
New Issues
• Non-EU countries involved in chains
• Scale of revisions
• Reverse charging
• Identifying turning points
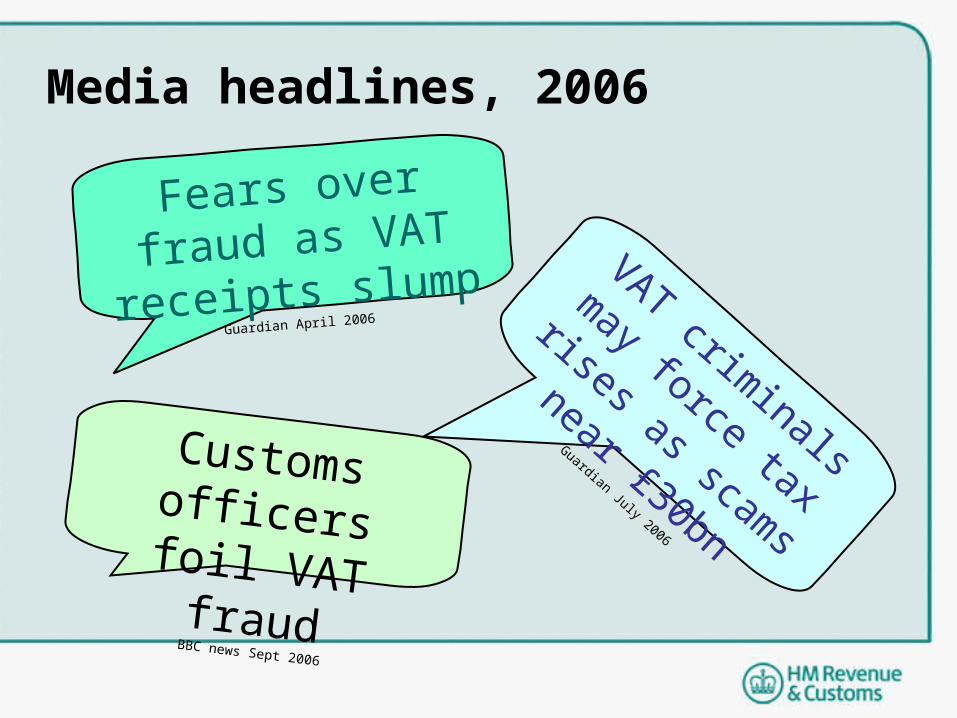
Media headlines, 2006
Fears over fraud
as VAT receipts
slumpGuardian April 2006
Customs officers foil VAT fraudBBC news Sept 2006
VAT criminals
may force tax
rises as scams
near £30bn
Guardian July 2006
• We continue to produce monthly estimates of the impact of the fraud for the OTS, BoP and Eurostat trade data
• We monitor changes in the pattern of trade –commodity–country
Ongoing work
• Need to continually monitor changes
• Close links between SATU and Customs important
• Conflicting requirements
• Use of a range of data
Lessons Learnt

If you want more information please contact:[email protected]@hmrc.gsi.gov.uk