Embed Size (px)
Citation preview
Scotland's Rural College
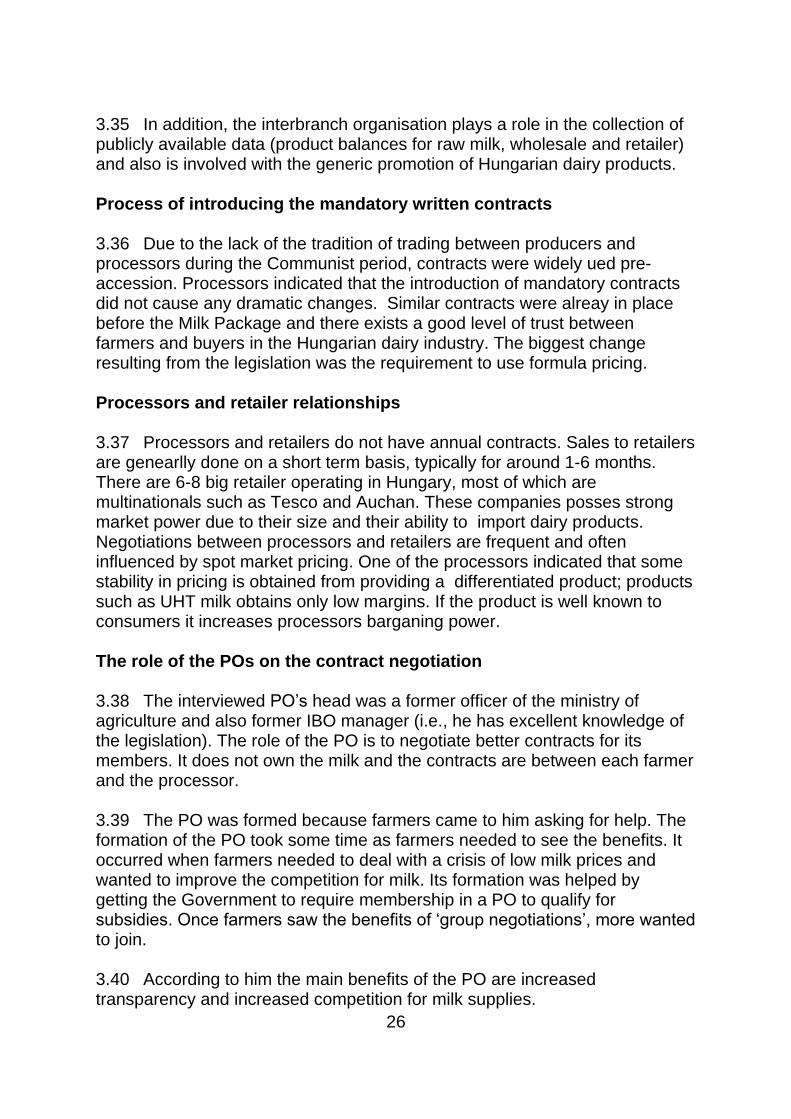
The impact of mandatory written dairy contracts in European countries and theirpotential application in ScotlandRevoredo-Giha, C; Clayton, P; Costa-Font, M; Agra-Lorenzo, FAL; Akaichi, F
Print publication: 14/11/2019
Document VersionPublisher's PDF, also known as Version of record
Link to publication
Citation for pulished version (APA):Revoredo-Giha, C., Clayton, P., Costa-Font, M., Agra-Lorenzo, FAL., & Akaichi, F. (2019). The impact ofmandatory written dairy contracts in European countries and their potential application in Scotland. (SocialResearch series). Scottish Government Social Research.
General rightsCopyright and moral rights for the publications made accessible in the public portal are retained by the authors and/or other copyright ownersand it is a condition of accessing publications that users recognise and abide by the legal requirements associated with these rights.
• Users may download and print one copy of any publication from the public portal for the purpose of private study or research. • You may not further distribute the material or use it for any profit-making activity or commercial gain • You may freely distribute the URL identifying the publication in the public portal ?
Take down policyIf you believe that this document breaches copyright please contact us providing details, and we will remove access to the work immediatelyand investigate your claim.
Download date: 26. Jan. 2022
AGRICULTURE, ENVIRONMENT AND MARINE
researchsocial
The impact of mandatorywritten dairy contracts inEuropean countries and theirpotential application inScotland
The impact of mandatory written dairy contracts in European countries and their potential application in Scotland
Cesar Revoredo-Giha, Patty Clayton, Montse Costa-Font, Fernando Agra-Lorenzo and Faical Akaichi1
November – 2019
1 Revoredo-Giha, Costa-Font, Agra-Lorenzo and Akaichi are with the Food Marketing Research Team – Land Economy, Environment and Rural Society Research Group, Scotland’s Rural College (SRUC), King’s Buildings, Edinburgh EH9 3JG, UK, Phone: +44(0)131 5354344, e-mail: [email protected]. Patty Clayton is Senior Analyst, Dairy Market Intelligence Division, AHDB, Stoneleigh, Kenilworth, e-mail: [email protected].
Acknowledgements
This report has been possible due to the help and contribution of many collaborators and stakeholders in several European Union countries and in the UK. Our gratitude to all of them.
Contents
Executive Summary ........................................................................................... i
1. Introduction ................................................................................................ 1
2. Overview of the current dairy landscape in Scotland ................................ 7
2.1 Structure of the industry ........................................................................ 7
2.2 Scottish dairy contracts ....................................................................... 13
3. Review of the evidence on dairy contracts in European countries .......... 18
3.1 France ................................................................................................. 18
3.2 Hungary ............................................................................................... 24
3.3 Italy ...................................................................................................... 28
3.4 Poland ................................................................................................. 33
3.5 Romania .............................................................................................. 37
3.6 Spain ................................................................................................... 40
4. Introduction of mandatory contracts and farm price volatility .................. 45
5. Discussion ............................................................................................... 49
5.1 Scottish dairy sector and countries that implemented MWCs ............... 50
5.2 How MWCs can be applied in Scotland and their likely impact ............. 53
6. Conclusions and recommendations ........................................................ 58
7. Annexes ................................................................................................... 60
7.1 Overview of the studied dairy industries ............................................. 60
7.1.1 France ........................................................................................... 60
7.1.2 Hungary ......................................................................................... 62
7.1.3 Italy ................................................................................................ 63
7.1.4 Poland ........................................................................................... 64
7.1.5 Romania ........................................................................................ 66
7.1.6 Spain ............................................................................................. 67
7.2 Dairy statistics by country ................................................................... 68
7.3 Mandatory contracts and farm price volatility (full analysis) ................ 82
7.4 Rules set by the Milk Package regarding MWCs ................................ 96
7.5 References .......................................................................................... 97
List of Tables Table 1: Great Britain - Market shares – Drinking milk (percentages) ............ 12
Table 2: Great Britain - Market shares – Cheese (percentages) .................... 13
Table 3: MWCs implementation in Europe ...................................................... 46
Table 4: Descriptive statistics .......................................................................... 47
Table 5: Conditional variance equation estimates .......................................... 48
Table 6: Comparison of dairy sector features in the studied countries ........... 51
List of Figures Figure 1: Scotland and Rest of UK production of milk 2003-17 ........................ 8
Figure 2: Scotland - Total deliveries index by selected processor - 2017 ......... 9
Figure 3: Scotland - Total deliveries index by selected processor - 2018 ........ 9
Figure 4: UK - Prices paid for milk 2004-18 .................................................... 10
Figure 5: Scotland – Milk collection share by company - 2017 ....................... 10
Figure 6: Scotland – Milk collection share by product - 2017 .......................... 11
Figure 7: Scotland – Drinking milk and cheese milk utilisation share - 2017 .. 11
Figure 8: Great Britain – Drinking milk and cheese sales indexes .................. 12
Figure 9: Diagram 1- Scottish dairy contracts ................................................. 17
Figure 10: Diagram 2 - French dairy contracts ................................................ 23
Figure 11: Diagram 3 - Hungarian dairy contracts .......................................... 27
Figure 12: Diagram 4: Italian dairy contracts .................................................. 32
Figure 13: Diagram 5: Polish dairy contracts .................................................. 36
Figure 14: Diagram 6: Romanian dairy contracts ............................................ 39
Figure 15: Diagram 7: Spanish dairy contracts ............................................... 44
Figure 16: Scotland - Private label share on total sales of drinking milk ......... 52
Figure 17: Scotland - Private label share on total sales of Cheddar cheese .. 52
i
Executive Summary
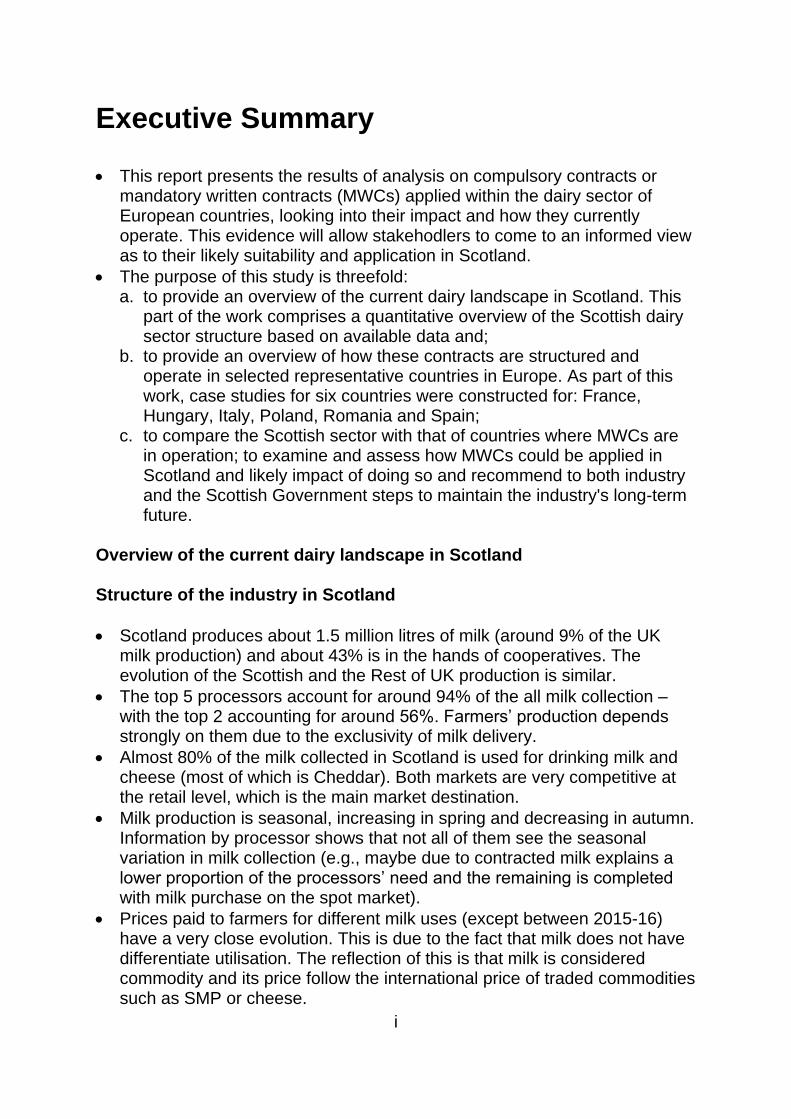
• This report presents the results of analysis on compulsory contracts or mandatory written contracts (MWCs) applied within the dairy sector of European countries, looking into their impact and how they currently operate. This evidence will allow stakehodlers to come to an informed view as to their likely suitability and application in Scotland.
• The purpose of this study is threefold: a. to provide an overview of the current dairy landscape in Scotland. This
part of the work comprises a quantitative overview of the Scottish dairy sector structure based on available data and;
b. to provide an overview of how these contracts are structured and operate in selected representative countries in Europe. As part of this work, case studies for six countries were constructed for: France, Hungary, Italy, Poland, Romania and Spain;
c. to compare the Scottish sector with that of countries where MWCs are in operation; to examine and assess how MWCs could be applied in Scotland and likely impact of doing so and recommend to both industry and the Scottish Government steps to maintain the industry's long-term future.
Overview of the current dairy landscape in Scotland Structure of the industry in Scotland
• Scotland produces about 1.5 million litres of milk (around 9% of the UK milk production) and about 43% is in the hands of cooperatives. The evolution of the Scottish and the Rest of UK production is similar.
• The top 5 processors account for around 94% of the all milk collection – with the top 2 accounting for around 56%. Farmers’ production depends strongly on them due to the exclusivity of milk delivery.
• Almost 80% of the milk collected in Scotland is used for drinking milk and cheese (most of which is Cheddar). Both markets are very competitive at the retail level, which is the main market destination.
• Milk production is seasonal, increasing in spring and decreasing in autumn. Information by processor shows that not all of them see the seasonal variation in milk collection (e.g., maybe due to contracted milk explains a lower proportion of the processors’ need and the remaining is completed with milk purchase on the spot market).
• Prices paid to farmers for different milk uses (except between 2015-16) have a very close evolution. This is due to the fact that milk does not have differentiate utilisation. The reflection of this is that milk is considered commodity and its price follow the international price of traded commodities such as SMP or cheese.
ii
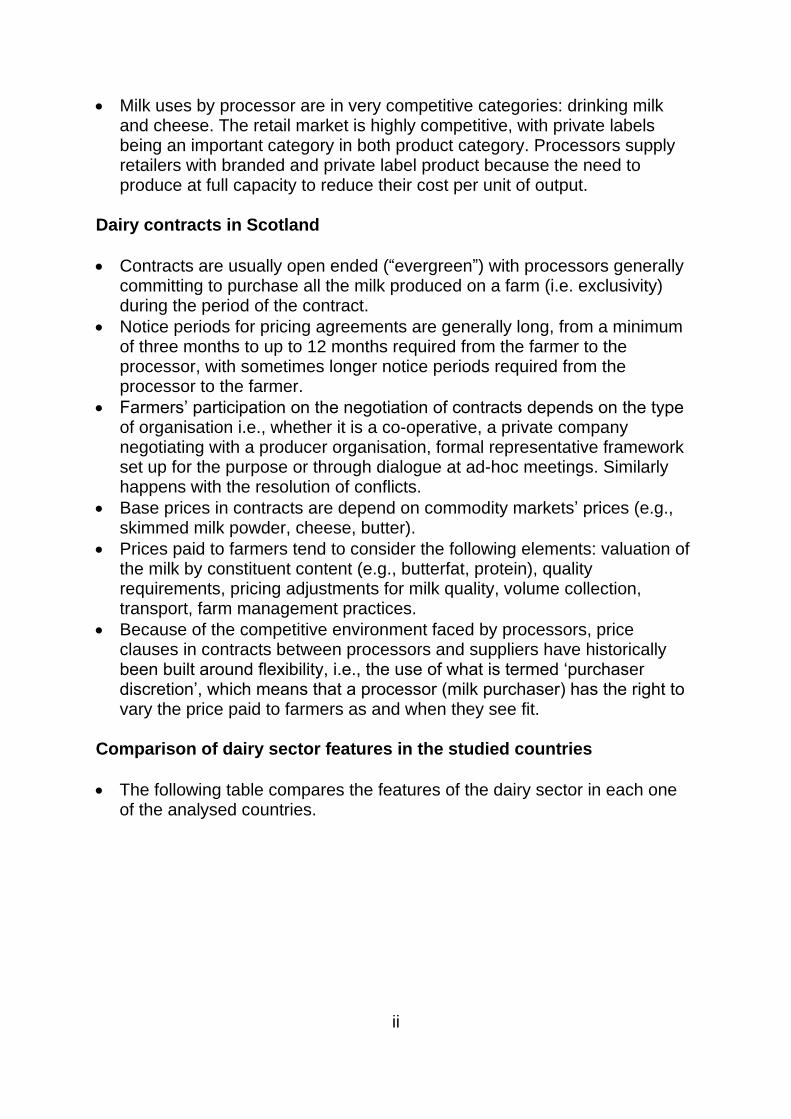
• Milk uses by processor are in very competitive categories: drinking milk and cheese. The retail market is highly competitive, with private labels being an important category in both product category. Processors supply retailers with branded and private label product because the need to produce at full capacity to reduce their cost per unit of output.
Dairy contracts in Scotland
• Contracts are usually open ended (“evergreen”) with processors generally committing to purchase all the milk produced on a farm (i.e. exclusivity) during the period of the contract.
• Notice periods for pricing agreements are generally long, from a minimum of three months to up to 12 months required from the farmer to the processor, with sometimes longer notice periods required from the processor to the farmer.
• Farmers’ participation on the negotiation of contracts depends on the type of organisation i.e., whether it is a co-operative, a private company negotiating with a producer organisation, formal representative framework set up for the purpose or through dialogue at ad-hoc meetings. Similarly happens with the resolution of conflicts.
• Base prices in contracts are depend on commodity markets’ prices (e.g., skimmed milk powder, cheese, butter).
• Prices paid to farmers tend to consider the following elements: valuation of the milk by constituent content (e.g., butterfat, protein), quality requirements, pricing adjustments for milk quality, volume collection, transport, farm management practices.
• Because of the competitive environment faced by processors, price clauses in contracts between processors and suppliers have historically been built around flexibility, i.e., the use of what is termed ‘purchaser discretion’, which means that a processor (milk purchaser) has the right to vary the price paid to farmers as and when they see fit.
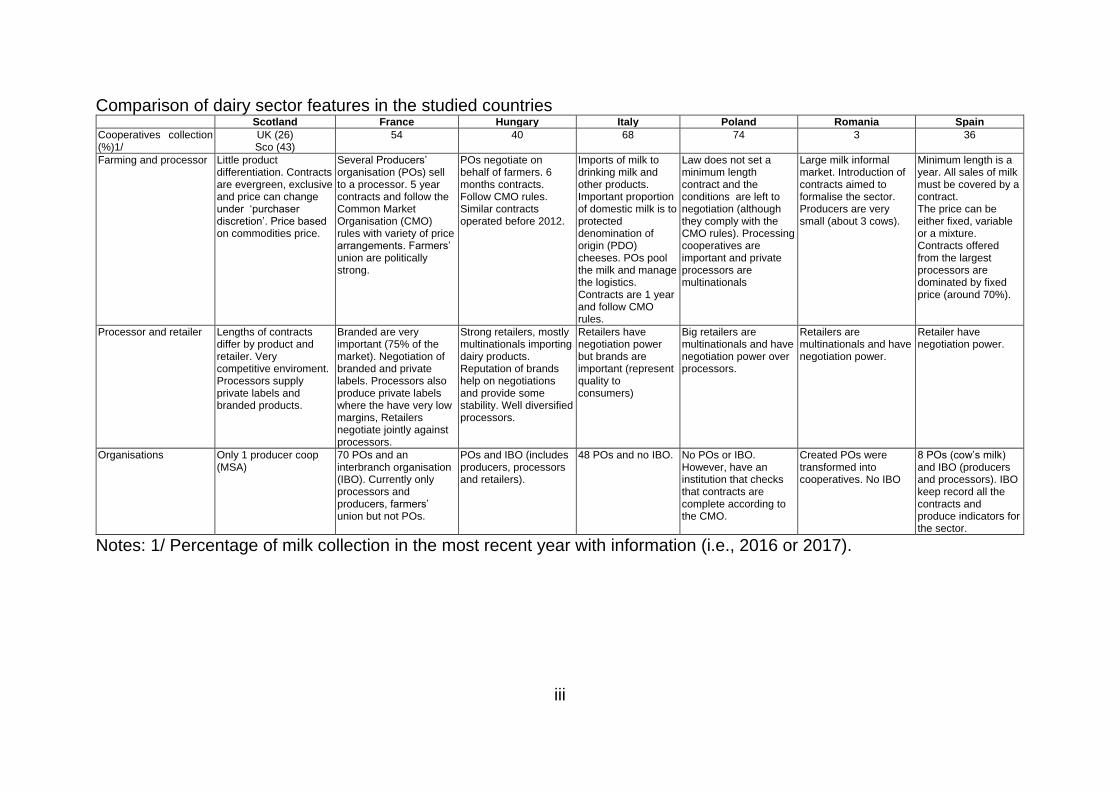
Comparison of dairy sector features in the studied countries
• The following table compares the features of the dairy sector in each one of the analysed countries.
iii
Comparison of dairy sector features in the studied countries Scotland France Hungary Italy Poland Romania Spain
Cooperatives collection (%)1/
UK (26) Sco (43)
54 40 68 74 3 36
Farming and processor Little product differentiation. Contracts are evergreen, exclusive and price can change under ‘purchaser discretion’. Price based on commodities price.
Several Producers’ organisation (POs) sell to a processor. 5 year contracts and follow the Common Market Organisation (CMO) rules with variety of price arrangements. Farmers’ union are politically strong.
POs negotiate on behalf of farmers. 6 months contracts. Follow CMO rules. Similar contracts operated before 2012.
Imports of milk to drinking milk and other products. Important proportion of domestic milk is to protected denomination of origin (PDO) cheeses. POs pool the milk and manage the logistics. Contracts are 1 year and follow CMO rules.
Law does not set a minimum length contract and the conditions are left to negotiation (although they comply with the CMO rules). Processing cooperatives are important and private processors are multinationals
Large milk informal market. Introduction of contracts aimed to formalise the sector. Producers are very small (about 3 cows).
Minimum length is a year. All sales of milk must be covered by a contract. The price can be either fixed, variable or a mixture. Contracts offered from the largest processors are dominated by fixed price (around 70%).
Processor and retailer Lengths of contracts differ by product and retailer. Very competitive enviroment. Processors supply private labels and branded products.
Branded are very important (75% of the market). Negotiation of branded and private labels. Processors also produce private labels where the have very low margins, Retailers negotiate jointly against processors.
Strong retailers, mostly multinationals importing dairy products. Reputation of brands help on negotiations and provide some stability. Well diversified processors.
Retailers have negotiation power but brands are important (represent quality to consumers)
Big retailers are multinationals and have negotiation power over processors.
Retailers are multinationals and have negotiation power.
Retailer have negotiation power.
Organisations Only 1 producer coop (MSA)
70 POs and an interbranch organisation (IBO). Currently only processors and producers, farmers’ union but not POs.
POs and IBO (includes producers, processors and retailers).
48 POs and no IBO. No POs or IBO. However, have an institution that checks that contracts are complete according to the CMO.
Created POs were transformed into cooperatives. No IBO
8 POs (cow’s milk) and IBO (producers and processors). IBO keep record all the contracts and produce indicators for the sector.
Notes: 1/ Percentage of milk collection in the most recent year with information (i.e., 2016 or 2017).
iv
Introduction of mandatory contracts and farm price volatility
• The impact of the implementation of MWCs (under the EU agricultural Common Market Organisation (CMO) regulation) on raw milk price volatility was investigated in twelve member states using time series models.
• Results showed evidence that in France, Hungary, and Slovakia milk price volatility decreased after the implementation of MWCs.
• However, in the rest of analysed countries were varied, with raw milk prices’ variance either found to be constant (Bulgaria, Cyprus, Italy, Poland, Portugal, and Romania) or to vary in a non-significant manner over the period studied (Lithuania, Slovenia and Spain).
• The above results can be due to a variety of causes such as that written contracts were commonly used before the 2012 Milk Package or the fact that CMO regulation included not only prescriptions about the introduction of MWCs but also other recommendations (e.g., implementation of dairy farmers’ PO and IBOs).
Comparison of Scotland and countries where MWCs have been applied
• The aim of the CMO rules was to improve stability in the EU dairy sector by promoting better contractual relationships and addressing the imbalance of bargaining power between farmers and first purchasers.
• Whilst there are points in common in the dairy sector of each country, such as retailers are the stakeholders with most significant negotiation power; there are substantial differences amongst all of them, which makes analysing and comparing them methodologically challenging. This also speaks positively about the adaptability of the CMO rules behind MWCs to the different business environments.
• None of the studied cases pointed out that MWCs brought problems for their dairy sectors and in at least one case (i.e., France) processors were grateful that the exclusivity clause was eliminated as part of the introduction of MWCs.
• Establishing MWCs may bring an initial cost for the industry to adapt their current contracts and practices but it may increase the transparency and certainty for dairy farmers.
• However, there are important factors to consider regarding the implementation of MWCs: o It is important to consider their structure together (e.g., volumes, pricing
and contract length) instead of analysing each clause independently and keeping the other aspects unmodified.
o Under the current market structure, characterised by highly vulnerable processors due to their products’ portfolio and changes in their costs of production, it is not feasible to introduce pricing mechanisms and minimum contract duration without taking into consideration delivery volumes.
v
o An example of the above could be the case of a contract between a processor and farmers, where the conditions are a contract length of year (i.e., the conditions of the contract cannot change during that period), the price paid to farmers depends on the international price of skimmed milk powder (SMP) through a formula, and the farmers deliver all the milk they produce to the processor (i.e., under exclusivity). If the price of SMP increases dramatically, it will encourage farmers to produce more and the processor will face a substantial increase on the total costs of milk and will need to dispose the excess of milk without necessarily having a market for it.
o There are at least two ways to reduce the processor’s vulnerability in the above example: one way would be to consider a contract where the exclusivity clause is eliminated and replaced by an agreed in advance schedule of milk delivery (i.e., agreed volumes). The second way, would be to maintain the exclusivity clause but replace the price formula by a type “A&B” pricing, where the processor would pay price A for an agreed volume of milk and much lower price for any milk delivered in excess of the agreed volume. The low price should discourage farmers to produce in excess.
o The elimination of the exclusivity clause worries some processors that it will create them problems to ensure a reliable supply of milk. The observed abroad experiences indicate that processors operate without any problem by asking farmers to state in the contract their expected quarterly or monthly milk supply for the contract period (e.g., a year), also including clauses that allow for deviations from those values and penalties in case of very significant deviations.
o Note that the effectiveness of the A&B pricing depends on the reaction of the supply to the set prices. If the B price is set too high, low cost producers may still over deliver.
o The introduction of POs can be a good way not only to improve the bargaining power of farmers but also to organise milk supply for processors.
Recommendations for the Industry
• The motivation of this study was the results of the consultation on the formal extension of the GCA’s remit to cover primary producers (February 2018), which announced to introduce legislation governing contracts between producers and purchasers (i.e., MWCs) to provide extra transparency and certainty for dairy farmers by setting out minimum terms within a contract.
• In general, the study does not find reasons why the MWCs cannot be applied to the Scottish dairy market. However, the specific conditions need to be negotiated between the parties: o To avoid excessive exposure of processors to risk and therefore
damages to the dairy supply chain, it is important that volume delivered
vi
clauses should be considered together with pricing and minimum contract time duration.
o Thus, one option would be to eliminate the exclusivity clauses and replace them by agreed volume to be delivered.
o Given the seasonality of the production annual contracts are probably the most suitable duration of the contracts (evergreen contracts can be negotiated by the parties).
o Farmers commit on contracts a schedule of quarterly or monthly volumes, with deviations negotiated.
o Another option would be to consider a pricing mechanism of the “A&B” type, while maintaining the exclusivity clause.
o Written offers in advance (i.e., a formal offer is sent to the producer say two months in advance of the contract termination date) can be useful to avoid difficulties to producers trying to terminate their contracts within a reasonable period (e.g., if significant changes to prices or the terms of contracts are proposed.)
o The pricing scheme chosen (i.e., fixed, formula or a combination of both) is also subject to negotiation and might depend on the duration of the contracts. The industry can benefit of encouraging POs. For farmers, they can provide bargaining or at least greater help with understanding the details behind the contracts. For processors they can provide an organised way to collect milk reducing transaction costs.
o In addition, establishing an IBO, bringing together all the stakeholders, would be useful for the industry as it will allow them to discuss supply chain issues. It could be a way to develop collaboration on the dairy supply chain.
Recommendations for the Scottish Government
• Encourage the formation of POs led by negotiators with skills and experience and are able to gain the trust of farmers. A strategy for this needs to be established with probably the Government supporting financially the starting of the POs, although they should be supported by the farmers.
• Encourage the industry to create an IBO, with the participation of all the stakeholders i.e., farmers, processors and retailers, to discuss dairy supply chain issues and move towards a collaborative approach.
1
1. Introduction 1.1 In order to understand the current policy environment surrounding the discussion on mandatory written contracts (MWCs) one should go back to the proposal introduced by the European Commission (EC) in 2010 in preparation for the elimination of milk quotas in March 2015. 1.2 Uncertainty over the impacts of the abolition of milk quotas in 2015 coupled with a period of intense price volatility in 2007–09 led the European Commission to establish the High-Level Experts’ Group (HLG) on Milk in October 2009 (HC-EFRA, 2011). Based on the HLG reports in June 2010 and December 2010, the European Commission released its proposal on ‘Contractual relations in the milk and milk products sector’ (i.e., the ‘Milk Package’) (European Commission, 2010), where it stated that the problems of the dairy sector were:
• Inadequate price transmission along the chain, in particular as regards prices received by farmers.
• The value-added in the chain had become increasingly concentrated in the downstream sectors, notably with dairies.
• The volume of milk to be delivered during the season was not always well planned and there was a potential lack of adaptation of supply to demand as farmers were obliged to deliver all their milk to their buyers.
• There was a lack of widespread use of formal, written contracts containing basic elements and made in advance of delivery (e.g., lack of clear pricing, where in some cases, those buying milk were able to change the price at short notice, or even retrospectively without the option of a farmer stopping to supply milk to that buyer).
1.3 The Milk Package proposal put forward the following four recommendations (with the new rules applying only until 30 June 2020): 1. Member States could opt to make it compulsory for dairy producers and
processors to provide farmers with written contracts specifying a price or price formula, the delivery volume, the duration of the contract and the timing of collections.
2. Dairy producer organisations (POs) would be allowed to be established so they could jointly negotiate contract terms, including price, as long as they do not exceed 3.5% of EU production or 33% of national production by volume.
3. Interbranch organisations (IBO) could be set up across the supply chain to improve transparency and promote best practices, without distorting competition.
2
4. An explicit legal basis for Member States to allow for the collection of information from processors on raw milk deliveries on a monthly basis.
1.3 The House of Commons - Environment, Food and Rural Affairs Committee (HC-EFRA) (2011) discussed the EU proposal and highlighted that the forthcoming abolition of quotas, coupled with growing global demand for dairy products, was creating a window of opportunity for UK dairying; moreover, UK milk production was increasing for the first time in nearly ten years. However, despite the surge in global food prices, milk prices remained below the average cost of production, threatening the ability of some dairy farmers to continue producing and indicating serious issues of price transmission. 1.4 HC-EFRA recommended written contracts should specify either the raw milk price or the principles underpinning price, the volume and timing of deliveries, and the duration of the contract. They concluded that it would be essential for the new form of contract to be made compulsory, otherwise there would be no improvement in the system. In addition, they agreed with the principle of increasing farmers’ negotiating power through enabling producer organisations to jointly set prices with processors, although they recommended that national competition authorities should be required to approve the formation of producer organisations that cover over 20% of national milk production to avoid distortions of competition. 1.5 The Committee also insisted that Defra should take more proactive steps to increase investment in processing and reduce farmers’ production costs, including supporting innovative research and development. As large-scale dairy holdings were a significant future development for the industry, and could raise issues beyond the responsibility of planning authorities, Defra must establish its position on large-scale dairying. 1.6 Low milk prices in 2012 created financial difficulties for UK dairy farmers, particularly in the summer of 2012, when processors announced a series of milk price reductions to be implemented at short notice. Although some of these price cuts were subsequently withdrawn, ministers from the UK administrations worked with industry representatives to help secure an industry-led solution, which resulted in September 2012 in the signing of a voluntary code of practice for contractual relationships between dairy processors and producers inspired by the measures of the Milk-Package (Dairy UK et al., 2012). As of March 2013, it was estimated that 85 per cent of British milk was bound by the principles of the voluntary code. A report published in March 2013 by the House of Commons – Welsh Affair Committee (HC-WAC) (2013) concluded that:
• The new voluntary code of practice was an important step forward to redress the balance in the contractual relationship between dairy producer
3
and purchaser. All dairy processors who have not yet signed the voluntary code should do so.
• The code must be given time to work. The UK Government should set out precisely when and how it intends to measure the success or failure of the voluntary code.
• Should the voluntary code fail in its objectives, the UK Government must legislate for a statutory code of contracts in the dairy industry.
1.7 A 2014 review of the Voluntary Code of Practice (‘Code’, hereafter) chaired by Alex Fergusson, MSP, identified a high degree of commitment to the continuation of the Code. It stated that where it had been used most effectively it had benefitted both the producer and processor; however, more needed to be done to get the wider industry to appreciate all of the potential benefits. The review put forward seven recommendations: 1. The current notice of termination should remain unchanged. 2. The Code should clarify that a 30 day notification of a price change is only
required in the case of a price decrease. 3. A good practice clause should be written into the Code to ensure that the
producer is fully aware of the details of any new contract they are considering.
4. The wording in the Code, regarding early termination/payment of liquidated damages, should be changed.
5. Contracts should allow a producer to supply other purchasers where they wish to expand their production and the purchaser does not want to purchase the additional milk under the contractual terms and conditions, or where there is a ceiling on total volume of milk to be delivered within a 12-month period.
6. There should be wider adoption of the Code, with the possibility of expanding it to include retailers, whilst maintaining the voluntary nature of the code.
7. The Code should include a requirement for DairyUK, NFU and NFUS to meet at least every 6 months to review progress and engage in an on-going dialogue on any code-related issues.
1.8 In March 2015, dairy quotas were eliminated and milk prices were left to be determined by the market. The period after the elimination of the quota was characterised by a decreasing trend in the average price of milk (as observed in all EU milk prices across the EU). However, when disaggregated by milk contract prices, the results showed significant heterogeneity (with some prices rising in the period), reaching a gap between the highest and the lowest price of up to 18 pence per litre in August 2015, when the average price was 23.3 pence per litre (Costa-Font and Revoredo-Giha, 2018). This situation raised concerns about whether the average milk price for the UK calculated by Defra was a good indicator of the general trend of overall milk prices (AHDB, 2015).
4
1.9 In 2016, a formal call for evidence was launched by the UK Government to explore the case for extending the remit of the Groceries Code Adjudicator (GCA) beyond enforcing the Groceries Supply Code of Practice, and, for example, to cover relationships between farmers and processors. The consultation revealed a number of specific concerns for the dairy sector (which were already pointed out in the introduction of the Milk Package) such as:
• problems with the balance of bargaining power in the groceries supply chain;
• examples of unfair or unclear contract terms;
• difficulties caused by late payments;
• and a lack of trust and transparency that discouraged good relationships across the supply chain.
1.10 It is important to note that most large retailers highlighted problems with extending the GCA’s remit and argued against any further intervention, warning that this could dilute its effectiveness by adding further responsibilities. There were also concerns about funding and doubts of how any extended role for the GCA could be delivered in practice (Farm Business, 2018; ABC, 2018). 1.11 In February 2018, the UK Government announced that a formal extension of the GCA’s remit to cover primary producers would not be appropriate, and instead, it would identify certain actions to address the main concerns. One of the announced actions was to introduce legislation governing contracts between producers and purchasers under Article 148 of the EU Commission (note that under the voluntary code, contracts are not subject to governance). The objective of legislating dairy contracts was to provide extra transparency and certainty for dairy farmers by setting out minimum terms within a contract. These would include, at a minimum:
• the price payable for the delivery of milk – expressed either as a static
price or a formula;
• the volume of raw milk to be delivered and the timing of deliveries;
• the duration of the contract;
• details of payment periods and procedures;
• arrangements for collecting or delivering raw milk; and,
• rules that apply in the event of force majeure 1.12 Industry commentators believe that introducing mandatory written contracts (MWC) could help to reinforce the responsibility of operators in the dairy chain (farmers and milk buyers) and increase their awareness of using market signals to improve price transmission and to adapt supply to demand
5
because MWCs aim to: i) ensure the presence of a contract and ii) specify a range of criteria that must be included. 1.13 Note that currently, the European Commission gives Member States discretion as regards whether they should apply MWCs between dairy producers and processors for the delivery of raw milk. The EC (2014) provided an update of the Milk Package implementation indicating that 12 countries had adopted MWCs with different characteristics. The latest information (as of 2016) indicated that Slovenia and Poland had introduced them since January and October 2015, respectively. In addition, there were some modifications of the positions taken as regards the mandatory contracts. Thus, Cyprus, which had introduced compulsory contracts in June 2013, modified its position by making them compulsory only for recognised producer organisation (PO) and associations of producers’ organisations (APO) and for a minimum duration of one year; since April 2015 contracts in Latvia were no longer made compulsory; and the minimum duration of the contracts in Italy was extended to one year. These changes brought the number of countries applying MWCs to 13. 1.14 In the aforementioned context, the aim of this research project is to provide an analysis of the MWCs in European countries as there is currently limited evidence on the impact of these in the countries in which they currently operate. This evidence will allow Scottish Ministers to come to an informed view as to their likely suitability and application in Scotland. Specifically, the purpose of this study is threefold: 1. To provide an overview of how MWCs are structured and operate in
selected representative countries in Europe. As part of this work, case studies for six countries were constructed for: France, Hungary, Italy, Poland, Romania and Spain.
2. To provide an overview of the current dairy landscape in Scotland. This part of the work comprises a quantitative overview of the Scottish dairy sector structure based on available data (e.g., Economic Report on the Scottish Agriculture, Milk Utilisation Survey and Kantar Worldpanel, AHDB dairy prices) and it also covers factors that affect farm gate prices, e.g., how farmers, processors and retailers work together to establish contracts considering the structure of these contracts, their duration.
3. To compare the Scottish sector with that of countries where MWCs are in
operation; to examine and assess how MWCs could be applied in Scotland and likely impact of doing so and recommend to both industry and the Scottish Government steps to maintain the industry’s long-term future.
1.15 The structure of the report is as follows: it starts with an overview of the current dairy landscape in Scotland including contracting practices. It is
6
followed by a review of the evidence on dairy contracts in European countries based on six case studies. The next section discusses the similarities of the Scottish sector with that of countries where MWCs are in operation in order to analyse how these could be applied in Scotland and their potential impact. Finally, the report provides recommendations to both industry and the Scottish Government steps to maintain the industry’s long-term future.
7
2. Overview of the current dairy landscape
in Scotland
2.1 Structure of the industry
2.1 The purpose of this section is to describe the business environment of the dairy sector in Scotland as well as the features of the contracts that are
Key points
• Prices paid to farmers follow trends based on commodity markets due to the fact the same milk can be used to produce different manufacturing products.
• Based on 2017 figures almost 80% of the milk collected in Scotland is used for drinking milk and cheese (most of which is Cheddar). Both markets are very competitive at the retail level, which is the main market destination.
• The retail market is highly competitive, with private labels being an important category. Processors supply retailers both their branded products and private labels. This may reflect both presence of install capacity (when producing only branded products) and decline of major brands.
• Contracts are usually open ended (evergreen) with processors generally committing to purchase all the milk produced on a farm (i.e., exclusivity).
• Notice periods are generally long, from a minimum of three months to up to 12 months required from the farmer to the processor, with sometimes longer notice periods required from the processor to the farmer.
• Farmers’ participation on the negotiation of contracts depends on the type of organisation i.e., whether it is a cooperative, a private company negotiating with a producer organisation, formal representative framework set up for the purpose or through dialogue at ad-hoc meetings. Similarly happens with the resolution of conflicts.
• Because of the competitive environment faced by processors, price clauses in contracts between processors and suppliers have historically been built around flexibility, i.e., the use of what is termed ‘purchaser discretion’, which means that a processor (milk purchaser) has the right to vary the farm gate price as and when they see fit.
• Prices paid to farmers tend to consider the following elements: valuation of the milk by constituent content (e.g., butterfat, protein), quality requirements, pricing adjustments for milk quality, volume collection, transport, farm management practices.
8
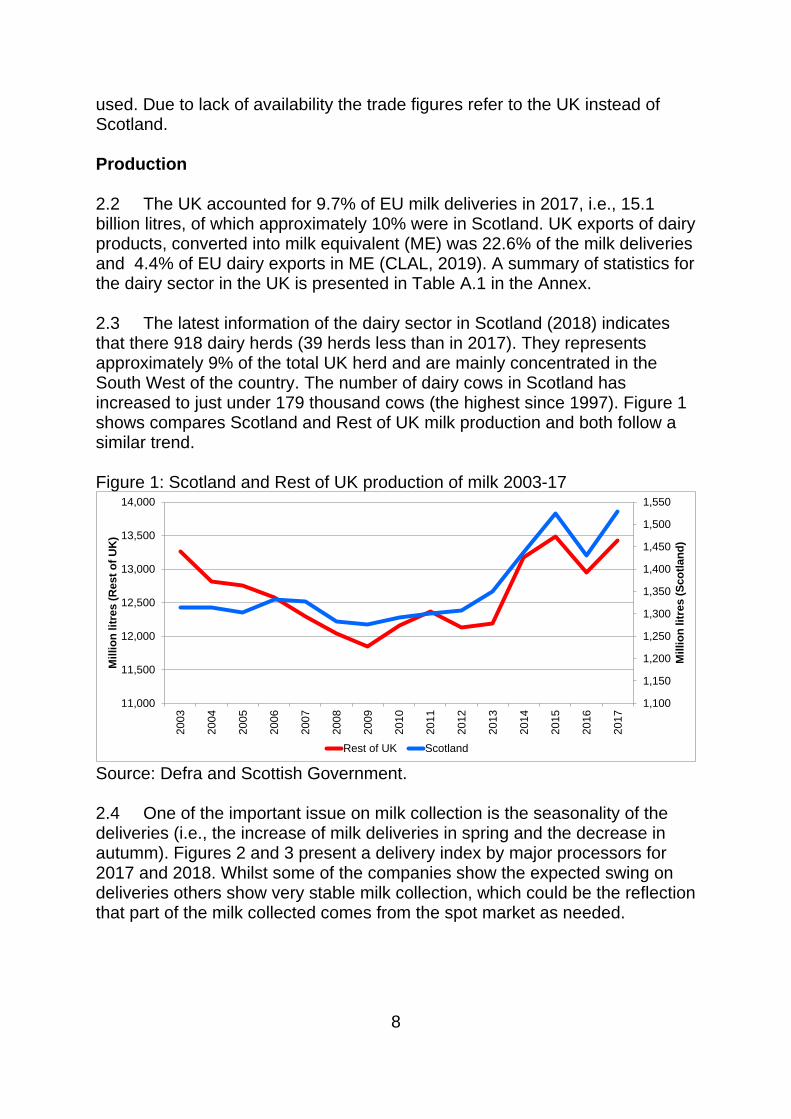
used. Due to lack of availability the trade figures refer to the UK instead of Scotland. Production 2.2 The UK accounted for 9.7% of EU milk deliveries in 2017, i.e., 15.1 billion litres, of which approximately 10% were in Scotland. UK exports of dairy products, converted into milk equivalent (ME) was 22.6% of the milk deliveries and 4.4% of EU dairy exports in ME (CLAL, 2019). A summary of statistics for the dairy sector in the UK is presented in Table A.1 in the Annex. 2.3 The latest information of the dairy sector in Scotland (2018) indicates that there 918 dairy herds (39 herds less than in 2017). They represents approximately 9% of the total UK herd and are mainly concentrated in the South West of the country. The number of dairy cows in Scotland has increased to just under 179 thousand cows (the highest since 1997). Figure 1 shows compares Scotland and Rest of UK milk production and both follow a similar trend. Figure 1: Scotland and Rest of UK production of milk 2003-17
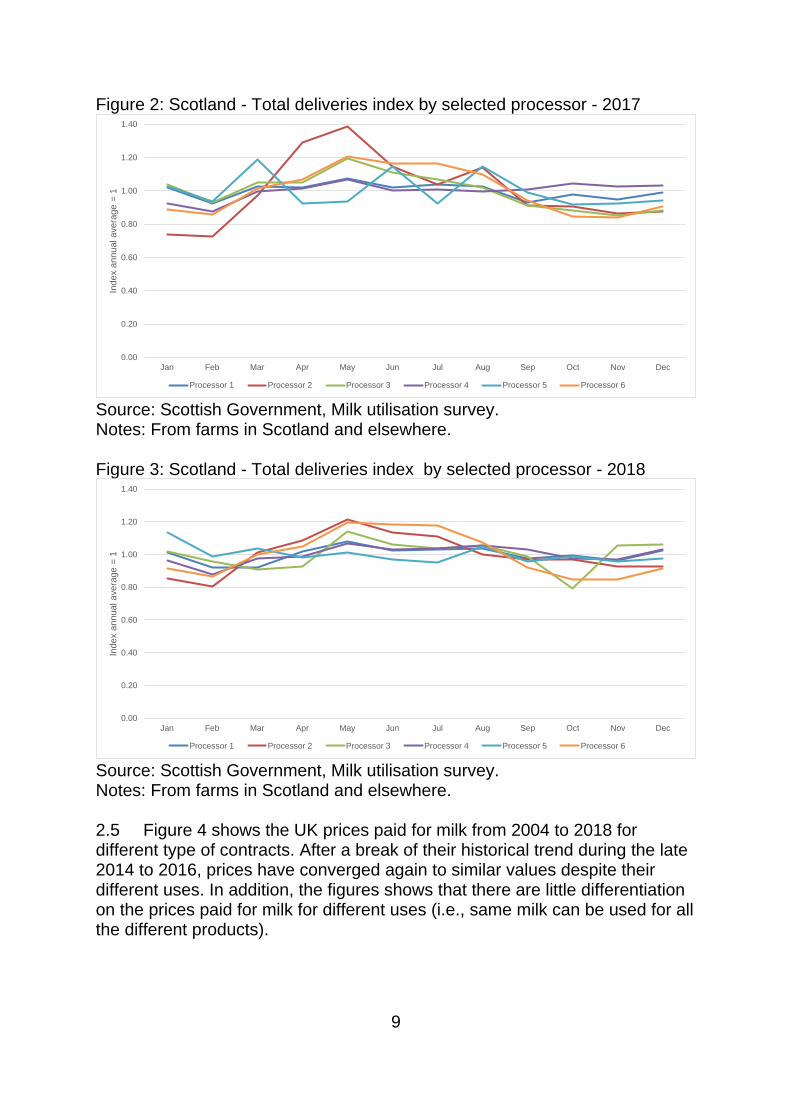
Source: Defra and Scottish Government. 2.4 One of the important issue on milk collection is the seasonality of the deliveries (i.e., the increase of milk deliveries in spring and the decrease in autumm). Figures 2 and 3 present a delivery index by major processors for 2017 and 2018. Whilst some of the companies show the expected swing on deliveries others show very stable milk collection, which could be the reflection that part of the milk collected comes from the spot market as needed.
1,100
1,150
1,200
1,250
1,300
1,350
1,400
1,450
1,500
1,550
11,000
11,500
12,000
12,500
13,000
13,500
14,000
2003
2004
2005
2006
2007
2008
2009
2010
2011
2012
2013
2014
2015
2016
2017
Mil
lio
n lit
res (
Sco
tlan
d)
Mil
lio
n lit
res (
Rest
of
UK
)
Rest of UK Scotland
9
Figure 2: Scotland - Total deliveries index by selected processor - 2017
Source: Scottish Government, Milk utilisation survey. Notes: From farms in Scotland and elsewhere. Figure 3: Scotland - Total deliveries index by selected processor - 2018
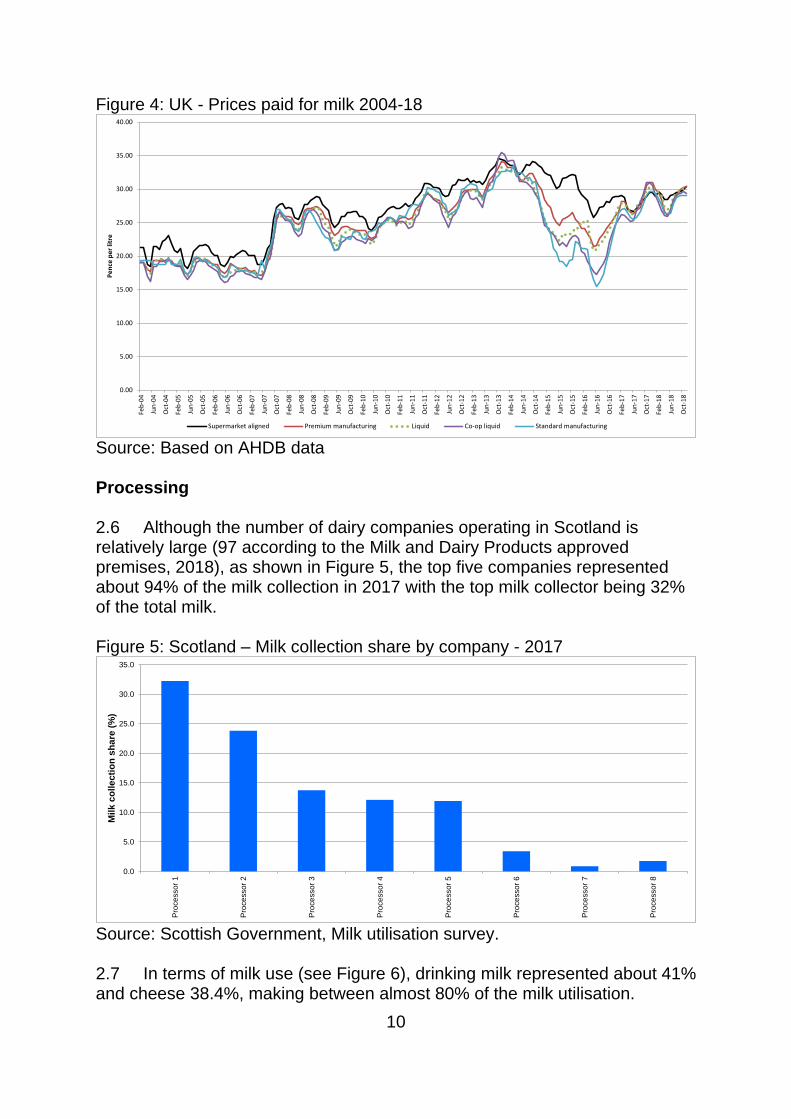
Source: Scottish Government, Milk utilisation survey. Notes: From farms in Scotland and elsewhere. 2.5 Figure 4 shows the UK prices paid for milk from 2004 to 2018 for different type of contracts. After a break of their historical trend during the late 2014 to 2016, prices have converged again to similar values despite their different uses. In addition, the figures shows that there are little differentiation on the prices paid for milk for different uses (i.e., same milk can be used for all the different products).
0.00
0.20
0.40
0.60
0.80
1.00
1.20
1.40
Jan Feb Mar Apr May Jun Jul Aug Sep Oct Nov Dec
Index a
nnual avera
ge =
1
Processor 1 Processor 2 Processor 3 Processor 4 Processor 5 Processor 6
0.00
0.20
0.40
0.60
0.80
1.00
1.20
1.40
Jan Feb Mar Apr May Jun Jul Aug Sep Oct Nov Dec
Index a
nnual avera
ge =
1
Processor 1 Processor 2 Processor 3 Processor 4 Processor 5 Processor 6
10
Figure 4: UK - Prices paid for milk 2004-18
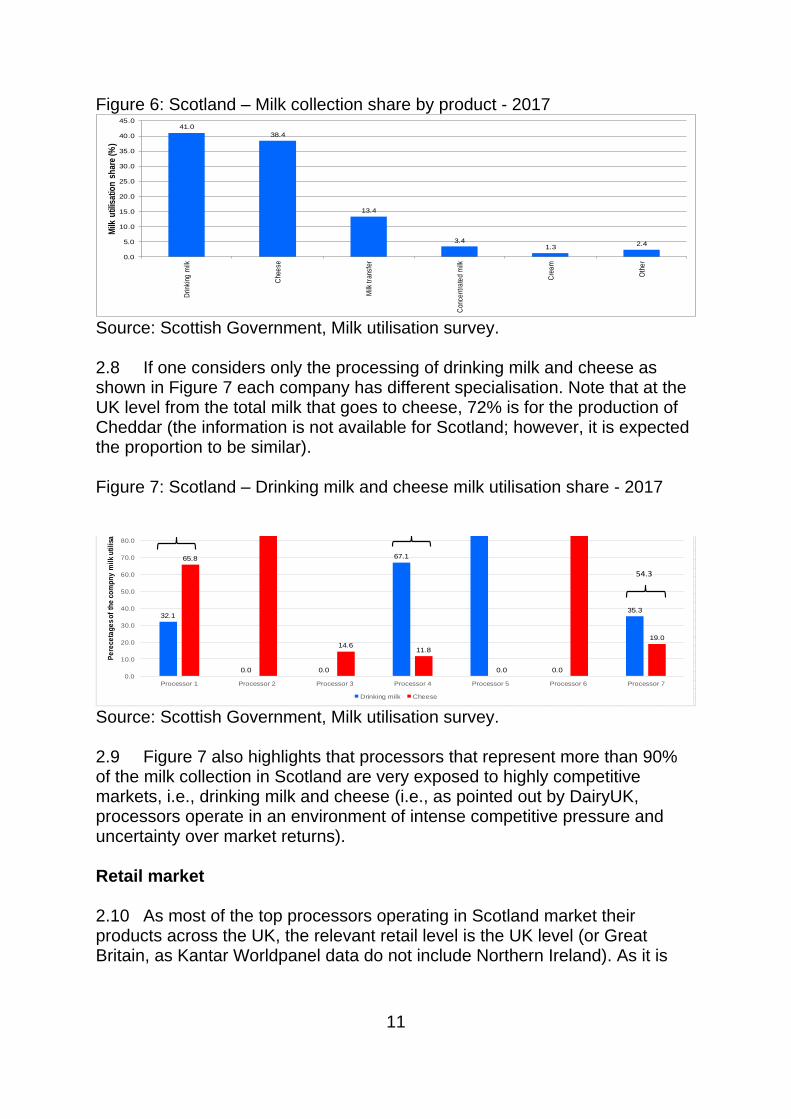
Source: Based on AHDB data Processing 2.6 Although the number of dairy companies operating in Scotland is relatively large (97 according to the Milk and Dairy Products approved premises, 2018), as shown in Figure 5, the top five companies represented about 94% of the milk collection in 2017 with the top milk collector being 32% of the total milk. Figure 5: Scotland – Milk collection share by company - 2017
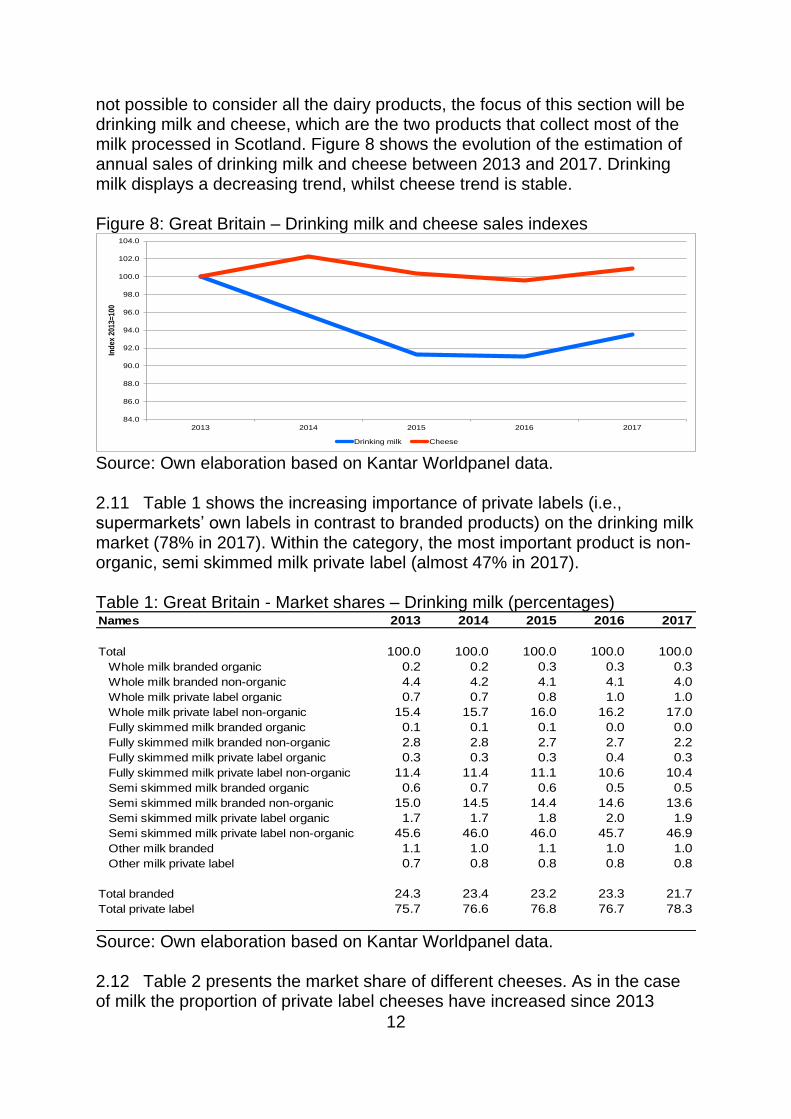
Source: Scottish Government, Milk utilisation survey. 2.7 In terms of milk use (see Figure 6), drinking milk represented about 41% and cheese 38.4%, making between almost 80% of the milk utilisation.
0.00
5.00
10.00
15.00
20.00
25.00
30.00
35.00
40.00
Feb
-04
Jun
-04
Oct
-04
Feb
-05
Jun
-05
Oct
-05
Feb
-06
Jun
-06
Oct
-06
Feb
-07
Jun
-07
Oct
-07
Feb
-08
Jun
-08
Oct
-08
Feb
-09
Jun
-09
Oct
-09
Feb
-10
Jun
-10
Oct
-10
Feb
-11
Jun
-11
Oct
-11
Feb
-12
Jun
-12
Oct
-12
Feb
-13
Jun
-13
Oct
-13
Feb
-14
Jun
-14
Oct
-14
Feb
-15
Jun
-15
Oct
-15
Feb
-16
Jun
-16
Oct
-16
Feb
-17
Jun
-17
Oct
-17
Feb
-18
Jun
-18
Oct
-18
Pe
nce
pe
r lit
re
Supermarket aligned Premium manufacturing Liquid Co-op liquid Standard manufacturing
0.0
5.0
10.0
15.0
20.0
25.0
30.0
35.0
Pro
ce
sso
r 1
Pro
ce
sso
r 2
Pro
ce
sso
r 3
Pro
ce
sso
r 4
Pro
ce
sso
r 5
Pro
ce
sso
r 6
Pro
ce
sso
r 7
Pro
ce
sso
r 8
Mil
k c
oll
ec
tio
n s
ha
re (
%)
11
Figure 6: Scotland – Milk collection share by product - 2017
Source: Scottish Government, Milk utilisation survey.
2.8 If one considers only the processing of drinking milk and cheese as shown in Figure 7 each company has different specialisation. Note that at the UK level from the total milk that goes to cheese, 72% is for the production of Cheddar (the information is not available for Scotland; however, it is expected the proportion to be similar).
Figure 7: Scotland – Drinking milk and cheese milk utilisation share - 2017
Source: Scottish Government, Milk utilisation survey.
2.9 Figure 7 also highlights that processors that represent more than 90% of the milk collection in Scotland are very exposed to highly competitive markets, i.e., drinking milk and cheese (i.e., as pointed out by DairyUK, processors operate in an environment of intense competitive pressure and uncertainty over market returns).
Retail market
2.10 As most of the top processors operating in Scotland market their products across the UK, the relevant retail level is the UK level (or Great Britain, as Kantar Worldpanel data do not include Northern Ireland). As it is
41.0
38.4
13.4
3.41.3
2.4
0.0
5.0
10.0
15.0
20.0
25.0
30.0
35.0
40.0
45.0
Drin
king
milk
Che
ese
Milk
tran
sfer
Con
cent
rate
d m
ilk
Cre
am
Oth
er
Milk
util
isat
ion
sh
are
(%)
32.1
0.0 0.0
67.1
91.0
0.0
35.3
65.8
94.2
14.611.8
0.0
89.7
19.0
0.0
10.0
20.0
30.0
40.0
50.0
60.0
70.0
80.0
90.0
100.0
Processor 1 Processor 2 Processor 3 Processor 4 Processor 5 Processor 6 Processor 7
Pe
rece
tag
es
of
the
co
mp
ny
mil
k u
tili
sati
on
Drinking milk Cheese
97.978.9
54.3
12
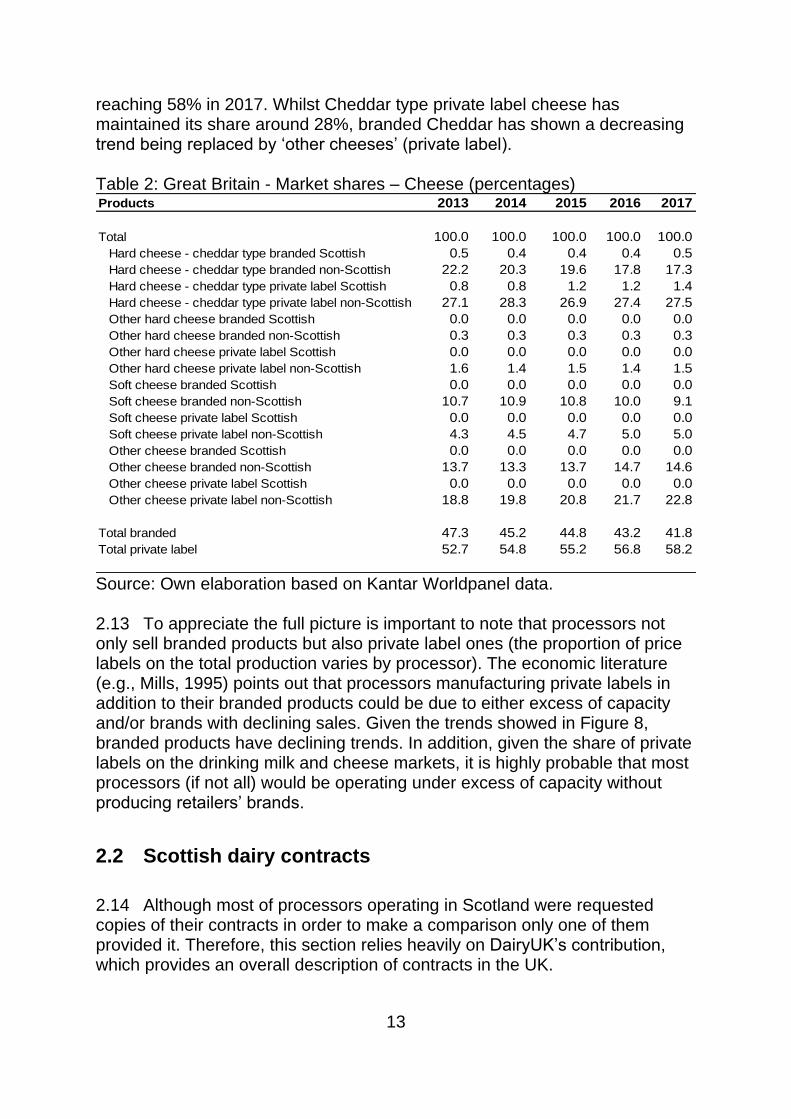
not possible to consider all the dairy products, the focus of this section will be drinking milk and cheese, which are the two products that collect most of the milk processed in Scotland. Figure 8 shows the evolution of the estimation of annual sales of drinking milk and cheese between 2013 and 2017. Drinking milk displays a decreasing trend, whilst cheese trend is stable. Figure 8: Great Britain – Drinking milk and cheese sales indexes
Source: Own elaboration based on Kantar Worldpanel data. 2.11 Table 1 shows the increasing importance of private labels (i.e., supermarkets’ own labels in contrast to branded products) on the drinking milk market (78% in 2017). Within the category, the most important product is non-organic, semi skimmed milk private label (almost 47% in 2017). Table 1: Great Britain - Market shares – Drinking milk (percentages)
Source: Own elaboration based on Kantar Worldpanel data. 2.12 Table 2 presents the market share of different cheeses. As in the case of milk the proportion of private label cheeses have increased since 2013
84.0
86.0
88.0
90.0
92.0
94.0
96.0
98.0
100.0
102.0
104.0
2013 2014 2015 2016 2017
Ind
ex 2
013=
100
Drinking milk Cheese
Names 2013 2014 2015 2016 2017
Total 100.0 100.0 100.0 100.0 100.0
Whole milk branded organic 0.2 0.2 0.3 0.3 0.3
Whole milk branded non-organic 4.4 4.2 4.1 4.1 4.0
Whole milk private label organic 0.7 0.7 0.8 1.0 1.0
Whole milk private label non-organic 15.4 15.7 16.0 16.2 17.0
Fully skimmed milk branded organic 0.1 0.1 0.1 0.0 0.0
Fully skimmed milk branded non-organic 2.8 2.8 2.7 2.7 2.2
Fully skimmed milk private label organic 0.3 0.3 0.3 0.4 0.3
Fully skimmed milk private label non-organic 11.4 11.4 11.1 10.6 10.4
Semi skimmed milk branded organic 0.6 0.7 0.6 0.5 0.5
Semi skimmed milk branded non-organic 15.0 14.5 14.4 14.6 13.6
Semi skimmed milk private label organic 1.7 1.7 1.8 2.0 1.9
Semi skimmed milk private label non-organic 45.6 46.0 46.0 45.7 46.9
Other milk branded 1.1 1.0 1.1 1.0 1.0
Other milk private label 0.7 0.8 0.8 0.8 0.8
Total branded 24.3 23.4 23.2 23.3 21.7
Total private label 75.7 76.6 76.8 76.7 78.3
13
reaching 58% in 2017. Whilst Cheddar type private label cheese has maintained its share around 28%, branded Cheddar has shown a decreasing trend being replaced by ‘other cheeses’ (private label). Table 2: Great Britain - Market shares – Cheese (percentages)
Source: Own elaboration based on Kantar Worldpanel data. 2.13 To appreciate the full picture is important to note that processors not only sell branded products but also private label ones (the proportion of price labels on the total production varies by processor). The economic literature (e.g., Mills, 1995) points out that processors manufacturing private labels in addition to their branded products could be due to either excess of capacity and/or brands with declining sales. Given the trends showed in Figure 8, branded products have declining trends. In addition, given the share of private labels on the drinking milk and cheese markets, it is highly probable that most processors (if not all) would be operating under excess of capacity without producing retailers’ brands.
2.2 Scottish dairy contracts
2.14 Although most of processors operating in Scotland were requested copies of their contracts in order to make a comparison only one of them provided it. Therefore, this section relies heavily on DairyUK’s contribution, which provides an overall description of contracts in the UK.
Products 2013 2014 2015 2016 2017
Total 100.0 100.0 100.0 100.0 100.0
Hard cheese - cheddar type branded Scottish 0.5 0.4 0.4 0.4 0.5
Hard cheese - cheddar type branded non-Scottish 22.2 20.3 19.6 17.8 17.3
Hard cheese - cheddar type private label Scottish 0.8 0.8 1.2 1.2 1.4
Hard cheese - cheddar type private label non-Scottish 27.1 28.3 26.9 27.4 27.5
Other hard cheese branded Scottish 0.0 0.0 0.0 0.0 0.0
Other hard cheese branded non-Scottish 0.3 0.3 0.3 0.3 0.3
Other hard cheese private label Scottish 0.0 0.0 0.0 0.0 0.0
Other hard cheese private label non-Scottish 1.6 1.4 1.5 1.4 1.5
Soft cheese branded Scottish 0.0 0.0 0.0 0.0 0.0
Soft cheese branded non-Scottish 10.7 10.9 10.8 10.0 9.1
Soft cheese private label Scottish 0.0 0.0 0.0 0.0 0.0
Soft cheese private label non-Scottish 4.3 4.5 4.7 5.0 5.0
Other cheese branded Scottish 0.0 0.0 0.0 0.0 0.0
Other cheese branded non-Scottish 13.7 13.3 13.7 14.7 14.6
Other cheese private label Scottish 0.0 0.0 0.0 0.0 0.0
Other cheese private label non-Scottish 18.8 19.8 20.8 21.7 22.8
Total branded 47.3 45.2 44.8 43.2 41.8
Total private label 52.7 54.8 55.2 56.8 58.2
14
2.15 Generally contractual arrangements in the dairy industry are based around flexibility in pricing to cater for the volatile market the industry operates in combined with security of supply chain arrangements. 2.16 Security of outlet and input is paramount to the successful operation of the dairy industry supply chain. Farmers need a secure continuous outlet for their milk. Raw milk is produced continuously during the year and it is a perishable product. Farmers do not have the storage capacity to keep more than a few days of production on the farm. The natural variability of milk production also gives uncertainty to the volume being produced. 2.17 Processors need a secure continuous flow of raw milk. Processors likewise do not have the capacity to store a significant volume of raw milk. Processors require a continuous flow of product, to maximise utilisation of processing plant and to service markets, especially fresh product markets. Processors need to obtain raw milk as much as farmers have to sell raw milk. Offer contract and duration 2.18 Milk processors are usually supplied by a large number of dairy farmers. As a result processors tend to use standardised contracts for all of their supplying farmers or groups of farmers. As pointed out by Dairy UK processors do not negotiate contracts individually with dairy farmers as it is impractical to do so. 2.19 Because of the aforementioned reasons behind the operation of dairy farms and processors, contracts are usually open ended (evergreen). Notice periods are generally long, from a minimum of three months to up to 12 months required from the farmer to the processor, with sometimes longer notice periods required from the processor to the farmer. The length of notice periods is designed to:
• Ensure processors can service long term contracts with their customers.
• Give processors time to secure alternative sources of supply if dairy farmers resign.
2.20 As regards farmer participation in determination of contracts, it differs by type of organisation: 2.21 Co-operatives - Around 45% of Scottish milk supply is purchased by dairy co-operatives. Dairy co-operatives are under the ownership and control of dairy farmers and the content of contracts or their equivalent are determined within the governance structure operated by the co-operative. 2.22 For private dairy companies the process by which contracts are developed and amended can be through:
15
2.23 Negotiation with representative organisations - Farmers supplying Lactalis are members of the Milk Suppliers Association. The MSA is a co-operative. It does not purchase the milk of its members but it engages directly with Lactalis in determining milk prices. MSA is not registered as a Producer Organisation but its status as a co-operative provides it with exemptions in competition law that entitle it to participate in price discussions. 2.24 Consultation through other frameworks - Some processors consult their supplying farmers through either a formal representative framework set up for the purpose or through dialogue at ad-hoc meetings. Farmers supplying Muller are organised in the Muller Milk Group. 2.25 Overall, taking into account co-ops and other representative structures into account, a major portion of Scottish milk supply is operated under arrangements that provide a mechanism to consult the views of dairy farmers in the development of contracts and determination of milk prices. Milk pricing 2.26 Processors (co-operatives or private companies) operate in an competitive environment, under uncertainty over market returns and do not have the resources to protect their supplying farmers from price fluctuations. As a result of these commercial pressures, price clauses in contracts between dairy processors and their supplying farmers have historically been built around flexibility. Very specifically this had led to the widespread adoption by milk processors of the use of what is termed ‘purchaser discretion’. This is where the processor (milk purchaser) has the right to vary the farm gate price as and when they see fit (Dairy UK). 2.27 Overall, in conjunction with the processors commitment to buy all the milk produced by a farmer, this results in processors taking the volume risk whilst dairy farmers carry the primary burden of price risk. However, processors are not completely exempted from price risk. For instance, manufacturers of mature cheese can be particularly affected by the differences in raw milk costs and price paid for the finished product given the lengthy period of maturation (e.g.,two years). 2.28 Prices paid to farmers tend to consider the following elements:
• Valuation of the milk by constituent content (e.g., butterfat, protein)
• Quality requirements
• Pricing adjustments for milk quality, volume collection, transport etc.
• Farm management practices
16
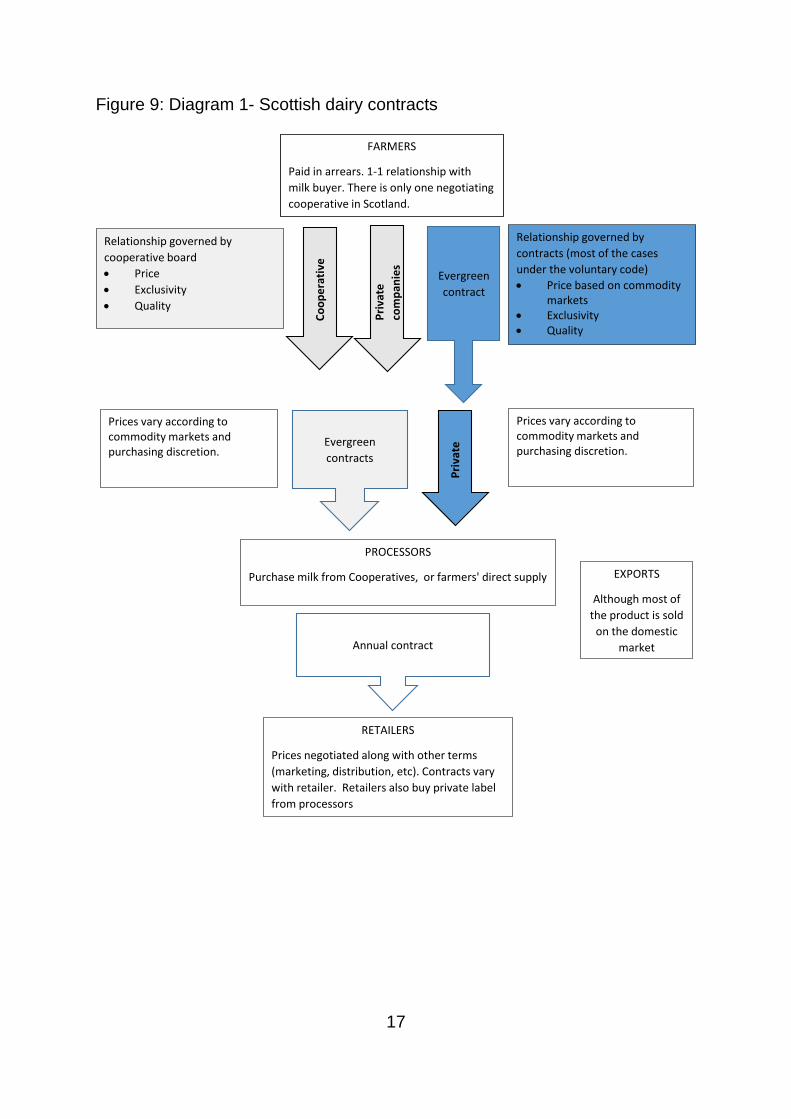
Volume collected 2.29 Processors are generally committed to purchase all the milk produced on a farm (i.e., exclusivity). Dispute resolution 2.30 Dispute resolution also differs by type of organisation: 2.31 Co-operatives – Complaints within a co-operative structure follow the procedures established by the co-operative. 2.32 Negotiation with representative organisations - Contracts establish that in case of conflict a mediated solution will be sought. The disputes are treated by the board committee encouraging an agreed resolution, and then if an agreement is not reached again an agreement is sought through mediation. The aspiration is that the last decision on the dispute will remain always in the hands of the parties, not with a third party. Farmers that want to leave after a period notice. In addition, if the mediation fails the contract has a deadlock clause in which the farmer can move after a period elsewhere. 2.33 Other frameworks – If the firm is relatively small there may not be any pre-established mechanism and the conflict solution may be left to left to the parties (i.e., processor and farmer) to discuss the problem. Market transparency – information disclosure 2.34 Whilst milk collection and their utilisation are gathered by the Scottish Government and Defra, dairy contracts are confidential. Contracts between processors and retailers 2.35 Based on the interviews it was clear that the contracts between processors and retailers are varied in terms of clauses and duration (i.e., they change by retailer and product). 2.36 Diagram 1 presents a summary of the structure of the dairy contracts in Scotland.
17
Figure 9: Diagram 1- Scottish dairy contracts
Annual contract
RETAILERS
Prices negotiated along with other terms
(marketing, distribution, etc). Contracts vary
with retailer. Retailers also buy private label
from processors
EXPORTS
Although most of
the product is sold
on the domestic
market
FARMERS
Paid in arrears. 1-1 relationship with
milk buyer. There is only one negotiating
cooperative in Scotland.
Relationship governed by
contracts (most of the cases
under the voluntary code)
• Price based on commodity markets
• Exclusivity• Quality
PROCESSORS
Purchase milk from Cooperatives, or farmers' direct supply
Prices vary according to commodity markets and purchasing discretion.
Relationship governed by
cooperative board
• Price
• Exclusivity
• Quality
Pri
vate
com
pan
ies
Co
op
erat
ive
Prices vary according to commodity markets and purchasing discretion.
Pri
vate
Evergreen
contract
Evergreen
contracts
18
3. Review of the evidence on dairy
contracts in European countries
3.1 France
3.1 Compulsory formal contracts and producers organisations were implemented in France in 2010 (Decree N° 2010-1753 of 30 December 2010). The decree, which came into force on the 1st of April of 2011, was reinforced by the adoption in 2012 of the Milk Package and the recognition in April 2012 of producers organisations (PO). 3.2 According to Dervillé and Allaire (2014) and Trouvé et al. (2016) MWCs were introduced as a result of several issues:
• The significant concentration of private companies on the French dairy sector.
• The progressive elimination of quotas.
• Competition issues around the role played by the French Dairy Interbranch Organization (CNIEL) in balancing the power relationships along the supply.
• The distress associated to the bankruptcy of several dairies in 2009.
• The limited collective bargaining of producers.
Key points
• Contracts were introduced to provide stability and transparency in the relationship between farmers and processors.
• The contracts specify the quantities to be delivered to processors and the pricing formula in the case of private companies. The latter is not a fixed indicator but a set of negotiated indicators used within a formula. Whilst the components are in general known, the weight to each one of them is confidential and only known to the negotiated parties.
• Cooperatives must also state the pricing elements within their contracts, but do not have the ability to restrict volumes, hence the widespread use of A/B style pricing.
• Currently France is implementing to requirement to include an indicator related to costs of production (production and processing) in the pricing of milk.
• There is some stability in the relationship between retailers and processors given by the use of negotiated annual contracts for branded products, which account for about 70% of the dairy products on the market.
19
3.3 As specified in Article L631-24 of the Rural Code and Maritime Fisheries on contracting in the agricultural sector, the main objectives of MWCs are:
• To guarantee the relations between the individual producers and the processors.
• To stabilise prices in the face of increased volatility risk.
• To fight against the reduction of the price of milk from peripheral areas, specially mountain areas.
3.4 There are two types of MWC: (1) individual "simple" contracts (i.e., individual producers and a processor), which are now a minority; (2) individual contracts signed by the members of the PO, supplemented by a collective agreement developed between the company and the PO. The contracts comprise by law seven mandatory components: the duration of the contract, the quality of the product, the volume of milk, the collection of milk, the price, payment and termination. 3.5 Moreover, Article L631-24 aims also at strengthening the role of PO in the negotiation of contract terms, and to balance the relationship between the producers and the companies. 3.6 The French law distinguishes two types of Producer Organisations: i) the commercial PO that, as the owner, sells the production of its members (i.e., there is transfer of ownership from the members to the PO); ii) and the non-commercial PO which collectively negotiating sales contracts on behalf of its members, markets their production but with no transfer of ownership. 3.7 As of October 2015, 51 POs were recognised and represented 40% of volumes delivered to private dairies. Most POs are associations structured around dairy production sites. They are vertical POs with a regional dimension (i.e., formed by a pool of farmers selling to one processor) and note that larges processors dairies deal with multiple POs. Transversal POs are infrequent being France Milk Board the only case which encompasses three POs covering the entire French territory. 3.8 Co-operatives in France are required to provide the same terms as in private contracts in terms of price (Lambaré et al., 2018). The use of contracts does not affect the duration or nature of the co-operative commitment to its members but does mean the terms and conditions by which the milk price is determined, and volumes are assessed is made explicit to members in the same way as in contracts offered by private dairies. 3.9 Because of their status, co-operatives are compelled to take on all the milk of their members. As such, and unlike private processors, they cannot make use of volume clauses in a commercial contract to manage their milk
20
supply. This createsan issue for them around managing upstream volumes and keeping a balance between processing capacity and negotiated markets. As such, rules need to be defined within the co-operative framework to deal with this issue (Trouvé et al. 2016). 3.10 For the case of France, the implementation of the Milk Package did not require the establishment of an interprofessional association because the French dairy interprofessional association CNIEL was first created the 21st March 1974. It was a joint initiative of the three federations representatives of the dairy milk professional assembly Fédération Nationale des Producteurs de Lait (FNPL), la Fédération Nationale des Coopératives Laitières (FNCL) and the Fédération Nationale de l’Industrie Laitière (FNIL). However, in January 2014, la Confédération Paysanne was incorporated as a new member. It is a private organisation with 40 million euros of annual budget. Funded by a mandatory fee paid dairy farmers (70%) and processors (30%), proportionate to the milk volume produced /processed. 3.11 Between 2010 and 2012, French Dairy Interbranch Organisation (CNIEL) positioned itself as a facilitator for contractual procedures. It elaborated a guide to good practices and created an Interprofessional Commission on Contractual Practices (CIPC), However, the CNIEL mission is weakened due to the lack of consensus between its parts. All decisions must be taken by unanimity of all its members: farmers, dairy cooperatives and private groups. Offer contract and duration 3.12 The contracts consist of written and compulsory commitments between milk producers and their buyers for a minimum five-years (seven years for new entrants). In the absence of a reference to the renewal conditions in the contract, these are considered as being evergreen contracts for a period equivalent for which it was initially signed but with the possibility of termination under 12-month notice. 3.13 Article L631-24 recommends to include in the contracts a restrictive list of reasons for termination by default. The contract would thus be considered as indefinite except in cases of force majuere for particular reasons under judicial control. In the case of non-renewal, the purchaser needs to notice the producer no less than three months in advance. The mandatory clauses of the contract also relate to the volumes and characteristics of the milk to be delivered and the methods of collection of milk. These elements are specified in the contracts through private negotiation.
21
Volume delivered 3.14 The volumes, after the elimination of the quota, were established based on the former quotas. Contracts specify the obligations, except in exceptional circumstances provided in the contract, to the seller and the purchaser. In particular the conditions of access to the milk, the frequency and the time-frame of collection, the conditions for the removal of the milk and the procedure established for sampling and measuring the quality and composition of the milk. At each removal of milk, the quantity collected shall be notified by the purchaser to the producer in the form of a delivery order. 3.15 On the interviews it was clear that contracts did not contain exclusivity clauses. This is due to the fact that a processor deals with several POs (e.g., Lactalis negotiates with 19 POs). Milk price 3.16 All contracts must contain a milk price or a price formula to indicate the monthly price to be paid (ALTA, 2017). Contracts most often use the indicators provided by the CNIEL as a reference. This can at times be adapted by region to allow for variations in markets. For the case of co-operatives, a system of double (or triple) pricing linked to volumes produced is often used. The contract always needs to specify the criteria and modalities taken into account for the determination of the basic price of milk. The indicators most often selected are those established by CNIEL such as:
• Index of industrial products of milk powder and butter
• An indicator related to export cheese prices for Gouda, Edam and Emmental
• An indicators of the level of consumption in France
• The difference between the average price of milk paid in France and Germany.
Dispute resolution 3.17 When there is a conflict or question related to the trade relations between producer and purchaser of cow milk, there is an institution named the Médiateur des Relations Commercials which is free of charge and has a preventive role. Mediations are carried out by an independent group made of one mediator and three delegates, and cover all agricultural sectors. Market transparency – information disclosure 3.18 To facilitate contractual negotiations within the food sector, the Observatory of Price Formation of Food Prices and Margins was created in
22
2010. The aim of the organisation is to track prices at different stages of the industry and to determine the margin between the stages of the suply chain. This is done using public statistical data. Note that the outputs are publically available as well so everybody can track the margins. Processors and retailer relationships 3.19 In France, retailers have significant negotiation power. This is increased by the fact that they are allowed to jointly negotiate with processors. The main reason behind this is that the competition authority is keen to maintain low prices for consumers. This is also the reason why the Processors’ Association is not allowed to participate in contract’ negotiations. 3.20 Negotiations between processors and retailers are in two forms: (1) negotiation for national brands, which occurs annually from November to February and (2) negotiation for private labels. The margins are tighter in the second case due to the higher substitutability of products. Private label has a much smaller markets share, with only 35% of all the milk products sold at retail level. Brands account for 65% of the market. In the case of UHT milk, however 70% is private label. 3.21 Branded products are sold to retailers on 1-year contract where price and volume is agreed. Private label products are be sold on indefinite contracts, in which case prices tend to remain fixed until one party to the contract asks for a renegotiation. This requires a 3 month notice period if a higher price is to be implemented. However, if the retailer re-negotiates a lower price, this is often implemented immediately. The longer term contract between processors and retailers provides some stability downstream the chain. Prospects 3.22 Farmers are relatively happy with the contracts. Although the strucutre of French contracts has limited their ability to expand (they cannot sell what they want), this was not a big change from the quota situation and most understand that volume management helps to support the price. 3.23 The main benefit to processors, excluding cooperatives, is they are no longer required buy all the milk delivered to them. This reduced their volume risk and helps with planning capacity. Previously, they were obliged to buy all volumes delivered while still paying a price indexed to market movements. Cooperatives have dealt with the volume issue by implementing differntial pricing. 3.24 The pricing mechanism in contracts is currently being modified to introduce cost of production for farmers and processors. It is thought this will
23
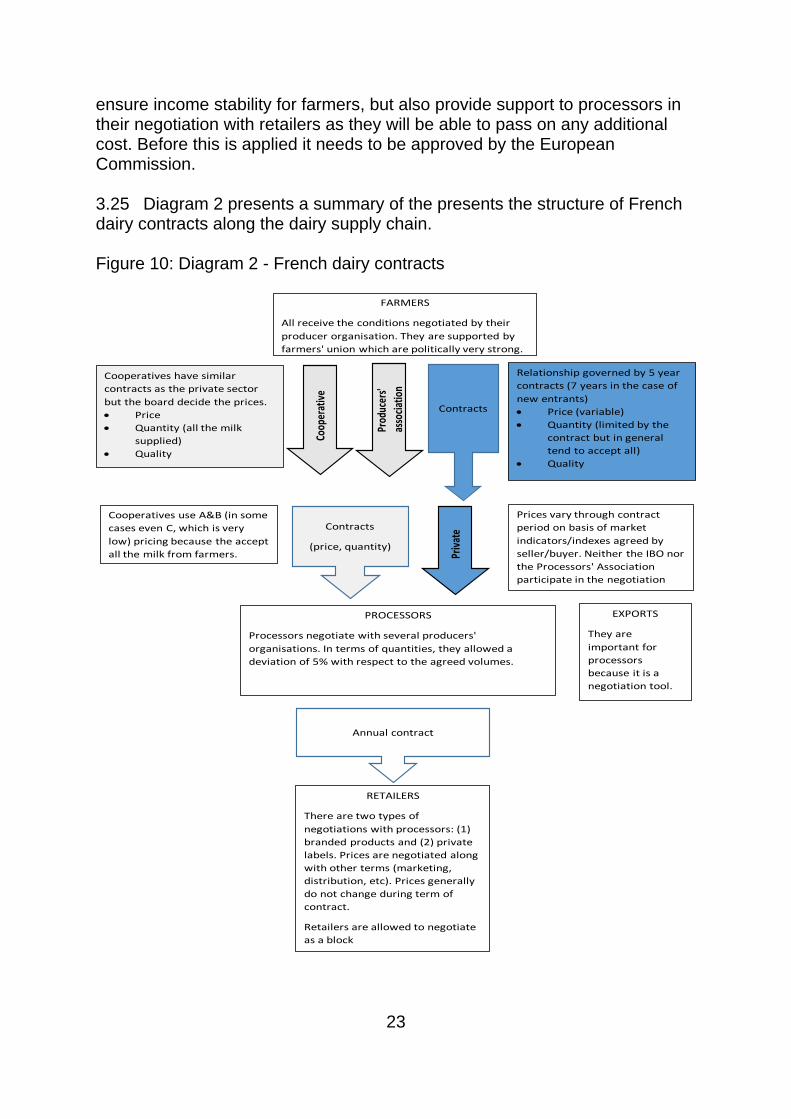
ensure income stability for farmers, but also provide support to processors in their negotiation with retailers as they will be able to pass on any additional cost. Before this is applied it needs to be approved by the European Commission. 3.25 Diagram 2 presents a summary of the presents the structure of French dairy contracts along the dairy supply chain. Figure 10: Diagram 2 - French dairy contracts
Annual contract
RETAILERS
There are two types of
negotiations with processors: (1)
branded products and (2) private
labels. Prices are negotiated along
with other terms (marketing,
distribution, etc). Prices generally
do not change during term of
contract.
Retailers are allowed to negotiate
as a block
EXPORTS
They are
important for
processors
because it is a
negotiation tool.
FARMERS
All receive the conditions negotiated by their
producer organisation. They are supported by
farmers' union which are politically very strong.
Relationship governed by 5 year
contracts (7 years in the case of
new entrants)
• Price (variable)
• Quantity (limited by the
contract but in general
tend to accept all)
• Quality
PROCESSORS
Processors negotiate with several producers'
organisations. In terms of quantities, they allowed a
deviation of 5% with respect to the agreed volumes.
Prices vary through contract
period on basis of market
indicators/indexes agreed by
seller/buyer. Neither the IBO nor
the Processors' Association
participate in the negotiation
Cooperatives have similar
contracts as the private sector
but the board decide the prices.
• Price
• Quantity (all the milk
supplied)
• Quality
Prod
ucer
s'
asso
ciat
ion
Coop
erat
ive
Cooperatives use A&B (in some
cases even C, which is very
low) pricing because the accept
all the milk from farmers. Priv
ate
Contracts
Contracts
(price, quantity)
24
3.2 Hungary
3.26 It has been suggested that a common feature of pre-socialist regimes in transition to liberal economic systems, has been the initial inability of their public institutions to properly enforce contracting agreements. This uncertain legal-business environment, resulted in producers and processors of milk, who may struggle to establish long-term relationships based on formal agreements, opting instead for oral agreements or using spot markets (Bakucs, et al., 2013). 3.27 The Milk Package was implemented in Hungary in December 2012, making mandatory the use of written contracts for the marketing of raw milk between producers and first purchasers of milk and establishing a minimum contract duration of six months (European Commission, 2016). A survey from members of the Hungarian Dairy Product Council (HDPC), which accounted for 75% of the Hungarian milk quota, found that approximately 72% of its members sold their milk under a written contract (Bakucs, et al., 2013). Offer contract and duration 3.28 The contracts consist of written and compulsory commitments between milk producers and their buyers for a minimum of six months. However, information from interviews suggest contracts are often of longer terms, anywhere from 1-3 years or evergreen. Contracts can be ended with notice of between 90 to 150 days. Volume delivered 3.29 Volumes are specified within contracts, with farmers providing information on volumes to be delivered within a set period (monthly, quarterly
Key points
• The introduction of contracts was not a dramatic change to the industry as they were already in wide-spread use before the Milk Package.
• Processors adapt pricing within contracts to their final markets and offer farmers a specific set of conditions (e.g., pricing alternatives) for their choice.
• Volumes expected to be delivered are declared in advance and tolerances are negotiated between the parties.
• POs play a role in balancing the negotiation power of farmers and purchasers and on mediation. Key on this is the competence of the head of the producer organisation.
• The IBO also plays a role as a place for discussion. It brings all the stakeholders. It is the only case in Europe where retailers are part of an IBO.
25
or annually). Depending on the processor, there are tolerances around these volumes of between 5% to 15%, which are often negotiated. Deviations beyond the agreed limits generally incur a penalty. 3.30 Not all the contracts include exclusity clauses. In some cases, farmers can sell milk elsewhere but only directly to consumers and only up to 25% of their production. They cannot sell to other processors. Pricing 3.31 The pricing used is adapted by processors according to their businesses, i.e., there is plenty of discretion in the way that the pricing is set. One of the interviewed processors set prices two months ahead. They are conservative on their pricing and they do not reflect the peaks and troughs observed on the market price. Nevertheless, they follow the average market price. In addition of the base price, there are premia for fat, protein and bacteria content. Price is lagged to keep in line with market and to help smooth price for farmers. 3.32 Another processor provides farmers with a choice of pricing options, using Hungarian market prices, the EU28 average price (or prices in neighbouring states) and spot market pricing. These indicators will then be used for the length of the contract. They offer farmers a set of 5-10 indicators in different combinations and around 20 ‘pricing’ choices to the farmer. The models offered to farmers are managed to align with relevant product markets of the processor. Dispute resolution 3.33 There a no centralised or formalised dispute resolution authority in Hungary. According to the interviewed producer organisation, the contracts contain the seeds of conflicts resolution. If the processor is not satisfied (e.g., due to a quality issue) then he would complain to the producer organisation. They would send the milk to an independent laboratory for check of quality. If the contract is not fulfilled then there would be a penalty. For amendments to the contracts the parties come first to the producer organisation. Market transparency – information disclosure 3.34 It was considered by all the interviewees that contracts increased market transparency. Contracts remained confidential between parties and the interbranch organisation (as in France) does not participate in negotiations. However, it plays an important role in bringing producers, processors and retailers together to align the interests across the supply chain. The interbranch organisation membershop covers 80% of raw milk production, 70% of the retailers, and 95% of the processors.
26
3.35 In addition, the interbranch organisation plays a role in the collection of publicly available data (product balances for raw milk, wholesale and retailer) and also is involved with the generic promotion of Hungarian dairy products. Process of introducing the mandatory written contracts 3.36 Due to the lack of the tradition of trading between producers and processors during the Communist period, contracts were widely ued pre-accession. Processors indicated that the introduction of mandatory contracts did not cause any dramatic changes. Similar contracts were alreay in place before the Milk Package and there exists a good level of trust between farmers and buyers in the Hungarian dairy industry. The biggest change resulting from the legislation was the requirement to use formula pricing. Processors and retailer relationships 3.37 Processors and retailers do not have annual contracts. Sales to retailers are genearlly done on a short term basis, typically for around 1-6 months. There are 6-8 big retailer operating in Hungary, most of which are multinationals such as Tesco and Auchan. These companies posses strong market power due to their size and their ability to import dairy products. Negotiations between processors and retailers are frequent and often influenced by spot market pricing. One of the processors indicated that some stability in pricing is obtained from providing a differentiated product; products such as UHT milk obtains only low margins. If the product is well known to consumers it increases processors barganing power. The role of the POs on the contract negotiation 3.38 The interviewed PO’s head was a former officer of the ministry of agriculture and also former IBO manager (i.e., he has excellent knowledge of the legislation). The role of the PO is to negotiate better contracts for its members. It does not own the milk and the contracts are between each farmer and the processor. 3.39 The PO was formed because farmers came to him asking for help. The formation of the PO took some time as farmers needed to see the benefits. It occurred when farmers needed to deal with a crisis of low milk prices and wanted to improve the competition for milk. Its formation was helped by getting the Government to require membership in a PO to qualify for subsidies. Once farmers saw the benefits of ‘group negotiations’, more wanted to join. 3.40 According to him the main benefits of the PO are increased transparency and increased competition for milk supplies.
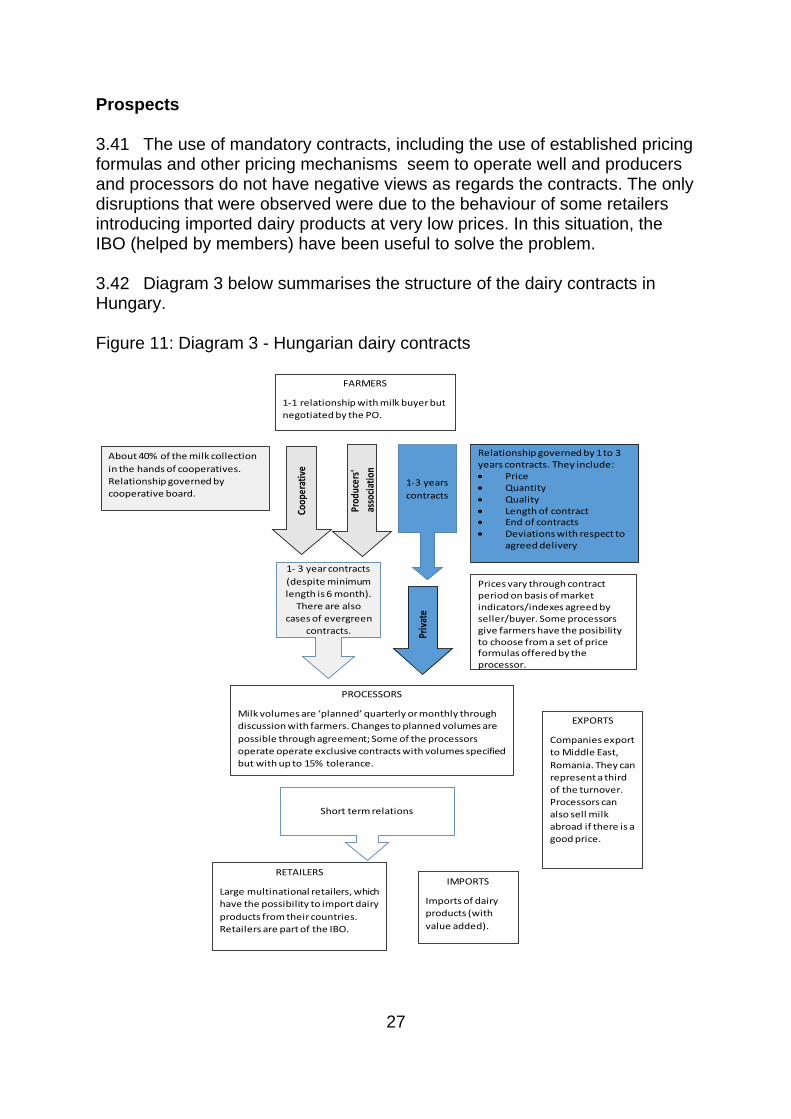
27
Prospects 3.41 The use of mandatory contracts, including the use of established pricing formulas and other pricing mechanisms seem to operate well and producers and processors do not have negative views as regards the contracts. The only disruptions that were observed were due to the behaviour of some retailers introducing imported dairy products at very low prices. In this situation, the IBO (helped by members) have been useful to solve the problem. 3.42 Diagram 3 below summarises the structure of the dairy contracts in Hungary. Figure 11: Diagram 3 - Hungarian dairy contracts
Short term relations
RETAILERS
Large multinational retailers, which
have the possibility to import dairy
products from their countries.
Retailers are part of the IBO.
EXPORTS
Companies export
to Middle East,
Romania. They can
represent a third
of the turnover.
Processors can
also sell milk
abroad if there is a
good price.
FARMERS
1-1 relationship with milk buyer but
negotiated by the PO.
Relationship governed by 1 to 3 years contracts. They include:• Price• Quantity • Quality• Length of contract• End of contracts• Deviations with respect to
agreed delivery
PROCESSORS
Milk volumes are ‘planned’ quarterly or monthly through
discussion with farmers. Changes to planned volumes are
possible through agreement; Some of the processors
operate operate exclusive contracts with volumes specified
but with up to 15% tolerance.
Prices vary through contract period on basis of market indicators/indexes agreed by seller/buyer. Some processors give farmers have the posibility to choose from a set of price formulas offered by the processor.
About 40% of the milk collection
in the hands of cooperatives.
Relationship governed by
cooperative board.
Prod
ucer
s'
asso
ciat
ion
Coop
erat
ive
Priv
ate
1-3 years
contracts
1- 3 year contracts
(despite minimum
length is 6 month).
There are also
cases of evergreen
contracts.
IMPORTS
Imports of dairy
products (with
value added).
28
3.3 Italy
3.43 The provisions of the Milk Package were implemented in Italy by the Ministry of Agricultural, Food and Forestry Policies (MIPAAF) through the Ministerial Decree (M.D.) N. 15164 on the 12 October 2012. This Decree regulated the organisations of producers, their associations and inter-branch organisations; the negotiation of contracts for raw milk delivery; and the regulation of the PDO and PGI cheese supply. 3.44 The aforementioned Decree established a criteria for the recognition of POs, requiring a minimum quantity of marketable production. This meant the POs must demonstrate they have a mandate from each member, lasting three years, for not less than 75% of the arithmetic mean of the quantities of milk delivered in the last two years by the single producer.It was also established that producer of milk could only join one PO. 3.45 For IBO in the milk and milk products sector to obtain recognition, in case of organisations at national level they must prove they account for 25% or more of the of the economic activities of the sector. For organisations operating in a single economic area, the threshold is 51% with respect to the area and 15% at national level. Currently, there is not an IBO for the dairy sector in Italy. Offer contract and duration 3.46 The Italian law on contracts governs the marketing of raw milk between producers and processors at the national level. The development of this national legal context was the result of negotiation/consultation between the Italian Government and the main institutional representatives of processors (ASSOLATTE) and producers (CONFAGRICOLTURA, COLDERETTI, CIA).
Key points
• The structure of the Italian dairy sector is unique in the sense that a sizable proportion of the domestic milk production is dedicated to DPO cheeses, which provides regional differentiation of the milk.
• The introduction of contracts did not affect the performance of the sector because they were already using similar contract.
• Producer organisations negotiate the contract conditions on behalf of farmers, and market the milk to multiple buyers. Farmers receive a weighted average price obtained from all sales (the PO negotiates with and sells to several processors).
• Producer organisations play an important role not only on the negotiation but also on the milk logistics (e.g., some cheeses can only be produced by milk from a specific region.
29
3.47 With regard to the negotiation of contracts for the delivery of raw milk, recognised POs (or APOs) are entitled to negotiate and underwrite supply agreements on behalf of their members for all or part of the milk conferred.2 3.48 Contracts for supply of raw milk with the first buyers in Italy must comply with all the elements required by the Milk Package (e.g., price to be paid on delivery, delivery volume and calendar, duration of the contract, resolution clauses). The minimum duration of contracts in Italy was extended in 2015 to one year. 3.49 With regard to PDO and PGI production, the Milk Package provides that, upon request of Producer Organisations, Interbranch Organisations or Consortia of protection, the State may establish binding rules for a limited period of time regulation of the supply of cheese benefiting from a designation of origin protected or a protected geographical indication. The possibility of establishing these rules presupposes the existence of an "agreement concluded between at least two thirds of the producers of milk or their representatives representing at least two thirds of raw milk used for the production of cheese and, where appropriate, at least two thirds of producers of such cheese which represents at least two thirds of the production of this cheese in the geographical area". Volume delivered 3.50 Based on information from the interviewed PO, it was indicated that members must provide an estimate of their production volumes. This is because the PO operates as a pooling agent, finding markets for members’ milk Producers can exceed the volumes by 3% to 5%. 3.51 In terms of exclusivity, from the interviews it was pointed out that there are no specific clauses on the contracts saying that producers cannot sell to other processors; however, it was indicated that in practice this is not common practice. This is partly a function of the high volumes of milk going through POs or APOs and into PDO/PGI cheeses. Pricing 3.52 As pricing within contracts covers a period of a year fixed price options are not common. Based on information from the interviewed PO, both fixed and index linked pricing are used. The most commonly used pricing system is
2 The volumes of raw milk under negotiation cannot exceed the thresholds set out at Community level and, in particular that: i) the volume of raw milk subject to bargaining does not exceed 3.5% of production total of the Union; ii) the volume of raw milk subject to bargaining produced and delivered to a particular Member State does not exceed 33% of national production total of the Member State itself.
30
to use an initial base price which varies through the year according to an index. The index is linked to market prices, with companies seting their own mechanism or indexes. Commonly used mechanisms are average German prices, the price for Parmigiano Reggiano (most common DPO cheese) or a combination of market indexes. 3.53 The contract with pricing based on indexes is more common for DPO products and fixed prices are more common for generic products which are then sold to retailers or merchants. The use of fixed pricing for the raw materials gives processors and merchant firmer grounds for negotiating with retailers and for achieving a price which provides them with a margin (e.g., often used for fresh milk/ soft cheeses). 3.54 White cheese (i.e., the balancing product for milk surplus) is mainly sold as a commodity product to wholesalers who package and re-sell it. These sales are often priced based on spot market prices (as they do not require regionally sourced milk) The spot prices are published weekly at a regional level by the Chamber of Commerce. The Chamber of Commerce sets prices through agreement of supply chain participants who submit, then agree, the price. There are sub-commissions for liquid milk, butter and non-DPO cheese. 3.55 Farmers are paid 30 days in arrears, at the end of each month. The price paid to the farmer is an average price (adjusted forbutterfat, protein and hygiene characteristics) achieved from all sales, weighted by volumes with a deduction of transport costs and administrative fee. Dispute resolution 3.56 The role of the Government as mediator has been relatively poor. 2 or 3 years ago they set a meeting to solve issues between producers and processors but without success. There is no really mediation. However, the Government (i.e., Ministry of agriculture) asks producers about every two month whether they are happy with the contracts. 3.57 Information from the interviewed PO indicated that conflict resolution is written into the contract and there is no official body that checks the contracts – it is left to the industry. In addition, it was mentioned that there are in general good relationships between the parties. 3.58 Although there are no special mechanism for mediation between the producers and processors in case of conflicts, in case of abuse of power it is the Italian Competition Authority (i.e., Autorità Garante della Concorrenza e del Mercato AGCM) that intervenes. An example of this happened when the main agricultural unions (e.g., Coldiretti) sent AGCM a report complaining of poor correlation between the consumer price of dairy products, the processing prices and the producers’ price for raw milk. AGCM launched an investigation
31
on 5 May 2015 consisting of a fact-finding survey on the dairy sector which closed on the 2 March 2016. 3.59 The AGCM analysed the sector, taking into account both the legislation that prohibits anti-competitive agreements and abuses of a dominant position, i.e., Article 62 of Decree Law no. 1/2012, bearing the "Discipline of commercial relations regarding the sale of agricultural and agri-food products", an as amended by Decree Law no. 51/2015. Market transparency – information disclosure 3.60 It was considered by all the interviewees that contracts increased market transparency. Contracts remain confidential and the Processors’ Association do not participate in negotiations. 3.61 The consulting firm CLAL provides significant amount of information about the dairy sector in Italy and Europe. However, the specific indicators used for setting price within individual contracts are confidential to the parties to the contract. Processors and retailer relationships 3.62 Processors sell primarily into retail channels; food service and exports account for a smaller share of sales. Retailers buy on medium to long term contracts (generally 12 months) which provide more security and stability to manufacturers. Nevertheless, retailers have substantive influence on prices paid to processors. Process of introducing the mandatory written contracts 3.63 In the interviews it was stated that the introduction of mandatory contracts did not have an important impact on the sector due to the fact that they were already using contracts. The contracts were, however, shorter in terms of duration. Prospects 3.64 A study carried out by AGCM (2016) on the dairy sector found that none of the sectors of the supply chain appear to be able to generate and permanently extract excessive profits to the detriment of milk producers. On the contrary, a high degree of competitiveness was found within retail markets. 3.65 AGCM then highlighted that in these markets, significant price pressure is exerted both by the strong countervailing power of the large-scale retail
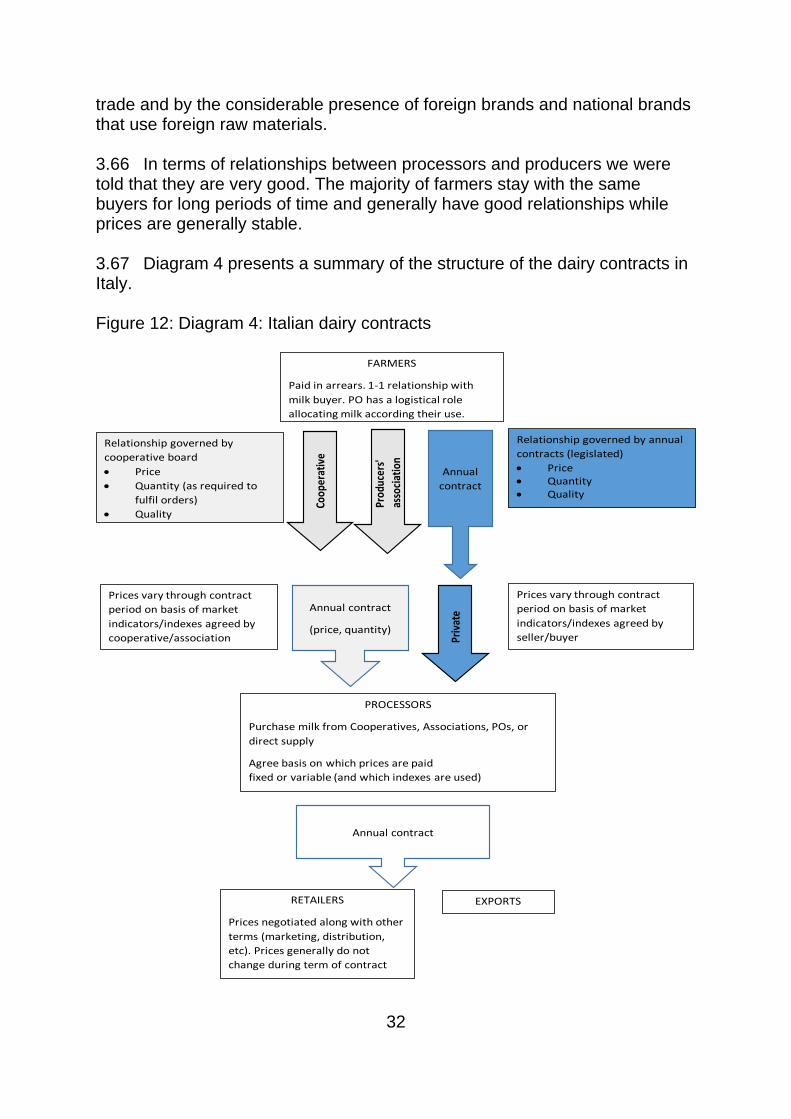
32
trade and by the considerable presence of foreign brands and national brands that use foreign raw materials. 3.66 In terms of relationships between processors and producers we were told that they are very good. The majority of farmers stay with the same buyers for long periods of time and generally have good relationships while prices are generally stable. 3.67 Diagram 4 presents a summary of the structure of the dairy contracts in Italy. Figure 12: Diagram 4: Italian dairy contracts
Annual contract
RETAILERS
Prices negotiated along with other
terms (marketing, distribution,
etc). Prices generally do not
change during term of contract
EXPORTS
FARMERS
Paid in arrears. 1-1 relationship with
milk buyer. PO has a logistical role
allocating milk according their use.
Relationship governed by annual
contracts (legislated)
• Price• Quantity • Quality
PROCESSORS
Purchase milk from Cooperatives, Associations, POs, or
direct supply
Agree basis on which prices are paid
fixed or variable (and which indexes are used)
Prices vary through contract
period on basis of market
indicators/indexes agreed by
seller/buyer
Relationship governed by
cooperative board
• Price
• Quantity (as required to
fulfil orders)
• Quality
Prod
ucer
s'
asso
ciat
ion
Coop
erat
ive
Prices vary through contract
period on basis of market
indicators/indexes agreed by
cooperative/association Priv
ate
Annual
contract
Annual contract
(price, quantity)
33
3.4 Poland
3.68 The Polish Government considers agriculture to be one of the pillars of the country's economy, a source of jobs and wealth creation for rural areas. The country uses all the levers at its disposal (Stachowiak, 2014):
• Almost 25% of the aid of the 2nd pillar has been transferred to the first pillar to support ' active ' agriculture;
• 15% of direct payments are coupled aid, in particular towards livestock farming;
• Redistributive payments for the first 30 hectares (about €41/ha) and support for young farmers.
3.69 Compulsory contracts were introduced in Poland in October 2015. However, as stated by Trouvé et al. (2016) dairy contracts existed in Poland before the Milk Package reforms and were used by the Polish Government as a relatively effective way of protecting farmers from fluctuations in the price of milk and ensuring quantity and quality of milk deliveries to dairies. 3.70 Despite the introduction of contracts in 2015 the Polish Minister of Agriculture was very critical regarding the measures of the Milk Package. He stated that the measures were not adapted to the Polish dairy sector, where the cooperatives dominate. 3.71 Due to the aforementioned reasons the application of the Milk Package in Poland was made at a minimum level due to the opinion that Polish farmers would be very little motivated to join a PO due to the fact that they were not use to have freedom of choice and the predominance of cooperatives in the Milk collection.
Key points
• About 70% of the milk handled in Poland is done by cooperatives. Therefore, contracts only operate for the other 30%.
• The introduction of the contracts did not have a big effect on the industry because as in other countries they were already operating under contracts.
• In contrast with other countries, there is no minimum length of a contract. The contracts conditions are market determined.
• The structure of the contracts in Poland follow the CMO and they need to specify the price, quantity, quality, length, payment terms, force majeure, conditions for acceptance and delivery.
• The Agricultural Market Agency is in charge of verifying whether (1) the delivery of agricultural products is carried out based on a contract concluded in written, electronic or paper form; and (2) the contract fulfils the requirements specified by law.

34
Offer contract and duration 3.72 The contracts apply to all the stages and to all the buyers from the producers. In the case of milk only raw milk is covered by the contracts. The contracts apply to all the forms i.e., written and electronic. If an email has all the elements of a contract, it is a contract. Contracts in Poland do not have a minimum length. The contracts conditions are market determined. There is no minimum length of a contract. Contracts need to specify the price, quantity, quality, length, payment terms, force majeure, conditions for acceptance and delivery. 3.73 Each contracting party has the right to terminate the contract with a six-month notice period. However, the processor has the right to terminate the contract with immediate effect if the milk does not meet the quality conditions. 3.74 As regards milk testing the content of fat and protein are done at random, milk temperature as well as the total number of microorganisms, number of somatic cells, antibiotics / inhibitory substances, organoleptic assessment are done at each collection. Volume delivered 3.75 Volume to be delivered is included on the contracts. The quantity is collected by processors. There is no obligation to sell all the milk to the processor (no exclusivity). Dairy cooperatives collect all the milk from their producers. 3.76 The contracts do not carry an exclusivity clause, but are, de facto, exclusive within the term of the contract. If it is disclosed that the producer gives the contracted milk to another purchaser during the term of the contract, the processor has the right to dissolve the contract from the date of disclosure of that fact. In addition, the producer for the contracting entity must pay a contractual penalty of 3 months gross value for milk delivered to the contracting producer calculated as an average over the last 6 months. Pricing 3.77 The interviewes did not provide much information about how pricing is set up in the case of private processors except that it is market determined and they consider factors such as fat, protein and bacteria content. In addition, it includes additional payments for quality and deductions if the delivery of milk is lower than 200 litres. 3.78 In the case of cooperatives, the price of milk is set for each month by the Management Board of the cooperative, depending on the quality of milk delivered and the financial capacity of the cooperative. In addition, it also
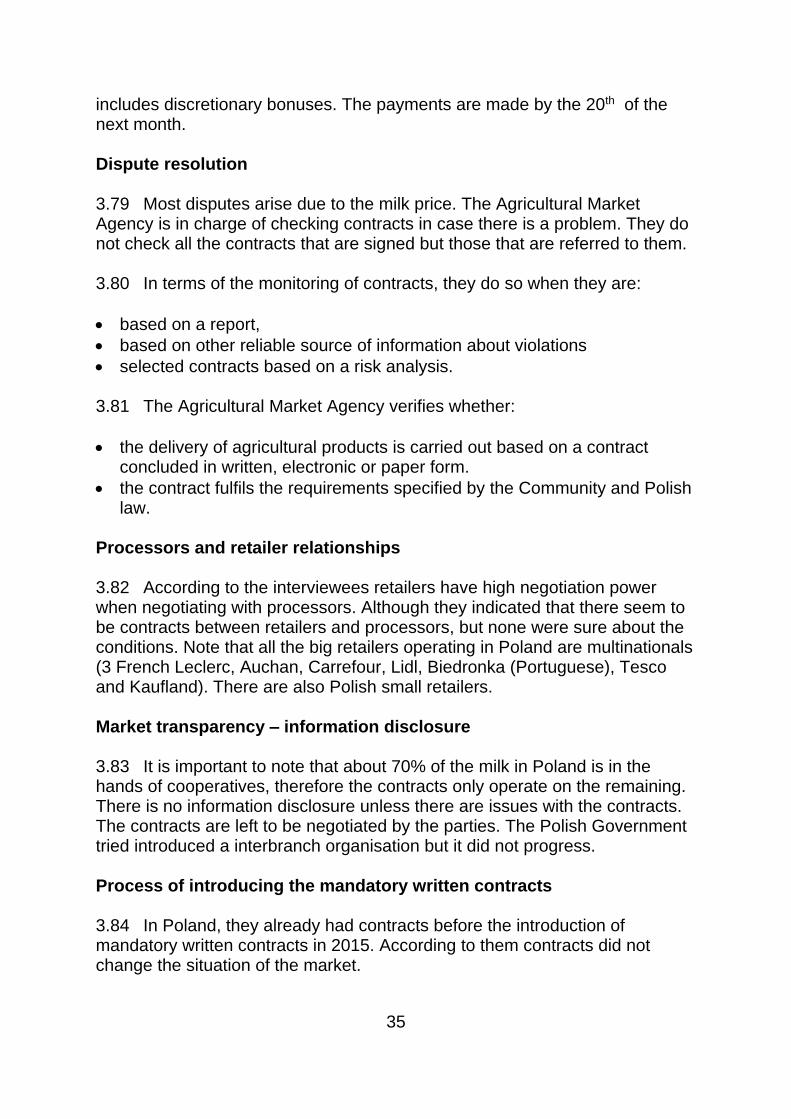
35
includes discretionary bonuses. The payments are made by the 20th of the next month. Dispute resolution 3.79 Most disputes arise due to the milk price. The Agricultural Market Agency is in charge of checking contracts in case there is a problem. They do not check all the contracts that are signed but those that are referred to them. 3.80 In terms of the monitoring of contracts, they do so when they are:
• based on a report,
• based on other reliable source of information about violations
• selected contracts based on a risk analysis. 3.81 The Agricultural Market Agency verifies whether:
• the delivery of agricultural products is carried out based on a contract concluded in written, electronic or paper form.
• the contract fulfils the requirements specified by the Community and Polish law.
Processors and retailer relationships 3.82 According to the interviewees retailers have high negotiation power when negotiating with processors. Although they indicated that there seem to be contracts between retailers and processors, but none were sure about the conditions. Note that all the big retailers operating in Poland are multinationals (3 French Leclerc, Auchan, Carrefour, Lidl, Biedronka (Portuguese), Tesco and Kaufland). There are also Polish small retailers. Market transparency – information disclosure 3.83 It is important to note that about 70% of the milk in Poland is in the hands of cooperatives, therefore the contracts only operate on the remaining. There is no information disclosure unless there are issues with the contracts. The contracts are left to be negotiated by the parties. The Polish Government tried introduced a interbranch organisation but it did not progress. Process of introducing the mandatory written contracts 3.84 In Poland, they already had contracts before the introduction of mandatory written contracts in 2015. According to them contracts did not change the situation of the market.
36
Prospects 3.85 None of the interviewed institutions indicated potential problems with the contracts. This may be due to the fact that contracts were already in operation before the Milk Package. 3.86 Diagram 5 presents a summary of the structure of the dairy contracts in Poland. Figure 13: Diagram 5: Polish dairy contracts
Annual contract
RETAILERS
Big retailers are multinationals.
Prices negotiated along with other
terms. There seems to be stability
on the relationship with
processors. Prices generally do not
change during term of contract.
FARMERS
1-1 relationship with milk buyers.
There is no exclusivity clauses.
Contracts do not have a
minimum length. However the
contracts need to contain:
• Price• Quantity • Quality• Length, • Payment terms, • force majeure, • conditions for acceptance
and delivery
PROCESSORS
Purchase milk from farmers directly. There is a surplus of
milk. However, processors go around the country
collecting milk.
Prices are set by processors.
Given the lack of minimum
length of contract, the price
varies by case. There is a fee if
milk is not delivered or out of
the 10% band.
70% of the milk is processed by
cooperatives. They are not
forced to use mandatory written
contracts. They export
unbranded products. Farm
ers
Coop
erat
ive
Prices set by the cooperative
board.
Priv
ate
Contracts
Contracts are left
to the market. The
only intervention is
if the contracts are
incomplete.
37
3.5 Romania
3.87 Before the implementation of the Milk Package in 2014, milk was marketed under verbal agreements that in most of the cases were very informal, and frequently triggered complaints from the producers. It mainly referred to changes to the price previously agreed. This circumstance along with the fact of a decreasing producing sector, stimulated since 2010 an increasing dialogue between processors and the government to attend to producers’ demands as to more stable and clear negotiated condition. Thereby, the Romanian implementation of the Milk Package included the imposition of mandatory written contracts (MWCs) for the marketing of raw milk. 3.88 In addition, it is important to note that the Romanian dairy sector possesses a singular structure. Of a total production of 4.5 million metric tonnes only a bit less that 1 million tonnes are sent to dairy processing plants. The rest of the milk is either self-processed by producers and distributed through direct selling to consumers or self-consumed in farm. There is also in Romania a black market of milk that moves yearly around 800,000 tonnes of milk. The introduction of MWCs was used as an opportunity to reduce this black market. Using EU funds, a subsidy per declared tonne of milk was offered to producers, obtaining as a result a 50% increase in the amount of milk declared. Offer contract and duration 3.89 The regulation is applied to the relationships between producers and first buyers of milk. It was agreed the minimum content that any milk contract should cover, namely: price (variable prices, fluctuating with the market, price fixed and not negotiated), duration, (minimum 6 months), quantity, quality (minimum standards and bonuses and penalisations), and payment methods.
Key points
• The Romanian dairy sector possesses a singular structure with only about a quarter of the milk production being sent to dairy processing plants.
• The regulation is applied to the relationships between producers and first buyers of milk.
• It was agreed the minimum content that any milk contract should cover is: price (variable prices, fluctuating with the market, price fixed and not negotiated), duration, (minimum 6 months), quantity, quality (minimum standards and bonuses and penalisations), and payment methods
• POs and IBO failed in being established and given the disparities in negotiation power, it is not clear how conflicts are resolved.
38
Volume delivered 3.90 Expected volumes are included in the contracts; however, the interviewees did not not know the details. Note that given the aforementioned structure of the sector, processors do not face with the need of a balancing product (i.e., they are in deficit). Pricing 3.91 The common practice to establish the price currently in Romania, is to review the price for each natural production season (autumn and spring). That is reviewing the price or renegotiating the price twice a year irrespective of the duration of the contract (there are cases of 12 and even 24 months contracts). The Romanian average price roughly follows the EU price trend with a delay of two months, being situated a below the average EU price. Dispute resolution 3.92 There is no mediation between farmers and processors. In practice, given the differences in scale between producers and processors if something happen it is not clear how the clauses of the contracts are enforced. Producers organisations and Interbranch organisation 3.93 As regards producer organisations two were set up in Romania after the implementation of the Milk Package. However, they were not successful in terms of joint negotiation with processors and both evolved into co-ops. 3.94 The Romanian administration made several unsuccessful attempts to set up an interbranch organisation. They counted with the support of the APRIL, the processors’ association. The main issue is that producers organisation misunderstood the role of the IBO as one of setting prices. Market transparency – information disclosure 3.95 It was indicated in the interviews that the Romanian government has access to significant amount of information on the dairy market. There exists a register of first buyers of milk. Quantities sourced, prices, milk constituents (fat, protein), and supplier have to be reported. However, it was mentioned that there is not an efficient utilisation of these data to inform the functioning of the market.
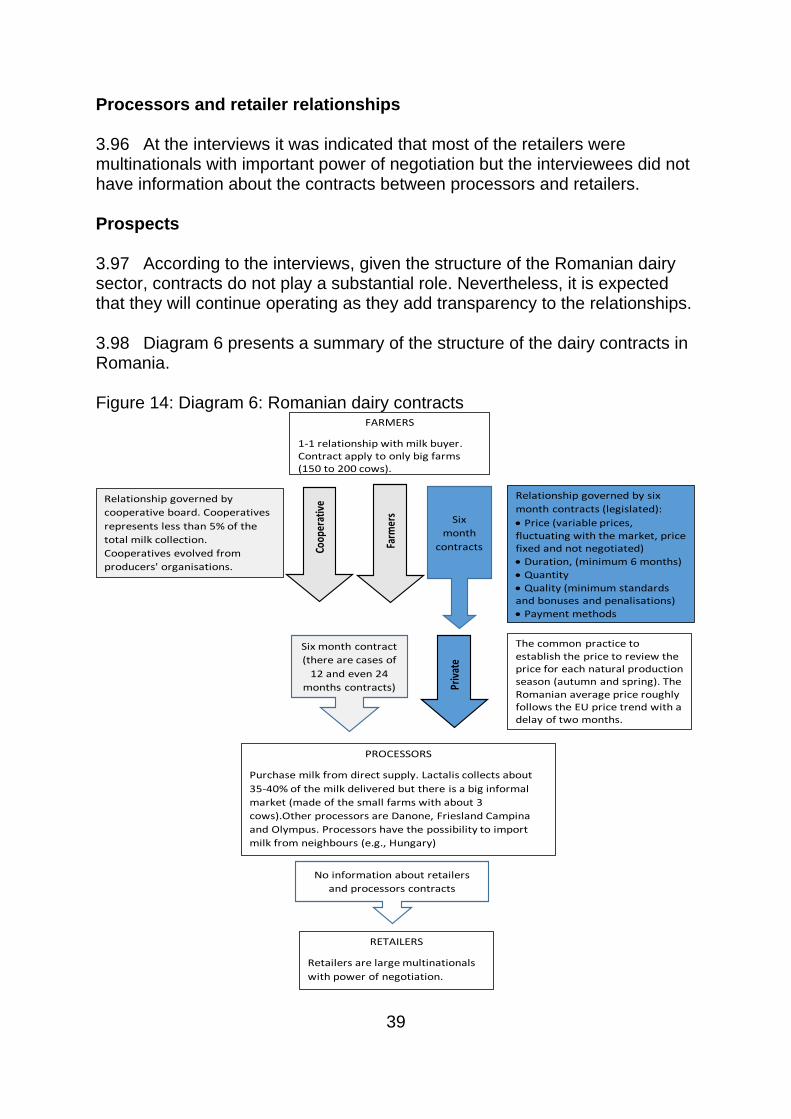
39
Processors and retailer relationships 3.96 At the interviews it was indicated that most of the retailers were multinationals with important power of negotiation but the interviewees did not have information about the contracts between processors and retailers. Prospects 3.97 According to the interviews, given the structure of the Romanian dairy sector, contracts do not play a substantial role. Nevertheless, it is expected that they will continue operating as they add transparency to the relationships. 3.98 Diagram 6 presents a summary of the structure of the dairy contracts in Romania. Figure 14: Diagram 6: Romanian dairy contracts
No information about retailers
and processors contracts
RETAILERS
Retailers are large multinationals
with power of negotiation.
FARMERS
1-1 relationship with milk buyer. Contract apply to only big farms (150 to 200 cows).
Relationship governed by six
month contracts (legislated):
• Price (variable prices, fluctuating with the market, price fixed and not negotiated)
• Duration, (minimum 6 months)
• Quantity
• Quality (minimum standards and bonuses and penalisations)
• Payment methods
PROCESSORS
Purchase milk from direct supply. Lactalis collects about
35-40% of the milk delivered but there is a big informal
market (made of the small farms with about 3
cows).Other processors are Danone, Friesland Campina
and Olympus. Processors have the possibility to import
milk from neighbours (e.g., Hungary)
The common practice to establish the price to review the price for each natural production season (autumn and spring). The Romanian average price roughly follows the EU price trend with a delay of two months.
Relationship governed by
cooperative board. Cooperatives
represents less than 5% of the
total milk collection.
Cooperatives evolved from
producers' organisations.
Farm
ers
Coop
erat
ive
Priv
ate
Six
month
contracts
Six month contract
(there are cases of
12 and even 24
months contracts)
40
3.6 Spain
3.99 The Milk Package was implemented into the Spanish legislation in 2013 (Ley 12/2013, and RD 1363/2013). It made mandatory the use of written contracts between producers and first purchasers for the marketing of raw milk. As part of this process, the Spanish inter-branch organisation (Organización Interprofesional Láctea – INLAC) was designed to play the role of coordinating the process of implementating the mandatory contracts. The main features of the Spanish legislation on mandatory contracts are as follows (Gobierno de España, 2015): Offer contract and duration 3.100 The milk purchaser must make a written offer to the producer at least two months before the beginning of milk delivering. The offer must include all the elements of the contract with a minimum duration of 12 months, although the producer could ask for a shorter duration. This offer is meant to serve as a base for further negotiation of contract terms. The negotiation should be freely negotiated between the parts in the contract.
Key points
• All sales of milk in Spain must be covered by a contract which specifies the milk price, volumes and term of the contract. Volumes must also be specified in the contract as well as delivery tolerances to be specified in the contract.
• The price in the contracts can be either fixed, variable or a mixture of fixed and variable, but they are set for the duration of the contract. In the case of a variable price, the reference used to adjust prices must be specified in the contract and be verifiable from published data. Contracts offered by the largest processors are dominated by fixed price offers (around 70%).
• Contracts must be offered to farmers for a minimum duration of 12 months. However, farmers can refuse the initial offer and agree a different length.
• Variations to contracts within the contract term can be negotiated between parties but must be agreed in writing and notified to the Government Department responsible for monitoring the regulation.
• Milk buyers retain discretion over the price level, as this is set at the beginning of the contract.
• While initially met with resistance by milk buyers, both farmers and processors feel they have improved the situation in terms of improving price stability and transparency.
41
3.101 Any contract may be agreed as renewable (i.e., rolling contracts or evergreen contracts) for similar length periods with a resignation period of two months. Whether the purchaser wanted to change the terms of the rolling contract, the new conditions should be sent in written to the producer at least two months before the end of the contract. Pricing 3.102 The Spanish regulation establishes that the price agreed in the contract may be determined as either a fixed price, a variable price, that should be established through a price mechanism specified in the contract or a mixed one (part fixed and part variable). 3.103 INLAC commissioned the University of Santiago de Compostela (USC) a thorough analysis of the Spanish dairy market in order to move forward the implementation process of the Milk Package. 3.104 The USC experts concluded that the best way to protect supply chain stakeholders against market price volatility was the inclusion of non-linear price mechanisms within the contracts to establish the raw mil price. Classical economic theory assumes a linear relationship between changes in prices and quantities produced under the assumptions of perfect information and an efficient market structure that naturally tends to equilibrium between supply and demand. However, the Spanish raw milk market may behave quite differently and the reactions of the economic agents market signals may be not as efficient as predicted by the economic theory. 3.105 Several factors may explain the efficiency problems in Spanish milk market: (1) operational difficulties to adapt production on the short term, what normally results in a lagged response, (2) high production investments entails high fixed costs, this may prompt opposite effects in front of a decrease of milk prices, triggering an increase in production as long as these are higher than the variable costs (Santiso Blanco, et al., 2014). In this context, the inclusion of benchmarking or referencing mechanisms was expected to enable enough flexibility for market changes whilst providing producers and processors with enough certainty about the price. The USC designed up to six dairy cow milk indexes and they are permanently updated and freely accessible to the industry through the INLAC website (INLAC, 2019). 3.106 Even though competition law prevents INLAC from recommending that this should be the preferred option to apply, its support and following up of its implementation seems to suggest that it is the preferable option to them. This agreed price or price mechanism cannot be modified unilaterally during the length of the contract (no purchaser discretion). Only if both parts agreed to change it, they must finalise first through a written agreement the current
42
contract and then to establish the new price or price mechanism in a new contract with a new duration. Dispute resolution 3.107 Given the commercial sensitivity of contracts’ content, INLAC has been entrusted with supervisory duties over the matter. Thereby, all the contracts signed between producers and first purchasers of raw milk must be sent to INLAC, remaining in custody for at least two years. This access to the contracts enables INLAC to act as a mediator in case of disputes arisen from misinterpretation or breach of contract terms. If an agreement could not be achieved through this amicable procedure, the parts must determine in the contract if they prefer to refer the dispute to either the ordinary court system, or the Spanish Arbitration Court. In this last case the dispute will be solved in a single procedure. Exclusivity 3.108 Each producer may subscribe as many contracts with as many purchasers of milk, as long as he/she only has a single contract with each of them to regulate their commercial relationships. Market transparency – information disclosure 3.109 First purchasers of raw milk are enforced by law to monthly feed an electronic database with the milk volume that they have received from each producer. The total amount paid to each producer, including premiums and penalisations must also be declared. 3.110 A weighted average price is obtained by dividing the total amount paid between the litres delivered and published every month by Spanish region. This database is freely accessible (Gobierno de España, 2019). Views about the contracts in Spain 3.111 As regards the functioning of contracts (Santiso, et al., 2018) provided the following opinions from stakeholders: 3.112 From the processors’ perspective - There exists an imbalance between a 12-month contract between producers and processors and shorter contracts that currently occur between processor and retailers, similar to the situation in the UK. The processors have stated that they face difficulty in setting long term prices within contracts without compromissing the flexibility required to remain competitive in the market. As a result, prices offered over a 12-month term are often viewed to be too low, and farmers prefer shorter term contract which offer higher prices.
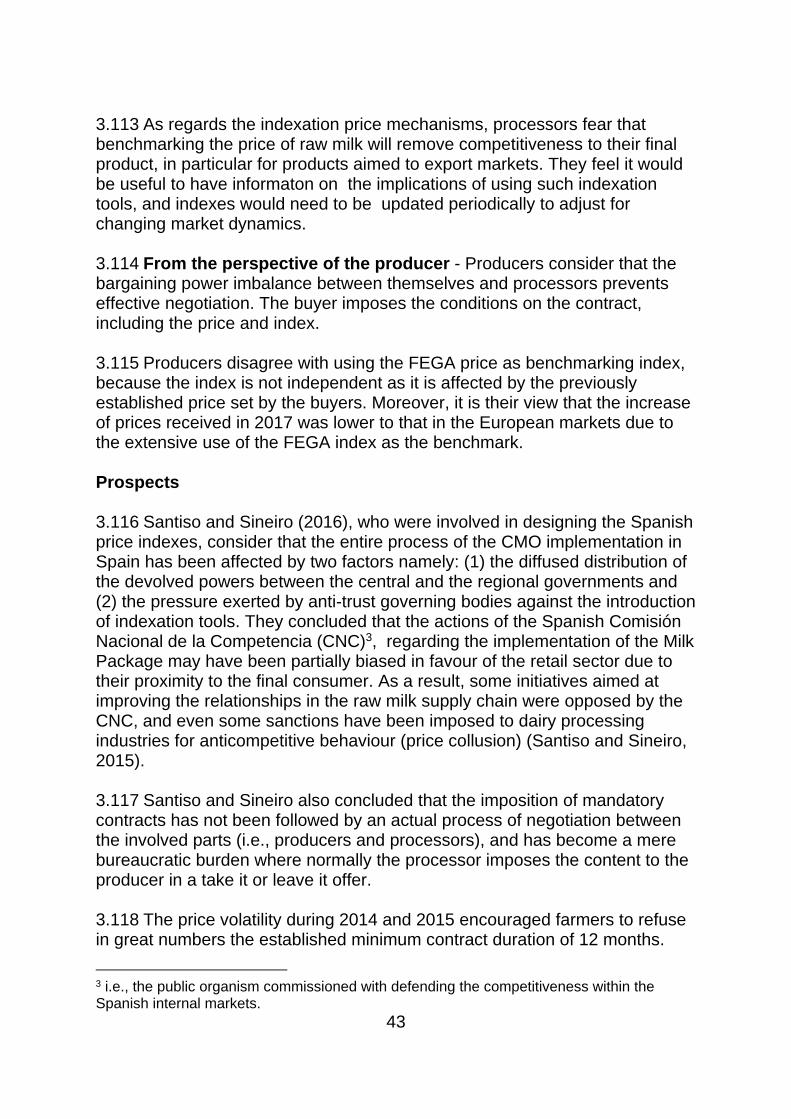
43
3.113 As regards the indexation price mechanisms, processors fear that benchmarking the price of raw milk will remove competitiveness to their final product, in particular for products aimed to export markets. They feel it would be useful to have informaton on the implications of using such indexation tools, and indexes would need to be updated periodically to adjust for changing market dynamics. 3.114 From the perspective of the producer - Producers consider that the bargaining power imbalance between themselves and processors prevents effective negotiation. The buyer imposes the conditions on the contract, including the price and index. 3.115 Producers disagree with using the FEGA price as benchmarking index, because the index is not independent as it is affected by the previously established price set by the buyers. Moreover, it is their view that the increase of prices received in 2017 was lower to that in the European markets due to the extensive use of the FEGA index as the benchmark. Prospects 3.116 Santiso and Sineiro (2016), who were involved in designing the Spanish price indexes, consider that the entire process of the CMO implementation in Spain has been affected by two factors namely: (1) the diffused distribution of the devolved powers between the central and the regional governments and (2) the pressure exerted by anti-trust governing bodies against the introduction of indexation tools. They concluded that the actions of the Spanish Comisión Nacional de la Competencia (CNC)3, regarding the implementation of the Milk Package may have been partially biased in favour of the retail sector due to their proximity to the final consumer. As a result, some initiatives aimed at improving the relationships in the raw milk supply chain were opposed by the CNC, and even some sanctions have been imposed to dairy processing industries for anticompetitive behaviour (price collusion) (Santiso and Sineiro, 2015). 3.117 Santiso and Sineiro also concluded that the imposition of mandatory contracts has not been followed by an actual process of negotiation between the involved parts (i.e., producers and processors), and has become a mere bureaucratic burden where normally the processor imposes the content to the producer in a take it or leave it offer. 3.118 The price volatility during 2014 and 2015 encouraged farmers to refuse in great numbers the established minimum contract duration of 12 months.
3 i.e., the public organism commissioned with defending the competitiveness within the Spanish internal markets.
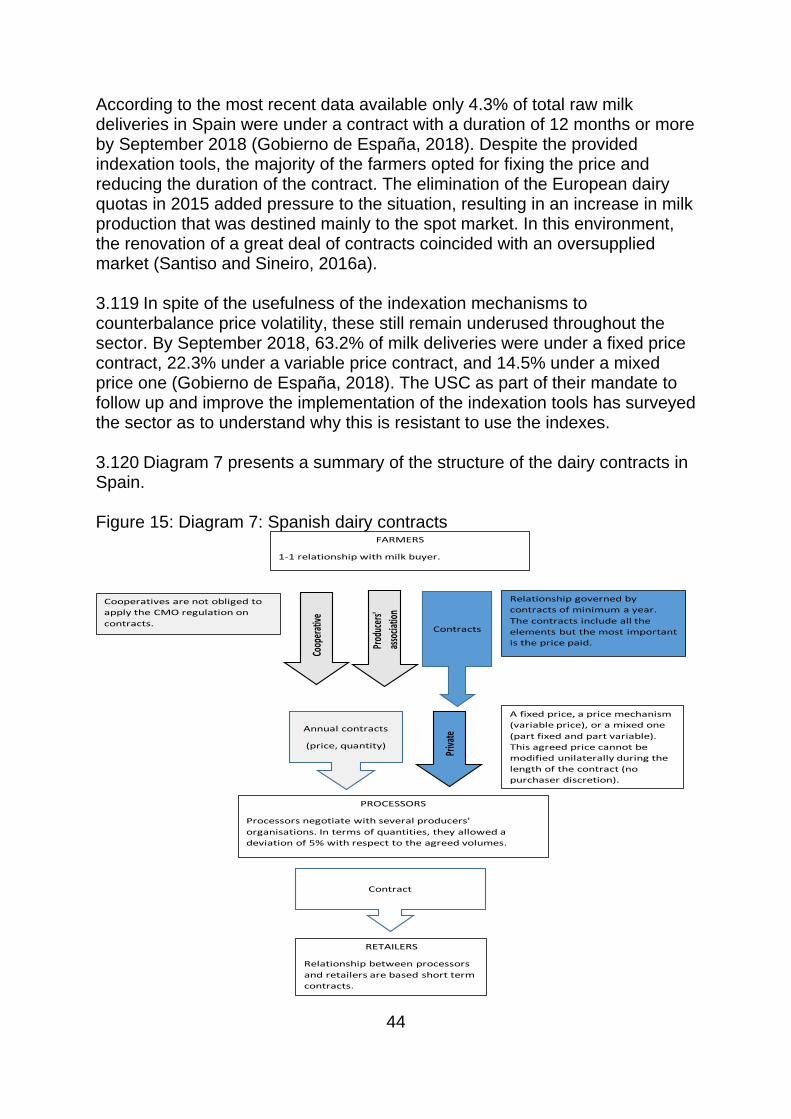
44
According to the most recent data available only 4.3% of total raw milk deliveries in Spain were under a contract with a duration of 12 months or more by September 2018 (Gobierno de España, 2018). Despite the provided indexation tools, the majority of the farmers opted for fixing the price and reducing the duration of the contract. The elimination of the European dairy quotas in 2015 added pressure to the situation, resulting in an increase in milk production that was destined mainly to the spot market. In this environment, the renovation of a great deal of contracts coincided with an oversupplied market (Santiso and Sineiro, 2016a). 3.119 In spite of the usefulness of the indexation mechanisms to counterbalance price volatility, these still remain underused throughout the sector. By September 2018, 63.2% of milk deliveries were under a fixed price contract, 22.3% under a variable price contract, and 14.5% under a mixed price one (Gobierno de España, 2018). The USC as part of their mandate to follow up and improve the implementation of the indexation tools has surveyed the sector as to understand why this is resistant to use the indexes. 3.120 Diagram 7 presents a summary of the structure of the dairy contracts in Spain. Figure 15: Diagram 7: Spanish dairy contracts
Contract
RETAILERS
Relationship between processors
and retailers are based short term
contracts.
FARMERS
1-1 relationship with milk buyer.
Relationship governed by
contracts of minimum a year.
The contracts include all the
elements but the most important
is the price paid.
PROCESSORS
Processors negotiate with several producers'
organisations. In terms of quantities, they allowed a
deviation of 5% with respect to the agreed volumes.
A fixed price, a price mechanism
(variable price), or a mixed one
(part fixed and part variable).
This agreed price cannot be
modified unilaterally during the
length of the contract (no
purchaser discretion).
Cooperatives are not obliged to
apply the CMO regulation on
contracts.
Prod
ucer
s'
asso
ciatio
n
Coop
erat
ive
Priva
te
Contracts
Annual contracts
(price, quantity)
45
4. Introduction of mandatory contracts
and farm price volatility4
4.1 The purpose of this section is to investigate the impact that the implementation of MWCs under the EU agricultural Common Market Organisation (CMO) regulation had on raw milk price volatility among twelve member states. Table 3 presents the countries implementing the contracts. 4.2 It is important to emphasise that although volatility is frequently mentioned on the discussions of MWCs (e.g., Scottish Government ITT), the purpose of those contracts it is not to reduce volatility but to provide transparency on the relationships between milk producers and their customers. 4.3 Volatility is a directionless measure of the variability of a price over time (Gilbert and Morgan, 2010). Price movements are embedded in the market’s clearing mechanism that enables demand and supply of any product to match. Price changes may reflect improvements in competitive advantages along the supply chain, as they may also disclose changing preferences on consumers that allow for efficient relocation of resources (O'Connor and Keane, 2011). In addition, unexpected large price variations may occur attending to other
4 This section presents a summary of the study. For details, see section 7.3.
Key points
• This analysis investigated the impact of the implementation of mandatory written contracts (MWC) under the EU agricultural Common Market Organisation (CMO) regulation in raw milk price volatility in twelve member states using time series models.
• The results showed evidence that in three of these members states (France, Hungary, and Slovakia) milk price volatility decreased after the internal implementation of MWCs.
• In the rest of the countries under consideration the results found were varied, with raw milk prices’ variance either found to be constant or to vary in a non-significant manner over the period studied. This could be due to a variety of causes such as that written contracts were commonly used before the 2012 Milk Package.
• It should be highlighted that the CMO regulation included not only prescriptions about the introduction of MWC but also other recommendations in order to improve the position of dairy farmers in the supply chain (e.g., implementation of dairy farmers’ PO and IBOs), as to improve producers bargaining position and transparency within the dairy supply chain.
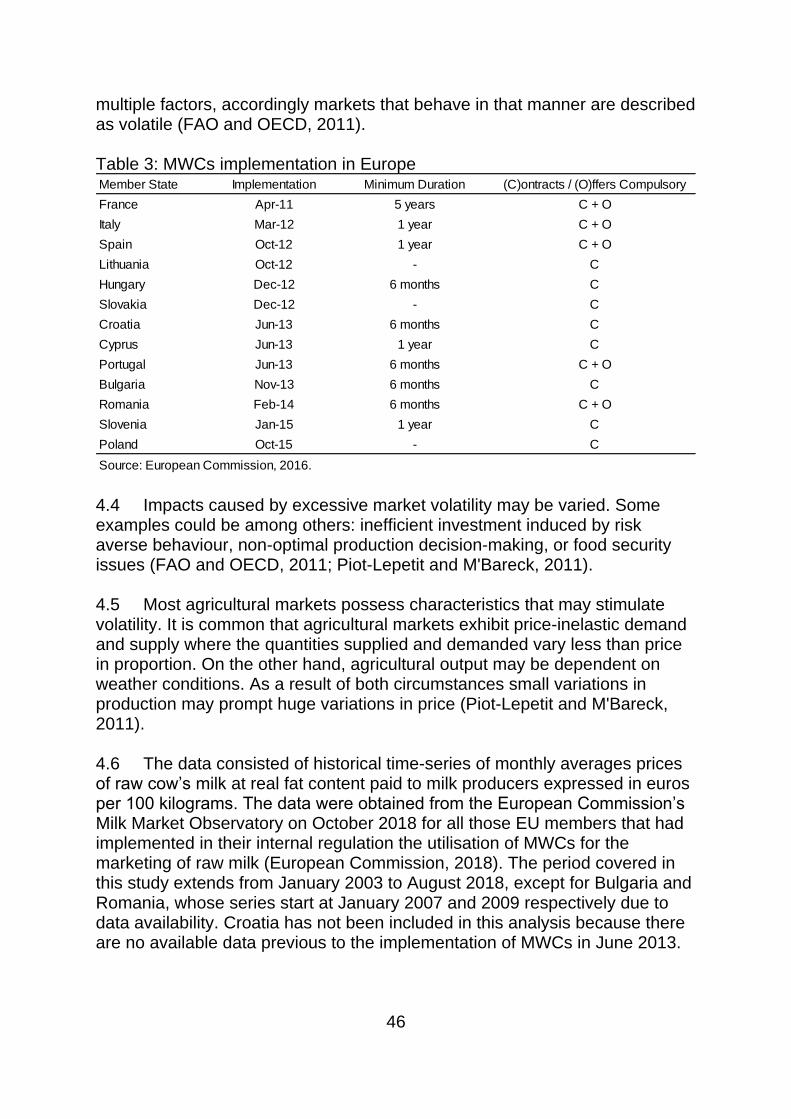
46
multiple factors, accordingly markets that behave in that manner are described as volatile (FAO and OECD, 2011). Table 3: MWCs implementation in Europe
4.4 Impacts caused by excessive market volatility may be varied. Some examples could be among others: inefficient investment induced by risk averse behaviour, non-optimal production decision-making, or food security issues (FAO and OECD, 2011; Piot-Lepetit and M'Bareck, 2011). 4.5 Most agricultural markets possess characteristics that may stimulate volatility. It is common that agricultural markets exhibit price-inelastic demand and supply where the quantities supplied and demanded vary less than price in proportion. On the other hand, agricultural output may be dependent on weather conditions. As a result of both circumstances small variations in production may prompt huge variations in price (Piot-Lepetit and M'Bareck, 2011). 4.6 The data consisted of historical time-series of monthly averages prices of raw cow’s milk at real fat content paid to milk producers expressed in euros per 100 kilograms. The data were obtained from the European Commission’s Milk Market Observatory on October 2018 for all those EU members that had implemented in their internal regulation the utilisation of MWCs for the marketing of raw milk (European Commission, 2018). The period covered in this study extends from January 2003 to August 2018, except for Bulgaria and Romania, whose series start at January 2007 and 2009 respectively due to data availability. Croatia has not been included in this analysis because there are no available data previous to the implementation of MWCs in June 2013.
Member State Implementation Minimum Duration (C)ontracts / (O)ffers Compulsory
France Apr-11 5 years C + O
Italy Mar-12 1 year C + O
Spain Oct-12 1 year C + O
Lithuania Oct-12 - C
Hungary Dec-12 6 months C
Slovakia Dec-12 - C
Croatia Jun-13 6 months C
Cyprus Jun-13 1 year C
Portugal Jun-13 6 months C + O
Bulgaria Nov-13 6 months C
Romania Feb-14 6 months C + O
Slovenia Jan-15 1 year C
Poland Oct-15 - C
Source: European Commission, 2016.
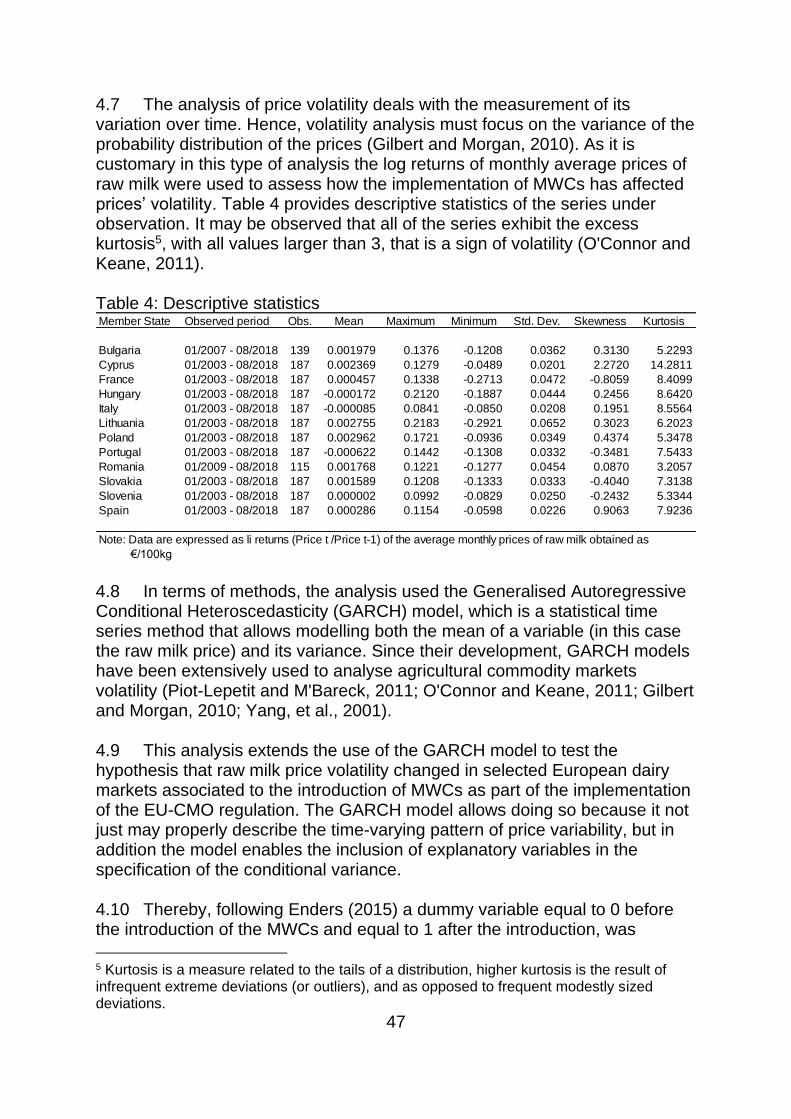
47
4.7 The analysis of price volatility deals with the measurement of its variation over time. Hence, volatility analysis must focus on the variance of the probability distribution of the prices (Gilbert and Morgan, 2010). As it is customary in this type of analysis the log returns of monthly average prices of raw milk were used to assess how the implementation of MWCs has affected prices’ volatility. Table 4 provides descriptive statistics of the series under observation. It may be observed that all of the series exhibit the excess kurtosis5, with all values larger than 3, that is a sign of volatility (O'Connor and Keane, 2011). Table 4: Descriptive statistics
4.8 In terms of methods, the analysis used the Generalised Autoregressive Conditional Heteroscedasticity (GARCH) model, which is a statistical time series method that allows modelling both the mean of a variable (in this case the raw milk price) and its variance. Since their development, GARCH models have been extensively used to analyse agricultural commodity markets volatility (Piot-Lepetit and M'Bareck, 2011; O'Connor and Keane, 2011; Gilbert and Morgan, 2010; Yang, et al., 2001). 4.9 This analysis extends the use of the GARCH model to test the hypothesis that raw milk price volatility changed in selected European dairy markets associated to the introduction of MWCs as part of the implementation of the EU-CMO regulation. The GARCH model allows doing so because it not just may properly describe the time-varying pattern of price variability, but in addition the model enables the inclusion of explanatory variables in the specification of the conditional variance. 4.10 Thereby, following Enders (2015) a dummy variable equal to 0 before the introduction of the MWCs and equal to 1 after the introduction, was
5 Kurtosis is a measure related to the tails of a distribution, higher kurtosis is the result of infrequent extreme deviations (or outliers), and as opposed to frequent modestly sized deviations.
Member State Observed period Obs. Mean Maximum Minimum Std. Dev. Skewness Kurtosis
Bulgaria 01/2007 - 08/2018 139 0.001979 0.1376 -0.1208 0.0362 0.3130 5.2293
Cyprus 01/2003 - 08/2018 187 0.002369 0.1279 -0.0489 0.0201 2.2720 14.2811
France 01/2003 - 08/2018 187 0.000457 0.1338 -0.2713 0.0472 -0.8059 8.4099
Hungary 01/2003 - 08/2018 187 -0.000172 0.2120 -0.1887 0.0444 0.2456 8.6420
Italy 01/2003 - 08/2018 187 -0.000085 0.0841 -0.0850 0.0208 0.1951 8.5564
Lithuania 01/2003 - 08/2018 187 0.002755 0.2183 -0.2921 0.0652 0.3023 6.2023
Poland 01/2003 - 08/2018 187 0.002962 0.1721 -0.0936 0.0349 0.4374 5.3478
Portugal 01/2003 - 08/2018 187 -0.000622 0.1442 -0.1308 0.0332 -0.3481 7.5433
Romania 01/2009 - 08/2018 115 0.001768 0.1221 -0.1277 0.0454 0.0870 3.2057
Slovakia 01/2003 - 08/2018 187 0.001589 0.1208 -0.1333 0.0333 -0.4040 7.3138
Slovenia 01/2003 - 08/2018 187 0.000002 0.0992 -0.0829 0.0250 -0.2432 5.3344
Spain 01/2003 - 08/2018 187 0.000286 0.1154 -0.0598 0.0226 0.9063 7.9236
Note: Data are expressed as li returns (Price t /Price t-1) of the average monthly prices of raw milk obtained as
€/100kg
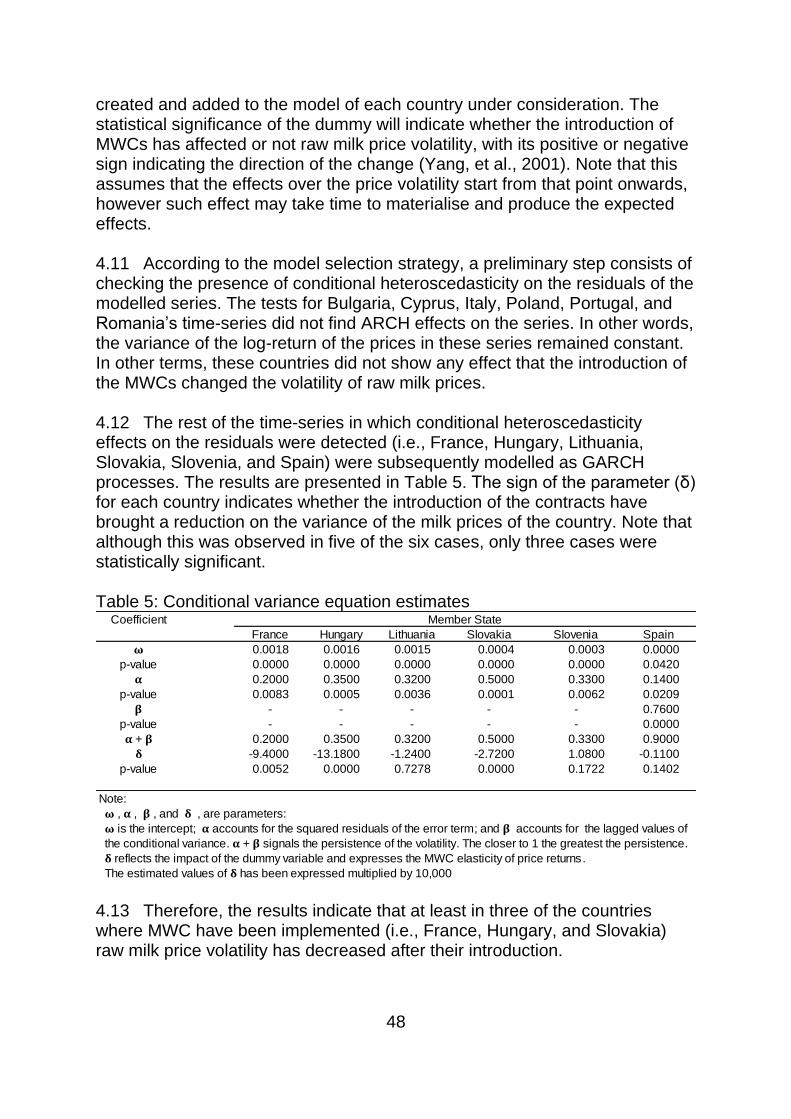
48
created and added to the model of each country under consideration. The statistical significance of the dummy will indicate whether the introduction of MWCs has affected or not raw milk price volatility, with its positive or negative sign indicating the direction of the change (Yang, et al., 2001). Note that this assumes that the effects over the price volatility start from that point onwards, however such effect may take time to materialise and produce the expected effects. 4.11 According to the model selection strategy, a preliminary step consists of checking the presence of conditional heteroscedasticity on the residuals of the modelled series. The tests for Bulgaria, Cyprus, Italy, Poland, Portugal, and Romania’s time-series did not find ARCH effects on the series. In other words, the variance of the log-return of the prices in these series remained constant. In other terms, these countries did not show any effect that the introduction of the MWCs changed the volatility of raw milk prices. 4.12 The rest of the time-series in which conditional heteroscedasticity effects on the residuals were detected (i.e., France, Hungary, Lithuania, Slovakia, Slovenia, and Spain) were subsequently modelled as GARCH processes. The results are presented in Table 5. The sign of the parameter (δ) for each country indicates whether the introduction of the contracts have brought a reduction on the variance of the milk prices of the country. Note that although this was observed in five of the six cases, only three cases were statistically significant. Table 5: Conditional variance equation estimates
4.13 Therefore, the results indicate that at least in three of the countries where MWC have been implemented (i.e., France, Hungary, and Slovakia) raw milk price volatility has decreased after their introduction.
Coefficient Member State
France Hungary Lithuania Slovakia Slovenia Spain
𝛚 0.0018 0.0016 0.0015 0.0004 0.0003 0.0000
p-value 0.0000 0.0000 0.0000 0.0000 0.0000 0.0420
𝛂 0.2000 0.3500 0.3200 0.5000 0.3300 0.1400
p-value 0.0083 0.0005 0.0036 0.0001 0.0062 0.0209
𝛃 - - - - - 0.7600
p-value - - - - - 0.0000
𝛂 + 𝛃 0.2000 0.3500 0.3200 0.5000 0.3300 0.9000
𝛅 -9.4000 -13.1800 -1.2400 -2.7200 1.0800 -0.1100
p-value 0.0052 0.0000 0.7278 0.0000 0.1722 0.1402
Note:
𝛚 , 𝛂 , 𝛃 , and 𝛅 , are parameters:
𝛚 is the intercept; 𝛂 accounts for the squared residuals of the error term; and 𝛃 accounts for the lagged values of
the conditional variance. 𝛂 + 𝛃 signals the persistence of the volatility. The closer to 1 the greatest the persistence.
𝛅 reflects the impact of the dummy variable and expresses the MWC elasticity of price returns.
The estimated values of 𝛅 has been expressed multiplied by 10,000
49
5. Discussion
5.1 This discussion covers two topics: (1) a comparison between the Scottish dairy sector with those of countries where MWCs are in operation and (2) an examination and assessment of how MWCs could be applied in Scotland and their likely impact.
Important points
• The aim of the CMO rules was to improve stability in the EU dairy sector by promoting better contractual relationships and addressing the imbalance of bargaining power between farmers and first purchasers.
• Whilst there are points in common in the dairy sector of each country such as the fact in all the countries retailers are the stakeholders with significant negotiation power; there are substantial differences between all of them. This speaks about the adaptability of the CMO rules behind MWCs to the different business environments.
• None of the studied cases pointed out that MWCs brought problems for their dairy sectors. In at least one case (i.e., France) processors were grateful that the exclusivity clause had been eliminated.
• Establishing MWCs may bring an initial cost for the industry to adapt their current contracts and practices but it may increase the transparency and certainty for dairy farmers.
• It is important to consider the structure of the MWCs together (e.g., volumes, pricing and contract length) instead of analysing each clause and keeping the other aspects unmodified.
• Under the current market structure characterised by processors that are highly vulnerable (due to their products portfolio) and changes in their costs of production, it is not feasible to introduce pricing mechanisms to the contracts and minimum duration without removing the current exclusivity clause from the contracts.
• The elimination of the exclusivity clause worries some processors that it will create them problems to ensure a reliable supply of milk. The observed experiences indicate that processor operate without any problem by asking farmers to state in the contract their expected quarterly or monthly milk supply for the contract period (e.g., a year), also including clauses that allow for deviations from those values and penalties in case of very significant deviations.
• The introduction of POs can be good way not only to improve the bargaining power of farmers but also to organise the milk supply for processors.
5.1 Scottish dairy sector and countries that implemented MWCs
5.2 Table 6 provides a comparison of the structure of the dairy sector in Scotland with those of countries that have implemented MWCs. The purpose of the Table is not to present an exhaustive description of each country’s sector but to highlight major charateristics.
5.3 Whilst there are points in common in the dairy sector of each country such as the fact in all the countries retailers are the stakeholders with substantive negotiation power; there are substantial differences between all of them. This speaks about the flexibility of the CMO rules behind MWCs to adapt to the different business environments.
5.4 Whilst France and Italy and to a less extent Hungary, are characterised by strong processing sectors with branded products that highlight the quality of the product, in Scotland the quality of the products is taken as given (as a standard) and not a source of differentiation (therefore, they do not command a premium). The effect of this is that processors have less negotiation capacity with retailers.
5.5 The above effect is reinforced by the fact that processors sell private label products to retailers. This allows processors to reduce their average costs by expanding their production, which reduces their average overheads/fixed costs (i.e., as mentioned in DairyUK contribution “[p]rocessors require a continuous flow of product, to maximise utilisation of
processing plant”). However, although one should expect that retailers take the lion’s share of the increasing in profits brought by the expansion on the production (and therefore, low marketing margins by processors), there is no information about the negotiations between retailers and processors.
5.6 In categories such as drinking milk and cheese (particularly Cheddar), processors operate in an environment of intense competitive pressure and uncertainty over market returns (DairyUK), which can be exemplified by the importance of private labels on the drinking milk and Cheddar categories. Figures 16 and 17 presents the evolution of the provate label shares on both categories from 2006 to 2017 in Scotland by major retailer.
5.7 As shown in both Figures 16 and 17,the presence of private labels is significant, particularly on drinking milk. Their presence increases the competition within the category and retailers negotiation power.
50
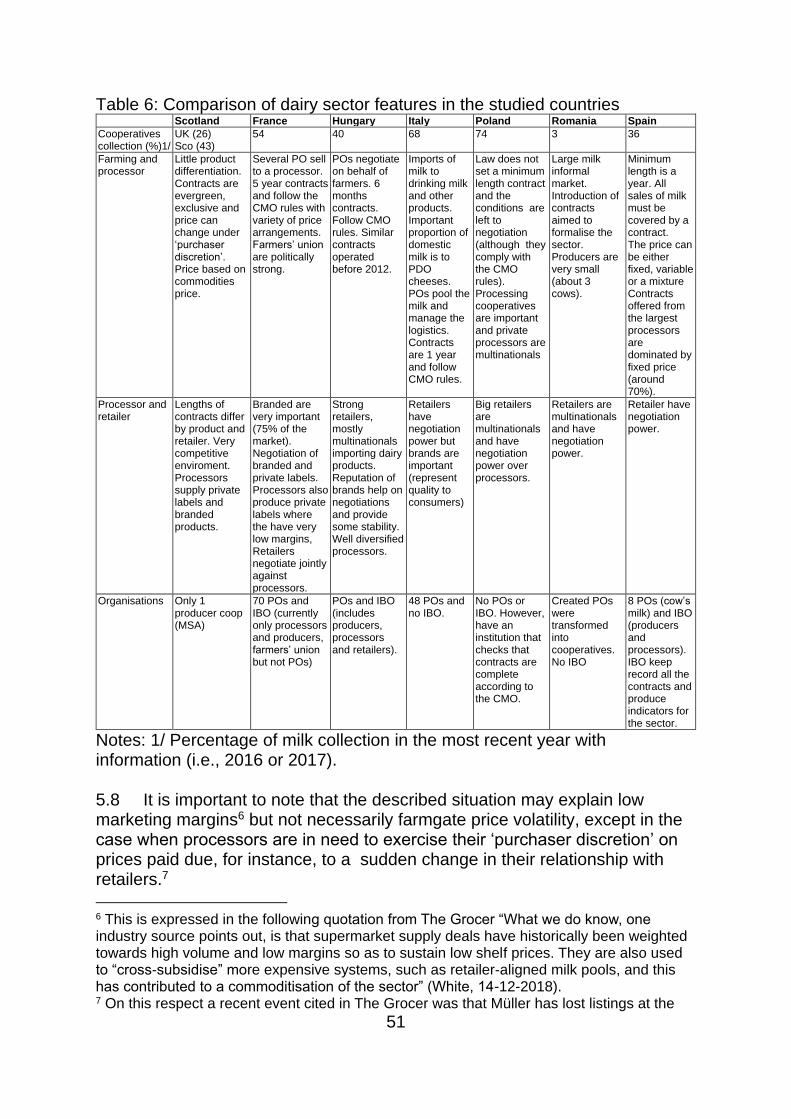
51
Table 6: Comparison of dairy sector features in the studied countries Scotland France Hungary Italy Poland Romania Spain
Cooperatives collection (%)1/
UK (26) Sco (43)
54 40 68 74 3 36
Farming and processor
Little product differentiation. Contracts are evergreen, exclusive and price can change under ‘purchaser discretion’. Price based on commodities price.
Several PO sell to a processor. 5 year contracts and follow the CMO rules with variety of price arrangements. Farmers’ union are politically strong.
POs negotiate on behalf of farmers. 6 months contracts. Follow CMO rules. Similar contracts operated before 2012.
Imports of milk to drinking milk and other products. Important proportion of domestic milk is to PDO cheeses. POs pool the milk and manage the logistics. Contracts are 1 year and follow CMO rules.
Law does not set a minimum length contract and the conditions are left to negotiation (although they comply with the CMO rules). Processing cooperatives are important and private processors are multinationals
Large milk informal market. Introduction of contracts aimed to formalise the sector. Producers are very small (about 3 cows).
Minimum length is a year. All sales of milk must be covered by a contract. The price can be either fixed, variable or a mixture Contracts offered from the largest processors are dominated by fixed price (around 70%).
Processor and retailer
Lengths of contracts differ by product and retailer. Very competitive enviroment. Processors supply private labels and branded products.
Branded are very important (75% of the market). Negotiation of branded and private labels. Processors also produce private labels where the have very low margins, Retailers negotiate jointly against processors.
Strong retailers, mostly multinationals importing dairy products. Reputation of brands help on negotiations and provide some stability. Well diversified processors.
Retailers have negotiation power but brands are important (represent quality to consumers)
Big retailers are multinationals and have negotiation power over processors.
Retailers are multinationals and have negotiation power.
Retailer have negotiation power.
Organisations Only 1 producer coop (MSA)
70 POs and IBO (currently only processors and producers, farmers’ union but not POs)
POs and IBO (includes producers, processors and retailers).
48 POs and no IBO.
No POs or IBO. However, have an institution that checks that contracts are complete according to the CMO.
Created POs were transformed into cooperatives. No IBO
8 POs (cow’s milk) and IBO (producers and processors). IBO keep record all the contracts and produce indicators for the sector.
Notes: 1/ Percentage of milk collection in the most recent year with information (i.e., 2016 or 2017). 5.8 It is important to note that the described situation may explain low marketing margins6 but not necessarily farmgate price volatility, except in the case when processors are in need to exercise their ‘purchaser discretion’ on prices paid due, for instance, to a sudden change in their relationship with retailers.7
6 This is expressed in the following quotation from The Grocer “What we do know, one industry source points out, is that supermarket supply deals have historically been weighted towards high volume and low margins so as to sustain low shelf prices. They are also used to “cross-subsidise” more expensive systems, such as retailer-aligned milk pools, and this has contributed to a commoditisation of the sector” (White, 14-12-2018). 7 On this respect a recent event cited in The Grocer was that Müller has lost listings at the
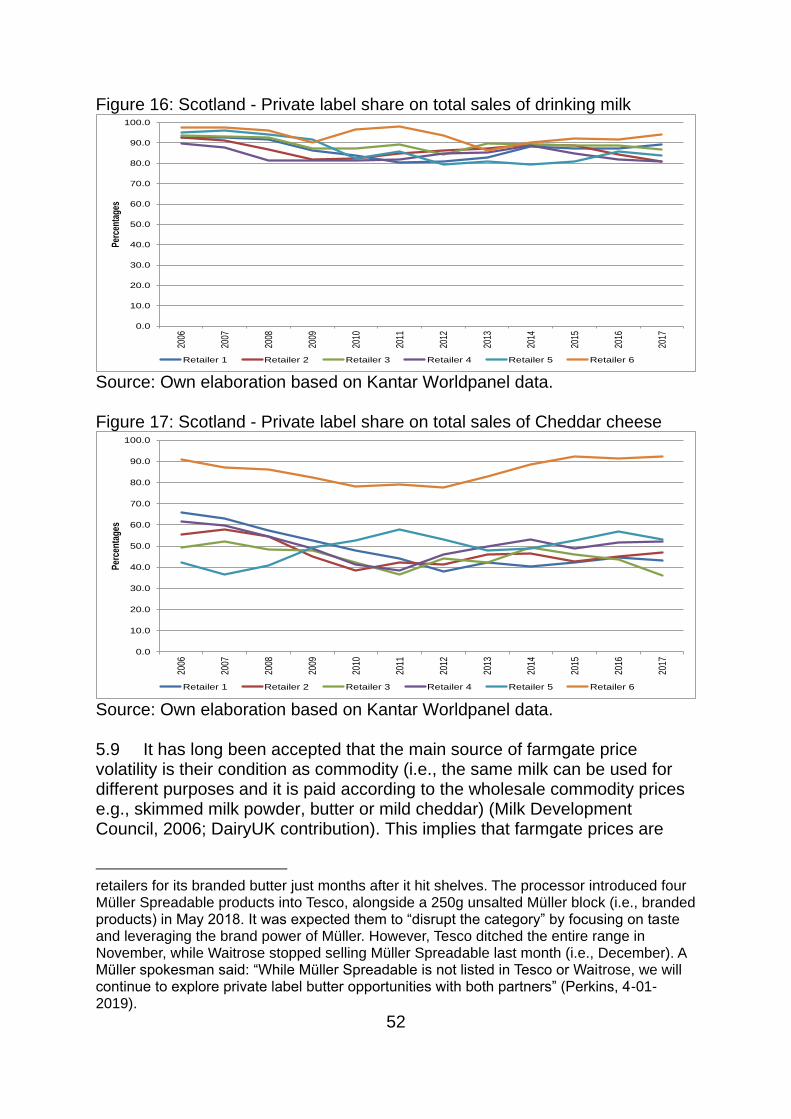
52
Figure 16: Scotland - Private label share on total sales of drinking milk
Source: Own elaboration based on Kantar Worldpanel data. Figure 17: Scotland - Private label share on total sales of Cheddar cheese
Source: Own elaboration based on Kantar Worldpanel data. 5.9 It has long been accepted that the main source of farmgate price volatility is their condition as commodity (i.e., the same milk can be used for different purposes and it is paid according to the wholesale commodity prices e.g., skimmed milk powder, butter or mild cheddar) (Milk Development Council, 2006; DairyUK contribution). This implies that farmgate prices are
retailers for its branded butter just months after it hit shelves. The processor introduced four Müller Spreadable products into Tesco, alongside a 250g unsalted Müller block (i.e., branded products) in May 2018. It was expected them to “disrupt the category” by focusing on taste and leveraging the brand power of Müller. However, Tesco ditched the entire range in November, while Waitrose stopped selling Müller Spreadable last month (i.e., December). A Müller spokesman said: “While Müller Spreadable is not listed in Tesco or Waitrose, we will continue to explore private label butter opportunities with both partners” (Perkins, 4-01-2019).
0.0
10.0
20.0
30.0
40.0
50.0
60.0
70.0
80.0
90.0
100.0
2006
2007
2008
2009
2010
2011
2012
2013
2014
2015
2016
2017
Per
cent
ages
Retailer 1 Retailer 2 Retailer 3 Retailer 4 Retailer 5 Retailer 6
0.0
10.0
20.0
30.0
40.0
50.0
60.0
70.0
80.0
90.0
100.0
2006
2007
2008
2009
2010
2011
2012
2013
2014
2015
2016
2017
Per
cen
tag
es
Retailer 1 Retailer 2 Retailer 3 Retailer 4 Retailer 5 Retailer 6
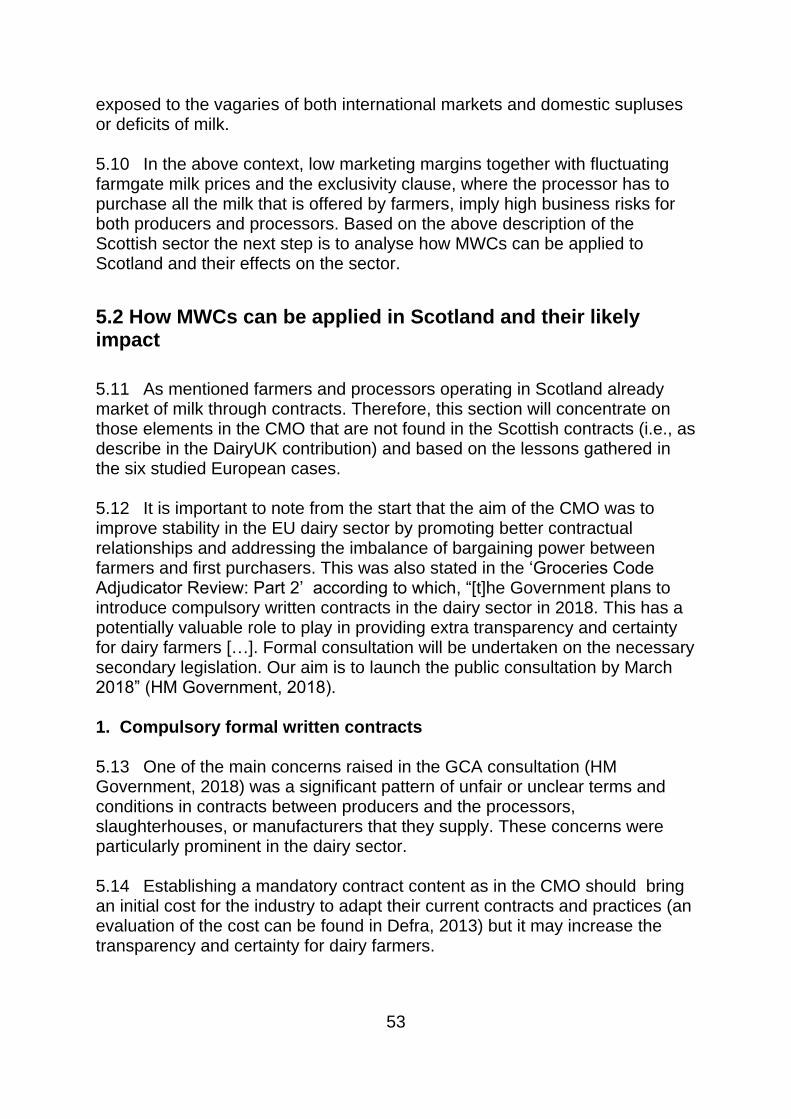
53
exposed to the vagaries of both international markets and domestic supluses or deficits of milk. 5.10 In the above context, low marketing margins together with fluctuating farmgate milk prices and the exclusivity clause, where the processor has to purchase all the milk that is offered by farmers, imply high business risks for both producers and processors. Based on the above description of the Scottish sector the next step is to analyse how MWCs can be applied to Scotland and their effects on the sector.
5.2 How MWCs can be applied in Scotland and their likely impact
5.11 As mentioned farmers and processors operating in Scotland already market of milk through contracts. Therefore, this section will concentrate on those elements in the CMO that are not found in the Scottish contracts (i.e., as describe in the DairyUK contribution) and based on the lessons gathered in the six studied European cases. 5.12 It is important to note from the start that the aim of the CMO was to improve stability in the EU dairy sector by promoting better contractual relationships and addressing the imbalance of bargaining power between farmers and first purchasers. This was also stated in the ‘Groceries Code Adjudicator Review: Part 2’ according to which, “[t]he Government plans to introduce compulsory written contracts in the dairy sector in 2018. This has a potentially valuable role to play in providing extra transparency and certainty for dairy farmers […]. Formal consultation will be undertaken on the necessary secondary legislation. Our aim is to launch the public consultation by March 2018” (HM Government, 2018). 1. Compulsory formal written contracts 5.13 One of the main concerns raised in the GCA consultation (HM Government, 2018) was a significant pattern of unfair or unclear terms and conditions in contracts between producers and the processors, slaughterhouses, or manufacturers that they supply. These concerns were particularly prominent in the dairy sector. 5.14 Establishing a mandatory contract content as in the CMO should bring an initial cost for the industry to adapt their current contracts and practices (an evaluation of the cost can be found in Defra, 2013) but it may increase the transparency and certainty for dairy farmers.
54
5.15 Some countries (e.g., Spain) yearly publish a contract model (without mandatory application) that may be used by the industry as a blueprint contract. This allows farmers’ organisations to provide general advice to milk producers, usually the part less informed in the contractual negotiation, as to contract interpretation. 5.16 In addition, the contract may contain mediation clauses that are similar across cases. 2. The written offer: ‘evergreen’ contracts 5.17 The GCA consultation also raised the difficulties that producers face in trying to terminate their contracts within a reasonable period if significant changes to prices or the terms of contracts are proposed. These can have major commercial implications for a small producer (HM Government, 2018). 5.18 In fact, it is common practice within the UK dairy sector the use of rolling or ‘evergreen’ contracts. These contracts renew automatically after each period under the same contract conditions. This, in addition to the use of long notice periods to terminate the contract may perpetuate a non-negotiated contractual relationship. 5.19 Some countries have tried to improve this situation by imposing milk buyers the obligation to make a mandatory written offer in advance. This formal offer is sent to the producer two months in advance of the contract termination date comprising the conditions of the contract for the following period. 3. Price determination, its changes and exclusivity clauses 5.20 A number of respondents to the GCA consultation highlighted the challenge posed by variations to specifications or contract terms, especially if imposed at short notice (HM Government, 2018). 5.21 As explained in the DairyUK contribution, processors are exposed to commercial pressures (e.g., low margins at the retail market, variable farmgate prices and quantity variability as result of production seasonality combined with the exclusivity clauses), therefore, pricing clauses in contracts between dairy processors and their supplying farmers have historically been built around flexibility reflected on the purchaser discretion to vary the farm gate price as and when they see fit. 5.22 Processors have argued that purchaser discretion is a natural consequence in order to balance the commercial risk that they are assuming by taking all the milk that their suppliers produce as a result of supply
55
exclusivity clauses.8 This circumstance connects price negotiation with the issue of milk volume management. 5.23 Most of the existing applications of MWCs on the European dairy markets follow the CMO regulation recommending that the price should be freely negotiated and agreed by the parts and included in the contract, either in a fixed or variable form for the duration of the contract. Clearly under the current conditions (i.e., processors buying all the milk produced by their farmers) this pricing system, would mean exposing them to a significant business risk. 5.24 Under the current market structure, characterised by highly vulnerable processors due to their products' portfolio and changes in their costs of production, it is not feasible to introduce pricing mechanisms and minimum contract duration without taking into consideration delivery volumes. 5.25 An example of the above could be the case of a contract between a processor and farmers, where the conditions are a contract length of year (i.e., the conditions of the contract cannot change during that period), the price paid to farmers depends on the international price of skimmed milk powder (SMP) through a formula, and the farmers deliver all the milk they produce to the processor (i.e., under exclusivity). If the price of SMP increases dramatically, it will encourage farmers to produce more and the processor will face a substantial increase on the total costs of milk and will need to dispose the excess of milk without necessarily having a market for it. 5.26 There are at least two ways to reduce the processor's vulnerability in the above example: one way would be to consider a contract where the exclusivity clause is eliminated and replaced by an agreed in advance schedule of milk delivery (i.e., agreed volumes). The second way, would be to maintain the exclusivity clause but replace the price formula by a type "A&B" pricing, where the processor would pay price A for an agreed volume of milk and much lower price for any milk delivered in excess of the agreed volume. The low price should discourage farmers to produce in excess. 5.27 Eliminating exclusivity clauses would liberate processors from the burden of seasonal surplus of milk eliminating significantly the quantity risk. However, at the same time it would require setting volumes on the contracts leaving the responsibility for managing the marketing of any potential
8 This can be seen in the following news from The Grocer “Müller Milk & Ingredients announced today it would cut the price it paid to members of the Müller Milk Group (on Müller Direct non supermarket-aligned contracts) to 26.25p per litre from 1 March, which is a 1.25p drop on its January price and a 2.25p drop on the price it paid in December. The processor said the price cut reflected “a surge in milk production from farms”, with AHDB data suggesting off-farm milk production in December was the highest for a quarter of a century” (White, 2019).

56
production surplus on the producers (or their organisations). This is the case in all the studied countries. 5.28 Another potential advantage of eliminating exclusivity on contracts is the possibility of farmers to decide what to do with the milk surplus once they have honoured their contracts. Farmers may decide to sell it to the processor if both parties agree, sell it to a different processor or decide to process it themselves. 5.29 A concern expressed regarding the elimination of exclusivity is that it may affect the stable supply of milk to processors. In all the studied countries, quantities supplied and variations are established into the contracts without bringing any problem. For instance, in France, cooperatives accept all the milk from their associated farmers whilst private processors set quantities as part of their contracts, having the possibility to buy additional quantities from their farmers at their discression. A problem that might occur is the potential existence of moral hazard issues in which a farmer reports not being able to honour its contract with a processor and instead market the milk to another one due to a better price. This could be avoided by reporting all the sales of milk a competent authority, for instance, to an IBO. This could also be avoided by the presence of PO organising the supply of milk. 5.30 Note that the effectiveness of the A&B pricing depends on the reaction of the supply to the set prices. If the B price is set too high, low cost producers may still over deliver. 5.31 As regards the pricing of milk, one of the aspects of concern is the lack of indicators that are suitable to establish formulas or set fix prices. However, current practices use price indicators available in the market (e.g., wholesale prices) moderated with other factors such as the companies’ economic results as well as quality and seasonal factors. As mentioned, the CMO proposal is very flexible as it allows the Member States to introduce the specific legislation and companies to adapt their pricing to their specific situation and products. The diversity of business environments where the CMO has been applied and how it has been adapted by the Member States reflects its flexibility. 5.32 It is important at this point to ask the question whether this pricing would imply higher or less volatile prices to farmers. Under the CMO rules prices are negotiated between processors and farmers and most probably the price formulas will be based on the same commodity prices that currently determine the prices of milk in Scotland. Therefore, one should not expect higher prices or less volatile prices due to the introduction of MWCs. However, what MWCs would avoid is the the sudden changes in conditions coming, say, from changes originated from processors’ customers (e.g., retailers). The discussion points out that there is not a lack of market price indicators to base the price formulas and a much more important point of discussion as regards
57
the introduction of MWCs is the elimination of purchasers’ discretion right to change prices when they see fit. 4. Producers’ organisations and interbranch organisations 5.33 As noted by HM Government (2018) compared with other, more powerful players in the groceries supply chain, primary producers are much smaller and disaggregated. The lack of bargaining power of many farmers and growers was an important theme raised by those responding to the Call for Evidence (i.e., GCA consultation). 5.34 Producers’ organisations have been useful devices in some of the European countries under study to solve both issues: strengthening producers bargaining position in the negotiation of contracts and milk volume management. POs depend on farmers’ initiative and cannot be imposed, say by the Governments. However, the Government can initially foster them as they need to led by a professional team that need to gain the trust of farmers. As in the studied countries POs need to be funded by farmers. 5.35 It is clear that although international conditions matter for the industry; as explained before, the particular structure of the dairy supply chain is also important. Interbranch organisations are structures that are useful for stakeholders (where all the parties are represented) to discuss issues concerning the supply chain.
58
6. Conclusions and recommendations 6.1 The purpose of this report has been to present the results of an analysis of the compulsory contracts or mandatory written contracts in European countries as there is currently limited evidence on the impact of these in the countries in which they currently operate. 6.2 In general the study does not find reasons why the MWCs cannot be applied to the Scottish dairy market. However, the specific conditions need to be negotiated between the parties. Recommendations for the Industry 6.3 To avoid excessive exposure of processors to risk and damages to the dairy supply chain, it is important that the exclusivity clauses should be eliminated and replaced by contracts that stipulate volume, price and minimum contract time duration. 6.4 Given the seasonality of the production annual contracts are probably the most suitable duration of the contracts (evergreen contracts can be negotiated by the parties). 6.5 Farmers commit on contracts a schedule of quarterly or monthly volumes, with deviations negotiated. 6.6 Mandatory written offers in advance (i.e., a formal offer is sent to the producer say two months in advance of the contract termination date) comprising the conditions of the contract for the following period can be useful to avoid the difficulties that producers face in trying to terminate their contracts within a reasonable period if significant changes to prices or the terms of contracts are proposed. 6.7 The pricing scheme chosen (i.e., fixed, formula or a combination of both) is also subject to negotiation and might depend on the duration of the contracts. 6.8 The industry can benefit of encouraging POs. For farmers, they can provide bargaining or at least greater help with understanding the details behind the contracts. For processors they can provide an organised way to collect milk reducing transaction costs. 6.9 In addition, establishing an IBO, bringing together all the stakeholders, would be useful for the industry as it will allow them to discuss supply chain issues. It could be a way to develop collaboration on the dairy supply chain.

59
Recommendations for the Scottish Government 6.10 Encourage the formation of POs led by negotiators with skills and experience and are able to gain the trust of farmers. A strategy for this needs to be established with problably the Government supporting financially the starting of the POs, although they should be supported by the farmers. 6.11 Encourage the industry to create an IBO, with the participation of all the stakeholders i.e., farmers, processors and retailers, to discuss dairy supply chain issues and move towards a collaborative approach.
60
7. Annexes
7.1 Overview of the studied dairy industries
7.1.1 France
Production 7.1 France’s production accounts 25 billion tonnes, which is equivalent to 15.8% of EU milk deliveries (based on 2017 volumes). Its exports of dairy products, converted into milk equivalent represent the 41.6% of the milk deliveries, and 13.0% of EU dairy exports in milk equivalent (year 2017) (CLAL, 2019). A summary of statistics for the dairy sector in France is presented in Table A.1 in the Annex, section 7.2. 7.2 France is the seventh biggest world producer of milk after the United States, India, China, Brasil, Russian and Germany and the second in Europe (FranceAgriMer 2018a). The French dairy productios is distributed among twelve regions or departments (S.S.P. Enquête Annuelle Laitière – 2017). However, 55% of farms and milk production are concentrated in the North-West of France in three regions namely: Bretagne, Pays-de-la-Loire and Normandie. The Bretagne department is the most important, accounting for almost 27% of the farms and 20% of milk production. Pays-de-la-Loire and Normandie covers respectively 16% of the French milk production and hosts 14% of farms. 7.3 Three main production areas can be distinguished in France (Dervillé and Allaire, 2014): specialised plain areas generally located in the north-western part of France, mixed farming areas with light milk density, and mountainous areas. As stated by Trouvé et al. (2016), the French farm structure and its spatial distribution was highly influenced by the implementation of quotas. The abolition of quotas in 2015 caused a change in its dynamics of growth with the west, north and east plain areas seeing growth. Mountain farms experienced declining profitability while there was an abandonment of farmland in the intermediary areas. 7.4 The Dairy production sector in France has gone through a dramatic structural change during the period 2007-2017, which was characterised by a reduction of 63 thousand dairy farms and around 100 thousand cows (CNIEL, 2018). Processing 7.5 At a dairy processing level, the percentages of milk used for domestic liquid consumption and manufacture are: 40% of the milk is processed into cheese (15% of the total cheeses are those under Protected Denomination of
61
Origin (PDO)), 27% into butter and cream, 13% into milk powder, 10% into milk, 7% into fresh products (yogurts or deserts) and 3% is directed to other uses. In addition, approximately 25% of the processed products are sold to industries for further processing whilst the 75% are sold to the general public (FranceAgriMer 2018a). 7.6 There are more than 730 dairy processors in France9 (CNIEL, 2018) with a turnover of 19,711 million euros (CNIEL, 2018). 7.7 624 processors reported manufacturing cow milk to a monthly dairy survey during 2017 (FranceAgriMer, 2018b). Of these, cooperatives groups represent 50.4% of all the processors and the remaining 49.6% are private operators. The majority of these establishments (58.7%) are specialised on only one dairy category such as packaged milk, fats, packaged cream, ultra-fresh products - yogurts and dessert, cheeses or milk powders. Cheese processors are the most significant most significant group (70.5% of the processors) followed by ultra-fresh products (14.5%) and milk powder (8.2%) (FranceAgriMer, 2018b). 7.8 There are different size of coperatives: 10 very large ones with a turnover in excess of 300 million euros, 30 medium size cooperatives and 200 fruitières with a turnover much lower (Trouvé et al., 2016). As of 2011, Sodiaal is the largest French cooperative group, ranking 17th in the world, 4.9 billion litres collected. Other large purchasers areLaïta, Agrial and Eurial collecting together around a billion litres of milk. 7.9 Among the large private companies, four are in the top 25 world turnover ranking: Lactalis (No. 1, with 16 billion Euros in turnover), Danone (No. 4), Bongrain/Savencia (No. 18) and Bel (No. 24) (CNIEL, 2018). The distribution of manufactured products among the different dairy products areas does not vary between cooperatives and private groups (FranceAgriMer, 2018b). 7.10 French dairy processors are concentrated in six regions: 72% of the production is located in four regions, being Auvergne-Rhône-Alpes the most important one as concerning the number of manufacturing sites. However, when considering the volume of milk processed Hauts-de-France is the leading region covering 25% of the produced volume followed by Bretagne and Auvergne-Rhône-Alpes with 17.5% and 15.6% respectively (FranceAgriMer, 2018b). The degree of concentration per dairy products area changes by products; nevertheless the top processors are: Lactalis, Danone, Savencia, Sodiaal (FranceAgriMer, 2018b).
9 Considering all dairy products and establishments with more than 20 employees.
62
7.1.2 Hungary
7.11 In 2017 Hungary, which a production of 1.9 billion tonnes of milk, accounted for 1.0% of EU milk deliveries. Its exports of dairy products converted into milk equivalent were 40.4% of the milk deliveries and 0.8% of EU dairy exports (CLAL, 2019). A summary of statistics for the dairy sector in Hungary is presented in Table A.2 in the Annex, section 7.2. 7.12 The Hungarian dairy sector underwent significant structural transformation during the last two decades because of two key political factors: (1) the fall of the socialist system in 1989 and (2) its accession to the European Union (EU) in 2004 (Perekhozhuk, et al., 2011). 7.13 One of the results of the liberalisation of the economy was the reduction in the number of dairy farms (Bakucs, et al., 2013). Between 2000 and 2016, the number of dairy cows decreased by 31.2% from 355 to 244 thousand heads. Raw milk production fell by only 8% however as milk yieldsgrew steadily during the period. By 2016, they had risen to 7,862 kg/head from just over 6,000kg/head in (European Commission, 2019). 7.14 The abolition of the Hungarian national milk price support system, incompatible with EU competition rules, has been pointed out as another underpinning factor for this decline in the sector. Until 2004, the Hungarian government favoured those dairy processors who paid a targeted minimum farm gate price to producers with an export subsidy. This resulted in producers getting an artificially high raw milk price in comparison with neighbouring countries such as Poland, the Czech Republic and Slovakia (Hockmann and Vöneki, 2009). This situation ended with the elimination of the export subsidies. 7.15 One of the main characteristics featured by the Hungarian dairy sector since its accession to the EU has been its low competitiveness with respect to other EU members. This low competitiveness is due to several factors, which Szücs and Szöllösi (2015) have summarised in three main groups: (1) factors underpinning the low profitability of milk production settings, with high average costs of production; (2) the unfavourable market position of the Hungarian processing industry, mainly focused on low value added products with high average costs of production facing an internal low demand market for dairy products and accompanied by increasing quality regulatory requirements; (3) factors that have favoured the introduction of products from other EU members to cover dairy internal market gap.
63
7.1.3 Italy
Production 7.16 Italy accounted for 8.2% of EU milk deliveries in 2017, i.e., 12 billion tonnes of milk. The same year its exports of dairy products, converted into milk equivalent (ME) represented 32.4% of the milk deliveries and 4.7% of EU dairy exports in ME (CLAL, 2019). A summary of statistics for the dairy sector in Italy is presented in Table A.3 in the Annex, section 7.2. 7.17 Approximately 12 millions of tonnes of milk are produced in Italy (2017) and about 13 millions of tonnes of milk are converted in a million tonnes of cheese (more than 440 thousand tonnes are Protected Designation of Origin (PDO) cheeses - 37 Italian cheese carry a PDO label), almost three millions of tonnes of pasteurised drinking milk and 190 thousand tonnes of yogurts and fermented milks. The difference between the domestic milk production and the utilisation is explained by imports from mainly France and Germany. 7.18 The Italian production of cow’s milk is essentially concentrated in 8 regions: Lombardy, Emilia Romagna, Veneto, Piedmont, Trentino Alto Adige, Lazio, Puglia and Friuli Venezia Giulia. In particular, 41% of the total production comes from the Lombardy region, while the first 4 regions (Lombardy, Emilia Romagna, Veneto and Piedmont) represent about 75% of the total production. Processing 7.19 In total, about 34 thousand processing companies operate in Italy, of which about 15 thousand are in the plain areas, 16 thousand in mountain areas and 3 thousand in other disadvantaged areas. Production of mountain and disadvantaged areas, however, represent only 20% of the total production, in contrast with the 80% from the plain areas. 7.20 The distribution of the number of companies by size classes clearly shows how about 2/3 of the companies are located in the two smaller size classes (with a production of less than 200 tonnes of milk) and accounting for less than 15% of total production. Large companies (with a production of over 1,000 tonnes of milk) instead account for less than 1/5 of the total and represent over 70% of total production. 7.21 Although still characterised by a strong productive fragmentation, the sector has in the last two decades been subject to a particularly intense restructuring phase which led to the drastic reduction in the number of companies as well as the increase in their size and productivity.
64
7.22 The reduction in the number of companies affected particularly small companies and has been more pronounced in the plain area, increasing the productivity gap between the plain and mountain areas. Average production per company in plain areas increased from 174 to 579 tonnes of milk processed in the last two decades whilst in mountain areas it went from 40 to 113 tonnes. 7.23 At the regional level the structural differences are also marked. Regions such as Lombardy, Emilia Romagna and Veneto have levels of milk production per company higher than the European average (comparable to those of France and Germany), while regions such as Puglia and Trentino Alto Adige present a lower average company size. 7.24 About 70% of the milk produced in Italy is destined to the production of a great variety of traditional cheeses, all of them unique in their organoleptic and nutritional characteristics and processing technique: Mozzarella occupies the first place as far as volume is concerned – 250,000 tonnes/year – followed by the two most popular PDO cheeses in the world: Grana Padano – the most exported with 163,000 tonnes/year and Parmigiano Reggiano – the most imitated with 116,000 tons/year. Other cheeses are Gorgonzola, Pecorino, Asiago, Taleggio. 7.25 Italy exports almost 250 thousand tonnes of cheese, with a value of €1.4 billion. Main Italian exported cheeses are Mozzarella and other fresh cheeses (36.4%), Grana Padano PDO and Parmigiano Reggiano PDO (25%) followed by Pecorino Romano PDO, Gorgonzola PDO and Provolone.
7.1.4 Poland
Production 7.26 Poland milk production in 2017 was 13.6 billion tonnes, i.e., represents 7.5% of EU milk deliveries, with its exports of dairy products, converted into milk equivalent (ME) being 33.7% of the milk deliveries, and 5.0% of EU dairy exports (CLAL, 2019). A summary of statistics for the dairy sector in Poland is presented in Table A.4 in the Annex, section 7.2. 7.27 In 2013 had Poland around 150 thousand dairy farms with a size of more than 10 ha (from a total of 335 thousand farms). Additionally, approximately 82% are farmers’ owned. Information to 2015 indicated that Poland has 132.5 thousand commercial dairy farms. 7.28 As regards the regional distribution of the production, Podlaskie, in the north-east of Poland, is by far the largest region by the number of dairy cows (18.3% of the total). It is followed by Wielkopolskie (12% of the total). Both regions (Wielkopolskie and Podlaskie) gained importance following the
65
market-driven transition in 1989 and accession to the EU in 2004. The elimination of the dairy quota system in the EU in 2015 offered new expansion opportunities (Sobczyński et al., 2015). 7.29 Poland dairy sector relays significantly on the external market since 25% of its national production (by volume) is sold outside the country, being 77% sold in the European Union and 10% in the Central European Initiative. Russia was a very important market for its cheeses, and the Russian embargo affected significantly Polish exports. It should be noted, however, that since 2009 the volume of Polish exports has not increased. The increase in value has been due to the evolution of international prices, the favourable exchange rate, and an increase in exports of products with higher added value, such as cheeses (Trouvé et al., 2016; Martinez, 2013). Processing 7.30 In Poland there are approximately 165 dairy processing plants of which many are independent companies or small cooperatives. There are 10 large processors covering about 60% of domestic production and the rest are of relatively small in size (Trouvé et al., 2016). The most important dairy firm in the Poland is ranked in 42nd place in terms of turnover at the European Union level. In fact, about 75% of the milk processed is in cooperatives and the rest is private firms. 7.31 Poland is the 4th European producer of milk but 6th when considering dairy processing, with 10 million tonnes of raw milk processed every year in Polish territory. Note that part of the Polish milk production is exported to be processed in neighbouring countries such as Germany. Nevertheless, Poland is the 7th largest cheese producer in the world, and the 5th in the European Union. 7.32 According to Trouvé et al. (2016) most the cooperatives have a highly politicised management board, strongly linked to the PSL1 (Polskie Stronnictwo Ludowe, the Polish Peasant Party), a member of the ruling coalition, and thus have an important power over the Ministry of Agriculture. 7.33 Since 2015, foreign companies such as Danone, Lactalis, Bongrain and Hochland, have been well established in Poland and they transform about 25% of the milk collection (Trouvé et al., 2016). It should be noted that the total number of dairy processing plants is decreasing at a slow rate, while the turnover has been increasing rapidly from 2016 to 2017. This indicates a very slow concentration of the processing sector. The dairy processing plants employ more than 32 thousand people. The number of dairy processing plants has been stable whilst the number of employees per plant is growing slowly.
66
7.1.5 Romania
Production 7.34 The Romanian production of milk in 2017 was 3.8 billion tonnes and accounted for 0.7% of EU milk deliveries in 2017. Its exports of dairy products, converted into milk equivalent (ME) represented 22.2% of the milk deliveries and 0.3% of EU dairy exports (CLAL, 2019). A summary of statistics for the dairy sector in Romania is presented in Table A.5 in the Annex, section 7.2. 7.35 The Romanian dairy production sector is extremely fragmented, small sized farms are prevalent on the sector. According to data from the Romania Ministry of Agriculture, Forestry and Rural Development, by April 2009 there were around 850 thousand dairy producers, of which 89% held one or two cows, amounting for more than 60% of the total dairy livestock (Pieniadz, et al., 2009). As to 2017, Romania still had the lowest average number of cows per holding (3), the lowest level of milk production per holding (10 tonnes), and the lowest annual yield per cow (3.4 tonnes) of the 28 European Union members (Wijnands, et al., 2017). 7.36 Measured in terms of economic output, more than 81% of dairy farms presented in 2013 a level of EU standard output value below 7,999 euros per holding (Grodea, 2016). In addition, Romania presents one of the highest levels of employment in agriculture within the European Union. However, this vast farm labour force possesses a poor level of training with a high percentage of farm holders above 64 years of age (Fredriksson, et al., 2017). Such features delineate the traditional structure of a very fragmented and low productive sector. 7.37 Although the production settings have begun to change and evolve towards fewer and larger production units., and the milk collection method is also changing increasingly evolving towards direct deliveries to dairies and moving away from the traditional indirect method that used communal collecting points. However, there still exist important differences among different regions (Pieniadz, et al., 2009). Processing 7.38 The above described production sector faces a dairy processing industry where big processors (those who employ more than 250 employees) generated more than 60% of the total dairy industry turnover in 2013. The proportion between these big processors and the number dairy Romanian producers was 1 processor per more than 7,000 producers. Meanwhile as to 2017, there was not any Romanian dairy processing cooperative operating in the country, in other words all Romanian cow milk production was delivered
67
under a contractual agreement to private dairy processors (Wijnands, et al., 2017). 7.39 Understandably, looking at this fragmentation on production, small size of production settings, and lack of cooperative initiatives among producers, the latest European Commission report on the operation of the Milk Package provisions reflects that representatives of the Romanian dairy sector perceived a clear potential for more producer organisations (PO’s) in their territory (European Commission, 2016). Currently, only two PO’s are in operation in Romania (Wijnands, et al., 2017).
7.1.6 Spain
Production 7.40 Spain accounted for 4.5% of EU milk deliveries in 2017 with a production of 7.2 billion tonnes. Its exports of dairy products converted into milk equivalent (ME) represented 21.9% of the milk deliveries and 2% of EU dairy exports (CLAL, 2019). A summary of statistics for the dairy sector in Spain is presented in Table A.6 in the Annex, section 7.2. 7.41 The Spanish total milk production was slightly above 7 million tonnes in 2017, increasing 1.8% from the previous year. 7.42 The production is located mainly in the northern area of Spain (81%), with a high concentration on the NorthWest regions of Galicia (38%) Asturias (8%), and Cantabria (6%). Likewise, the number producers is eminently concentrated in those regions congregating 78% of Spain’s milk producers. Processing 7.43 The Spanish processing industry generated €8,640 millions of output value in 2015, that accounted for 1.8% of the total Spanish industrial production and 9.2% of the food and drink sector. The industrial sector comprissed 1,557 dairy business in 2015. Although, the ten biggest processing groups account for 68% of the total output value.
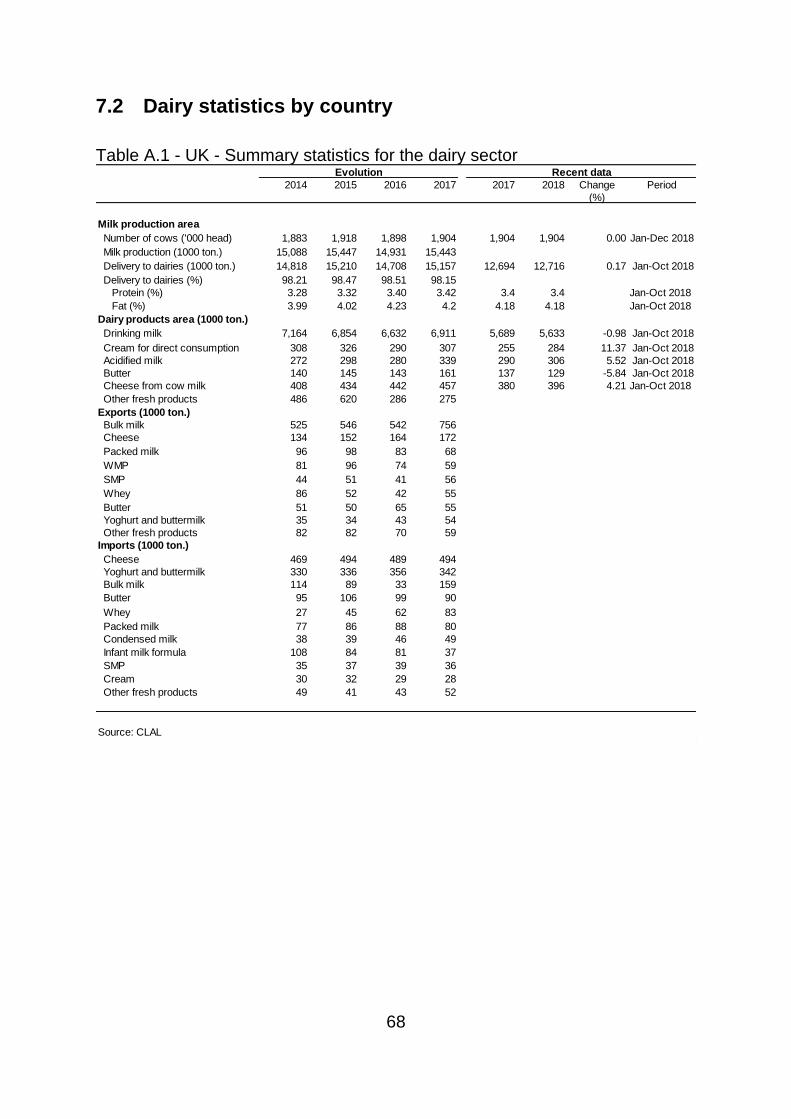
68
7.2 Dairy statistics by country
Table A.1 - UK - Summary statistics for the dairy sector
Evolution Recent data
2014 2015 2016 2017 2017 2018 Change Period
(%)
Milk production area
Number of cows ('000 head) 1,883 1,918 1,898 1,904 1,904 1,904 0.00 Jan-Dec 2018
Milk production (1000 ton.) 15,088 15,447 14,931 15,443
Delivery to dairies (1000 ton.) 14,818 15,210 14,708 15,157 12,694 12,716 0.17 Jan-Oct 2018
Delivery to dairies (%) 98.21 98.47 98.51 98.15
Protein (%) 3.28 3.32 3.40 3.42 3.4 3.4 Jan-Oct 2018
Fat (%) 3.99 4.02 4.23 4.2 4.18 4.18 Jan-Oct 2018
Dairy products area (1000 ton.)
Drinking milk 7,164 6,854 6,632 6,911 5,689 5,633 -0.98 Jan-Oct 2018
Cream for direct consumption 308 326 290 307 255 284 11.37 Jan-Oct 2018
Acidified milk 272 298 280 339 290 306 5.52 Jan-Oct 2018
Butter 140 145 143 161 137 129 -5.84 Jan-Oct 2018
Cheese from cow milk 408 434 442 457 380 396 4.21 Jan-Oct 2018
Other fresh products 486 620 286 275
Exports (1000 ton.)
Bulk milk 525 546 542 756
Cheese 134 152 164 172
Packed milk 96 98 83 68
WMP 81 96 74 59
SMP 44 51 41 56
Whey 86 52 42 55
Butter 51 50 65 55
Yoghurt and buttermilk 35 34 43 54
Other fresh products 82 82 70 59
Imports (1000 ton.)
Cheese 469 494 489 494
Yoghurt and buttermilk 330 336 356 342
Bulk milk 114 89 33 159
Butter 95 106 99 90
Whey 27 45 62 83
Packed milk 77 86 88 80
Condensed milk 38 39 46 49
Infant milk formula 108 84 81 37
SMP 35 37 39 36
Cream 30 32 29 28
Other fresh products 49 41 43 52
Source: CLAL
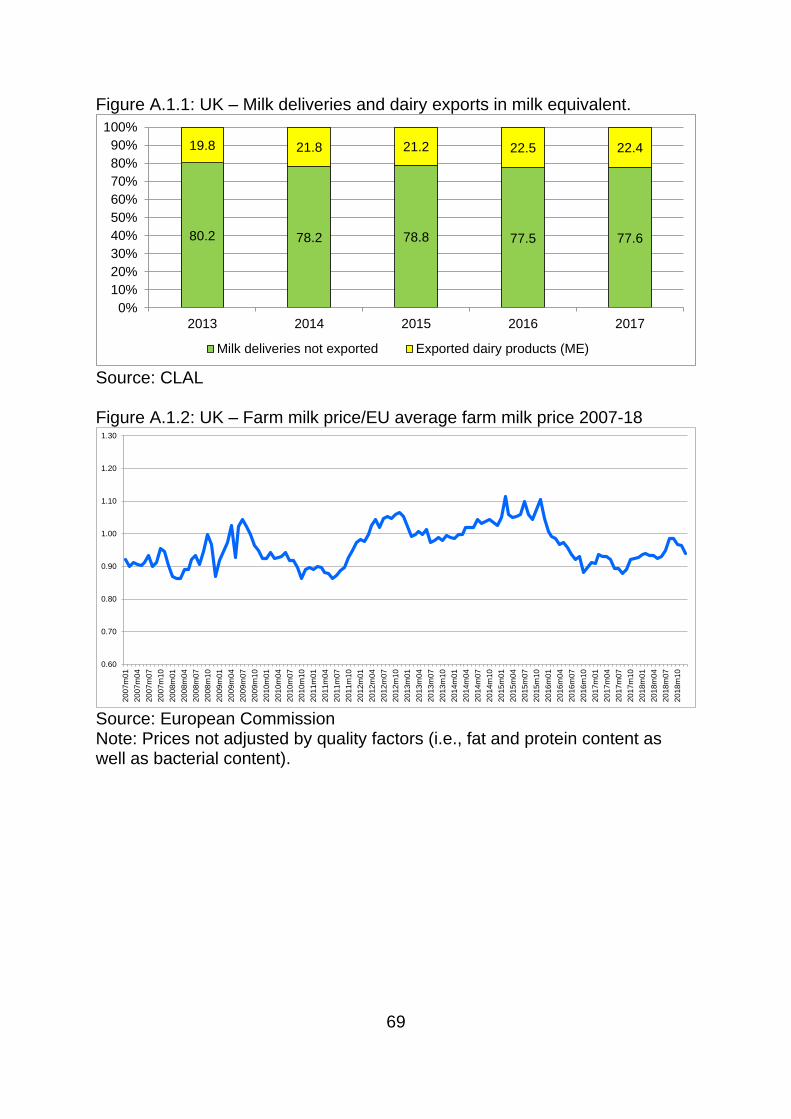
69
Figure A.1.1: UK – Milk deliveries and dairy exports in milk equivalent.
Source: CLAL Figure A.1.2: UK – Farm milk price/EU average farm milk price 2007-18
Source: European Commission Note: Prices not adjusted by quality factors (i.e., fat and protein content as well as bacterial content).
80.2 78.2 78.8 77.5 77.6
19.8 21.8 21.2 22.5 22.4
0%
10%
20%
30%
40%
50%
60%
70%
80%
90%
100%
2013 2014 2015 2016 2017
Milk deliveries not exported Exported dairy products (ME)
0.60
0.70
0.80
0.90
1.00
1.10
1.20
1.30
20
07m
01
20
07m
04
20
07m
07
20
07m
10
20
08m
01
20
08m
04
20
08m
07
20
08m
10
20
09m
01
20
09m
04
20
09m
07
20
09m
10
20
10m
01
20
10m
04
20
10m
07
20
10m
10
20
11m
01
20
11m
04
20
11m
07
20
11m
10
20
12m
01
20
12m
04
20
12m
07
20
12m
10
20
13m
01
20
13m
04
20
13m
07
20
13m
10
20
14m
01
20
14m
04
20
14m
07
20
14m
10
20
15m
01
20
15m
04
20
15m
07
20
15m
10
20
16m
01
20
16m
04
20
16m
07
20
16m
10
20
17m
01
20
17m
04
20
17m
07
20
17m
10
20
18m
01
20
18m
04
20
18m
07
20
18m
10
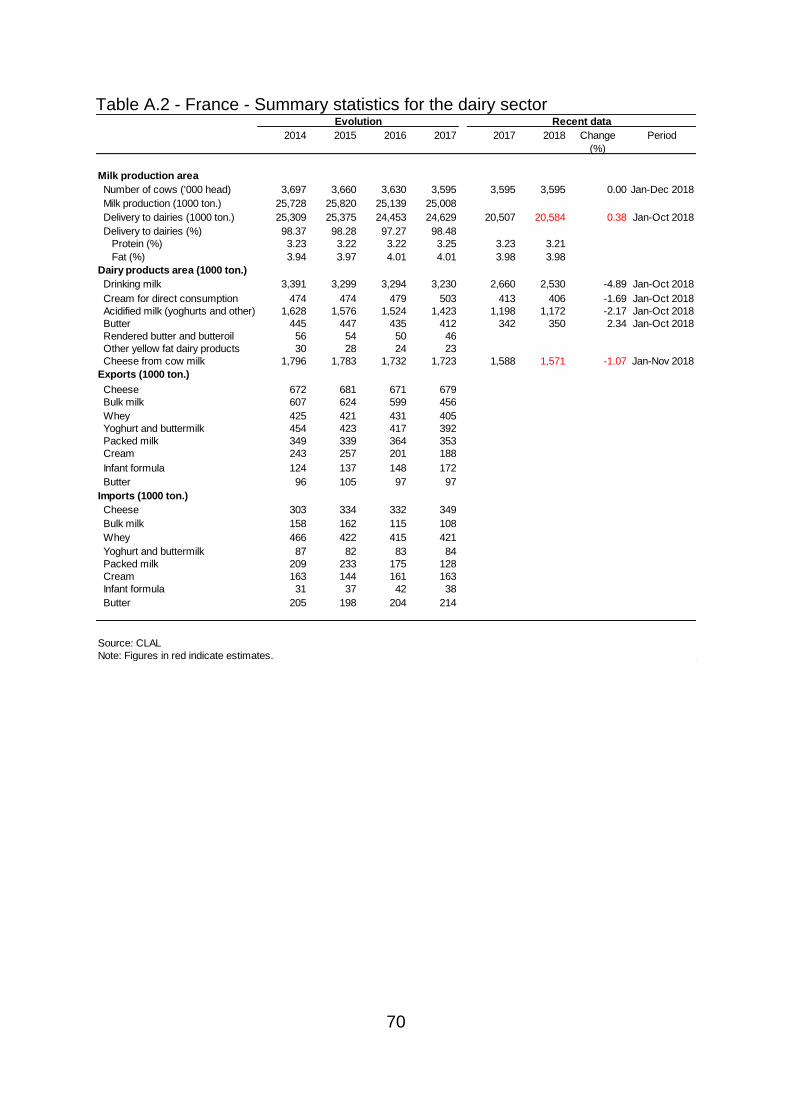
70
Table A.2 - France - Summary statistics for the dairy sector
Evolution Recent data
2014 2015 2016 2017 2017 2018 Change Period
(%)
Milk production area
Number of cows ('000 head) 3,697 3,660 3,630 3,595 3,595 3,595 0.00 Jan-Dec 2018
Milk production (1000 ton.) 25,728 25,820 25,139 25,008
Delivery to dairies (1000 ton.) 25,309 25,375 24,453 24,629 20,507 20,584 0.38 Jan-Oct 2018
Delivery to dairies (%) 98.37 98.28 97.27 98.48
Protein (%) 3.23 3.22 3.22 3.25 3.23 3.21
Fat (%) 3.94 3.97 4.01 4.01 3.98 3.98
Dairy products area (1000 ton.)
Drinking milk 3,391 3,299 3,294 3,230 2,660 2,530 -4.89 Jan-Oct 2018
Cream for direct consumption 474 474 479 503 413 406 -1.69 Jan-Oct 2018
Acidified milk (yoghurts and other) 1,628 1,576 1,524 1,423 1,198 1,172 -2.17 Jan-Oct 2018
Butter 445 447 435 412 342 350 2.34 Jan-Oct 2018
Rendered butter and butteroil 56 54 50 46
Other yellow fat dairy products 30 28 24 23
Cheese from cow milk 1,796 1,783 1,732 1,723 1,588 1,571 -1.07 Jan-Nov 2018
Exports (1000 ton.)
Cheese 672 681 671 679
Bulk milk 607 624 599 456
Whey 425 421 431 405
Yoghurt and buttermilk 454 423 417 392
Packed milk 349 339 364 353
Cream 243 257 201 188
Infant formula 124 137 148 172
Butter 96 105 97 97
Imports (1000 ton.)
Cheese 303 334 332 349
Bulk milk 158 162 115 108
Whey 466 422 415 421
Yoghurt and buttermilk 87 82 83 84
Packed milk 209 233 175 128
Cream 163 144 161 163
Infant formula 31 37 42 38
Butter 205 198 204 214
Source: CLAL
Note: Figures in red indicate estimates.
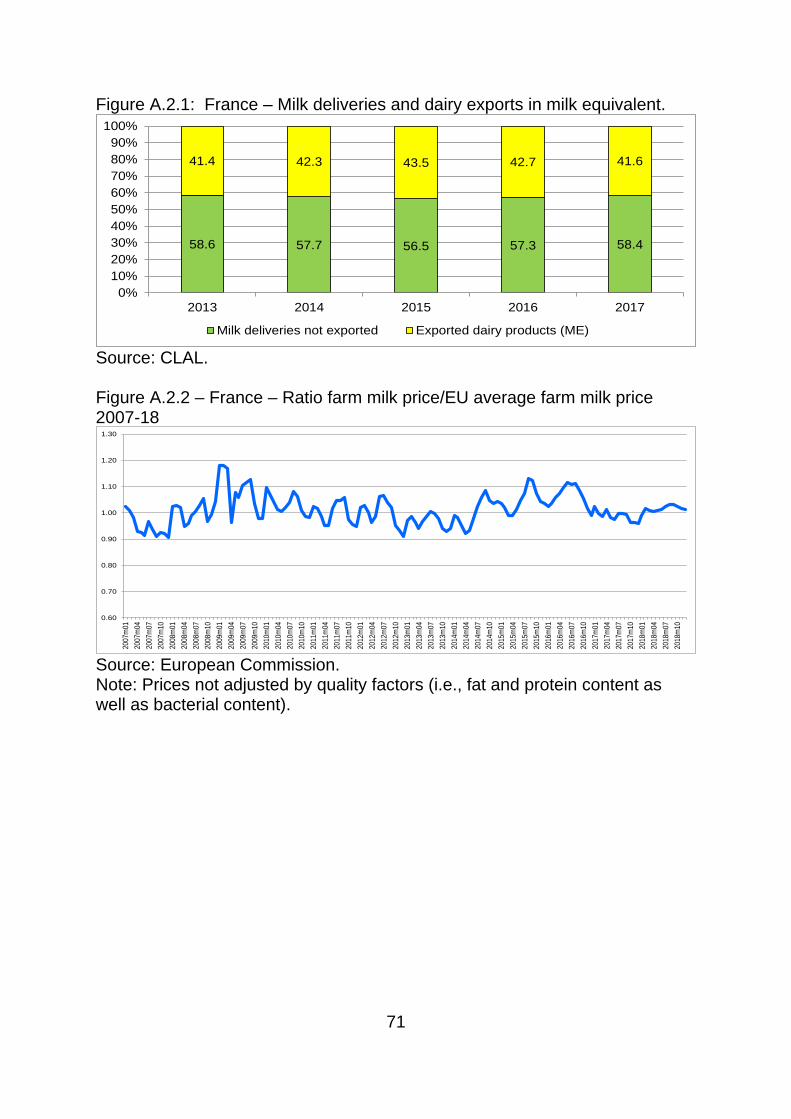
71
Figure A.2.1: France – Milk deliveries and dairy exports in milk equivalent.
Source: CLAL. Figure A.2.2 – France – Ratio farm milk price/EU average farm milk price 2007-18
Source: European Commission. Note: Prices not adjusted by quality factors (i.e., fat and protein content as well as bacterial content).
58.6 57.7 56.5 57.3 58.4
41.4 42.3 43.5 42.7 41.6
0%
10%
20%
30%
40%
50%
60%
70%
80%
90%
100%
2013 2014 2015 2016 2017
Milk deliveries not exported Exported dairy products (ME)
0.60
0.70
0.80
0.90
1.00
1.10
1.20
1.30
2007
m01
2007
m04
2007
m07
2007
m10
2008
m01
2008
m04
2008
m07
2008
m10
2009
m01
2009
m04
2009
m07
2009
m10
2010
m01
2010
m04
2010
m07
2010
m10
2011
m01
2011
m04
2011
m07
2011
m10
2012
m01
2012
m04
2012
m07
2012
m10
2013
m01
2013
m04
2013
m07
2013
m10
2014
m01
2014
m04
2014
m07
2014
m10
2015
m01
2015
m04
2015
m07
2015
m10
2016
m01
2016
m04
2016
m07
2016
m10
2017
m01
2017
m04
2017
m07
2017
m10
2018
m01
2018
m04
2018
m07
2018
m10
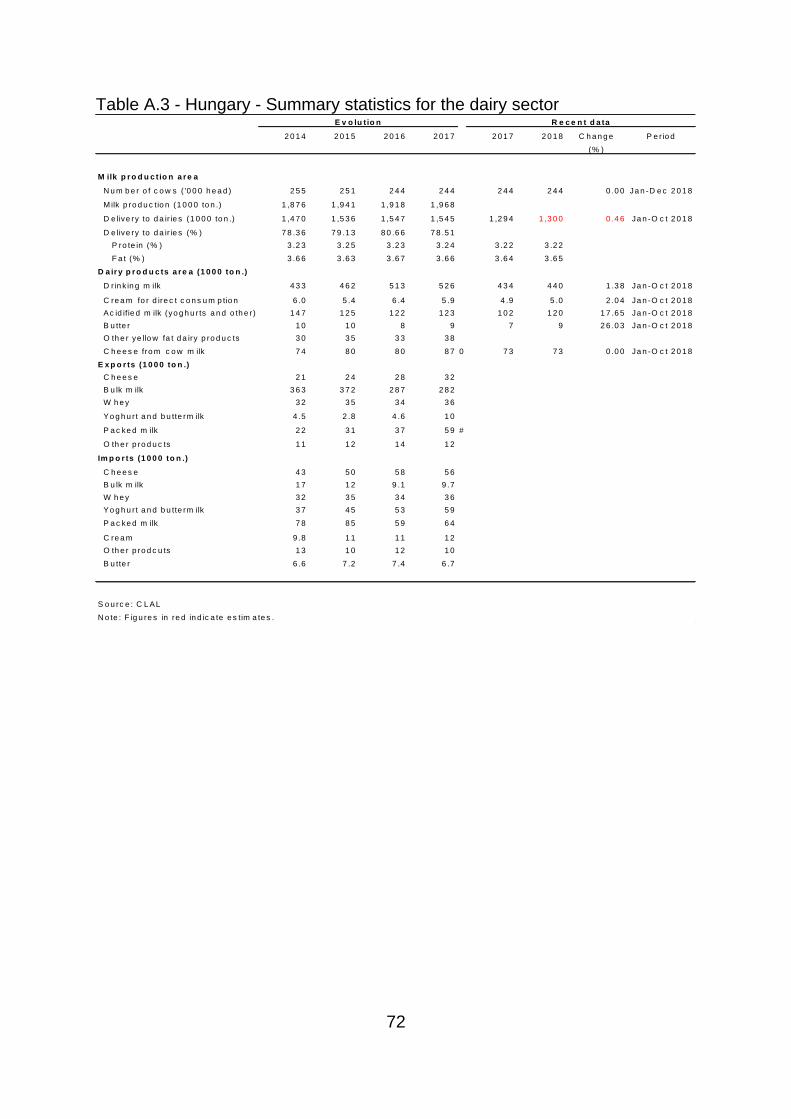
72
Table A.3 - Hungary - Summary statistics for the dairy sector
E v o lu t io n R e c e n t d a ta
2 0 1 4 2 0 1 5 2 0 1 6 2 0 1 7 2 0 1 7 2 0 1 8 C h a n g e P e r io d
(% )
M ilk p r o d u c t io n a r e a
N u m b e r o f c o w s ( '0 0 0 h e a d ) 2 5 5 2 5 1 2 4 4 2 4 4 2 4 4 2 4 4 0 .0 0 Ja n -D e c 2 0 1 8
M ilk p ro d u c tio n (1 0 0 0 to n .) 1 ,8 7 6 1 ,9 4 1 1 ,9 1 8 1 ,9 6 8
D e live ry to d a ir ie s (1 0 0 0 to n .) 1 ,4 7 0 1 ,5 3 6 1 ,5 4 7 1 ,5 4 5 1 ,2 9 4 1 ,3 0 0 0 .4 6 Ja n -O c t 2 0 1 8
D e live ry to d a ir ie s (% ) 7 8 .3 6 7 9 .1 3 8 0 .6 6 7 8 .5 1
P ro te in (% ) 3 .2 3 3 .2 5 3 .2 3 3 .2 4 3 .2 2 3 .2 2
F a t (% ) 3 .6 6 3 .6 3 3 .6 7 3 .6 6 3 .6 4 3 .6 5
D a ir y p r o d u c ts a r e a (1 0 0 0 to n .)
D r in k in g m ilk 4 3 3 4 6 2 5 1 3 5 2 6 4 3 4 4 4 0 1 .3 8 Ja n -O c t 2 0 1 8
C re a m fo r d ire c t c o n s u m p tio n 6 .0 5 .4 6 .4 5 .9 4 .9 5 .0 2 .0 4 Ja n -O c t 2 0 1 8
Ac id ifie d m ilk (yo g h u r ts a n d o th e r) 1 4 7 1 2 5 1 2 2 1 2 3 1 0 2 1 2 0 1 7 .6 5 Ja n -O c t 2 0 1 8
B u tte r 1 0 1 0 8 9 7 9 2 6 .0 3 Ja n -O c t 2 0 1 8
O th e r ye llo w fa t d a iry p ro d u c ts 3 0 3 5 3 3 3 8
C h e e s e fro m c o w m ilk 7 4 8 0 8 0 8 7 0 7 3 7 3 0 .0 0 Ja n -O c t 2 0 1 8
E x p o r ts (1 0 0 0 to n .)
C h e e s e 2 1 2 4 2 8 3 2
B u lk m ilk 3 6 3 3 7 2 2 8 7 2 8 2
W h e y 3 2 3 5 3 4 3 6
Yo g h u r t a n d b u tte rm ilk 4 .5 2 .8 4 .6 1 0
P a c ke d m ilk 2 2 3 1 3 7 5 9 #
O th e r p ro d u c ts 1 1 1 2 1 4 1 2
Im p o r ts (1 0 0 0 to n .)
C h e e s e 4 3 5 0 5 8 5 6
B u lk m ilk 1 7 1 2 9 .1 9 .7
W h e y 3 2 3 5 3 4 3 6
Yo g h u r t a n d b u tte rm ilk 3 7 4 5 5 3 5 9
P a c ke d m ilk 7 8 8 5 5 9 6 4
C re a m 9 .8 1 1 1 1 1 2
O th e r p ro d c u ts 1 3 1 0 1 2 1 0
B u tte r 6 .6 7 .2 7 .4 6 .7
S o u rc e : C L AL
N o te : F ig u re s in re d in d ic a te e s tim a te s .
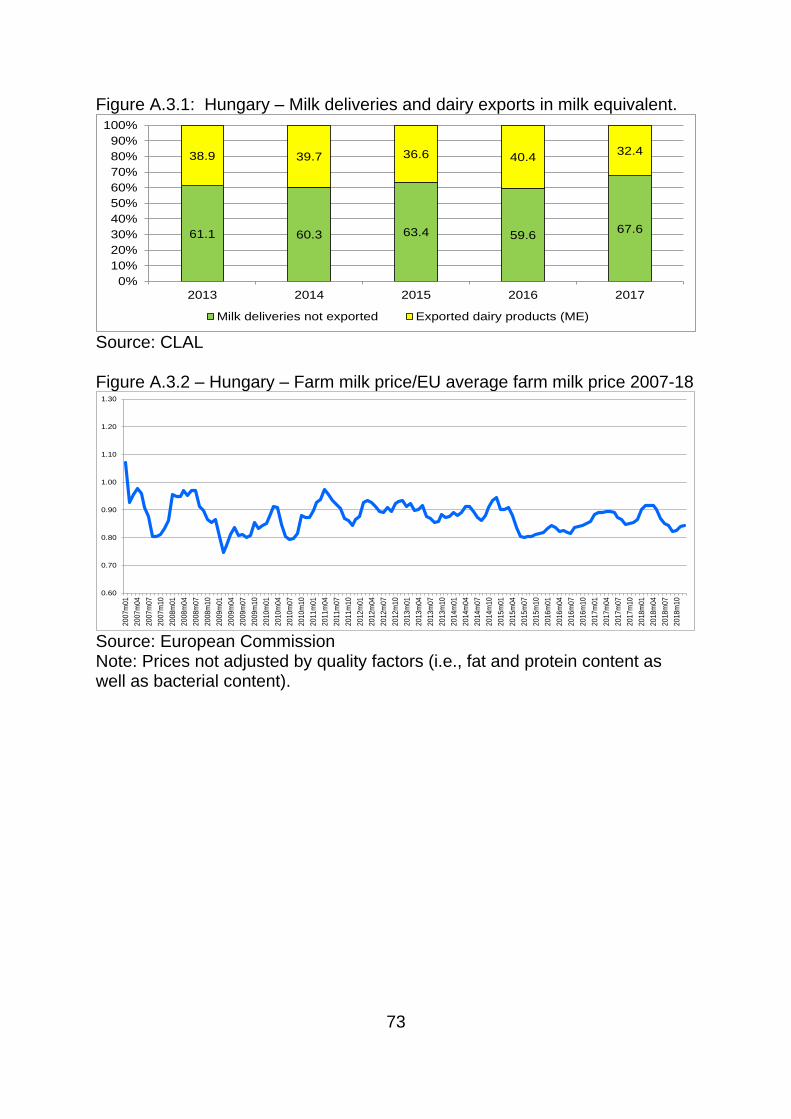
73
Figure A.3.1: Hungary – Milk deliveries and dairy exports in milk equivalent.
Source: CLAL Figure A.3.2 – Hungary – Farm milk price/EU average farm milk price 2007-18
Source: European Commission Note: Prices not adjusted by quality factors (i.e., fat and protein content as well as bacterial content).
61.1 60.3 63.4 59.667.6
38.9 39.7 36.6 40.432.4
0%
10%
20%
30%
40%
50%
60%
70%
80%
90%
100%
2013 2014 2015 2016 2017
Milk deliveries not exported Exported dairy products (ME)
0.60
0.70
0.80
0.90
1.00
1.10
1.20
1.30
20
07m
01
20
07m
04
20
07m
07
20
07m
10
20
08m
01
20
08m
04
20
08m
07
20
08m
10
20
09m
01
20
09m
04
20
09m
07
20
09m
10
20
10m
01
20
10m
04
20
10m
07
20
10m
10
20
11m
01
20
11m
04
20
11m
07
20
11m
10
20
12m
01
20
12m
04
20
12m
07
20
12m
10
20
13m
01
20
13m
04
20
13m
07
20
13m
10
20
14m
01
20
14m
04
20
14m
07
20
14m
10
20
15m
01
20
15m
04
20
15m
07
20
15m
10
20
16m
01
20
16m
04
20
16m
07
20
16m
10
20
17m
01
20
17m
04
20
17m
07
20
17m
10
20
18m
01
20
18m
04
20
18m
07
20
18m
10
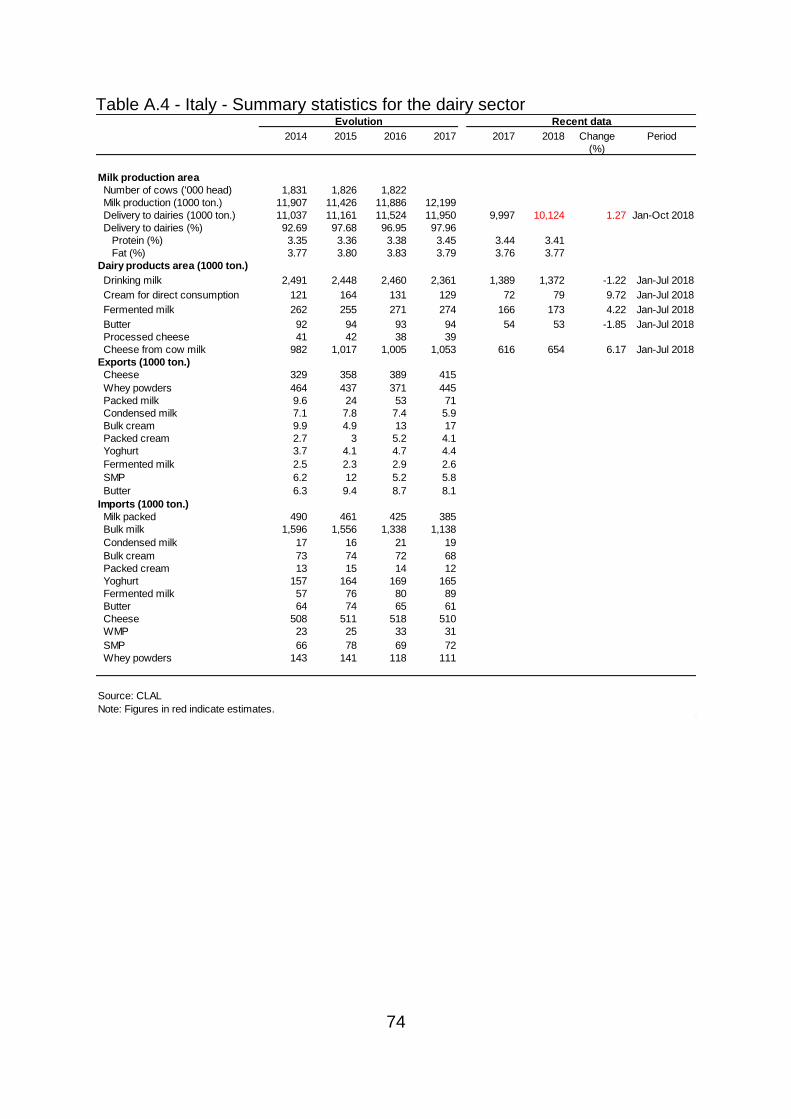
74
Table A.4 - Italy - Summary statistics for the dairy sector
Evolution Recent data
2014 2015 2016 2017 2017 2018 Change Period
(%)
Milk production area
Number of cows ('000 head) 1,831 1,826 1,822
Milk production (1000 ton.) 11,907 11,426 11,886 12,199
Delivery to dairies (1000 ton.) 11,037 11,161 11,524 11,950 9,997 10,124 1.27 Jan-Oct 2018
Delivery to dairies (%) 92.69 97.68 96.95 97.96
Protein (%) 3.35 3.36 3.38 3.45 3.44 3.41
Fat (%) 3.77 3.80 3.83 3.79 3.76 3.77
Dairy products area (1000 ton.)
Drinking milk 2,491 2,448 2,460 2,361 1,389 1,372 -1.22 Jan-Jul 2018
Cream for direct consumption 121 164 131 129 72 79 9.72 Jan-Jul 2018
Fermented milk 262 255 271 274 166 173 4.22 Jan-Jul 2018
Butter 92 94 93 94 54 53 -1.85 Jan-Jul 2018
Processed cheese 41 42 38 39
Cheese from cow milk 982 1,017 1,005 1,053 616 654 6.17 Jan-Jul 2018
Exports (1000 ton.)
Cheese 329 358 389 415
Whey powders 464 437 371 445
Packed milk 9.6 24 53 71
Condensed milk 7.1 7.8 7.4 5.9
Bulk cream 9.9 4.9 13 17
Packed cream 2.7 3 5.2 4.1
Yoghurt 3.7 4.1 4.7 4.4
Fermented milk 2.5 2.3 2.9 2.6
SMP 6.2 12 5.2 5.8
Butter 6.3 9.4 8.7 8.1
Imports (1000 ton.)
Milk packed 490 461 425 385
Bulk milk 1,596 1,556 1,338 1,138
Condensed milk 17 16 21 19
Bulk cream 73 74 72 68
Packed cream 13 15 14 12
Yoghurt 157 164 169 165
Fermented milk 57 76 80 89
Butter 64 74 65 61
Cheese 508 511 518 510
WMP 23 25 33 31
SMP 66 78 69 72
Whey powders 143 141 118 111
Source: CLAL
Note: Figures in red indicate estimates.
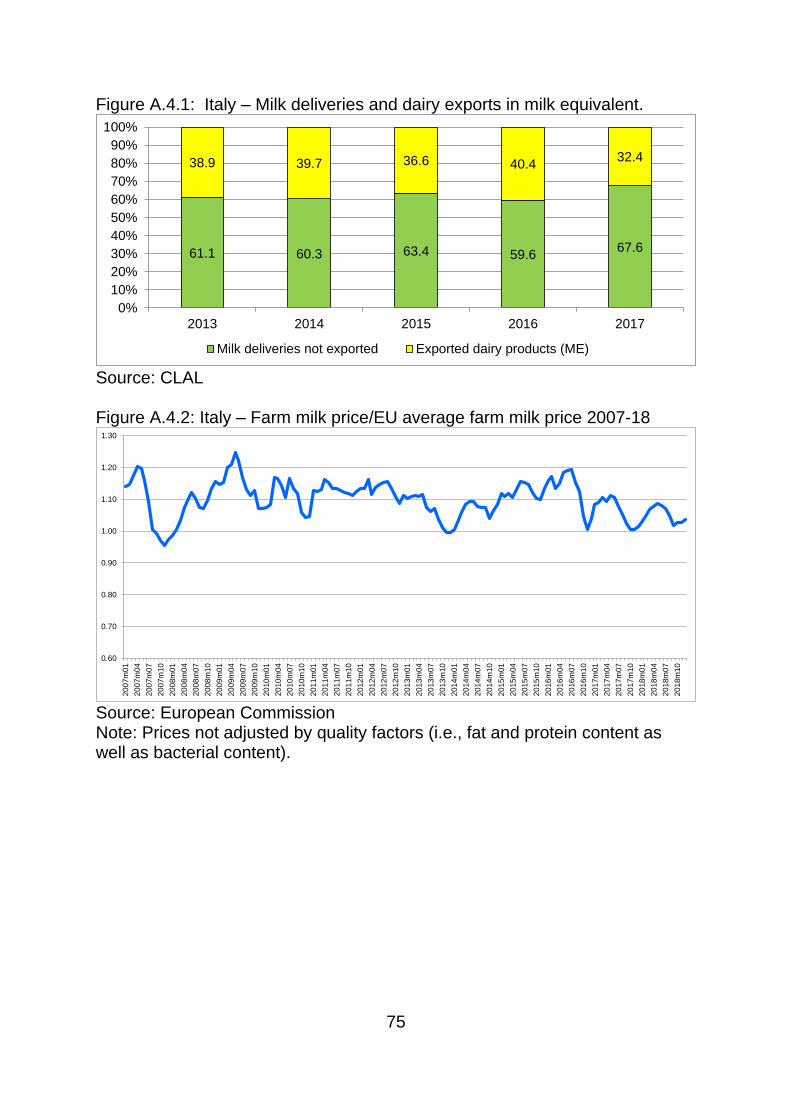
75
Figure A.4.1: Italy – Milk deliveries and dairy exports in milk equivalent.
Source: CLAL Figure A.4.2: Italy – Farm milk price/EU average farm milk price 2007-18
Source: European Commission Note: Prices not adjusted by quality factors (i.e., fat and protein content as well as bacterial content).
61.1 60.3 63.4 59.667.6
38.9 39.7 36.6 40.432.4
0%
10%
20%
30%
40%
50%
60%
70%
80%
90%
100%
2013 2014 2015 2016 2017
Milk deliveries not exported Exported dairy products (ME)
0.60
0.70
0.80
0.90
1.00
1.10
1.20
1.30
20
07m
01
20
07m
04
20
07m
07
20
07m
10
20
08m
01
20
08m
04
20
08m
07
20
08m
10
20
09m
01
20
09m
04
20
09m
07
20
09m
10
20
10m
01
20
10m
04
20
10m
07
20
10m
10
20
11m
01
20
11m
04
20
11m
07
20
11m
10
20
12m
01
20
12m
04
20
12m
07
20
12m
10
20
13m
01
20
13m
04
20
13m
07
20
13m
10
20
14m
01
20
14m
04
20
14m
07
20
14m
10
20
15m
01
20
15m
04
20
15m
07
20
15m
10
20
16m
01
20
16m
04
20
16m
07
20
16m
10
20
17m
01
20
17m
04
20
17m
07
20
17m
10
20
18m
01
20
18m
04
20
18m
07
20
18m
10
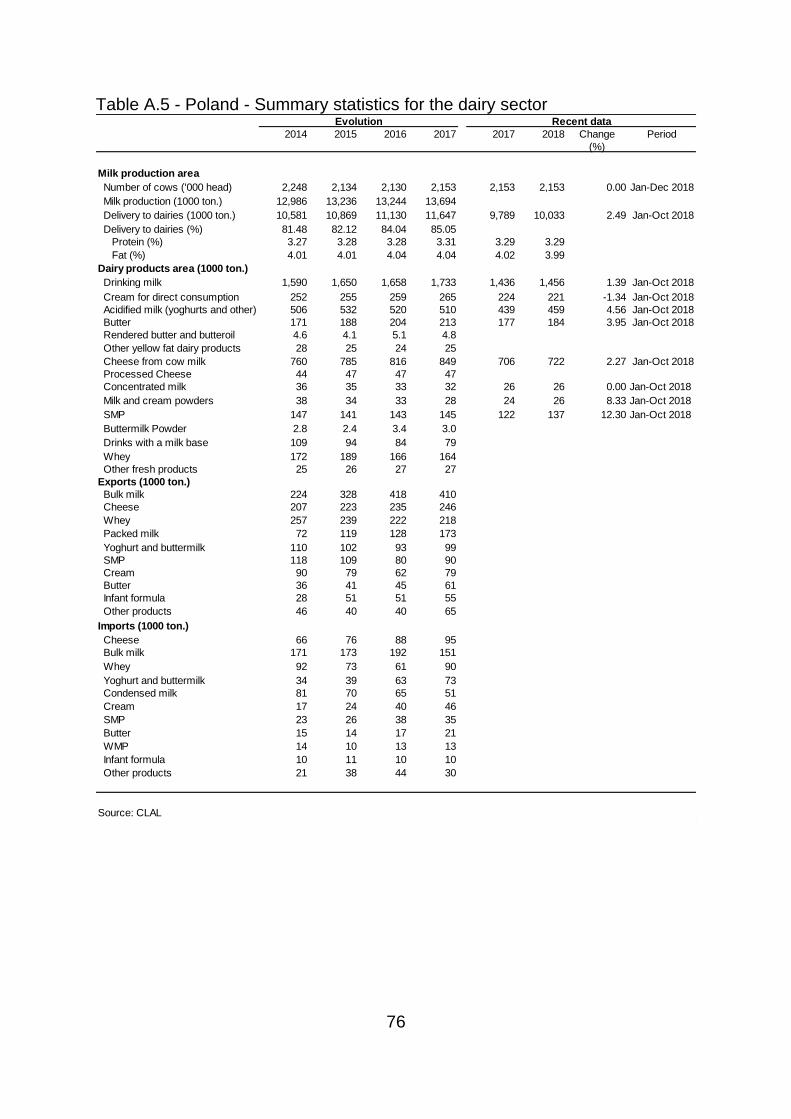
76
Table A.5 - Poland - Summary statistics for the dairy sector
Evolution Recent data
2014 2015 2016 2017 2017 2018 Change Period
(%)
Milk production area
Number of cows ('000 head) 2,248 2,134 2,130 2,153 2,153 2,153 0.00 Jan-Dec 2018
Milk production (1000 ton.) 12,986 13,236 13,244 13,694
Delivery to dairies (1000 ton.) 10,581 10,869 11,130 11,647 9,789 10,033 2.49 Jan-Oct 2018
Delivery to dairies (%) 81.48 82.12 84.04 85.05
Protein (%) 3.27 3.28 3.28 3.31 3.29 3.29
Fat (%) 4.01 4.01 4.04 4.04 4.02 3.99
Dairy products area (1000 ton.)
Drinking milk 1,590 1,650 1,658 1,733 1,436 1,456 1.39 Jan-Oct 2018
Cream for direct consumption 252 255 259 265 224 221 -1.34 Jan-Oct 2018
Acidified milk (yoghurts and other) 506 532 520 510 439 459 4.56 Jan-Oct 2018
Butter 171 188 204 213 177 184 3.95 Jan-Oct 2018
Rendered butter and butteroil 4.6 4.1 5.1 4.8
Other yellow fat dairy products 28 25 24 25
Cheese from cow milk 760 785 816 849 706 722 2.27 Jan-Oct 2018
Processed Cheese 44 47 47 47
Concentrated milk 36 35 33 32 26 26 0.00 Jan-Oct 2018
Milk and cream powders 38 34 33 28 24 26 8.33 Jan-Oct 2018
SMP 147 141 143 145 122 137 12.30 Jan-Oct 2018
Buttermilk Powder 2.8 2.4 3.4 3.0
Drinks with a milk base 109 94 84 79
Whey 172 189 166 164
Other fresh products 25 26 27 27
Exports (1000 ton.)
Bulk milk 224 328 418 410
Cheese 207 223 235 246
Whey 257 239 222 218
Packed milk 72 119 128 173
Yoghurt and buttermilk 110 102 93 99
SMP 118 109 80 90
Cream 90 79 62 79
Butter 36 41 45 61
Infant formula 28 51 51 55
Other products 46 40 40 65
Imports (1000 ton.)
Cheese 66 76 88 95
Bulk milk 171 173 192 151
Whey 92 73 61 90
Yoghurt and buttermilk 34 39 63 73
Condensed milk 81 70 65 51
Cream 17 24 40 46
SMP 23 26 38 35
Butter 15 14 17 21
WMP 14 10 13 13
Infant formula 10 11 10 10
Other products 21 38 44 30
Source: CLAL
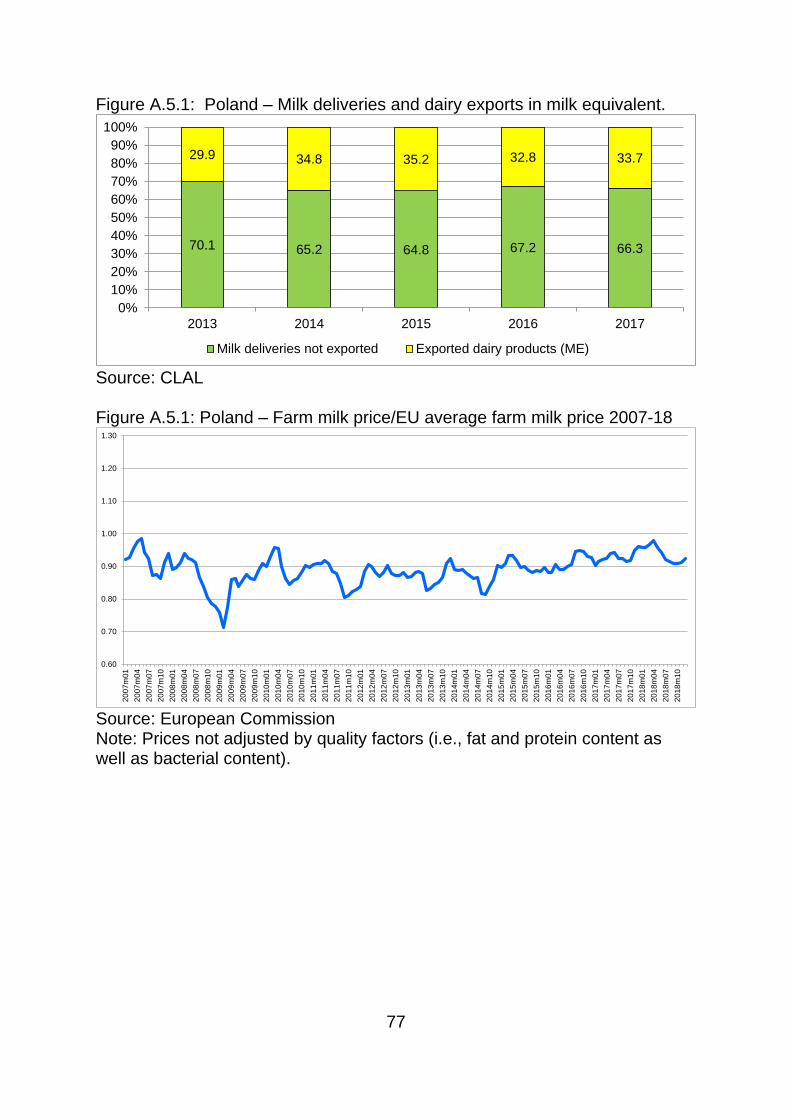
77
Figure A.5.1: Poland – Milk deliveries and dairy exports in milk equivalent.
Source: CLAL Figure A.5.1: Poland – Farm milk price/EU average farm milk price 2007-18
Source: European Commission Note: Prices not adjusted by quality factors (i.e., fat and protein content as well as bacterial content).
70.1 65.2 64.8 67.2 66.3
29.9 34.8 35.2 32.8 33.7
0%
10%
20%
30%
40%
50%
60%
70%
80%
90%
100%
2013 2014 2015 2016 2017
Milk deliveries not exported Exported dairy products (ME)
0.60
0.70
0.80
0.90
1.00
1.10
1.20
1.30
20
07m
01
20
07m
04
20
07m
07
20
07m
10
20
08m
01
20
08m
04
20
08m
07
20
08m
10
20
09m
01
20
09m
04
20
09m
07
20
09m
10
20
10m
01
20
10m
04
20
10m
07
20
10m
10
20
11m
01
20
11m
04
20
11m
07
20
11m
10
20
12m
01
20
12m
04
20
12m
07
20
12m
10
20
13m
01
20
13m
04
20
13m
07
20
13m
10
20
14m
01
20
14m
04
20
14m
07
20
14m
10
20
15m
01
20
15m
04
20
15m
07
20
15m
10
20
16m
01
20
16m
04
20
16m
07
20
16m
10
20
17m
01
20
17m
04
20
17m
07
20
17m
10
20
18m
01
20
18m
04
20
18m
07
20
18m
10
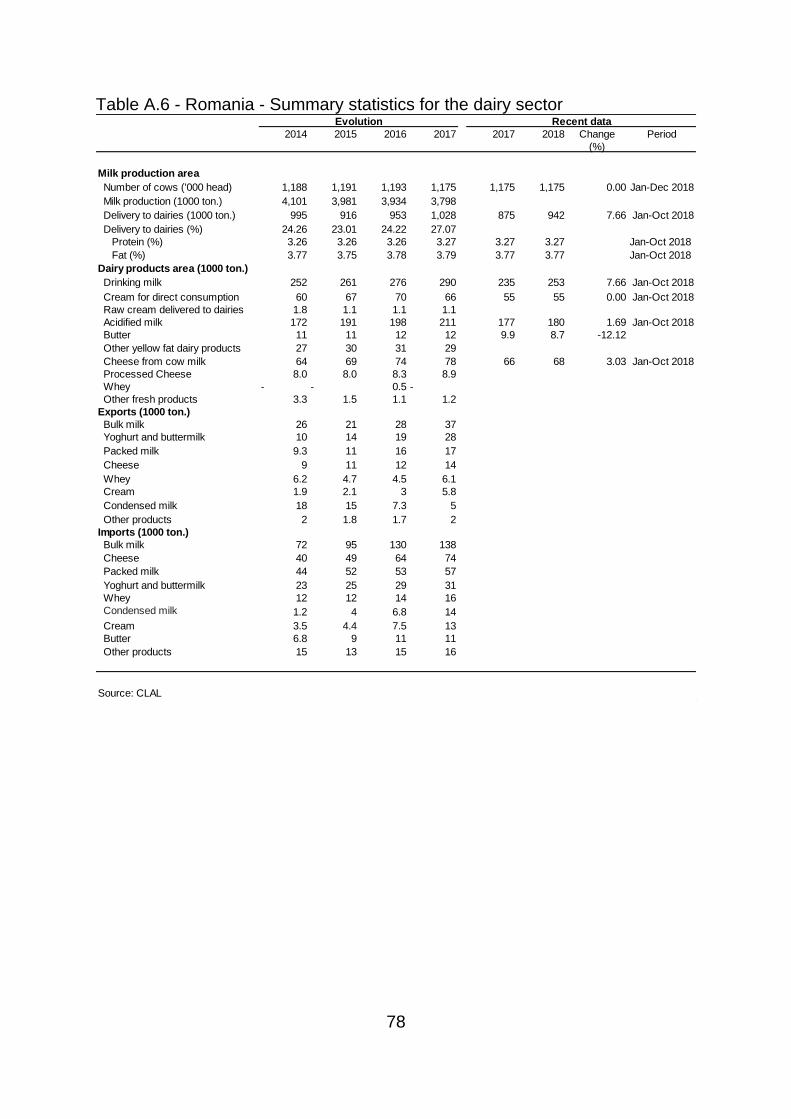
78
Table A.6 - Romania - Summary statistics for the dairy sector
Evolution Recent data
2014 2015 2016 2017 2017 2018 Change Period
(%)
Milk production area
Number of cows ('000 head) 1,188 1,191 1,193 1,175 1,175 1,175 0.00 Jan-Dec 2018
Milk production (1000 ton.) 4,101 3,981 3,934 3,798
Delivery to dairies (1000 ton.) 995 916 953 1,028 875 942 7.66 Jan-Oct 2018
Delivery to dairies (%) 24.26 23.01 24.22 27.07
Protein (%) 3.26 3.26 3.26 3.27 3.27 3.27 Jan-Oct 2018
Fat (%) 3.77 3.75 3.78 3.79 3.77 3.77 Jan-Oct 2018
Dairy products area (1000 ton.)
Drinking milk 252 261 276 290 235 253 7.66 Jan-Oct 2018
Cream for direct consumption 60 67 70 66 55 55 0.00 Jan-Oct 2018
Raw cream delivered to dairies 1.8 1.1 1.1 1.1
Acidified milk 172 191 198 211 177 180 1.69 Jan-Oct 2018
Butter 11 11 12 12 9.9 8.7 -12.12
Other yellow fat dairy products 27 30 31 29
Cheese from cow milk 64 69 74 78 66 68 3.03 Jan-Oct 2018
Processed Cheese 8.0 8.0 8.3 8.9
Whey - - 0.5 -
Other fresh products 3.3 1.5 1.1 1.2
Exports (1000 ton.)
Bulk milk 26 21 28 37
Yoghurt and buttermilk 10 14 19 28
Packed milk 9.3 11 16 17
Cheese 9 11 12 14
Whey 6.2 4.7 4.5 6.1
Cream 1.9 2.1 3 5.8
Condensed milk 18 15 7.3 5
Other products 2 1.8 1.7 2
Imports (1000 ton.)
Bulk milk 72 95 130 138
Cheese 40 49 64 74
Packed milk 44 52 53 57
Yoghurt and buttermilk 23 25 29 31
Whey 12 12 14 16
Condensed milk 1.2 4 6.8 14
Cream 3.5 4.4 7.5 13
Butter 6.8 9 11 11
Other products 15 13 15 16
Source: CLAL
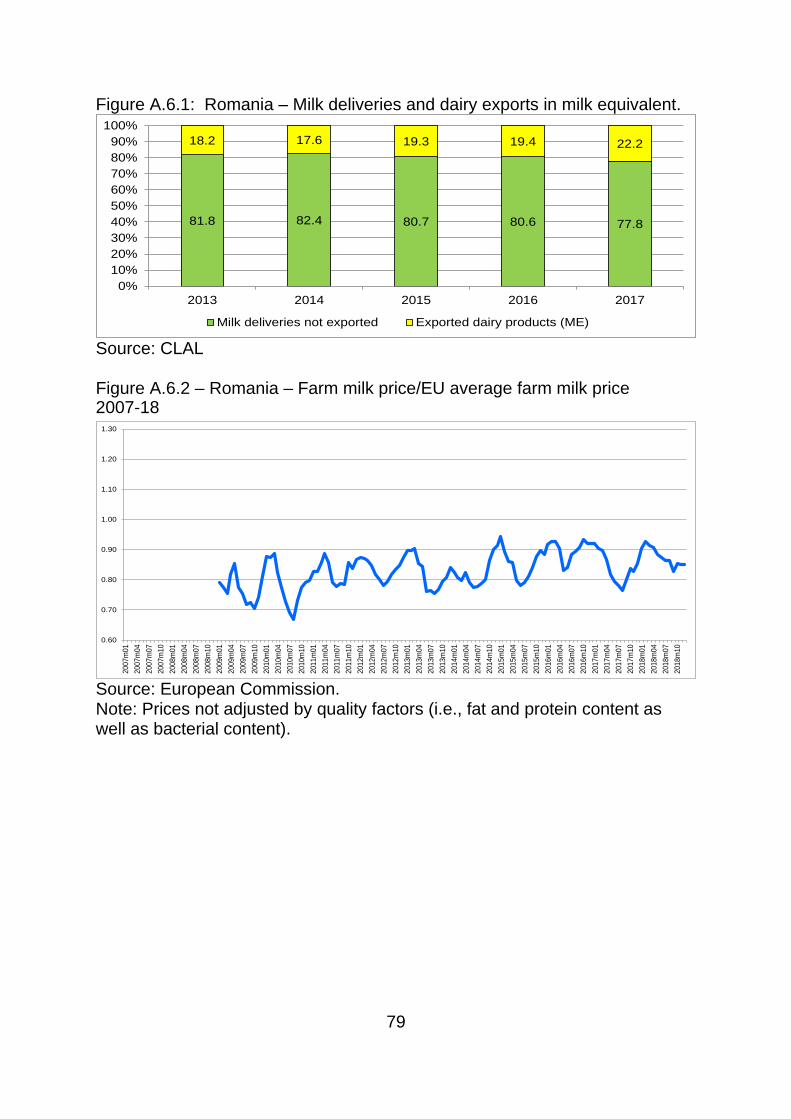
79
Figure A.6.1: Romania – Milk deliveries and dairy exports in milk equivalent.
Source: CLAL
Figure A.6.2 – Romania – Farm milk price/EU average farm milk price 2007-18
81.8 82.4 80.7 80.6 77.8
18.2 17.6 19.3 19.4 22.2
0%
10%
20%
30%
40%
50%
60%
70%
80%
90%
100%
2013 2014 2015 2016 2017
Milk deliveries not exported Exported dairy products (ME)
Source: European Commission. Note: Prices not adjusted by quality factors (i.e., fat and protein content as well as bacterial content).
0.60
0.70
0.80
0.90
1.00
1.10
1.20
1.30
20
07m
01
20
07m
04
20
07m
07
20
07m
10
20
08m
01
20
08m
04
20
08m
07
20
08m
10
20
09m
01
20
09m
04
20
09m
07
20
09m
10
20
10m
01
20
10m
04
20
10m
07
20
10m
10
20
11m
01
20
11m
04
20
11m
07
20
11m
10
20
12m
01
20
12m
04
20
12m
07
20
12m
10
20
13m
01
20
13m
04
20
13m
07
20
13m
10
20
14m
01
20
14m
04
20
14m
07
20
14m
10
20
15m
01
20
15m
04
20
15m
07
20
15m
10
20
16m
01
20
16m
04
20
16m
07
20
16m
10
20
17m
01
20
17m
04
20
17m
07
20
17m
10
20
18m
01
20
18m
04
20
18m
07
20
18m
10
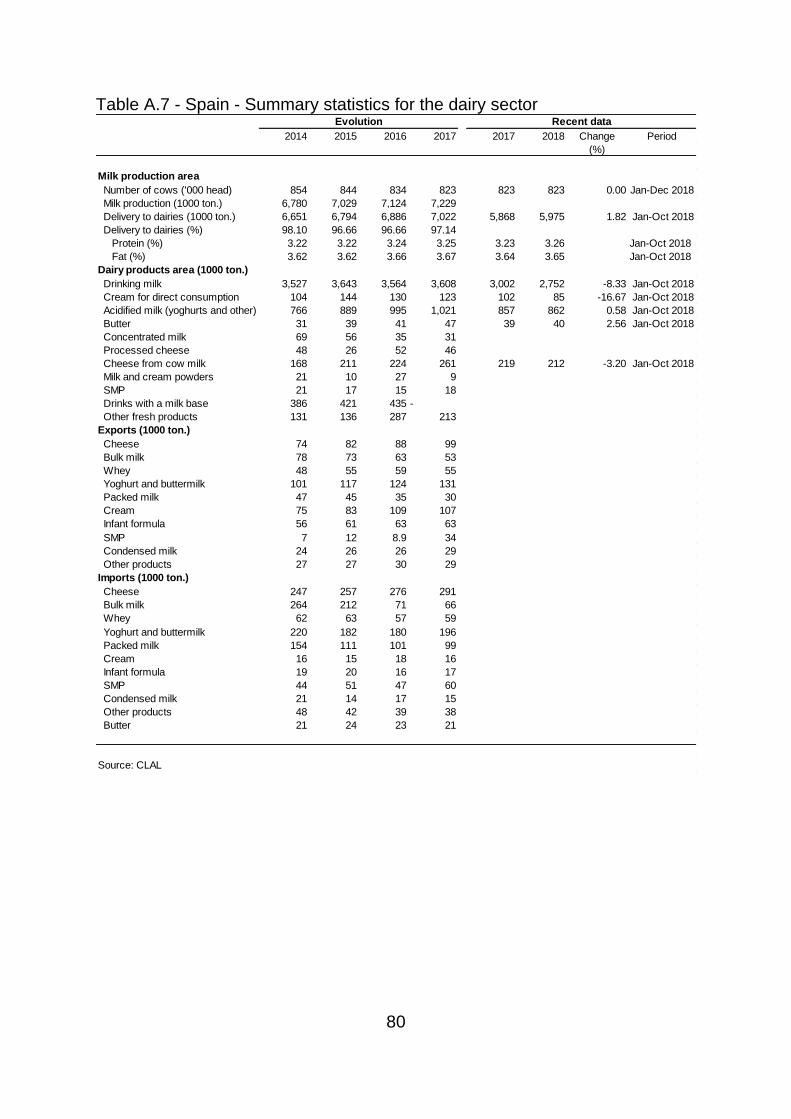
80
Table A.7 - Spain - Summary statistics for the dairy sector
Evolution Recent data
2014 2015 2016 2017 2017 2018 Change Period
(%)
Milk production area
Number of cows ('000 head) 854 844 834 823 823 823 0.00 Jan-Dec 2018
Milk production (1000 ton.) 6,780 7,029 7,124 7,229
Delivery to dairies (1000 ton.) 6,651 6,794 6,886 7,022 5,868 5,975 1.82 Jan-Oct 2018
Delivery to dairies (%) 98.10 96.66 96.66 97.14
Protein (%) 3.22 3.22 3.24 3.25 3.23 3.26 Jan-Oct 2018
Fat (%) 3.62 3.62 3.66 3.67 3.64 3.65 Jan-Oct 2018
Dairy products area (1000 ton.)
Drinking milk 3,527 3,643 3,564 3,608 3,002 2,752 -8.33 Jan-Oct 2018
Cream for direct consumption 104 144 130 123 102 85 -16.67 Jan-Oct 2018
Acidified milk (yoghurts and other) 766 889 995 1,021 857 862 0.58 Jan-Oct 2018
Butter 31 39 41 47 39 40 2.56 Jan-Oct 2018
Concentrated milk 69 56 35 31
Processed cheese 48 26 52 46
Cheese from cow milk 168 211 224 261 219 212 -3.20 Jan-Oct 2018
Milk and cream powders 21 10 27 9
SMP 21 17 15 18
Drinks with a milk base 386 421 435 -
Other fresh products 131 136 287 213
Exports (1000 ton.)
Cheese 74 82 88 99
Bulk milk 78 73 63 53
Whey 48 55 59 55
Yoghurt and buttermilk 101 117 124 131
Packed milk 47 45 35 30
Cream 75 83 109 107
Infant formula 56 61 63 63
SMP 7 12 8.9 34
Condensed milk 24 26 26 29
Other products 27 27 30 29
Imports (1000 ton.)
Cheese 247 257 276 291
Bulk milk 264 212 71 66
Whey 62 63 57 59
Yoghurt and buttermilk 220 182 180 196
Packed milk 154 111 101 99
Cream 16 15 18 16
Infant formula 19 20 16 17
SMP 44 51 47 60
Condensed milk 21 14 17 15
Other products 48 42 39 38
Butter 21 24 23 21
Source: CLAL
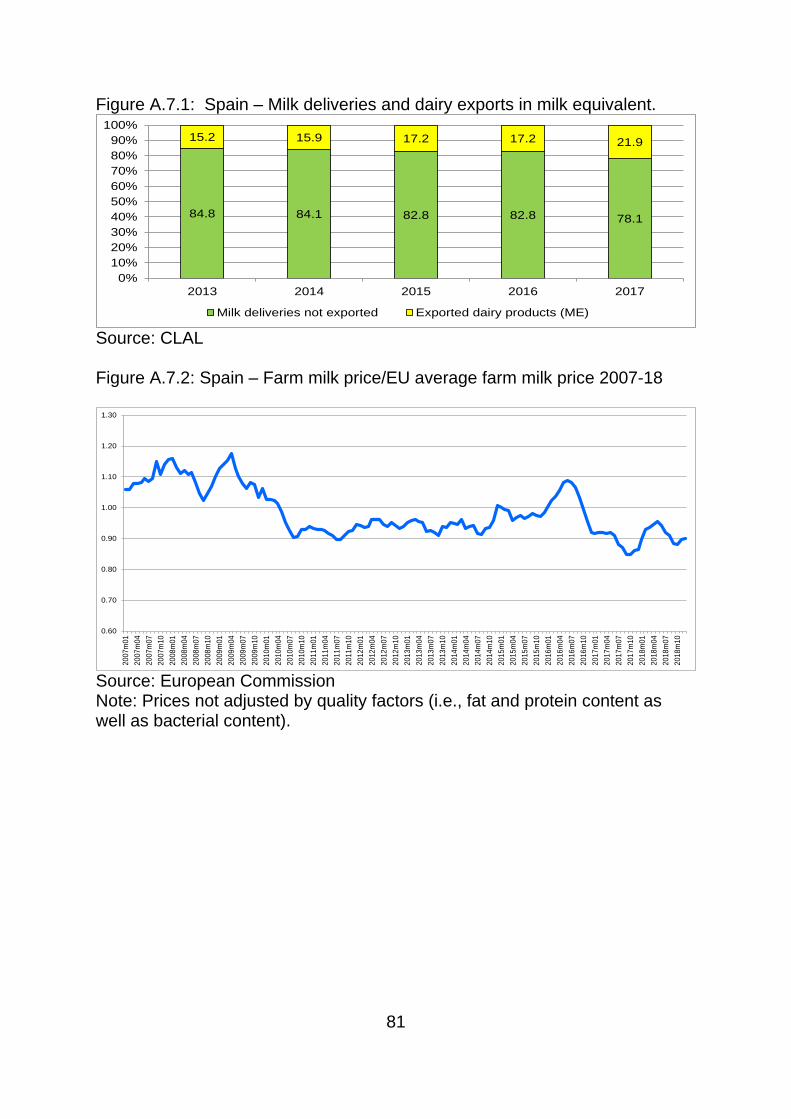
81
Figure A.7.1: Spain – Milk deliveries and dairy exports in milk equivalent.
Source: CLAL Figure A.7.2: Spain – Farm milk price/EU average farm milk price 2007-18
Source: European Commission Note: Prices not adjusted by quality factors (i.e., fat and protein content as well as bacterial content).
84.8 84.1 82.8 82.8 78.1
15.2 15.9 17.2 17.2 21.9
0%
10%
20%
30%
40%
50%
60%
70%
80%
90%
100%
2013 2014 2015 2016 2017
Milk deliveries not exported Exported dairy products (ME)
0.60
0.70
0.80
0.90
1.00
1.10
1.20
1.30
20
07m
01
20
07m
04
20
07m
07
20
07m
10
20
08m
01
20
08m
04
20
08m
07
20
08m
10
20
09m
01
20
09m
04
20
09m
07
20
09m
10
20
10m
01
20
10m
04
20
10m
07
20
10m
10
20
11m
01
20
11m
04
20
11m
07
20
11m
10
20
12m
01
20
12m
04
20
12m
07
20
12m
10
20
13m
01
20
13m
04
20
13m
07
20
13m
10
20
14m
01
20
14m
04
20
14m
07
20
14m
10
20
15m
01
20
15m
04
20
15m
07
20
15m
10
20
16m
01
20
16m
04
20
16m
07
20
16m
10
20
17m
01
20
17m
04
20
17m
07
20
17m
10
20
18m
01
20
18m
04
20
18m
07
20
18m
10
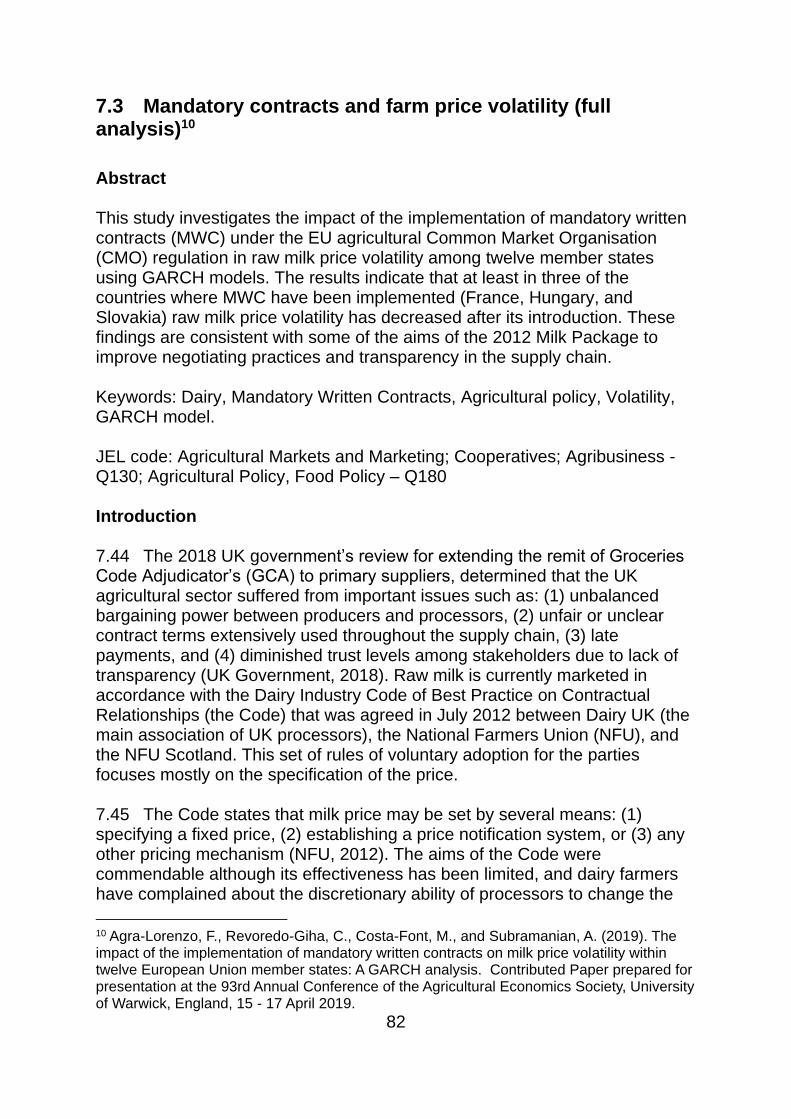
82
7.3 Mandatory contracts and farm price volatility (full analysis)10
Abstract This study investigates the impact of the implementation of mandatory written contracts (MWC) under the EU agricultural Common Market Organisation (CMO) regulation in raw milk price volatility among twelve member states using GARCH models. The results indicate that at least in three of the countries where MWC have been implemented (France, Hungary, and Slovakia) raw milk price volatility has decreased after its introduction. These findings are consistent with some of the aims of the 2012 Milk Package to improve negotiating practices and transparency in the supply chain. Keywords: Dairy, Mandatory Written Contracts, Agricultural policy, Volatility, GARCH model. JEL code: Agricultural Markets and Marketing; Cooperatives; Agribusiness - Q130; Agricultural Policy, Food Policy – Q180 Introduction 7.44 The 2018 UK government’s review for extending the remit of Groceries Code Adjudicator’s (GCA) to primary suppliers, determined that the UK agricultural sector suffered from important issues such as: (1) unbalanced bargaining power between producers and processors, (2) unfair or unclear contract terms extensively used throughout the supply chain, (3) late payments, and (4) diminished trust levels among stakeholders due to lack of transparency (UK Government, 2018). Raw milk is currently marketed in accordance with the Dairy Industry Code of Best Practice on Contractual Relationships (the Code) that was agreed in July 2012 between Dairy UK (the main association of UK processors), the National Farmers Union (NFU), and the NFU Scotland. This set of rules of voluntary adoption for the parties focuses mostly on the specification of the price. 7.45 The Code states that milk price may be set by several means: (1) specifying a fixed price, (2) establishing a price notification system, or (3) any other pricing mechanism (NFU, 2012). The aims of the Code were commendable although its effectiveness has been limited, and dairy farmers have complained about the discretionary ability of processors to change the
10 Agra-Lorenzo, F., Revoredo-Giha, C., Costa-Font, M., and Subramanian, A. (2019). The impact of the implementation of mandatory written contracts on milk price volatility within twelve European Union member states: A GARCH analysis. Contributed Paper prepared for presentation at the 93rd Annual Conference of the Agricultural Economics Society, University of Warwick, England, 15 - 17 April 2019.
83
price giving only a 30-day notice and transferring in this way the market risks to producers, whilst establishing notice periods of up to 12 months for the farmer to terminate a contract. In spite of the broad engagement in this voluntary Code throughout the chain, as the conclusions of the consultation on the extension of the remit of the GCA made clear, its use has not been enough to solve the formerly stated issues within the sector. As a result, the UK Government has announced plans to introduce mandatory written contracts (MWCs) in the UK dairy sector. MWCs were introduced in EU legislation in 2012 with the aim of improving contractual negotiation in the Supply chain. The UK government has referred explicitly to this regulation when announced its plans for introducing MWCs in the UK. In order to adequately inform the necessary secondary legislation to do that, the UK Government announced in February 2018 the call for a formal consultation process by March the same year (UK Government, 2018). This call has come to a standstill due to the Brexit process. 7.46 MWCs have been implemented in some member states, but to our knowledge there is no evidence about their impact on milk price volatility. This study uses the Generalised Autoregressive Conditional Heteroscedasticity (GARCH) model to evaluate whether milk price volatility has changed after the implementation of MWCs in twelve EU member states, using monthly data on farmgate milk prices sourced from the European Milk Market Observatory. 7.47 The structure of the paper is organised as follows. First, the European Union agricultural regulation as to the MWCs and its level of implementation are briefly reviewed. Second, the empirical methodology used in this study is explained, with some references about the concept of volatility and the data utilised are shown. Third, the findings are presented and discussed. Finally, some remarks are offered to conclude. The Milk Package 7.48 The price crisis that occurred within agricultural commodity markets in the period from 2007 to 2009 and the subsequent collapse of dairy product prices in 2008 and 2009, triggered a situation of high milk price volatility that put into question the viability of many European milk producers. This problematic situation prompted a thorough examination of the dairy sector by the European Union (EU). 7.49 The assessment was commissioned to a group of experts set up in October 2009 (i.e., High-Level Expert Group on Milk (HLG)). The main aim of this group of experts was to produce proposals for a long-term common strategy for the EU milk sector. The HLG reported in 2010 and its main conclusion was that despite the heterogeneity of EU’s dairy supply chains, there existed throughout all the member states a growing imbalance in bargaining power as to the commercial relationships between relatively small
84
and disunited milk producers and an increasingly concentrated dairy processing industry. 7.50 These situations of power imbalance had led to multiple examples of unfair commercial practices that had prompted issues of price transmission and consequently rigidities along the EU’s dairy supply chains. These rigidities had in turn exacerbated the impact of the 2008/09 increased raw milk price volatility upon milk producers (European Commission, 2012). Additionally, the HLG signalled that similar shocks might occur recurrently in the future due to the elimination of the EU milk quota system. 7.51 The smooth phasing-out of milk quotas that had begun in 2009 to be fully completed in April 2015, was expected to pave the way for a more liberalised dairy market (European Commission, 2012). Accordingly, the European markets might be increasingly exposed to greater influence from international dairy commodity markets, which historically had suffered from higher volatility (Costa-Font and Revoredo-Giha, 2018; O'Connor and Keane, 2011). 7.52 The EU reacted by regulating the dairy sector in what has become known as the Milk Package. Based on the recommendations from the HLG, the Milk Package regulation was enacted in 2012 and later on integrated within the EU agricultural Common Market Organisation (CMO) regulation in 2013 (European Commission, 2013). The CMO enabled member states the development into their internal law of a set of provisions aimed at reinforcing the position of dairy producers within the supply chain. These provisions constituted an especial designed framework for the European raw milk markets that extended over the European competition rules. 7.53 The main content of the aforementioned provisions might be summarised as follows: (1) the implementation of MWCs to regulate the transactions between milk producers and first purchasers of raw milk was made available to member states in a discretionary basis; (2) compulsory recognition of new dairy producer’s organisations (PO) and their joint-bargaining capability was imposed so as to strengthen farmer’s bargaining position facing processors; (3) member states must encourage and facilitate the creation of inter-branch organisations (IBO) to improve knowledge and transparency by advisory and data publication activities; and finally, (4) in order to increase transparency as to the gathering of market data, the new regulation provided a legal basis to require monthly information on the amount of milk received from the first purchasers of milk. The European regulators considered that the use of MWCs could efficiently tackle price transmission issues by increasing awareness of market signals so as to better balance the supply and demand of milk (European Commission, 2012). It must be highlighted that the CMO regulation left the co-operatives out of its scope of
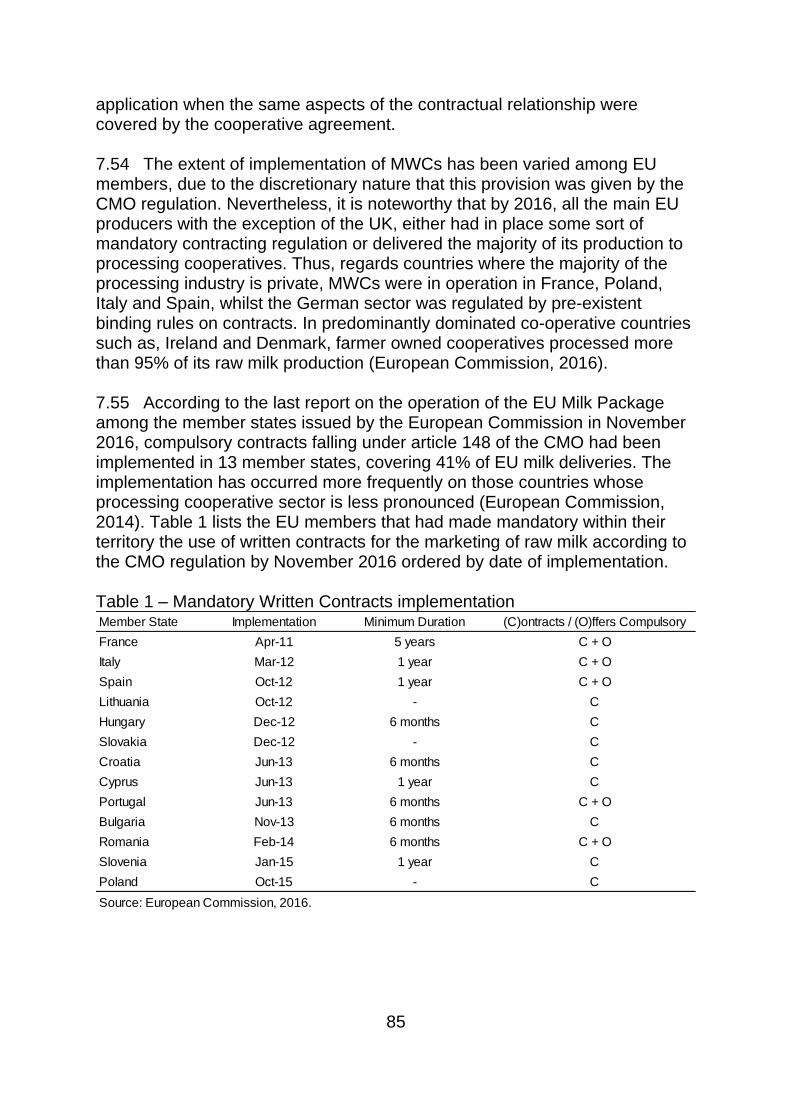
85
application when the same aspects of the contractual relationship were covered by the cooperative agreement. 7.54 The extent of implementation of MWCs has been varied among EU members, due to the discretionary nature that this provision was given by the CMO regulation. Nevertheless, it is noteworthy that by 2016, all the main EU producers with the exception of the UK, either had in place some sort of mandatory contracting regulation or delivered the majority of its production to processing cooperatives. Thus, regards countries where the majority of the processing industry is private, MWCs were in operation in France, Poland, Italy and Spain, whilst the German sector was regulated by pre-existent binding rules on contracts. In predominantly dominated co-operative countries such as, Ireland and Denmark, farmer owned cooperatives processed more than 95% of its raw milk production (European Commission, 2016). 7.55 According to the last report on the operation of the EU Milk Package among the member states issued by the European Commission in November 2016, compulsory contracts falling under article 148 of the CMO had been implemented in 13 member states, covering 41% of EU milk deliveries. The implementation has occurred more frequently on those countries whose processing cooperative sector is less pronounced (European Commission, 2014). Table 1 lists the EU members that had made mandatory within their territory the use of written contracts for the marketing of raw milk according to the CMO regulation by November 2016 ordered by date of implementation. Table 1 – Mandatory Written Contracts implementation
Member State Implementation Minimum Duration (C)ontracts / (O)ffers Compulsory
France Apr-11 5 years C + O
Italy Mar-12 1 year C + O
Spain Oct-12 1 year C + O
Lithuania Oct-12 - C
Hungary Dec-12 6 months C
Slovakia Dec-12 - C
Croatia Jun-13 6 months C
Cyprus Jun-13 1 year C
Portugal Jun-13 6 months C + O
Bulgaria Nov-13 6 months C
Romania Feb-14 6 months C + O
Slovenia Jan-15 1 year C
Poland Oct-15 - C
Source: European Commission, 2016.
86
Agricultural markets volatility and its analysis 7.56 Volatility is a directionless measure of the variability of a price over time (Gilbert and Morgan, 2010). Price movements are a sine qua non requirement embedded in the market’s clearing mechanism that enables demand and supply of any product to match. Price changes may reflect improvements in competitive advantages along the supply chain, as they may also disclose changing preferences on consumers that allow for efficient relocation of resources (O'Connor and Keane, 2011). 7.57 The clearing mechanism usually generates well-stablished smooth price movements that reflect market’s economic core principles. However, unexpected large price variations may occur attending to other multiple factors, accordingly markets that behave in that manner are described as volatile (FAO and OECD, 2011). Impacts caused by excessive market volatility may be varied. Some examples could be among others; inefficient investment induced by risk averse behaviour, non-optimal production decision-making, or food security issues (FAO and OECD, 2011; Piot-Lepetit and M'Bareck, 2011). 7.58 Most agricultural markets possess characteristics that may stimulate volatility. It is common that agricultural markets exhibit price-inelastic demand and supply functions where quantities supplied and demanded vary less than price in proportion. On the other hand, agricultural output may be hugely dependent on weather conditions. As a result of both circumstances small variations in production may prompt huge variations in price (Piot-Lepetit and M'Bareck, 2011). Consequently, observation of price volatility has been highlighted by international organisations and academics as an indispensable input tool for agricultural stakeholders and policymakers alike (FAO and OECD, 2011; Gilbert and Morgan, 2010; Yang, et al., 2001). 7.59 There is abundant economic literature on the analysis of agricultural markets that has focused on the modelling of time-series of commodity prices (Piot-Lepetit and M'Bareck, 2011). 7.60 The classical methodology used by econometricians to analyse time-series consisted in decomposing a series of historical prices into four components; namely: trend, seasonal, cyclical and irregular component (Enders, 2015). The long-run evolution of the series would be explained by the trend component that corresponds with the economic fundamentals of the market showed by the evolution of its price’s mean. Recurrent wavelike price movements are captured by the seasonal and the cyclical components (Enders, 2015; Piot-Lepetit and M'Bareck, 2011). 7.61 The cobweb theorem may be used to illustrate a cyclical movement in the raw milk market generated by a lagged response. According to this
87
theorem, farmers would set their future supply in terms of the price in the current period oversupplying the market in the following period and triggering a fall in prices, subsequently the lag prompted between their decision and the actual demand of milk in the market results in the cycle until the market adjust in the long term (Hansen and Li, 2017). In the same way, seasonal movements may be explained in the dairy sector by the biology of the livestock and the variations of feeding costs and feeding systems throughout the climatic year (Bergmann et al., 2015). Finally, the irregular components or residuals of a time-series are stochastic and usually do not follow a defined pattern in the long-run (Enders, 2015). 7.62 Price movements that follow trend, cyclical or seasonal components are predictable in the long-run, although they may lack interest for analysis in the short-run (Gilbert and Morgan, 2010). Conversely, in spite of the stochastic nature of the irregular component often there exists a positive correlation between the consecutive values of this irregular component in the short-run. As Box et al. observed: “typically, adjacent observations are dependent” (Box, et al., 2016, p. 1). That is, normally a high value in a given period is followed by another high value in the following, as well as low values normally follow low values too. This stylised fact, proper of some time series data has been commonly referred to as volatility clustering (Box, et al., 2016). As a result, the analysis of this irregular component may be of great interest for short-run forecasting, and consequently for the analysis of price volatility (Enders, 2015). This study will focus now on those models that enable to study the evolution of the irregular component of a time-series. 7.63 One of the main assumptions of conventional econometric time-series models is that the variance of the irregular term must be constant. However, the existence of alternating periods of high and low volatility, often seen in some series of economic data, suggests that the assumption of constant variance (homoscedasticity) is not always appropriate (Box, et al., 2016). The Generalized Autoregressive Conditional Heteroscedasticity (GARCH) model developed by Bollerslev (1986) extended the ARCH model introduced by Engle (Engle, 1982). It allows modelling the conditional variance when there exists volatility clustering in the series (Box, et al., 2016). 7.64 In an Autoregressive Moving Average (ARMA) process, the unconditional mean remains constant over time whilst the conditional mean changes as a function of its own lagged values. Similarly, the ARCH model assumes that the unconditional variance of the disturbance process is constant whilst the conditional variance varies as an autoregressive function of past squared errors. Bollerslev generalised the ARCH model, then GARCH, by describing the conditional variance itself as an ARMA process, that is allowing for both autoregressive and moving average components in the heteroskedastic variance formula (Box, Jenkins, Reinsel, and Ljung, 2016; Enders, 2015).
88
7.65 The GARCH model requires the conditional variance to be positive, imposing non-negativity constraints on the estimated parameters (Kirchgässner, et al., 2013). In addition, the model also imposes stationarity constraints over the process that require the sum of the estimated parameters of the conditional variance to be lesser than 1 (O'Connor and Keane, 2011). If the process is stable the conditional variance in the long-run will tend to equal the unconditional variance, but the model will still capture periods of high and low volatility. When the sum of the parameters exceeds 1, it suggests an explosive series that will deviate from the mean in the long run (Enders, 2015). Data used in the analysis 7.66 The data consisted of historical time-series of monthly averages prices of raw cow’s milk at real fat content paid to milk producers expressed in euros per 100 kilograms.11 The data were obtained from the European Commission’s Milk Market Observatory on October 2018 for all those EU members that had implemented in their internal regulation the utilisation of MWCs for the marketing of raw milk (European Commission, 2018). The period covered in this study extends from January 2003 to August 2018, except for Bulgaria and Romania, whose series start at January 2007 and 2009 respectively due to data availability. Croatia was not been included in this analysis due to lack of data before the implementation of MWCs in June 2013. 7.67 The study of price volatility deals with the measurement of its variation over time. Hence, volatility analysis must focus on the second moment or variance of the probability distribution of the data set prices, or any derived transformation from it (Gilbert and Morgan, 2010). Conventionally, volatility studies prefer to use the standard deviation of logarithmic prices as it provides a unit-free comparable measure. In addition, economic price time-series may exhibit trends which may affect price’s volatility beyond the influence of the proper price’s variance process. Measuring volatility as the standard deviation of price returns, that is the standard deviation of changes in logarithmic prices, eliminates this possible influence without imposing unwanted restrictions on the series to eliminate the trend (Gilbert and Morgan, 2010). This study, therefore, used the log returns of monthly average prices of raw milk to asses how the implementation of MWCs has affected prices’ volatility. Table 2 provides descriptive statistics of the series under observation.
11 Note that because the purpose of the analysis was to analyse the volatility of the actual price received by the farmers, the price series were not standardised by solids content (e.g., butterfat content).
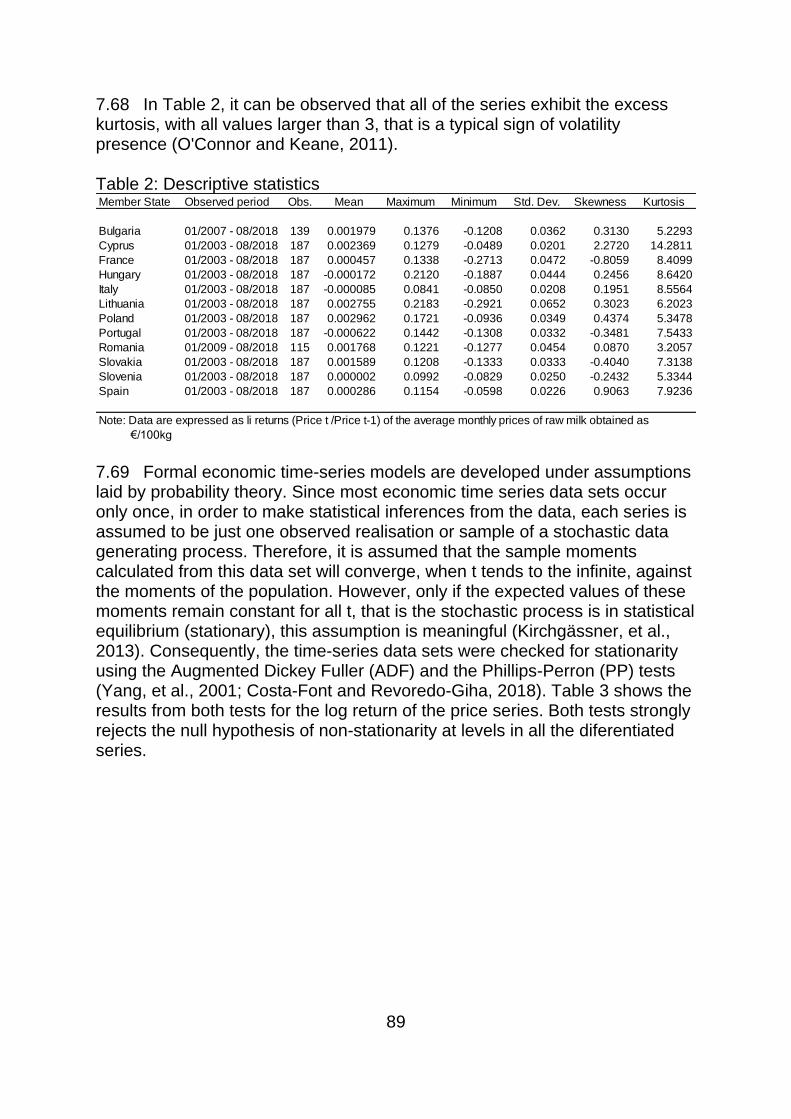
89
7.68 In Table 2, it can be observed that all of the series exhibit the excess kurtosis, with all values larger than 3, that is a typical sign of volatility presence (O'Connor and Keane, 2011). Table 2: Descriptive statistics
7.69 Formal economic time-series models are developed under assumptions laid by probability theory. Since most economic time series data sets occur only once, in order to make statistical inferences from the data, each series is assumed to be just one observed realisation or sample of a stochastic data generating process. Therefore, it is assumed that the sample moments calculated from this data set will converge, when t tends to the infinite, against the moments of the population. However, only if the expected values of these moments remain constant for all t, that is the stochastic process is in statistical equilibrium (stationary), this assumption is meaningful (Kirchgässner, et al., 2013). Consequently, the time-series data sets were checked for stationarity using the Augmented Dickey Fuller (ADF) and the Phillips-Perron (PP) tests (Yang, et al., 2001; Costa-Font and Revoredo-Giha, 2018). Table 3 shows the results from both tests for the log return of the price series. Both tests strongly rejects the null hypothesis of non-stationarity at levels in all the diferentiated series.
Member State Observed period Obs. Mean Maximum Minimum Std. Dev. Skewness Kurtosis
Bulgaria 01/2007 - 08/2018 139 0.001979 0.1376 -0.1208 0.0362 0.3130 5.2293
Cyprus 01/2003 - 08/2018 187 0.002369 0.1279 -0.0489 0.0201 2.2720 14.2811
France 01/2003 - 08/2018 187 0.000457 0.1338 -0.2713 0.0472 -0.8059 8.4099
Hungary 01/2003 - 08/2018 187 -0.000172 0.2120 -0.1887 0.0444 0.2456 8.6420
Italy 01/2003 - 08/2018 187 -0.000085 0.0841 -0.0850 0.0208 0.1951 8.5564
Lithuania 01/2003 - 08/2018 187 0.002755 0.2183 -0.2921 0.0652 0.3023 6.2023
Poland 01/2003 - 08/2018 187 0.002962 0.1721 -0.0936 0.0349 0.4374 5.3478
Portugal 01/2003 - 08/2018 187 -0.000622 0.1442 -0.1308 0.0332 -0.3481 7.5433
Romania 01/2009 - 08/2018 115 0.001768 0.1221 -0.1277 0.0454 0.0870 3.2057
Slovakia 01/2003 - 08/2018 187 0.001589 0.1208 -0.1333 0.0333 -0.4040 7.3138
Slovenia 01/2003 - 08/2018 187 0.000002 0.0992 -0.0829 0.0250 -0.2432 5.3344
Spain 01/2003 - 08/2018 187 0.000286 0.1154 -0.0598 0.0226 0.9063 7.9236
Note: Data are expressed as li returns (Price t /Price t-1) of the average monthly prices of raw milk obtained as
€/100kg
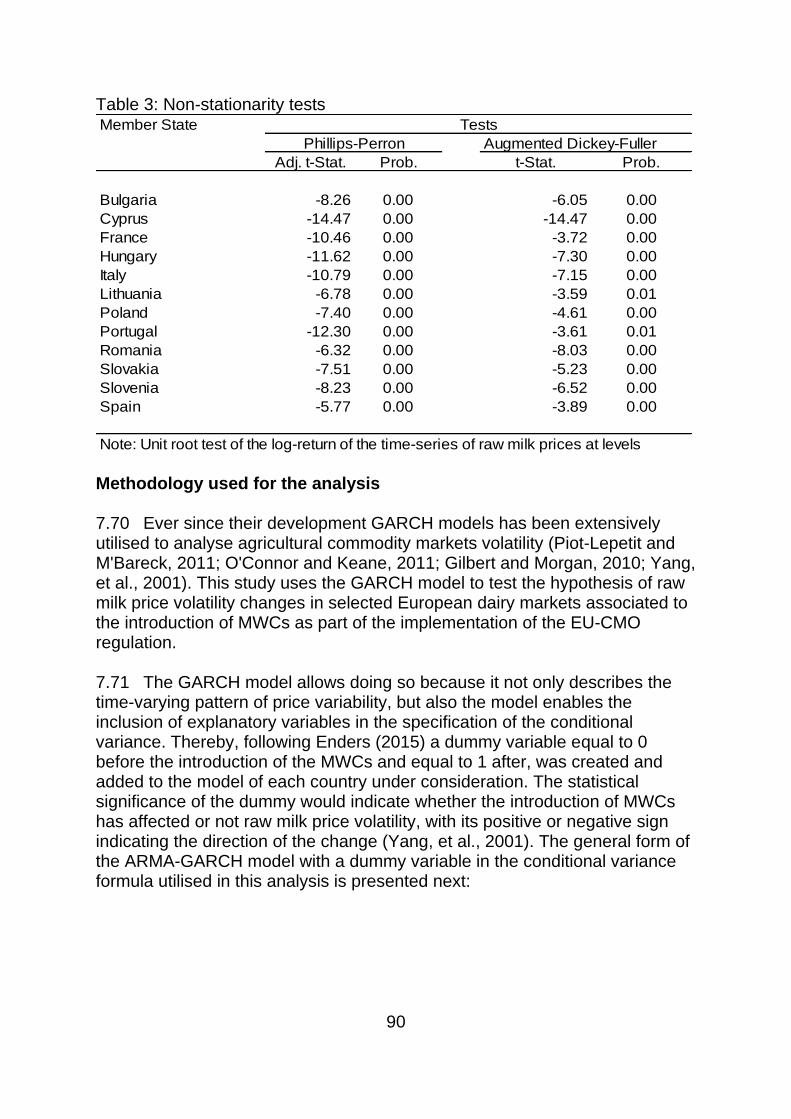
90
Table 3: Non-stationarity tests
Methodology used for the analysis 7.70 Ever since their development GARCH models has been extensively utilised to analyse agricultural commodity markets volatility (Piot-Lepetit and M'Bareck, 2011; O'Connor and Keane, 2011; Gilbert and Morgan, 2010; Yang, et al., 2001). This study uses the GARCH model to test the hypothesis of raw milk price volatility changes in selected European dairy markets associated to the introduction of MWCs as part of the implementation of the EU-CMO regulation. 7.71 The GARCH model allows doing so because it not only describes the time-varying pattern of price variability, but also the model enables the inclusion of explanatory variables in the specification of the conditional variance. Thereby, following Enders (2015) a dummy variable equal to 0 before the introduction of the MWCs and equal to 1 after, was created and added to the model of each country under consideration. The statistical significance of the dummy would indicate whether the introduction of MWCs has affected or not raw milk price volatility, with its positive or negative sign indicating the direction of the change (Yang, et al., 2001). The general form of the ARMA-GARCH model with a dummy variable in the conditional variance formula utilised in this analysis is presented next:
Member State Tests
Phillips-Perron Augmented Dickey-Fuller
Adj. t-Stat. Prob. t-Stat. Prob.
Bulgaria -8.26 0.00 -6.05 0.00
Cyprus -14.47 0.00 -14.47 0.00
France -10.46 0.00 -3.72 0.00
Hungary -11.62 0.00 -7.30 0.00
Italy -10.79 0.00 -7.15 0.00
Lithuania -6.78 0.00 -3.59 0.01
Poland -7.40 0.00 -4.61 0.00
Portugal -12.30 0.00 -3.61 0.01
Romania -6.32 0.00 -8.03 0.00
Slovakia -7.51 0.00 -5.23 0.00
Slovenia -8.23 0.00 -6.52 0.00
Spain -5.77 0.00 -3.89 0.00
Note: Unit root test of the log-return of the time-series of raw milk prices at levels
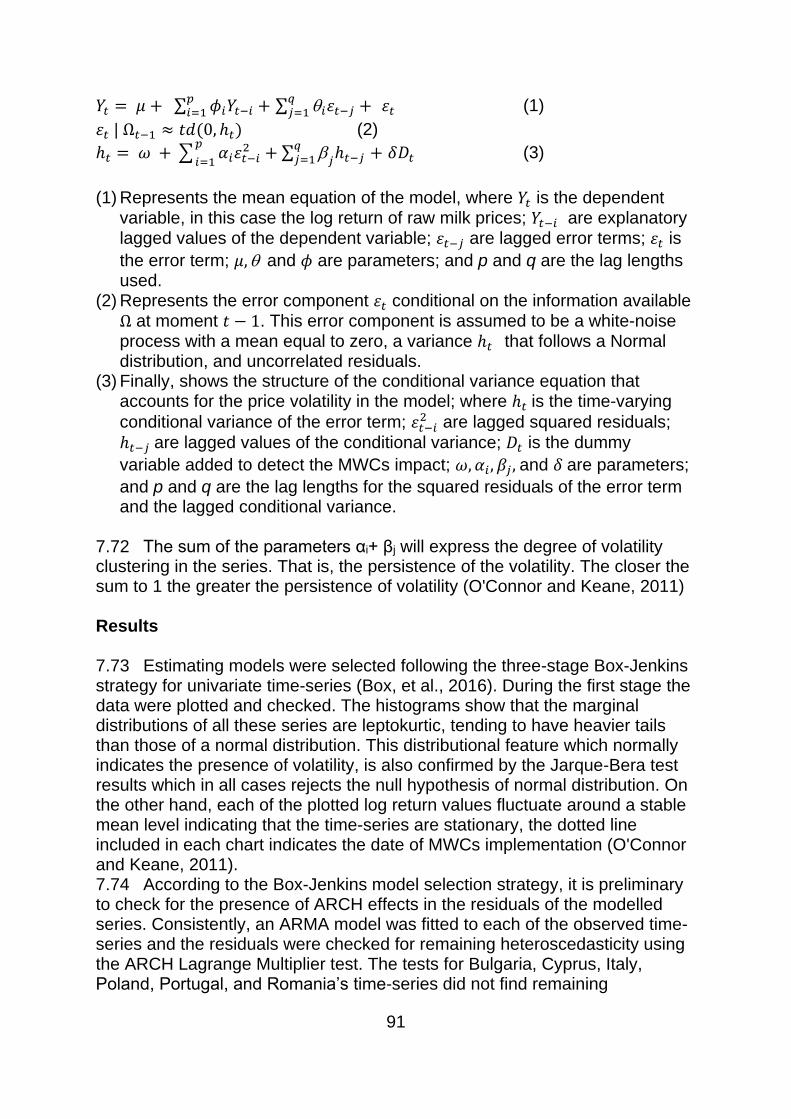
91
𝑌𝑡 = 𝜇 + ∑ 𝜙𝑖𝑌𝑡−𝑖𝑝𝑖=1 + ∑ 𝑖휀𝑡−𝑗
𝑞𝑗=1 + 휀𝑡 (1)
휀𝑡 | Ω𝑡−1 ≈ 𝑡𝑑(0, ℎ𝑡) (2)
ℎ𝑡 = 𝜔 + ∑ 𝛼𝑖휀𝑡−𝑖2𝑝
𝑖=1+ ∑
𝑗ℎ𝑡−𝑗
𝑞𝑗=1 + 𝛿𝐷𝑡 (3)
(1) Represents the mean equation of the model, where 𝑌𝑡 is the dependent
variable, in this case the log return of raw milk prices; 𝑌𝑡−𝑖 are explanatory lagged values of the dependent variable; 휀𝑡−𝑗 are lagged error terms; 휀𝑡 is
the error term; 𝜇, and 𝜙 are parameters; and p and q are the lag lengths used.
(2) Represents the error component 휀𝑡 conditional on the information available Ω at moment 𝑡 − 1. This error component is assumed to be a white-noise process with a mean equal to zero, a variance ℎ𝑡 that follows a Normal distribution, and uncorrelated residuals.
(3) Finally, shows the structure of the conditional variance equation that accounts for the price volatility in the model; where ℎ𝑡 is the time-varying
conditional variance of the error term; 휀𝑡−𝑖2 are lagged squared residuals;
ℎ𝑡−𝑗 are lagged values of the conditional variance; 𝐷𝑡 is the dummy
variable added to detect the MWCs impact; 𝜔, 𝛼𝑖 , 𝛽𝑗 , and 𝛿 are parameters;
and p and q are the lag lengths for the squared residuals of the error term and the lagged conditional variance.
7.72 The sum of the parameters αi+ βj will express the degree of volatility clustering in the series. That is, the persistence of the volatility. The closer the sum to 1 the greater the persistence of volatility (O'Connor and Keane, 2011) Results 7.73 Estimating models were selected following the three-stage Box-Jenkins strategy for univariate time-series (Box, et al., 2016). During the first stage the data were plotted and checked. The histograms show that the marginal distributions of all these series are leptokurtic, tending to have heavier tails than those of a normal distribution. This distributional feature which normally indicates the presence of volatility, is also confirmed by the Jarque-Bera test results which in all cases rejects the null hypothesis of normal distribution. On the other hand, each of the plotted log return values fluctuate around a stable mean level indicating that the time-series are stationary, the dotted line included in each chart indicates the date of MWCs implementation (O'Connor and Keane, 2011). 7.74 According to the Box-Jenkins model selection strategy, it is preliminary to check for the presence of ARCH effects in the residuals of the modelled series. Consistently, an ARMA model was fitted to each of the observed time-series and the residuals were checked for remaining heteroscedasticity using the ARCH Lagrange Multiplier test. The tests for Bulgaria, Cyprus, Italy, Poland, Portugal, and Romania’s time-series did not find remaining
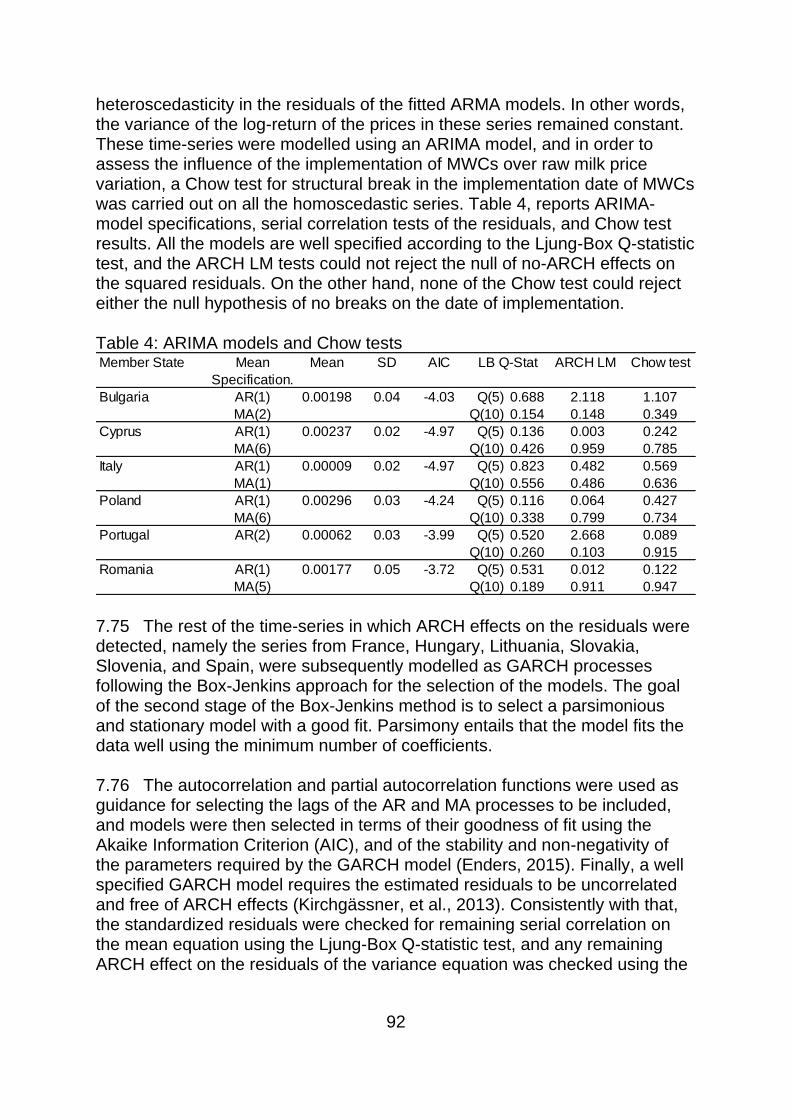
92
heteroscedasticity in the residuals of the fitted ARMA models. In other words, the variance of the log-return of the prices in these series remained constant. These time-series were modelled using an ARIMA model, and in order to assess the influence of the implementation of MWCs over raw milk price variation, a Chow test for structural break in the implementation date of MWCs was carried out on all the homoscedastic series. Table 4, reports ARIMA-model specifications, serial correlation tests of the residuals, and Chow test results. All the models are well specified according to the Ljung-Box Q-statistic test, and the ARCH LM tests could not reject the null of no-ARCH effects on the squared residuals. On the other hand, none of the Chow test could reject either the null hypothesis of no breaks on the date of implementation. Table 4: ARIMA models and Chow tests
7.75 The rest of the time-series in which ARCH effects on the residuals were detected, namely the series from France, Hungary, Lithuania, Slovakia, Slovenia, and Spain, were subsequently modelled as GARCH processes following the Box-Jenkins approach for the selection of the models. The goal of the second stage of the Box-Jenkins method is to select a parsimonious and stationary model with a good fit. Parsimony entails that the model fits the data well using the minimum number of coefficients. 7.76 The autocorrelation and partial autocorrelation functions were used as guidance for selecting the lags of the AR and MA processes to be included, and models were then selected in terms of their goodness of fit using the Akaike Information Criterion (AIC), and of the stability and non-negativity of the parameters required by the GARCH model (Enders, 2015). Finally, a well specified GARCH model requires the estimated residuals to be uncorrelated and free of ARCH effects (Kirchgässner, et al., 2013). Consistently with that, the standardized residuals were checked for remaining serial correlation on the mean equation using the Ljung-Box Q-statistic test, and any remaining ARCH effect on the residuals of the variance equation was checked using the
Member State Mean Mean SD AIC LB Q-Stat ARCH LM Chow test
Specification.
Bulgaria AR(1) 0.00198 0.04 -4.03 Q(5) 0.688 2.118 1.107
MA(2) Q(10) 0.154 0.148 0.349
Cyprus AR(1) 0.00237 0.02 -4.97 Q(5) 0.136 0.003 0.242
MA(6) Q(10) 0.426 0.959 0.785
Italy AR(1) 0.00009 0.02 -4.97 Q(5) 0.823 0.482 0.569
MA(1) Q(10) 0.556 0.486 0.636
Poland AR(1) 0.00296 0.03 -4.24 Q(5) 0.116 0.064 0.427
MA(6) Q(10) 0.338 0.799 0.734
Portugal AR(2) 0.00062 0.03 -3.99 Q(5) 0.520 2.668 0.089
Q(10) 0.260 0.103 0.915
Romania AR(1) 0.00177 0.05 -3.72 Q(5) 0.531 0.012 0.122
MA(5) Q(10) 0.189 0.911 0.947
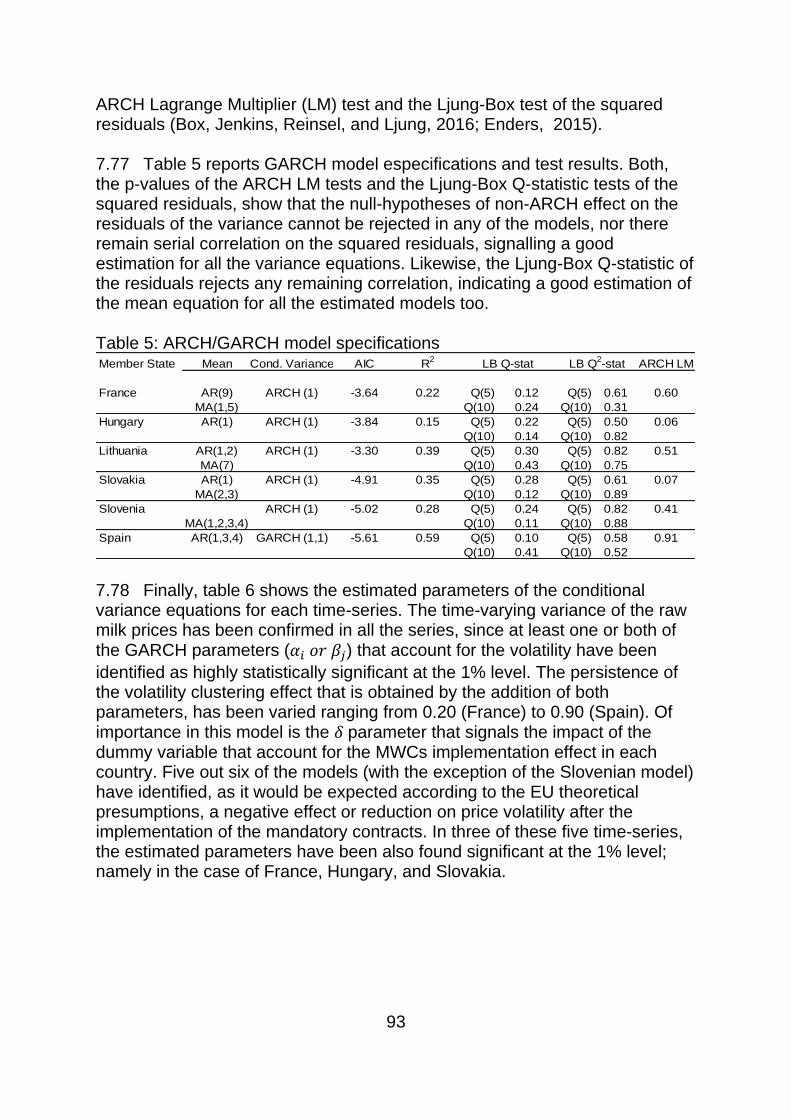
93
ARCH Lagrange Multiplier (LM) test and the Ljung-Box test of the squared residuals (Box, Jenkins, Reinsel, and Ljung, 2016; Enders, 2015). 7.77 Table 5 reports GARCH model especifications and test results. Both, the p-values of the ARCH LM tests and the Ljung-Box Q-statistic tests of the squared residuals, show that the null-hypotheses of non-ARCH effect on the residuals of the variance cannot be rejected in any of the models, nor there remain serial correlation on the squared residuals, signalling a good estimation for all the variance equations. Likewise, the Ljung-Box Q-statistic of the residuals rejects any remaining correlation, indicating a good estimation of the mean equation for all the estimated models too. Table 5: ARCH/GARCH model specifications
7.78 Finally, table 6 shows the estimated parameters of the conditional variance equations for each time-series. The time-varying variance of the raw milk prices has been confirmed in all the series, since at least one or both of the GARCH parameters (𝛼𝑖 𝑜𝑟 𝛽𝑗) that account for the volatility have been
identified as highly statistically significant at the 1% level. The persistence of the volatility clustering effect that is obtained by the addition of both parameters, has been varied ranging from 0.20 (France) to 0.90 (Spain). Of importance in this model is the 𝛿 parameter that signals the impact of the dummy variable that account for the MWCs implementation effect in each country. Five out six of the models (with the exception of the Slovenian model) have identified, as it would be expected according to the EU theoretical presumptions, a negative effect or reduction on price volatility after the implementation of the mandatory contracts. In three of these five time-series, the estimated parameters have been also found significant at the 1% level; namely in the case of France, Hungary, and Slovakia.
Member State Mean Cond. Variance AIC R2
LB Q-stat LB Q2-stat ARCH LM
France AR(9) ARCH (1) -3.64 0.22 Q(5) 0.12 Q(5) 0.61 0.60
MA(1,5) Q(10) 0.24 Q(10) 0.31
Hungary AR(1) ARCH (1) -3.84 0.15 Q(5) 0.22 Q(5) 0.50 0.06
Q(10) 0.14 Q(10) 0.82
Lithuania AR(1,2) ARCH (1) -3.30 0.39 Q(5) 0.30 Q(5) 0.82 0.51
MA(7) Q(10) 0.43 Q(10) 0.75
Slovakia AR(1) ARCH (1) -4.91 0.35 Q(5) 0.28 Q(5) 0.61 0.07
MA(2,3) Q(10) 0.12 Q(10) 0.89
Slovenia ARCH (1) -5.02 0.28 Q(5) 0.24 Q(5) 0.82 0.41
MA(1,2,3,4) Q(10) 0.11 Q(10) 0.88
Spain AR(1,3,4) GARCH (1,1) -5.61 0.59 Q(5) 0.10 Q(5) 0.58 0.91
Q(10) 0.41 Q(10) 0.52
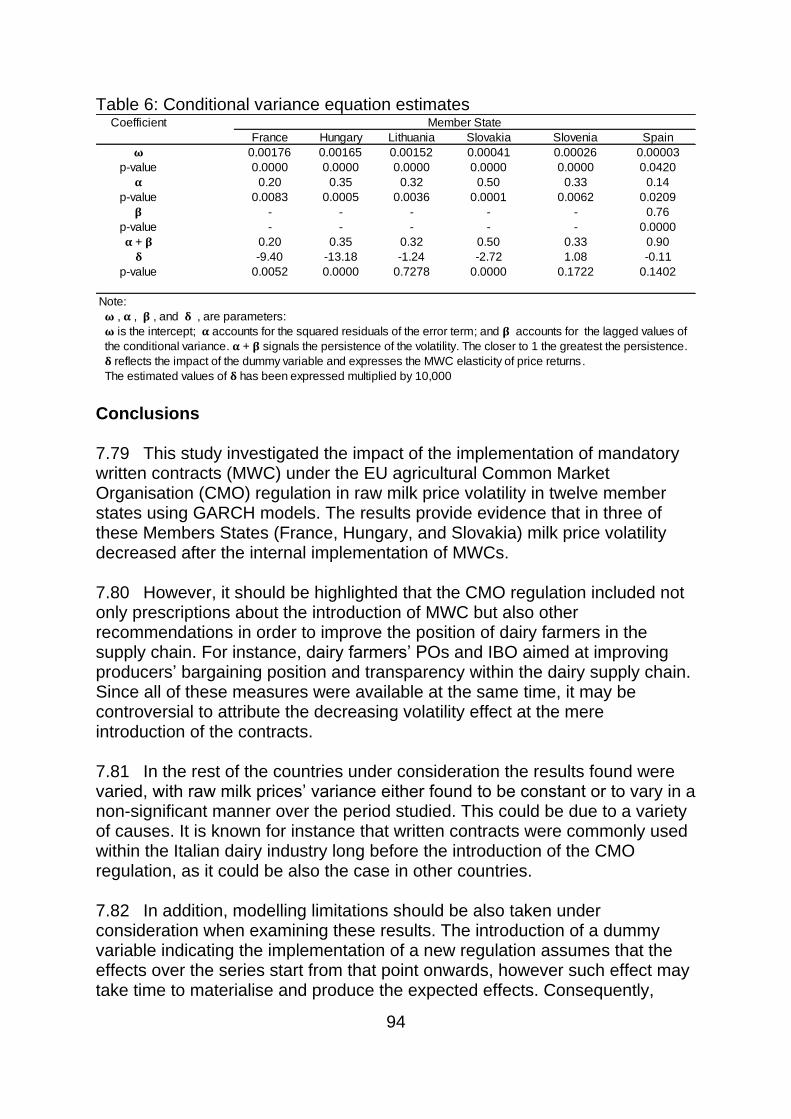
94
Table 6: Conditional variance equation estimates
Conclusions 7.79 This study investigated the impact of the implementation of mandatory written contracts (MWC) under the EU agricultural Common Market Organisation (CMO) regulation in raw milk price volatility in twelve member states using GARCH models. The results provide evidence that in three of these Members States (France, Hungary, and Slovakia) milk price volatility decreased after the internal implementation of MWCs. 7.80 However, it should be highlighted that the CMO regulation included not only prescriptions about the introduction of MWC but also other recommendations in order to improve the position of dairy farmers in the supply chain. For instance, dairy farmers’ POs and IBO aimed at improving producers’ bargaining position and transparency within the dairy supply chain. Since all of these measures were available at the same time, it may be controversial to attribute the decreasing volatility effect at the mere introduction of the contracts. 7.81 In the rest of the countries under consideration the results found were varied, with raw milk prices’ variance either found to be constant or to vary in a non-significant manner over the period studied. This could be due to a variety of causes. It is known for instance that written contracts were commonly used within the Italian dairy industry long before the introduction of the CMO regulation, as it could be also the case in other countries. 7.82 In addition, modelling limitations should be also taken under consideration when examining these results. The introduction of a dummy variable indicating the implementation of a new regulation assumes that the effects over the series start from that point onwards, however such effect may take time to materialise and produce the expected effects. Consequently,
Coefficient Member State
France Hungary Lithuania Slovakia Slovenia Spain
𝛚 0.00176 0.00165 0.00152 0.00041 0.00026 0.00003
p-value 0.0000 0.0000 0.0000 0.0000 0.0000 0.0420
𝛂 0.20 0.35 0.32 0.50 0.33 0.14
p-value 0.0083 0.0005 0.0036 0.0001 0.0062 0.0209
𝛃 - - - - - 0.76
p-value - - - - - 0.0000
𝛂 + 𝛃 0.20 0.35 0.32 0.50 0.33 0.90
𝛅 -9.40 -13.18 -1.24 -2.72 1.08 -0.11
p-value 0.0052 0.0000 0.7278 0.0000 0.1722 0.1402
Note:
𝛚 , 𝛂 , 𝛃 , and 𝛅 , are parameters:
𝛚 is the intercept; 𝛂 accounts for the squared residuals of the error term; and 𝛃 accounts for the lagged values of
the conditional variance. 𝛂 + 𝛃 signals the persistence of the volatility. The closer to 1 the greatest the persistence.
𝛅 reflects the impact of the dummy variable and expresses the MWC elasticity of price returns.
The estimated values of 𝛅 has been expressed multiplied by 10,000
95
models may fail to detect the significance in that single point whilst the underlying process is effectively being affected. It is plausible for this reasons that perhaps this effect could be better detected using recursive estimation techniques (Enders, 2015). 7.83 Finally, this study has focused on the analysis of individual country time-series. However, within the EU there exist singular milk buyers that operate in different countries at the same time and the import-export of raw milk is also an extended practice throughout some parts of the EU. Consequently, to undertake a multivariate time-series analysis of raw milk price volatility including a variety of interrelated countries in a single panel data model may be worthy of future investigation.
96
7.4 Rules set by the Milk Package regarding MWCs
The rules set by the Milk Package (Regulation (EU) No 1308/2013 of the European Parliament and of the Council of 17 December 2013) Member States can make the use of formal written contracts compulsory. Although, contracts will remain voluntary at EU level. Co-operatives will be exempt from any requirement for compulsory contracts at a member state level. 1. Where a member state decides that every delivery of raw milk between a
farmer and processor shall be covered by a written contract, that contract will fulfil the following conditions:
a. The price payable, which will be static and set out in the contract or vary only on factors that are set out in the contract (i.e. a formula or linked to specified market indicators).
b. Volume which may, or shall be delivered and timing of deliveries. c. Duration of the contract, with termination clauses.
2. A contract will not be required if the farmer supplies a co-op – but only if the co-op statutes contain provisions with the same objective as the Commission’s ‘contract requirements’.
3. The Commission proposes to allow producer organisations to negotiate contract terms, including price jointly, or for some of its members’ production to a dairy:
a. POs will be subject to quantitative limits at EU and member state level.
b. The PO must notify the competent authority of the member state to register as a legal entity.
c. Strict clauses are set out in the regulation that will restrict the activity of the PO so as to prevent price fixing, and other distortions of competition.
4. Member States may also recognise interbranch organisations which: a. have formally requested recognition and are made up of
representatives of economic activities linked to the production of raw milk and linked to at least one of the following stages of the supply chain: processing of or trade in, including distribution of, products of the milk and milk products sector;
b. are formed on the initiative of all or some of the representatives referred to in point ‘a’;
c. carry out, in one or more regions of the Union, taking into account the interests of the members of those interbranch organisations and of consumers.
97
7.5 References
ABC Consulting (2018). DEFRA Opportunity for Compulsory UK Milk Contracts. Presentation at the NFU Scotland. AHDB-Dairy (2014). Voluntary Code can benefit both producer and processor, according to review. Available online at: https://dairy.ahdb.org.uk/news/news-archive/2014/october-2014/voluntary-code-can-benefit-both-producer-and-processor,-according-to-review/#.W5oQrv6WwqU AHDB-Dairy (2015). Defra farmgate prices: When is an average not an average? Available at: http://dairy.ahdb.org.uk/news/news-articles/april-2015/defra-farmgate-prices-when-is-an-average-notan-average/ Authority Responsible for Competition and Market (Autorità garante della concorrenza e del mercato AGCM) (2016). IC51-indagine conoscitiva sul settore lattiero-caseario. Available online at: http://www.agcm.it/dotcmsCustom/getDomino Attach?urlStr=192.168.14.10:8080/C12564CE0049D161/0/8479B59509CFFF40C1257F77004F18B0/$File/p25899_all.pdf Bakucs, Z., Fertö, I. and Szabó, G. G., (2013). Contractual Relationships in the Hungarian Milk Sector. British Food Journal, 115(2): 252-261. Bergman, D., O'Connor, D. & Thümmel, A., (2015). Seasonal and cyclical behaviour of farm gate milk prices. British Food Journal, 117(12), pp. 2899-2913. Blaskó, B., Kovács, K., Szöllösi, L. & Szücs, I., (2015). Complex problem analysis of the Hungarian dairy farms. Available online at: http://apstract.net/index.php/2015/09 /30/complex-problem-analysis-of-the-hungarian-dairy-farms/ Bollerslev, T., (1986). Generalized autoregressive conditional heteroskedasticity. Journal of Econometrics, 31: 307-327. Box, G. E., Jenkins, G. M., Reinsel, G. C. and Ljung, G. M., (2016). Time series analysis: forecasting and control. 5th ed. Hoboken, New Jersey: Wiley. CNIEL. (2018). L’économie laitière en chiffres – Édition 2018 – Online access: https://presse.filiere-laitiere.fr/assets/economie-laitiere-en-chiffres-edition-2018-63c2-ef05e.html?lang=fr
98
Conseil général de l’alimentation, de l’agriculture et des espaces ruraux. (2012). RAPPORT sur la contractualisation dans le secteur agricole (Article L631-24 du Code rural et de la pêche maritime). Available online access: https://www.ladocumentationfrancaise.fr/rapports-publics/124000405/index.shtml Costa‐Font, M., & Revoredo‐Giha, C. (2018). An empirical analysis of UK milk contract prices 2004–2016. Agribusiness, 34(1), 112-141. Dervillé, M., & Allaire, G. (2014). Change of competition regime and regional innovative capacities: Evidence from dairy restructuring in France. Food Policy, 49, 347-360. Dairy UK, NFU, NFUS (2012). Dairy industry code of best practice on contractual relationships. Available at: https://www.nfuonline.com/code-of-practice-booklet/ Defra (2013). Impact Assessment: Implementation of the EU Dairy Package. Dervillé M. and Allaire G. (2014). Change of competition regime and regional innovative capacities: Evidence from dairy restructuring in France. Food Policy 49: 347–360. Embassy of the Kingdom of the Netherlands in Warsaw (EKNW) (2017). Quickscan Polish Dairy Sector. Department of Agriculture, Nature and Food Quality. Available online at: www.nlembassy.pl Enders, W., (2015). Applied Econometric Time Series. 4th ed. Hoboken: John Wiley & Sons, Inc. Engle, R. F., (1982). Autoregressive conditional heteroscedasticity with estimates of the variance of United Kingdom inflation. Econometrica, 50(4), pp. 987-1007. European Commission (2010). Proposal for a regulation of the European Parliament and of the Council amending Council Regulation (EC) No 1234/2007 as regards contractual relations in the milk and milk products sector, COM (2010) 728, 9 December 2010. European Commission, (2012). Regulation (EU) No 261/2012 as regards contractual relations in the milk and milk products sector. Available online at: https://eur-lex.europa.eu/legal-content/EN/TXT/?uri=CELEX:32012R0261. European Commission, (2013). Regulation (EU) No 1308/2013 establishing a common organisation of the markets in agricultural products. Available online
99
at: https://eur-lex.europa.eu/legal-content/EN/ALL/?uri=CELEX%3A32013R1308 [Accessed October 2018]. European Commission (2014). Development of the dairy market situation and the operation of the "Milk Package" provisions. Report from the commission to the European Parliament and The Council. COM (2014) 354 final. European Commission, (2016). Report on the development of the dairy market situation and the operation of the "Milk Package" provisions. Available online at: https://ec.europa.eu/agriculture/milk/milk-package/com-2016-724_en.pdf European Commission, (2019). EU Milk Market Observarory. Available online at: https://ec.europa.eu/agriculture/market-observatory/milk/latest-statistics/productions stock s_en FAO & OECD, (2011). Price Volatility in Food and Agricultural Markets: Policy Responses. Available online at: http://www.oecd.org/agriculture/pricevolatilityinfood andagriculturalmarketspolicyresponses.html. FarmBusiness (2018). The Government has rejected calls to extend the remit of the Groceries Code Adjudicator (GCA) beyond the top 10 supermarkets. Available online at: http://www.farmbusiness.co.uk/business/politics/the-government-has-rejected-calls-to-extend-the-remit-of-the-groceries-code-adjudicator-gca-beyond-the-top-10-supermarkets.html FranceAgriMer. (2018a). Filière Lait de vache. Publication de FranceAgriMer. Février 2018. Available online at: : http://www.franceagrimer.fr/filiere-lait/Publications FranceAgriMer. (2018b). La transformation laitière française: évolutions récentes - Données 2017. Publication de FranceAgriMer. septembre 2018 Available online at: : http://www.franceagrimer.fr/filiere-lait/Publications Fredriksson, L., Bailey, A., Davidova, S. and Gorton, M., (2017). The commercialisation of subsistence farms: Evidence from the new member states of the EU. Land Use Policy, Volume 60: 37-47. Gilbert, C. L. & Morgan, C. W., (2010). Food Price Volatility. Philosophical Transactions of the Royal Society B, Volume 365, pp. 3023-3034. Gobierno de España (2015). Contrato lácteo. Paquete lácteo II. Available online at: https://www.mapa.gob.es/es/ganaderia/temas/produccion-y-mercados-ganaderos/ contratosdefinitivo_paquetelacteo_tcm30-104561.pdf
100
Gobierno de España (2018). Paquete Lácteo. Estado de Implantacion. Reunión Sectorial Vacuno de Leche. Available online at: https://www.mapa.gob.es/es /ganaderia/temas/produccion-y-mercados-ganaderos/estadoimplantacionpaquete_ tcm30-495893.pdf Gobierno de España (2019). Datos de campañas: Declaraciones de leche. Available online at: https://www.fega.es/datos-campanas-clasificadas-por-actividad/actividad /declaracionesleche Grodea, M., (2016). Milk processing and collection in Romania: An analysis across regions. s.l., Agrarian Economy and Rural Development - Realities and Perspectives for Romania. 7th Edition of the International Symposium, The Research Institute for Agricultural Economy and Rural Development (ICEADR), Bucharest, pp. 196-201. Hansen, B. G. & Li, Y., (2016). An Analysis of Past World Market Prices of Feed and Milk and Predictions for the Future. Agribusiness, 00(0), pp. 1-19. Hockmann, H. and Vöneki, É., (2009). Collusion in the Hungarian market for raw milk. Agriculture, 38(1): pp. 39-45. HM Government (2018). Groceries Code Adjudicator Review: Part 2 Government response to the Call for Evidence on the case for extending the Groceries Code Adjudicator’s remit in the UK groceries supply chain. February. Available online at: https://assets.publishing.service.gov.uk/government/uploads/system/uploads/attachment_data/file/681882/groceries-adjudicator-consult-summary-of-responses-180216 .pdf House of Commons Environment, Food and Rural Affairs Committee (HC-EFRA) (2011). EU proposals for the dairy sector and the future of the dairy industry. Available online at: https://publications.parliament.uk/pa/cm201012/cmselect/cmenv fru/952/952.pdf House of Commons Welsh Affairs Committee (HC-WAC) (2013). Government should ensure fairer deal for dairy farmers. Available online at: https://www.parliament.uk/business /committees/committees-a-z/commons-select/welsh-affairs-committee/news/the-volunta ry-code-of-practice-in-the-dairy-sector/ Kirchgässner, G., Wolters, J. & Hassler, U., 2013. Introduction to Modern Time Series Analysis. Second ed. Heidelberg: Springer. Lambaré, P., Dervillé, M. and You, G. (2018). Quelles conditions d’accès au marché des éleveurs après les quotas laitiers? Économie rurale 364: 55-71.
101
Leat, P. and Revoredo-Giha, C., (2008). Building collaborative agri-food supply chains. The challenge of relationship development in the Scottish red meat chain. British Food Journal, 110(4/5): 395-411. Martinez A. (2013). Comprendre le positionnement polonais sur la gestion du secteur laitier. Ambassade de France en Pologne, service économique régional de Varsovie, Pôle agriculture et alimentation. Note 13-023, rédigée à Varsovie le 15 janvier 2013. Milk Development Council (MDC) (2006). Routes to Profitability: Is reduced milk production the solution? August. Mills, D. E. (1995). Why retailers sell private labels. Journal of Economics & Management Strategy, 4(3), 509-528. NFU, (2012). Dairy Industry Code of Best Practice on Contractual Relationships. Available online at: https://www.nfuonline.com/code-of-practice-booklet/ [Accessed September 2018]. O'Connor, D. & Keane, M., (2011). Empirical Issues Relating to Dairy Commodity Price Volatility. In: I. Piot-Lepetit & R. M'Bareck, eds. Methods to Analyse Agricultural Commodity Price Volatility. New York: Springer, pp. 63-83. Perekhozhuk, O., Hockmann, H., Bakucs, L. Z. and Fertö, I., (2011). Identification of Market Power in the Hungarian Dairy Industry. A Plant-Level Analysis. Zurich, European Association of Agricultural Economist EAAE - Congress Change and Uncertainty. Challenges for Agriculture, Food, and Natural Resources. Perkins, C. (2019). Muller loses branded listings at supermarkets. The Grocer, 4 January. Pieniadz, A., Hanf, J. H., Voicilas, D. M. and Götz, L., (2009). Challenges for chain based finance in the Romanian dairy chain. Chania, Crete, 113th European Association of Agricultural Economics (EAAE) Seminar "A Resilient European Food Industry and Food Chain in a Challenging World". Piot-Lepetit, I. & M'Bareck, R., (2011). Methods to Analyse Agricultural Commodity Price Volatility. In: I. Piot-Lepetit & R. M'Bareck, eds. Methods to Analyse Agricultural Commodity Price Volatility. New York: Springer, pp. 1-12. Ruminantia (2016). The Antitrust Authority closed the fact-finding survey on the dairy sector. Available online at: http://www.ruminantia.it/lautorita-antitrust-ha-chiuso-lindagine-conoscitiva-sul-settore-lattiero-caseario/
102
Santiso, J., López, E., Sineiro, F. and Lorenzana, R. (2018). Revisión y actualización de los modelos de indexación leche de vaca (Sept 2018), Madrid: INLAC - USC. Santiso, J. and Sineiro, F. (2016a). La politica lactea europea, en cuestion. Crisis de excedentes y problemas especificos en el sector lacteo espanol. In: M. Á. Díaz Yubero, ed. El sector lacteo espanol en la encrucijada. Almería: Cajamar Caja Rural, pp. 57-91. Santiso, J. and Sineiro, F., (2016b). Liberalizacion de los mercados lecheros: Una perspectiva desde el sector lacteo espanol. Clermont, Société Française d'Economie Rurale (SFER). Colloque Scientifique La Liberalisation del Marchés Laitiers. 9&10 June. Santiso Blanco, J. & Sineiro García, F., 2015. El Sector Lácteo y a Competencia Efectiva de los Mercados. Valencia, X Congreso de la Asociación Española de Economía Agraria. Alimentacion y territorios sostenibles desde el sur de Europa. Universitat Politècnica de València. Santiso Blanco, J. A., Sineiro García, F. & López Iglesias, E., (2014). Adaptacion al nuevo marco del sector lacteo y dinamizacion de las herramientas del Paquete Lacteo, Madrid: Organizacion Interprofesional Lactea - INLAC. Service de la Statistique et de la Prospective (SSP) Enquête annuelle laitière. (2017). Available online at: http://agreste.agriculture.gouv.fr/enquetes/entreprises-agroalimentaires/enquete-annuelle-laitiere/ Sobczyński, T., Klepacka, A. M., Revoredo-Giha, C., and Florkowski, W. J. (2015). Dairy farm cost efficiency in leading milk-producing regions in Poland. Journal of dairy science, 98(12): 8294-8307. Szücs, I. and Szöllösi, L., (2015). Problems of the Hungarian dairy sector in connection with the abolition of the milk quota system. Poznań, SERIA Congress - Polish Association of Agricultural Economist and Agribusiness. Trouvé, A., Dervillé,M., Gouin, D-M., Pouch, T., Fink-Kessler, A., Kroll, J-C., Rat-Aspert, O., Briot, X., Lambaré, P., Jongeneel, R. (2016). Study of Measures against Market Imbalance: What Perspectives after Milk Quotas in the European Dairy Sector? Procurement reference SSP-DGPAAT-2014-027. Available online at: https://agriculture.gouv.fr/sites/minagri/files/study_of_measures_against_market_imbalance_-_summary.pdf
103
UK Government (2018). Groceries Code Adjudicator Review: Part 2 Government response to the Call for Evidence on the case for extending the Groceries Code Adjudicator’s remit in the UK groceries supply chain. Available online at: https://assets.publishing.service.gov.uk/government/uploads/system/uploads/attachment_data/file/681882/groceries-adjudicator-consult-summary-of-responses-18021 6.pdf White, K. (2018). As profit margins shrink, what’s going wrong in liquid milk? The Grocer, 14 December. White, K. (2019). Müller faces farmer unrest over milk price cut. The Grocer, 31 January. Wijnands, J. H., Bijman, J. and Tramnizke, T., (2017). Analyses of the Functioning of Milk Package provisions as regards Producer Organisations and collective negotiations. , Luxembourg: European Commission, Joint Research Centre, EUR 28762 EN, doi:10.2760/157364. Yang, J., Haigh, M. S. and Leatham, D. J., (2001). Agricultural liberalization policy and commodity price volatility: a GARCH application. Applied Economics Letters, 8: 593-598.
Social Research seriesISSN 2045-6964ISBN 978-1-83960-320-4
Web and Print Publicationwww.gov.scot/socialresearch
PPDAS659262 (11/19)
researchsocial
© Crown copyright 2019You may re-use this information (excluding logos and images) free of charge in any format or medium, under the terms of the Open Government Licence. To view this licence, visit http://www.nationalarchives.gov.uk/doc/open-government-licence/ or e-mail: [email protected] we have identified any third party copyright information you will need to obtain permission from the copyright holders concerned.
The views expressed in this report are those of the researcher anddo not necessarily represent those of the Scottish Government orScottish Ministers.
This document is also available from our website at www.gov.scot.ISBN: 978-1-83960-320-4
The Scottish GovernmentSt Andrew’s HouseEdinburghEH1 3DG
Produced for the Scottish Government by APS Group ScotlandPPDAS659262 (11/19)Published by the Scottish Government, November 2019