Embed Size (px)
Citation preview
The Impact of Mandated Corporate Social Responsibility: Evidence from India’s Companies Act of 2013
Dhammika Dharmapala
University of Chicago Law School [email protected]
Vikramaditya Khanna
University of Michigan Law School [email protected]
January 2017
Abstract Firms’ Corporate Social Responsibility (CSR) activity has become the subject of a large literature in recent years. This paper analyzes CSR activity using quasi-experimental variation created by Section 135 of India’s Companies Act of 2013, which requires (on a “comply-or-explain” basis) that firms satisfying specific size or profit thresholds spend a minimum of 2% of their net profit on CSR. We examine effects along a number of different dimensions including firm value, CSR spending, and other outcomes, as well as exploring broader theoretical implications. Our analysis uses financial statement and stock price data on Indian firms from the Prowess database, along with hand-collected data from firms’ disclosures of CSR activity. By combining a regression discontinuity (RD) framework (based on a nonparametric local polynomial regression approach) with a standard event study, we find a negative and substantial effect on the value of affected firms (relative to unaffected firms) around the crucial event date. This effect seems to be concentrated among firms that are less customer-facing, as indicated by low advertising expenditures. Using a difference-in-difference approach, we find significant increases in CSR activity among firms affected by Section 135, especially in the fraction of firms engaging in CSR spending. The fraction of firms subject to Section 135 that engage in advertising expenditures appears to have declined, consistent with substitution between advertising and CSR. There is no robust evidence of any significant impact on sales or accounting performance, although a modest decline in the return on assets cannot be ruled out. For a subset of large firms, we hand-collect comprehensive CSR data and find that while firms initially spending less than 2% increased their CSR activity, large firms initially spending more than 2% reduced their CSR expenditures after Section 135 came into effect. We explore various explanations for this presumably unintended consequence of Section 135, and also seek to derive some wider implications of this analysis for understanding the role of CSR. Acknowledgments: We thank Reuven Avi-Yonah, Bobby Bartlett, Alicia Davis, David Finkelstein, Jesse Fried, Daniel Hemel, Don Herzog, Jill Horwitz, William Hubbard, Michael Livermore, Anup Malani, Martha Nussbaum, Jillian Popadak, J.J. Prescott, Nicholson Price, Gabriel Rauterberg, Sonja Starr, seminar participants at the University of Michigan and the University of Chicago, and conference participants at the International Conference on Corporate Finance, Governance and Sustainability, Delhi School of Business for helpful discussions and comments. We also thank Peter Bratton, Sarah Jaward, Lilliana Lin, Neil Patel, Ben Thompson, and Derek Turnbull for outstanding research assistance. Dharmapala acknowledges the financial support of the Lee and Brena Freeman Faculty Research Fund at the University of Chicago Law School. Khanna acknowledges the financial support of the William W. Cook Fund at the University of Michigan Law School. Any remaining errors or omissions are our own.
1
1) Introduction
A vast literature on firms’ Corporate Social Responsibility (CSR) activity has emerged in
recent years across a number of scholarly disciplines, including law, economics, management,
accounting, and finance.1 Indeed, understanding the determinants and consequences of firms’
CSR activity illuminates various important issues surrounding firm behavior and corporate
governance, as well as much broader questions about the private provision of public goods and
the role of corporations in society. For example, one longstanding concern is whether CSR
activity reflects agency problems – i.e. represents the extraction of private benefits by insiders –
or instead enhances shareholder value.2
This paper analyzes the impact of exogenously mandated CSR requirements on firm
value, on CSR activity, and on various other outcomes such as advertising expenditures, sales
revenue, and accounting performance. It uses quasi-experimental variation created by Section
135 of India’s Companies Act of 2013, which requires (on a “comply-or-explain” basis) that
firms satisfying specific size or profit thresholds undertake CSR activity.3 A large prior literature
has examined the consequences of CSR spending on share prices, operating performance,
ownership structure, and other outcomes.4 However, in most studies the variation in CSR
expenditures is endogenously determined by the firm (e.g. Clacher and Hagendorff, 2012). To
the best of our knowledge, India’s 2013 Companies Act provides the only example to date of a
1 Kitzmueller and Shimshack (2012) provide a survey of this extensive literature. CSR is typically defined to include various forms of charitable activity and the reduction of negative firm externalities to a greater extent than required by law. 2 Recently, Cheng, Hong and Shue (2014) argue that exogenous improvements in governance lead to reduced growth in CSR spending. They use the 2003 tax reform in the US (that reduced tax rates on dividends) as source of variation in insider ownership. They also find that close shareholder votes (just above 50%) for measures that improve governance lead to slower CSR growth. On the other hand, Ferrell, Liang and Renneboog (2014) use a dataset of firms across a large number of countries and find that better governance is associated with higher CSR expenditures, suggesting that CSR is not primarily attributable to agency problems, but rather to efforts to increase firm value. They analyze the impact of proxies for agency problems on the level of CSR spending by firms. While some of these proxies – such as managerial compensation structure – are determined by the firm simultaneously with its choice of CSR, others – such as investor protection laws at the country level - are plausibly exogenous to the firm. 3 See the summary of Section 135 by the accounting firm Grant Thornton, available at: http://gtw3.grantthornton.in/assets/Companies_Act-CSR.pdf 4 For instance, Dimson, Karakas and Li (2015) analyze a sample of CSR-related engagements by a large institutional investor with US firms. They find that firms where the engagement was successful experience improved accounting performance and governance outcomes, relative to firms where the engagement was unsuccessful.
2
legislative mandate to engage in CSR activity, and its thresholds for applicability provide an
extremely rare instance of quasi-experimental variation in CSR expenditures.5
Section 135 requires (on a “comply-or-explain” basis) that firms satisfying certain size or
profit thresholds spend at least 2% of the average of their (pretax domestic) profit over the last 3
years, if any, on CSR activity. The law also requires that firms above the threshold establish a
CSR Committee of the Board of Directors. This committee is responsible for formulating the
firm’s CSR policy, for ensuring that at least 2% of profits are spent on CSR activity, and (where
applicable) for explaining why the firm failed to achieve the target. Schedule VII of the 2013
Companies Act provides an illustrative (but apparently not exhaustive) list of activities
qualifying for CSR status for purposes of the mandate, as discussed in Section 2 below.
The threshold for the application of Section 135 is multi-faceted, based on turnover (i.e.
sales revenue), net profits and the concept of “net worth” (the face value of shares originally
issued by the corporation, adjusted for subsequent retained earnings and various reserves). The
net worth threshold is set at Indian Rupees (INR) 5 billion (or INR 500 crores6), the sales
threshold at INR 10 billion, and the net profit threshold at INR 50 million, with any firm
satisfying at least one of these criteria being subject to the CSR requirement. Importantly, these
particular thresholds apply only to Section 135, and were not associated with any other
requirements in Indian company law. The net worth and sales thresholds are set at a level that
applies to around a quarter of Indian firms, while the net profit threshold is set around the profits
of the median firm. Because it is typically the net profit threshold that is binding, we focus on
this threshold in our primary empirical tests.
The Companies Act of 2013 was enacted on 29 August 2013, and came into effect for the
2015 fiscal year (i.e. the fiscal year ending on March 31, 2015). The key event dates that marked
its passage through Parliament are summarized in Table 1. The bill underwent extensive
discussion and debate over a number of years prior to final enactment. The notion that firms
would be encouraged to voluntarily undertake CSR was first mooted in late 2009. The first
announcement of a mandatory CSR requirement for firms above the thresholds noted above was
5 Flammer (2015) finds a positive effect of CSR activity on financial performance, comparing the effects of CSR-related shareholder proposals that pass by a narrow majority to those of proposals that narrowly fail. However, CSR proposals that are initiated by shareholders may arguably be systematically different in their value effects from CSR that is mandated by company law or that is chosen by firm insiders. 6 In India a crore refers to 10 million INR; thus, for instance, 500 crores is identical to 5 billion INR (roughly US$77 million or £55 million at an exchange rate of 1 USD = 65 INR).
3
made on August 6, 2010. Subsequent media reports (on December 24, 2010 and various later
dates) suggested that this measure would be weakened to a “comply-or-explain” obligation. A
“comply-or-explain” CSR obligation was included as part of the Companies Bill in July 2011.
The bill was passed by the lower house of Parliament on 18 December 2012 and by the upper
house on 8 August 2013 (receiving the President’s assent on 29 August 2013).
We present a simple theoretical model of CSR activity by a firm with a controlling
shareholder, and characterize the impact of a legal provision mandating a minimum level of CSR
spending. Our empirical tests are guided by the model, and address the impact of Section 135 on
firm value, CSR activity, and outcomes such as advertising, sales, and accounting performance.
To address the effect on firm value, we combine a standard event study methodology with a
regression discontinuity (RD) design based on the INR 50 million net profit threshold. We first
compute abnormal stock market returns around the relevant event dates, using stock price data
from the Prowess database.7 We then compare abnormal returns for firms just above the net
profit threshold with those for firms just below the threshold. As is standard in the current
literature, we use a nonparametric local polynomial regression approach in implementing our RD
framework (e.g. Hahn, Todd, and van der Klaauw, 2001; Calonico, Cattaneo, and Titiunik,
2014a).
On the first event date (August 6, 2010, when a CSR mandate was announced), we find a
substantial negative effect on the value of firms that became subject to the CSR requirement
(which at that time was expected to be mandatory, rather than a “comply-or-explain” regulation).
The estimated decline in firm value is about 2.6% to 3.3%, depending on the specification. This
exceeds the CSR requirement of 2%, possibly reflecting the compliance and disclosure costs of
establishing a CSR committee and program. The effect seems to be concentrated among firms
that are less customer-facing, as indicated by low advertising expenditures. The RD estimates for
all subsequent event dates are statistically insignificant and generally small in magnitude.
Overall, these results suggest that Section 135 reduced the value of firms by a magnitude
comparable to (or even larger than) the amount of CSR spending that the provision required. The
7 The Prowess database, maintained by the Center for Monitoring the Indian Economy (CMIE), reports financial statements, share prices, and other relevant data for publicly traded Indian corporations). For more details on the Prowess database and for background on Indian corporate law and governance, see e.g. Dharmapala and Khanna (2013).
4
size of the effect suggests that private returns to CSR activity are quite small for firms around the
threshold.
In the accounting literature, an event study by Manchiraju and Rajgopal (2015) makes an
important contribution to understanding the effects of Section 135 on firm value. There are a
number of significant differences between their study and ours that are detailed in Section 4
below; most importantly, they do not use a nonparametric local polynomial regression approach
to analyze effects on firm value, and they limit their analysis solely to firm value whereas we
engage in a more comprehensive study of the impact of this law on a wide range of outcomes,
including CSR expenditures. Despite these differences, their basic results on firm value are quite
similar to ours.
Most firms were not required to disclose CSR spending or activity until Section 135 took
effect in fiscal year 2015. In light of this, we adopt two strategies to gather data on CSR activity.
First, from 2012 onwards we can construct proxies for CSR expenditures from Prowess data, but
the disclosure of these items was voluntary and thus subject to concerns about self-selection.
Treating missing CSR observations as zeroes, we implement a difference-in-difference approach
using panel data from Prowess over 2012-2015. The results indicate a substantial increase in
CSR activity among firms subject to Section 135. This is particularly marked along the extensive
margin (i.e. in the fraction of firms engaging in positive amounts of CSR spending). We also
examine the impact of Section 135 on various other firm-level outcomes. There is some evidence
of a decline in the fraction of firms subject to Section 135 engaging in advertising, which is
consistent with some degree of substitution between advertising and CSR spending. There is no
robust evidence of any significant impact on sales, perhaps reflecting optimization by firms
along this dimension prior to the reform. Some of the compliance and disclosure costs of Section
135 would imply declines in accounting performance. However, there is no statistically
significant impact on firms’ return on assets (ROA) that is detectable, although a modest decline
in ROA cannot be ruled out.
Second, for a subsample consisting of the largest 100 firms, the self-selection issue noted
earlier can be overcome because India’s securities regulator – the Securities and Exchange Board
of India (SEBI) – required these firms to disclose their CSR spending in the year prior to the
Companies Act 2013 taking effect. Although the sample size is quite small (just the top 100
firms), it is apparent that firms initially spending less than 2% of their profits on CSR increased
5
their CSR activity, while those that were initially spending more than 2% reduced their CSR
expenditures towards 2% after Section 135 came into effect. On balance, however, the former
effect was larger than the latter, so that aggregate CSR spending increased in this sample.
Additional tests suggest that the latter effect does not seem attributable to mean reversion in CSR
spending. We explore various explanations for this presumably unintended consequence of
Section 135.
The paper also seeks to elucidate some of the wider implications of this policy for
understanding the role of CSR. CSR mandates seem analogous to taxes but are also different in
important respects. We explore the conditions under which CSR mandates on firms may be
optimal responses by a (relatively benevolent) government to concerns with the provision of
these activities by the government (e.g., governance failures, weak information on the part of the
government on effective providers of CSR services, or corruption at mid-level government
bodies). More generally, the pioneering episode of mandated CSR represented by Section 135
provides both a new source of quasi-experimental evidence and highlights the need for new
conceptual frameworks to understand the wider implications of CSR.
Finally, we emphasize that our paper focuses on assessing the firm value, CSR spending
and other outcomes of a rule mandating CSR in India. Our results cannot necessarily be
extrapolated to the effects of voluntary CSR spending in other countries or to the social value
(rather than private firm value) of CSR. Indeed, some prior research has found evidence that
voluntary CSR in the US is profitable and valuable to firms and to society (Ioannou and Serafeim
2015, Flammer 2015). Nonetheless, it is important to emphasize that the mandatory nature of the
CSR requirement provides quasi-experimental variation in CSR activity, which is particularly
valuable for addressing important research questions related to CSR. Our research analyzes these
questions in the Indian context, and generates insights for exploring the wider implications of
CSR.
The paper proceeds as follows. Section 2 discusses the legislative history of the
Companies Act of 2013 and identifies the key event dates. Section 3 presents a simple model of
CSR spending. Section 4 describes the dataset and presents the empirical strategy and results.
Section 5 discusses the implications of the results, and Section 6 concludes.
6
2) The Legislative History of the Companies Act of 2013 and of Section 135
India is the first country to require that some firms spend a percentage of their profits on
socially responsible activities (as designated by law), or explain why they do not. This rule is
part of Section 135 of the Companies Act 2013, which lays out the approach to CSR in two
broad steps – first, by specifying which firms are subject to Section 135, and second, by
specifying the obligations of these firms. Section 135 only applies to firms that satisfy at least
one of three thresholds in any financial year – either having net worth (the face value of shares
originally issued by the corporation, adjusted for subsequent retained earnings and various
reserves) exceeding INR 5 billion (~USD 77 Million),8 turnover (i.e., sales) exceeding INR 10
billion (~USD 154 Million), or net profits exceeding INR 50 million (~USD 770,000).9 All
publicly traded and privately held firms with operations in India (including foreign-owned firms)
are subject to Section 135 if they cross any of the thresholds.10 Moreover, the “in any financial
year” language appears to indicate that these thresholds apply going forward from the effective
date of the Companies Act 2013.
If a firm crosses any of these thresholds, then:
(i) it must constitute a “Corporate Social Responsibility” (CSR) committee with 3
directors, of which one must be independent, 11
(ii) it must disclose the composition of the CSR committee, 12
(iii) the CSR committee must formulate a CSR policy recommending the kinds and
amounts of CSR spending the firm is to pursue and the committee must monitor that
policy,13
(iv) the Board is to approve and publicize the firm’s CSR policy (after taking into
account the CSR committee’s recommendations) and to ensure that the policy is
followed,14 and
8 Net worth is based on a firm’s “paid up share capital” (the number of shares outstanding, multiplied by the face value at which the share certificates were originally issued), but also takes account of the face value of preferred stock, and adjusts for retained earnings and various reserves (see Dharmapala and Khanna, 2013). 9 Section 135 (1), Companies Act 2013. The US Dollar totals are based on an exchange rate of 1 USD = 65 INR. 10 Ministry of Corporate Affairs, Companies (Corporate Social Responsibility Policy) Rules (2014) (hereinafter CSR Rules). 11 Id. 12 Section 135 (2), Companies Act 2013. 13 Section 135 (3), Companies Act 2013. 14 Section 135 (4), Companies Act 2013.
7
(v) the Board is to ensure that the firm spends at least 2% of the firm’s average net
profits (over the last 3 years) on activities listed in the firm’s CSR Policy or provide
reasons for why this spending level was not achieved (i.e., a “comply-or-explain”
rule).15
It is noteworthy that the “comply-or-explain” rule only applies to the amount spent on
CSR (i.e., 2% of average net profits); the other requirements (items (i) to (iv)) are mandatory and
failure to meet them would trigger liability regardless of what explanation was provided. Failure
to meet the 2% spending requirement would not trigger liability if an acceptable explanation for
failing to meet it was provided (although it is not entirely clear to whom such an explanation
must be provided and what the standard of “acceptability” is). If such an explanation is not
provided and the firm failed to spend at least 2% of average net profits on CSR activities then
liability would be triggered here too. The penalty on the firm and every officer of the firm who
violates Section 135 is INR 10,000 for the first day of the violation plus an additional INR 1,000
a day if the violation continues.16
Finally, the Ministry of Corporate Affairs (MCA) has promulgated a set of rules in 2014
that provides a list of the activities that satisfy the requirement for CSR spending.17 The activities
listed are very broad and cover a large swath of what is typically considered CSR and perhaps
more (e.g., spending on education, health, poverty eradication, environment, arts, gender
equality, reducing other inequalities, some designated government programs, funds for
technology incubators in Government Academic institutions),18 thereby leaving firms with
considerable discretion in directing their CSR spending. However, the MCA’s rules do not count
as CSR spending those expenditures that would have been undertaken in the normal course of
15 Section 135 (5), Companies Act 2013. Section 135 (5) also notes that the firm should give preference to CSR spending in its local areas; this has generated some negative commentary (Afsharipour and Rana, 2014). 16 Section 450, Companies Act 2013 (also attaching liability to other persons who are in default). Although it is not clear who is to enforce Section 135 from its wording, one can assume that it is the Ministry of Corporate Affairs. Note that if the violation is repeated within a 3 year period the fine can be doubled – Section 451, Companies Act 2013. 17 CSR Rules (2014). These rules become part of Schedule VII of the Companies Act 2013. 18 CSR Rules (2014).
8
business, that are meant to benefit employees or political parties, or that relate to activities
occurring outside of India.19
Section 135 is part of the Companies Act 2013, which has been the subject of discussion
for quite some time. Prior to the 2013 Act, India’s Companies Law was governed by the
Companies Act 1956 and there had been considerable interest in overhauling it since India began
the process of liberalizing its economy in the 1990s.20 The first public intimation of the
Government’s interest in socially responsible spending by firms came in December 2009 when
the Ministry of Corporate Affairs (MCA) released a voluntary code on corporate social
responsibility that exhorted firms to engage in socially responsible behavior (CSR Voluntary
Guidelines (2009)).21 These voluntary guidelines did not appear to have much effect - CSR
activity was by no means common among Indian firms even after the 2009 guidelines
(Afsharipour, 2011; Van Zile, 2012).22
An important news story on August 6, 2010 revealed that the Government was planning
to enact a new provision in the Companies Law that would require firms above certain thresholds
to develop a CSR Policy to ensure that they contributed at least 2% of their annual net profits to
CSR.23 The thresholds quoted in the news story are precisely the same ones that became part of
19 CSR Rules (2014). These rules also note that CSR activities can be undertaken through a third party registered society, trust or Section 8 (of the Companies Act) entity, or by a similar entity of the firm, or via collaboration with other firms or entities. 20 The Irani Committee Report (2005) proposed a series of changes to India’s Companies Law that would have granted firms greater power to customize corporate governance to suit their ends. Although the report did not contain any provisions on CSR, it did note that corporations were expected to contribute not just to the economic well-being of the country but also to its social well-being. 21 Although the voluntary guidelines did not require firms to engage in CSR, they brought into focus concerns that had been percolating for some time. These included concerns that India’s phased liberalization program, that began in earnest around 1991, may have benefited only a small subset of players in the economy, that income inequality had grown, and that the “business sector also needs to take the responsibility of exhibiting socially responsible business practices that ensures the distribution of wealth and well being of the communities in which the business operates” (CSR Voluntary Guidelines (2009, p. 5)). Absent some attempts to balance these effects (such as a CSR initiative), continuing liberalization was likely to face some strong political headwinds (Van Zile, 2012). Moreover, academic discussion in India seemed to be moving toward a “trusteeship” model of governance that appeared more likely to facilitate CSR regulation (Balasubramanian, 2010). 22 See Standing Committee on Finance, Twenty-First Report (The Companies Bill, 2009), Lok Sabha, Clause 49, available at http://www.prsindia.org/uploads/media/Companies%20Bill%202009.pdf. See also Times Foundation, Corporate Social Responsibility Practices in India (2010). Available at http://timesfoundation.indiatimes.com/articleshow/4662536.cms. See also Viji Sundaram, Vinod Khosla To Donate Half His Fortune to Charity, New America Media, May 18, 2011. Available at: http://ethnoblog.newamericamedia.org/2011/05/vinod-khosla-to-donate-half-his-fortune-to-charity.php. 23 See Mandatory CSR not a great idea, feels India Inc., MONEYCONTROL, CNBC-TV18 News, August 6, 2010. Available at: http://www.moneycontrol.com/news/business/mandatory-csr-notgreat-idea-feels-india-inc_475926.html. This was also discussed in a closely followed Blog website on corporate matters in India. See
9
Section 135, as is the 2% requirement. No other provision in the Companies Act or earlier
Companies Bills used these thresholds. Thus, this is – to the best of our knowledge - the first
time the market learned of a mandatory CSR requirement, the amount involved, and the
applicable thresholds. The news story does not, however, discuss the possibility of requiring a
CSR committee.
The response of Indian business (often known collectively as “India Inc.”) to this
proposal was decidedly negative.24 In short order, the Confederation of Indian Industry (a very
large trade group) came out against such a rule, as did others.25 These concerns not only reflected
worries about mandating behavior previously thought to be voluntary, but also concerns that the
CSR mandate might signal instability in the overall liberalization process. Despite the negative
reaction of India Inc., the draft of the proposed CSR requirement put forward by the Standing
Committee of Finance on September 8, 2010 largely tracks the news report of August 6, 2010.
However, it appears to be silent on a penalty for non-compliance, preferring to rely on disclosure
of non-compliance as the remedy.26 However, by December 24, 2010 news reports indicate that
the Government began to back away from its mandatory CSR requirement and now seemed to be
adopting a “comply-or-explain” rule rather than a mandatory one.27 This was largely confirmed
by February 10, 2011 when news reports emerged that the MCA was planning to accept the
Standing Committee on Finance’s recommendations on CSR but would rely on a “comply-or-
explain” rule as its enforcement mechanism on the 2% spending requirement.28 More
commentary on the move away from mandatory CSR appeared on March 14, 2011.29
Umakanth Varottil, Viability of Mandatory CSR, INDIACORPLAWBLOG, August 7, 2010. Available at: http://indiacorplaw.blogspot.com/2010/08/viability-of-mandatory-csr.html. 24 As early as the first news reports on August 6, 2010, Indian firms responded with concerns about mandating CSR. See MONEYCONTROL, CNBC-TV18 News, August 6, 2010, op. cit. 25 See Akhila Vijayaraghavan, Indian Industries Oppose Mandatory CSR Reporting, JUST MEANS, August 16, 2010. Available at: http://www.justmeans.com/editorials?action=readeditorial&p=26759. IT CEOs back Premji against mandatory CSR, TIMES OF INDIA, March 26, 2011. Available at: http://articles.timesofindia.indiatimes.com/2011-03-26/software-services/29191926_1_csr-azim-premji-corporate-social-responsibility; CSR Spend on Cards for India Inc., INDIAN EXPRESS, February 9, 2011. Available at: http://www.indianexpress.com/news/2-csr-spend-on-cards-for-india-inc/747860/0. 26 See India Inc faces 2% CSR levy, BUSINESS STANDARD, September 8, 2010. Available at: http://www.business-standard.com/article/economy-policy/india-inc-faces-2-csr-levy-110090800022_1.html. 27 See It’s Their Business, TIMES OF INDIA, December 24, 2010. Available at: http://timesofindia.indiatimes.com/edit-page/Its-Their-Business/articleshow/7152001.cms. 28 See Sidhartha, Companies Law Set to Mandate 2% CSR Spend, TIMES OF INDIA, February 10, 2011. Available at: http://timesofindia.indiatimes.com/india/Companies-law-set-to-mandate-2-CSR-spend/articleshow/7464529.cms. 29 See Akhila Vijayaraghavan, India CSR: 2% Spend No Longer Mandatory, Govt Rules, JUST MEANS, March 14, 2011 (noting that people should move away from a “mandatory or not” discussion towards a discussion on how CSR
10
The discussion of the mandatory or comply-or-explain rule was officially settled on July
11, 2011 when the Companies Bill was tabled in front of the lower house of Parliament (the Lok
Sabha) containing the provision that became Section 135 and the “comply-or-explain”
language.30 The Bill sat in the Lok Sabha for some time and was finally enacted by it on
December 18, 2012. The Bill then went to the upper house of Parliament (the Rajya Sabha) and
was enacted by it on August 8, 2013, receiving Presidential Assent on August 29, 2013.31 A
summary of the dates on which relevant events and news stories occurred is provided in Table 1.
3) A Simple Model of CSR Spending
Before proceeding to the empirical analysis, we develop a simple theoretical framework
for analyzing firms’ decisions regarding CSR spending. Consider a firm that has exogenous
value 𝑉 in the absence of CSR activity. Let 𝑥! be the firm’s expenditures on CSR activity. These
expenditures are assumed to generate a benefit 𝐵(𝑥!) for firm value (for instance, due to
favorable publicity). We assume that 𝐵(𝑥!) ≥ 0, allowing for the possibility that CSR spending
generates no private returns for the firm (i.e. that 𝐵 𝑥! ≡ 0 for all values of 𝑥!). When 𝐵(𝑥!)
takes on nonzero values, we assume that it is increasing and concave (i.e. that 𝐵′ 𝑥! > 0 and
𝐵′′ 𝑥! < 0), that 𝐵 0 = 0, and that lim!!→! 𝐵′ 𝑥! = ∞; these assumptions imply an interior
optimum when 𝐵(𝑥!) takes on nonzero values. Taking into account the consequences of CSR
spending, the value of the firm (denoted by 𝑉!) can be expressed as:
𝑉! = 𝑉 + 𝐵 𝑥! − 𝑥! (1)
The firm is assumed to have a controlling shareholder who owns a fraction 𝛼 < 1 of its
stock. It is assumed that 𝛼 is sufficiently large to assure effective control of the firm (for
instance, 𝛼 > 0.5). This scenario reflects the ownership structure and governance environment
that is typical of Indian firms. The controller has exogenous private wealth 𝑊, in addition to her
ownership of the firm’s stock. She is assumed to derive utility 𝑢(𝐺) from a public good (which
is a valid business strategy). Available at: http://www.justmeans.com/blogs/india-csr-2-spend-no-longer-mandatory-govt-rules. 30 The Companies Bill (Proposed), 2011, No. 121, Lok Sabha, Clause 135, http://www.mca.gov.in/Ministry/pdf/The_Companies_Bill_2011.pdf. 31 Other government regulatory agencies were also gearing up for the introduction of CSR requirements. The Securities and Exchange Board of India (SEBI) – the securities markets regulator – has required since August 13, 2012 that the top 100 firms produce and disclose “business responsibility reports” and file them with SEBI. See SEBI Circular CIR/CFD/DIL/8/2012, August 13, 2012.
11
can be provided by personal charitable activity as well as through firms’ CSR activity). 𝐺 is the
aggregate supply of the public good, defined as follows:
𝐺 = 𝐷 + 𝑥! + 𝑥! (2)
𝐷 is the exogenous amount that is supplied by all other individuals and firms in society (apart
from the controller and the firm she controls),32 while 𝑥! denotes the amount of personal
contributions to the public good made by the controller. In a complete analysis, both 𝑥! and 𝑥!
would be chosen simultaneously by the controller. However, our dataset does not enable us to
link firms’ CSR activity with personal charitable activities by firms’ controlling families or
individuals. Thus, in the analysis that follows, we generally treat 𝑥! as being fixed (and denote
this fixed value by 𝑥!).
We assume that 𝑢(𝐺) ≥ 0, allowing for the possibility that the controller does not derive
any utility from the public good (i.e. that 𝑢(𝐺) ≡ 0 for all values of 𝐺). When 𝑢(𝐺) takes on
nonzero values, we assume that it is increasing and concave (i.e. that 𝑢′ 𝐺 > 0 and 𝑢′′ 𝐺 < 0),
that 𝑢 0 = 0, and that lim!→! 𝑢! 𝐺 = ∞; these assumptions imply an interior optimum when
𝑢(𝐺) takes on nonzero values. The controller’s payoff consists of her utility (if any) from the
public good,33 her personal wealth (net of any personal spending on the public good), and her pro
rata share of the firm’s value. Assuming for simplicity an additively separable quasi-linear
functional form, her payoff (denoted 𝑈!) can be expressed as:
𝑈! = 𝑢 𝐺 +𝑊 − 𝑥! + 𝛼 𝑉 + 𝐵 𝑥! − 𝑥! (3)
The controller chooses 𝑥! to maximize 𝑈!; this (privately) optimal choice of 𝑥! is denoted by
𝑥!∗ .
As described in Section 2, the general aim of Section 135 is to encourage greater CSR
activity by firms. In view of this, it is somewhat paradoxical that one of the central conclusions
that emerges from the framework presented here is that firms will typically engage in too much
CSR activity, from the perspective of minority shareholders, when the controller has altruistic
32 𝐷 is assumed to be exogenous for simplicity, and because the charitable activities of the controller and her firm are typically likely to be small in relation to the aggregate amount of charitable activity. However, it is possible that the charitable activity of a particularly wealthy and influential controller may induce others to contribute, especially when there exist network effects (Flammer 2015) or increasing returns to scale for certain types of charitable activity. 33 As the controller is assumed to care about the aggregate value of 𝐺 (rather than about her own contributions), this model is one of “pure” altruism. However, the results would not be fundamentally different if we were to incorporate “impure” altruism or “warm-glow” preferences (Andreoni, 1990), in which the controller also derives utility from the amount of her own contributions and/or from the amount spent by the firm on CSR activity.
12
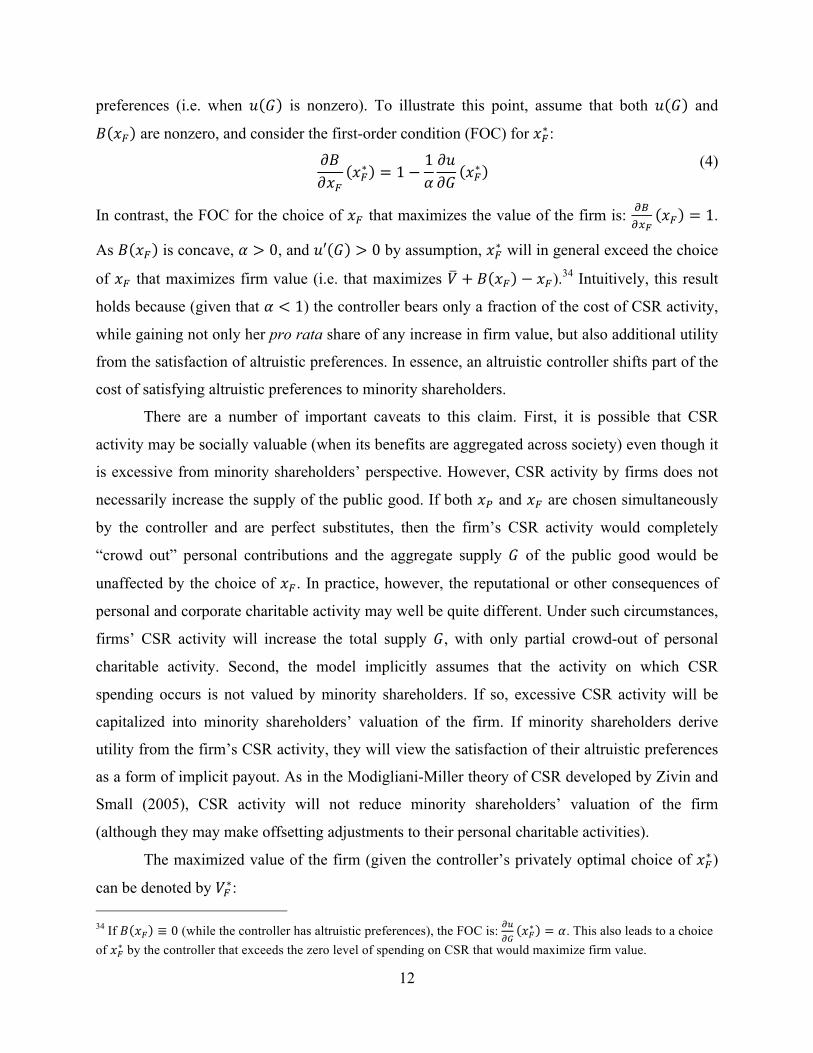
preferences (i.e. when 𝑢 𝐺 is nonzero). To illustrate this point, assume that both 𝑢 𝐺 and
𝐵 𝑥! are nonzero, and consider the first-order condition (FOC) for 𝑥!∗ :
𝜕𝐵𝜕𝑥!
𝑥!∗ = 1−1𝛼𝜕𝑢𝜕𝐺 𝑥!∗
(4)
In contrast, the FOC for the choice of 𝑥! that maximizes the value of the firm is: !"!!!
𝑥! = 1.
As 𝐵 𝑥! is concave, 𝛼 > 0, and 𝑢′ 𝐺 > 0 by assumption, 𝑥!∗ will in general exceed the choice
of 𝑥! that maximizes firm value (i.e. that maximizes 𝑉 + 𝐵 𝑥! − 𝑥!).34 Intuitively, this result
holds because (given that 𝛼 < 1) the controller bears only a fraction of the cost of CSR activity,
while gaining not only her pro rata share of any increase in firm value, but also additional utility
from the satisfaction of altruistic preferences. In essence, an altruistic controller shifts part of the
cost of satisfying altruistic preferences to minority shareholders.
There are a number of important caveats to this claim. First, it is possible that CSR
activity may be socially valuable (when its benefits are aggregated across society) even though it
is excessive from minority shareholders’ perspective. However, CSR activity by firms does not
necessarily increase the supply of the public good. If both 𝑥! and 𝑥! are chosen simultaneously
by the controller and are perfect substitutes, then the firm’s CSR activity would completely
“crowd out” personal contributions and the aggregate supply 𝐺 of the public good would be
unaffected by the choice of 𝑥!. In practice, however, the reputational or other consequences of
personal and corporate charitable activity may well be quite different. Under such circumstances,
firms’ CSR activity will increase the total supply 𝐺, with only partial crowd-out of personal
charitable activity. Second, the model implicitly assumes that the activity on which CSR
spending occurs is not valued by minority shareholders. If so, excessive CSR activity will be
capitalized into minority shareholders’ valuation of the firm. If minority shareholders derive
utility from the firm’s CSR activity, they will view the satisfaction of their altruistic preferences
as a form of implicit payout. As in the Modigliani-Miller theory of CSR developed by Zivin and
Small (2005), CSR activity will not reduce minority shareholders’ valuation of the firm
(although they may make offsetting adjustments to their personal charitable activities).
The maximized value of the firm (given the controller’s privately optimal choice of 𝑥!∗ )
can be denoted by 𝑉!∗: 34 If 𝐵 𝑥! ≡ 0 (while the controller has altruistic preferences), the FOC is: !"
!"𝑥!∗ = 𝛼. This also leads to a choice
of 𝑥!∗ by the controller that exceeds the zero level of spending on CSR that would maximize firm value.
13
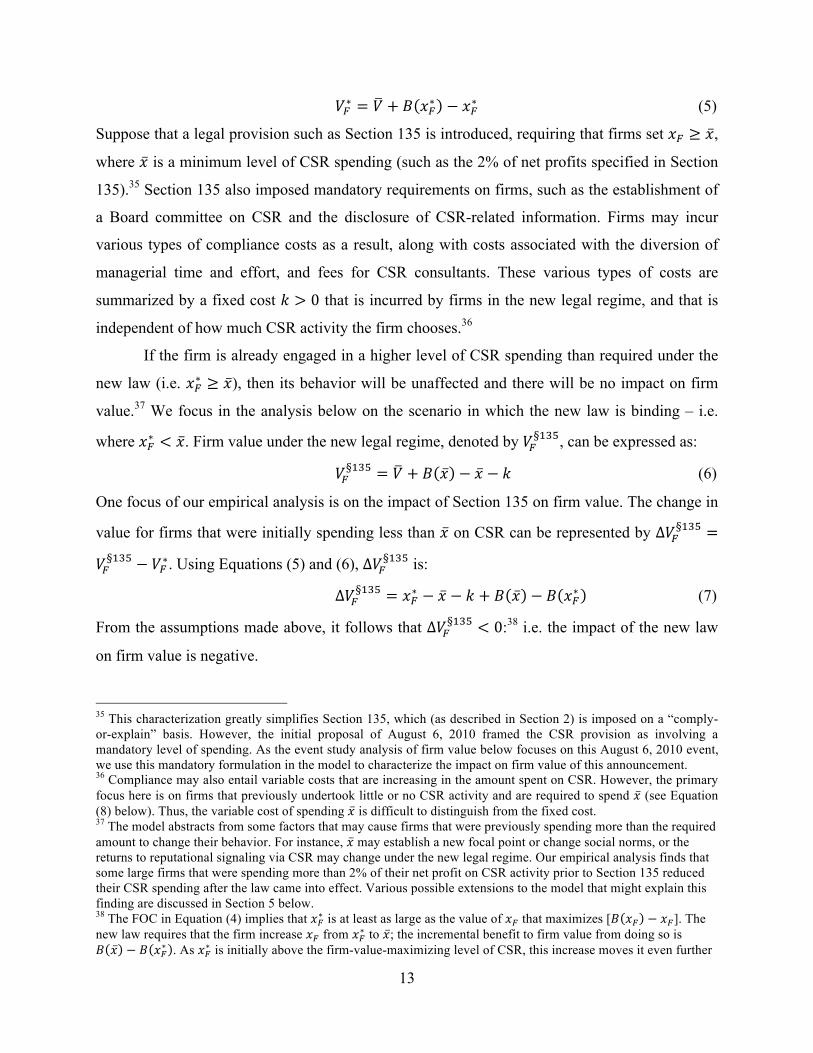
𝑉!∗ = 𝑉 + 𝐵 𝑥!∗ − 𝑥!∗ (5)
Suppose that a legal provision such as Section 135 is introduced, requiring that firms set 𝑥! ≥ 𝑥,
where 𝑥 is a minimum level of CSR spending (such as the 2% of net profits specified in Section
135).35 Section 135 also imposed mandatory requirements on firms, such as the establishment of
a Board committee on CSR and the disclosure of CSR-related information. Firms may incur
various types of compliance costs as a result, along with costs associated with the diversion of
managerial time and effort, and fees for CSR consultants. These various types of costs are
summarized by a fixed cost 𝑘 > 0 that is incurred by firms in the new legal regime, and that is
independent of how much CSR activity the firm chooses.36
If the firm is already engaged in a higher level of CSR spending than required under the
new law (i.e. 𝑥!∗ ≥ 𝑥), then its behavior will be unaffected and there will be no impact on firm
value.37 We focus in the analysis below on the scenario in which the new law is binding – i.e.
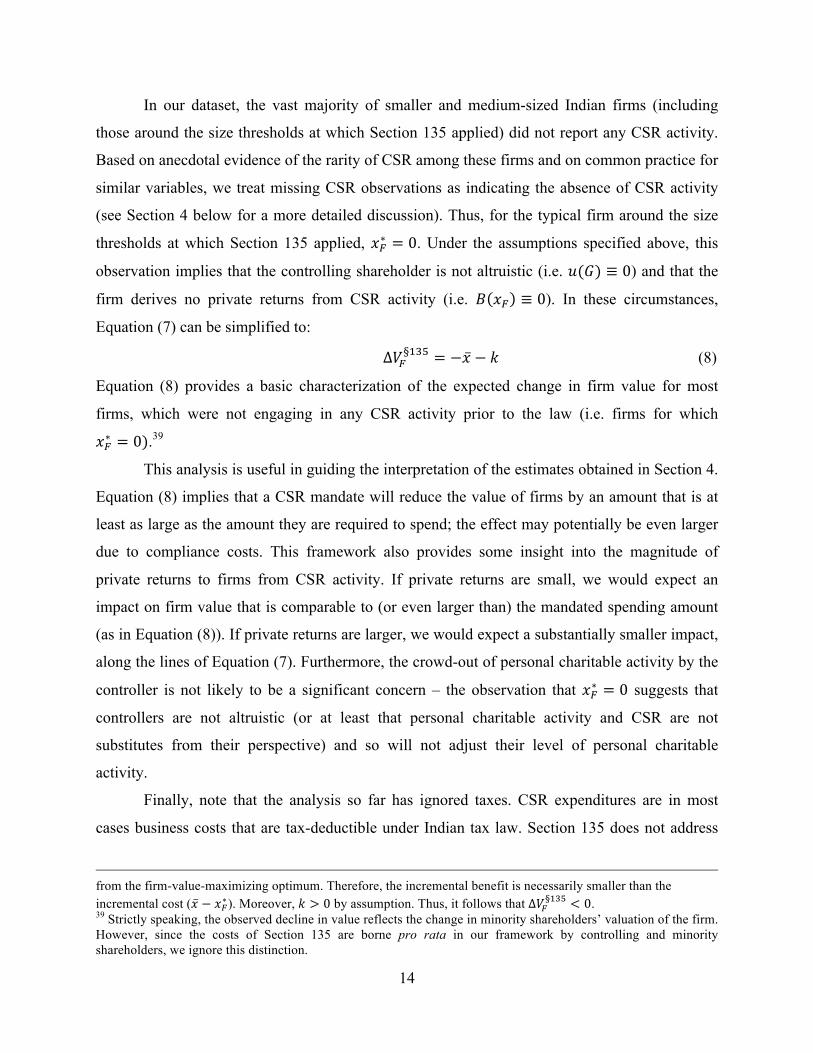
where 𝑥!∗ < 𝑥. Firm value under the new legal regime, denoted by 𝑉!§"#$, can be expressed as:
𝑉!§"#$ = 𝑉 + 𝐵 𝑥 − 𝑥 − 𝑘 (6)
One focus of our empirical analysis is on the impact of Section 135 on firm value. The change in
value for firms that were initially spending less than 𝑥 on CSR can be represented by Δ𝑉!§"#$ =
𝑉!§"#$ − 𝑉!∗. Using Equations (5) and (6), Δ𝑉!
§"#$ is:
Δ𝑉!§"#$ = 𝑥!∗ − 𝑥 − 𝑘 + 𝐵 𝑥 − 𝐵 𝑥!∗ (7)
From the assumptions made above, it follows that Δ𝑉!§"#$ < 0:38 i.e. the impact of the new law
on firm value is negative.
35 This characterization greatly simplifies Section 135, which (as described in Section 2) is imposed on a “comply-or-explain” basis. However, the initial proposal of August 6, 2010 framed the CSR provision as involving a mandatory level of spending. As the event study analysis of firm value below focuses on this August 6, 2010 event, we use this mandatory formulation in the model to characterize the impact on firm value of this announcement. 36 Compliance may also entail variable costs that are increasing in the amount spent on CSR. However, the primary focus here is on firms that previously undertook little or no CSR activity and are required to spend 𝑥 (see Equation (8) below). Thus, the variable cost of spending 𝑥 is difficult to distinguish from the fixed cost. 37 The model abstracts from some factors that may cause firms that were previously spending more than the required amount to change their behavior. For instance, 𝑥 may establish a new focal point or change social norms, or the returns to reputational signaling via CSR may change under the new legal regime. Our empirical analysis finds that some large firms that were spending more than 2% of their net profit on CSR activity prior to Section 135 reduced their CSR spending after the law came into effect. Various possible extensions to the model that might explain this finding are discussed in Section 5 below. 38 The FOC in Equation (4) implies that 𝑥!∗ is at least as large as the value of 𝑥! that maximizes [𝐵 𝑥! − 𝑥!]. The new law requires that the firm increase 𝑥! from 𝑥!∗ to 𝑥; the incremental benefit to firm value from doing so is 𝐵 𝑥 − 𝐵 𝑥!∗ . As 𝑥!∗ is initially above the firm-value-maximizing level of CSR, this increase moves it even further
14
In our dataset, the vast majority of smaller and medium-sized Indian firms (including
those around the size thresholds at which Section 135 applied) did not report any CSR activity.
Based on anecdotal evidence of the rarity of CSR among these firms and on common practice for
similar variables, we treat missing CSR observations as indicating the absence of CSR activity
(see Section 4 below for a more detailed discussion). Thus, for the typical firm around the size
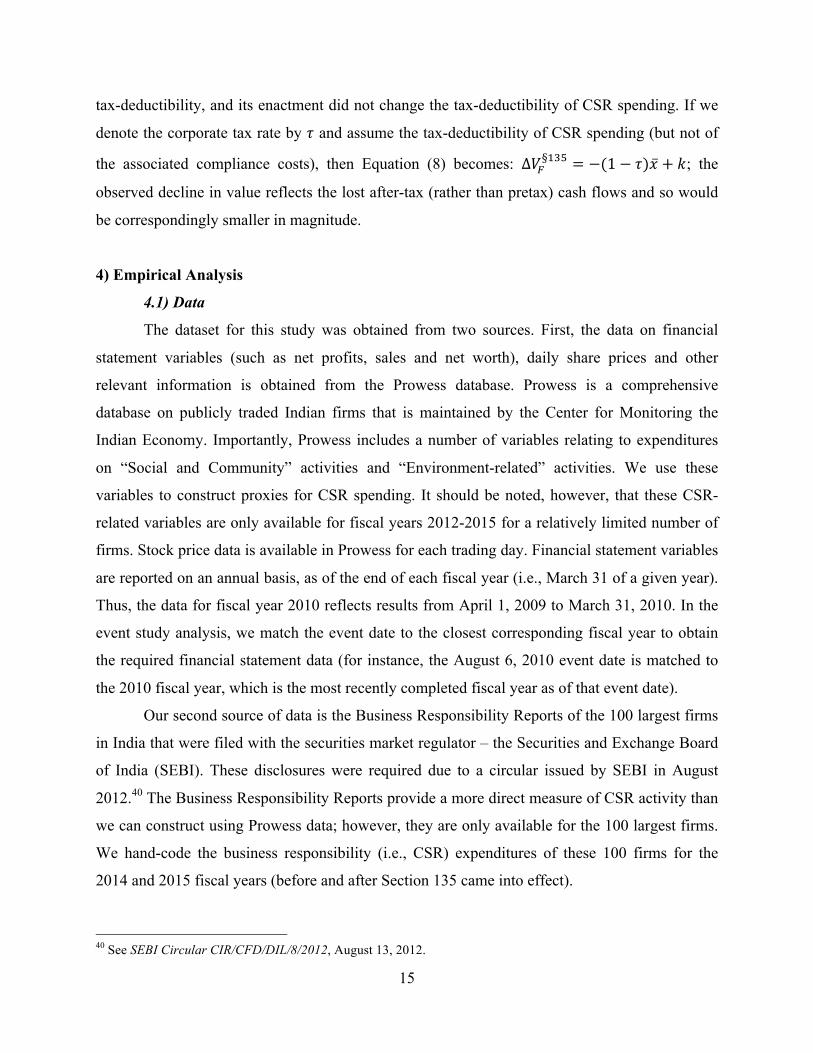
thresholds at which Section 135 applied, 𝑥!∗ = 0. Under the assumptions specified above, this
observation implies that the controlling shareholder is not altruistic (i.e. 𝑢(𝐺) ≡ 0) and that the
firm derives no private returns from CSR activity (i.e. 𝐵 𝑥! ≡ 0). In these circumstances,
Equation (7) can be simplified to:
Δ𝑉!§"#$ = −𝑥 − 𝑘 (8)
Equation (8) provides a basic characterization of the expected change in firm value for most
firms, which were not engaging in any CSR activity prior to the law (i.e. firms for which
𝑥!∗ = 0).39
This analysis is useful in guiding the interpretation of the estimates obtained in Section 4.
Equation (8) implies that a CSR mandate will reduce the value of firms by an amount that is at
least as large as the amount they are required to spend; the effect may potentially be even larger
due to compliance costs. This framework also provides some insight into the magnitude of
private returns to firms from CSR activity. If private returns are small, we would expect an
impact on firm value that is comparable to (or even larger than) the mandated spending amount
(as in Equation (8)). If private returns are larger, we would expect a substantially smaller impact,
along the lines of Equation (7). Furthermore, the crowd-out of personal charitable activity by the
controller is not likely to be a significant concern – the observation that 𝑥!∗ = 0 suggests that
controllers are not altruistic (or at least that personal charitable activity and CSR are not
substitutes from their perspective) and so will not adjust their level of personal charitable
activity.
Finally, note that the analysis so far has ignored taxes. CSR expenditures are in most
cases business costs that are tax-deductible under Indian tax law. Section 135 does not address
from the firm-value-maximizing optimum. Therefore, the incremental benefit is necessarily smaller than the incremental cost (𝑥 − 𝑥!∗ ). Moreover, 𝑘 > 0 by assumption. Thus, it follows that Δ𝑉!
§"#$ < 0. 39 Strictly speaking, the observed decline in value reflects the change in minority shareholders’ valuation of the firm. However, since the costs of Section 135 are borne pro rata in our framework by controlling and minority shareholders, we ignore this distinction.
15
tax-deductibility, and its enactment did not change the tax-deductibility of CSR spending. If we
denote the corporate tax rate by 𝜏 and assume the tax-deductibility of CSR spending (but not of
the associated compliance costs), then Equation (8) becomes: Δ𝑉!§"#$ = −(1− 𝜏)𝑥 + 𝑘; the
observed decline in value reflects the lost after-tax (rather than pretax) cash flows and so would
be correspondingly smaller in magnitude.
4) Empirical Analysis
4.1) Data
The dataset for this study was obtained from two sources. First, the data on financial
statement variables (such as net profits, sales and net worth), daily share prices and other
relevant information is obtained from the Prowess database. Prowess is a comprehensive
database on publicly traded Indian firms that is maintained by the Center for Monitoring the
Indian Economy. Importantly, Prowess includes a number of variables relating to expenditures
on “Social and Community” activities and “Environment-related” activities. We use these
variables to construct proxies for CSR spending. It should be noted, however, that these CSR-
related variables are only available for fiscal years 2012-2015 for a relatively limited number of
firms. Stock price data is available in Prowess for each trading day. Financial statement variables
are reported on an annual basis, as of the end of each fiscal year (i.e., March 31 of a given year).
Thus, the data for fiscal year 2010 reflects results from April 1, 2009 to March 31, 2010. In the
event study analysis, we match the event date to the closest corresponding fiscal year to obtain
the required financial statement data (for instance, the August 6, 2010 event date is matched to
the 2010 fiscal year, which is the most recently completed fiscal year as of that event date).
Our second source of data is the Business Responsibility Reports of the 100 largest firms
in India that were filed with the securities market regulator – the Securities and Exchange Board
of India (SEBI). These disclosures were required due to a circular issued by SEBI in August
2012.40 The Business Responsibility Reports provide a more direct measure of CSR activity than
we can construct using Prowess data; however, they are only available for the 100 largest firms.
We hand-code the business responsibility (i.e., CSR) expenditures of these 100 firms for the
2014 and 2015 fiscal years (before and after Section 135 came into effect).
40 See SEBI Circular CIR/CFD/DIL/8/2012, August 13, 2012.
16
4.2) The Impact of Section 135 on Firm Value
Event studies use a variety of approaches to estimate firms’ normal or predicted returns.
We use the market model, which does not rely on any specific economic assumptions. Using
daily stock price data from Prowess, we compute abnormal returns for the firms in our sample
over a (-3, +3) event window for each of the events identified in Section 2 (i.e. we consider the
market reaction over a period extending from 3 trading days prior to the event to 3 trading days
following the event). This event window accommodates some degree of anticipation prior to the
event, and allows some scope for delayed reactions.
The market model uses daily returns for each firm i and for the market, and can be
represented as follows (e.g. Bhagat and Romano, 2002, p. 146; Dharmapala and Khanna, 2016):
𝑅!" = 𝑎! + 𝑏!𝑀! + 𝑒!" (9)
where Rit is firm i’s return on day t, 𝑀! is the market return on day t, and 𝑒!" is the error term.
We run this regression separately for each firm over an estimation window that consists of a year
of daily returns data prior to the event window. We use the results to compute a predicted return
for each firm on each day of the relevant event window. We then subtract this predicted return
from the actual return on each day of the event window to obtain the abnormal return for each
firm i on each of these days. These abnormal returns are then summed to compute cumulative
abnormal returns (CARs) for each firm for the event window.
The quasi-experimental variation in this study is attributable to the use in Section 135 of
specific bright-line thresholds to determine the applicability of the CSR provision. As noted
previously, the threshold for the application of Section 135 is multi-faceted, based on turnover,
net profits and net worth. The net worth and sales thresholds are set at levels that apply to around
a quarter of Indian firms, while the net profit threshold is set around the profits earned by the
median firm (and so applies to about half of the firms in the Prowess database). It is thus
typically the net profit threshold that is binding - virtually all firms that satisfy the net worth or
sales thresholds also satisfy the profit threshold, whereas many firms satisfy the net profit
threshold without satisfying the other criteria. We therefore focus on the net profit threshold in
our primary empirical tests and discuss why this is a particularly powerful identification strategy
after presenting our main results.41
41 In order to ensure that these tests use only firms for which the net profit threshold is relevant, we exclude from the analysis any firm that satisfies either the sales or the net worth threshold. This exclusion affects very few firms close
17
An RD design can be implemented statistically in a number of different ways. A
particularly influential approach is the use of nonparametric local polynomial regressions (e.g.
Hahn, Todd, and van der Klaauw, 2001; Calonico, Cattaneo, and Titiunik (2014a), hereafter
CCT). A local polynomial regression involves fitting a weighted least squares regression to each
observation, using data from a neighborhood close to that observation; this data is weighted in
some specific way by the distance to the observation of interest. Weighting the data requires a
choice of “bandwidth” – i.e. the width of the set of observations used for the regression. There
are a number of approaches to the selection of the bandwidth (e.g. Imbens and Kalyanaraman,
2012); our reported results use a bandwidth that optimizes mean squared error.
Intuitively, the nonparametric local polynomial regression approach involves estimating
local polynomial regressions separately above and below the threshold. The RD treatment effect
is estimated as the difference in the values of the regression functions at the threshold.
Observations are weighted by their proximity to the cutoff, with observations close to the
threshold receiving more weight. CCT (2014a) develop a new approach to estimating confidence
intervals for RD estimators based on local polynomial regressions, which is used in deriving
robust standard errors in the analysis below.42
The intuition underlying this RD approach (and our result on firm value) can be
illustrated by Figure 1. This plots the CARs around the August 6, 2010 event date for firms that
reported net profit in fiscal year 2010 in the range of INR 40 million to INR 60 million,
representing a range of net profit centered on and close to the INR 50 million cutoff. The CARs
are Winsorized on both sides at 5% in order to address potential outliers. The three different
figures show local polynomial regression functions estimated separately above and below the
cutoff, using polynomials of order 1, 2, and 3, respectively.43 As might be expected given the
noise associated with stock returns, the plot of the CARs is quite scattered, and does not
immediately suggest a sharp break at the threshold. However, all three panels of Figure 1 show a
substantial difference in the values of the regression functions at the threshold. This pattern
to the net profit threshold – for instance, in the OLS implementation of the RD design that is restricted to firms with net profit in the range INR zero to 100 million (see Table 5 below), only 3 firms are excluded because they meet either the sales or net worth criteria. 42 CCT (2014b) provide a Stata command (“rdrobust”) that implements their approach and other commonly-used approaches to RD estimation using local polynomial regressions; we use this package in generating the RD estimates described below. 43 There is no generally optimal order of the polynomial, so we illustrate regression functions using polynomials of three different orders.
18
implies a negative RD estimate of the impact of Section 135 on firm value, and this appears to be
robust to the choice of the order of the polynomial.
Table 2 reports the RD estimates obtained using a local polynomial regression approach
for each of the event dates of interest.44 The first announcement of a mandatory CSR requirement
(using the thresholds that we have described) occurred on August 6, 2010. Our RD estimate
indicates a substantial decrease in firm value around that date for firms that were expected to be
affected by the CSR mandate. The estimate implies a reduction in firm value of 3.3%, relative to
unaffected firms. This is of borderline statistical significance, using the CCT (2014a) approach to
computing robust standard errors. In particular, the z-statistic is -1.84 and the p-value is 0.066,
implying significance at the 7% level. While its statistical significance is admittedly only
marginal, it should be borne in mind that data on abnormal stock returns is intrinsically very
noisy and thus some imprecision in the estimates might be expected.
We also undertake a number of placebo tests that involve positing a (nonexistent) legal
threshold at some other value of net profit. Figure 2 illustrates a placebo test around INR 100
million, and plots CARs around August 6, 2010 for firms that reported net profit in fiscal year
2010 in the range of INR 90 million to INR 110 million. There is little difference in the values of
the regression functions at this placebo “threshold.” Table 3 reports the RD estimates for placebo
tests at the INR 100 million and INR 150 million net profit levels for August 6, 2010 (using a
local polynomial regression approach). The results at these placebo “thresholds” are statistically
insignificant and the coefficients are quite small.
On December 24, 2010, media reports emerged of a relaxation in the CSR mandate
towards a “comply-or-explain” obligation. As shown in Table 2, the RD estimate for this event
date entails a positive market reaction of 1.2% for firms affected by the CSR provision, relative
to unaffected firms. This estimate, however, is not statistically significant.45 Table 2 also reports
the RD estimates for the subsequent event dates. All of these are statistically insignificant and
mostly quite small in magnitude.
44 These estimates are obtained using the Stata command “rdrobust” (CCT, 2014b), with a triangular kernel, bandwidth selected to optimize mean squared error, and a third-order polynomial. The results are mostly similar using lower-order polynomials. 45 The estimated effect around December 24, when combined with the estimated effect around August 6, would imply about a -2% net effect of the comply-or-explain CSR obligation. However, the insignificance of the December 24 result makes it difficult to draw this conclusion with any substantial degree of confidence.
19
In addition to the nonparametric local polynomial regression illustrated above, we also
use a straightforward ordinary least-squares (OLS) implementation of our RD design as an
additional robustness test. This involves running the following OLS regression:
𝐶𝐴𝑅! = 𝛼 + 𝛽§135! + 𝑓 𝜋! , 𝑠! ,𝑤! + 𝐗!𝛾 + 𝜖! (10)
𝐶𝐴𝑅! is the CAR computed for firm i around August 6, 2010. The function 𝑓 𝜋! , 𝑠! ,𝑤! is a
polynomial function of the three variables that determine the applicability of Section 135 – net
profit, sales, and net worth, respectively; the reported results use quadratic functions of these
variables. The variable of interest, §135!, is an indicator = 1 if Section 135 applies, and 0
otherwise. As firms that satisfy the sales or net worth criteria are excluded from the sample,
§135!= 1 when 𝜋! > INR 50 million. 𝐗! is a vector of control variables (in the reported results,
these are total assets, advertising expenditures, and export earnings), 𝛼 is a constant, and 𝜖! is the
error term. The sample is restricted to firms with net profit in the range of zero to INR 100
million in fiscal year 2010, to ensure that the estimate is based only on firms relatively close to
the threshold.
The OLS implementation of the RD design leads to quite similar conclusions. Table 4
provides descriptive statistics for CARs around August 6, 2010 and for control variables in fiscal
year 2010. Table 5 reports RD estimates using the OLS specification in Equation (12) for firms
in the zero to INR 100 million net profit band. Column 1 shows that firms to which Section 135
applies experience a firm value decline of about 2.6%, relative to unaffected firms. This is
marginally significant; the t-statistic is -1.79 and the p-value is 0.074, indicating significance at
about the 8% level. The magnitude is quite similar to that of the corresponding estimate in Table
3.
In principle, the model in Section 3 implies that this decline in firm value should apply
only to firms that engaged CSR spending below 2% of net profit. Unfortunately, we do not have
data on CSR spending in 2010; using the earliest available data (for 2012) and omitting the 19
firms that spent 2% or more of net profit on CSR in 2012 leads to very similar results to those in
Column 1.46 The estimated effect among firms that spent 2% or more of net profit on CSR in
2012 is positive and around 2%, but statistically insignificant (possibly due to the small sample
size). Such an effect may be consistent with a scenario in which these firms’ controllers were
originally overspending on CSR from the perspective of minority shareholders (as suggested by
46 The nonparametric RD estimate is also robust to omitting such firms.
20
Equation (4)), and where investors anticipated that CSR spending among such firms would fall
after Section 135 came into effect (as we find in Section 4.5 below). However, it is difficult to
reach any firm conclusions due to the statistical insignificance of the estimate.
The volatility and potential manipulability of profits create two distinct challenges for our
RD approach. The first is that firms may seek to manipulate net profits in order to remain below
the threshold. If so, this would violate one of the central assumptions of the RD approach - that
assignment to the treatment is random close to the threshold. This is primarily a concern for the
RD analysis of CSR spending in Section 4.3; however, even the RD estimates of the impact on
firm value may be affected if investors anticipate that firms will manipulate net profits to stay
below the threshold.
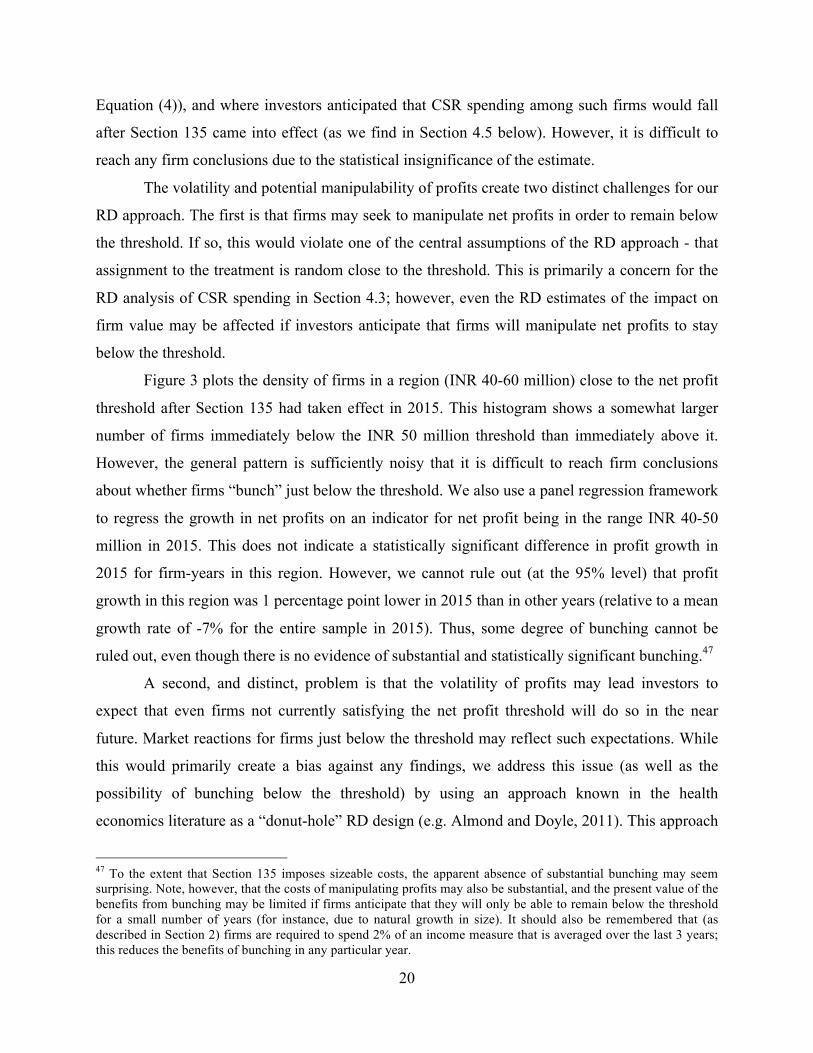
Figure 3 plots the density of firms in a region (INR 40-60 million) close to the net profit
threshold after Section 135 had taken effect in 2015. This histogram shows a somewhat larger
number of firms immediately below the INR 50 million threshold than immediately above it.
However, the general pattern is sufficiently noisy that it is difficult to reach firm conclusions
about whether firms “bunch” just below the threshold. We also use a panel regression framework
to regress the growth in net profits on an indicator for net profit being in the range INR 40-50
million in 2015. This does not indicate a statistically significant difference in profit growth in
2015 for firm-years in this region. However, we cannot rule out (at the 95% level) that profit
growth in this region was 1 percentage point lower in 2015 than in other years (relative to a mean
growth rate of -7% for the entire sample in 2015). Thus, some degree of bunching cannot be
ruled out, even though there is no evidence of substantial and statistically significant bunching.47
A second, and distinct, problem is that the volatility of profits may lead investors to
expect that even firms not currently satisfying the net profit threshold will do so in the near
future. Market reactions for firms just below the threshold may reflect such expectations. While
this would primarily create a bias against any findings, we address this issue (as well as the
possibility of bunching below the threshold) by using an approach known in the health
economics literature as a “donut-hole” RD design (e.g. Almond and Doyle, 2011). This approach
47 To the extent that Section 135 imposes sizeable costs, the apparent absence of substantial bunching may seem surprising. Note, however, that the costs of manipulating profits may also be substantial, and the present value of the benefits from bunching may be limited if firms anticipate that they will only be able to remain below the threshold for a small number of years (for instance, due to natural growth in size). It should also be remembered that (as described in Section 2) firms are required to spend 2% of an income measure that is averaged over the last 3 years; this reduces the benefits of bunching in any particular year.
21
involves excluding observations in a region close to the threshold and conducting the RD
analysis on the remaining observations. In Column 2 of Table 5, we omit observations in the
range INR 43-50 million and calculate the RD estimate comparing observations around INR 43
million and those just above INR 50 million.48 The results are very similar to those in Column 1.
Finally, it is possible that the effect may differ across firms with differing characteristics.
For instance, firms with less final customer interaction may have lower gains from CSR
spending (e.g. Servaes and Tamayo, 2015). To test for this, we proxy for final customer
interaction by using advertising expenses as reported in Prowess. Columns 3 and 4 of Table 5
divide firms that have net profits ranging from 0 to INR 100 million into two subsamples – one
(in Column 3) where firms have zero or missing advertising expenses (suggesting little final
customer interaction) and the other (in Column 4) where firms have positive advertising
expenses. Column 3 reports a firm value decline of 3.5% (which is marginally significant at the
10% level) for firms with zero or missing advertising; Column 4 reports an insignificant effect
(with a much smaller coefficient) for firms with positive advertising. This is consistent with the
negative firm value effect being largely concentrated among firms with zero or missing
advertising expenses. As discussed further in Section 4.4, one potential explanation might be that
firms with more advertising expenses could reduce their “advertising expenses” and increase
their “CSR spending” (i.e., substitute between advertising and CSR spending).
Manchiraju and Rajgopal (2015) also undertake an event study analysis of Section 135.
There are a number of significant differences between their event study methodology and ours,
as well significant differences in the questions we address in our respective papers (e.g., we go
beyond firm value effects). Most importantly, they do not use a nonparametric local polynomial
regression approach in assessing firm value effects. In addition, the precise event dates that they
identify are somewhat different from ours. They use a somewhat smaller sample of firms
(restricted to those trading on the National Stock Exchange of India), whereas we use all firms in
the Prowess database. We interpret our results in the light of the theoretical model in Section 3
that emphasizes the central role of controlling shareholders, leading to some important
differences of interpretation. Our results relating to the mediating impact of advertising
expenditures are also quite different from theirs. Despite all of these differences, when our
48 Note that varying the size of the “donut hole” (i.e. using values other than INR 43 million) leads to fairly similar estimates.
22
analyses overlap the results are quite similar; in particular, they also find a substantial negative
effect of Section 135 on firm value. However, Manchiraju and Rajgopal (2015) focus only on
firm value, whereas we engage in a more comprehensive study of the impact of Section 135 on a
wide range of outcomes, including CSR expenditures (to which we turn next).
4.3) The Impact of Section 135 on CSR Expenditures
The second important question we address is the impact of Section 135 on CSR
expenditures. As the CSR obligation in Section 135 takes a comply-or-explain form – where
firms may make no change to their CSR activity and instead provide explanations for why it falls
below the 2% target - the impact of Section 135 on CSR spending is by no means a trivial
question. Unfortunately, the empirical estimation of this effect is hampered by limitations of the
pre-Section 135 data on CSR spending. Most Indian firms were not required to disclose CSR
activity until the provision took effect in fiscal year 2015.49 For years starting in 2012, it is
possible to construct proxies for CSR expenditures from variables reported in the Prowess
dataset. In particular, the variables “Social and Community” expenditures and “Environment-
related” expenditures appear closely related to CSR, and we add these two categories together to
construct a proxy for CSR spending.50
There are a number of important caveats with respect to this measure, especially for fiscal
years prior to 2015. First, disclosure of these items was voluntary, and thus subject to concerns
about self-selection. Second, there are a large number of missing observations – for instance, in
2014, there are 893 non-missing observations for our CSR measure, out of 4628 firms in the
Prowess database (and there are even fewer observations in earlier years). The simplest approach
– which we adopt in the analysis below – is to treat missing CSR observations as zeroes, as is
commonly assumed in the literature for variables such as advertising and R&D; this is also
consistent with anecdotal evidence suggesting that CSR activity was small or nonexistent among
smaller Indian firms.51
To measure the impact of Section 135 on CSR activity, we use both a difference-in-
difference (DiD) approach (using panel data from Prowess over 2012-2015) and an RD design 49 The largest 100 firms constitute an exception, and data for these firms is analyzed separately in Section 4.5 below. 50 A third category reported in Prowess (“Donations”) may also overlap with CSR. However, it is unclear whether the donations typically made by firms fall within the definition of CSR provided in Schedule VII of the Companies Act 2013. Thus, we exclude “Donations” from our baseline measure. However, the results are similar when “Donations” are included in the CSR measure. 51 See CSR Voluntary Guidelines (2009); Afsharipour, 2011; Van Zile, 2012; NEW AMERICA MEDIA, May 18, 2011. op cit.
23
using data for 2015 (described below). The DiD approach tests for changes in CSR spending
among “treatment” firms that became subject to Section 135 (based on net worth, sales, or net
profit) in 2015, relative to CSR spending by those (“control”) firms that remained unaffected.
Figure 4 depicts mean CSR spending by treatment and control firms with net profits between 0
and INR 100 million over the period 2012-2015. There is a marked increase in CSR spending by
treatment firms from 2014 to 2015. However, treatment firms’ CSR spending exhibits more
volatility prior to the implementation of Section 135, so the inference of an effect from the visual
inspection of Figure 4 should be drawn with some caution.
The basic empirical specification for the DiD analysis is the following:
𝐶𝑆𝑅!" = 𝛽(§135!" ∗ 𝑌𝑅2015!)+ 𝐗!"𝛾 + 𝜇! + 𝛿! + 𝑣!" (11)
where 𝐶𝑆𝑅!" is our measure of CSR activity (described above) for firm i in year t; this is
Winsorized from above at 5% to address potential outliers. §135!" is an indicator variable equal
to 1 if firm i met at least one of the net worth, sales or net profit thresholds in year t (and zero
otherwise). 𝑌𝑅2015! is an indicator variable equal to 1 in 2015, when Section 135 came into
effect (and zero otherwise). As §135!" = 1 if the thresholds are satisfied, even in years prior to
the implementation of Section 135, it is the interaction term §135!" ∗ 𝑌𝑅2015! that reflects the
applicability of the new law, and the basic hypothesis is that β > 0. The terms µi and δt are firm
and year fixed effects, respectively, and νit is the error term. Xit is a vector of control variables,
which includes total assets, advertising expenditures (treating missing observations as zeroes),
and export earnings (treating missing observations as zeroes). As the “treatment” depends on net
profit, net worth and sales, we include linear and squared terms of each of these variables as
controls. Table 6 provides descriptive statistics for CSR spending and the control variables.
It is possible that treatment firms may have experienced faster growth in CSR spending
even prior to Section 135, and that the estimated DiD effect may represent a continuation of this
preexisting trend, rather than a causal impact of Section 135. To address this possibility, we add
firm-specific linear trends in CSR spending (denoted by git, where gi represents the firm-specific
growth rate in CSR for firm i) to the model in Equation (11). The augmented model can be
straightforwardly implemented using estimation in first differences (see Wooldridge, 2002, pp.
315-316):
∆𝐶𝑆𝑅!" = 𝛽∆(§135!" ∗ 𝑌𝑅2015!)+ ∆𝐗!"𝛾 + 𝑔! + 𝜁! + 𝜂!" (12)
24
where ∆𝐶𝑆𝑅!" = 𝐶𝑆𝑅!" − 𝐶𝑆𝑅!,!!!, and other changes are defined analogously; 𝜁! is the year
effect and 𝜂!" the error term in the first-differenced model (representing the changes in 𝛿! and
𝑣!", respectively). The firm fixed effect µi in Equation (11) drops out of Equation (12). However,
the firm-specific trend gi can be estimated by including a firm effect in the estimation of
Equation (12).
Column 1 of Table 7 reports the results of the specification in Equation (11), using a
panel of Prowess data for the years 2012-2015 with 13,770 observations on nearly 4000 firms.
The estimated Section 135 treatment effect is statistically significant, and its magnitude is about
INR 6 million. For purposes of comparison, mean CSR expenditure in 2014 was INR 65 million
among firms that reported positive CSR. Thus, this result implies that CSR spending rose as a
consequence of Section 135 by about 9% relative to the mean among firms reporting positive
CSR.52 In Column 2, we add several additional control variables, and obtain a very similar
estimate.
The analysis so far assumes that missing CSR observations are zeroes. To test whether
the results are sensitive to this assumption, we estimate Equation (11) for the subsample
consisting only of firm-years with non-missing CSR expenditures, as reported in Column 3 of
Table 7. While the sample size is much smaller (consisting of 2108 observations on 915 firms),
the estimated Section 135 treatment effect is statistically significant; its magnitude is about INR
9.7 million, representing an increase in CSR spending of about 15% relative to the mean among
firms reporting positive CSR. Column 4 of Table 7 reports the results of estimating Equation
(12); this is a first-differenced specification, so the variables should be interpreted as changes
rather than as levels. The estimated Section 135 treatment effect (relative to the preexisting
trend) is statistically significant, and its magnitude is very similar to that of the baseline effect in
Column 1.
In addition, we also consider the “extensive margin” of CSR activity – i.e. the fraction of
firms that engage in any CSR activity. We reinterpret 𝐶𝑆𝑅!" in Equation (11) as a dichotomous
variable, equal to 1 if firm i reports a positive amount of spending on CSR in year t, and zero
otherwise (all other variables are as defined above). This test is implemented using a linear
52 Two categories of firms that are potentially of particular interest are state-owned and foreign-owned firms. The basic result – an increase in CSR spending among firms subject to Section 135 – holds within each of these subgroups of firms, and the magnitude of the effect is fairly similar to that for the full sample. The baseline result also holds when state-owned and foreign-owned firms are omitted from the sample.
25
probability model of the probability that a firm engages in CSR activity (although results are
fairly similar using logit and probit models). Figure 5 depicts the fraction of treatment and
control firms that have positive CSR spending over 2012-2015. There is clearly a marked
increase in the fraction of treatment firms with positive CSR spending from 2014 to 2015
(although this fraction is still quite far below 1, reflecting the comply-or-explain nature of the
law and possibly also some degree of noncompliance or nonreporting).
Column 1 of Table 8 shows that the probability of engaging in CSR increased among
treatment firms by about 0.33. This is substantial in magnitude and statistically significant, and
also closely mirrors the graphical evidence in Figure 5. Column 2 of Table 8 restricts the sample
to observations with net profit in the range INR 0-100 million. Among these smaller firms, the
increase in the probability of engaging in CSR increased among treatment firms is smaller
(around 0.05), but is also statistically significant and quite large relative to the mean among
treatment firms in 2014 (of about 0.08).
An alternative to the DiD approach is an RD design that uses data for 2015 and tests
whether there is a difference in CSR spending among firms just above and below the net profit
threshold. The underlying intuition is that the discontinuous application of Section 135 at the
INR 50 million net profit threshold should lead to a discontinuous jump in CSR spending among
firms just above the cutoff (assuming that at least some firms comply rather than explain). As in
the analysis of firm value, we use a nonparametric local polynomial regression approach that
involves estimating local polynomial regressions separately above and below the cutoff. The RD
treatment effect of Section 135 on CSR spending is estimated as the difference in the values of
the regression functions at the threshold.
Column 1 of Table 9 reports this RD estimate, using data for fiscal year 2015. The
estimate – an increase in CSR spending of about INR 2.7 million - is very large relative to the
DiD estimates in Table 7, and is of borderline statistical significance. As the RD estimate applies
to firms close to the threshold, the most relevant comparison is with mean CSR expenditure in
2014 among firms with profits less than INR 100 million that reported positive CSR (which was
INR 1.71 million). The RD estimate implies that CSR spending rose as a consequence of Section
135 by about 160% relative to the mean among firms in this size category reporting positive
CSR. We also report a placebo test in Column 2 of Table 9 that involves estimating the same RD
treatment effect using data for the years 2012-2014, when Section 135 did not apply. As
26
expected, this RD estimate is statistically insignificant and much smaller in magnitude than that
for 2015. Even so, however, the small number of firms reporting positive CSR in the region of
the threshold makes it difficult to rule out the possibility that the 2015 result is driven by a few
influential observations. In addition, it is subject to concerns about potential bunching, as
discussed in Section 4.2. Thus, while we report the result in Table 9 for completeness, it should
be interpreted with considerable caution.
4.4) The Impact of Section 135 on Advertising, Sales, and Accounting Performance
In Table 5, the negative impact of Section 135 on firm value appears to be concentrated
among firms that do not engage in advertising. One potential explanation - that firms with more
advertising expenses can more readily substitute CSR spending for advertising - receives support
from Column 3 of Table 8, which reports DiD estimates from a linear probability model of the
impact of Section 135 on the probability of engaging in advertising. The dependent variable is an
indicator for strictly positive advertising expenses. There is a statistically significant decline in
the probability of engaging in advertising among firms subject to Section 135, relative to control
firms. Column 4 restricts the analysis to firms with net profits between 0 and INR 100 million.
The point estimate here is very similar to that in Column 3, but is no longer statistically
significant. These findings suggest that there may be some degree of substitutability between
CSR spending and advertising, although caution is warranted due to the lack of statistical
significance in Column 4.
We also examine the impact of Section 135 on the ratio of sales to total assets and on the
return on assets (ROA, the ratio of net profit to total assets). We use both DiD specifications
(analogous to Equation (11), but with the dependent variable being the ratio of sales to total
assets or ROA) and an RD approach around the INR 50 million threshold in 2015. There are no
robust, consistent and statistically significant results for either of these variables across these
specifications. Figure 6 plots the ratio of sales to total assets in fiscal year 2015 for firms with net
profit in the range of INR 40 million to INR 60 million. There is little difference between the
local polynomial regression functions estimated below and above the cutoff. The apparent
absence of any causal effect of CSR activity on sales should be interpreted with some caution,
given the difficulty of establishing a negative result. However, it is consistent with firms
choosing CSR activity (or the lack thereof) to optimize their sales performance prior to the
enactment of the new law.
27
Figure 7 tells a similar story with respect to ROA in fiscal year 2015. We might expect
that some types of costs associated with the CSR mandate (such as fees paid to CSR consultants,
or the distraction of managers from normal business operations) may result in decreases in ROA.
In a DiD specification, the estimated effect of Section 135 on ROA is quite imprecise. However,
a modest decline in ROA – of up to 1.5 percentage points, relative to a mean ROA of 11% - as a
result of Section 135 cannot be ruled out at the 95% level.
4.5) Section 135 and the CSR Activity of Large Firms
Taken in combination, the results in Section 4.3 above imply that Section 135 increased
CSR activity significantly, especially along the extensive margin. However, it should be noted
that the results are subject to the self-selection concerns noted earlier, and rely on the assumption
that missing values are zeroes. For a subsample consisting of the largest 100 firms, the self-
selection issues can be overcome because India’s securities regulator (SEBI) required these firms
to disclose their CSR spending in the year prior to the Companies Act 2013 taking effect (i.e. for
fiscal year 2014) as well as for the year in which it took effect (fiscal year 2015).53 For these
firms, we hand-collect data on CSR expenditures before and after Section 135 from these
Business Responsibility disclosures. Unfortunately, despite the mandate from SEBI to disclose
CSR spending, data is missing for some firms. In addition, the disclosure requirement only
applied to firms with positive profits (as loss-making firms are exempt from Section 135).
Ultimately, we obtain data on CSR spending in both 2014 and 2015 for a sample of 55 firms
(those among the top 100 firms for which there is complete CSR data for both years, and which
did not experience losses in either year). Of these firms, 10 met or exceeded the 2% target in
2014, even prior to Section 135 taking effect. The remaining 45 spent less than 2% of net profits
on CSR in 2014. Descriptive statistics for each category of firms are presented in Table 10.
Although the sample size is very small, it is apparent from Table 10 that while firms that
were initially spending less than 2% increased their CSR activity, those that were initially
spending more than 2% reduced their CSR expenditures after Section 135 came into effect. This
presumably unintended effect is also apparent in Figure 8, which depicts CSR spending as a
percentage of net profit for each group of firms for fiscal years 2014 and 2015. Firms that were
initially spending less than 2% increased their CSR spending from about 0.8% of net profit on
average to about 1.5% of net profit. On the other hand, firms that were initially spending more
53 See SEBI Circular CIR/CFD/DIL/8/2012, August 13, 2012.
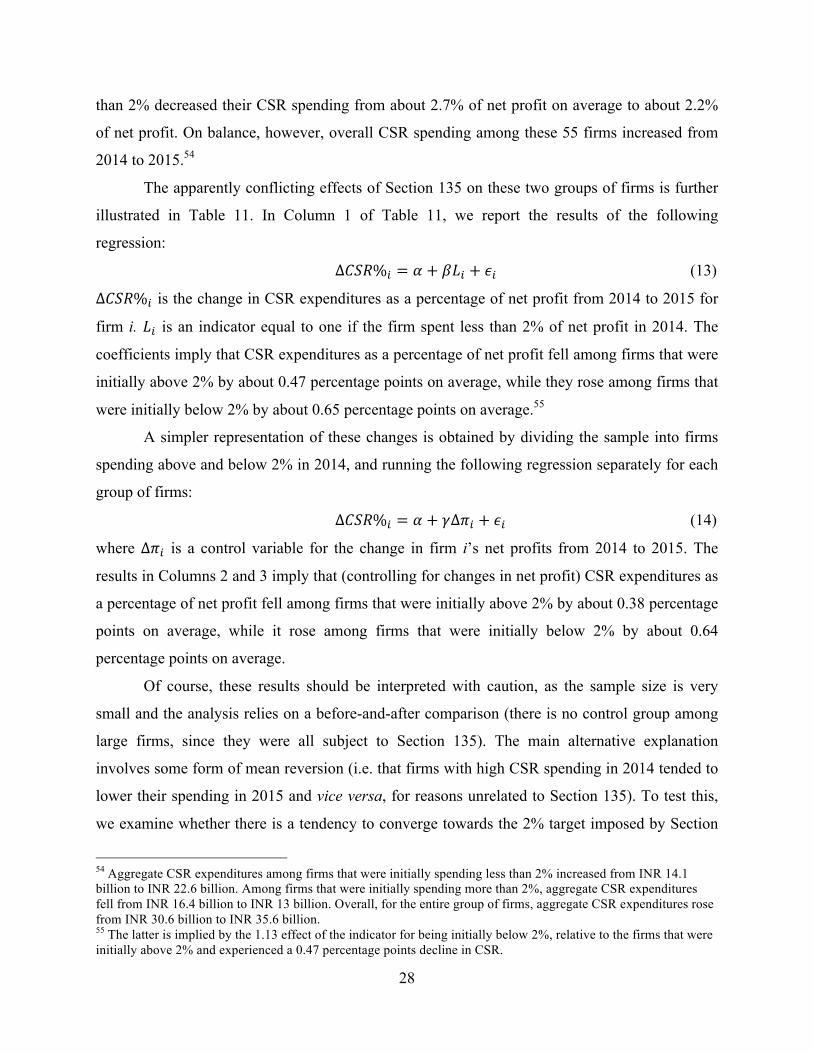
28
than 2% decreased their CSR spending from about 2.7% of net profit on average to about 2.2%
of net profit. On balance, however, overall CSR spending among these 55 firms increased from
2014 to 2015.54
The apparently conflicting effects of Section 135 on these two groups of firms is further
illustrated in Table 11. In Column 1 of Table 11, we report the results of the following
regression:
∆𝐶𝑆𝑅%! = 𝛼 + 𝛽𝐿! + 𝜖! (13)
∆𝐶𝑆𝑅%! is the change in CSR expenditures as a percentage of net profit from 2014 to 2015 for
firm i. 𝐿! is an indicator equal to one if the firm spent less than 2% of net profit in 2014. The
coefficients imply that CSR expenditures as a percentage of net profit fell among firms that were
initially above 2% by about 0.47 percentage points on average, while they rose among firms that
were initially below 2% by about 0.65 percentage points on average.55
A simpler representation of these changes is obtained by dividing the sample into firms
spending above and below 2% in 2014, and running the following regression separately for each
group of firms:
∆𝐶𝑆𝑅%! = 𝛼 + 𝛾∆𝜋! + 𝜖! (14)
where ∆𝜋! is a control variable for the change in firm i’s net profits from 2014 to 2015. The
results in Columns 2 and 3 imply that (controlling for changes in net profit) CSR expenditures as
a percentage of net profit fell among firms that were initially above 2% by about 0.38 percentage
points on average, while it rose among firms that were initially below 2% by about 0.64
percentage points on average.
Of course, these results should be interpreted with caution, as the sample size is very
small and the analysis relies on a before-and-after comparison (there is no control group among
large firms, since they were all subject to Section 135). The main alternative explanation
involves some form of mean reversion (i.e. that firms with high CSR spending in 2014 tended to
lower their spending in 2015 and vice versa, for reasons unrelated to Section 135). To test this,
we examine whether there is a tendency to converge towards the 2% target imposed by Section
54 Aggregate CSR expenditures among firms that were initially spending less than 2% increased from INR 14.1 billion to INR 22.6 billion. Among firms that were initially spending more than 2%, aggregate CSR expenditures fell from INR 16.4 billion to INR 13 billion. Overall, for the entire group of firms, aggregate CSR expenditures rose from INR 30.6 billion to INR 35.6 billion. 55 The latter is implied by the 1.13 effect of the indicator for being initially below 2%, relative to the firms that were initially above 2% and experienced a 0.47 percentage points decline in CSR.
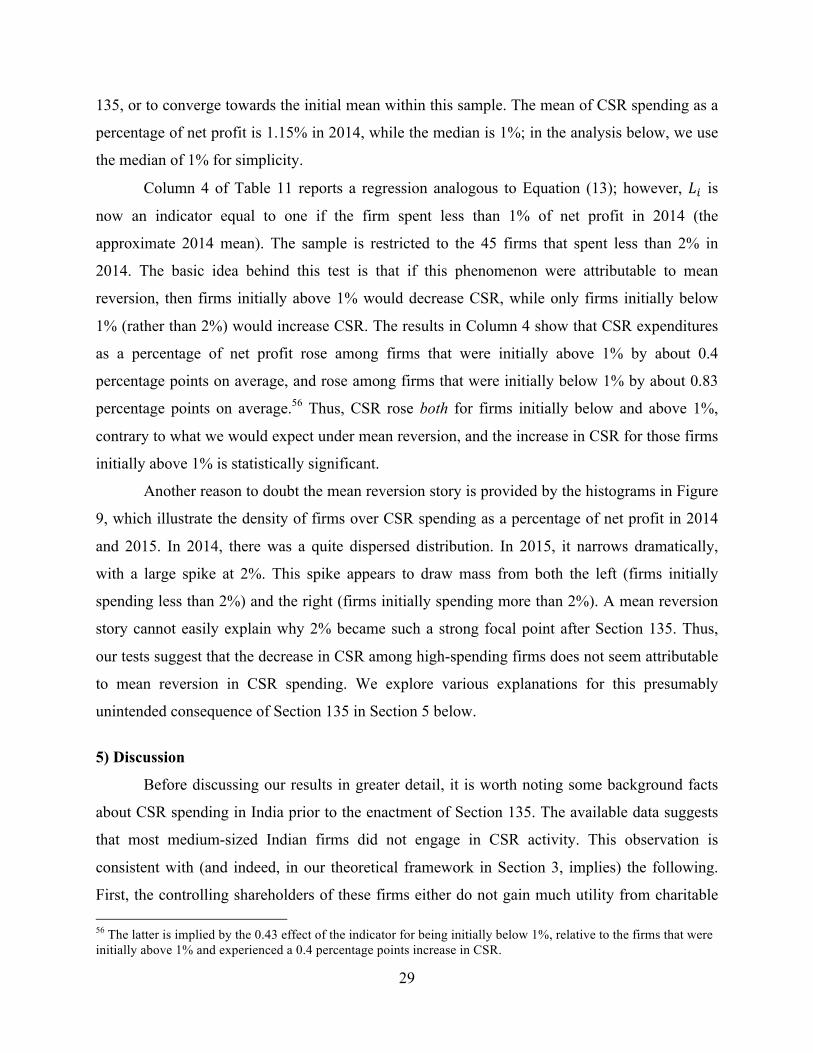
29
135, or to converge towards the initial mean within this sample. The mean of CSR spending as a
percentage of net profit is 1.15% in 2014, while the median is 1%; in the analysis below, we use
the median of 1% for simplicity.
Column 4 of Table 11 reports a regression analogous to Equation (13); however, 𝐿! is
now an indicator equal to one if the firm spent less than 1% of net profit in 2014 (the
approximate 2014 mean). The sample is restricted to the 45 firms that spent less than 2% in
2014. The basic idea behind this test is that if this phenomenon were attributable to mean
reversion, then firms initially above 1% would decrease CSR, while only firms initially below
1% (rather than 2%) would increase CSR. The results in Column 4 show that CSR expenditures
as a percentage of net profit rose among firms that were initially above 1% by about 0.4
percentage points on average, and rose among firms that were initially below 1% by about 0.83
percentage points on average.56 Thus, CSR rose both for firms initially below and above 1%,
contrary to what we would expect under mean reversion, and the increase in CSR for those firms
initially above 1% is statistically significant.
Another reason to doubt the mean reversion story is provided by the histograms in Figure
9, which illustrate the density of firms over CSR spending as a percentage of net profit in 2014
and 2015. In 2014, there was a quite dispersed distribution. In 2015, it narrows dramatically,
with a large spike at 2%. This spike appears to draw mass from both the left (firms initially
spending less than 2%) and the right (firms initially spending more than 2%). A mean reversion
story cannot easily explain why 2% became such a strong focal point after Section 135. Thus,
our tests suggest that the decrease in CSR among high-spending firms does not seem attributable
to mean reversion in CSR spending. We explore various explanations for this presumably
unintended consequence of Section 135 in Section 5 below.
5) Discussion
Before discussing our results in greater detail, it is worth noting some background facts
about CSR spending in India prior to the enactment of Section 135. The available data suggests
that most medium-sized Indian firms did not engage in CSR activity. This observation is
consistent with (and indeed, in our theoretical framework in Section 3, implies) the following.
First, the controlling shareholders of these firms either do not gain much utility from charitable 56 The latter is implied by the 0.43 effect of the indicator for being initially below 1%, relative to the firms that were initially above 1% and experienced a 0.4 percentage points increase in CSR.
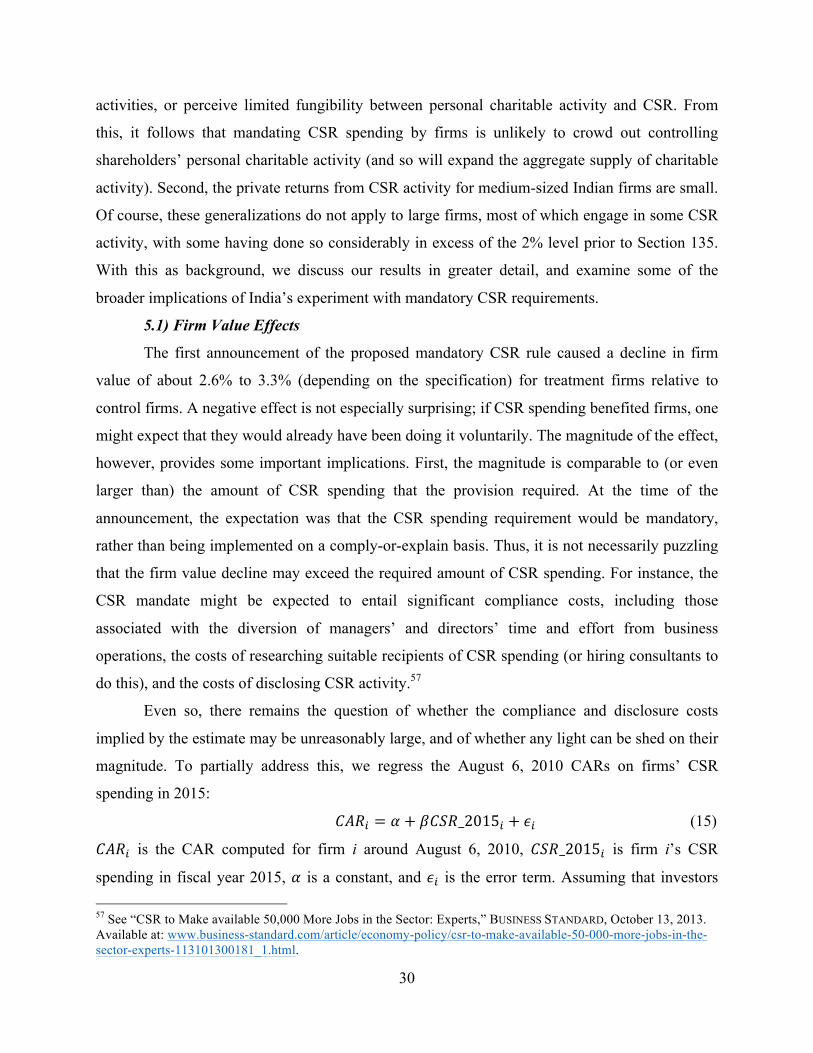
30
activities, or perceive limited fungibility between personal charitable activity and CSR. From
this, it follows that mandating CSR spending by firms is unlikely to crowd out controlling
shareholders’ personal charitable activity (and so will expand the aggregate supply of charitable
activity). Second, the private returns from CSR activity for medium-sized Indian firms are small.
Of course, these generalizations do not apply to large firms, most of which engage in some CSR
activity, with some having done so considerably in excess of the 2% level prior to Section 135.
With this as background, we discuss our results in greater detail, and examine some of the
broader implications of India’s experiment with mandatory CSR requirements.
5.1) Firm Value Effects
The first announcement of the proposed mandatory CSR rule caused a decline in firm
value of about 2.6% to 3.3% (depending on the specification) for treatment firms relative to
control firms. A negative effect is not especially surprising; if CSR spending benefited firms, one
might expect that they would already have been doing it voluntarily. The magnitude of the effect,
however, provides some important implications. First, the magnitude is comparable to (or even
larger than) the amount of CSR spending that the provision required. At the time of the
announcement, the expectation was that the CSR spending requirement would be mandatory,
rather than being implemented on a comply-or-explain basis. Thus, it is not necessarily puzzling
that the firm value decline may exceed the required amount of CSR spending. For instance, the
CSR mandate might be expected to entail significant compliance costs, including those
associated with the diversion of managers’ and directors’ time and effort from business
operations, the costs of researching suitable recipients of CSR spending (or hiring consultants to
do this), and the costs of disclosing CSR activity.57
Even so, there remains the question of whether the compliance and disclosure costs
implied by the estimate may be unreasonably large, and of whether any light can be shed on their
magnitude. To partially address this, we regress the August 6, 2010 CARs on firms’ CSR
spending in 2015:
𝐶𝐴𝑅! = 𝛼 + 𝛽𝐶𝑆𝑅_2015! + 𝜖! (15)
𝐶𝐴𝑅! is the CAR computed for firm i around August 6, 2010, 𝐶𝑆𝑅_2015! is firm i’s CSR
spending in fiscal year 2015, 𝛼 is a constant, and 𝜖! is the error term. Assuming that investors 57 See “CSR to Make available 50,000 More Jobs in the Sector: Experts,” BUSINESS STANDARD, October 13, 2013. Available at: www.business-standard.com/article/economy-policy/csr-to-make-available-50-000-more-jobs-in-the-sector-experts-113101300181_1.html.
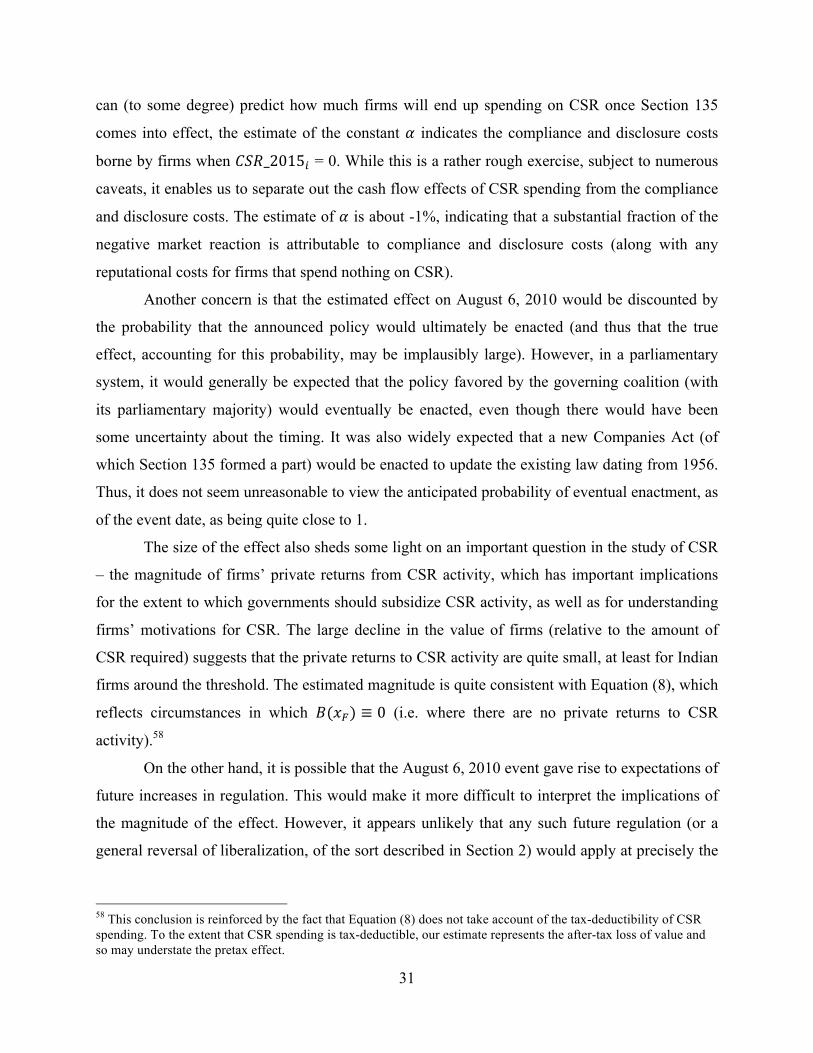
31
can (to some degree) predict how much firms will end up spending on CSR once Section 135
comes into effect, the estimate of the constant 𝛼 indicates the compliance and disclosure costs
borne by firms when 𝐶𝑆𝑅_2015! = 0. While this is a rather rough exercise, subject to numerous
caveats, it enables us to separate out the cash flow effects of CSR spending from the compliance
and disclosure costs. The estimate of 𝛼 is about -1%, indicating that a substantial fraction of the
negative market reaction is attributable to compliance and disclosure costs (along with any
reputational costs for firms that spend nothing on CSR).
Another concern is that the estimated effect on August 6, 2010 would be discounted by
the probability that the announced policy would ultimately be enacted (and thus that the true
effect, accounting for this probability, may be implausibly large). However, in a parliamentary
system, it would generally be expected that the policy favored by the governing coalition (with
its parliamentary majority) would eventually be enacted, even though there would have been
some uncertainty about the timing. It was also widely expected that a new Companies Act (of
which Section 135 formed a part) would be enacted to update the existing law dating from 1956.
Thus, it does not seem unreasonable to view the anticipated probability of eventual enactment, as
of the event date, as being quite close to 1.
The size of the effect also sheds some light on an important question in the study of CSR
– the magnitude of firms’ private returns from CSR activity, which has important implications
for the extent to which governments should subsidize CSR activity, as well as for understanding
firms’ motivations for CSR. The large decline in the value of firms (relative to the amount of
CSR required) suggests that the private returns to CSR activity are quite small, at least for Indian
firms around the threshold. The estimated magnitude is quite consistent with Equation (8), which
reflects circumstances in which 𝐵(𝑥!) ≡ 0 (i.e. where there are no private returns to CSR
activity).58
On the other hand, it is possible that the August 6, 2010 event gave rise to expectations of
future increases in regulation. This would make it more difficult to interpret the implications of
the magnitude of the effect. However, it appears unlikely that any such future regulation (or a
general reversal of liberalization, of the sort described in Section 2) would apply at precisely the
58 This conclusion is reinforced by the fact that Equation (8) does not take account of the tax-deductibility of CSR spending. To the extent that CSR spending is tax-deductible, our estimate represents the after-tax loss of value and so may understate the pretax effect.
32
same thresholds used for Section 135, especially as these thresholds are not used elsewhere in
Indian company law.
In general, an important caveat is that our firm value results measure the value to the firm
of CSR spending, not the social value of such spending. Thus, our results should not be viewed
as indicating that CSR spending is socially value-destroying. Indeed, in Section 5.4 we discuss
briefly how India’s mandatory rule might be socially value-enhancing even if it generates
negative firm value effects.59
5.2) Compliance and Enforcement
One important set of concerns about this study relates to the limited enforcement of
company and securities law in India. While this is an important background consideration, it is
generally the case that most potential compliance and enforcement problems are likely to create a
bias against our findings. Moreover, the “comply-or-explain” structure of Section 135 is in many
ways well-tailored to a weak enforcement environment, relying primarily on disclosure. We thus
begin by discussing firm’s decisions on whether to spend or to explain their lack of CSR activity.
We then consider problems arising from possible corruption, fraud, and noncompliance.
Spending at least 2% of net profits on CSR and spending less but providing an
explanation of the failure to spend 2% are both alternative forms of compliance with Section
135. To understand the prevalence and consequences of these choices, we hand-collect data on
the explanations provided by the largest 100 firms from their Business Responsibility reports. Of
53 firms with usable data, about one third spend 2% or more, while virtually all the rest provide
explanations (as required by Section 135). Thus, even among the largest firms, explaining rather
than spending 2% is common. The explanations provided are generally not very detailed and
often not particularly compelling. Some common themes include the novelty of the CSR
requirement and the difficulty of identifying worthy causes on which to spend in the limited time
available. A number of firms promise to carry forward their shortfall by spending more than
required in future years. We also run a regression of the August 6, 2010 CAR on an indicator for
whether firms spent 2% or more in fiscal year 2015 or instead provided an explanation. The
firms that explained experienced a market reaction that was almost 1 percentage point less 59 Indeed, it is possible that if enough firms start engaging in CSR then network effects may develop that make it more valuable to firms to engage in CSR (Flammer 2015). That may not have happened by 2010 in India, but given the large increases in CSR spending and the rapidly increasing fraction of firms doing this spending that may happen soon. Also, there have been suggestions in the literature in the US that analysts’ perceptions and valuations of CSR have changed over time (Ioannou and Serafeim 2015).
33
negative than that for firms that ended up spending 2% or more; however, the difference between
the effects is not statistically significant.
A significant concern is that the CSR mandate may give rise to corrupt or fraudulent
forms of spending, for instance where the firm directs funds towards a fraudulent organization
that then returns most of the money. If such “kickbacks” were returned to the firm, we would not
observe (as we do) a substantial negative market reaction. However, if they were directed to the
controller, then this would amount to a form of controller self-dealing that may give rise to a
negative market reaction (reflecting minority shareholders’ valuation). However, it should be
remembered that Section 135 does not create any new opportunities for self-dealing by
controllers. If CSR spending happens to be an effective mechanism for self-dealing, then
controllers would already have been engaged in this practice. Thus, if Section 135 gives rise to
“kickbacks” of this type, then they would be offset by reductions in other forms of self-dealing.
It is therefore unlikely that fraudulent forms of CSR spending would confound our basic results.
Perhaps the most egregious form of noncompliance by firms would be to falsely claim
CSR expenditures that they had not actually made. This strategy is fraught with difficulty,
however. The ostensible beneficiaries of the “spending” would be aware that funds had not been
received and are likely to object. Indeed, even in the absence of enforcement by SEBI or other
official bodies, India has a quite vibrant business press that would be likely to publicize such
forms of noncompliance.
5.3) CSR Spending Effects
After Section 135 came into effect, there was a significant increase in CSR spending by
treatment firms relative to control firms, and a particularly large increase in the fraction of
treatment firms (relative to control firms) that engaged in positive amounts of CSR spending. At
the same time, we find that the negative effect on firm value seems to have been concentrated
among firms that had little customer interaction, proxied for by those with zero or missing
advertising expenses. Further, we find some evidence indicating that the likelihood of advertising
spending decreased when firms were subject to Section 135. These results collectively indicate
some degree of substitutability between CSR and advertising, suggesting that the primary benefit
to Indian firms of CSR spending is inculcating goodwill or good public relations (very much like
34
advertising).60 Other benefits of CSR that have been discussed in the literature, such as CSR
spending insulating firms against government enforcement actions (e.g. Jeffers, 2015; Hong and
Liskovich, 2016) seem unlikely to hold in the Indian context where such enforcement actions are
infrequent and often mired in delays.
The increase in CSR spending was concentrated among firms that spent less than 2% of
their net profits on CSR prior to Section 135. While there were few firms that spent more than
2% prior to Section 135, these firms appear to have decreased their CSR spending after Section
135 came into effect; presumably, this was an unintended and undesired outcome. It is
particularly interesting because many of these leading CSR firms were opposed to Section 135.61
One explanation is that the firms (and their controllers) might consider the primary benefit of
CSR to be the goodwill it generates for the firm (or its controlling group), which might be
negatively impacted by mandated CSR spending. For instance, imagine that prior to Section 135,
a separating equilibrium existed in which “good” firms engaged in 4% CSR (and thereby
signaled their type), while “bad” firms did no CSR activity.62 After Section 135, “good” firms
must increase their CSR – e.g. to 8% – to remain distinguishable from the “bad” firms (which
now spend 2%). This may not be worth the cost, in which case the “good” firms will settle for a
pooling equilibrium in which all firms spend 2%.
In addition to the signaling story, it is possible that the 2% level serves as a focal point
because it is specified (though not required) in the law. This would also be consistent with the
observed pattern (among large firms) of convergence from both below and above to 2%. This
result also connects to a broader literature that examines what happens when a practice that was
previously voluntary becomes mandated. In some scenarios, this may have a deleterious effect
on the underlying practice, with the threshold becoming both a ceiling and a floor (or an
“anchor”).63 Finally, to the extent that CSR activity reflects intrinsic motivations of firms’
60 These results suggest that firms with positive advertising reduced their advertising expenditures and increased their CSR spending and that these firms suffered a lesser negative firm value effect compared to firms that did no advertising, which increased their CSR spending. Stated this way, it appears the advertising firms were able to reduce the cash flow effect of CSR spending by reducing advertising, but the no-advertising firms did not have this option. 61 See MONEYCONTROL, CNBC-TV18 News, August 6, 2010, op cit; INDIACORPLAWBLOG, August 7, 2010, op cit. 62 Lys, Naughton and Wang (2015) present evidence that CSR activity may signal future financial performance. 63 For example, in 1993 the US Congress enacted Section 162(m) of the US tax code. This provision limited the deductibility to corporations of an executive’s compensation to $1 million (unless the compensation is performance-based). Subsequently, some firms that had been paying their CEOs less than $1 million of salary increased their salaries to $1 million (Harris and Livingstone, 2002).
35
insiders, the result may also be seen as relating to the literature on the crowd-out of intrinsic
motivation (e.g. Gneezy and Rustichini, 2000).
5.4) CSR Mandates versus Corporate Taxation
Finally, one of the most intriguing aspects of Section 135 is that it can be viewed as a tax
imposed by the government (of 2% of net profits), albeit spent by the firms (rather than by the
government) on a broad array of CSR activities.64 This prompts two different types of questions.
One of these concerns the parallels between our empirical findings and results on the impact of
corporate taxes on firm value. The other is about when such a rule might be preferable to a
straightforward tax of 2%; although we do not develop a formal model here, we identify below a
few key factors to consider.65
Increases in corporate tax rates would, other things equal, be expected to lead to
commensurate reductions in the after-tax value of corporations. While there is a substantial
literature on the valuation effects of various aspects of firms’ responses to taxation (e.g. Desai
and Dharmapala, 2009), there is relatively little event study evidence on market reactions to
corporate tax changes. Moreover, these market reactions are potentially difficult to interpret, as
they depend not simply on the tax rate change, but also on changes in the tax base, firms’
responses (e.g. firms may reduce investment and increase their pretax return, thereby shifting
some of the incidence from capital to labor), and on the personal tax treatment of shareholders’
returns. Perhaps the most closely analogous study is on the 1986 US tax reform, which reduced
corporate tax rates while broadening the corporate base (with the latter effect dominating, such
that corporate tax revenue increased substantially). Givoly and Hayn (1992) analyze the
aggregate impact of various legislative events associated with this reform on firms’ market
values, computing an overall decline in market value of about $450 billion. The present value of
the additional tax payments, however, are estimated to be about $275 billion. Thus, as in our
64 Note, however, that while loss-making firms are exempt from the CSR requirement, firms are not able to “carry forward” losses to offset their future CSR obligations. In this respect, the CSR “tax” is less favorable to firms than the typical corporate tax. Moreover, as described in Section 3, firms are required to spend 2% of an income measure that is averaged over the last 3 years, so it appears possible that a loss-making firm may face CSR obligations based on this 3-year average income measure (whereas it would have no current tax obligations). 65 There has been considerable policy interest in the apparent growth of tax avoidance activity by multinational firms (e.g. OECD, 2013; Dharmapala, 2014). Indeed, current discussion seems to entertain the possibility that tax payments by large multinationals may be sufficiently voluntary in nature to constitute CSR activity (e.g. Desai and Dharmapala, 2006). In this environment, CSR mandates may possibly be viewed by some policymakers as an alternative to corporate taxation.
36
setting, the market reaction was rather more negative than would be expected from the direct
cash flow consequences.
That then leads to our second question – when might India’s CSR rule be preferable to a
straightforward tax? Important differences between Section 135 and a corporate tax include who
spends the funds and what kind of disclosure accompanies it. In the latter, governments (i.e.,
government employees) spend the money on whatever it considers its priorities, with the level of
disclosure determined by the political system. Under Section 135, firms (i.e., firm insiders and
employees) spend the money, with the level of disclosure determined by securities law. The
Section 135 approach may be advantageous if there are reasons to think that firm employees will
do a better job than government employees in deciding where to spend the funds, for instance
because firms stand to gain goodwill from (effective) CSR spending and so motivate employees
to spend funds effectively. If so, firms’ employees may find better projects and avoid siphoning
funds off to other activities. It is not clear that government employees have similar incentives,
and in some emerging market (and other) contexts the risk of government employees’ misuse of
funds may be greater than that associated with firms’ employees.
A related point is that firms’ decisions on CSR spending might reveal their private
information on effective CSR programs. For example, firms might better target their resources to
providers that generate the “best” results. Firms’ choices might influence other firms (especially
if firms disclose their CSR spending in detail) so that more funds reach “better” providers. This
could be valuable if the firms’ decisions track the efficacy of the providers in meeting their stated
objectives and if firms’ have some advantage in gathering, publicizing and making credible such
information.
We hasten to add, however, that these comments should not be taken to suggest that firms
are always better at this sort of activity than the government. It is not difficult to imagine less
optimistic scenarios. It is not impossible that politicians may favor a CSR mandate because it
enables them to pressure firms to direct CSR activity to politicians’ preferred causes or
organizations. However, it should be remembered that such pressure could have been exerted
before Section 135, as nothing prevented firms from spending on CSR. Section 135 adds the
element of mandatory disclosure of CSR activities. This may enable politicians to better monitor
firms’ choice of CSR beneficiaries, and make it more likely that firms direct their spending
towards politically favored groups. If this is expected to be widespread, then our estimate of the
37
market reaction may be influenced by this expectation and the estimate may not reflect the
returns from “genuine” CSR activity that is free of political pressure. We plan to explore such
issues (and the question raised above of whether firms direct CSR spending to the “best”
providers) through the hand-collection of further information from disclosures of CSR activity.
More generally, India’s experiment with Section 135 provides an opportunity to think more
broadly about how one might approach the issue of providing certain kinds of CSR activities and
the circumstances in which the approach in India might be potentially desirable. We leave more
fulsome discussion of this to future research.
6) Conclusion
The Corporate Social Responsibility (CSR) activities of firms are of great interest to
policymakers, practitioners, investors, and the general public. They have generated a vast
academic literature cutting across multiple disciplines, and implicating fundamental questions
regarding corporate governance, the role of corporations in society, and the institutional design
of the provision of public goods. This paper analyzes the consequences of CSR activity using the
quasi-experimental variation created by Section 135 of India’s Companies Act of 2013, which
requires (on a “comply-or-explain” basis) that firms satisfying specific size or profit thresholds
spend a minimum of 2% of their net profit on CSR.
Using an RD design based on a nonparametric local polynomial regression approach, we
find a negative and substantial effect on firm value around the first announcement of the CSR
mandate. This effect is larger than the 2% spending requirement, suggesting the importance of
additional compliance and disclosure costs, and implying that the private returns of mandated
CSR activity to firms around the threshold are small. The effect seems to be concentrated among
firms that are less customer-facing, as indicated by low advertising expenditures; along with
other evidence we report, this indicates some degree of substitutability between CSR and
advertising. We also find significant increases in CSR activity among firms subject to the new
provision, especially along the extensive margin (i.e. the fraction of firms engaging in CSR
spending). For a subset of large firms (the top 100), we find that while firms initially spending
less than 2% increased their CSR activity, firms initially spending more than 2% reduced their
CSR expenditures after Section 135 came into effect. These findings bring new evidence to bear
38
on the wide-ranging debates over the consequences of CSR activities, and suggest new ways of
understanding this important phenomenon.
References Afsharipour, A. (2011) “Directors as Trustees of the Nation? India’s Corporate Governance
and Corporate Social Responsibility Reform Efforts” Seattle University Law Review, 34, 995–1024.
Afsharipour, A. and S. Rana (2014) “The Emergence of New Corporate Social Responsibility Regimes in China and India” U.C. Davis Business Law Journal, 14,
175–230. Almond, D. and Doyle, J. J. (2011) “After midnight: A regression discontinuity design in length
of postpartum hospital stays” American Economic Journal: Economic Policy, 3 (3), 1-34. Andreoni, J. (1990) “Impure Altruism and Donations to Public Goods: A Theory of Warm-Glow
Giving” Economic Journal, 100, 464-477. Balasubramanian, N. B. (2010) “Governing the Socially Responsible Corporate – A Gandhian
Perspective” in Ananda Das Gupta (Ed.) Ethics, Business and Society: Managing Responsibly, Singapore, Sage Publications.
Bénabou, R. and J. Tirole (2010) “Individual and Corporate Social Responsibility” Economica,
77 (305), pp.1-19. Besley, T. and M. Ghatak (2007) “Retailing Public Goods: The Economics of Corporate Social
Responsibility” Journal of Public Economics, 91 (9), 1645-1663. Bhagat, S. and R. Romano (2002) “Event Studies and the Law: Part I: Technique and
Corporate Litigation” American Law and Economics Review, 4, 141-167. Calonico, S., Cattaneo, M. D. and Titiunik, R., (2014a) “Robust Nonparametric Confidence
Intervals for Regression-‐Discontinuity Designs” Econometrica, 82 (6), pp. 2295-2326. Calonico, S., Cattaneo, M. D. and Titiunik, R., (2014b) “Robust data-driven inference in the
regression-discontinuity design” Stata Journal, 14 (4), pp. 909-946. Cheng, I-H., H. Hong and K. Shue (2014) “Do Managers Do Good with Other People’s
Money?” Working paper. Clacher, I. and J. Hagendorff (2012) “Do announcements about corporate social responsibility
create or destroy shareholder wealth? Evidence from the UK” Journal of Business Ethics, 106(3), 253-266.
39
Desai, M.A. and D. Dharmapala (2006) “CSR and taxation: The missing link” Leading Perspectives, 4 (5).
Desai, M.A. and D. Dharmapala (2009) “Corporate tax avoidance and firm value” Review of
Economics and Statistics, 91(3), 537-546. Dharmapala, D. (2014) “What Do We Know about Base Erosion and Profit Shifting? A Review
of the Empirical Literature” Fiscal Studies, 35, 421-448. Dharmapala, D. and V. S. Khanna (2013) “Corporate Governance, Enforcement and Firm Value:
Evidence from India” Journal of Law, Economics, & Organization, 29, 1056-1084. Dharmapala, D. and V.S. Khanna (2016) “The Costs and Benefits of Mandatory Securities Regulation: Evidence from Market Reactions to the JOBS Act of 2012” Journal of Law,
Finance and Accounting, 1, 139 – 186. Dimson, E., Karakaş, O., and Li, X. (2015) “Active Ownership” Review of Financial Studies, 28,
3225-3268. Ferrell, A., H. Liang and L. Renneboog (2014) “Socially Responsible Firms” European
Corporate Governance Institute Working Paper No. 432/2014. Flammer, C. (2015) “Does Corporate Social Responsibility Lead to Superior Financial
Performance? A Regression Discontinuity Approach” Management Science, 61, 2549-2568.
Givoly, D. and C. Hayn (1991) “The aggregate and distributional effects of the tax reform act of 1986 on firm valuation” Journal of Business, 64 (3), 363-392.
Gneezy, U. and Rustichini, A. (2000) “A Fine is a Price” Journal of Legal Studies, 29, 1-17. Hahn, J., Todd, P. and van der Klaauw, W. (2001) “Identification and estimation of treatment
effects with a regression-‐discontinuity design” Econometrica, 69 (1), 201-209. Harris, D. G. and J. R. Livingstone (2002) “Federal Tax Legislation as an Implicit Contracting
Cost Benchmark: The Definition of Excessive Executive Compensation” Accounting Review, 77 (4), 997-1018.
Hong, H. G. and I. Liskovich (2016) “Crime, Punishment and the Halo Effect of Corporate Social Responisiblity”. Available at SSRN: http://ssrn.com/abstract=2492202. Imbens, G. and Kalyanaraman, K. (2011) “Optimal bandwidth choice for the regression
discontinuity estimator” Review of Economic Studies, 79, 933-959. Ioannou, I. and G. Serafeim (2015) “The Impact of Corporate Social Responsibility on
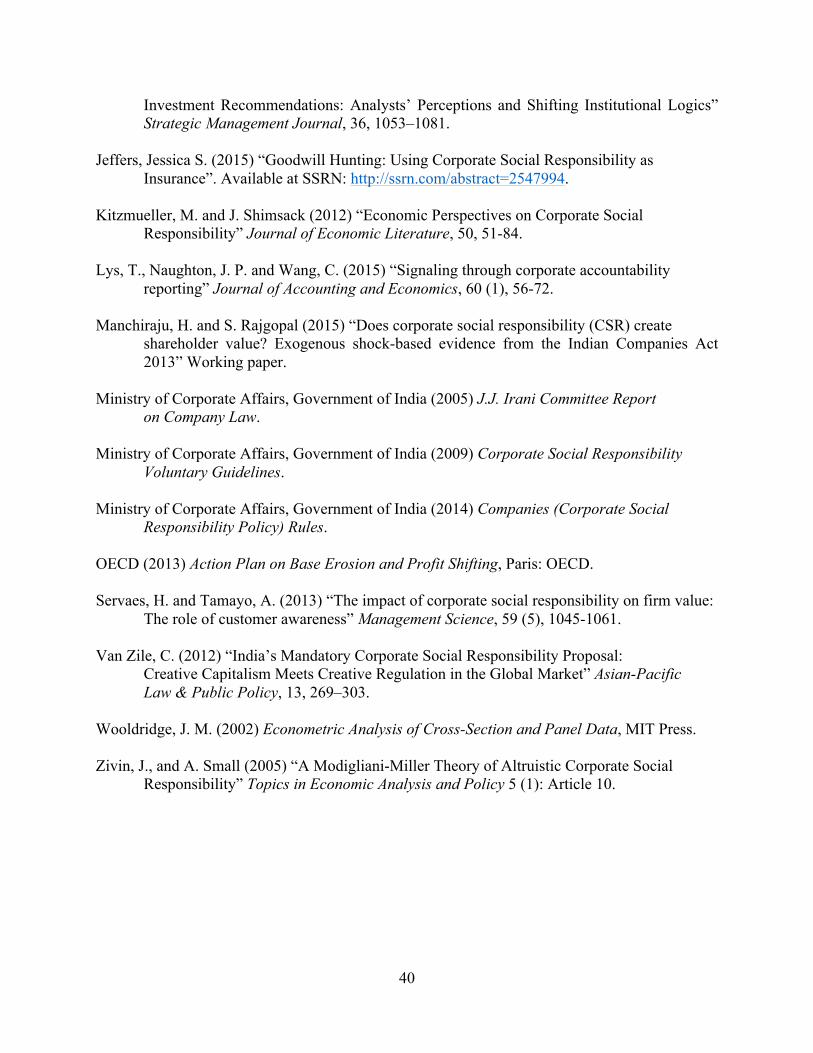
40
Investment Recommendations: Analysts’ Perceptions and Shifting Institutional Logics” Strategic Management Journal, 36, 1053–1081.
Jeffers, Jessica S. (2015) “Goodwill Hunting: Using Corporate Social Responsibility as
Insurance”. Available at SSRN: http://ssrn.com/abstract=2547994. Kitzmueller, M. and J. Shimsack (2012) “Economic Perspectives on Corporate Social
Responsibility” Journal of Economic Literature, 50, 51-84. Lys, T., Naughton, J. P. and Wang, C. (2015) “Signaling through corporate accountability
reporting” Journal of Accounting and Economics, 60 (1), 56-72. Manchiraju, H. and S. Rajgopal (2015) “Does corporate social responsibility (CSR) create
shareholder value? Exogenous shock-based evidence from the Indian Companies Act 2013” Working paper.
Ministry of Corporate Affairs, Government of India (2005) J.J. Irani Committee Report
on Company Law. Ministry of Corporate Affairs, Government of India (2009) Corporate Social Responsibility
Voluntary Guidelines. Ministry of Corporate Affairs, Government of India (2014) Companies (Corporate Social
Responsibility Policy) Rules. OECD (2013) Action Plan on Base Erosion and Profit Shifting, Paris: OECD. Servaes, H. and Tamayo, A. (2013) “The impact of corporate social responsibility on firm value:
The role of customer awareness” Management Science, 59 (5), 1045-1061. Van Zile, C. (2012) “India’s Mandatory Corporate Social Responsibility Proposal: Creative Capitalism Meets Creative Regulation in the Global Market” Asian-Pacific
Law & Public Policy, 13, 269–303. Wooldridge, J. M. (2002) Econometric Analysis of Cross-Section and Panel Data, MIT Press. Zivin, J., and A. Small (2005) “A Modigliani-Miller Theory of Altruistic Corporate Social
Responsibility” Topics in Economic Analysis and Policy 5 (1): Article 10.
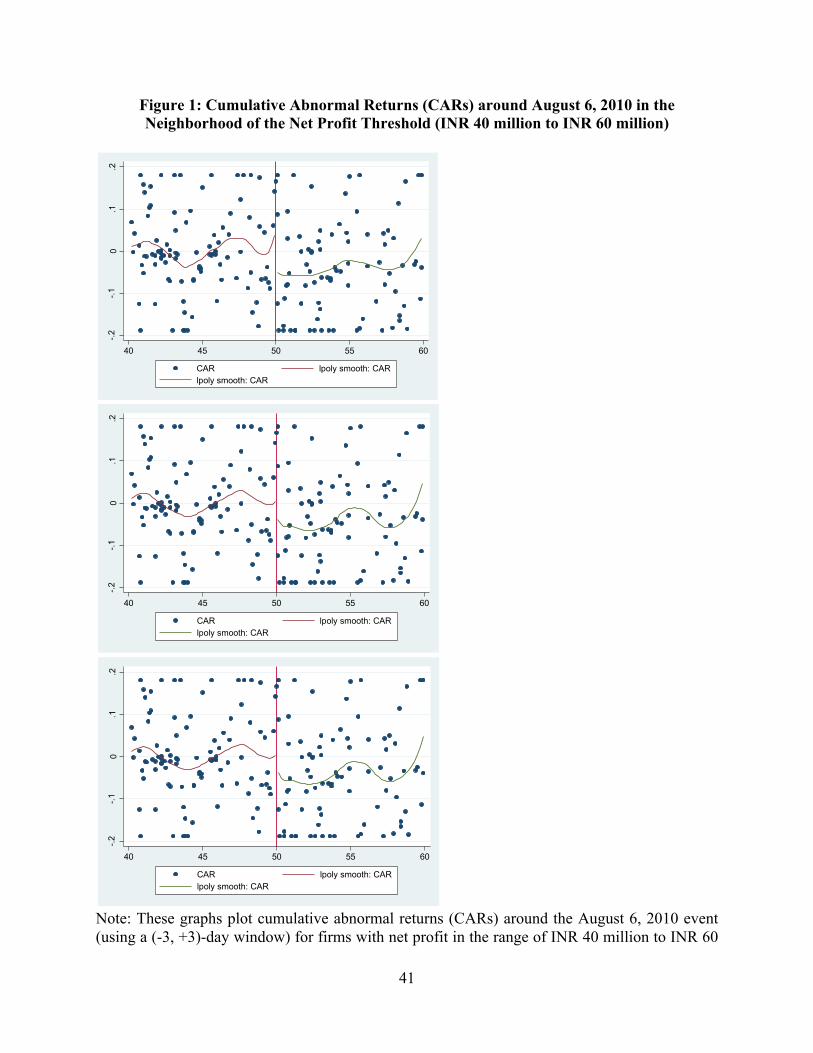
41
Figure 1: Cumulative Abnormal Returns (CARs) around August 6, 2010 in the Neighborhood of the Net Profit Threshold (INR 40 million to INR 60 million)
Note: These graphs plot cumulative abnormal returns (CARs) around the August 6, 2010 event (using a (-3, +3)-day window) for firms with net profit in the range of INR 40 million to INR 60
-.2-.1
0.1
.2
40 45 50 55 60
CAR lpoly smooth: CARlpoly smooth: CAR
-.2-.1
0.1
.2
40 45 50 55 60
CAR lpoly smooth: CARlpoly smooth: CAR
-.2-.1
0.1
.2
40 45 50 55 60
CAR lpoly smooth: CARlpoly smooth: CAR
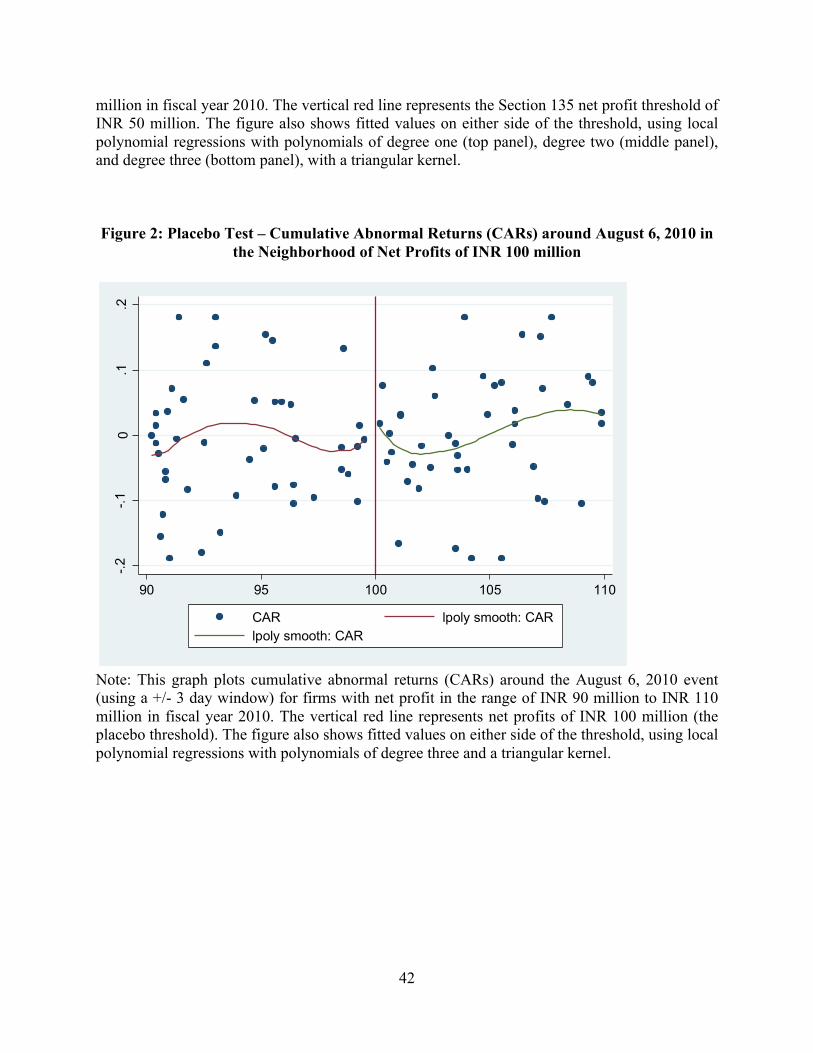
42
million in fiscal year 2010. The vertical red line represents the Section 135 net profit threshold of INR 50 million. The figure also shows fitted values on either side of the threshold, using local polynomial regressions with polynomials of degree one (top panel), degree two (middle panel), and degree three (bottom panel), with a triangular kernel. Figure 2: Placebo Test – Cumulative Abnormal Returns (CARs) around August 6, 2010 in
the Neighborhood of Net Profits of INR 100 million
Note: This graph plots cumulative abnormal returns (CARs) around the August 6, 2010 event (using a +/- 3 day window) for firms with net profit in the range of INR 90 million to INR 110 million in fiscal year 2010. The vertical red line represents net profits of INR 100 million (the placebo threshold). The figure also shows fitted values on either side of the threshold, using local polynomial regressions with polynomials of degree three and a triangular kernel.
-.2-.1
0.1
.2
90 95 100 105 110
CAR lpoly smooth: CARlpoly smooth: CAR
43
Figure 3: Frequency Distribution of Firms in the Neighborhood of the Net Profit Threshold (INR 40 million to INR 60 million) in Fiscal Year 2015
Note: This histogram represents the frequency distribution of firms across the range of net profits INR 40 million to INR 60 million in fiscal year 2015. The bin width is INR 1 million.
05
1015
20
Frequency
40 45 50 55 60pbdita
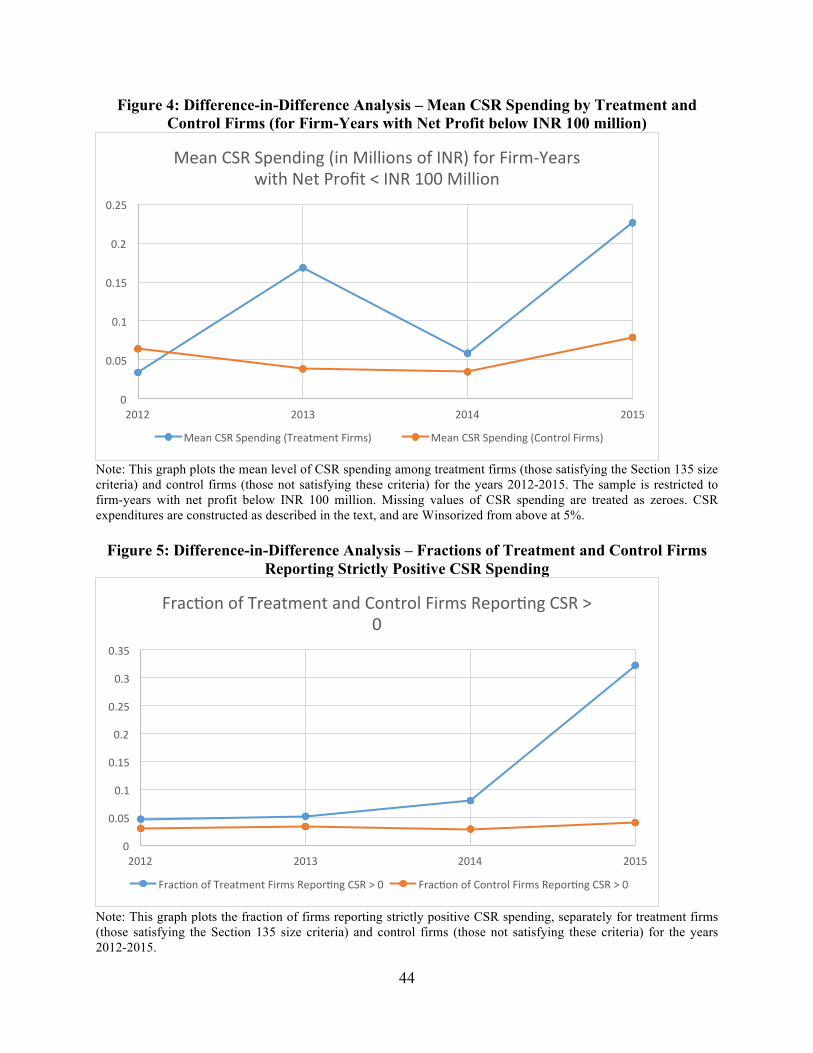
44
Figure 4: Difference-in-Difference Analysis – Mean CSR Spending by Treatment and Control Firms (for Firm-Years with Net Profit below INR 100 million)
Note: This graph plots the mean level of CSR spending among treatment firms (those satisfying the Section 135 size criteria) and control firms (those not satisfying these criteria) for the years 2012-2015. The sample is restricted to firm-years with net profit below INR 100 million. Missing values of CSR spending are treated as zeroes. CSR expenditures are constructed as described in the text, and are Winsorized from above at 5%.
Figure 5: Difference-in-Difference Analysis – Fractions of Treatment and Control Firms Reporting Strictly Positive CSR Spending
Note: This graph plots the fraction of firms reporting strictly positive CSR spending, separately for treatment firms (those satisfying the Section 135 size criteria) and control firms (those not satisfying these criteria) for the years 2012-2015.
0
0.05
0.1
0.15
0.2
0.25
2012 2013 2014 2015
Mean CSR Spending (in Millions of INR) for Firm-‐Years with Net Profit < INR 100 Million
Mean CSR Spending (Treatment Firms) Mean CSR Spending (Control Firms)
0
0.05
0.1
0.15
0.2
0.25
0.3
0.35
2012 2013 2014 2015
FracIon of Treatment and Control Firms ReporIng CSR > 0
FracIon of Treatment Firms ReporIng CSR > 0 FracIon of Control Firms ReporIng CSR > 0
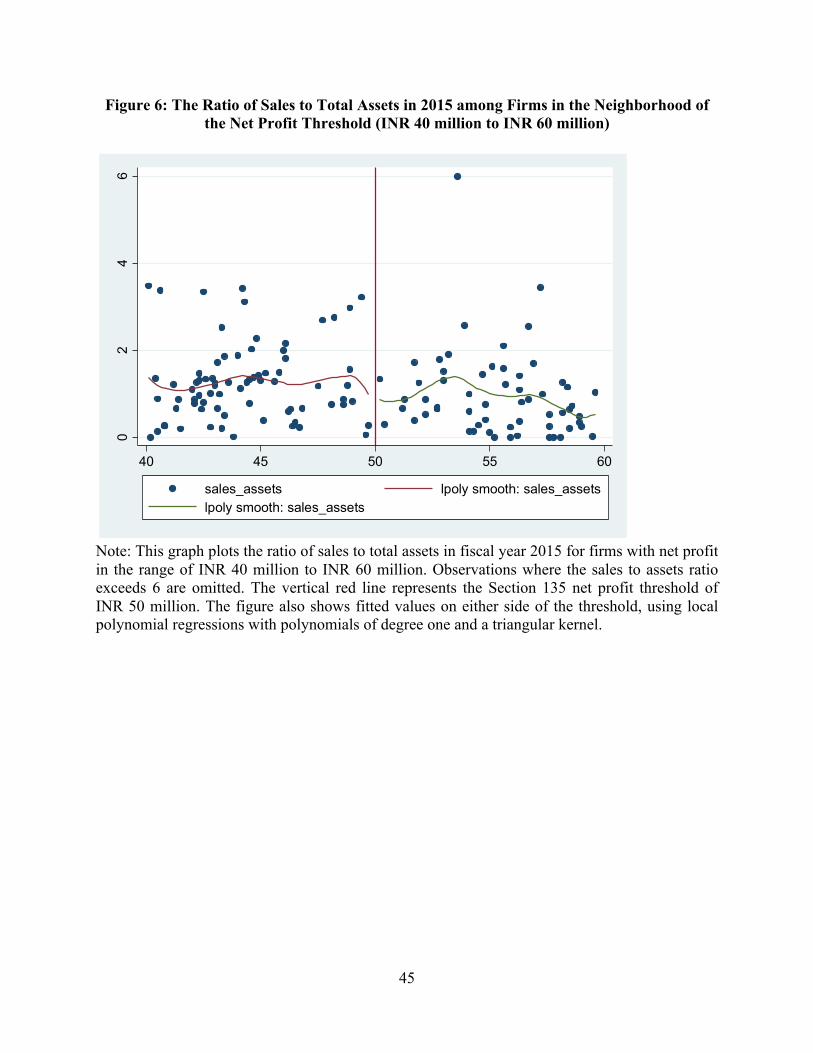
45
Figure 6: The Ratio of Sales to Total Assets in 2015 among Firms in the Neighborhood of the Net Profit Threshold (INR 40 million to INR 60 million)
Note: This graph plots the ratio of sales to total assets in fiscal year 2015 for firms with net profit in the range of INR 40 million to INR 60 million. Observations where the sales to assets ratio exceeds 6 are omitted. The vertical red line represents the Section 135 net profit threshold of INR 50 million. The figure also shows fitted values on either side of the threshold, using local polynomial regressions with polynomials of degree one and a triangular kernel.
02
46
40 45 50 55 60
sales_assets lpoly smooth: sales_assetslpoly smooth: sales_assets
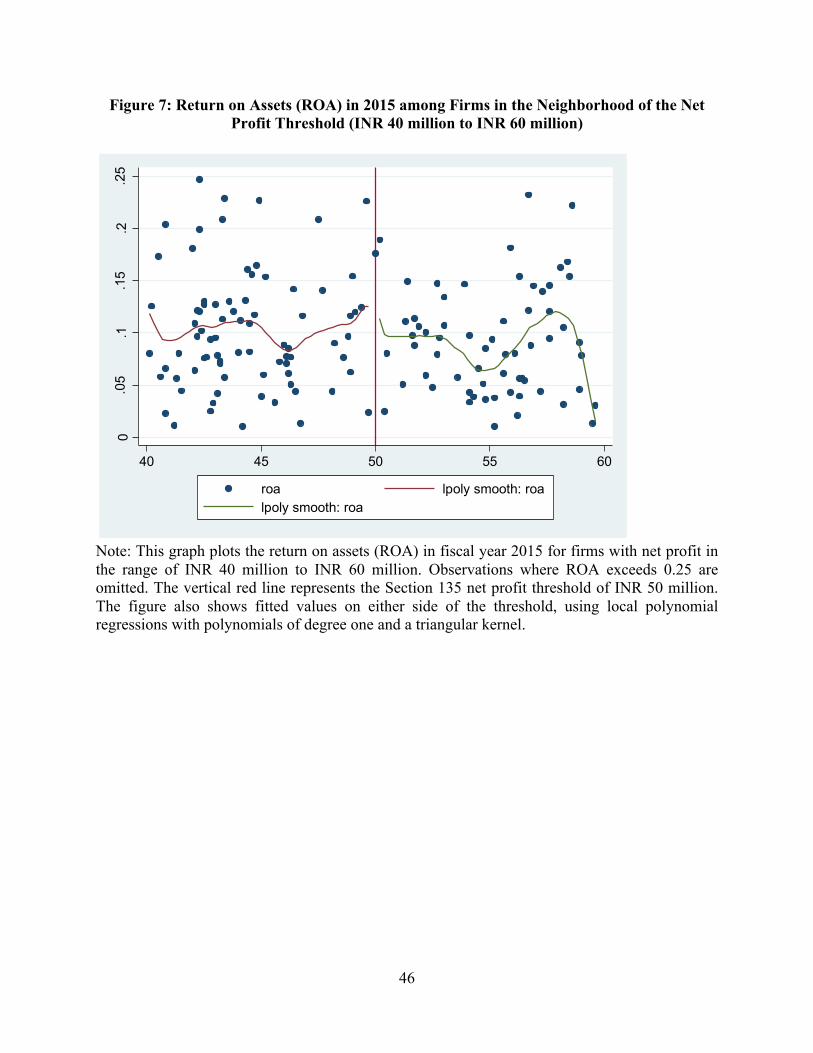
46
Figure 7: Return on Assets (ROA) in 2015 among Firms in the Neighborhood of the Net Profit Threshold (INR 40 million to INR 60 million)
Note: This graph plots the return on assets (ROA) in fiscal year 2015 for firms with net profit in the range of INR 40 million to INR 60 million. Observations where ROA exceeds 0.25 are omitted. The vertical red line represents the Section 135 net profit threshold of INR 50 million. The figure also shows fitted values on either side of the threshold, using local polynomial regressions with polynomials of degree one and a triangular kernel.
0.0
5.1
.15
.2.2
5
40 45 50 55 60
roa lpoly smooth: roalpoly smooth: roa
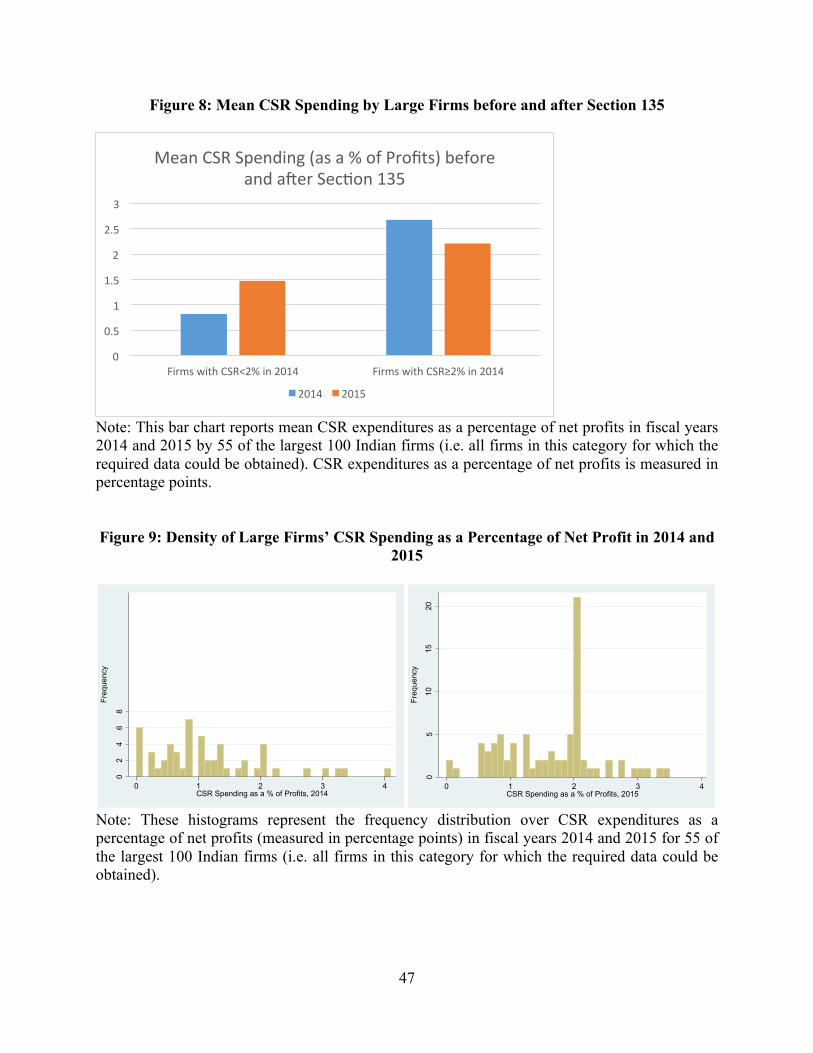
47
Figure 8: Mean CSR Spending by Large Firms before and after Section 135
Note: This bar chart reports mean CSR expenditures as a percentage of net profits in fiscal years 2014 and 2015 by 55 of the largest 100 Indian firms (i.e. all firms in this category for which the required data could be obtained). CSR expenditures as a percentage of net profits is measured in percentage points. Figure 9: Density of Large Firms’ CSR Spending as a Percentage of Net Profit in 2014 and
2015
Note: These histograms represent the frequency distribution over CSR expenditures as a percentage of net profits (measured in percentage points) in fiscal years 2014 and 2015 for 55 of the largest 100 Indian firms (i.e. all firms in this category for which the required data could be obtained).
0
0.5
1
1.5
2
2.5
3
Firms with CSR<2% in 2014 Firms with CSR≥2% in 2014
Mean CSR Spending (as a % of Profits) before and aNer SecIon 135
2014 2015
02
46
8
Freq
uenc
y
0 1 2 3 4CSR Spending as a % of Profits, 2014
05
1015
20
Freq
uenc
y
0 1 2 3 4CSR Spending as a % of Profits, 2015
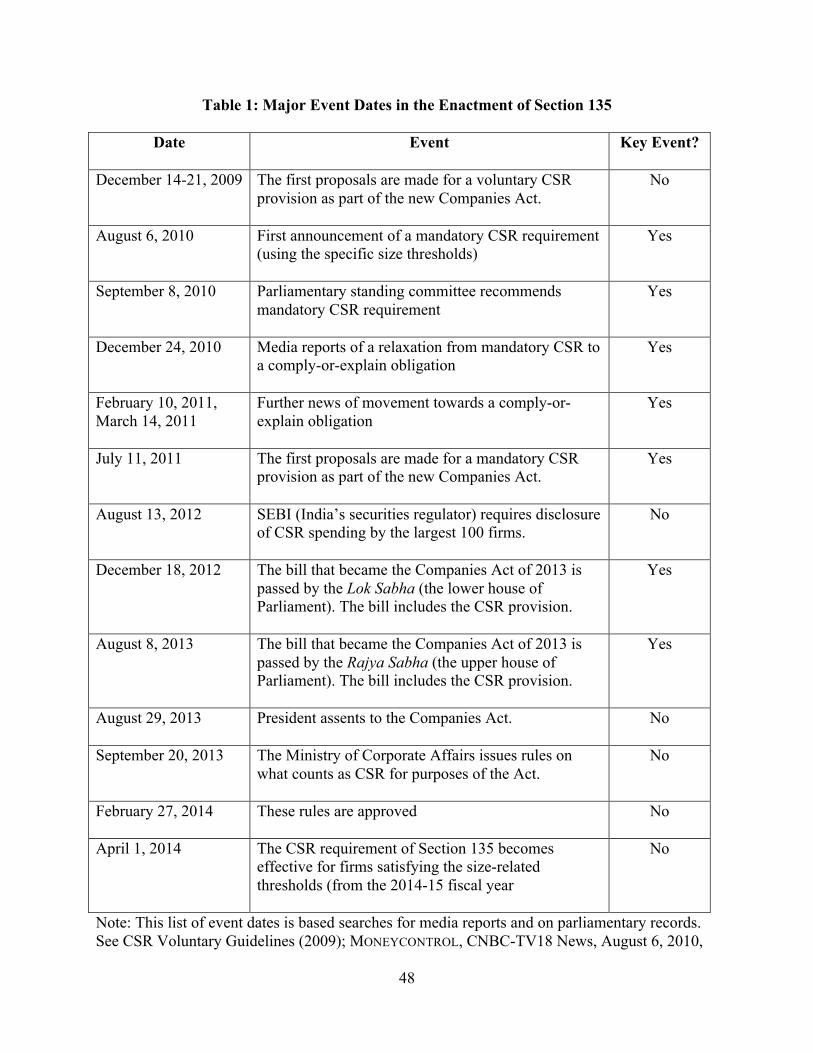
48
Table 1: Major Event Dates in the Enactment of Section 135
Date Event
Key Event?
December 14-21, 2009 The first proposals are made for a voluntary CSR provision as part of the new Companies Act.
No
August 6, 2010 First announcement of a mandatory CSR requirement (using the specific size thresholds)
Yes
September 8, 2010
Parliamentary standing committee recommends mandatory CSR requirement
Yes
December 24, 2010 Media reports of a relaxation from mandatory CSR to a comply-or-explain obligation
Yes
February 10, 2011, March 14, 2011
Further news of movement towards a comply-or-explain obligation
Yes
July 11, 2011 The first proposals are made for a mandatory CSR provision as part of the new Companies Act.
Yes
August 13, 2012 SEBI (India’s securities regulator) requires disclosure of CSR spending by the largest 100 firms.
No
December 18, 2012 The bill that became the Companies Act of 2013 is passed by the Lok Sabha (the lower house of Parliament). The bill includes the CSR provision.
Yes
August 8, 2013 The bill that became the Companies Act of 2013 is passed by the Rajya Sabha (the upper house of Parliament). The bill includes the CSR provision.
Yes
August 29, 2013 President assents to the Companies Act.
No
September 20, 2013 The Ministry of Corporate Affairs issues rules on what counts as CSR for purposes of the Act.
No
February 27, 2014 These rules are approved
No
April 1, 2014 The CSR requirement of Section 135 becomes effective for firms satisfying the size-related thresholds (from the 2014-15 fiscal year
No
Note: This list of event dates is based searches for media reports and on parliamentary records. See CSR Voluntary Guidelines (2009); MONEYCONTROL, CNBC-TV18 News, August 6, 2010,
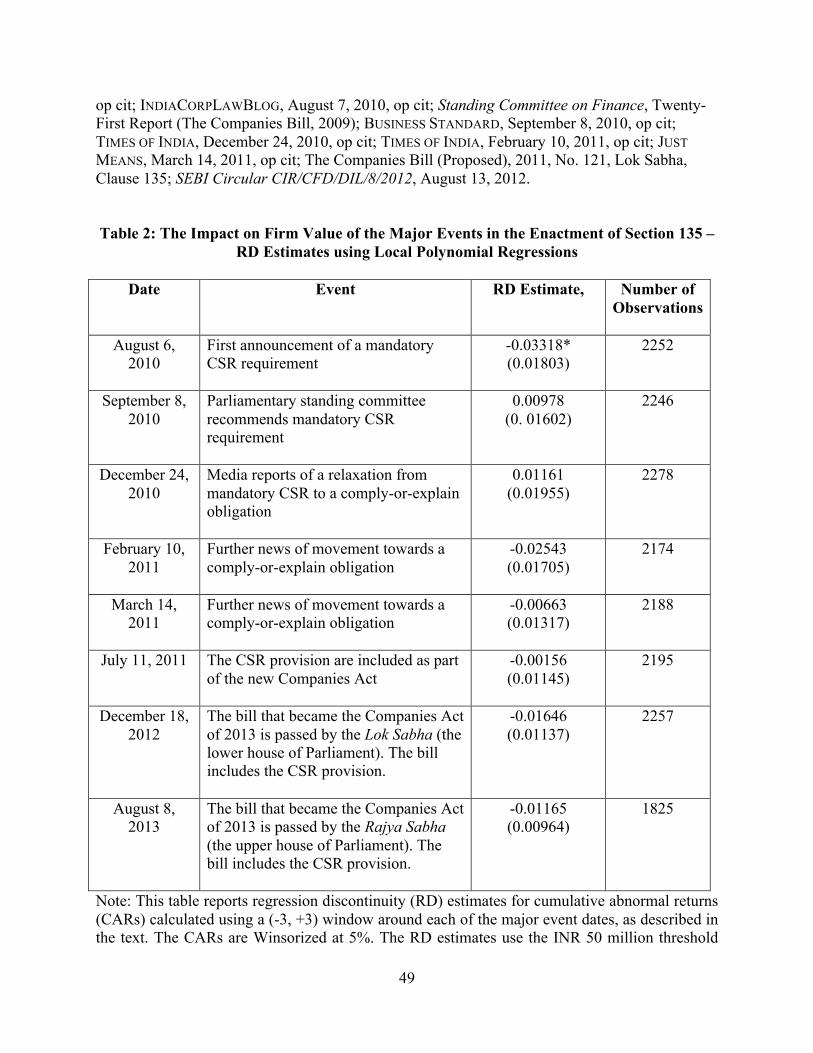
49
op cit; INDIACORPLAWBLOG, August 7, 2010, op cit; Standing Committee on Finance, Twenty-First Report (The Companies Bill, 2009); BUSINESS STANDARD, September 8, 2010, op cit; TIMES OF INDIA, December 24, 2010, op cit; TIMES OF INDIA, February 10, 2011, op cit; JUST MEANS, March 14, 2011, op cit; The Companies Bill (Proposed), 2011, No. 121, Lok Sabha, Clause 135; SEBI Circular CIR/CFD/DIL/8/2012, August 13, 2012. Table 2: The Impact on Firm Value of the Major Events in the Enactment of Section 135 –
RD Estimates using Local Polynomial Regressions
Date Event
RD Estimate,
Number of Observations
August 6,
2010 First announcement of a mandatory CSR requirement
-0.03318* (0.01803)
2252
September 8, 2010
Parliamentary standing committee recommends mandatory CSR requirement
0.00978 (0. 01602)
2246
December 24, 2010
Media reports of a relaxation from mandatory CSR to a comply-or-explain obligation
0.01161 (0.01955)
2278
February 10, 2011
Further news of movement towards a comply-or-explain obligation
-0.02543 (0.01705)
2174
March 14, 2011
Further news of movement towards a comply-or-explain obligation
-0.00663 (0.01317)
2188
July 11, 2011 The CSR provision are included as part of the new Companies Act
-0.00156 (0.01145)
2195
December 18, 2012
The bill that became the Companies Act of 2013 is passed by the Lok Sabha (the lower house of Parliament). The bill includes the CSR provision.
-0.01646 (0.01137)
2257
August 8, 2013
The bill that became the Companies Act of 2013 is passed by the Rajya Sabha (the upper house of Parliament). The bill includes the CSR provision.
-0.01165 (0.00964)
1825
Note: This table reports regression discontinuity (RD) estimates for cumulative abnormal returns (CARs) calculated using a (-3, +3) window around each of the major event dates, as described in the text. The CARs are Winsorized at 5%. The RD estimates use the INR 50 million threshold
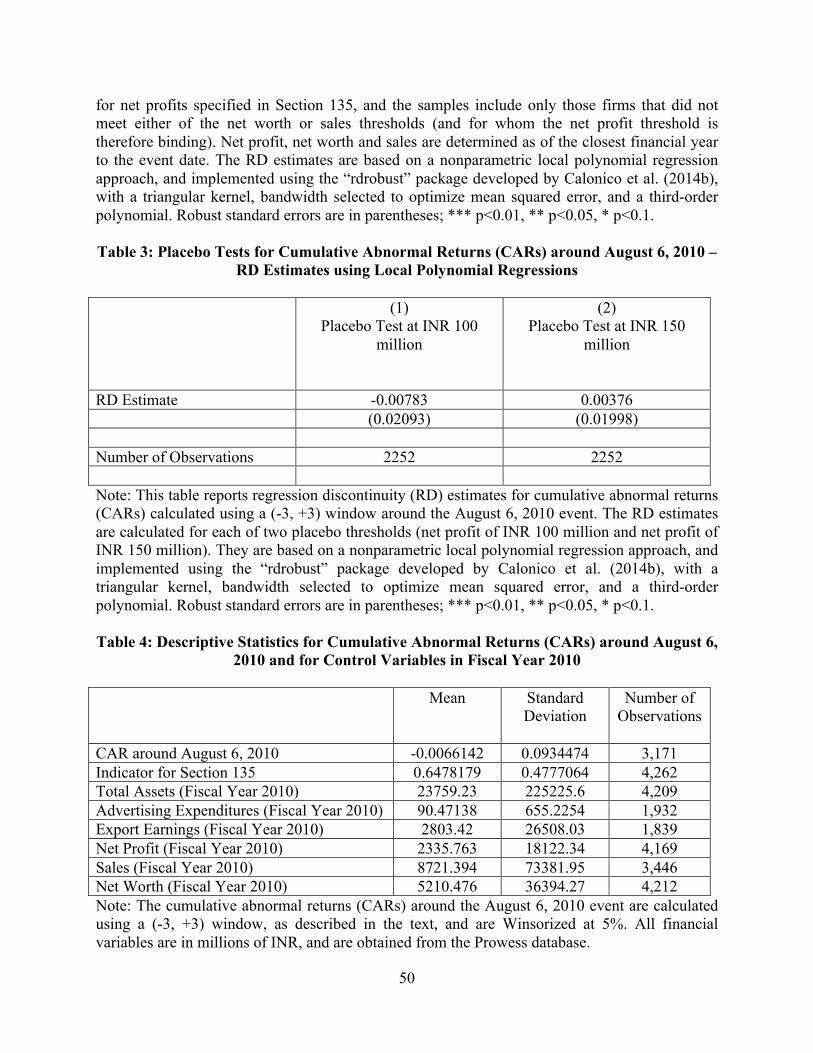
50
for net profits specified in Section 135, and the samples include only those firms that did not meet either of the net worth or sales thresholds (and for whom the net profit threshold is therefore binding). Net profit, net worth and sales are determined as of the closest financial year to the event date. The RD estimates are based on a nonparametric local polynomial regression approach, and implemented using the “rdrobust” package developed by Calonico et al. (2014b), with a triangular kernel, bandwidth selected to optimize mean squared error, and a third-order polynomial. Robust standard errors are in parentheses; *** p<0.01, ** p<0.05, * p<0.1. Table 3: Placebo Tests for Cumulative Abnormal Returns (CARs) around August 6, 2010 –
RD Estimates using Local Polynomial Regressions (1)
Placebo Test at INR 100 million
(2) Placebo Test at INR 150
million
RD Estimate -0.00783 0.00376 (0.02093) (0.01998) Number of Observations 2252 2252 Note: This table reports regression discontinuity (RD) estimates for cumulative abnormal returns (CARs) calculated using a (-3, +3) window around the August 6, 2010 event. The RD estimates are calculated for each of two placebo thresholds (net profit of INR 100 million and net profit of INR 150 million). They are based on a nonparametric local polynomial regression approach, and implemented using the “rdrobust” package developed by Calonico et al. (2014b), with a triangular kernel, bandwidth selected to optimize mean squared error, and a third-order polynomial. Robust standard errors are in parentheses; *** p<0.01, ** p<0.05, * p<0.1.
Table 4: Descriptive Statistics for Cumulative Abnormal Returns (CARs) around August 6,
2010 and for Control Variables in Fiscal Year 2010
Mean Standard Deviation
Number of Observations
CAR around August 6, 2010 -0.0066142 0.0934474 3,171 Indicator for Section 135 0.6478179 0.4777064 4,262 Total Assets (Fiscal Year 2010) 23759.23 225225.6 4,209 Advertising Expenditures (Fiscal Year 2010) 90.47138 655.2254 1,932 Export Earnings (Fiscal Year 2010) 2803.42 26508.03 1,839 Net Profit (Fiscal Year 2010) 2335.763 18122.34 4,169 Sales (Fiscal Year 2010) 8721.394 73381.95 3,446 Net Worth (Fiscal Year 2010) 5210.476 36394.27 4,212 Note: The cumulative abnormal returns (CARs) around the August 6, 2010 event are calculated using a (-3, +3) window, as described in the text, and are Winsorized at 5%. All financial variables are in millions of INR, and are obtained from the Prowess database.
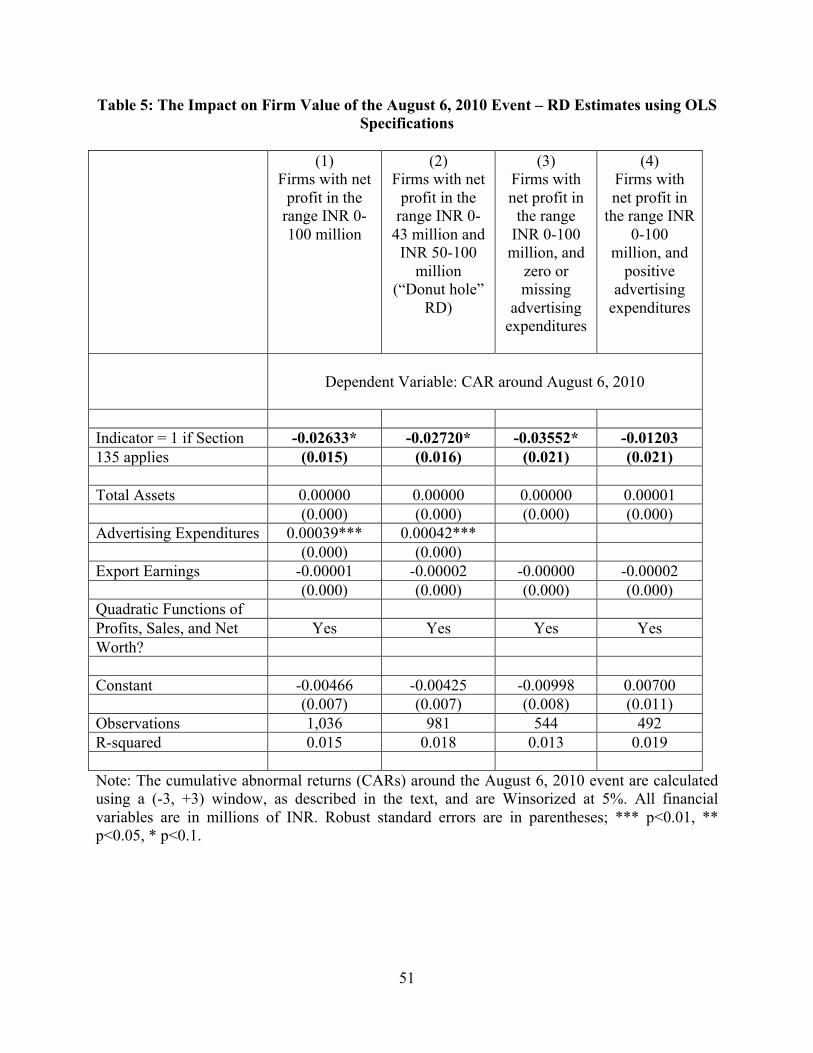
51
Table 5: The Impact on Firm Value of the August 6, 2010 Event – RD Estimates using OLS Specifications
(1)
Firms with net profit in the
range INR 0-100 million
(2) Firms with net
profit in the range INR 0-
43 million and INR 50-100
million (“Donut hole”
RD)
(3) Firms with net profit in
the range INR 0-100
million, and zero or missing
advertising expenditures
(4) Firms with net profit in
the range INR 0-100
million, and positive
advertising expenditures
Dependent Variable: CAR around August 6, 2010
Indicator = 1 if Section -0.02633* -0.02720* -0.03552* -0.01203 135 applies (0.015) (0.016) (0.021) (0.021) Total Assets 0.00000 0.00000 0.00000 0.00001 (0.000) (0.000) (0.000) (0.000) Advertising Expenditures 0.00039*** 0.00042*** (0.000) (0.000) Export Earnings -0.00001 -0.00002 -0.00000 -0.00002 (0.000) (0.000) (0.000) (0.000) Quadratic Functions of Profits, Sales, and Net Yes Yes Yes Yes Worth? Constant -0.00466 -0.00425 -0.00998 0.00700 (0.007) (0.007) (0.008) (0.011) Observations 1,036 981 544 492 R-squared 0.015 0.018 0.013 0.019 Note: The cumulative abnormal returns (CARs) around the August 6, 2010 event are calculated using a (-3, +3) window, as described in the text, and are Winsorized at 5%. All financial variables are in millions of INR. Robust standard errors are in parentheses; *** p<0.01, ** p<0.05, * p<0.1.
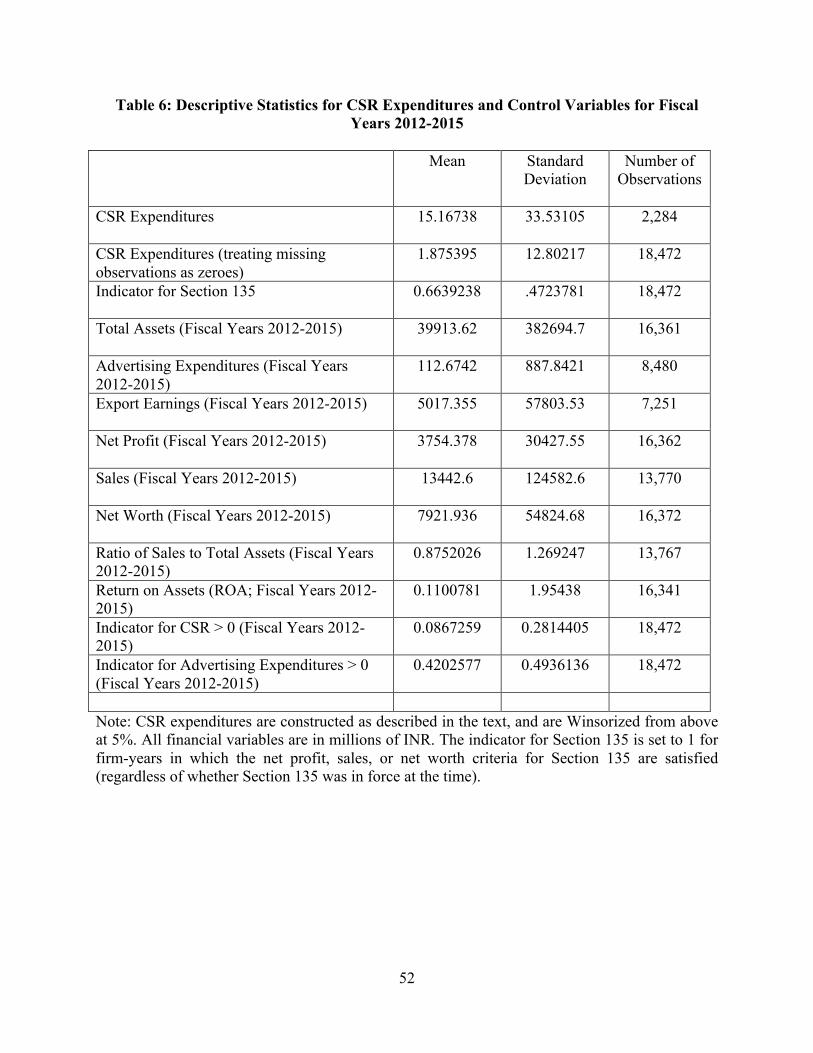
52
Table 6: Descriptive Statistics for CSR Expenditures and Control Variables for Fiscal Years 2012-2015
Mean Standard
Deviation Number of
Observations
CSR Expenditures
15.16738 33.53105 2,284
CSR Expenditures (treating missing observations as zeroes)
1.875395 12.80217 18,472
Indicator for Section 135
0.6639238 .4723781 18,472
Total Assets (Fiscal Years 2012-2015)
39913.62 382694.7 16,361
Advertising Expenditures (Fiscal Years 2012-2015)
112.6742 887.8421 8,480
Export Earnings (Fiscal Years 2012-2015)
5017.355 57803.53 7,251
Net Profit (Fiscal Years 2012-2015)
3754.378 30427.55 16,362
Sales (Fiscal Years 2012-2015)
13442.6 124582.6 13,770
Net Worth (Fiscal Years 2012-2015)
7921.936 54824.68 16,372
Ratio of Sales to Total Assets (Fiscal Years 2012-2015)
0.8752026 1.269247 13,767
Return on Assets (ROA; Fiscal Years 2012-2015)
0.1100781 1.95438 16,341
Indicator for CSR > 0 (Fiscal Years 2012-2015)
0.0867259 0.2814405 18,472
Indicator for Advertising Expenditures > 0 (Fiscal Years 2012-2015)
0.4202577 0.4936136 18,472
Note: CSR expenditures are constructed as described in the text, and are Winsorized from above at 5%. All financial variables are in millions of INR. The indicator for Section 135 is set to 1 for firm-years in which the net profit, sales, or net worth criteria for Section 135 are satisfied (regardless of whether Section 135 was in force at the time).
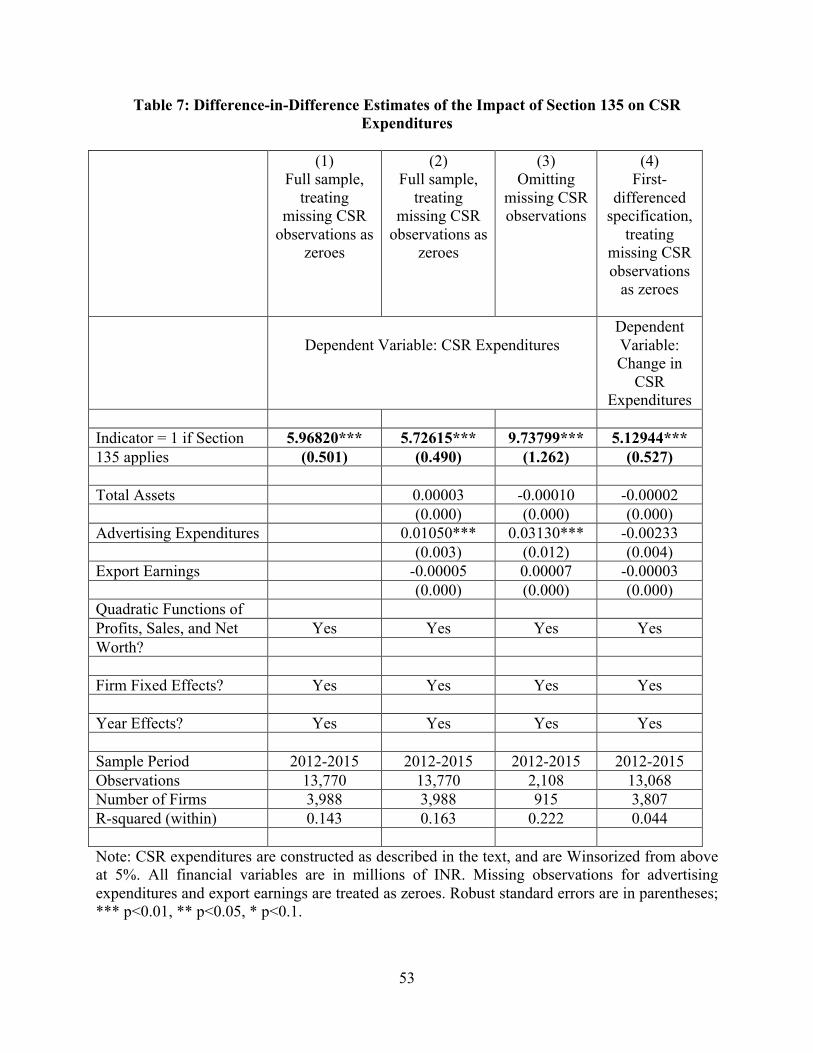
53
Table 7: Difference-in-Difference Estimates of the Impact of Section 135 on CSR Expenditures
(1)
Full sample, treating
missing CSR observations as
zeroes
(2) Full sample,
treating missing CSR
observations as zeroes
(3) Omitting
missing CSR observations
(4) First-
differenced specification,
treating missing CSR observations
as zeroes
Dependent Variable: CSR Expenditures
Dependent Variable: Change in
CSR Expenditures
Indicator = 1 if Section 5.96820*** 5.72615*** 9.73799*** 5.12944*** 135 applies (0.501) (0.490) (1.262) (0.527) Total Assets 0.00003 -0.00010 -0.00002 (0.000) (0.000) (0.000) Advertising Expenditures 0.01050*** 0.03130*** -0.00233 (0.003) (0.012) (0.004) Export Earnings -0.00005 0.00007 -0.00003 (0.000) (0.000) (0.000) Quadratic Functions of Profits, Sales, and Net Yes Yes Yes Yes Worth? Firm Fixed Effects? Yes Yes Yes Yes Year Effects? Yes Yes Yes Yes Sample Period 2012-2015 2012-2015 2012-2015 2012-2015 Observations 13,770 13,770 2,108 13,068 Number of Firms 3,988 3,988 915 3,807 R-squared (within) 0.143 0.163 0.222 0.044 Note: CSR expenditures are constructed as described in the text, and are Winsorized from above at 5%. All financial variables are in millions of INR. Missing observations for advertising expenditures and export earnings are treated as zeroes. Robust standard errors are in parentheses; *** p<0.01, ** p<0.05, * p<0.1.
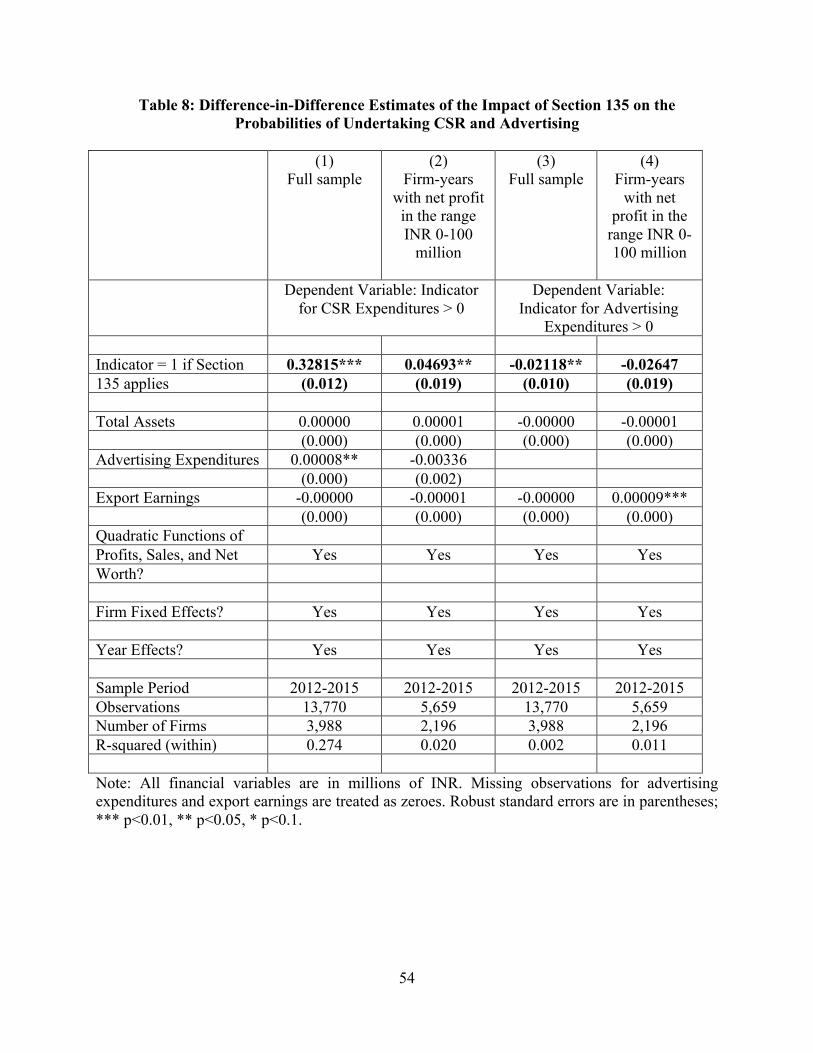
54
Table 8: Difference-in-Difference Estimates of the Impact of Section 135 on the Probabilities of Undertaking CSR and Advertising
(1)
Full sample (2)
Firm-years with net profit
in the range INR 0-100
million
(3) Full sample
(4) Firm-years
with net profit in the
range INR 0-100 million
Dependent Variable: Indicator
for CSR Expenditures > 0 Dependent Variable:
Indicator for Advertising Expenditures > 0
Indicator = 1 if Section 0.32815*** 0.04693** -0.02118** -0.02647 135 applies (0.012) (0.019) (0.010) (0.019) Total Assets 0.00000 0.00001 -0.00000 -0.00001 (0.000) (0.000) (0.000) (0.000) Advertising Expenditures 0.00008** -0.00336 (0.000) (0.002) Export Earnings -0.00000 -0.00001 -0.00000 0.00009*** (0.000) (0.000) (0.000) (0.000) Quadratic Functions of Profits, Sales, and Net Yes Yes Yes Yes Worth? Firm Fixed Effects? Yes Yes Yes Yes Year Effects? Yes Yes Yes Yes Sample Period 2012-2015 2012-2015 2012-2015 2012-2015 Observations 13,770 5,659 13,770 5,659 Number of Firms 3,988 2,196 3,988 2,196 R-squared (within) 0.274 0.020 0.002 0.011 Note: All financial variables are in millions of INR. Missing observations for advertising expenditures and export earnings are treated as zeroes. Robust standard errors are in parentheses; *** p<0.01, ** p<0.05, * p<0.1.
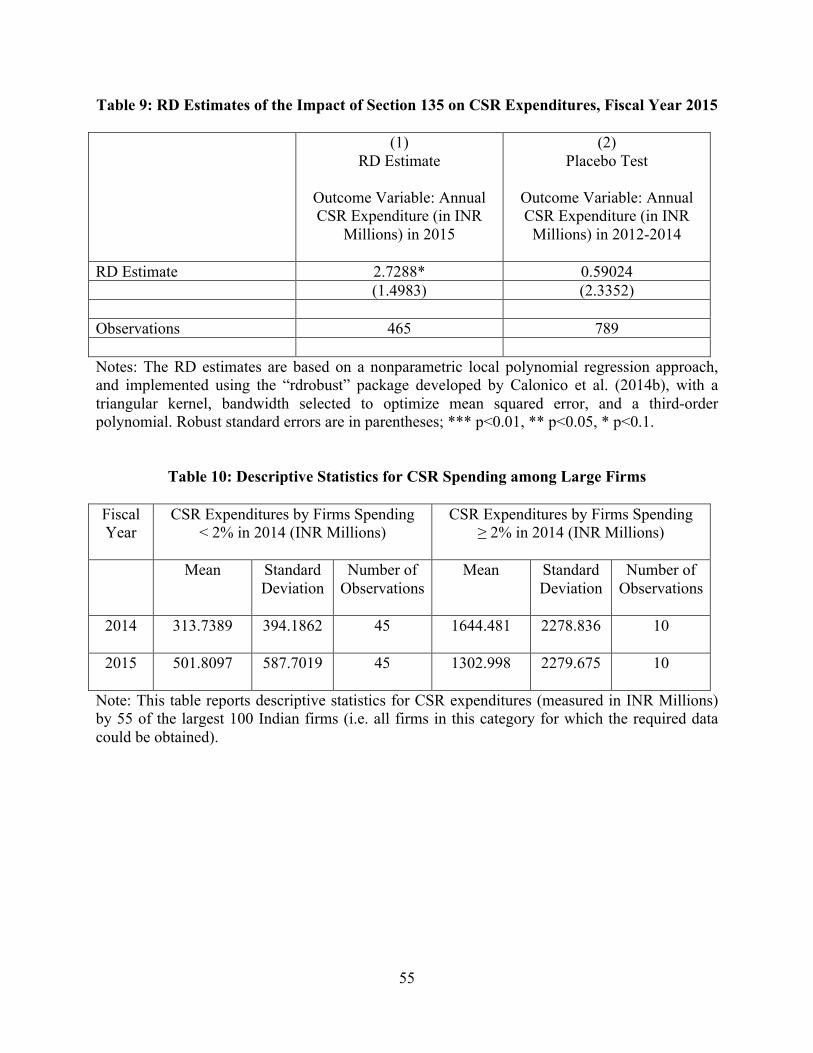
55
Table 9: RD Estimates of the Impact of Section 135 on CSR Expenditures, Fiscal Year 2015 (1)
RD Estimate
Outcome Variable: Annual CSR Expenditure (in INR
Millions) in 2015
(2) Placebo Test
Outcome Variable: Annual CSR Expenditure (in INR
Millions) in 2012-2014
RD Estimate 2.7288* 0.59024 (1.4983) (2.3352) Observations 465 789 Notes: The RD estimates are based on a nonparametric local polynomial regression approach, and implemented using the “rdrobust” package developed by Calonico et al. (2014b), with a triangular kernel, bandwidth selected to optimize mean squared error, and a third-order polynomial. Robust standard errors are in parentheses; *** p<0.01, ** p<0.05, * p<0.1.
Table 10: Descriptive Statistics for CSR Spending among Large Firms Fiscal Year
CSR Expenditures by Firms Spending < 2% in 2014 (INR Millions)
CSR Expenditures by Firms Spending ≥ 2% in 2014 (INR Millions)
Mean Standard Deviation
Number of Observations
Mean Standard Deviation
Number of Observations
2014 313.7389
394.1862 45 1644.481 2278.836 10
2015 501.8097
587.7019 45 1302.998 2279.675 10
Note: This table reports descriptive statistics for CSR expenditures (measured in INR Millions) by 55 of the largest 100 Indian firms (i.e. all firms in this category for which the required data could be obtained).
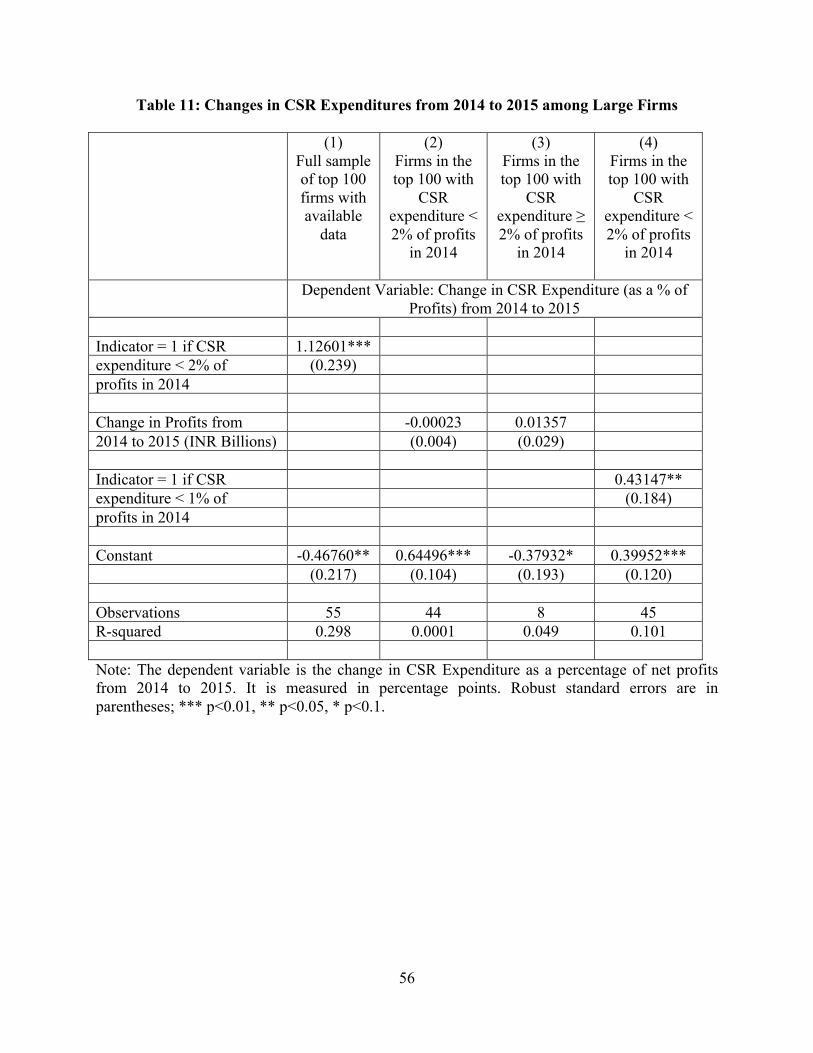
56
Table 11: Changes in CSR Expenditures from 2014 to 2015 among Large Firms
(1) Full sample of top 100 firms with available
data
(2) Firms in the top 100 with
CSR expenditure < 2% of profits
in 2014
(3) Firms in the top 100 with
CSR expenditure ≥ 2% of profits
in 2014
(4) Firms in the top 100 with
CSR expenditure < 2% of profits
in 2014
Dependent Variable: Change in CSR Expenditure (as a % of Profits) from 2014 to 2015
Indicator = 1 if CSR 1.12601*** expenditure < 2% of (0.239) profits in 2014 Change in Profits from -0.00023 0.01357 2014 to 2015 (INR Billions) (0.004) (0.029) Indicator = 1 if CSR 0.43147** expenditure < 1% of (0.184) profits in 2014 Constant -0.46760** 0.64496*** -0.37932* 0.39952*** (0.217) (0.104) (0.193) (0.120) Observations 55 44 8 45 R-squared 0.298 0.0001 0.049 0.101 Note: The dependent variable is the change in CSR Expenditure as a percentage of net profits from 2014 to 2015. It is measured in percentage points. Robust standard errors are in parentheses; *** p<0.01, ** p<0.05, * p<0.1.