Embed Size (px)
Citation preview

Clemson UniversityTigerPrints
All Dissertations Dissertations
5-2016
The Impact of Leadership on School Culture andStudent AchievementMatthew Joseph PiotrowskyClemson University, [email protected]
Follow this and additional works at: https://tigerprints.clemson.edu/all_dissertations
This Dissertation is brought to you for free and open access by the Dissertations at TigerPrints. It has been accepted for inclusion in All Dissertations byan authorized administrator of TigerPrints. For more information, please contact [email protected].
Recommended CitationPiotrowsky, Matthew Joseph, "The Impact of Leadership on School Culture and Student Achievement" (2016). All Dissertations. 1623.https://tigerprints.clemson.edu/all_dissertations/1623

i
THE IMPACT OF LEADERSHIP ON SCHOOL CULTURE AND STUDENT ACHIEVEMENT
A Dissertation Presented to
the Graduate School of Clemson University
In Partial Fulfillment of the Requirements for the Degree
Doctor of Philosophy Educational Leadership
by Matthew Joseph Piotrowsky
May 2016
Accepted by: Dr. Robert Knoeppel, Committee Chair
Dr. Russ Marion Dr. Joanne Avery
Dr. Barbara Nesbitt

ii
ABSTRACT
This study examined the predictive relationship of school leadership on school
culture. Given the demands of standards based education reform, the goal of every
school is student achievement. The literature review examines the previous studies
showing significance of leadership on culture, leadership on teacher retention, and
leadership and school culture on student achievement. This study uses the School
Culture Survey developed by Gruenert and Valentine (1998). It is a 35-item Likert-scale
survey defining six variables; Collaborative Leadership, Teacher Collaboration,
Professional Development, Unity of Purpose, Collegial Support, and Learning
Partnerships.
The survey was distributed electronically to an upstate South Carolina school
district’s elementary school. The analysis of the responses was done with stepwise
multiple regression and hierarchical linear modeling. By using the combination of these
methods it was confirmed that leadership does have a statistically significant impact on
school culture. A Post hoc test was used to determine the relationship between school
culture and teacher retention and school culture and student achievement. A positive
relationship was found to exist between schools with a Culture of Learning Partnerships
and teacher retention and between schools with a Culture of Learning Partnerships and
student achievement. Recommendations for future research and for practice are offered.
iii
DEDICATION
I dedicate this first of all to my parents. There never was an option other than
school. That being the case, I seem to have made education my life. I chose it as a career
and I have spent more time as a student than one-third of the population that is alive.
Dad: I so wish you were here to see the conclusion of this degree. I know you are
watching, but I wish I could shake your hand again as I finalize these words and walk. I
remember your attempt to define “potential” to me as a young boy. You always said I
had it and I never knew what it was. Thus, you tried to explain it by describing the water
behind a dam. Well, I get it now. It’s because of you that we ended up here. It’s
because of you I went to Clemson. And it’s because of you I have never quit. That was
never an option and thank you for teaching me that. I love you.
Mom: you have always been loving and taught me patience. Your quiet
perseverance of life and its obstacles is as stoic as it is stubborn. Through all of my life’s
obstacles, I’ve persevered from your example and love. It has made me a stronger person
and patient and loving man.
To family: Grandma, Michael, Carol Ann, Marsel, Tyler, Chris, Angelique, and
all of my other Aunts, Uncles and cousins, I love and appreciate all of you.
Davis, son, I hope I can teach you as much as my parents taught me. I love you
and enjoy everyday I get with you.
To all of my friends: the fact that you are still my friends after all this says
everything! Thank you for your support and I Love Y’all BONCHES.

iv
Dr. Knoeppel: To bring this around full circle, thank you for recognizing my
intellectual and professional potential.
To the rest of my committee: Dr. Marion, Dr. Avery and Dr. Nesbitt, thank you
all for coming together to help make this happen. I truly appreciate your time and efforts.

v
TABLE OF CONTENTS
Page
TITLE PAGE ...................................................................................................................... i ABSTRACT ....................................................................................................................... ii DEDICATION .................................................................................................................. iii LIST OF TABLES ........................................................................................................... vii LIST OF FIGURES ........................................................................................................ viii CHAPTER I. INTRODUCTION ........................................................................................... 1 Background ................................................................................................ 1 Purpose of the Study .................................................................................. 4 Significance of the Study ........................................................................... 5 Theoretical Framework .............................................................................. 5 Definitions of Terms .................................................................................. 7 Limitations and Delimitations.................................................................. 10 Summary .................................................................................................. 11 II. LITERATURE REVIEW .............................................................................. 12 Introduction .............................................................................................. 12 Standards, Student Achievement and School Leadership ........................ 13 Teacher Quality ........................................................................................ 14 Culture, Climate and School Improvement ............................................. 18 Retention Behaviors/Variables ................................................................ 21 Leadership and Culture ............................................................................ 25 Poverty and School Culture ..................................................................... 30 Summary .................................................................................................. 31 III. METHODS .................................................................................................... 33 Introduction .............................................................................................. 33

vi
Table of Contents (Continued)
Page Method ..................................................................................................... 33 Research Hypothesis ................................................................................ 35 Data Collection and Sample ..................................................................... 37 Summary .................................................................................................. 44 IV. RESULTS ...................................................................................................... 45 Introduction .............................................................................................. 45 Data Collection and Processing ............................................................... 45 Data Analysis – Independent Variables ................................................... 46 Data Analysis – Dependent Variables ..................................................... 48 Redesigned Theoretical Framework ........................................................ 54 Results of the HLM .................................................................................. 55 Multiple Regression - Stepwise ............................................................... 56 Summary .................................................................................................. 61 V. DISCUSSION AND IMPLICATIONS ......................................................... 63 Introduction .............................................................................................. 63 Summary of the Study ............................................................................. 63 Research Question Answered with Statistical Support ............................ 65 Retention and Achievement ..................................................................... 68 Post Hoc Test ........................................................................................... 74 Implications for Practice and Future Study ............................................. 79 Summary .................................................................................................. 81 APPENDICES ................................................................................................................. 82 A: School Culture Survey ................................................................................... 83 B: Permission to us the School Culture Survey .................................................. 86 REFERENCES ................................................................................................................ 87
vii
LIST OF TABLES
Table Page 3.1 Survey questions grouping by variable ........................................................ 35 3.2 Cronbach’s Alpha factor reliability for School Culture Survey variables ..................................................................................... 37 3.3 Response number and rate by school ........................................................... 38 3.4 School report card characteristics by school ................................................ 39 4.1 Adjusted responses and rate after imputation .............................................. 46 4.2 Factor Analysis of the Leadership and Unity of Purpose variables ................................................................................................. 47 4.3 Factor analysis for the three new dependent variables chosen .................................................................................................... 51 4.4 New question groupings for dependent variables ........................................ 53 5.1 Survey questions grouped by variable used in post hoc average test ............................................................................................. 75 5.2 Post hoc questions analysis and school grouping from raw data .................................................................................................. 76

viii
LIST OF FIGURES
Figure Page 1.1 Theoretical Framework Model of School Leadership ................................... 7 2.1 Leithwood’s model of Leadership to Student Learning .............................. 26 4.1 Eigenvalues and Bartlett’s Test for Dependent Variables ........................... 49 4.2 Scree Plot of Dependent Variables after Factor Analysis ............................ 50 4.3 Redesigned Theoretical Framework Model ................................................. 54 4.4 Regression plot of Unity of Purpose vs. Culture of Learning Partnerships with all four schools ........................................... 59 4.5 Regression plot of Unity of Purpose vs. Culture of Collegiality with all four schools ........................................................... 60 4.6 Regression plot of Unity of Purpose vs. Culture of School Improvement with all four schools ............................................ 61

1
CHAPTER ONE
INTRODUCTION
Background
In their seminal report The Principal’s Role in Shaping School Culture, Deal and
Peterson (1990) describe the pressures facing educational leaders regarding school
improvement and student achievement. As noted by the authors, calls for education
reform have been ongoing. For example, national education goals were released in 1990
under the leadership of President George H.W. Bush and the 50 state governors. Later, in
2000, policymakers agreed that children in the United States should enter school ready to
learn, graduate from school at a rate of 90 percent, demonstrate competence in
challenging subject matter and be prepared for citizenship, rise to first in the world in
mathematics and science, attend safe, disciplined, and drug free schools, and join the
workforce as literate adults and responsible citizens (Deal & Peterson, 1990). Later, in
2001, the reauthorization of the Elementary and Secondary Education Act, known as the
No Child Left Behind Act (NCLB) of 2001, required that states establish standards and
assessments of basic skills. The Act required that these assessments be administered on a
yearly basis and that schools demonstrate progress toward proficiency on the standards.
In addition, NCLB included provisions for teacher quality. Most recently in the latest
reauthorization of ESEA, the Every Child Succeeds Act (ESSA) was signed in to law on
December 10, 2015. ESSA still requires that states establish challenging curriculum
standards and yearly testing of students, but the law gives more control to states over
accountability goals and assessment plans.

2
In considering strategies for school reform, Deal and Peterson (1990) introduced
five specific strategies for school improvement. Included in this list was what the authors
titled the school culture or ethos approach. This approach focuses on behavioral patterns
and the values, beliefs and norms that define those patterns. According to the authors,
this approach is premised on that assumption that teachers and students are heavily
influenced by morale, routines, and conscious or unconscious conventions about how
things are done in their respective schools. Schools experience difficulties when
ineffective practices become accepted as conventions in schools. Reform and change in a
school can be accomplished through a focus on changing school culture.
Bolman and Deal (2008) define culture as the glue that binds an organization,
unites people, and helps an organization accomplish a desired goal. In order for each
student to receive the opportunity for a high-quality education, high-quality teachers must
be recruited and retained (Baker-Doyle, 2010). School leadership has been linked to
school culture and teacher commitment. In turn school culture and teacher retention have
been linked to student performance (Bradshaw, Waasdorp, Debnam, & Johnson, 2014,
Leithwood & Beatty, 2008, Helterbran, 2010, and Hulpia, Devos & Van Keer, 2010).
School culture has been shown to be a major component of success at the school,
teacher and student level (Creemers & Kyriakides, 2010 and Yahaya, Yahaya, Ramli,
Hashim & Zakariya, 2010). Lumby and Foskett (2011) defined the concept of school
culture as a tool to assist with the process of making sense of people by providing a
mechanism for categorizing, simplifying, and describing the human state. Their research
was focused on the impact of school leadership on school culture. Bolman and Deal

3
(2008) stated that leaders who understand how to evoke spirit and soul can shape a more
cohesive and effective organization.
Quality teachers must be recruited, retained and equally distributed throughout
classrooms in order to ensure all children have an opportunity to learn. The No Child
Left Behind Act described a highly qualified teacher as one who has a minimum of a
bachelor’s degree, meets full state certification requirements, and demonstrates subject-
matter mastery in each subject taught (Paige, 2004). Boe, Cook and Sunderland (2008)
estimated from Teacher Follow-up Survey data from 2000-2001 that 25.5% of teachers
leave within the first three years of employment. In order to combat this “crisis”
(Gujarati, 2012) suggested implementing administrator-supported activities such as
mentoring and school and district level induction programs (Conway, Krueger, Robinson,
Haack, & Smith, 2002; Ingersoll, 2004; Kent, Feldman, & Hayes, 2009). Furthermore,
Prather-Jones (2011) found that administrative support had a connection to teachers’
career decisions.
“The efforts or behaviors of those providing leadership are among the most
powerful direct sources or influences on teachers’ working conditions and both direct and
indirect sources of influence on teacher emotions” (Leithwood & Beatty, 2008, p. 11).
Leadership styles such as distributive leadership, instructional leadership, collaborative
leadership, and even transformational leadership have all been shown to be statistically
significant predictors of school culture (Arbabi & Mehdinezhad, 2015; Fusarelli,
Kowalski, & Petersen, 2011; Ross & Gray, 2006; Sahin, 2011). Successful educational
leaders understand the goals of public education in the 21st century and act

4
collaboratively to develop a shared vision of success; they regularly reflect on their
beliefs and values with regard to the purpose of education and act to create a culture and
climate that supports student achievement (Darling-Hammond, 2007).
Leadership and culture have been shown to correlate directly to student
achievement (Helterbran, 2010, Perilla, 2014, Wilhem, 2016, and Yahaya, Yahaya,
Ramli, Hashim, & Zakariya, 2010). Establishing collaborative and congenial working
relationships with administrators and teachers and nurturing teacher-teacher relationships
through support of professional learning communities has been found to be effective in
closing the achievement gap for learners (Leithwood, 2010). That type of school culture
and climate can directly influence school performance (Adeogun & Olisaemeka, 2011).
Purpose of the Study
The purpose of this study was to examine the influence of leadership on school
culture. Given the demands of standards based education reform, the goal of every
school is student achievement. Teachers have been identified as the most important
school level resource that impacts student achievement. As such, the recruitment and
retention of quality teachers is of paramount importance. Current research supports the
claim that a positive school culture can increase teacher retention and increase student
achievement.
For the purposes of this study, culture was initially defined as teacher
collaboration, professional development, collegial support, and learning partnerships.
Leadership was defined as collaborative leadership and unity of purpose

5
Significance of the Study
The significance of this study is to contribute to the scholarship of the impact of
school leadership on school culture. Data collection for the study included responses
from teachers in four elementary schools on the School Culture Survey (Gruenert &
Valentine, 1998). The data were analyzed using hierarchical linear modeling (HLM) and
a stepwise multiple regression. The choice to use hierarchical linear modeling allowed
the researcher to consider the nested nature of culture. As such, data collected for use in
the study was at two levels, school and teacher. Conclusions were drawn about the
predictive nature of school leadership on school culture. Research has shown that
leadership can have a statistically significant impact on culture (Arbabi & Mehdinezhad,
2015; Fusarelli, Kowalski, & Petersen, 2011; Ross & Gray, 2006; Sahin, 2011) and that
school culture can have an impact on student achievement (Adeogun & Olisaemeka,
2011). The study will conclude by attempting to make a connection between the effect of
leadership and culture on teacher retention and test scores.
Theoretical Framework
To better understand the predictive nature of leadership on culture and the impact
on student achievement, the theoretical framework in the study was created using the
current literature on educational leadership, culture, teacher retention, and educational
opportunity. Current policy in schools requires accountability for performance; one
purpose of the Elementary and Secondary Education Act, Title 1, Part A of Public Law
107-110 was to enable schools to provide opportunities for all children to acquire the
knowledge and skills contained in the challenging state content (U.S. Department of

6
Education, 2016). The demonstration of proficiency on state defined content standards
was thought to be a measure of opportunity which would ensure that students were
prepared to enter the workforce and become productive citizens of society.
Isbister (2001) stated that equality is central to the notions of social justice and
opportunity. The author reasoned that the provision of equal access to resources can give
individuals equal opportunities to achieve their desired goals. Over time, the effects of
achieving equal outcomes are cumulative; achievement of equal outcomes can and does
advance the possibility of equal opportunity. Because the teacher has been identified as
the single most important school level resource that impacts student achievement, the
retention of quality teachers becomes a matter of critical importance. Educational leaders
are tasked with the creation of learning organizations that are aligned to meet the
demands of providing educational opportunity. This begins with a focus on culture
(Sullivan & Glanz, 2006; Zmuda, Kulis, & Kline, 2004).
Collaborative Leadership has been shown to have a positive correlation to teacher
efficacy (Arbabi & Mehdinezhad, 2015) and is an initial driver in school improvement
(Heck & Hallinger, 2010). Positive teacher efficacy and teacher retention has been
linked to actions taken by the administrator to create a positive school culture (Leithwood
& Beatty, 2008). “Schools in which teachers have more control over key school wide
and classroom decisions have fewer issues with student misbehavior, show more
collegiality and cooperation among teachers and administrators, have a more committed
and engaged teaching staff, and do a better job of retaining their teachers” (Ingersoll,

7
2007, p.24). The opportunity to improve student achievement lies within school culture
and leadership (Wilhem, 2016; Yahaya, Yahaya, Ramli, Hashim & Zakariya, 2010).
Based on this literature, the theoretical framework was created. The theoretical
framework appears in Figure 1.1. Leadership is defined as collaborative leadership and
unity of purpose. Leadership is predictive of culture which can be defined as teacher
collaboration, professional development, collegial support, and learning partnerships.
Figure 1.1: Theoretical Framework Model of School Leadership
Definitions of Terms
The following definitions are provided to offer clarity of the terms used
throughout this study:

8
ACT Aspire - A standards-based system of assessments to monitor progress
toward college and career readiness from grade 3 through early high school,
connecting each grade level to the next (ACT Aspire LLC, 2016).
Attrition - Leaving the profession or changing schools (Johnson, 2004).
Bartlett’s Test - A procedure that tests the null hypothesis that the variables in
the population correlation matrix are uncorrelated and used for factor analysis
with small samples (Mertler & Vannatta, 2010).
Climate - The set of internal characteristics that distinguish one school from
another and influence the behaviors of each school’s members (Hoy & Miskel,
2005).
Collaborative Leadership - The degree to which school leaders establish and
maintain collaborative relationships with school staff (Gruenert & Valentine,
1998).
Collegial Support - The degree to which teachers work together effectively
(Gruenert & Valentine, 1998).
Culture - The totality of the organizational experience (Marion, 2002).
Distributive Leadership - Leadership that diffuses leadership throughout the
whole organization thus making the school or organization less dependent on
individual leaders (Fusarelli, Kowalski, & Petersen, 2011).
Eigen Value- The amount of total variance explained by each factor (Mertler &
Vannatta, 2010).
9
Factor Analysis - A mathematical model created resulting in the estimation of
factors in contrast with the principal component analysis (Mertler & Vannatta,
2010).
Hierarchical Linear Modeling (HLM) - A complex form of ordinary least
squares regression that is used to analyze variance in the outcome variables when
the predictor variables are at varying hierarchical levels. HLM applies when the
observations in a study form groups and when those groups are in some way
randomly selected (Raudenbush & Bryk, 2002).
Learning Partnerships - The degree to which teachers, parents, and student
work together for the common good of the student (Gruenert & Valentine, 1998).
Multiple Regression - Identifies the best combination of predictors (independent
variables) of the dependent variable and is used when there are several
independent quantitative variables and one dependent variable (Mertler &
Vannatta, 2010).
Poverty Index - The percent of students participating in Medicaid, SNAP, or
TANF; homeless, foster or migrant students.
Principal Component Analysis (PCA) - PCA is used for extracting factors in
factor analysis and when the original variables are transformed into a new set of
linear combinations by extracting the maximum variance for the data set with
each component (Mertler & Vannatta, 2010).

10
Professional Development - The degree to which teachers value continuous
personal development and school-wide improvement (Gruenert & Valentine,
1998).
Retention - Teachers staying at their school and in the teaching profession.
School Improvement - Teachers, students, parents and leaders working together
to value school advancement.
Scree Plot - A plot that graphs the magnitude of each Eigen value placed on the
vertical axis and plotted against their ordinal numbers on the horizontal axis
(Mertler & Vannatta, 2010).
Stepwise Multiple Regression – a procedure to determine which specific
independent variables make a meaningful contribution to the overall prediction by
entering them in the equation in order (Mertler & Vannatta, 2010).
Teacher Collaboration - The degree to which teachers engage in constructive
dialog that furthers the educational vision of the school (Gruenert & Valentine,
1998).
Unity of Purpose - The degree to which teachers work toward a common mission
for the school (Gruenert & Valentine, 1998).
Limitations and Delimitations
The purpose of this study was to explore the predictive capacity of leadership on
school culture. In order to have adequate power in running a successful HLM, large
samples are normally required. The survey was distributed to the instructional staff of
the four elementary schools within one district. There are approximately 111 classroom

11
teachers employed by these four schools. If there were 100% return rate on the survey,
that would still give a small sample. Thus, more responses and schools would obviously
help the overall power of the results.
Delimitations of this study would include the fact that only the elementary schools
were chosen to take part in the survey. This left out the middle school and high school
that were also a part of the district. The middle school was purposely excluded due to the
fact that the researcher is employed there. The high school was left out due to the fact that
the ACT Aspire test results would cover the smallest portion of their student body.
Summary
The purpose of this chapter was to introduce the critical role of the principal in
achieving the goals of school improvement. Culture was introduced as one strategy for
school improvement. The chapter included a brief synopsis of the literature describing
the relationship between leadership and culture; this literature was used to create a
theoretical framework for the study.
Chapter two includes a review of the literature on leadership and school culture.
Chapter three includes an explanation of the proposed methodology of the study as well
as the plan for data collection and data analysis. Chapter four includes a presentation of
findings. Chapter five situates findings from the study within the existing literature and
includes recommendations for future research and practice.

12
CHAPTER TWO
LITERATURE REVIEW
Introduction
The purpose of this study was to examine the influence of leadership on school
culture. Given the demands of standards based education reform, the goal of every
school is student achievement. One strategy for improving schools is to improve the
culture of the school. Teachers have been identified as the most important school level
resource that impacts student achievement. As such, the recruitment and retention of
quality teachers is of paramount importance. Current research supports the claim that a
positive school culture can increase teacher retention and increase student achievement.
The literature review will discuss education reform and the purpose of schools,
leadership during a time of standards based reform, the importance of a quality teacher,
culture, retention behaviors/variables, the relationship of leadership and the impact of
poverty on school culture. Further, the chapter includes a synthesis of the literature base
describing the relationship of school culture and school leadership. The chapter
concludes with a review of literature on how the leader can have a positive effect on the
school’s culture.
This quote from Darling-Hammond (2007) succinctly introduces the review of
literature, “It is the work they do that enables teachers to be effective—as it is not just the
traits that teachers bring, but their ability to use what they know in a high-functioning
organization, that produces student success. And it is the leader who both recruits and
retains high quality staff—indeed, the number one reason for teachers’ decisions about

13
whether to stay in a school is the quality of administrative support—and it is the leader
who must develop this organization” (p. 17).
Standards, Student Achievement, and School Leadership
Education reform in the United States has been ongoing for the past four decades.
Scholars have traced the standards based reform movement to the publication of A Nation
at Risk in 1983. This report linked the decline in American competitiveness to a
perceived lack of rigor in public schools and resulted in the adoption of learning
standards in all fifty states. According to Linn (2000), standards-based education reform
challenged past practices in education that differentiated both content and instruction
based on teacher perceptions of student ability. By changing the process of instruction
and offering rigorous content to all students, it was thought that an increase student
achievement would result. As such, schools and school districts were tasked with
designing appropriate instructional practices and strategies that meet the needs of all
learners across content areas in return for accountability as measured by student
performance (Goertz, 2001; Spillane & Seashore Louis, 2002; Weiss, Knapp, Hollweg &
Burrill, 2001). The standards based reform movement highlighted the need for policies
and procedures that would lead to school improvement.
Current research suggests that the role of the principal has changed from manager
to leader as a result of the standards movement. Leader is defined as change agent,
facilitator, and consensus builder (Beck & Murphy, 1993). Successful educational leaders
understand the goals of public education in the 21st century and act collaboratively to
develop a shared vision of success; they regularly reflect on their beliefs and values with

14
regard to the purpose of education and act to create a culture and climate that supports
student achievement (Darling-Hammond, 2007). Authentic leaders who are committed to
their core values can inspire followership and trust. In so doing, the leader is able to
articulate a shared vision for their schools and create learning organizations that focus on
continuous improvement (Kouzes & Posner, 2002; Fullan, 2001; Blase & Kirby, 2000;
Evans, 1996).
Previous leadership theory is thought to be insufficient to address the current
demands of education. The change in the notion of school leadership begins with a focus
on culture (Sullivan & Glanz, 2006; Zmuda, Kulis, & Kline, 2004). Effective schools of
the 21st century are characterized by a culture wherein there is a shared purpose,
decisions are made collaboratively, responsibilities are distributed among teacher leaders
and capacity exists to create and sustain change through a process of data driven decision
making. Successful schools are organizations that make use of an ethical decision making
framework that guides practice. Leaders of 21st century schools focus on the most
important facet of the schooling process: instruction (Leithwood & Riehl, 2005;
Marzano, Waters & McNulty, 2005). After facilitating shared purpose and changing
school culture, educational leaders must establish new norms for behavior that establish
learning communities wherein the expertise of all members of the faculty are maximized
to support the school’s mission.
Teacher Quality
Current school improvement initiatives focus on teacher quality issues as critical
to ensuring academic achievement for all students. In early 1998, national legislation and

15
state requirements for teacher testing began to give increased attention to teacher quality
(Ramirez, 2003). Reauthorization of the Higher Education Act in 1998 required state and
higher education accountability for preparing teachers who are highly skilled
pedagogically and highly competent in their academic teaching content area.
Secretary of Education Paige (2004), in the Third Annual Report on Teacher
Quality, noted that “highly qualified teachers matter” and that “research evidence now
emerging supports the belief that teachers are an important determinant of the quality of
education in the nation’s schools” (p.1). Students taught by good teachers have been
shown by research to progress academically at greater rates than students in classrooms
with poor teachers (Sanders, 2000; Sanders & Horn, 1998; Sanders, Wright, & Ross,
1999; Topping & Sanders, 2000). In describing the critical role played by teachers in the
school’s influence on student learning, Hodge (2003) reported that “research has
consistently shown that teacher effect accounts for 55% to 80% of the variance associated
with student achievement.” However, identifying the characteristics of a quality teacher
is more difficult than it may appear.
The No Child Left Behind Act described a highly qualified teacher as one who
has a minimum of a bachelor’s degree, meets full state certification requirements, and
demonstrates subject-matter mastery in each subject taught (Paige, 2004). Thus, NCLB
legislation identified teaching skills and subject knowledge as two essential elements of
teacher quality. Researchers have examined effects of a variety of variables on student
achievement: teacher preparation (Wilson, Floden, & Ferrini-Mundy, 2002), major or
minor in a subject area (Goldhaber & Brewer, 1997; Hawk, Coble, & Swanson, 1985;

16
Monk & King, 1994), teachers’ advanced degrees (Goldhaber & Brewer, 2000), and
National Teacher Exam (NTE) scores (Quirk, Witten, & Weinberg, 1973). Although
there have been mixed results in some areas of study, generally, subject content
knowledge seems to matter, particularly in teaching complex, higher levels of subject
matter. However, after a threshold of competency is attained, pedagogical teacher
training may be more important to student success than content knowledge (Laczko-Kerr
& Berliner, 2002).
Measurable variables drive policy with regard to teacher quality. Ferguson and
Ladd (1996); Greenwald, Hedges, and Lange (1996); and Murnane and Phillips (1981)
examined teaching experience as a measurable variable in student achievement. Based on
a review of these studies, King Rice (2003) proposed that teaching experience appears to
have a relationship to student achievement. However, at the elementary level, the
relationship is strongest during the first several years of teaching and then drops off
(Ferguson, 1991; Hanushek, 1997). Research indicates that positive effects on student
achievement reemerge after 8 to 14 years of teaching experience (Ferguson, 1991).
Teaching experience has a more sustained effect on student achievement at the high
school level than elementary, and the teaching experience effect for high school students
compared to elementary continues later in teachers’ careers (Ferguson, 1991).
Results of primarily qualitative studies of teacher preparation programs showed
mixed results about program contributions to teacher competence and student
achievement (King Rice, 2003). Adams and Krockover (1997) indicated a positive
influence on novice teachers’ framework for organizing, understanding, and reflecting on

17
their classroom experiences. Hollingsworth found that subject-specific pedagogy and
classroom management appeared to be the most important teacher preparation
components (as cited in King Rice, 2003).
Teacher certification has shown a positive effect on high school mathematics
achievement when the teacher’s certification is in mathematics (Goldhaber & Brewer,
1997; Hawk, Coble, & Swanson, 1985). Teacher coursework, both in pedagogy (Adams
& Krockover, 1997; Ferguson & Womack, 1993; Monk & King, 1994) and the subject
taught (Monk & King, 1994), contributes to positive student results. Course content in the
subject taught appears to be most important at the high school level. Teachers’ verbal
skills or literacy levels appear to be correlated with student achievement (Bowles &
Levin, 1968; Ehrenberg & Brewer, 1993; Hanushek, 1971). Studies of the National
Teacher Examination (Quirk, Witten, & Weinber, 1973) and other state-mandated tests of
basic skills and/or teaching skills showed less consistent results as teacher performance
predictors than did literacy or verbal skills (Ferguson, 1991).
Rivkin, Hanushek, and Kain (2005) used a value-added model to examine school
resource effects on achievement. Study results showed significant effects of class size on
both mathematics and reading achievement gains, but the effect declined as students
progressed through school. The effect became smaller and was less significant in reading
than in mathematics. They did not find evidence that having a master’s degree improved
teacher skills. Important gains in teaching quality appeared to take place in the first year
of teaching, and smaller gains occurred over the next few years. These researchers
concluded that schools and teachers play an important role in promoting equity and that

18
school policy can be a tool for raising achievement of low-income students. A
succession of good teachers could help close achievement gaps, but more must be known
about how to provide consistently high quality teachers. In addition, quality teachers
must be recruited, retained, and equally distributed throughout classrooms in order to
ensure that all children have an opportunity to learn; improved culture is one way to
ensure teacher retention and increased student achievement.
Culture, Climate and School Improvement
Deal and Peterson (1990) introduced five strategies for school improvement.
Culture and ethos was introduced as one of the strategies to improve educational
outcomes. According to the authors, improving schools consists of something in addition
to improving the skills of the staff, setting clearly defined goals, placing faculty in the
right roles. Certainly, these are important issues, but Deal and Peterson (1990) noted that
there was something else about a school that is critical to performance and improvement.
Schools have their own character or feel (Deal & Peterson, 1990) which can be felt
immediately upon entering a school. The authors argued that climate and ethos were
used to describe this feeling in a school. However, in their report, they call it culture.
School culture describes the character of a school “as it reflects deep patterns of
values, beliefs, and traditions that have been formed over the course of its history” (Deal
& Peterson, 1990 p. 7). Deal and Peterson (1990) explained that school culture is often
taken for granted although it underlies and gives meaning to the actions of members of
the school community. School culture is transmitted through symbolic language; it can
shape beliefs and behavior over time.

19
There are no universally accepted definitions of culture. Marion (2002) stated,
“culture is influenced by the totality of the organizational experience” (p. 227). Lumby
and Foskett (2011) defined the concept of culture as a tool to assist with the process of
making sense of people by providing a mechanism for categorizing, simplifying, and
describing the human state. Another definition was offered by Bolman & Deal (2008)
who stated, “Culture forms the superglue that bonds an organization, unites people, and
helps an enterprise accomplish desired ends.” Lumby and Foskett’s (2011) focused on
culture the perspective of an educational leader. They noted that the leader’s decisions
and actions have a direct impact on the school’s culture. The goal of school leadership
should be to positively influence culture for raising student achievement (Lumby &
Foskett, 2011). Bolman and Deal (2008) stated that leaders who understand the
significance of symbols and know how to evoke spirit and soul can shape more cohesive
and effective organizations. According to Bolman and Deal, “Culture anchors an
organization’s identity and sense of itself” (p. 278).
Climate is component of culture. Hoy and Miskel (2005) defined school climate
as “the set of internal characteristics that distinguish one school from another and
influence the behaviors of each school’s members” (p. 185). Bradshaw, Waasdorp,
Debnam, and Johnson (2014) referred to school climate as “shared beliefs, values, and
attitudes that shape interactions between students, teachers, and administrators and set the
parameters of acceptable behavior and norms for the school. School climate is a product
of teacher and student social interactions, and is influenced by educational and social
values” (p. 594). Using this definition, Bradshaw et al. (2014) drew conclusions from

20
the results of a survey of over 25,000 high school students. The authors analyzed results
from the Maryland Safe and Supportive School Climate Survey and found that a positive
school climate can show productive conditions for learning, which predict positive
outcomes for student achievement (Bradshaw et al., 2014).
Collie, Shapka and Perry (2011) found that school climate was a significant
predictor of a teacher’s commitment to stay. Their research used a survey design that
included variables measuring School Climate and Social-Emotional Learning (SEL).
Included in the School Climate variable were the sub variables of collaboration, student
relations, school resources, decision making, and instructional innovation. Included in
the Social-Emotional Learning variable were SEL Comfort, SEL Commitment, SEL
Culture, and SEL Integration. Using binary logic regression, Collie et al. (2011)
concluded that a positive school climate, one that includes good student relations, greater
collaboration among teachers and input on decision making, resulted in greater teacher
commitment. According to the authors, “Teachers who feel greater well being in their
teaching may have greater commitment to the profession” (Collie et al., 2011, p. 1045).
Prather-Jones (2011) found three emergent themes from teacher interviews
regarding administrative support in conjunction to their career decisions. The first theme
was teachers looking to administrators for support when delivering consequences on
student misconduct. The second theme was that teachers felt more supported when
administrators showed respect and appreciated their efforts in the classroom. The third
theme was that teachers looked to administrators to help develop supportive relationships
from other teachers that can assist with classroom needs. These three themes that
21
Prather-Jones (2011) reported from her research were aspects of culture and climate that
could be attributed to actions taken by the administrator.
Retention Behaviors/Variables
Gruenert and Valentine (1998) indentified six variables that are related to
retention from the survey that was used in this study. They include:
Collaborative Leadership: the degree to which school leaders establish and
maintain collaborative relationships with school staff.
Arbabi and Mehdinezhad (2015) defined collaborative leadership as “the
participation of employees in different levels in the organization to identify problems,
analyze solutions and achieve solutions, so they can assist their managers and
headquarters in solving problems” (p. 126). This style of leadership aids in promoting
and developing organizations. Arbabi and Mehdinezhad (2015) were able to prove a
statistically significant positive correlation between a principal’s collaborative leadership
style and a teacher’s self-efficacy. Their research made use of the Tschannen-Moran &
Woolfolk self-efficacy questionnaire and the Washington University Turning Point
Collaborative Leadership Questionnaire. The direction of the correlation was positive
and direct.
Collaborative leadership has been shown to have other positive effects on schools
other than teachers’ self-efficacy. Heck and Hallinger (2010) concluded that
collaborative leadership was an initial driver in school improvement. In their study, Heck
and Hallinger (2010) found that collaborative leadership had a direct impact on school
achievement. It makes sense that Valentine and Gruenert’s School Culture Survey

22
(1998) included the most questions relating to collaborative leadership in relation to a
positive school culture.
Teacher Collaboration: the degree to which teachers engage in constructive
dialog that furthers the educational vision of the school.
Poulos, Culberston, Piazza, and D’Entremont (2014) said “teachers universally
point to the impact of teacher collaboration on student learning by improving classroom
practice, promoting data use, increasing academic rigor, and supporting students’ non-
academic needs” (p. 31). This statement summarizes the value of teacher collaboration on
a school’s culture for improvement. Their findings “highlight the value of establishing
school-wide structures and collaborative cultural norms to school leaders and teachers
committed to working together” (p. 31).
Professional Development: the degree to which teacher’s value continuous
personal development and school-wide improvement.
Main, Pendergast, and Virture (2015) stated that for continuous professional
development to be effective and for transformative learning to take place, participants
must understand the topic in terms of what to do, how it works, and why it is important.
They concluded that continuous professional development that increases teacher
effectiveness and improves pedagogical practices has a strong connection to teachers’
self-efficacy.
Main, Pendergast and Virture (2015) showed why continuous professional
development is important. Goodwin’s (2015) research explained how to make
professional development effective. He stated “effective PD requires follow-up support
23
focused not on adoption but rather on adaption—helping teachers apply better practices
with their own students instead of bird-dogging program implementation” (p. 83).
Goodwin concluded by saying the elements of professional development that are
employed by a leader need to be cohesive in the areas of need of the school and faculty.
Unity of Purpose: the degree to which teachers work toward a common mission
for the school. “Teachers who are more committed to the values of an organization and to
its members are more likely to adopt instructional practices recommended by the
organization, assist colleagues, and work harder to achieve organizational goals” (Ross
& Gray, 2006, p. 802).
The way that Freed (2014) defined a shared purpose is insightful. She stated: “a
well-functioning school is one in which the school leadership—especially the head of the
school—is able to manage the complex network of people focused on a shared mission—
whatever it may be” (p. 105). Freed’s study and organizational analysis emphasized the
importance of the shared purpose to “create more empathy and build connection among
adults in school community, but also to recognize where systemic issues need to be
addressed in order to inform long-lasting personal and organizational change and growth”
(p. 105). In summary, effective leaders articulate a shared purpose; that purpose needs to
be well defined. According to Freed (2014), “Everyone is accountable to the big
picture—the mission—and everyone needs leadership’s ongoing support to serve the
mission in his or her designated way” (p. 106). In order for the unity of purpose to be
successful, leadership needs to clearly define what the team is, who the team members
are, what their roles are, and most importantly what they are all working toward.
24
Collegial Support: the degree to which teachers work together effectively.
LaPlant (1986) and Paquette (1987) both researched the impact of collegial
support among teachers. Their research found that teachers that work and plan together,
as well as celebrate their accomplishments seem to have a positive impact on their overall
view of the culture of the school. By working and planning together, teachers built
relationships; this led to a benefit for the students and the schools.
Learning Partnership: the degree to which teachers, parents, and the students
work together for the common good of the student.
An important component of establishing learning partnerships is to help students
understand how academics relate to them, who they are, and what the world means to
them. Teachers need to show how lessons are relatable but it is on the student to make
the material personal (Blodget, 2016). “This is how they become productive, moral
citizens of the world” (Blodget, 2016, p. 72).
Vantine (2016) provided an example of learning partnerships by describing an all
girls’ school in Massachusetts serving grades 5-12 who shifted to a school-wide
collaborative academic support paradigm. The three elements of this model were: “(1)
giving teachers agency of academic support process, (2) changing the language we use to
communicate about students’ struggles, and most importantly, (3) giving our students
voice to write their own learning narratives” (Vantine, 2016, p. 102). This gives the
students the ability to develop self-awareness, self-advocacy, and self-efficacy (Vantine,
2016). In summary the learning partnerships is important for the students to develop
meaning for their educational process.

25
Leadership and Culture
“The single greatest advantage any company can achieve is organizational health.
Yet it is ignored by most leaders even though it is simple, free, and available to anyone
who wants it” (Lencioni, 2012, p. 1). Leadership is the direct link to teacher retention and
school culture. Leithwood and Beatty (2008) created a flow chart (Figure 2.1) that linked
leadership to the teachers’ emotional state within each school. Their diagram showed that
school working conditions and classroom working conditions fall under the umbrella of
leadership. Teachers’ thoughts and feelings develop based on working conditions. Next,
teachers’ school wide practices, teachers’ classroom practices and teachers’ engagement
in the profession all lead to the end goal of student success. “The efforts or behaviors of
those providing leadership are among the most powerful direct sources or influences on
teachers’ working conditions and both direct and indirect sources of influence on teacher
emotions” (Leithwood & Beatty, 2008, p. 11). The authors further stated that the
teachers’ perception of leadership determined their commitment. As a result, the
teachers’ school and classroom practices improved and ultimately improved student
achievement.

26
Figure 2.1: Leithwood’s model of leadership to student learning. (www.tcdsb.org)
With regard to leadership, Ingersoll (2007) noted that “Schools in which teachers
have more control over key school wide and classroom decisions have fewer student
misbehavior, show more collegiality and cooperation among teachers and administrators,
have a more committed and engaged teaching staff, and do a better job of retaining their
teachers” (p. 24). This is consistent with the way that Gruenert and Valentine (1998)
defined collaborative leadership. Collaborative leadership was a variable measured in the
survey that was used in this study.
A principal must accomplish five main tasks: provide the school community with
a vision of academic success for students; create a climate that is safe, welcoming,
cooperative, and that places student success as its top priority; develop the staff around
them by distributing their leadership and thus creating buy-in; provide instructional

27
leadership in the form of direct coaching of teachers by instituting systems that facilitate
improving teachers’ instructional practice; and set up systems and processes to collect
and analyze data in order to drive school improvement (Mendels, 2012). Leithwood and
Beatty (2008) noted that a teacher’s perception of leadership and climate are factors that
are directly correlated to their commitment. The paradox is that a leader can think they
are doing everything according to plan and everything is fluid, however, the teachers’
needs are not being met and their perception of the leadership declines. By becoming
more involved in the school and acting in a manner that sends positive signals to students
and teachers, a principal can aide poorly performing individuals, teachers and students,
by helping them believe that they can achieve more (Ware & Kitstantas, 2011, and Sahin,
2011).
Leadership is not a one size fits all when hiring. Ware and Kistantas (2011) warn
superintendents and school boards to be aware of the best interest of the students as well
as the school and to match the efficacy beliefs of the existing staff when placing new
leaders in school. “A mismatch could lead to departures of existing staff” (p. 191) and
have a great influence on the culture and climate of a school. This can be directly
correlated to the retention of teachers that are considering leaving.
Leadership styles and their impact on culture
Research supports three leadership styles as being correlated to school culture:
distributive leadership, instructional leadership and transformational leadership.

28
Distributive Leadership
What leadership styles best support productive school cultures and teacher
retention? Fusarelli, Kowalski, and Petersen (2011) suggested that distributive leadership
can play a key role in school improvement. Distributive leadership diffuses leadership
throughout the whole organization thus making the school or organization less dependent
on individual leaders. This type of leadership can be more stable and lead to less attrition
because the overall operations are not tied to an individual. Even when the leader leaves
the school, leadership stays intact through the various networks (Fusarelli et al., 2011).
A study done by Hulpia, Devos and Van Keer (2010) suggested that distributive
leadership contributes to organizational commitment. Hulpia et al. (2010) developed a
Distributed Leadership Inventory that was used with another organizational commitment
questionnaire to collect data for the dependent variable in their study. Their research
design employed a hierarchical multileveled approach with teachers in level-1 and school
level data in level-2. This design recognized the fact that teachers are nested within
schools. A similar design is used in this study. Hulpia et. al (2010) concluded that the
formal distribution of supportive leadership among the leadership team had a positive
impact on teachers’ commitment at the school level. Teachers who believe believe
support is equally distributed among the leadership team will have a higher
organizational commitment than teachers who believe that support is provided by one
person on the leadership team (Hulpia et al., 2010).
In describing democratic public education, Maxcy (1995) articulated several
elements of the concept. Among them were the worth and importance of individuals,
29
participation in decision making, and that individuals, working together within
communities of learning, are capable of engaging in strategic planning and problem
solving. Distributive leadership helps “create democratic learning communities in which
power is shared and there is a mutual belief in working together for the common good”
(Kochan & Reed, 2005, p. 72). These findings from Maxcy (1995), Kochan and Reed
(2005) echo the findings of Tschannen-Moran and Barr (2004) who concluded that
shared responsibilities in school decisions can lead to better teacher self efficacy.
Instructional Leadership
Instructional leadership has a statistically significant influence upon all factors of
school culture (Sahin, 2011). The study conducted by Sahin (2011) was a likert-type
questionnaire distributed to teachers with the following variables: Length of Service,
Teaching Level, Academic Achievement, Gender and Socio-Economic Statues. The
researchers used SPSS to calculate the arithmetic means and standard deviations on each
variable. Analysis of variance (one-way ANOVA) and t-test were used to draw
inferences about differences between group means. Sahin (2011) concluded by stating
“there is positive relationship between instructional leadership and all the dimensions of
school culture” (p. 1924).
Transformational Leadership
Conversely, the results of a study done by Ross and Gray (2006) found that
transformational leadership had no direct effect on student achievement. Instead, they
found that transformational leadership is related to Collective Teacher Efficacy,
Commitment to School Mission, Commitment to Professional Community, and
30
Commitment to Community Partnerships. The Collective Teacher Efficacy was
simplified to three commitment variables. The three commitment variables were found
to be predictors of student achievement in grades 3 to 6. The model was used to
demonstrate that teacher commitment is a predictor of student achievement. Thus,
transformational leadership indirectly effects achievement according to Rodd and Gray’s
(2006) study. However, it is because of the influence of transformational leadership that
student achievement was improved.
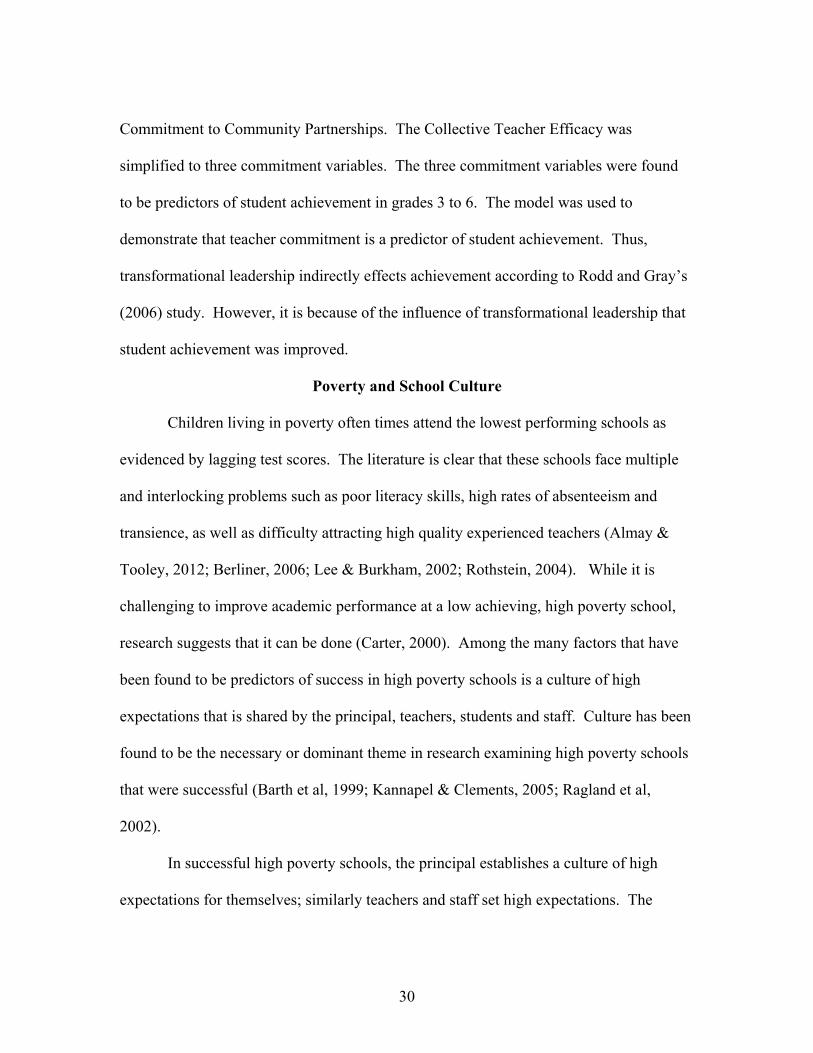
Poverty and School Culture
Children living in poverty often times attend the lowest performing schools as
evidenced by lagging test scores. The literature is clear that these schools face multiple
and interlocking problems such as poor literacy skills, high rates of absenteeism and
transience, as well as difficulty attracting high quality experienced teachers (Almay &
Tooley, 2012; Berliner, 2006; Lee & Burkham, 2002; Rothstein, 2004). While it is
challenging to improve academic performance at a low achieving, high poverty school,
research suggests that it can be done (Carter, 2000). Among the many factors that have
been found to be predictors of success in high poverty schools is a culture of high
expectations that is shared by the principal, teachers, students and staff. Culture has been
found to be the necessary or dominant theme in research examining high poverty schools
that were successful (Barth et al, 1999; Kannapel & Clements, 2005; Ragland et al,
2002).
In successful high poverty schools, the principal establishes a culture of high
expectations for themselves; similarly teachers and staff set high expectations. The

31
process of continual learning is modeled (Kannapel & Clements, 2005). Furthermore, the
leader sets measurable goals and communicates their expectations in tangible ways
(Carter, 2000; Kannapel & Clements, 2005; Ragland et al, 2002). This culture of
expectations in turn creates unity of purpose (Jesse et al, 2004). Lastly, the culture of
high expectations is found in a caring and nurturing environment where adults and
children treat one another with respect (Kannapel & Clements, 2005).
Sheehan and Rall (2011) said that students from poverty feel that they can’t
achieve because they think that education will not release them from poverty. They
studied the De La Salle School, a Catholic school in Freeport, NY. This school has a
small enrollment (65) and only has male students of color. The focus at De La Salle
School is hope. There is a correlation that goes both ways between hope and emotional
and behavioral engagement, and hope and achievement. Educators there use strategies
centered on hope to give the students the skills and mental strength to become “hopeful
students.” The head of school and teachers have all bought into the positive social-
emotional climate, and the school is producing students that have better self-awareness,
self management, social awareness, and relationship management (Sheehan & Rall,
2011). Poverty isn’t a controllable condition, but leadership and school culture both can
be manipulated.
Summary
This chapter provided a review of relevant literature. The chapter began with a
summary of the current pressures facing educational leaders to increase student
achievement. A different leadership paradigm for schools in an era of standards based

32
education was explored. The teacher was found to be the most important school level
resource that can impact student achievement. As such, educational leaders must make
every attempt to recruit and retain quality teachers in schools. Culture was introduced as
a strategy for school improvement and studies linking leadership to culture were
synthesized. An indirect effect of teacher retention and student achievement was
explored in the literature. The chapter concluded with a brief review of school culture in
high poverty schools.

33
CHAPTER THREE
METHODS
Introduction
This chapter will outline the method used in this study. The purpose of this study
was to examine the predictive capacity of leadership on school culture. The goal was to
show that effective leadership is a strategy for creating and maintaining a positive school
culture. This could possibly lead to teachers staying at a particular school and could lead
to an increase in student achievement. The research question proposed in the study was:
does school leadership predict school culture?
Method
This study used Hierarchical Linear Modeling (HLM) method and stepwise
multiple regression to test the research question: does school leadership predict school
culture? This question was analyzed by using the six variables defined from the School
Culture Survey: collaborative leadership, teacher collaboration, professional
development, unity of purpose, collegial support, and learning partnership. Poverty
index, test scores, and retention percentages for each of the schools were used in the
model as well as covariates. Data were acquired from the yearly school report card made
available from the South Carolina Department of Education (www.ed.sc.gov). HLM is a
popular statistical method across many domains of social sciences, especially in
education settings (Woltman, Feldstain, MacKay, & Rocchi, 2012). HLM applies when
the observations in a study form groups and when those groups are in some way
randomly selected (Raudenbush & Bryk, 2002).

34
Hierarchical Linear Modeling is a complex form of ordinary least squares
regression that is used to analyze variance in the outcome variables when the predictor
variables are at varying hierarchical levels. For example, the variables used in the survey
would all be teacher level variables in the model and the test scores, poverty index and
retention percentages would be school level predictor variables. HLM accounts for the
shared variance in hierarchically structured data. The technique accurately estimates
lower-level slopes and their implementation in estimating higher-level outcomes
(Hofmann, 1997). In this study, the lower-level would be teacher level responses from
the survey on school culture and the higher-level would be the school level data from the
school report card.
“HLM takes into consideration the impact of factors at their respective levels on
an outcome of interest. It is the favored technique for analyzing hierarchical data because
it shares the advantages of disaggregation and aggregation without introducing the same
disadvantages” (Woltman, et al., 2012, p. 55-56). HLM is great for analyzing nested data
because it shows the relationship between the predictor and outcome variables by taking
both level-1 and level-2 regression relationships into account.
A disadvantage of HLM is that it in order to have adequate power, a large sample
is required. This is normally true when detecting the effects at level-1. Higher-level
effects are more sensitive to increases in groups than to increases in observations per
group. HLM can handle missing data at level-1 and removes groups with missing data at
level-2 or above. For these reasons, it is advantageous to increase the number of groups
as opposed to the number of observations per group. For example, a study with thirty

35
groups with thirty observations giving an n=900, can have the same power as one
hundred fifty groups with five observations each giving an n=750 (Hofman, 1997).
Research Hypothesis
This research question was considered when developing the research hypothesis:
does school leadership as defined as Collaborative Leadership and Unity of Purpose
predict school culture as defined as Teacher Collaboration, Professional Development,
Collegial Support and Learning Partnerships? The study included two independent
variables measuring leadership (Collaborative Leadership and Unity of Purpose) and four
dependent variables measuring school culture (Teacher Collaboration, Professional
Development, Collegial Support and Learning Partnerships). I hypothesize that school
leadership as defined as Collaborative Leadership and Unity of Purpose will predict
culture as defined as Teacher Collaboration, Professional Development, Collegial
Support and Learning Partnerships. The questions used to compose the dependent and
independent variable were from Gruenert and Valentine’s (1998) School Culture Survey
are displayed in Table 3.1.
Table 3.1. Survey questions grouping by variable
Dependent Variables Culture
Teacher Collaboration
• Teachers have opportunities for dialog and planning across grades and subjects
• Teachers spend considerable time planning together
• Teachers take time to observe each other teaching
• Teachers are generally aware of what other teachers are teaching
• Teachers work together to develop and evaluate programs and projects
• Teaching practice disagreements are voiced

36
openly and discussed
Professional Development
• Teachers utilize professional networks to obtain information and resources for classroom instruction
• Teachers regularly seek ideas from seminars, colleagues and conferences
• Professional development is valued by the faculty
• Teachers maintain a current knowledge base about the learning process
• The faculty values school improvement
Collegial Support
• Teachers trust each other • Teachers are willing to help out whenever there
is a problem • Teachers’ ideas are valued by other teachers • Teachers work cooperatively in groups
Learning Partnerships
• Teachers and parents have common expectations for student performance
• Parents trust teachers’ professional judgments • Teachers and parents communicate frequently
about student performance • Students generally accept responsibility for their
schooling, for example they engage mentally in class and complete homework assignments
Independent Variables Leadership
Collaborative Leadership
• Leaders value teachers’ ideas • Leaders in this school trust the professional
judgments of teachers • Leaders take time to praise teachers that perform
well • Teachers are involved in the decision-making
process • Leaders in our school facilitate teachers working
together • Teachers are kept informed on current issues in
the school • My involvement in policy or decision making is
taken seriously • Teachers are rewarded for experimenting with
new ideas and techniques • Leaders support risk-taking and innovation in
teaching • Administrators protect instruction and planning

37
time • Teachers are encouraged to share ideas
Unity of Purpose
• Teachers support the mission of the school • The school mission provides a clear sense of
direction for teachers • Teachers understand the mission of the school • The school mission statement reflects the values
of the community • Teaching performance reflects the mission of the
school
Data Collection and Sample
The study was conducted using a 35 item Likert-scale School Culture Survey
developed by Gruenert and Valentine (1998) analyzing school culture from six variables;
Collaborative Leadership (11 items), Teacher Collaboration (6 items), Professional
Development (5 items), Unity of Purpose (5 items), Collegial Support (4 items) and
Learning Partnerships (4 items). Reliability coefficients for the Gruenert and
Valentine’s (1998) School Culture Survey appear in Table 3.2.
Table 3.2. Cronbach’s Alpha factor reliability for School Culture Survey variables
Collaborative Leadership: 0.91 Teacher Collaboration: 0.83 Professional Development: 0.82 Unity of Purpose: 0.87 Collegial Support: 0.80 Learning Partnerships: 0.66
The Cronbach’s Alpha factor reliability coefficient is a measure of internal
consistency. It comprises a number of items that make up a scale designed to measure a
single construct, and it determines the degree to which all the items being measured are
38
of the same construct. Strong reliability using the Cronbach’s Alpha are values that are
close to 1.0, weaker ones are closer to 0.0 (Cronk, 2010). The values for the items within
each variable in the survey are close to 1.0, showing a strong reliability.
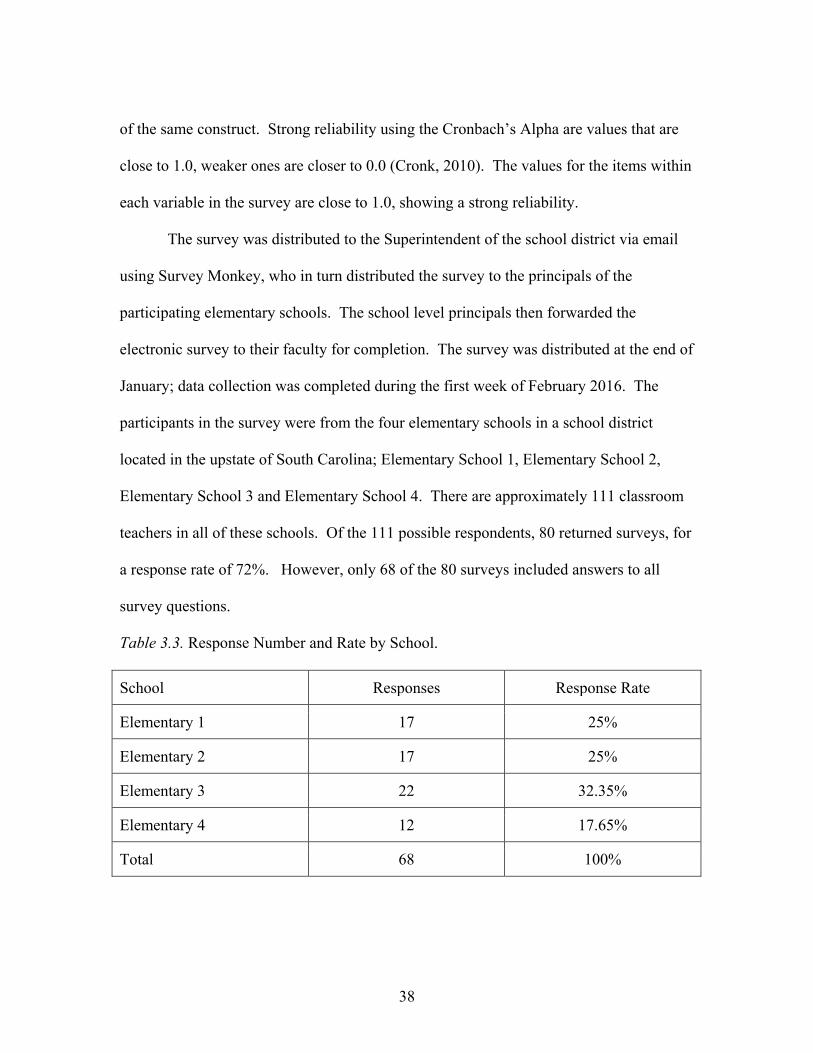
The survey was distributed to the Superintendent of the school district via email
using Survey Monkey, who in turn distributed the survey to the principals of the
participating elementary schools. The school level principals then forwarded the
electronic survey to their faculty for completion. The survey was distributed at the end of
January; data collection was completed during the first week of February 2016. The
participants in the survey were from the four elementary schools in a school district
located in the upstate of South Carolina; Elementary School 1, Elementary School 2,
Elementary School 3 and Elementary School 4. There are approximately 111 classroom
teachers in all of these schools. Of the 111 possible respondents, 80 returned surveys, for
a response rate of 72%. However, only 68 of the 80 surveys included answers to all
survey questions.
Table 3.3. Response Number and Rate by School.
School Responses Response Rate
Elementary 1 17 25%
Elementary 2 17 25%
Elementary 3 22 32.35%
Elementary 4 12 17.65%
Total 68 100%

39
The scores were downloaded from Survey Monkey into a Microsoft Excel
spreadsheet. Afterwards, the spreadsheet was cleaned up by deleting unnecessary
columns and rows. Next, the elementary schools were coded into numbers to maintain
anonymity. Next, columns were added for the following data that was retrieved from
each school report card: Teachers’ Retention Percentage, Poverty Index, ACT Aspire
English, ACT Aspire, Reading, ACT Aspire Mathematics, and ACT Aspire Writing
scores. For the ACT Aspire subject scores, the levels of “exceeding” and “ready” were
combined to create one score.
The demographics of each school are shown in Table 3.4. A brief description of
each school follows.
Table 3.4. School report card characteristics by school.
School Retention Percentage
ACT English
ACT Writing
ACT Reading
ACT Math
Poverty Index
Elementary 1 75.7 64.4 29.9 29.4 42.4 81.3
Elementary 2 87.8 82 27.1 40.6 60.4 64.3
Elementary 3 75.9 76.3 23.2 40 56.5 52.1
Elementary 4 96.5 78.3 37.3 45 57.3 76.2
Elementary School 1 consists of 418 students in grades Pre-Kindergarten to Sixth
Grade and is the most urban of the four schools. All four schools are still considered in a
rural school district. Elementary School 1 has a first-year principal. The new principal
was employed at the school during data collection. Because state accountability scores

40
lag one year, the current principal was not the leader of the school during testing that
appears on the current school report card. The previous principal had been at the school
for a total of 3 years. This school offers a Montessori program for its students. The
percentage of teachers with advanced degrees is 53.1. Due to changes in how schools are
rated in South Carolina, the most recent ratings for schools are from 2014. In 2014
Elementary School 1 received an Average Absolute Rating and an At-Risk Growth
rating. Schools will be given new ratings beginning in 2017.
Elementary School 2 serves 421 students in grades Pre-Kindergarten to sixth
grade. This school incorporates the Focus 5 areas of arts integration: music, writing,
drama, art, and dance. The principal at this school has been in place for 8.5 years. The
percentage of teachers with advanced degrees is 72.4. The 2014 state report card ratings
show that Elementary School 2 had an Absolute Rating of Excellent and a Growth Rating
of Below Average.
Elementary School 3 serves the most students in the study with 490 and it is the
newest of the buildings in the district. It serves grades Pre-Kindergarten to Sixth Grade;
this is the principal’s second year there. Previously, the principal had retired and was
there from its opening of the school. Elementary School 3 is the home for STEM
(Science, Technology, Engineering, and Math) instruction. This is the first elementary
school in the country to receive STEM certification from AdvancED. The percentage of
teachers in this school with advanced degrees is 46.7 and the school has the lowest
average teacher salary. This correlates to a relatively young teaching staff. The 2014

41
state report card ratings for Elementary School 3 are Good for Absolute Rating and At-
Risk for Growth Rating.
Elementary School 4 is the most rural of the four schools and it is the smallest
school in the study. Currently, Elementary School 4 serves 286 students in grades Pre-
Kindergarten to Sixth Grade. This school utilizes The Leader In Me as a school-wide
philosophy, which emphasizes a culture of student empowerment and helps each student
to reach their full potential. The principal has been at this school for 12 years. This
school has the longest serving administrator in the school district as well as the highest
teacher retention percentage of the district. The percentage of teachers with advanced
degrees is 80; this school also has the highest average teacher salary in the study. The
2014 state report card gives Elementary School 4 an Absolute Rating of Excellent and a
Growth Rating of Good.
One last contextual factor that could have an impact on all four schools is that the
district leadership experienced turnover as well. The Superintendent retired and a new
one was appointed by the district’s Board of Education in 2015. In a district this small
with six total schools, a change at the district level can easily be felt in the schools. The
district and school leadership operate closely, thus the beliefs and values at the central
office level easily trickle down to each school.
After the data were cleaned in Excel, the statistical analysis was performed using
JPM software. Once the data was imported to JMP an imputation was run to fill in the
missing survey scores. This allowed the researcher to increase the number of survey

42
responses. The imputation is a way to take available information for complete and
incomplete data points to predict the value of a specific missing data point.
The first step in the data analysis was to run a principal component analysis.
Principal component analysis is used for extracting factors in factor analysis. The
original variables are transformed into a new set of linear combinations by extracting the
maximum variance for the data set with each component (Mertler & Vannatta, 2010). An
easy way to think about PCA is that it is an exploratory data analysis used to identify the
possible numbers of factors. A PCA was run for all of the questions in the dependent and
independent variables from the survey. The questions were entered according to their
specific groups, DV or IV identifiers.
Once the PCA was run the Eigen value and Bartlett’s test were examined to
determine the number of existing factors. The Eigen value is the amount of total variance
explained by each factor (Mertler & Vannatta, 2010). All factors over 1 were taken into
consideration. The Bartlett’s test is a procedure that tests the null hypothesis that the
variables in the population correlation matrix are uncorrelated and used for factor
analysis with small samples (Mertler & Vannatta, 2010). To further reduce the number
of factors identified by the PCA, the next step was to examine the scree plot. The scree
plot is a graph of the magnitude of each Eigen value placed on the vertical axis and
plotted against their ordinal numbers on the horizontal axis (Mertler & Vannatta, 2010).
Three factors were observed based from the curve of the plot.
Upon completion of the exploratory analysis of the data, a factor analysis was run.
A factor analysis is a mathematical model that results in the estimation of factors in

43
contrast with the principal component analysis (Mertler & Vannatta, 2010). When
running the factor analysis, three factors were used to determine the results. From this
point three new factors were determined and renamed. These three factors were still
represented in the culture dependent variable.
A factor analysis was also run on the leadership independent variables of
collaborative leadership and unity of purpose. The results were rotated same as the
dependent variable results. The factor analysis confirmed the two factors of collaborative
leadership and unity of purpose.
The factor analysis was used to identify the dependent and independent variables
for use in testing the research hypothesis. The chosen methodology was hierarchical liner
modeling. The HLM was run using teacher level variables as level 1 (the culture
variables as the dependent variable and the leadership variables as the independent
variables) and school level variables as level 2 (demographics, student performance).
Because the results from the HLM suggested that all variance was explained at the
teacher level, this method was abandoned in favor of using a stepwise multiple
regression. The fact that all variance was explained at the teacher level suggested that the
data were not nested and that there were not differences across the schools. As such, a
more appropriate method to test the research hypothesis was required.
Next a stepwise multiple regression was run to determine the predictive nature of
leadership on culture using the factors identified in the factor analysis. A stepwise
multiple regression allows the ability to determine which specific independent variables
make a meaningful contribution to the prediction of the dependent variable. A multiple

44
regression identifies the best combination of predictors (independent variables) of the
dependent variable. It is used when there are several independent quantitative variables
and one dependent variable (Mertler & Vannatta, 2010). The stepwise multiple
regression was run three times, once for each of the newly created dependent variables
from the factor analysis (Culture of Collegiality, Culture of Learning Partnerships and
Culture of School Improvement).
Summary
This chapter introduced the research question and the research hypothesis that
was tested in the present study. A detailed explanation of the method, research variables,
data collection and sample were provided for this study. In addition, the methodology and
data analysis procedures were explained and supported with literature. The results of the
analysis will be presented in chapter four.

45
CHAPTER FOUR
RESULTS
Introduction
This chapter will present the results of the study. The purpose of this study was
to examine the predictive capacity of leadership on school culture by using hierarchical
linear modeling and multiple regression. The research question posed in the study was:
does school leadership predict school culture? The data was collected using Gruenert and
Valentine’s (1998) School Culture Survey (see Appendix A). The data from the survey
was then downloaded into Microsoft Excel and then transferred into JMP. Once it was in
JMP all of the analyses were run.
Data Collection and Processing
The School Culture Survey (Gruenert & Valentine, 1998) was distributed to the
instructional staff of four elementary schools in a school district in the upstate region of
South Carolina. The survey was distributed to a total of 111 teachers; 80 responses were
collected for a response rate of 72%. Although 80 individuals submitted a survey, 12 of
the surveys had no data or had missing data. That left 68 complete responses that were
available to be used for the data analysis. Using data imputation, some of the missing
responses were able to be recovered. Imputation is a way to take available information
for complete and incomplete data points to predict the value of specific missing data
points by estimating the value based on available information. The use of imputation
increased the total number of complete surveys to 73. The remaining seven surveys were

46
discarded. This left an adjusted usable response rate of: 65.8%. The updated response
table is below:
Table 4.1. Adjusted responses and rate after imputation.
School Responses from school Percentages from school
Elementary 1 21 28.77%
Elementary 2 18 24.66%
Elementary 3 22 30.13%
Elementary 4 12 16.44%
Total 73 100%
Data Analysis – Independent Variables
A principal component analysis was run on both sets of questions for the
independent (leadership) and dependent (culture) variables. First the PCA was run for
the independent variables. According to the results from the PCA, there was no
difference in the factors identified by Gruenert and Valentine’s (1998) School Culture
Survey so data analysis moved directly to the use of the factor analysis. The factor
analysis for the independent variable question set confirmed the groupings of the two
variables of Collaborative Leadership and Unity of Purpose. A factor analysis is a
mathematical model created resulting in the estimation of factors in contrast with the
principal component analysis (Mertler & Vannatta, 2010). As seen in the table, the value
in each factor that is bolded carries the weight of significance. The questions are bolded
within each factor according to participant responses. The factor loadings represent how

47
questions were related to one another according to participant responses. Factors scoring
0.4 and greater were considered significant for a factor score. As previously stated the
independent variables were grouped as predicted. The rotated factor analysis is shown in
Table 4.2.
Table 4.2. Factor Analysis of the Leadership and Unity of Purpose variables
Factor 1
Factor 2
Leaders value teachers’ ideas 0.47 0.26
Leaders in this school trust the professional judgements of teachers 0.75 0.37
Leaders take time to praise teachers that perform well 0.44 0.21
Teachers are involved in the decision-making process 0.64 0.24
Leaders in our school facilitate teachers working together 0.53 0.32
Teachers are kept informed on current issues in the school 0.42 0.39
My involvement in policy or decision making is taken seriously 0.55 0.31
Teachers are rewarded for experimenting with new ideas and techniques
0.62 0.18
Leaders support risk-taking and innovation in teaching 0.72 0.38
Administrators protect instruction and planning time 0.48 0.28
Teachers are encouraged to share ideas 0.78 0.18
Teachers support the mission of the school 0.30 0.59
The school mission provides a clear sense of direction for teachers 0.39 0.60
Teachers understand the mission of the school 0.27 0.66
The school mission statement reflects the values of the community 0.39 0.63
Teaching performance reflects the mission of the school 0.16 0.86

48
The first 11 questions of the School Culture Survey were all originally contained
in the Collaborative Leadership section of the survey. The last 5 questions of the School
Culture Survey were all contained in the Unity of Purpose section of the survey. The
factor analysis confirmed that the questions should be grouped together as designed by
Gruenert and Valentine (1998). Collaborative Leadership scored the highest (0.91) in the
Cronbach’s Alpha factor reliability coefficient measured from Gruenert and Valentine
(1998). Unity of Purpose scored the third highest (0.82) in the Cronbach’s Alpha factor
reliability coefficient. The Cronbach’s Alpha factor reliability coefficient is a measure
of consistency. Strong reliability consists of measurements that are close to 1.0, weaker
ones are closer to 0.0 (Cronk, 2010).
Data Analysis – Dependent Variables
After completing the data analysis for the independent variables, the same process
was used to examine the dependent variables. A Principal Component Analysis was
conducted using the 19 questions that originally composed the dependent variables
measuring culture included: teacher collaboration, professional development, collegial
support, and learning partnerships. Initially, the Principal Component Analysis identified
more than four dependent variables. To reduce the number of factors, the Eigen values
and Bartlett’s test were calculated. The Eigen value is the amount of total variance
explained by each factor (Mertler & Vannatta, 2010). The Eigen value was calculated for
all 19 questions; a score greater than 1 was used as a cutoff to identify different factors.
Based on the results from the Eigen values, 7 factors were found to have scores greater
than 1. In order to reduce that number, a Bartlett’s test was conducted. The Bartlett’s

49
test is a procedure that tests the null hypothesis that the variables in the population
correlation matrix are uncorrelated and used for factor analysis with small samples
(Mertler & Vannatta, 2010). The Bartlett’s test narrowed the field to three scores based
off the Prob>ChiSq reading. Prob>ChiSq is the probability of obtaining a greater Chi-
square value by chance alone if the specified model fits no better than the model that
includes only intercepts. The Eigen values and Bartlett’s test are shown in Figure 4.1.
Figure 4.1: Eigenvalues and Bartlett’s Test for dependent variables.
The next step was to view the scree plot. The scree plot is a graph of the
magnitude of each Eigen value placed on the vertical axis and plotted against their
ordinal numbers on the horizontal axis (Mertler & Vannatta, 2010). The target of the
observation of the scree plot was to see a slope from vertical to horizontal. There were
three observable breaks in the scree plot. The scree plot is shown in Figure 4.2.

50
Figure 4.2: Scree Plot of dependent variables after factor analysis
Results from the scree plot confirmed the decision to run three factors for the
factor analysis of the dependent variables. A factor analysis is a mathematical model
created resulting in the estimation of factors in contrast with the principal component
analysis (Mertler & Vannatta, 2010). Results that are bolded describe the weight of
significance and were used to regroup the variables according to participant responses. In
the dependent variable factor analysis the respondents grouped the questions in different
clusters than the authors of the survey. Factors scoring 0.35 and greater were considered
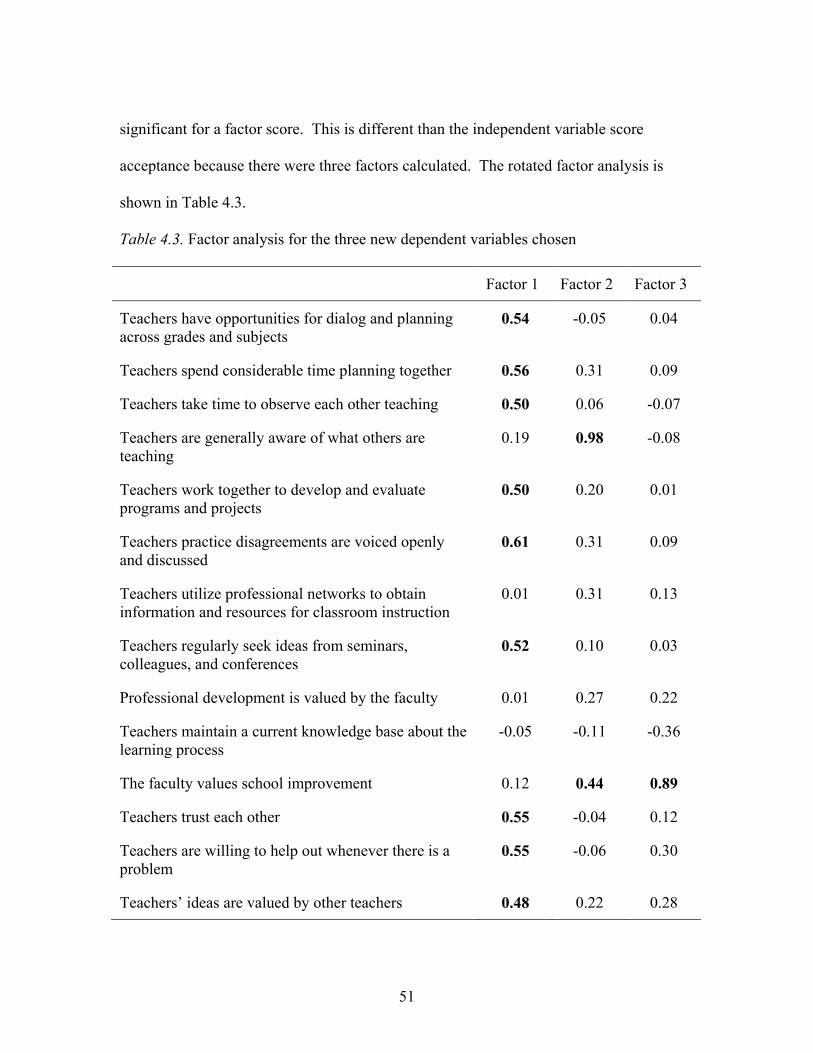
51
significant for a factor score. This is different than the independent variable score
acceptance because there were three factors calculated. The rotated factor analysis is
shown in Table 4.3.
Table 4.3. Factor analysis for the three new dependent variables chosen
Factor 1 Factor 2 Factor 3
Teachers have opportunities for dialog and planning across grades and subjects
0.54 -0.05 0.04
Teachers spend considerable time planning together 0.56 0.31 0.09
Teachers take time to observe each other teaching 0.50 0.06 -0.07
Teachers are generally aware of what others are teaching
0.19 0.98 -0.08
Teachers work together to develop and evaluate programs and projects
0.50 0.20 0.01
Teachers practice disagreements are voiced openly and discussed
0.61 0.31 0.09
Teachers utilize professional networks to obtain information and resources for classroom instruction
0.01 0.31 0.13
Teachers regularly seek ideas from seminars, colleagues, and conferences
0.52 0.10 0.03
Professional development is valued by the faculty 0.01 0.27 0.22
Teachers maintain a current knowledge base about the learning process
-0.05 -0.11 -0.36
The faculty values school improvement 0.12 0.44 0.89
Teachers trust each other 0.55 -0.04 0.12
Teachers are willing to help out whenever there is a problem
0.55 -0.06 0.30
Teachers’ ideas are valued by other teachers 0.48 0.22 0.28

52
Factor 1 Factor 2 Factor 3
Teachers work cooperatively in groups 0.44 -0.27 -0.12
Teachers and parents have common expectations for student performance
0.68 -0.08 0.08
Parents trust teachers’ professional judgements 0.46 0.23 0.17
Teachers and parents communicate frequently about student performance
0.09 -0.05 0.39
Students generally accept responsibility for their schooling, for example they engage mentally in class and complete homework assignments
0.66 -0.02 0.12
Based on the groupings of the rotated factor analysis the dependent variables were
regrouped into 3 variables and label as: Culture of Learning Partnerships for factor 1,
Culture of Collegiality for factor 2 and Culture of School Improvement for factor 3.
Some of the questions were included in more than one group and some questions
eliminated all together. The first factor was labeled Culture of Learning Partnerships.
The questions that formed this factor were centered around the notions of common
planning, trust, parent support of the teaching and learning process, collaboration, teacher
communication, and teacher willingness to assist others. Factor 1 included one question
regarding the use of ideas from seminars but all other questions related to professional
development were eliminated. The culture of collegiality was named because it included
factors such as teachers are aware of instruction that is taking place in other classrooms.
Two questions that were originally found in the four original factors measured in the
survey were found in the newly formed Factor 2. For example, Survey respondents
grouped the following two questions together: Teachers are generally aware of what

53
other teachers are teaching and the faculty values school improvement. These two
questions were originally contained within the teacher collaboration and professional
development variable question set. Factor 3 was labeled culture of School Improvement
and contained questions focused on school improvement and regular communication
about student progress. Overwhelmingly, the largest number of questions fell in Factor 1.
Teachers in this rural school district saw culture as Learning Partnerships and defined the
concept as collaboration, common planning, effective communication, and support of one
another. The new groupings of the questions are shown in Table 4.4.
Table 4.4. New question groupings for dependent variables
Culture of Learning Partnerships
• Teachers have opportunities for dialog and planning across grades and subjects
• Teachers spend considerable time planning together • Teachers take time to observe each other teaching • Teachers work together to develop and evaluate programs and projects • Teaching practice disagreements are voiced openly and discussed • Teachers regularly seek ideas from seminars, colleagues, and conferences • Teachers trust each other • Teachers are willing to help out whenever there is a problem • Teachers’ ideas are valued by other teachers • Teachers work cooperatively in groups • Teachers and parents have common expectations for student performance • Parents trust teachers’ professional judgements • Students generally accept responsibility for their schooling, for example
they engage mentally in class and complete homework assignments
Culture of Collegiality
• Teachers are generally aware of what other teachers are teaching. • The faculty values school improvement
Culture of School Improvement
• Teachers maintain a current knowledge base about the learning process • The faculty values school improvement • Teachers and parents communicate frequently about student performance.
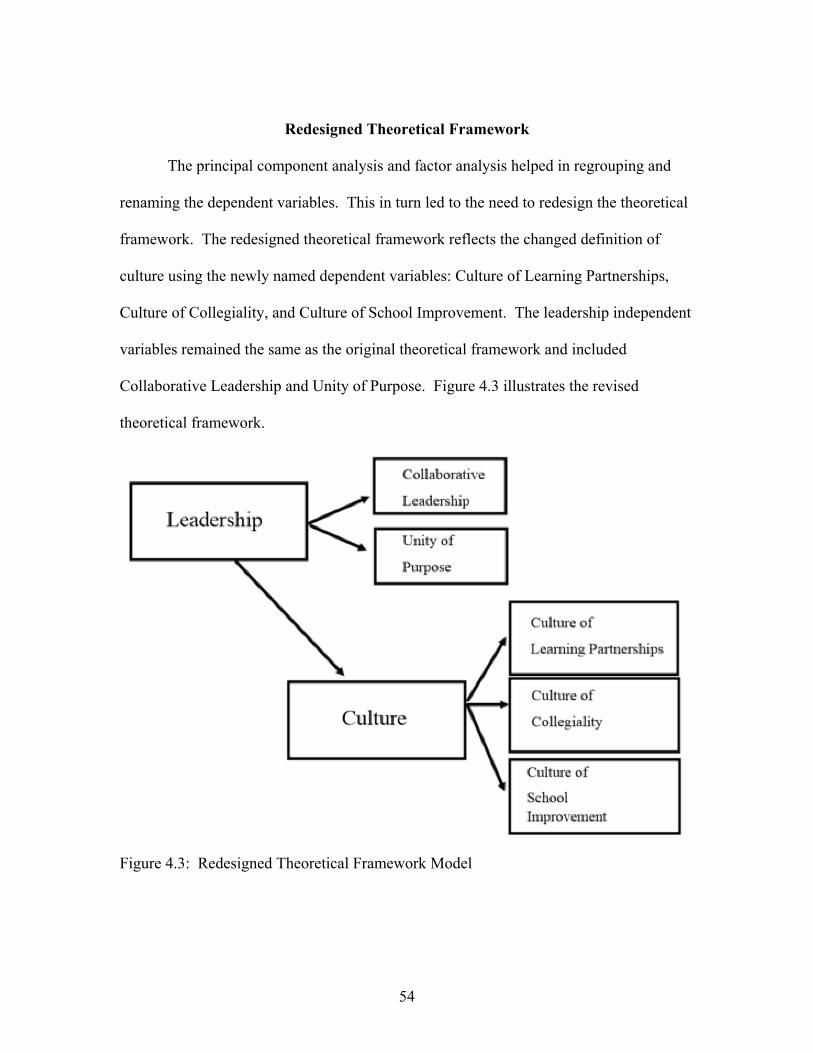
54
Redesigned Theoretical Framework
The principal component analysis and factor analysis helped in regrouping and
renaming the dependent variables. This in turn led to the need to redesign the theoretical
framework. The redesigned theoretical framework reflects the changed definition of
culture using the newly named dependent variables: Culture of Learning Partnerships,
Culture of Collegiality, and Culture of School Improvement. The leadership independent
variables remained the same as the original theoretical framework and included
Collaborative Leadership and Unity of Purpose. Figure 4.3 illustrates the revised
theoretical framework.
Figure 4.3: Redesigned Theoretical Framework Model

55
Results of the HLM
After confirming the independent and dependent variables, the next step in the
data analysis was the hierarchical linear modeling. The HLM was run using teacher level
variables as level 1 (the culture variables as the dependent variables and the leadership
variables as the independent variables) and school level variables as level 2
(demographics, performance). The reason that that HLM was chosen at this point was
because it is a method that allows for nested data. Since the data is from four different
schools, it was assumed that the teachers would be nested by schools. Initially, it was
expected to include all of the dependent, independent and school related factors in the
model. This was not possible because of the small sample size. When computing the
HLM, only one school level variable was included in level 2. The level 1 variables
included all three dependent variables measuring school culture and both independent
variables measuring leadership. In level 2, only one school measure was included
(Poverty Index) because there would not have been enough degrees of freedom to run the
model with all school level factors. Poverty index was set as random to run the HLM.
In examining the results of the HLM, the leadership independent variables were
found to explain 7.3% of the variance in Culture of Learning Partnership. No probability
test was calculated because all of the variance was explained in the residual. In level 2 of
the model, 0.0% was explained by the school level factors. A finding of 100% of
residual suggests that all of the effects were at the teacher level.
The next HLM examined the relationship between leadership with a Culture of
Collegiality. Again, the Poverty Index was random. In the second HLM, leadership was

56
found to explain 6.3% of the variance in Culture of Collegiality. As with the first HLM,
no probability test was calculated because nearly all of the variation in responses in the
model was found to exist at the teacher level.
The final HLM examined the predictive relationship of leadership with a Culture
of School Improvement. The Poverty Index was used as a random variable. This model
was found to explain 5.7% of the variance in the measure of school culture. Again, all
variation in responses was found to exist at the teacher level rather than the school level.
Since the teachers were nested within the schools, HLM was used with the
anticipation of accounting for a higher variance. However, what happened is that none of
the variance was explained at the school level and all of it fell in the residual, or teacher
level. This was due to the schools consistently reporting collaborative leadership as the
primary style of all four principals, thus leaving no variance at the school-level. This
completely eliminated one of the levels in the model. Thus it was determined that HLM
was not the appropriate method to answer the research question.
Multiple Regression—Stepwise
After running the HLM, it was found that there was no variance explained at the
school level; all of the variance in responses was being explained in the residual, or at the
teacher level. As such, it was decided that a stepwise multiple regression would be used
to answer the research question. A stepwise multiple regression allows the ability to
determine which specific independent variables make a meaningful contribution to the
prediction of the dependent variable (Mertler & Vannatta, 2010). In the multiple
regression models the first thing that was observed was the coefficient of determination
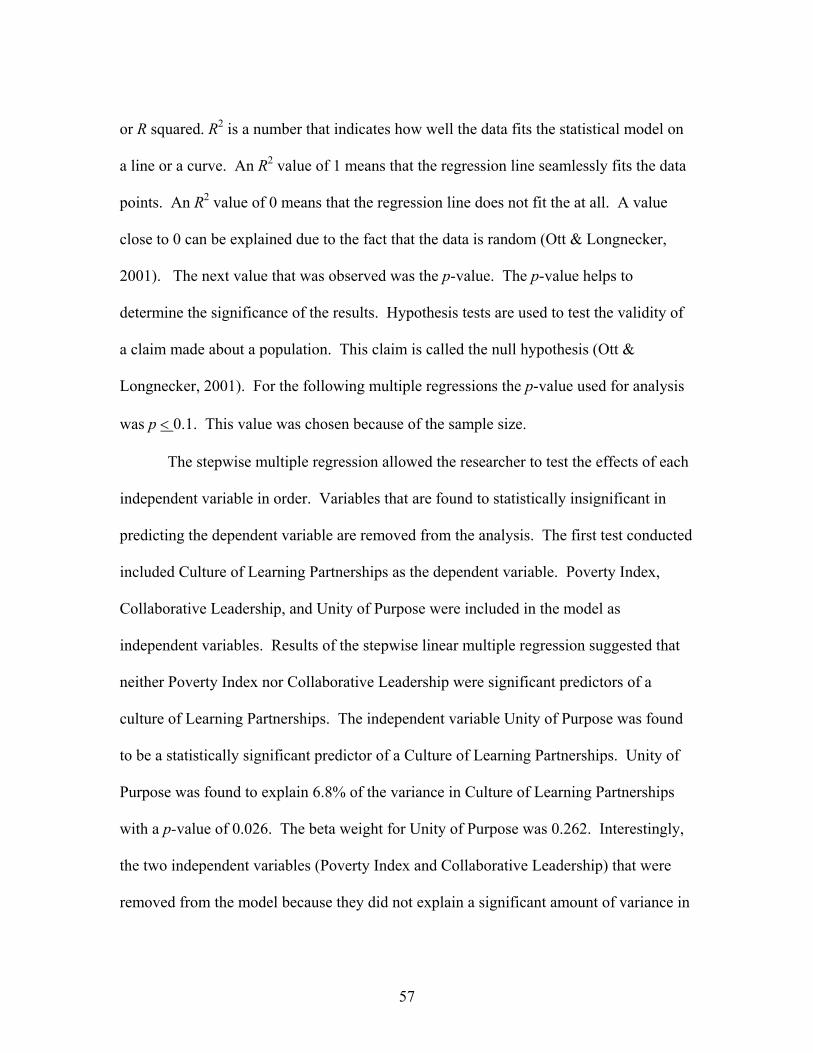
57
or R squared. R2 is a number that indicates how well the data fits the statistical model on
a line or a curve. An R2 value of 1 means that the regression line seamlessly fits the data
points. An R2 value of 0 means that the regression line does not fit the at all. A value
close to 0 can be explained due to the fact that the data is random (Ott & Longnecker,
2001). The next value that was observed was the p-value. The p-value helps to
determine the significance of the results. Hypothesis tests are used to test the validity of
a claim made about a population. This claim is called the null hypothesis (Ott &
Longnecker, 2001). For the following multiple regressions the p-value used for analysis
was p < 0.1. This value was chosen because of the sample size.
The stepwise multiple regression allowed the researcher to test the effects of each
independent variable in order. Variables that are found to statistically insignificant in
predicting the dependent variable are removed from the analysis. The first test conducted
included Culture of Learning Partnerships as the dependent variable. Poverty Index,
Collaborative Leadership, and Unity of Purpose were included in the model as
independent variables. Results of the stepwise linear multiple regression suggested that
neither Poverty Index nor Collaborative Leadership were significant predictors of a
culture of Learning Partnerships. The independent variable Unity of Purpose was found
to be a statistically significant predictor of a Culture of Learning Partnerships. Unity of
Purpose was found to explain 6.8% of the variance in Culture of Learning Partnerships
with a p-value of 0.026. The beta weight for Unity of Purpose was 0.262. Interestingly,
the two independent variables (Poverty Index and Collaborative Leadership) that were
removed from the model because they did not explain a significant amount of variance in
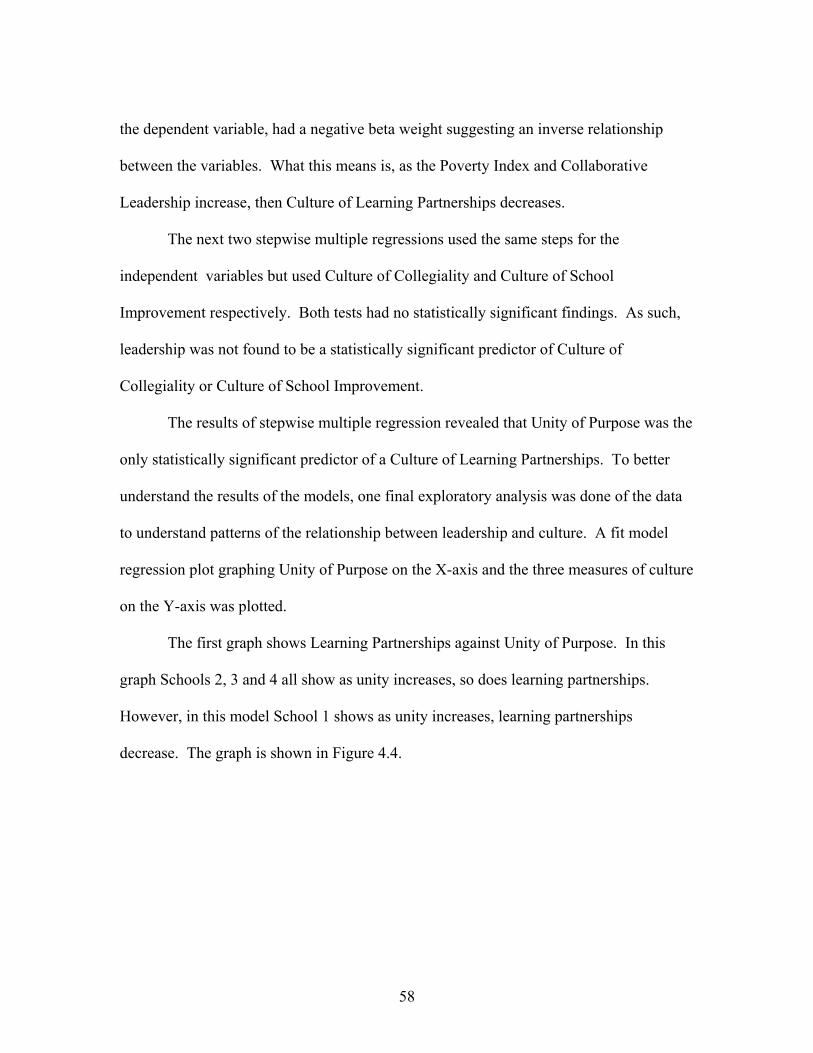
58
the dependent variable, had a negative beta weight suggesting an inverse relationship
between the variables. What this means is, as the Poverty Index and Collaborative
Leadership increase, then Culture of Learning Partnerships decreases.
The next two stepwise multiple regressions used the same steps for the
independent variables but used Culture of Collegiality and Culture of School
Improvement respectively. Both tests had no statistically significant findings. As such,
leadership was not found to be a statistically significant predictor of Culture of
Collegiality or Culture of School Improvement.
The results of stepwise multiple regression revealed that Unity of Purpose was the
only statistically significant predictor of a Culture of Learning Partnerships. To better
understand the results of the models, one final exploratory analysis was done of the data
to understand patterns of the relationship between leadership and culture. A fit model
regression plot graphing Unity of Purpose on the X-axis and the three measures of culture
on the Y-axis was plotted.
The first graph shows Learning Partnerships against Unity of Purpose. In this
graph Schools 2, 3 and 4 all show as unity increases, so does learning partnerships.
However, in this model School 1 shows as unity increases, learning partnerships
decrease. The graph is shown in Figure 4.4.

59
Figure 4.4: Regression plot of Unity of Purpose vs. Culture of Learning Partnerships with
all four schools.
The second regression plot displayed Collegiality against Unity of Purpose. In
this graph School 2 shows a strong positive correlation between unity and collegiality.
School 3 shows a very faint increase of collegiality as unity increases. Schools 1 and 4
show a slight negative correlation between unity and collegiality. The regression plot is
shown in Figure 4.5.
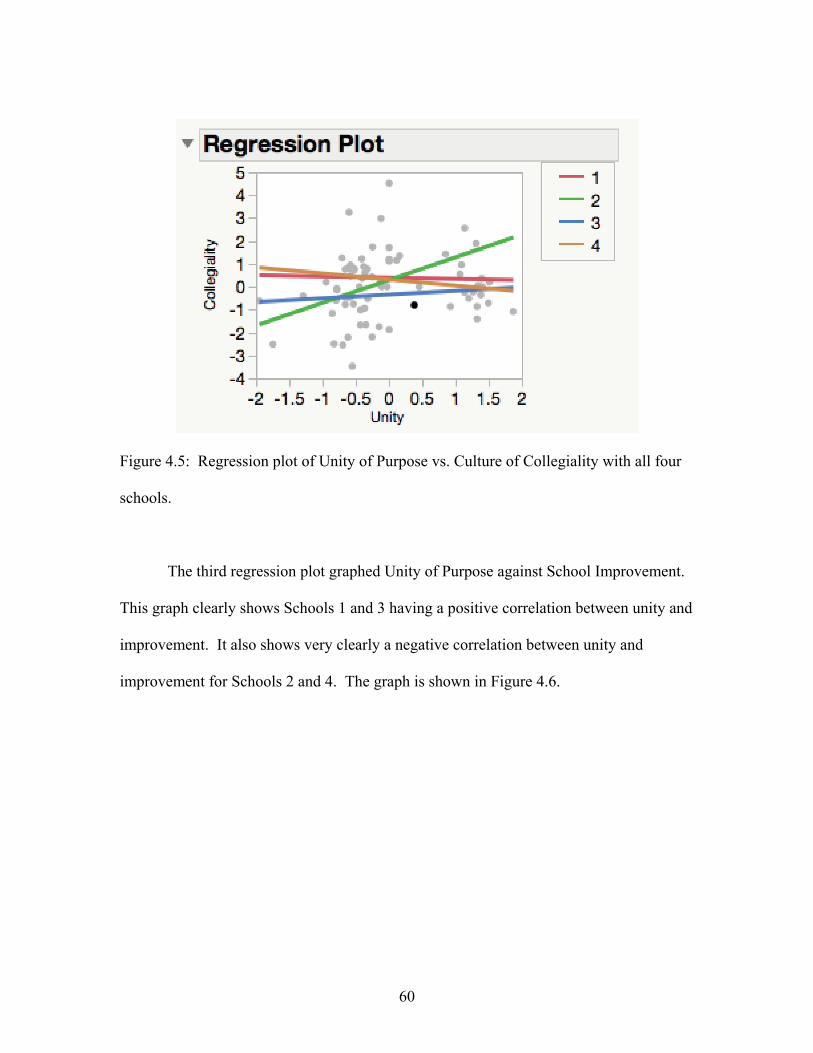
60
Figure 4.5: Regression plot of Unity of Purpose vs. Culture of Collegiality with all four
schools.
The third regression plot graphed Unity of Purpose against School Improvement.
This graph clearly shows Schools 1 and 3 having a positive correlation between unity and
improvement. It also shows very clearly a negative correlation between unity and
improvement for Schools 2 and 4. The graph is shown in Figure 4.6.

61
Figure 4.6: Regression plot of Unity of Purpose vs. Culture of School Improvement with
all four schools.
Summary
This chapter included findings from the multiple analyses conducted in the study
in an attempt to answer the research question. To define culture, three new dependent
variables were constructed based on the results from the PCA and the factor analysis.
The variables were relabeled and regrouped and the theoretical framework was adjusted.
After running the HLM it was found that nearly all of the variance was being explained
by the residual or teacher level and not the school. As such, stepwise multiple regression
was selected as a more appropriate method of analysis. Results from the stepwise
multiple regression suggest that Unity of Purpose was the only significant factor in
predicting Culture of Learning Partnerships. Using one final method of analysis, a
regression plot, the relationship of leadership and culture was plotted for the four schools

62
using Unity of Purpose as the Independent Variable and all three dependent variables,
Culture of Learning Partnerships, Culture of Collegiality, and Culture of School
Improvement.
63
CHAPTER FIVE
DISCUSSION AND IMPLICATIONS
Introduction
The purpose of this study was to examine the effect of leadership on school
culture. This chapter includes a discussion of findings from the study. Findings of this
study will be situated in existing literature. Using a post hoc test, the indirect effect of
leadership and culture on teacher retention and student achievement will be examined in
this chapter. Finally, recommendations for practice are offered as well as suggestions for
future research
Summary of the Study
The research question posed in this study was does school leadership as defined
as Collaborative Leadership and Unity of Purpose predict school culture as defined as
Teacher Collaboration, Professional Development, Collegial Support and Learning
Partnerships? As described in the literature review, repeated calls for improved outcomes
for students have resulted in new models of leadership in schools. Culture was identified
as a school improvement strategy. Of particular interest is the culture of high performing,
high poverty schools. School culture has been shown to be a major component of success
at the school, teacher and student level (Creemers & Kyriakides, 2010 and Yahaya,
Yahaya, Ramli, Hashim & Zakariya, 2010).
Based on the review of relevant literature, a theoretical framework was created
and used to write the research hypothesis. Data for the study was collected from four
elementary schools in one school district in the upstate of South Carolina. In these four

64
schools 111 teachers were asked to complete the 35 item Likert-scale School Culture
Survey developed by Gruenert and Valentine (1998). Data analysis included principal
component analysis, factor analysis, hierarchical linear modeling, and stepwise multiple
regression. Results from the principal component analysis and factor analysis of the
independent variables resulted in no change in those variables. As such, the leadership
predictor variables included in the study were identified as Collaborative Leadership and
Unity of Purpose.
Results from the principal component analysis and factor analysis of the
dependent variables measuring culture suggested changes to the number of factors to be
included in the study. Based on patterns of responses on the survey, three new measures
of culture were identified and labeled Culture of Learning Partnerships, Culture of
Collegiality, and Culture of School Improvement. Due to the need to rename the
dependent variables, a new theoretical framework was developed and the research
question was revised to read does school leadership as defined as Collaborative
Leadership and Unity of Purpose predict school culture as defined as Learning
Partnerships, Collegiality, and School Improvement?
After the independent variables and dependent variables were identified, data
analysis proceeded with hierarchical linear modeling. The small sample size coupled
with the finding that all variation in responses were found at the teacher level led to the
conclusion that a more appropriate method of analysis was required. As such, a stepwise
linear regression was calculated. Results from the stepwise multiple regression are
reviewed in this chapter and the results are situated in the literature base.

65
Research Question Answered with Statistical Support
The research question for this study was: does school leadership, defined as
Collaborative Leadership and Unity of Purpose, predict school culture, defined as Culture
of Learning Partnerships, Culture of Collegiality, and Culture of School Improvement?
Results from the multiple analyses conducted in the study allowed me to conclude that
Unity of Purpose is a significant predictor of Culture of Learning Partnerships.
Therefore, leadership, as defined as Unity of Purpose is a predictor of culture, as defined
as Learning Partnerships.
Initially an HLM was used to answer the research question, but found that this
method was inappropriate because all three of the HLM models showed that 100% of the
variance in responses was found in the residual. What this means is that there was no
school level effect; all variation in responses was found at the teacher level.
Because the data were not nested, it was determined that a more appropriate
method of analysis would be stepwise multiple regression. Results from the stepwise
multiple regression suggested that Unity of Purpose a statistically significant predictor of
Culture of Learning Partnerships. The stepwise test revealed that neither Poverty Index
nor Collaborative Leadership were statistically significant predictors of a Culture of
Learning Partnerships. The model explained 6.8% of the variance with a p-value of
0.026. The variance explained by the model was considered statistically significant.
Two other stepwise multiple regressions were calculated using the remaining two
dependent variables Culture of Collegiality and Culture of School Improvement. None of
the independent variables, Collaborative Leadership or Unity of Purpose were found to

66
be statistically significant predictors of Culture of Collegiality of Culture of School
Improvement.
To further show how the leadership variable Unity of Purpose impacted each of
the culture variables, Culture of Learning Partnerships, Culture of Collegiality, and
Culture of School Improvement, regression plots were drawn graphing Unity of Purpose
on the X Axis and Culture on the Y Axis. These graphs showed the results by school
with mostly positive correlations. As Unity of Purpose increases, the culture variables
also increased. This suggests that it is important for a leader to clearly establish a
mission and to communicate that mission to all stakeholders. When a leader clearly
articulates school goals and obtains buy-in from teachers, school culture improves.
The regression plots also revealed instances where there was a negative
relationship between leadership and culture. For example, on the first regression plot
Unity of Purpose was graphed against Culture of Learning Partnerships. Schools 2, 3,
and 4 all showed a positive slope. However, School 1 showed a negative slope. This
seems to say that as the leadership encouraged unity and shared purpose, the culture score
for the school declined. This could be that the common goal differed from their own
personal goals.
The second regression plot graphed Unity of Purpose with Culture of Collegiality.
This graph showed a strong positive correlation for School 2 as compared to the others.
This implies they work well together. School 3 had a slight positive slope as well.
However, both School 1 and 4 had a negative slope. This explains that the teachers don’t
do well in working together as leadership encourages unity.

67
The third regression plot graphed Unity of Purpose versus Culture of School
Improvement. Schools 1 and 3 had a positive correlation, explaining that the leadership
and faculty both are working towards overall school improvement. Schools 2 and 4 had a
negative slope. This predicts that the faculty’s perception of leadership is not congruent
with their own for school improvement.
The stepwise multiple regression and regression plots all showed, in different
ways how school leadership predicts school culture. This concept has repeatedly
appeared in the literature. Specifically so with Leithwood and Beatty (2008) who stated,
“the efforts or behaviors of those providing leadership are among the most powerful
direct sources or influences on teachers’ working conditions and both direct and indirect
sources of influence on teacher emotions” (p. 11). As noted in the literature review,
research exists that demonstrates that leadership impacts culture and that culture has been
suggested as a school improvement strategy. Deal and Peterson (1990) argued that
research across different kinds of organizations, including schools, suggests that
organizations perform best when people are committed to commonly held values and
beliefs. When commitment increases, individuals become bonded to one another and to
the organization by key symbols. Principals can encourage a strong culture that improves
education by articulating these values and by using effective symbols (Deal & Peterson,
1990). Because this study found a relationship between leadership and culture, an
examination of the literature on culture and teacher retention and culture and student
achievement shows final conclusions focused on how the leader can impact culture and
therefore improve performance.
68
Retention and Achievement
As noted by Deal and Peterson (1990), the culture of an organization can impact
performance. The authors argued that there is reason to believe that just as improved
culture impacts high performance in business, the same expectations can be set for
educational institutions. Deal and Petersen (1990) drew comparisons between the
literature on school culture and effective schools and concluded that effective
organizations have a strong culture with shared ways and values of how things are done;
leaders who embody core values; widely shared beliefs about the mission; employees
who represent core values; ceremonies, traditions and rituals centered on events; balance
between innovation and tradition, autonomy and authority; and employee participation in
decisions about their own work.
Because teachers have been identified as the most important school level resource
that predicts student achievement, the recruitment and retention of quality teachers
becomes of paramount importance. Improving culture by clearly stating a mission for the
school and allowing teachers to interact with one another to improve their skills and take
ownership of programs to achieve the mission of the school is seen as an important
strategy to improve schools. The results from this study suggested that leadership does
predict school culture. To situate the findings in the current literature, a brief review of
the relationship between culture and teacher retention and culture and student
achievement is offered.
69
Teacher Retention
As noted in the literature review, current education policy in the United States is
focused on school improvement and enhanced student performance for all children. In
order for each student to receive the opportunity for a high-quality education, high-
quality teachers must be recruited and retained. The issue of recruitment was examined
by Baker-Doyle (2010). Her work used a labor market perspective, defined as financial
and human capital incentives, to attract and retain high quality teachers. Baker-Doyle
(2010) specifically named financial incentives such as larger base pay, bonuses, and
tuition reimbursement to lure and keep teachers in schools. Alternatively she found that
the bonuses were a good recruitment tool, but lacked stability for retaining teachers.
The human capital part of recruitment, according to Baker-Doyle (2010) included
changes to entry requirements for people interested in becoming teachers as well as a
provision that would allow individuals to use professional experience as viable resource
to use in the classroom for temporary replacement of teaching credentials as they work
toward certification. An example of how this policy might work is South Carolina’s
Program of Alternative Certification for Educators or PACE. This program was designed
to recruit people who have not have not completed a traditional four-year teacher
education program but have spent years in business or industry. This allows South
Carolina to recruit teachers and put them through a three-year training program for full
licensure while teaching in their content area (South Carolina Department of Education,
2016).

70
Gujarati (2012) stated that teacher retention has become a national crisis that is
not limited to the recruitment of highly qualified teachers; a plan must be in place to keep
these teachers in the classrooms. The most common tools used to combat teacher
attrition are induction programs and mentoring. Over the years the two terms have been
used synonymously since most induction programs rely heavily on mentoring. Smith and
Ingersoll (2004) defined mentoring as “the personal guidance provided, usually by
seasoned veterans, to beginning teachers in school” (p. 683). “Teachers’ organizational
commitment was mainly related to teachers’ perceptions concerning the cooperation of
the leadership team and the support received from the leadership team” (Hulpia, Devos,
& Van Keer, 2010, p. 47). A similar study conducted by Hulpia, Devos and Rosseel
(2009) revealed that a cohesive leadership team and the maximum possible amount of
teacher support from that team are critical variables associated with job commitment and
satisfaction.
Another administrator-supported activity is using mentors and a school or district
level induction program. “Induction refers to a program provided to a beginning teacher
that includes professional development that is specific to beginning teachers. Many
induction programs include the assigning of a mentor” (Conway, Krueger, Robinson,
Haack, & Smith, 2002, p. 9). “It is the responsibility of the mentoring program to
provide knowledgeable mentors who will engage in the clinical supervision of
prospective teachers; and to provide future teachers with the appropriate content
knowledge necessary for teaching any and all subjects covered in school today” (Kent,
Feldman, & Hayes, 2009, p. 75).
71
Kent, Feldman, and Hayes’ (2009) research on a mentor teacher program showed
positive results upon completion of the mentoring program. In their study, first year
teachers reported that they “felt better prepared to meet the challenges of today’s
students;” the authors concluded “these first year teachers are very much ahead of
traditional first year teachers” (p. 87). Smith and Ingersoll’s (2004) study stated that their
“analysis found a strong link between participation in induction programs and reduced
rates of turnover” (p. 706).
Attrition
Boe, Cook and Sunderland (2008) defined teacher attrition simply as “leaving
employment.” According to the TFS (Teacher Follow-up Survey) data for 2000-2001,
8.5% of public school teachers with one to three years of full-time teaching experience
left teaching employment annually (Boe et al., 2008, p. 9). Based on this data, the
estimated rate of attrition during the first three years was 25.5% (Boe et al., 2008, p. 9).
When these numbers are coupled with the 30% yearly retirement rate (Boe et al., 2008), a
significant gap is left in the teaching force.
Attrition, according to Johnson (2004), is defined as completely leaving the
profession or changing schools as a result of several factors like: conflicts with principals,
unfair assignments and challenging working conditions. Buchanan (2010) also identified
workload as being a contributing factor to attrition. Attrition is expensive. “Turnover
carries substantial financial costs associated with recruiting, hiring, inducting, and
professionally training replacement teachers” (Fall, 2010, p. 76). These factors point to
the necessity to retain teachers.
72
Ingersoll (2007) reported that 60% of teachers who leave their jobs indicated
dissatisfaction with working conditions as their primary reason for leaving. One of the
working conditions leading to teacher attrition was later defined as lack of support from
school administration. Drago-Severson (2012) further claimed that healthy school
climates can help to retain qualified principals and teachers by preventing burnout.
Ladd (2011) used surveys to investigate the gap between teacher attrition, school
culture and student achievement. Ladd’s conclusions found two resounding concepts that
predicted teacher departures. One was leadership. The teachers’ perceived quality of the
leadership and the teachers’ probability of attrition was negatively correlated. Simply
stated, as the quality of the leadership decreases, the probability of the teachers leaving
increases. Another highly predictive variable for teachers leaving according to Ladd
(2011) was working conditions. Again, as perceived by the teachers, the working
conditions and probability of departure were negatively correlated. Ladd said working
conditions were defined as leadership, expanded roles, time factor, professional
development, facilities, and evaluation. As the teachers’ perceived that working
conditions were deteriorating, the probability for attrition increased. Ladd (2011)
concluded that working conditions were predictive of a teacher’s motivation to stay or
leave, but the dominant factor was the quality of the school leadership.
Ladd’s (2011) findings of the quality of a school’s leadership were consistent with
a transformational model of leadership that she proposed. She was able to show the
“correlations between the factors are such that when the leadership factor is eliminated
from the planned departure models, many of the other factors emerge more clearly as

73
predictors of departure” (p. 256). This means “leadership works in part through
providing opportunities for professional development, giving teachers more roles and
providing time for collaboration and planning” (Ladd, 2011, p. 256). The predictors of
teachers’ commitment have been linked to teacher efficacy by Tschannen-Moran and
Barr (2004). One of the predictors that links teacher efficacy and commitment is having
a shared responsibility in school decisions. It is important for teachers to have input in to
what and how things happen. When this occurs in schools, the teachers tend to form a
more cohesive unit. “They roll up their sleeves and get the job done” (Tschannen-Moran
and Barr, 2004, p. 47).
Student Performance
To stress the effect of collaborative leadership on student achievement, Terry
Wilhem (2016) stated, “shared leadership empowers teacher leaders to begin, side-by-
side with the principal, to shoulder the responsibilities for significant work toward
improving student achievement, through the process of the principal’s modeling, co-
planning, co-facilitating, and debriefing leadership experiences” (p. 26). The research
done by Yahaya, Yahaya, Ramli, Hashim and Zakariya (2010) found that there is a
significant relationship between a school’s formal culture and learning style with
students’ academic performance. This research was a descriptive survey about the
relationship between school culture and student learning styles to student’s academic
performance. “It is expected that school-level factors influence the teaching-learning
situation by developing and evaluating the school policy on teaching and the policy on
creating a learning environment at the school” (Creemers & Kyriakides, 2010, p. 264).

74
The relationship of leadership to student achievement is also articulated by
Helterbran (2010), who argued, “sustained, effective school leadership substantially
strengthens student achievement” (p. 364). “Leaders are almost always responsible for
improving the technical core of their organizations’ work; in the case of school leaders,
an unrelenting demand to focus on improving the achievement of all students make
contemporary school leaders’ attention to instructional quality the highest priority for
their work” (Sun & Leithwood, 2012, p. 440). Establishing collaborative and congenial
working relations with administrators and teachers and nurturing teacher-teacher
relationships through support of professional learning communities has been found to be
effective in closing the achievement gap for learners (Leithwood, 2010). Similarly,
Adeogun and Olisaemeka (2011) found that school climate could directly influence
school performance.
To summarize this section and further show the leaders’ impact on student
achievement Perilla (2014) discussed research done by Robert Marzano; “60 percent of
the impact a school has on its students’ academic achievement is the direct result of
efforts by teachers and principals, and of that, 25 percent of the school’s academic
achievement depends solely on the principals actions. This means a single person can
determine one-fourth of a school’s overall impact on students” (p. 61).
Post Hoc Test
Based on the literature on the relationship between culture and teacher retention
and culture and student achievement, a post hoc test was conducted to determine the
relationship of culture with teacher retention and student achievement in the district under
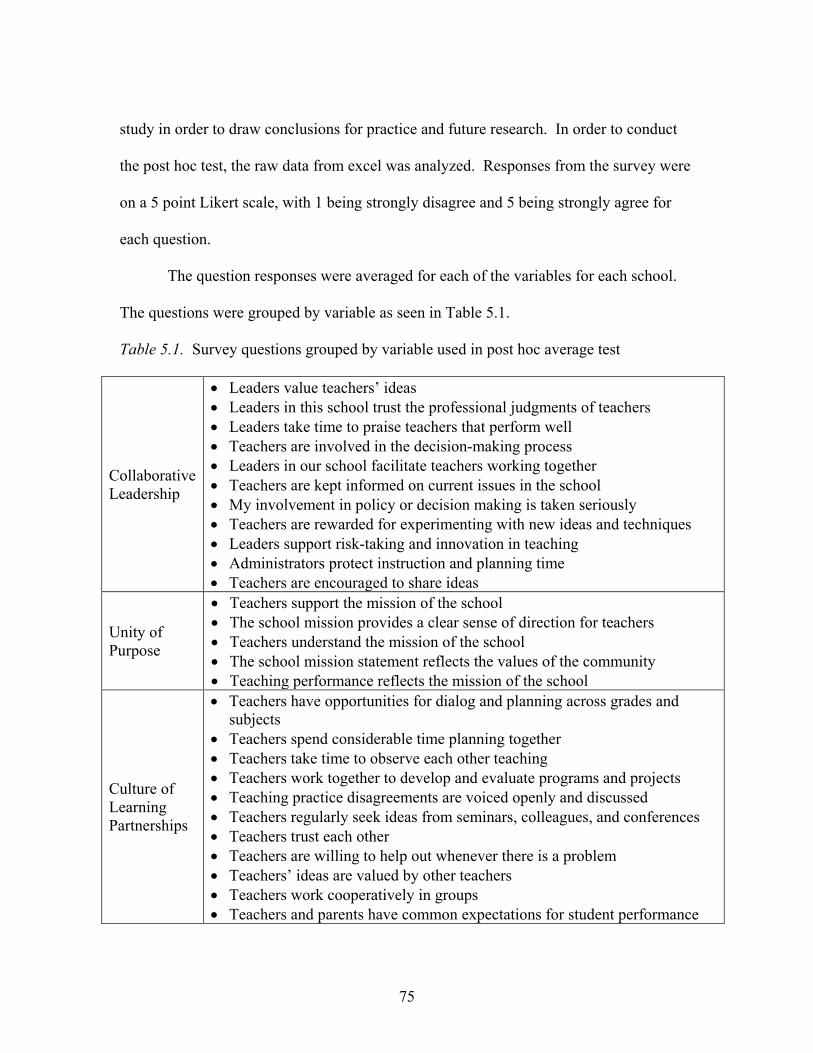
75
study in order to draw conclusions for practice and future research. In order to conduct
the post hoc test, the raw data from excel was analyzed. Responses from the survey were
on a 5 point Likert scale, with 1 being strongly disagree and 5 being strongly agree for
each question.
The question responses were averaged for each of the variables for each school.
The questions were grouped by variable as seen in Table 5.1.
Table 5.1. Survey questions grouped by variable used in post hoc average test
Collaborative Leadership
• Leaders value teachers’ ideas • Leaders in this school trust the professional judgments of teachers • Leaders take time to praise teachers that perform well • Teachers are involved in the decision-making process • Leaders in our school facilitate teachers working together • Teachers are kept informed on current issues in the school • My involvement in policy or decision making is taken seriously • Teachers are rewarded for experimenting with new ideas and techniques • Leaders support risk-taking and innovation in teaching • Administrators protect instruction and planning time • Teachers are encouraged to share ideas
Unity of Purpose
• Teachers support the mission of the school • The school mission provides a clear sense of direction for teachers • Teachers understand the mission of the school • The school mission statement reflects the values of the community • Teaching performance reflects the mission of the school
Culture of Learning Partnerships
• Teachers have opportunities for dialog and planning across grades and subjects
• Teachers spend considerable time planning together • Teachers take time to observe each other teaching • Teachers work together to develop and evaluate programs and projects • Teaching practice disagreements are voiced openly and discussed • Teachers regularly seek ideas from seminars, colleagues, and conferences • Teachers trust each other • Teachers are willing to help out whenever there is a problem • Teachers’ ideas are valued by other teachers • Teachers work cooperatively in groups • Teachers and parents have common expectations for student performance
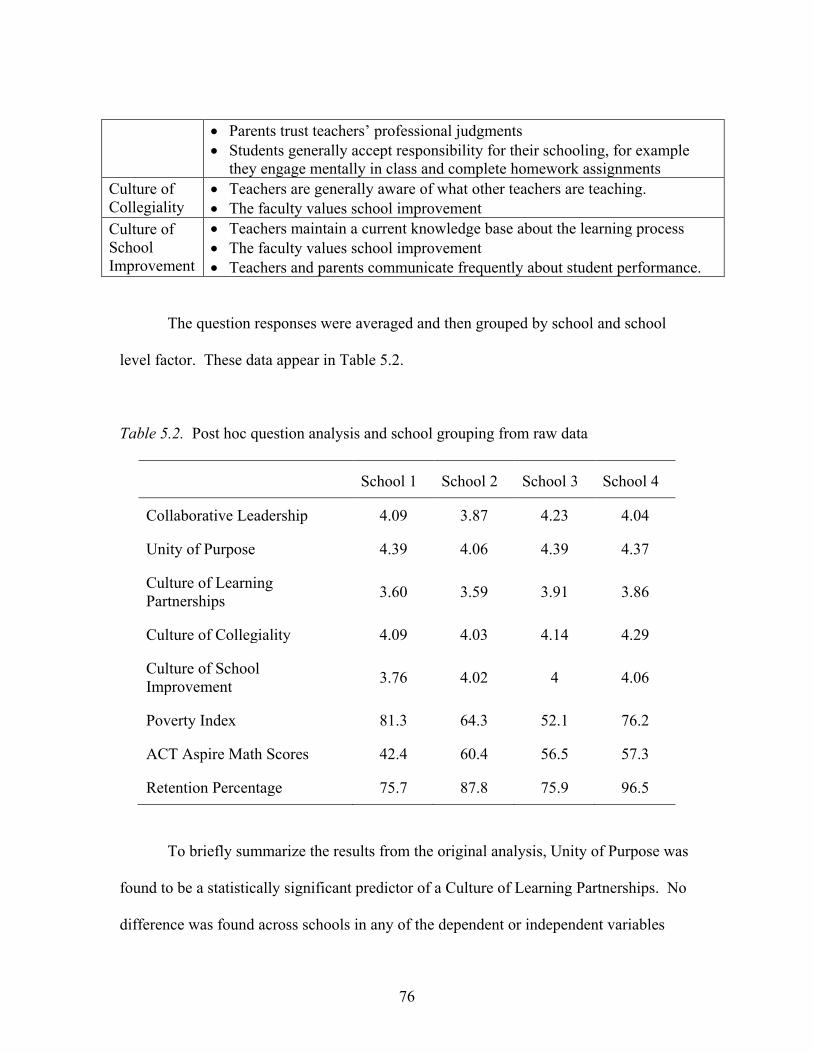
76
• Parents trust teachers’ professional judgments • Students generally accept responsibility for their schooling, for example
they engage mentally in class and complete homework assignments Culture of Collegiality
• Teachers are generally aware of what other teachers are teaching. • The faculty values school improvement
Culture of School Improvement
• Teachers maintain a current knowledge base about the learning process • The faculty values school improvement • Teachers and parents communicate frequently about student performance.
The question responses were averaged and then grouped by school and school
level factor. These data appear in Table 5.2.
Table 5.2. Post hoc question analysis and school grouping from raw data
School 1 School 2 School 3 School 4
Collaborative Leadership 4.09 3.87 4.23 4.04
Unity of Purpose 4.39 4.06 4.39 4.37
Culture of Learning Partnerships 3.60 3.59 3.91 3.86
Culture of Collegiality 4.09 4.03 4.14 4.29
Culture of School Improvement 3.76 4.02 4 4.06
Poverty Index 81.3 64.3 52.1 76.2
ACT Aspire Math Scores 42.4 60.4 56.5 57.3
Retention Percentage 75.7 87.8 75.9 96.5
To briefly summarize the results from the original analysis, Unity of Purpose was
found to be a statistically significant predictor of a Culture of Learning Partnerships. No
difference was found across schools in any of the dependent or independent variables

77
except for Unity of Purpose. According to the results from the HLM, no variance was
explained at the school level; the only differences in responses were found the teacher
level. According to the data in Table 5.2, differences exist in the demographics of the
schools as well in measures of student achievement. In examining the data in Table 5.2,
it is important to remember that there is new leadership in Elementary School 1 which
could be the cause of the difference in culture score when compared with the other three
elementary schools.
To better understand the data presented in the post hoc analysis, a Pearson
correlation was done. A Pearson correlation is the appropriate measure of correlation
when variables are expressed as scores. Findings from the Pearson correlation added to
the understanding of the relationship between leadership and culture as well as the
relationship between culture and retention and culture and achievement. Further, the
Pearson correlations confirmed other findings.
A negative relationship was found to exist between poverty and test scores (r= -
0.61); the relationship was not found to be statistically significant at the p<.05 level.
This suggests that as poverty increases, the test scores would decrease. The stepwise
multiple regression also explained that poverty did not predict culture. Poverty was not
statistically significant in relation to teacher retention, but had an r=0.27. With this slight
positive relationship, retention slightly increases with poverty. There was also a positive
relationship of Unity of Purpose and poverty with an r=0.19. These two results help
explain that poverty doesn’t predict culture in theses cases; it’s the leader setting the
direction that overcomes poverty (Almay & Tooley, 2012). One important factor that

78
was found in high poverty high achieving schools was a clearly defined goal of high
expectations for teachers and students.
One of the more interesting findings in the Pearson correlation was that the
Poverty Index had a negative relationship with Collaborative Leadership (r=-0.30). This
suggests means that as poverty increases, collaborative leadership decreases. Results
from the study suggest that leaders have done a good job setting direction and obtaining
consensus from stakeholders on the mission of schools but that work needs to be done on
building a culture of collaborative leadership, especially in schools with higher
concentrations of poverty. Strategies to accomplish this would include involving teachers
in decision making in the building, increasing time for planning, and facilitating the
creation of relationships build upon trust.
Conclusions from this table are well supported in the literature. First, School 1
had the lowest score in the culture variable and also had the lowest retention percentage.
Alternatively, School 4 scored the highest average in the culture variables and had the
highest percentage of retention. According to Collie, Shapka and Perry (2011), “teachers
who feel greater well being in their teaching may have a greater commitment to the
profession” (p. 1045).
Another finding from this table that is supported by the literature is that culture
predicts both teacher retention and student achievement. Adeogun and Olisaemeka
(2011) found that school culture had a direct influence on school performance. Schools 2
and 4 both had the highest retention percentages and they both had the highest ACT
Aspire Math scores.

79
In summary, leadership predicts culture, culture predicts teacher retention, and
teacher retention predicts student achievement. Helterbran (2010) summarized it simply
as “sustained, effective school leadership substantially strengthens student achievement”
(p. 364).
Implications for Practice and Future Study
As noted, one limitation of the current study was the sample size. The study must
be replicated in a larger school district containing more schools in order to analyze the
data using hierarchical linear modeling. In so doing, it would be more likely to find
differences across schools. Using hierarchical linear modeling to study the relationship
between leadership and culture could help the researcher to better explain the relationship
between these two constructs of nested variables. It’s also important to note that the
results from this study are not generalizable; they are representative of this small district
in the upstate of South Carolina. Teachers in this study had different definitions of
school culture. Overwhelmingly, teachers in the district defined culture as Learning
Partnerships. Their responses revealed similar patterns in answering questions focused
on collaboration, problem solving, support for one another, and communication. Absent
from conversations about culture were questions about professional development and
creating a culture of improvement focused on the instructional process. A larger sample
might yield a different grouping of the questions and allow for varied definitions of
culture that were more aligned with the variables as defined by the creators of the survey.
Different definitions of culture could lead to different findings with regard to the
importance of leadership and creating a positive culture.

80
A larger sample would also eliminate the bias that resulted from the leadership
change in one of the elementary schools. Recalling that the principal in Elementary
School 1 was a first year principal is important. This leader was only in the building for
six months at the time that the survey was administered. The scores on culture were
correlated with performance measures from the previous year which may account for the
negative relationship between culture and student achievement.
In terms of practice, results of this study suggest that the most important behavior
of a leader is to set direction; this finding is supported by the literature. (Leithwood &
Beatty, 2008). As defined by the survey, Unity of Purpose included establishing a
mission, clearly communicating the mission to teachers, gaining stakeholder buy-in of the
mission and teaching performance matches the mission of the school. We know that
collaborative leadership matters although we didn’t find it in this study due to the small
sample. We know from the literature that Collaborative Leadership is viable for a
healthy school and teacher efficacy (Arbabi & Mehdinezhad, 2015 and Heck &
Hallinger, 2010). However, there was a negative correlation between collaborative
leadership and poverty – in those schools the leader needs to focus on; valuing teachers’
ideas, trusting the professional judgment of teachers, praising teachers that perform well,
involving teachers in decision-making, facilitating teachers working together, keeping
teachers informed about current issues, rewarding teachers for experimenting with new
ideas and techniques, supporting risk-taking and innovation in teaching, and protecting
instruction and planning time.
81
Summary
This chapter included a discussion of the results of the study. Study results were
situated in the literature in order to inform findings. The research question was answered
using results from multiple methods, supported and confirmed by the literature. As a
result of the findings of the study, a new model for how leadership impacts culture was
proposed. Because collaborative leadership was not found to be a predictor of culture in
any of the analyses conducted in the study, one final post hoc analysis was conducted
using descriptive statistics. The descriptive statistics confirmed the relationship between
leadership, culture, and student achievement.

82
APPENDICES
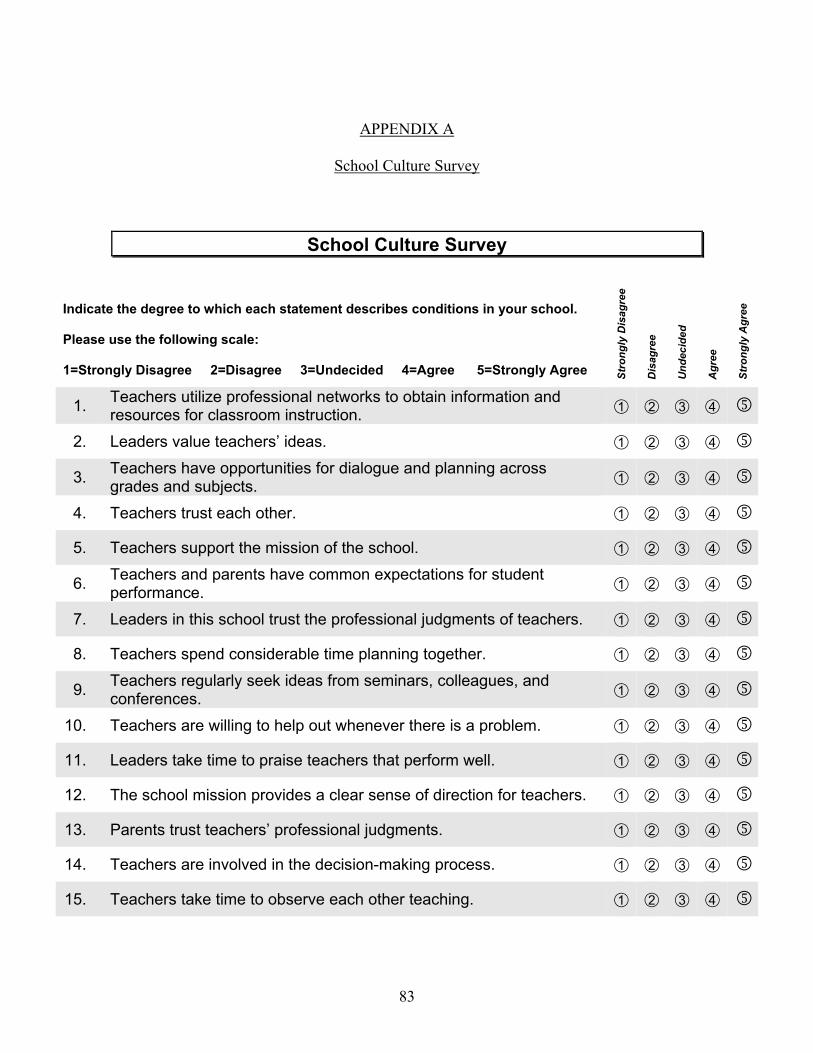
83
APPENDIX A
School Culture Survey
School Culture Survey
Indicate the degree to which each statement describes conditions in your school. Please use the following scale: 1=Strongly Disagree 2=Disagree 3=Undecided 4=Agree 5=Strongly Agree St
rong
ly D
isag
ree
Dis
agre
e
Und
ecid
ed
Agr
ee
Stro
ngly
Agr
ee
1. Teachers utilize professional networks to obtain information and resources for classroom instruction. ➀ ➁ ➂ ➃
2. Leaders value teachers’ ideas. ➀ ➁ ➂ ➃
3. Teachers have opportunities for dialogue and planning across grades and subjects. ➀ ➁ ➂ ➃
4. Teachers trust each other. ➀ ➁ ➂ ➃
5. Teachers support the mission of the school. ➀ ➁ ➂ ➃
6. Teachers and parents have common expectations for student performance. ➀ ➁ ➂ ➃
7. Leaders in this school trust the professional judgments of teachers. ➀ ➁ ➂ ➃
8. Teachers spend considerable time planning together. ➀ ➁ ➂ ➃
9. Teachers regularly seek ideas from seminars, colleagues, and conferences. ➀ ➁ ➂ ➃
10. Teachers are willing to help out whenever there is a problem. ➀ ➁ ➂ ➃
11. Leaders take time to praise teachers that perform well. ➀ ➁ ➂ ➃
12. The school mission provides a clear sense of direction for teachers. ➀ ➁ ➂ ➃
13. Parents trust teachers’ professional judgments. ➀ ➁ ➂ ➃
14. Teachers are involved in the decision-making process. ➀ ➁ ➂ ➃
15. Teachers take time to observe each other teaching. ➀ ➁ ➂ ➃

84
16. Professional development is valued by the faculty. ➀ ➁ ➂ ➃
17. Teachers’ ideas are valued by other teachers. ➀ ➁ ➂ ➃
18. Leaders in our school facilitate teachers working together. ➀ ➁ ➂ ➃
19. Teachers understand the mission of the school. ➀ ➁ ➂ ➃
20. Teachers are kept informed on current issues in the school. ➀ ➁ ➂ ➃
Please continue on the back of this survey.
1=Strongly Disagree 2=Disagree 3=Undecided 4=Agree 5=Strongly Agree St
rong
ly D
isag
ree
Dis
agre
e
Und
ecid
ed
Agr
ee
Stro
ngly
Agr
ee
21. Teachers and parents communicate frequently about student performance. ➀ ➁ ➂ ➃
22. My involvement in policy or decision making is taken seriously. ➀ ➁ ➂ ➃
23. Teachers are generally aware of what other teachers are teaching. ➀ ➁ ➂ ➃
24. Teachers maintain a current knowledge base about the learning process. ➀ ➁ ➂ ➃
25. Teachers work cooperatively in groups. ➀ ➁ ➂ ➃
26. Teachers are rewarded for experimenting with new ideas and techniques. ➀ ➁ ➂ ➃
27. The school mission statement reflects the values of the community. ➀ ➁ ➂ ➃
28. Leaders support risk-taking and innovation in teaching. ➀ ➁ ➂ ➃
29. Teachers work together to develop and evaluate programs and projects. ➀ ➁ ➂ ➃
30. The faculty values school improvement. ➀ ➁ ➂ ➃
31. Teaching performance reflects the mission of the school. ➀ ➁ ➂ ➃
32. Administrators protect instruction and planning time. ➀ ➁ ➂ ➃
33. Teaching practice disagreements are voiced openly and discussed. ➀ ➁ ➂ ➃

85
34. Teachers are encouraged to share ideas. ➀ ➁ ➂ ➃
35. Students generally accept responsibility for their schooling, for example they engage mentally in class and complete homework assignments.
➀ ➁ ➂ ➃
Steve Gruenert and Jerry Valentine, Middle Level Leadership Center, University of Missouri, 1998.
Reproduce only by authors’ written permission.

86
APPENDIX B
Permission to use the School Culture Survey
Figure B-1: Screen shot of the email confirming permission to use the survey

87
REFERENCES
Adams, P.E., & Krockover, G.H. (1997, January). Concerns and perceptions of beginning secondary science and mathematics teachers. Science Education, 81(1), 29-51.
Adeogun, A.A., & Olisaemeka Blessing, U. (2011). Influence of school climate on students’ achievement and teachers’ productivity for sustainable development. US-China Education Review, 8(4), 552-557.
Almay, S. & Tooley, M. (2012). Building and sustaining talent creating conditions in high-poverty schools that support effective teaching and learning. The Education Trust, 1-17.
Arbabi, A., & Mehdinezhad, V. (2015). The relationship between the school principals’ collaborative leadership style and the teachers’ self-efficacy. Palestrica of the third millennium- Civilization and Sport 16(2), 125-131.
Baker-Doyle, K. (2010). Beyond the labor market paradigm: a social network perspective on teacher recruitment and retention. Education Policy Analysis Archives, 18(26), 1-14.
Barth, P., Haycock, K., Jackson, H., Mora, K., Ruiz, P., Robinson, S., & Wilkins, A. (Eds.) (1999). Dispelling the myth: High poverty schools exceeding expectations. Washington, DC: Education Trust.
Beck, L.G. & Murphy, J. (1993). Understanding the principalship: Metaphorical themes, 1920’s-1990’s. New York: Teachers College Press.
Berliner, D.C. (2006). Our impoverished view of educational reform. Teachers College Record [Electronic Version]. Retrieved April 20, 2016 from Web Site: http://www.tcrecord.org/content.asp?contentid-12106
Blase, J. & Kirby, P.C. (2000). Bringing out the best in teachers: What effective principals do (2nd ed.). Thousand Oaks, CA: Corwin Press.
Blodget, A. S. (2016). My school, my self. Independent School, 75(3), 70-76.
Boe, E., Cook, L., & Sunderland, R. (2008). Teacher Turnover: Examining Exit Attrition, Teaching Area Transfer, and School Migration. Exceptional Children, 75(1), 7-31.
Bolman, L. G. & Deal, T. E. (2008). Reframing organizations. San Francisco, CA: Jossey-Bass
88
Bowles, S., & Levin, H.M. (1968). The determinants of scholastic achievement: an appraisal of some recent evidence. The Journal of Human Resources, 3(1), 3-24.
Bradshaw, C. P., Waasdorp, T. E., Debnam, K. J., and Johnson, S. L. (2014). Measuring school climate in high schools: a focus on safety, engagement, and the environment. Journal of School Health, 84(9), 593-604.
Buchanan, J. (2010). May I be excused? Why teachers leave the profession. Asia Pacific Journal of Education, 30(2), 199-211.
Carter, S.C. (2000). No excuses: Lessons from 21 high-performing, high-poverty schools. Washington, DC: Heritage Foundation.
Collie, R. J., Shapka, J. D., & Perry, N. E. (2011). Predicting teacher commitment: the impact of school climate and social-emotional learning. Psychology in the Schools 48(10), 1034-1048.
Conway, C., Krueger, P., Robinson, M., Haack, P., and Smith, M.V. (2002). Beginning music teacher induction and mentor policies: a cross-state perspective. Arts Education Policy Review, 104(2), 9-17.
Cooper, B.S., & Iorio, J. E. (1990). Organizing schools for teacher collegiality: The new york city experience. Education 111(1), 68-76.
Creemers, B. & Kyriakides, L. (2010). School factors explaining achievement on cognitive and affective outcomes: establishing a dynamic model of educational effectiveness. Scandinavian Journal of Educational Research, 54(3), 263-294
Cronk, B. C., (2010). How to use PASW statistics, a step-by-step guide to analysis and interpretation. Glendale, CA: Pyrczak Publishing.
Darling-Hammond, L. (2007). Excellent teachers deserve excellent leaders. The Wallace Foundation’s National Conference, New York City, October 22-24, 2007. Education Leadership: A Bridge to School Reform (pp.17-24).
Deal, T.E. & Peterson, K.D. (1990). The principal’s role in shaping school culture. Office of Educational Research and Improvement. Report No PIP-90-870. Washington, DC.
Drago-Sevenson, E. (2012). New opportunities for principal leadership: shaping school climates for enhanced teacher development. Teachers College Record, 114, 1-44.
Ehrenberg, R.G., & Brewer, D.J. (1995). Did teachers’ verbal ability and race matter in the 1960s? Coleman revisited. Economics of Education Review, 14(1), 1-21.
89
Evans, R. (1996). The human side of change: Reform, resistance, and the real-life problems of innovation. San Francisco: Jossey-Bass.
Ferguson, R., & Ladd, H. (1996). How and why money matters: An analysis of Alabama schools. In H.Ladd (Ed.). Holding schools accountable. Washington, DC: Brookings Institute Press.
Ferguson, R.F., & Womack, S.T. (1993). The impact of subject matter and education coursework on teaching performance. Journal of Teacher Education, 44(1), 55-63.
Freed, D. (2014). It’s not personal. It’s organizational. Independent School, 73(3), 104-110.
Fullan, M. (2001). The new meaning of educational change (3rd ed.). New York: Teachers College Press.
Ferguson, R.F. (1991, May). Racial patterns in how school and teacher quality affect achievement and earnings. Challenge, 2(1), 1-35.
Fusarelli, L. D., Kowalski, T. J., & Petersen, G. J. (2011). Distributive leadership, civic engagement and deliberative democracy as vehicles for school improvement. Leadership and Policy in Schools, 10, 42-62.
Goertz, M. E. (2001). Standards-based accountability: Horse trade or horse whip? In L. Corno (Ed.), Education across a century: The centennial volume, NSSE Yearbook, 100(1), 39-59.
Goldhaber, D. D., & Brewer, D. (2000). Does teacher certification matter? High school teacher certification status and student achievement. Educational Evaluation and Policy Analysis, 22, 129-145.
Goldhaber, D.D., & Brewer, D.M. (1997). Evaluating the effect of teacher degree level on educational performance. In Fowler, J.W. (Ed.). Development of school finance. Washington, DC: National Center for Education Statistics.
Goodwin, B. (2015). Does teacher collaboration promote teacher growth? Education Leadership, 73(4), 82-83.
Greenwald, R., Hedges, L., & Laine, R. (1996). The effect of school resources on student achievement. Review of Education Research, 66(3), 1141-1178.
Gruenert, S. & Valentine, J. (1998). School Culture Survey
Gujarati, J. (2012). A comprehensive induction system: a key to the retention of highly qualified teachers. The Educational Forum, 76, 218-223.
90
Hanushek, E.A. (1997). Assessing the effects of school resources on student performance: An update. Educational Evaluation and Policy analysis, 19(2), 141-164.
Hanushek, E. (1971). Teacher characteristics and gains in student achievement: Estimation using micro data. American Economic Review, 61(2), 280-288.
Hawk, P., Coble, C.R., & Swanson, M. (1985). Certification: It does matter. Journal of Teacher Education, 36(3), 13-15.
Heck, R. H., & Hallinger, P. (2010). Collaborative leadership effects on school improvement. Elementary School Journal 111(2), 226-252.
Helterbran, V. R. (2010). Teacher leadership: Overcoming ‘I am just a teacher’ syndrome. Education, 131(2), 363-371.
Hodge, W.A. (2003). The role of performance pay systems in comprehensive school reform: Considerations for policy making and planning. Lanham, MD: University Press of America.
Hofmann, D. A. (1997). An overview of the logic and rationale of hierarchical linear models. Journal of Management, 23, 723-744.
Hoy, W. K. & Miskel, C. G. (2005). Educational administration theory, research and practice. Boston, MA: McGraw Hill.
Hulpia, H., Devos, G., & Rosseel, Y. (2009). The relationship between the perception of distributed leadership in secondary schools and teachers’ and teacher leaders’ job satisfaction and organizational commitment. School Effectiveness and School Improvement, 20(3), 291-317.
Hulpia, H., Devos, G., & Van Keer, H. (2010). The influence of distributed leadership on teachers’ organizational commitment: a multilevel approach. The Journal of Educational Research, 103(1), 40-52.
Isbister, J. (2001), Capitalism and Justice: Envisioning Social and Economic Fairness, Kumarian Press, Bloomfield, CT.
Ingersoll, R. M. (2007). The science and mathematics teacher shortage: fact and myth. NSTA Reports!, 18(9), 6-7.
JMP Statistical Discovery from SAS. www.jmp.com
Jesse, D., Davis, A., & Pokorny, N. (2004). High-achieving middle schools for Latino students in poverty. Journal of Education for Students Placed at Risk 9 (1): 23-45.

91
Johnson, S. M. (2004) Finders and keepers: helping new teachers survive and thrive in our schools (San Francisco, CA, Jossey-Bass).
Kannapel, P.J., & Clements, S.K. (February 2005). Inside the black box of high performing high-poverty schools. Lexington, KY: The Prichard Committee for Academic Excellence.
Kent, A. M., Feldman, P., and Hayes, R. L., (2009). Mentoring and inducting new teachers into the profession: an innovative approach. International Journal of Applied Educational Studies, 5(1), 73-95.
King Rice, J. (2003).Teacher quality: Understanding the effectiveness of teacher attributes. Washington, DC: Economic Policy Institute.
Kochan, F. K., & Reed, C. J. (2005). Collaborative leadership, community building, and democracy in public education. In F. W. English (Ed.), The Sage handbook of educational leadership (pp. 68-84). Thousand Oaks, CA: Sage.
Kouzes, J.M. & Posner, B.Z. (2002). The leadership challenge (3rd ed.). San Francisco: Jossey-Bass.
Laczko-Kerr, I., & Berliner, D.C. (2002, September). The effectiveness of “Teach for America” and other under-certified teachers on student academic achievement: A case of harmful public policy. Education Policy Analysis Archives, 10(37). Retrieved September 10, 2002, from http://epaa.asu.edu/epaa/v10n37/
Ladd, H. F., (2011). Teachers’ perceptions of their working conditions: how predictive of planned and actual teacher movement? Educational Evaluation and Policy Analysis, 33(2), 235-261.
LaPlant, J.C. (1986). Collegial support for professional development and school improvement. Theory into Practice 25(3), 185-190.
Lee, V.E & Burkha, D.T. (2002). Inequality at the starting gate: Social background differences in achievement as children begin school, Washington, DC: Economic Policy Institute.
Leithwood, K. (2010). Characteristics of school districts that are exceptionally effective in closing the achievement gap. Leadership and Policy in Schools, 9, 245-291.
Leithwood, K. & Beatty, B. (2008). Leading with teacher emotions in mind. Thousand Oaks, CA: Corwin Press.
92
Leithwood. K.A. & Riehl, C. (2005). What do we already know about educational leadership? In W.A. Firestone & C. Riehl (Eds.), A new agenda for research in educational leadership (pp. 12-27). New York: Teachers College Press.
Lencioni, P. (2012). The advantage. San Francisco, CA: Jossey-Bass
Linn, R.L. (2000), Assessments and accountability, Educational Researcher, 29(2), 4-16.
Lumby, J., & Foskett, N. (2011). Power, risk, and utility: interpreting the landscape of culture in educational leadership. Educational Administration Quarterly, 47(3), 446-461.
Main, K., Pendergast, D., & Virtue, D. C. (2015). Core features of effective continuing professional development for the middle years: A tool for reflection. Research in Middle Level Education Online, 38(10), 1-18.
Marion, R. (2002). Leadership in education organizational theory for the practitioner. Upper Saddle River, NJ: Pearson Education.
Marzano, R. J., Waters, T., & McNulty, B. S. (2005). School leadership that works: Form research to results. Alexandria, VA & Aurora, CO: Association for Supervision and Curriculum Development, Mid-continent Research for Education and Learning.
Maxcy, S. J. (1995). Democracy, chaos, and the new school order. Thousand Oaks, CA: Corwin.
Mendels, P. (2012). The effective principal. JSD, 33(1), 54-58.
Mertler, C. A. & Vannatta, R. A. (2010). Advanced and multivariate statistical methods. Glendale, CA: Pyrczak Publishing.
Monk, D., & King. J. (1994). Multi-level teacher resource effects on pupil performance in secondary mathematics and science. In R.G. Eherenberg (Ed.), Choices and consequences (pp. 29-58). Ithaca, NY: ILR Press.
Morel, N.J. (2014). Setting the stage for collaboration: An essential skill for professional growth. Delta Kappa Gamma Bulletin, 81(1), 36-39.
Murnane, R.J., & Phillips, B. (1981, March). What do effective teachers of inner-city schools have in common? Social Science Research, 10(1), 83-100.
Ndoye, A., Imig, S.R., & Parker, M.A. (2010). Empowerment, leadership, and teachers’ intentions to stay in or leave the profession or their schools in North Carolina charter schools. Journal of School Choice, 4, 174-190.
93
Nelson, J. P., Caldarella, P., Adams, M. B., & Shatzer, R. H. (2013). Effects of peer praise notes on teachers’ perceptions of school community and collegiality. American Secondary Education, 41(3), 62-77.
Paige, R. (2004). Meeting the highly qualified teachers challenge: The Secretary’s third annual report on teacher quality. Washington, DC: Office of Postsecondary Education, U.S. Department of Education.
Paquette, M. (1987). Voluntary collegial support groups for teachers. Educational Leadership 45(3), 36-39.
Perilla, N. (2014). Leading the future: rethinking principal preparation and accountability frameworks. Harvard Journal of Hispanic Policy, 26, 59-69.
Poulos, J., Culberston, N., Piazza, P., & D’Entremont, C. (2014). Making space: The value of teacher collaboration. Education Digest, 80(2), 28-31.
Prather-Jones, B. (2011). How school administrators influence the retention of teachers of students with emotional and behavioral disorders. The Clearing House, 84(1), 1-8.
Quirk, T.J., Witten, B.J., & Weinberg, S.F. (1973). Review of studies of the concurrent and predictive validity of the National Teacher Examinations. Review of Educational Research, 43(1), 89-113.
Ragland, M.A., Clubine, B., Constable, D., & Smith, P.A. (2002). Expecting success: A Study of five high-performing high- poverty schools. Washington, DC: Council of Chief State School Officers.
Ramirez, H. (2003, October). The shift from hands-off; the federal role in supporting and defining teacher quality. American Enterprise Institute for Public Policy Research, Progressive Policy Institute.
Raudenbush, S. W. & Bryk, A. S. (2002). Hierarchical linear models applications and data analysis methods. Thousand Oaks, CA: Sage Publications.
Rivkin, S.G., Hanushek, E.A. & Kain, J.F. (2005). Teachers, schools, and academic achievement. Econometrica, 73(2), 417-458.
Ross, J. A. & Gray, P. (2006). School leadership and student achievement: the mediating effects of teacher beliefs. Canadian Journal of Education, 29(3), 798-822.
Rothstein, R. (2004). Class and schools. Washington, DC: Economic Policy Institute.
Sahin, S. (2011). The relationship between instructional leadership style and school culture. Educational Sciences: Theory & Practice, 11(4), 1920-1927.

94
Sanders, W.L. (2000). Value-added assessment from student achievement data: Opportunities and hurdles. Journal of Personnel Evaluation in Education, 14(4), 329-339.
Sanders W.L., & Horn, S. P. (1998). Research findings from the Tennessee value-added assessment system (TVAAS) database: Implications for educational evaluation and research. Journal of Personnel Evaluation in Education, 12(3). 247-256.
Sanders, W.L., Wright, S.P., & Ross, S.M. (1999). Value-added achievement results for two cohorts of Roots and Wings schools in Memphis: 1995-1998 outcomes. Memphis, TN: Center for Research in Educational Policy, The University of Memphis.
Sheehan, K. & Rall, K. (2011). Rediscovering hope: building school cultures of hope for children of poverty. Phi Delta Kappan, 93(3), 44-47.
Smith, T.S., and Ingersoll, R.M. (2004). What are the effects of induction and mentoring on beginning teacher turnover? American Educational Research Journal 41(3), 681-714.
South Carolina Department of Education. (2016). ed.sc.gov
Spillane, J.P. & Seashore Louis, K. (2002), School improvement processes and practices: Professional learning for building instructional capacity, In J. Murphy (Ed.), The educational leadership challenge: Redefining leadership for the 21st century (pp. 83-104), Chicago: The University of Chicago Press.
Sullivan, S., & Glanz, J. (2006). Building effective learning communities: Strategies for leadership, learning, & collaboration. Thousand Oaks, CA: Corwin Press.
Sun, J. & Leithwood, K. (2012). Transformational school leadership effects on student achievement. Leadership and Policy in Schools, 11(4), 418-451.
Topping, K.J., & Sanders, W.L. (2000). Teacher effectiveness and computer assessment of reading: Relating value added and learning information system data. School Effectiveness and School Improvement, 11(3), 305-337.
Toronto Catholic District School Board. (2016). www.tcdsb.org
Tschannen-Moran, M. & Barr, M. (2004). Fostering student learning: the relationship of collective teacher efficacy and student achievement. Leadership and Policy in Schools, 3(3), 189-209.
U.S. Department of Education. (2016). www2.ed.gov
95
Vantine, L (2016), Reconceptualizing academic support. Independent School 75(3), 100-106.
Ware, H.W. & Kitsantas, A. (2011). Predicting teacher commitment using principal and teacher efficacy variables: an HLM approach. The Journal of Educational Research, 104, 183-193.
Weiss, I.R., Knapp, M.S., Hollweg, K.S., & Burrill, G. (Eds.), (2001), Investigating the influence of standards: A framework for research in mathematics, science, and technology education, Washington, DC: National Academy Press.
Wilhem, T. (2016). Not just striving, but thriving. Leadership, 45(4), 24-28.
Wilson, S.M., Floden, R.E., & Ferrini-Mundy, I. (2002). Teacher preparation research: An insider'’ view from the outside. Journal of Teacher Education, 53(3), 190-204.
Woltman, H., Feldstain, J., MacKay, C., & Rocchi, M. (2012). An introduction to hierarchical linear modeling. Tutorials in Quantitative Methods for Psychology, 8(1), 52-69.
Yahaya, A., Yahaya, N., Ramli, J., Hashim, S., & Zakariya, Z. (2010). The effects of various modes of school formality culture and student learning style with secondary students academic’s achievements. International Journal of Psychological Studies 2(1), 96-106.
Zmuda, A., Kuklis, R., & Kline, E. (2004). Transforming schools: Creating a culture of continuous improvement. Alexandria, VA: Association for Supervision and Curriculum Development.