Embed Size (px)
Citation preview
The impact of informal employment on the subjective social status
Anna A. Zudina, junior research fellow, Centre for Labor Market Studies (CLMS)Academic Supervisor: Professor Vladimir E. Gimpelson (CLMS)

Structure of presentation Motivation for research Informal employment: key points of theory and research
evolution Advancing new approach to the analysis Aim of research Key research questions Data Research question 1:
Methodology and data Descriptive analysis Multinominal logit analysis
Research question 2: Methodology and data Descriptive analysis OLS analysis
Discussion
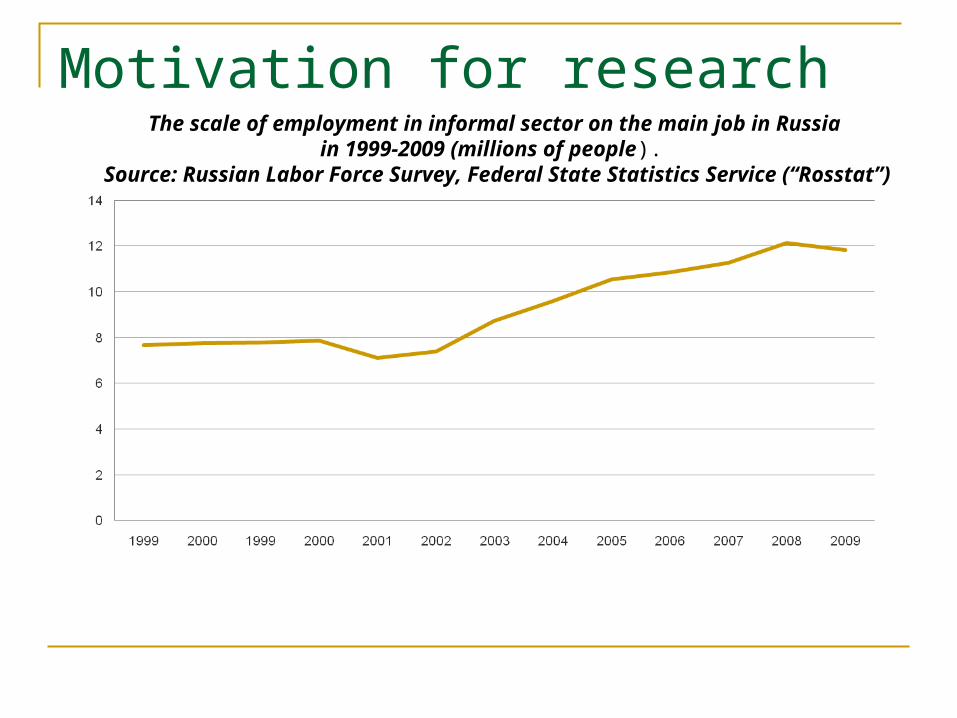
Motivation for researchThe scale of employment in informal sector on the main job in Russia
in 1999-2009 (millions of people). Source: Russian Labor Force Survey, Federal State Statistics Service (“Rosstat”)
Motivation for research Large literature about informal employment exists,
but still there is no consensus about major characteristics of informality, its causes, consequences and its whole nature.
Specifically, little is known about the actual social position of informally employed workers and social consequences of informality.
The direct comparison of levels of income in formal and informal sectors has been highly criticized.
The elaboration of a new approach to investigation based on the indirect indicators – on the subjective perceptions of social position – and thus contribution to the understanding of informal employment.

Informal employment: key points of theory and research evolutionEconomic approaches: The concept of “informality” was introduced by British
anthropologist Keith Hart (1970; 1973) - low-qualified and underpaid self-employment.
Harris-Todaro theoretical model of dual labor market (1970).
The first revision – Gary Fields (1990), informal employment appear to be very heterogeneous itself.
The second revision – William Maloney (2004), informality can be characterized by certain benefits which make it more preferable for certain groups of workers.
Empirical studies showed that two categories of informally employed also differ greatly - informal wage and salary workers and informal self-employed [Maloney, 2004].

Informal employment: key points of theory and research evolutionIn developed countries: Initially – secondary labor market discussion; peripheral jobs
[Portes, Sassen-Koob, 1987; Mingione, 1990; Cox, Watt, 2002; Edgcomb, Thetford, 2004].
The combination of different factors [Gerxhani, 2004]. – economic (the absence of employment registration, tax evasion, the enterprise size); political (the lack of government regulation); statistical (systematical distortion in GNP measurement); social (autonomy or flexibility of employment, lack of access to social protection; occupational status);
The relatively high extension of informality in the Mediterranean counties - Italy, Spain, Portugal, Greece, Cyprus – in the form of micro entrepreneurship and self-employment. In continental European countries – increase in informality due to the inclusion of migrants into the least regulated labor market segments.
Non-standard (atypical, unstable) employment discussion, change in the dominant form of labor relations.

Informal employment: key points of theory and research evolutionIn transition countriesVery different sources.A) gap between the increasing regulation and the limited
institutional capacity of enforcers to ensure compliance with the rules (delays in wage payment in Russia of 1990s - [Earle, Sabirianova Peter, 2009] );
B) total unemployment while formal social security system is weak (self-employment - household production of goods for sale- as the only alternative) [Earle, Sakova, 2000; Kapeliushnikov, 2006];
C) institutional environment remains aggressive and ineffective (the unregistered micro-entrepreneurship);
D) individuals are hired by micro-entrepreneurs;E) underdevelopment of formal sector and ineffective
institutions (growing demand of households for various services promotes the informal supply of these services).

Informal employment: key points of theory and research evolutionIn transition countries In more wealthy countries of Central and Eastern
Europe informality appears as a way of avoiding high taxes and heavy regulation [Bernabe, 2008].
In less wealthy transition countries – as a last employer for those who have lost their jobs in the formal sector and can’t rely on the system of unemployment assistance [Bernabe, 2008].
Ukraine – relatively low level of self-employment while the level of informal wage and salary work remains significant and increases [Lehmann and Pignatti, 2007].

Informal employment: key points of theory and research evolutionNew methodological turn – the dynamic approach
The analysis of the flows of workers who change their labor market status [Bosch, Maloney, 2005; Bosch, Goni, Maloney, 2007] and the consequences of these shifts.
Clear methodological advantages: controlling for unobservables, solving the endogeneity problem to some extent [Perry et al., 2007].
The comparison of levels of income before and after the move into informality [Perry et al., 2007].
The comparison of subjective indicators - job satisfaction [Pages, Madrigal, 2008; Perry et al., 2007] and subjective well-being and subjective welfare [Perry et al., 2007; Ferrer-i-Carbonell, Gerxani, 2008; Beuran, Kalugina, 2006].
Quite contradictory results were received.
Advancing new approach to the analysis The importance of new in-depth analysis of the consequences of the
informal employment shifts using the concept of subjective social status. Social stratification research – the concept of subjective social class
(SSC), an instrument of class consciousness measurement [Centers, 1949; Jackman, Jackman, 1973].
SSC – represent “individuals’ perceptions of their social position within a hierarchy” [Jackman, Jackman, 1973].
Little distinction between “class” and “status” concepts, both appealing to a position in a system of social inequality. SSC, as put in [Jackman, Jackman, 1973], –” the individual's perception of his own position in the status hierarchy”.
Connection between occupation and SSS - one of the traditional research directions studied here [Centers, 1949; Murphy, Morris, 1961; Goldman et al., 2005; Lindemann, 2007; Gross, 2003].
Changes in the SSS are widely considered to be informative indicator of economic and social dynamics [Jackman, 1979].
Subjective perceptions influence the individual’s behavior in various spheres and their relationship with others [Della Fave, 1980; Shepelak, 1987].
They can be employed as an indirect indicator of the actual changes. Social position as a multidimensional location in different fields (power,
respect, well-being) [Kluegel, Singleton, Starnes, 1977]. New insights into the question about the nature of informal employment.
Aim of research
To analyze the dynamics of self-perceptions of those who shift between formal and informal employment, and thus examine the interconnections between informal employment and subjective perceptions of social position
Key research questions: What were the scale, dynamics and structure of informal
employment in Russia in 2000s?
What are the main features of informal employment compared to formal employment when it deals with subjective perceptions of social position? Does employment in formal/informal sector affects the subjective perceptions of social status?
Do subjective perceptions of social position change after the transition of the worker into informal employment from the state of employment in formal sector? Do they change after the vice-versa transition?
DataRussia Longitudinal Monitoring
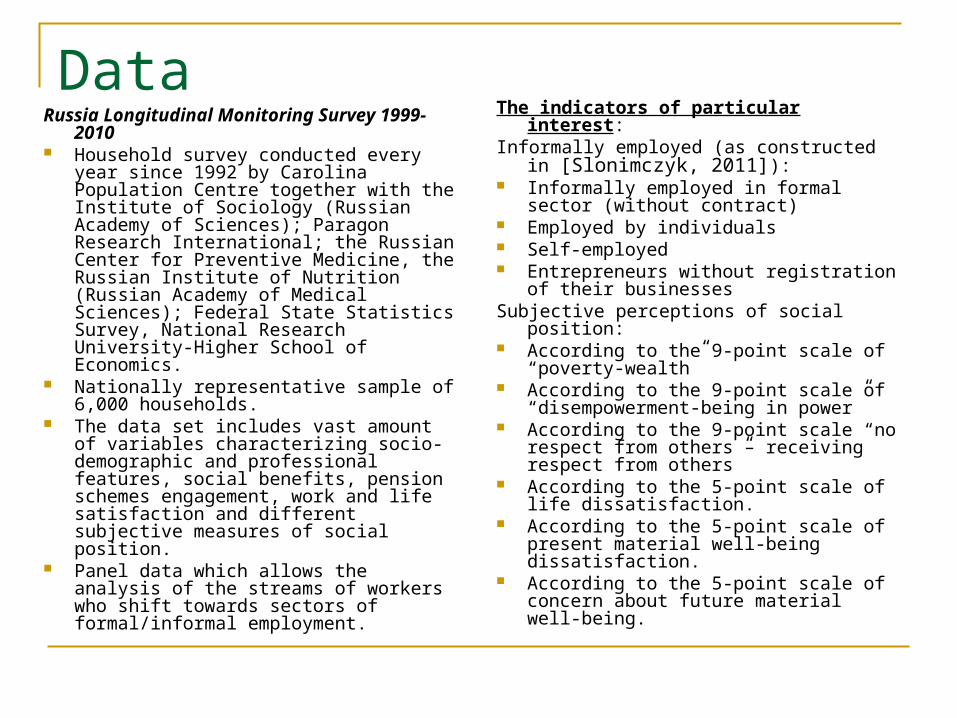
Survey 1999-2010 Household survey conducted every
year since 1992 by Carolina Population Centre together with the Institute of Sociology (Russian Academy of Sciences); Paragon Research International; the Russian Center for Preventive Medicine, the Russian Institute of Nutrition (Russian Academy of Medical Sciences); Federal State Statistics Survey, National Research University-Higher School of Economics.
Nationally representative sample of 6,000 households.
The data set includes vast amount of variables characterizing socio-demographic and professional features, social benefits, pension schemes engagement, work and life satisfaction and different subjective measures of social position.
Panel data which allows the analysis of the streams of workers who shift towards sectors of formal/informal employment.
The indicators of particular interest:Informally employed (as constructed in
[Slonimczyk, 2011]): Informally employed in formal sector
(without contract) Employed by individuals Self-employed Entrepreneurs without registration
of their businesses Subjective perceptions of social
position: According to the 9-point scale of
“poverty-wealth” According to the 9-point scale of
“disempowerment-being in power” According to the 9-point scale “no
respect from others – receiving respect from others”
According to the 5-point scale of life dissatisfaction.
According to the 5-point scale of present material well-being dissatisfaction.
According to the 5-point scale of concern about future material well-being.

DataRussian Labor Force Survey
1999-2009 Household survey conducted by
Federal State Statistics Survey quarterly, and since September 2009 – monthly.
Large nationally and regionally representative samples (more than 270,000 people per year).
The period of 1999-2009 – minimal changes in methodology and the opportunity to analyze the reaction of LM both to economic growth and crisis.
The data set includes vast amount of variables characterizing the employment features and the position on the LM.
The indicator of employment in the informal sector constructed according to ILO methodology.
The indicator of particular interest:
Informally employed: Employed by individuals
(informal wage and salary workers)
Unincorporated entrepreneurs Self-employed Employed in own household
producing goods for sale Employed on unincorporated
farms or without the registration of enterprise

Research question 1: methodology and data The analysis of the scale, dynamics and
structure of informal employment in Russia in 2000s.
Russia Longitudinal Monitoring Survey 2000-2009; Russian Labor Force Survey 2000-2009.
Two stages - 1)descriptive analysis and 2) multinominal logit analysis.
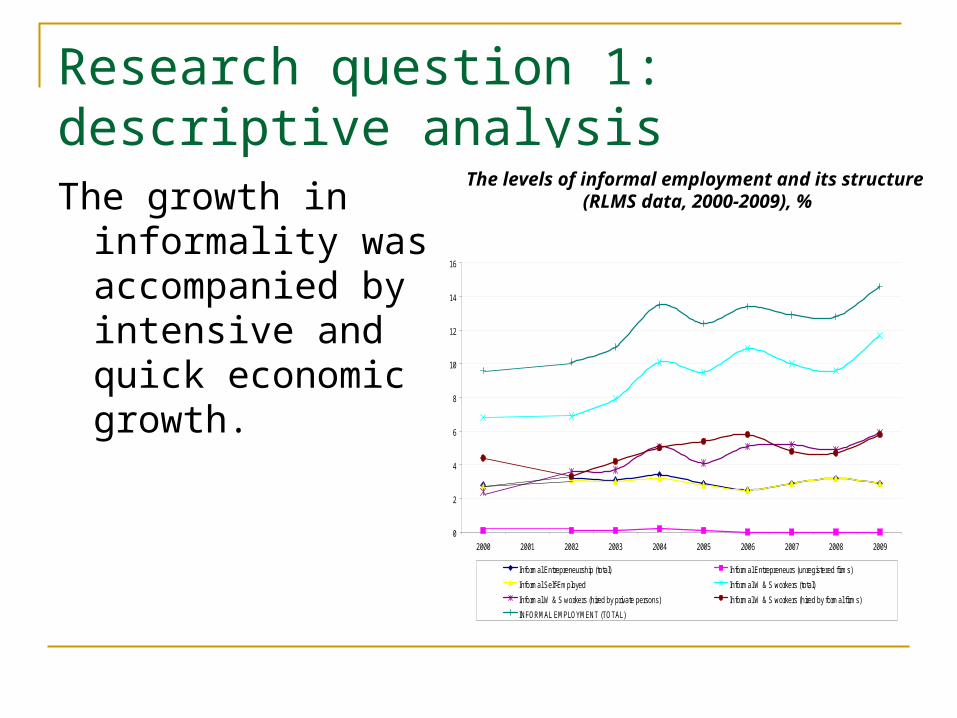
Research question 1: descriptive analysisThe growth in
informality was accompanied by intensive and quick economic growth.
0
2
4
6
8
10
12
14
16
2000 2001 2002 2003 2004 2005 2006 2007 2008 2009
Informal Entrepreneurship (total) Informal Entrepreneurs (unregistered firms)
Informal Self-Employed Informal W & S workers (total)
Informal W & S workers (hired by private persons) Informal W & S workers (hired by formal firms)
INFORMAL EMPLOYMENT (TOTAL)
The levels of informal employment and its structure (RLMS data, 2000-2009), %

Research question 1: descriptive analysisThe growth in
informality was largely supplied by the increase in the total amount of wage and salary workers while entrepreneurial activity appears to demonstrate low elasticity to the GDP growth.
Dynamics and structure of informal employment (1999-
2009), thousands of people, LFS data
0
2000
4000
6000
8000
10000
12000
14000
1999 2000 2001 2002 2003 2004 2005 2006 2007 2008 2009
Employed in own firm Employed on unincorporated farms
Unincorporated entrepreneurs Employed by individuals (informal wage and salary workers)
Self-employed Employed in own household producing goods for sale
Total
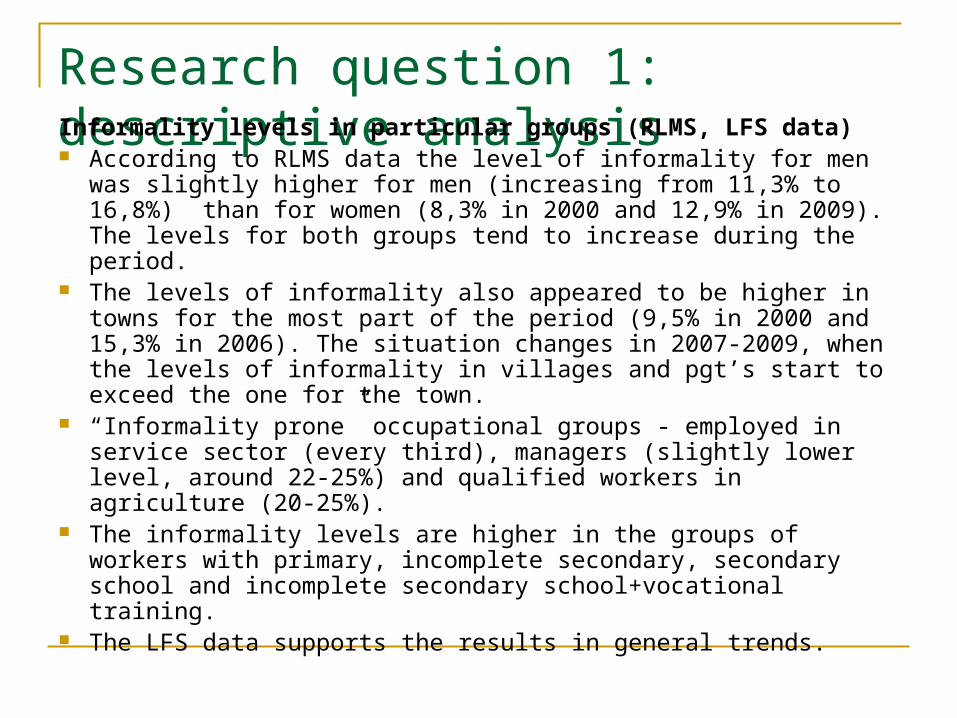
Research question 1: descriptive analysisInformality levels in particular groups (RLMS, LFS data) According to RLMS data the level of informality for men was
slightly higher for men (increasing from 11,3% to 16,8%) than for women (8,3% in 2000 and 12,9% in 2009). The levels for both groups tend to increase during the period.
The levels of informality also appeared to be higher in towns for the most part of the period (9,5% in 2000 and 15,3% in 2006). The situation changes in 2007-2009, when the levels of informality in villages and pgt’s start to exceed the one for the town.
“Informality prone” occupational groups - employed in service sector (every third), managers (slightly lower level, around 22-25%) and qualified workers in agriculture (20-25%).
The informality levels are higher in the groups of workers with primary, incomplete secondary, secondary school and incomplete secondary school+vocational training.
The LFS data supports the results in general trends.

Informality levels: self-employed vs. wage and salary workers No particular differences between self-employed and wage and
salary workers in terms of gender. The levels of informality are higher for males in both informal
employment categories, however the levels of informality are higher in informal wage and salary group.
Informal wage and salary workers appear to be less educated when compared to informal self-employed (but the latter group is very heterogeneous).
Workers belonging to the occupational group of managers (20-22%) and the qualified workers in agriculture (17-19%) have significantly higher levels of informal self-employment.
The risk of informal wage and salary work is higher for the employed in service sector (25%), craftsmen (9-15%) and general workers (9-20%).
The self-employed are generally older. In 2000-2009 both mean estimates tend to decrease while the age
gap still exists. In 2000 the mean age of SE - 36 years and the mean age of Informal W & S – 33 years. In 2009 – 31 and 27, respectively.
Research question 1: descriptive analysis
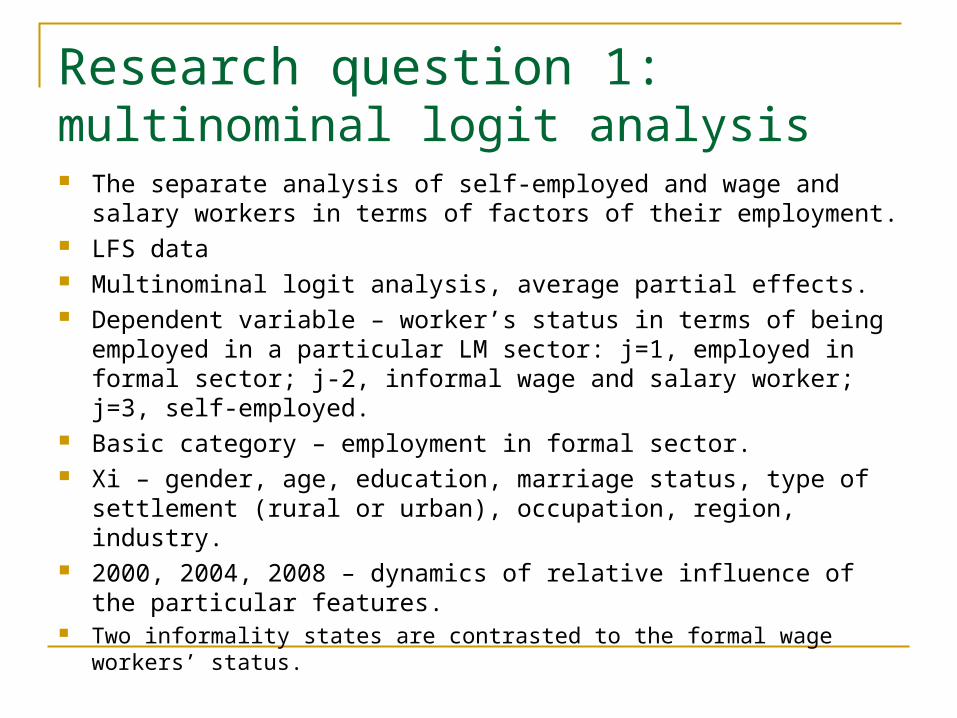
Research question 1: multinominal logit analysis The separate analysis of self-employed and wage and salary
workers in terms of factors of their employment. LFS data Multinominal logit analysis, average partial effects. Dependent variable – worker’s status in terms of being
employed in a particular LM sector: j=1, employed in formal sector; j-2, informal wage and salary worker; j=3, self-employed.
Basic category – employment in formal sector. Xi – gender, age, education, marriage status, type of
settlement (rural or urban), occupation, region, industry. 2000, 2004, 2008 – dynamics of relative influence of the
particular features. Two informality states are contrasted to the formal wage workers’
status.
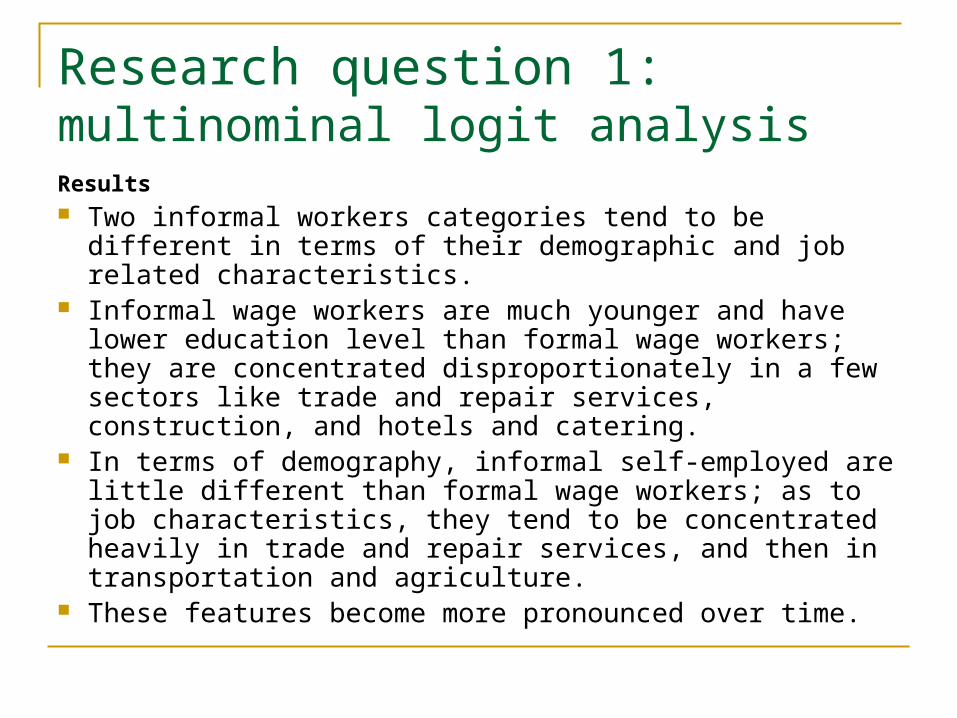
Research question 1: multinominal logit analysisResults Two informal workers categories tend to be different in
terms of their demographic and job related characteristics.
Informal wage workers are much younger and have lower education level than formal wage workers; they are concentrated disproportionately in a few sectors like trade and repair services, construction, and hotels and catering.
In terms of demography, informal self-employed are little different than formal wage workers; as to job characteristics, they tend to be concentrated heavily in trade and repair services, and then in transportation and agriculture.
These features become more pronounced over time.
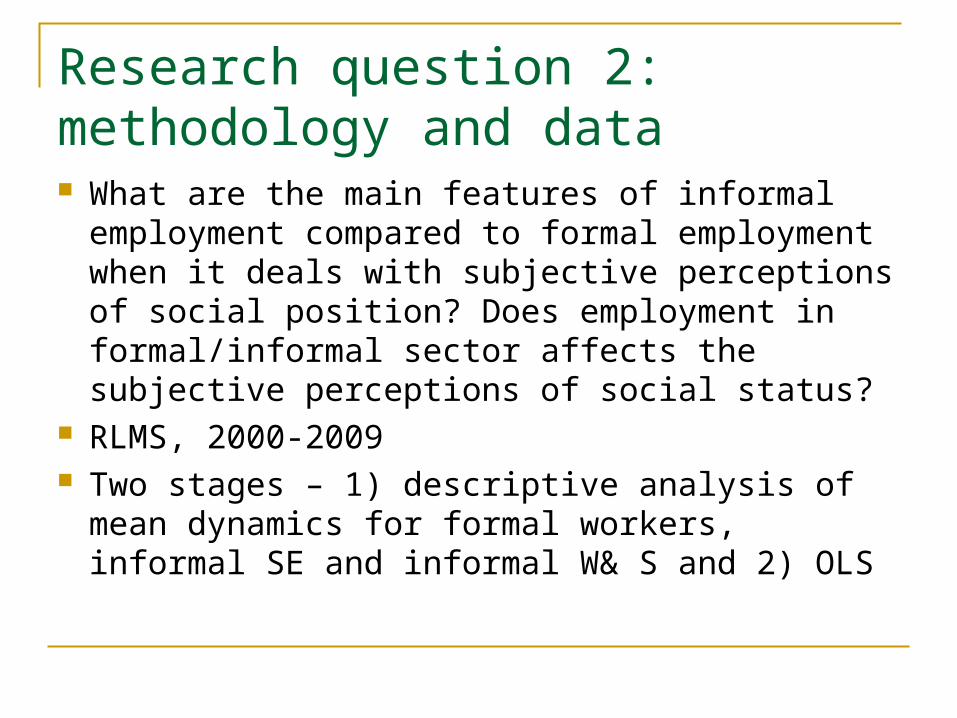
Research question 2: methodology and data What are the main features of informal
employment compared to formal employment when it deals with subjective perceptions of social position? Does employment in formal/informal sector affects the subjective perceptions of social status?
RLMS, 2000-2009 Two stages – 1) descriptive analysis of mean
dynamics for formal workers, informal SE and informal W& S and 2) OLS

Research question 2: descriptive analysis The 9-point scale of “poverty-wealth”: estimates
vary approximately on the same level; they are concentrated in the middle of the scale (4.5-5); the mean estimates of the informal SE are higher; the formal sector workers and informal W & S workers appear to be very similar.
The 9-point scale of access to power : the means are very low for all workers (3.3-3.6); the means of the SE are the highest, while the informal W & S workers tend to express the lowest subjective power estimates.
The 9-point scale of respect: the means are rather high for all workers (6-6.4); the means for the informal SE again are higher while the informal W & S workers express the lowest subjective respect estimates.

Research question 2: descriptive analysis The 5-point subjective life dissatisfactin scale: the
levels of dissatisfaction were rather high in all three categories (3-3.7); the tendency to the decrease of the means in 2000-2009 can be noted; level of life dissatisfaction is highest among the informal W &S workers while the informal SE represent the group most satisfied with life.
The 5-point scale of concern about future material well-being: rather high in all three groups; SE express slightly lower levels of concern in general; informal W&S workers and formal workers are very similar.
The 5-point scale of present material well-being dissatisfaction: mean estimates were concentrated around 3.7-4; overall tendency to some decrease of these levels; SE in general expressed lower levels of dissatisfaction while formal workers and informal W&S workers reported similar mean estimates.
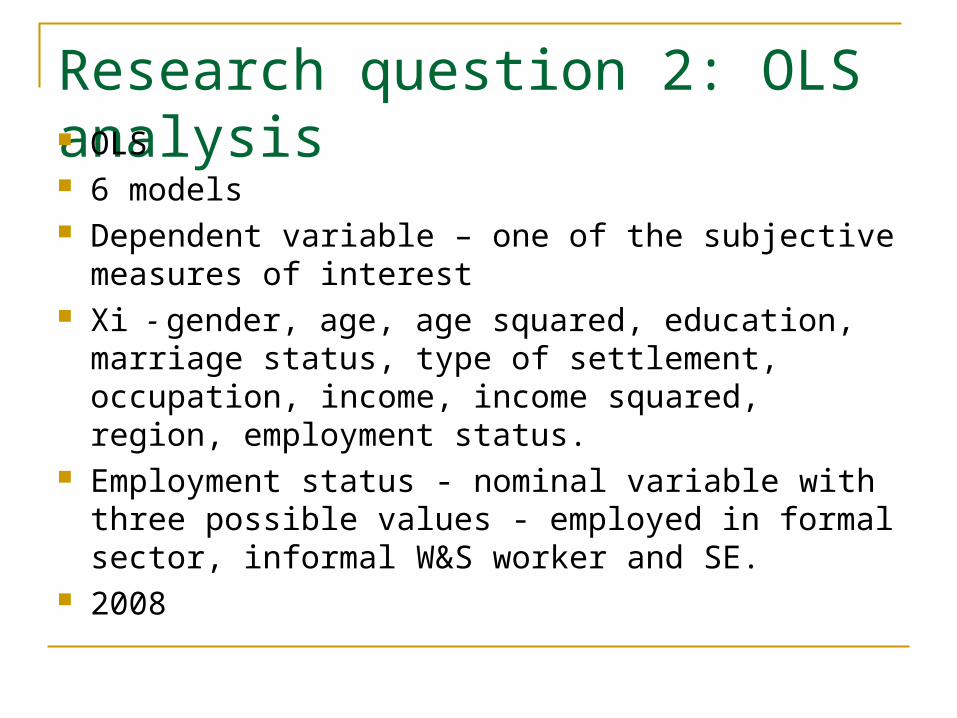
Research question 2: OLS analysis OLS 6 models Dependent variable – one of the subjective
measures of interest Xi - gender, age, age squared, education,
marriage status, type of settlement, occupation, income, income squared, region, employment status.
Employment status - nominal variable with three possible values - employed in formal sector, informal W&S worker and SE.
2008

Research question 2: OLS analysisResults Analysis showed no significant difference
between the employment categories in terms of subjective respect and power.
In other 4 estimated models there was found no significant difference between informal W & S workers and formal sector workers.
SE were significantly different from those employed in formal sector tending to express higher levels of satisfaction and lower levels of concern.

Discussion Informality doesn’t negatively affect social status
perceptions of people engaged in it. When the effect shows (for SE) it is rather positive. The limitations of the analysis conducted: The analysis was made only for the employed part
of the sample. Analysis of different sub-groups of the employed
sample- respective subjective measures, their distribution, means and dynamics – should be made.
The OLS analysis only for one year –the dynamics should be considered.
Special features of people engaged in any kind of entrepreneurship can partially explain these significantly higher subjective estimates.

Discussion Indirect indicator of the quality of Russian
formal labor market system. Large amount of employed population so
far appears to be dissatisfied and expresses low levels of subjective levels of wealth and power regardless of their formal/informal labor market status.
The signal of the great weakness of Russian labor market institutions and the idle channels of social mobility that are situated in the formal sector.

Appendix 1

Average Partial Effects,%

Average Partial Effects,%
Note:*** p<0.01, ** p<0.05, * p<0.1

The influence of age on the type of informal employment, APE, %
Informal Wage and Salary Work
-2
-1
0
1
2
3
4
5
6
7
8
15-19 20-29 30-39 40-49 50-59 60-72
2000 2004
2008
Informal Self-employment
-1.5
-1
-0.5
0
0.5
1
1.5
2
2.5
15-19 20-29 30-39 40-49 50-59 60-72
2000
2004
2008

The influence of education on the type of informal employment, APE, %Informal Wage and Salary Work
0
2
4
6
8
10
12
14
High.Prof Incompl. High.Prof Vocat. Primar. Prof Second. (compl) Basic General Elementary Gen.or None
2000 2004 2008
Informal Self-employment
-2.5
-2
-1.5
-1
-0.5
0
0.5
1
1.5
2
High.Prof Incompl. High.Prof Vocat. Primar. Prof Second. (compl) Basic General Elementary Gen.or None
2000 2004 2008

The influence of occupation on the type of informal employment, APE, %Informal Wage and Salary Work
0
2
4
6
8
10
12
14
16
18
20
ISCO_1 2 3 4 5 6 7 8 9
2000 2004 2008
-8
-7
-6
-5
-4
-3
-2
-1
0
ISCO_1 2 3 4 5 6 7 8 9
2000 2004 2008
Informal Self-employment