Embed Size (px)
Citation preview
The impact of informal contacts on communication in hierarchical
organizations Modeling small-worldliness in a hierarchical network
Remko Arts
312553
HAIT Master Thesis series nr. 11-016
THESIS SUBMITTED IN PARTIAL FULFILLMENT OF THE REQUIREMENTS FOR THE DEGREE OF
MASTER OF ARTS IN COMMUNICATION AND INFORMATION SCIENCES, MASTER TRACK HUMAN ASPECTS OF INFORMATION TECHNOLOGY,
AT THE SCHOOL OF HUMANITIES OF TILBURG UNIVERSITY
Thesis committee: Prof. dr. E.O. Postma Prof. dr. A. Plaat A.P.C.I. Hong MA
Tilburg University School of Humanities
Department of Communication and Information Sciences Tilburg center for Cognition and Communication (TiCC)
Tilburg, The Netherlands
December 2011

1

2
Preface
Graduating is wonderful, I can tell from experience. When I graduated for my Bachelor of ICT at Fontys University of Applied Sciences several years ago, however, I felt I wanted to acquire more depth, background and a more critical point of view. Though my study ‘Human Computer Interaction’ had provided me a solid background in IT, I felt I was missing the edge. Graduation was a milestone, but not the end of formal education.
After a few twists and turns I decided to start a Master’s in Human Aspects of IT, a decision that soon proved to be the right one. The incredible enthusiasm and expertise of my professors at Tilburg center for Cognition and Communication (TiCC) inspired me a lot and totally got me even more involved in natural language technology, artificial intelligence, human cognition, text mining and evolution of the internet. I am certain I will always keep my interest in these fields of study. The staff at Tilburg University also inspired me to be more concise, thorough and self-critical. This thesis will not be a milestone, but a completion of my studies.
During my years at Tilburg university, I learned a lot from my work at AskNow Solutions, where my colleagues gave me the room to combine studying with an almost fulltime job. I was lucky to have the opportunity to manage my own projects and customers and I participated in the design of several wonderful products. Ramon, Bas, Laura, Rob, Martine, and Christian, we did awesome stuff (and you still do!). Thanks.
This thesis would have been impossible to write without the insightful advice of both of my thesis supervisors; Aske Plaat and Eric Postma. The combination of your fields of expertise helped me to make this thesis what it is now. Thanks for answering all my questions at all time, and allowing me to leave with even more of them. They often gave me the footholds to continue searching in the right direction. Alain Hong, the title page wears your initials with style now. HiTiME group: Antal van den Bosch, Kalliopi Zervanou, Matje van de Camp, Steve Hunt. Things do not always go as planned. Thanks for your support.
I also want to thank: Menno van Zaanen, your quick help with coding the graph output in R was invaluable; Joppe, Peter, Ellen, your reviews of (the early versions of) my thesis helped me a lot; Bibi, Jasper, thanks for listening. Simon, you helped me focus and kept me going. I want to conclude thanking all of my friends whom missed me during get-togethers while I was writing. I was with you on Facebook, and also enjoyed the pictures.
Finally, I want to thank my family for being there when I was around, and missing me when I was not. Mum, dad, your faith and support through the years has been astonishing. Ivo, reviewing and reflecting with you provided me really valuable bright moments. You can do this, too!
I will enter the professional world and leave academia behind for now, but I hope that as a casual, ad hoc contact, I will stay connected to the wonderful people who inspired, taught, worked and had great fun with me, since informal contacts are the most valuable assets in the enormous social networks of our lives.
Remko
3
Abstract
Informal communication between employees is generally believed to contribute to the sharing of knowledge and expertise (Brzozowski, 2009; Dörner, Pipek, & Won, 2007; John & Seligmann, 2006), to increase team productivity when dealing with complex tasks (Wu, Waber, Aral, Brynjolfsson, & Pentland, 2008), and to spur creativity (Uzzi & Spiro, 2005). In this thesis, a model of a purely hierarchical organizational communication structure is presented in order to investigate the impact of informal connections on the communication efficiency in organizations. The problem statement addressed reads: “How do informal contacts impact the communication efficiency of a hierarchical organizational communication structure”?
The presented model is inspired by Mintzberg’s organization theory (Mintzberg, 1983) and simulates communication by means of a hierarchical network of communicators (vertices) and communication lines (edges). In our simulations, strictly hierarchical networks are gradually ‘informalized’ by randomly rewiring edges (cf. Watts & Strogatz, 1998). The impact of the rewiring (i.e., the introduction of informal contacts) on the efficiency of networks is quantified by their clustering coefficient (Holland & Leinhardt, 1971), characteristic path length (Dijkstra, 1959) and their ratio, the small-worldliness (Walsh, 1999) of the resulting network. Efficient communication structures are reflected in a large clustering coefficient, a low characteristic path length, and a high degree of small-worldliness.
Simulation results indicate that hierarchical communication networks in are already very efficient in terms of clustering and characteristic path length. Hierarchical networks with a few layers benefit only slightly from random rewires, in for many-layered networks, rewiring increases small-worldliness. We conclude that: (1) for large organizations, informal contacts play an invaluable role since they help to minimize communication path lengths while keeping organizational teams clustered, and (2), for smaller organizations the decrease in communication path length coincides with a decrease in clustering of teams.
There are several limitations that prevent practical application of this theoretical simulation model. Future research could enhance the realism of the model by adding for example the size of second and third-degree, quality of transferred information and replacing the hierarchical model with more realistic communication structures. Also, there has been no verification with any practical situations. Despite this, the study proved salient by exposing several effects of small-worldliness on hierarchical communication networks and providing a model that can be extended to aid future studies.
4
Table of Contents
1 Introduction .................................................................................................................................................. 5 1.1 Problem statement ............................................................................................................................ 5 1.2 Research questions ............................................................................................................................ 6 1.3 Research approach ............................................................................................................................ 6 1.4 Thesis outline ..................................................................................................................................... 7
2 Hierarchical small-world networks ............................................................................................................ 8 2.1 The small-world experiment ............................................................................................................ 8
3 The hierarchical network model .............................................................................................................. 11 3.1 Parameters ........................................................................................................................................ 11 3.2 Constructing the hierarchical network ......................................................................................... 11 3.3 Random rewiring ............................................................................................................................. 12 3.4 Measured variables .......................................................................................................................... 13 3.5 Assumptions..................................................................................................................................... 14
4 Experimental setup .................................................................................................................................... 16 4.1 Experiment 1: Watts & Strogatz and small-worldliness ............................................................ 16 4.2 Experiment 2: Randomly rewiring a hierarchical network ........................................................ 17 4.3 Experiment 3: Persistent hierarchical structure .......................................................................... 18 4.4 Experiment 4: Varying hierarchy depth ....................................................................................... 18
5 Results .......................................................................................................................................................... 19 5.1 Experiment 1: Watts &Strogatz and small-worldliness .............................................................. 19 5.2 Experiment 2: Randomly rewiring a hierarchical network ........................................................ 21 5.3 Experiment 3: Persistent hierarchical structure .......................................................................... 23 5.4 Experiment 4: Varying hierarchy depth ....................................................................................... 25 5.5 Summary of results ......................................................................................................................... 27
6 Discussion ................................................................................................................................................... 28 6.1 Interpretation of results ................................................................................................................. 28 6.2 Limitations of results ...................................................................................................................... 28 6.3 Future research ................................................................................................................................ 29
7 Conclusions ................................................................................................................................................. 30 7.1 Modeling a hierarchical communication network....................................................................... 30 7.2 Consequences of random connections........................................................................................ 30 7.3 Hierarchy variations ........................................................................................................................ 31 7.4 Final words ....................................................................................................................................... 31
References .............................................................................................................................................................. 33 Appendix 1: Experiment 1 results ...................................................................................................................... 36 Appendix 2: Experiment 2 results ...................................................................................................................... 37 Appendix 3: Experiment 3 results ...................................................................................................................... 38 Appendix 4: Experiment 4a results .................................................................................................................... 39 Appendix 5: Experiment 4b results ................................................................................................................... 40 Appendix 6: NetLogo code (non-persistent model) ....................................................................................... 41 Appendix 7: NetLogo code (persistent model) ................................................................................................ 48
5
1 Introduction
In some sense, the world is getting smaller. Working environments change from strict production oriented systems to networked organizations where people meet at the coffee machine, send emails and connect on (corporate) social networks to seek expertise and share thoughts and ideas. These informal connections are formed as a result of shared interest, rather than as a result of organization structure. On a personal level, informal connections can connect an employee to someone outside the group of colleagues, superiors and subordinates, potentially reaching (far) across the traditional organizational structure. Informal contacts can thereby indirectly connect the employee to an entirely new group of people, ideas, and skills.
Previous studies on teams and organizations have indicated that informal contacts increase worker productivity and creativity (Collins & Randall, 1998; Uzzi & Spiro, 2005), especially for complex tasks requiring tacit knowledge (Wu, Waber, Aral, & Brynjolfsson, 2008) and may even be vital for an organization’s processes (Krackhardt & Hanson, 1993; McMillan, 2002). Also, they provide people with information that is only available far from their own network of formal contacts (Granovetter, 1973; Bian, 1997). Implementation of corporate social networking tools or even simply the placement of a coffee machine or water cooler can contribute to the sharing of expertise (Brzozowski, 2009; Dörner, Pipek, & Won 2007; John & Seligmann, 2006). These studies all indicated the importance of informal connections and their ability to directly affect the efficiency of communication in organizations, but do not provide insight into the mechanisms relating informal connections to communication efficiency.
Gaining an understanding of these mechanisms is hampered by the complexity of organizations. Therefore, a model that is restricted to a specification of the network of formal and informal contacts in an organization, in which communication efficiency can be measurable without inference, is preferred. Networks models have been used to describe, predict and generalize the behavior of interconnected components in many application domains. Computer science (Faloutsos, Faloutsos, & Faloutsos, 1999), social science (Rapoport & Horvath, 1961), biology (Jeong, Tombor, Albert, Oltvai, & Barababasi, 2000) and chemistry (Wagner & Fell, 2001) all provide their examples of how parts of a whole relate to each other; visual representations of such networks can be found easily in both scientific and popular literature. Using a modeling environment allows for a strict analysis of the impact of informal connections, without the noise that could influence empirical studies of existing situations.
Since the 1950s, network graphs have become a popular method of modeling, especially for information and disease propagation. There was much attention for quantitative analysis of network graphs in terms of probability distributions and randomness, and graph theory became a resourceful field of study that was no longer solely harvested by mathematicians, but by scientists from many disciplines. Graph theory also gained great interest among sociologists (Milgram, 1967; Pool & Kochen, 1978), and quantitative methods using graphs theory became widely used in the analysis of friendships and communication webs. Mathematicians, on their turn, “began to think of graphs as the medium through which various modes of influence –information and disease in particular– could propagate” (Newman, Barabási, & Watts, 2006). We will use network models to analyze the effect of informal connections on the organizational communication structure. Since most organizations are typically hierarchically organized (Mintzberg, 1983), we focus on hierarchical networks.
1.1 Problem statement We investigate the effect of informal contacts on organizational communication networks by presenting the following problem statement:
How do informal contacts impact the communication efficiency of a hierarchical organizational communication structure?
6
The three components that constitute the problem statement (namely informal contacts, communication efficiency, and organizational communication structure) will be further in Paragraph 1.3 in this Chapter.
1.2 Research questions We state three research question that address our problem statement:
RQ 1: How should the effect of informal contacts on communication efficiency in hierarchical organizations be modeled?
RQ 2: Does the efficiency of organizational communication networks change when informal connections are formed?
RQ 3: Do informal connections affect different organizational communication structures equally?
The first research question is already addressed in Chapter 3. The second and third research question are investigated by the experiments described in Chapter 4. All research questions are be answered in Chapter 7.
1.3 Research approach In order to answer the research questions, our approach is to perform simulations of the communication network. In each simulation, a regular network is restructured by the reassignment of informal contacts (connections) and the effect on communication efficiency is assessed.
The initial network; a simplified, abstract organizational communication structure, is influenced by adding informal contacts. The formal structure consists of two parts. Firstly, organizations are typically hierarchically organized (Mintzberg, 1983). Therefore we use a hierarchical structure to represent organizational, formal communication structure. Secondly, teams in organizations are often fully connected subgroups (Hansen, 1999) called cliques, or clusters. This will be represented by interconnecting all agents under the same manager.
Informal contacts (which often form after serendipitous meetings at the coffee machine (DiFonzo & Bordia, 2007)), are modeled as random connections (cf. Watts & Strogatz, 1998). They drastically decrease communication distance between workers, thereby effectively making the network “smaller”. This effect is called the small-world phenomenon and will be discussed in more detail in Chapter 2. The result of the decreased network size is the smaller average communication distance between two workers in the network and therefore the greater availability of information (Granovetter, 1973; Bian, 1997).
The efficiency of the communication networks is measured in terms of (team) clustering and communication distance. Tightly interconnected teams are generally considered valuable to an organization, as they have the property of transferring complex information and other resources among themselves efficiently (Granovetter, 1973; Krackhardt, 1992; Reagans & McEvily, 2003; Uzzi, & Spiro, 2005). A short communication distance means people in the organization have access to a larger part of the organization’s knowledge, thus it increases the knowledge available to each person in the organization (Wu et al, 2008). Also short communication distances increase the speed at which information propagates (Davis & O’Connor, 1976). In our study, we seek the combination of both tight connectedness between teams, and a short communication distance between people in the network.
The first challenge of our study lies in converting the three parts of the organizational problem
7
statement into a corresponding network model (research question 1). In order to answer research questions two and three, the constructed model will be used to examine the evolution of the organizational communication networks (research question 2), and the consequences of different hierarchical networks. The latter will be examined by running multiple tests with varying initial specifications (research question 3).
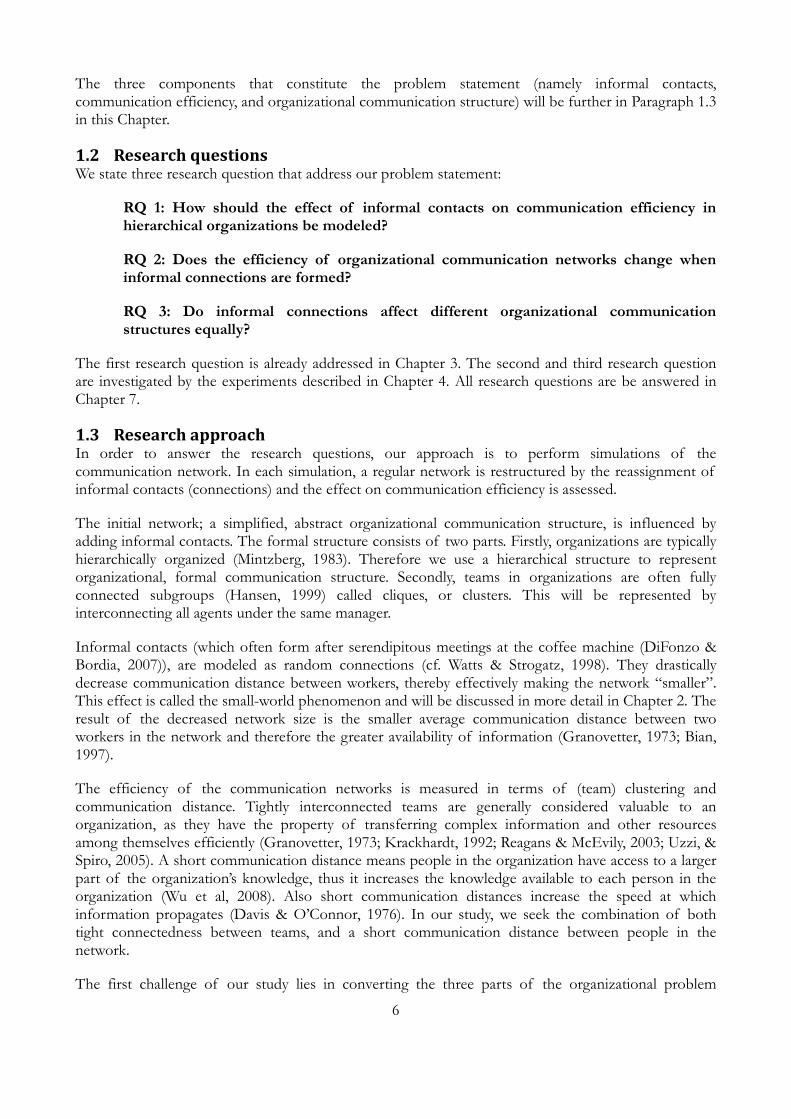
1.4 Thesis outline The structure of the thesis is illustrated in Figure 1. The figure shows the layered structure of our thesis, each addressing the problem statement at a different level. Chapter 1 provided a general introduction to the topic and presented the problem statement and research questions of our thesis. In Chapter 2 we explain the small-world network model by Watts and Strogatz (1998), which forms the technical basis for our thesis and how this connects to our organizational problem statement. In Chapter 3 the theory from Chapter 2 is used to construct a network model. Chapter 4, ‘Experimental setup’ describes how the simulation experiments were conducted, followed by their results and (network-) theoretical implications in Chapter 5. In Chapter 6, ‘Discussion’, we will return to organization theory and put the previously presented results back in an organizational perspective. We elaborate on the limitations of the experiments and recommendations for further research. Chapter 7 concludes this thesis by answering the three research questions and addressing the problem statement.
1. Introduction 2. Hierarchical small-world networks
Problem statement &
Research Questions
3. The network model Organizational ↕
Technical 4. Experimental setup Experiment 5. Results 6. Discussion 7. Conclusions
Figure 1: Thesis outline.
8
2 Hierarchical small-world networks
In this Chapter, we discuss the small-world network model of Watts and Strogatz (1998) that forms the inspiration for our model in Chapter 3. We examine how informal contacts (random connections) affect the efficiency of formal (regular) networks. Communication networks are considered efficient when (1) teams both remain strongly connected (a high degree of clustering) and (2) communication path lengths are short in proportion to the network’s total size. Networks that meet these requirements are called ‘small-world’ networks.
Watts and Strogatz (1998) rewired a ring-shaped regular network by adding random connections and adapt their experiment to include a hierarchical network and explain the different values that we measure.
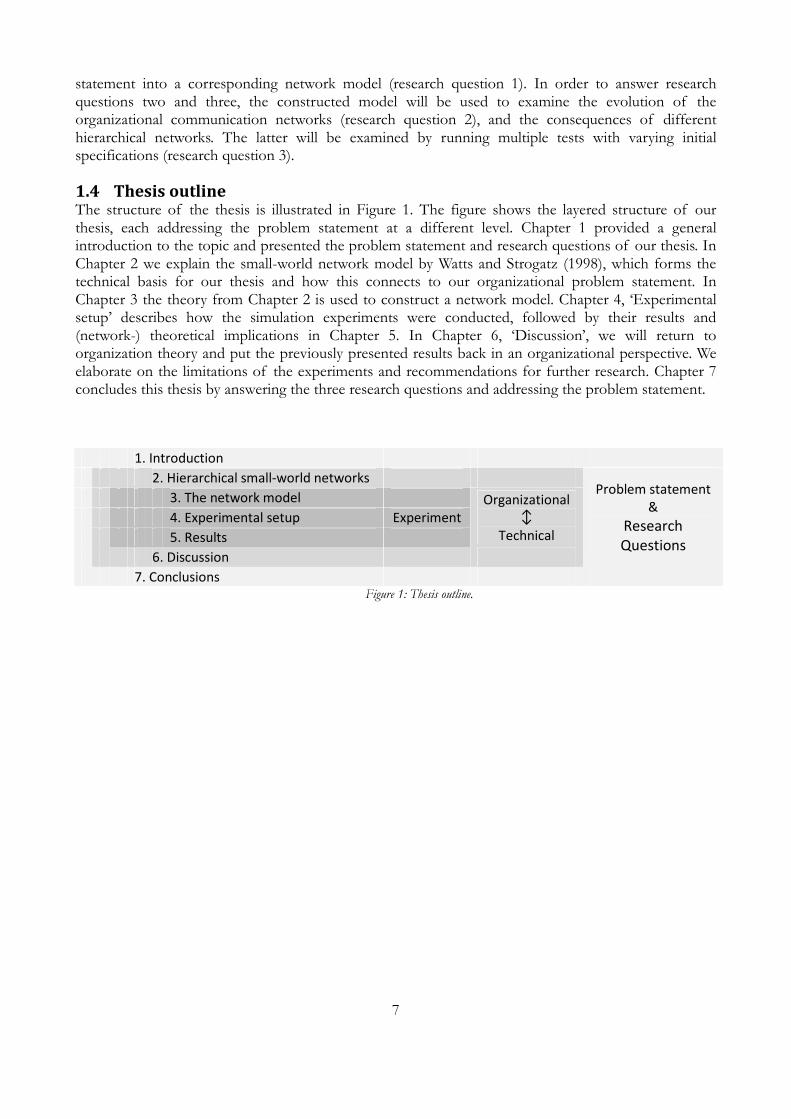
2.1 The small-world experiment Watts and Strogatz (1998) showed that adding random connections to a regular network can have extreme consequences for the factual properties of a regular network. In their experiment, they randomly rewired a fully regular network into a fully random network as illustrated in Figure 2.
Figure 2: Illustration of the rewiring procedure proposed by Watts and Strogatz By varying the rewiring probability p from 0 to 1, the network changes from regular, via small-world, to random. (Reproduced from Watts & Strogatz, 1998).
It was in between those two states where they found similarities with many real world systems, including technological, biological and social networks. Small-world systems are highly clustered (like a regular network), but have a small characteristic path length (like random networks). This type of network was named the ‘small-world’ network, after the small-world phenomenon (Milgram, 1967; Pool & Kochen, 1978).
9
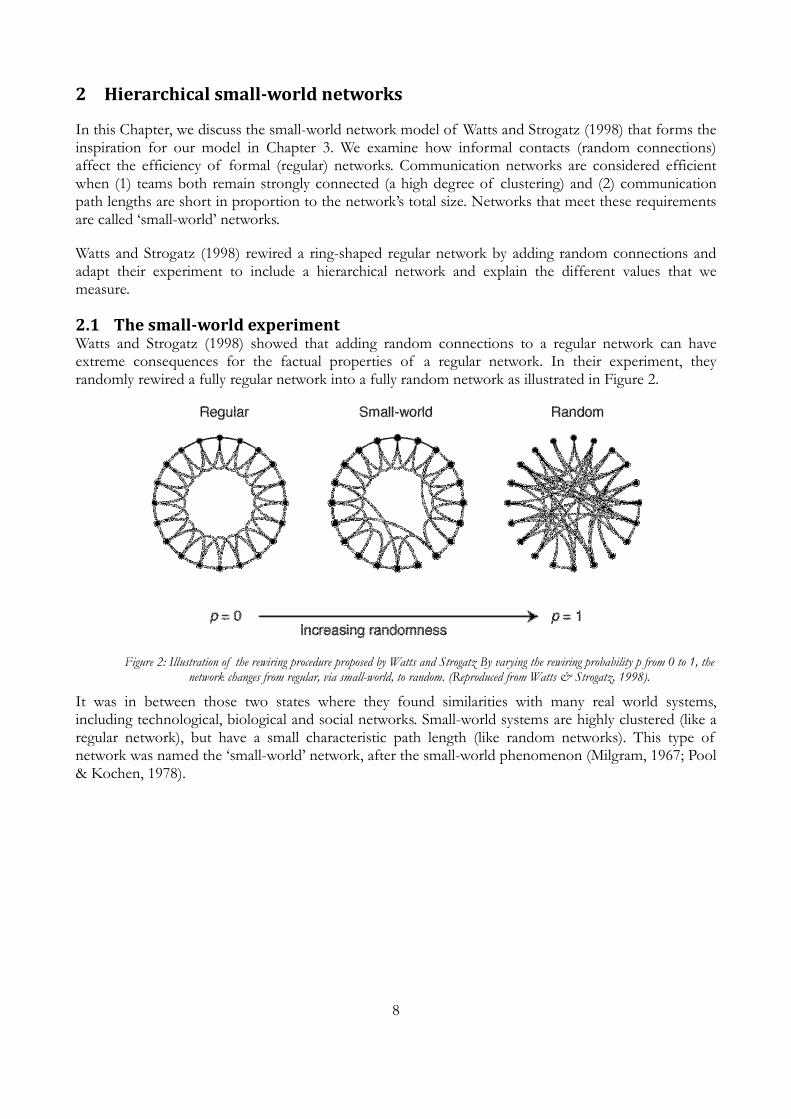
Figure 3: Watts and Strogatz' original 1998 results (reproduced from Watts & Strogatz, 1998). The clustering C and characteristic path length L of the network are calculated relatively to their initial values at P=0. When plotted on a logarithmic scale, it showed
that between P=0.001 and P=0.1 C remains high while L drops rapidly, resulting in a small-world network.
Watts and Strogatz found that these ‘random’ connections often shorten the characteristic path length, but only a few such edges (or links) are needed to cut down the amount of steps needed to traverse the network drastically, thereby retaining the high degree of clustering of the initial network (see Figure 3). These ‘random’ edges across the network reduce the average number of steps that has to be taken to walk from one random node in the network, to a other random node, effectively making the so-called diameter of the network ‘smaller’, hence the name ‘small-world network’. This ‘small-world phenomenon’ was deemed the holy grail of efficiency for organized networks. Measuring efficiency
The Paragraphs below illustrate how efficiency of a communication network is measured using the ratio of ‘clustering’ and ‘characteristic path length’.
Clustering Clustering is the measure of how likely it is that two random neighbors of a vertex (or, node) in the network are connected to each other. It indicates to what extent there are highly interconnected subgroups in the network. Recently, organizational studies have investigated the importance of small-world connections for efficiency and creativity in companies and found that “dense clustering should transfer information and other resources more efficiently” (Etzkowitz, Kemelgor, & Uzzi, 2000; Reagans & McEvily, 2003).
Calculating the clustering coefficient is best explained by citing Watts & Strogatz (1998):
The Clustering coefficient C(p)is defined as follows. Suppose that a vertex v had kv neighbors; then at most kv(kv-1)/2 edges van exist between them (this occurs when every neighbor of v is connected to every other neighbor of v). Let Cv denote the fraction of these allowable edges that actually exist. Define C as the average of Cv over all v.
Characteristic Path Length The characteristic path length, also called ‘network diameter’ and ‘denotes the shortest path between two random nodes in the network’ (Barabasi, 1999). It is calculated by adding up the shortest paths between every possible pair of vertices and dividing that number by the total number of paths.
The shortest path between two nodes is calculated using the Dijkstra algorithm (Dijkstra, 1959; Cormen, Leiserson, Rivest, & Stein, 2001). Dijkstra’s algorithm calculates the shortest path between vertex v and every other vertex. This is done for every vertex in the network. The sum of all results is divided by the total number of results to obtain the network diameter.
According to Watts & Strogatz (1998), the speed of information propagation, also called percolation

10
time, greatly depends on the network diameter, also called characteristic path length, can be described as the average of the minimum number of steps between all possible pairs of vertices (or nodes) and is calculated by summing the number of steps in the shortest path between each possible pair of vertices and dividing it by the number of pairs of vertices.
Small-worldliness Small-worldliness (Walsh, 1999) measures to what extend a network has a network small characteristic path length while maintaining a high degree of clustering. Watts (1999) states that networks are considered small-worlds when a network is (1) large, (2) sparsely connected, (3) highly clustered and when (4) not all its nodes connected to a central node. Organizations meet these requirements: while (1) organizations usually don’t have amounts of employees in the order of billions, for large organizations, n is still a lot larger than 1. The amount of contacts (2) a person can sustain actively is indeed limited. While in in organization the strategic apex does fulfill a central role, they are not a central vertex (3) in the sense that most other vertices are directly connected to them. The fourth criterion is also met, as teams form highly interconnected cliques. Therefore, we can speak of an organization as a small-world network and use small-worldliness as an instrument to measure the combined efficiency of characteristic path length and clustering
11
3 The hierarchical network model
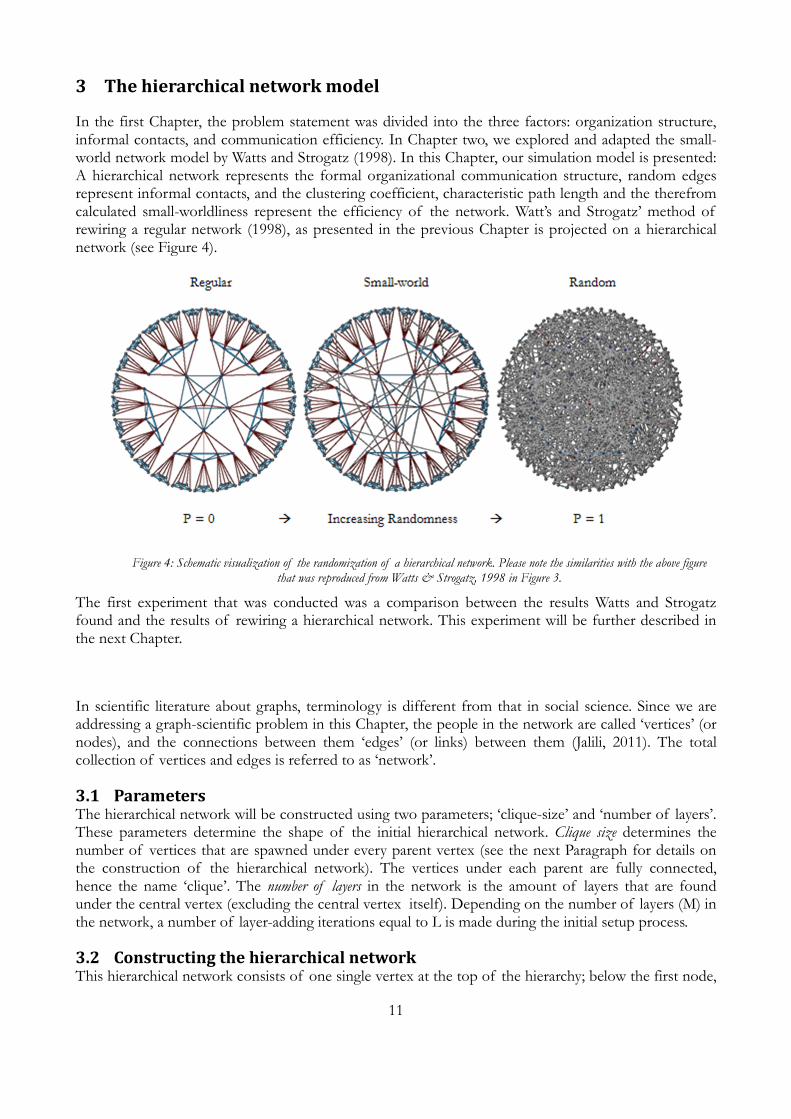
In the first Chapter, the problem statement was divided into the three factors: organization structure, informal contacts, and communication efficiency. In Chapter two, we explored and adapted the small-world network model by Watts and Strogatz (1998). In this Chapter, our simulation model is presented: A hierarchical network represents the formal organizational communication structure, random edges represent informal contacts, and the clustering coefficient, characteristic path length and the therefrom calculated small-worldliness represent the efficiency of the network. Watt’s and Strogatz’ method of rewiring a regular network (1998), as presented in the previous Chapter is projected on a hierarchical network (see Figure 4).
Figure 4: Schematic visualization of the randomization of a hierarchical network. Please note the similarities with the above figure that was reproduced from Watts & Strogatz, 1998 in Figure 3.
The first experiment that was conducted was a comparison between the results Watts and Strogatz found and the results of rewiring a hierarchical network. This experiment will be further described in the next Chapter.
In scientific literature about graphs, terminology is different from that in social science. Since we are addressing a graph-scientific problem in this Chapter, the people in the network are called ‘vertices’ (or nodes), and the connections between them ‘edges’ (or links) between them (Jalili, 2011). The total collection of vertices and edges is referred to as ‘network’.
3.1 Parameters The hierarchical network will be constructed using two parameters; ‘clique-size’ and ‘number of layers’. These parameters determine the shape of the initial hierarchical network. Clique size determines the number of vertices that are spawned under every parent vertex (see the next Paragraph for details on the construction of the hierarchical network). The vertices under each parent are fully connected, hence the name ‘clique’. The number of layers in the network is the amount of layers that are found under the central vertex (excluding the central vertex itself). Depending on the number of layers (M) in the network, a number of layer-adding iterations equal to L is made during the initial setup process.
3.2 Constructing the hierarchical network This hierarchical network consists of one single vertex at the top of the hierarchy; below the first node,
12
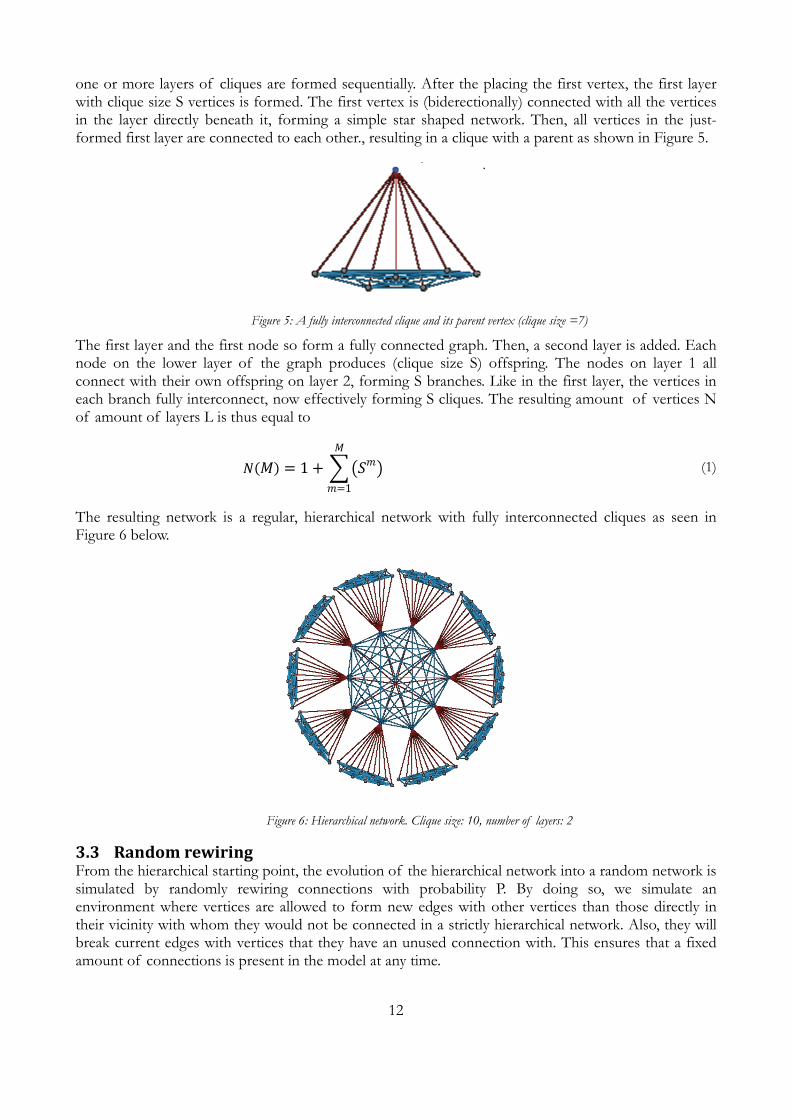
one or more layers of cliques are formed sequentially. After the placing the first vertex, the first layer with clique size S vertices is formed. The first vertex is (biderectionally) connected with all the vertices in the layer directly beneath it, forming a simple star shaped network. Then, all vertices in the just-formed first layer are connected to each other., resulting in a clique with a parent as shown in Figure 5.
Figure 5: A fully interconnected clique and its parent vertex (clique size =7)
The first layer and the first node so form a fully connected graph. Then, a second layer is added. Each node on the lower layer of the graph produces (clique size S) offspring. The nodes on layer 1 all connect with their own offspring on layer 2, forming S branches. Like in the first layer, the vertices in each branch fully interconnect, now effectively forming S cliques. The resulting amount of vertices N of amount of layers L is thus equal to
���� � 1� ����
��1 (1)
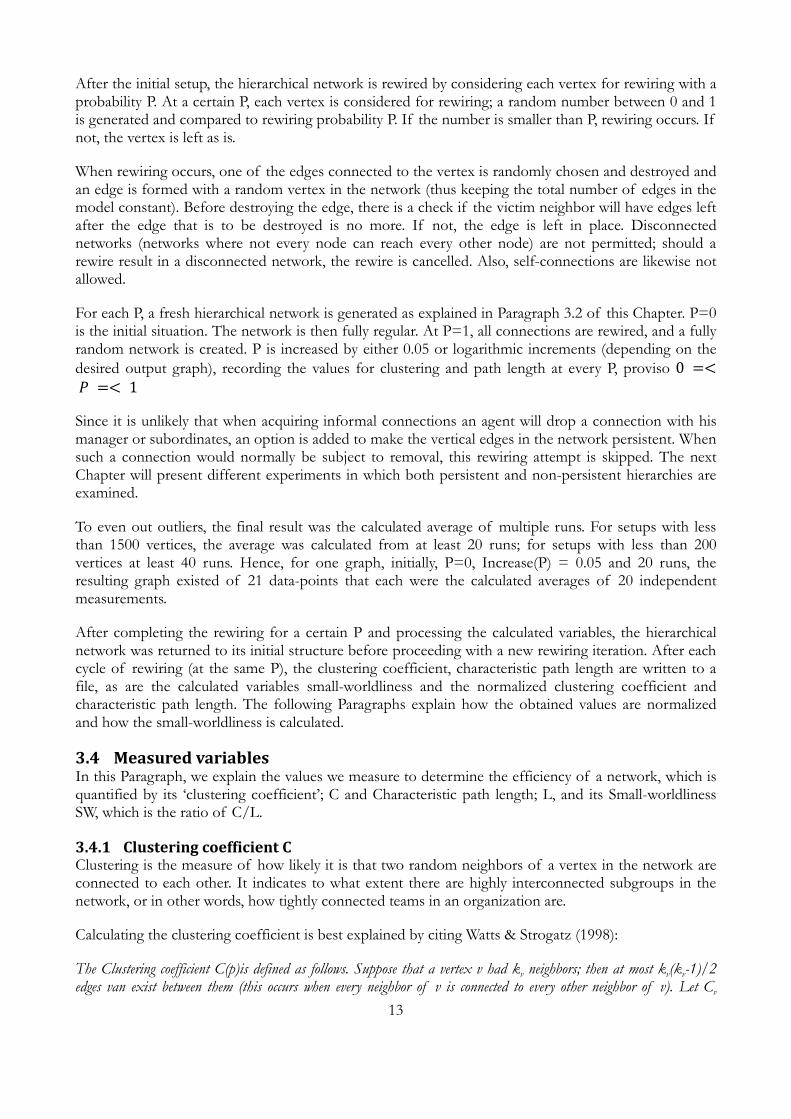
The resulting network is a regular, hierarchical network with fully interconnected cliques as seen in Figure 6 below.
Figure 6: Hierarchical network. Clique size: 10, number of layers: 2
3.3 Random rewiring From the hierarchical starting point, the evolution of the hierarchical network into a random network is simulated by randomly rewiring connections with probability P. By doing so, we simulate an environment where vertices are allowed to form new edges with other vertices than those directly in their vicinity with whom they would not be connected in a strictly hierarchical network. Also, they will break current edges with vertices that they have an unused connection with. This ensures that a fixed amount of connections is present in the model at any time.
13
After the initial setup, the hierarchical network is rewired by considering each vertex for rewiring with a probability P. At a certain P, each vertex is considered for rewiring; a random number between 0 and 1 is generated and compared to rewiring probability P. If the number is smaller than P, rewiring occurs. If not, the vertex is left as is.
When rewiring occurs, one of the edges connected to the vertex is randomly chosen and destroyed and an edge is formed with a random vertex in the network (thus keeping the total number of edges in the model constant). Before destroying the edge, there is a check if the victim neighbor will have edges left after the edge that is to be destroyed is no more. If not, the edge is left in place. Disconnected networks (networks where not every node can reach every other node) are not permitted; should a rewire result in a disconnected network, the rewire is cancelled. Also, self-connections are likewise not allowed.
For each P, a fresh hierarchical network is generated as explained in Paragraph 3.2 of this Chapter. P=0 is the initial situation. The network is then fully regular. At P=1, all connections are rewired, and a fully random network is created. P is increased by either 0.05 or logarithmic increments (depending on the
desired output graph), recording the values for clustering and path length at every P, proviso 0 �<� �< 1Since it is unlikely that when acquiring informal connections an agent will drop a connection with his manager or subordinates, an option is added to make the vertical edges in the network persistent. When such a connection would normally be subject to removal, this rewiring attempt is skipped. The next Chapter will present different experiments in which both persistent and non-persistent hierarchies are examined.
To even out outliers, the final result was the calculated average of multiple runs. For setups with less than 1500 vertices, the average was calculated from at least 20 runs; for setups with less than 200 vertices at least 40 runs. Hence, for one graph, initially, P=0, Increase(P) = 0.05 and 20 runs, the resulting graph existed of 21 data-points that each were the calculated averages of 20 independent measurements.
After completing the rewiring for a certain P and processing the calculated variables, the hierarchical network was returned to its initial structure before proceeding with a new rewiring iteration. After each cycle of rewiring (at the same P), the clustering coefficient, characteristic path length are written to a file, as are the calculated variables small-worldliness and the normalized clustering coefficient and characteristic path length. The following Paragraphs explain how the obtained values are normalized and how the small-worldliness is calculated.
3.4 Measured variables In this Paragraph, we explain the values we measure to determine the efficiency of a network, which is quantified by its ‘clustering coefficient’; C and Characteristic path length; L, and its Small-worldliness SW, which is the ratio of C/L.
3.4.1 Clustering coefficient C Clustering is the measure of how likely it is that two random neighbors of a vertex in the network are connected to each other. It indicates to what extent there are highly interconnected subgroups in the network, or in other words, how tightly connected teams in an organization are.
Calculating the clustering coefficient is best explained by citing Watts & Strogatz (1998):
The Clustering coefficient C(p)is defined as follows. Suppose that a vertex v had kv neighbors; then at most kv(kv-1)/2 edges van exist between them (this occurs when every neighbor of v is connected to every other neighbor of v). Let Cv

14
denote the fraction of these allowable edges that actually exist. Define C as the average of Cv over all v.
Thus the clustering coefficient �� for one single vertex (where e represents the actual number of edges among its neighbors) would be:
�� ���� ∙ ��� − 1)) 2⁄
� (2)
Calculate this number for all vertices and divide that number by n to obtain the clustering coefficient
�(�) for the total network:
�(�) = � (�� ∙ (�� − 1)) 2⁄�|�|
(3)
3.4.2 Characteristic Path length L The characteristic path length (also called ‘network diameter ‘) denotes the shortest path between two random nodes in the network. It is calculated by adding up the shortest paths between every possible pair of vertices and dividing that number by the total number of paths. Dijkstra’s algorithm (Dijkstra, 1959; Cormen et al., 2001) is used to select the shortest path between vertex v and every other vertex. This is done for every vertex in the network. The characteristic path length is obtained by taking the sum of all results and dividing it by the total number of results.
3.4.3 Small-worldliness It is the “ratio of the clustering coefficient and the characteristic path length, normalized by the same values for a random graph with the same number of edges and vertices” (Walsh, 1999).
Let C(p) denote the clustering coefficient at a certain P and L the characteristic path length at that P. The Small-worldliness (henceforth referred to as SW) is the ratio of both variables:
� = �(�) �(�)⁄ (4)
In output graphs, the small-worldliness is normalized with its initial values at P=0:
��� �!"#$�% = (�(�) �(�)⁄ )(�(0) �(0)⁄ ) (5)
This normalized small-worldliness represents the impact that adding randomness has had on the network’s structural variables as compared to structural variables of the original, regular shape.
3.4.4 Normalizing variables To account for the variations in the different hierarchical networks we examine (the different numbers of layers and varying clique sizes), the output of each rewiring sequence is normalized with the initial values for that network (the values at P=0). Hence, the values of norm(C), norm(L) and norm(C/L) represent how the value at a certain P is different from that value in the fully regular version of that network. Thanks to this normalization, the results from the hierarchical models can be compared to both the original results of Watts and Strogatz' ring-shaped network and to each other.
3.5 Assumptions We assume the following: the networks are undirected; edges between vertices are thus always bidirectional. Self-connections (edge e connects vertex v with v) of individual vertices are not allowed. Multiple direct edges existing between two vertices (edge e connects vertex v1 with v2 and edge f

15
connects vertex v1 with v2) are not allowed. All networks are unweighted. This implies that path length is equal to the number of vertices passed on the said path minus one.

16
4 Experimental setup
This Chapter describes four experiments based on the theories presented in the previous Chapter. The experiments are run in a simulation model that has been built in the multi-agent programmable modeling environment “NetLogo” (Wilensky, 1999)1.
First, the Watts and Strogatz’ 1998 experiment discussed in Chapter 2 will be reproduced using a computer simulation. While Watts and Strogatz’ model suits this thesis’ purpose partially, they used a ring-shaped rather than a hierarchical graph. Hence, after completing the Watts and Strogatz reconstruction and verifying the results, a second version of the model is designed to include the hierarchical network’s aspects. The ring network was replaced by a hierarchical network and the parameters relevant to hierarchical network setups were added to the simulation model. Input variables had to be added as the hierarchical networks that were used in this study varied in number of layers and size of the cliques.
In the first experiment, Watts and Strogatz’ results are reproduced in order to verify the validity of the model. Small-worldliness will be calculated and added to the results in order to present an image of typical small-world behavior. Thereafter, two experiments are conducted to answer research questions number two:
RQ 2: Do the structural properties of organizational communication networks change when informal connections are formed?
In the second experiment applies the same operations as in the first experiment, but to a hierarchical network with a comparable amount of vertices to compare the impact of random connections on a hierarchical network with their impact on Watts and Strogatz’ ring shaped network.
The third experiment adds the constraint of the vertical structure of the hierarchical network being persistent, implicating that a connection between a manager and his subordinates cannot be broken.
The final experiment is set up to answer the last research reaction:
RQ 3: Do informal connections affect different organizational communication structures equally?
This fourth experiment focusses on the effect of hierarchy depth on the development of the dependent variables during the rewiring process and consists of a comparison between shallowly and deeply layered hierarchies. Results will be presented in the next Chapter.
4.1 Experiment 1: Watts & Strogatz and small-worldliness The goal of the first experiment is to compare the results of our simulation to the results Watts and Strogatz (1998) found, and add the calculated small-worldliness of the results that were found. In their landmark paper, they concluded that a few random connections greatly decrease the characteristic path length while keeping the clustering high. Figure 7 shows a copy of their experimental results.
1 The constructed model is a full reconstruction of the Watts and Strogatz model (Watts and Strogatz, 1998), loosely based on http://ccl.northwestern.edu/netlogo/models/SmallWorlds (Wilensky, 2005)
17
Figure 7: Watts and Strogatz found that after the first rewires, clustering remained still high, while the characteristic path length had dropped drastically. C and L are normalized with the values of the initial network at P=0. Reproduced from Watts & Strogatz,
1998
A remake of their original model in NetLogo is used to reproduces Watts and Strogatz’ results and verify if the results of the NetLogo model concur with those found by Watts and Strogatz. Concurrently, small-worldliness (also relative to its initial value) is computed and added to the graph (for the formula, see Paragraph 3.4.4).
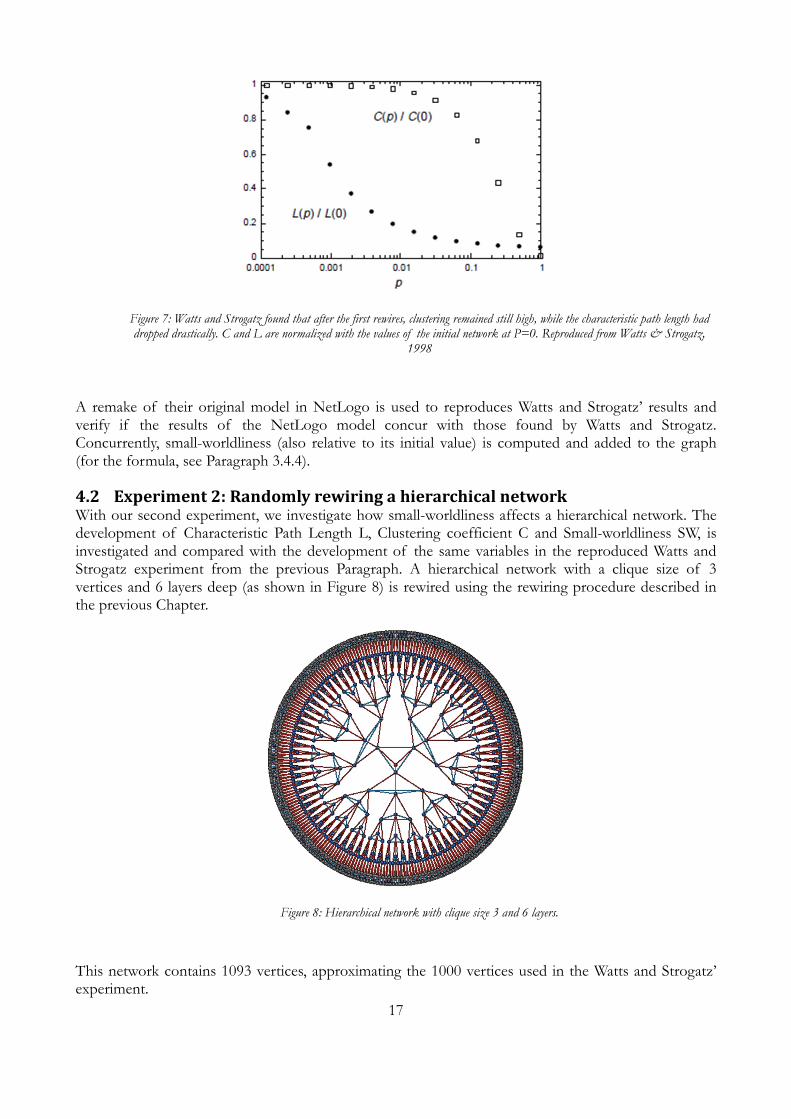
4.2 Experiment 2: Randomly rewiring a hierarchical network With our second experiment, we investigate how small-worldliness affects a hierarchical network. The development of Characteristic Path Length L, Clustering coefficient C and Small-worldliness SW, is investigated and compared with the development of the same variables in the reproduced Watts and Strogatz experiment from the previous Paragraph. A hierarchical network with a clique size of 3 vertices and 6 layers deep (as shown in Figure 8) is rewired using the rewiring procedure described in the previous Chapter.
Figure 8: Hierarchical network with clique size 3 and 6 layers.
This network contains 1093 vertices, approximating the 1000 vertices used in the Watts and Strogatz’ experiment.
18
4.3 Experiment 3: Persistent hierarchical structure Experiment 2 is repeated with a persistent hierarchical structure, meaning the vertical connections (red lines in Figure 8) between the different layers are considered persistent and are, in contrast to the non-persistent hierarchy used in experiment 2, not subject to rewiring. The values for the initial hierarchical network correspond with those used in experiment 2. Again, we use a network with clique size 3 and 6 layers.
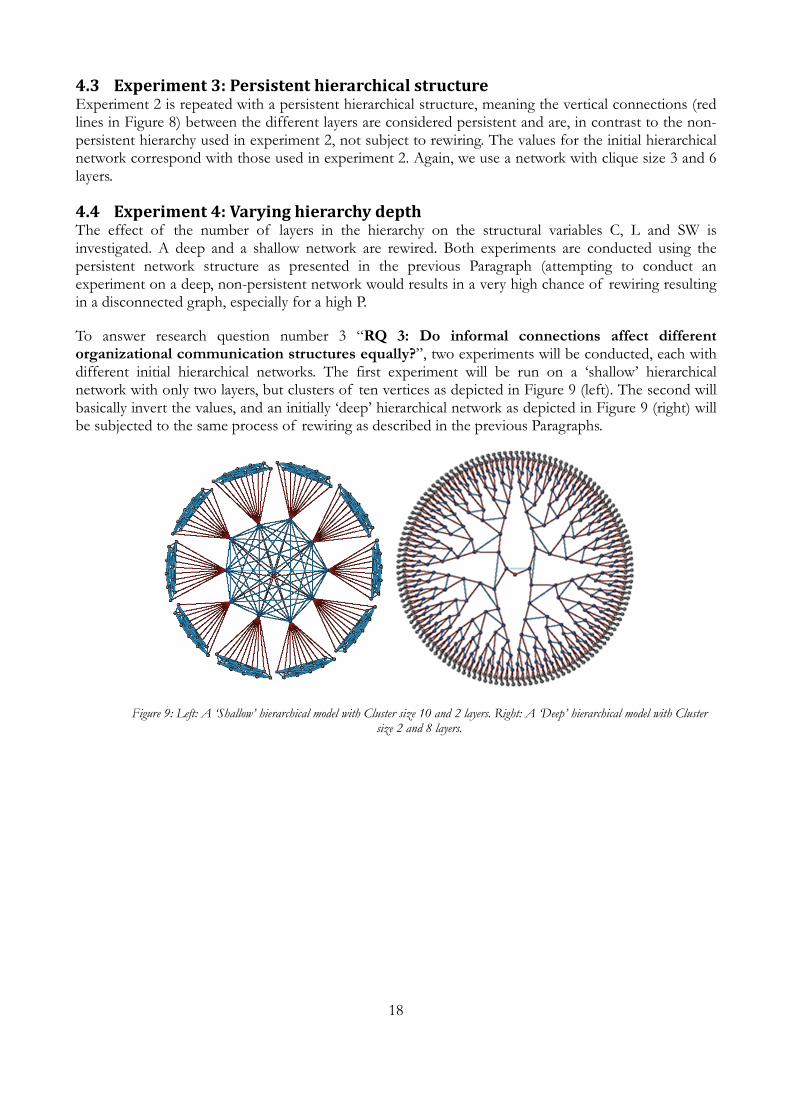
4.4 Experiment 4: Varying hierarchy depth The effect of the number of layers in the hierarchy on the structural variables C, L and SW is investigated. A deep and a shallow network are rewired. Both experiments are conducted using the persistent network structure as presented in the previous Paragraph (attempting to conduct an experiment on a deep, non-persistent network would results in a very high chance of rewiring resulting in a disconnected graph, especially for a high P.
To answer research question number 3 “RQ 3: Do informal connections affect different organizational communication structures equally?”, two experiments will be conducted, each with different initial hierarchical networks. The first experiment will be run on a ‘shallow’ hierarchical network with only two layers, but clusters of ten vertices as depicted in Figure 9 (left). The second will basically invert the values, and an initially ‘deep’ hierarchical network as depicted in Figure 9 (right) will be subjected to the same process of rewiring as described in the previous Paragraphs.
Figure 9: Left: A ‘Shallow’ hierarchical model with Cluster size 10 and 2 layers. Right: A ‘Deep’ hierarchical model with Cluster size 2 and 8 layers.
19
5 Results
This Chapter describes the results of the four simulation experiments. For each experiment, the results obtained after rewiring a hierarchical network will be reported. Thereafter, the effects of the different variations in the initial setup (the number of layers and the size of the cliques) will be analyzed. The analyses in this Chapter are strictly technical in nature; the organizational implications are discussed in the next Chapter.
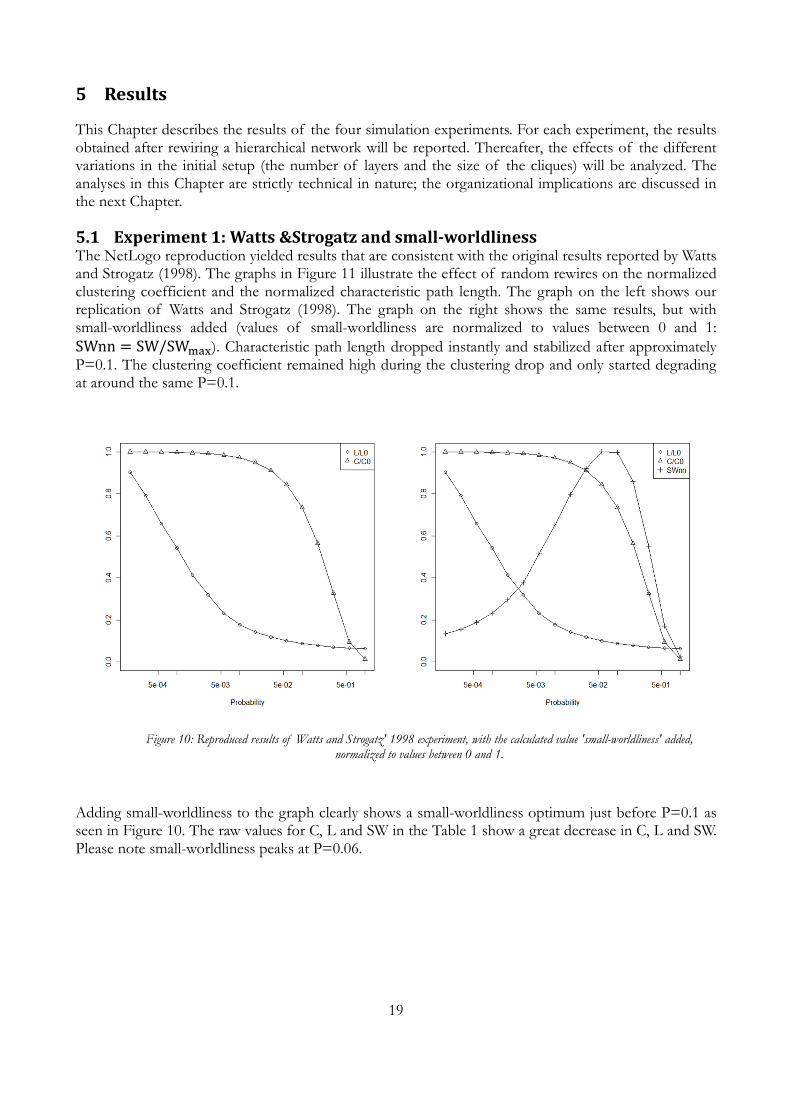
5.1 Experiment 1: Watts &Strogatz and small-worldliness The NetLogo reproduction yielded results that are consistent with the original results reported by Watts and Strogatz (1998). The graphs in Figure 11 illustrate the effect of random rewires on the normalized clustering coefficient and the normalized characteristic path length. The graph on the left shows our replication of Watts and Strogatz (1998). The graph on the right shows the same results, but with small-worldliness added (values of small-worldliness are normalized to values between 0 and 1:
SWnn = SW/SW*+,). Characteristic path length dropped instantly and stabilized after approximately P=0.1. The clustering coefficient remained high during the clustering drop and only started degrading at around the same P=0.1.
Figure 10: Reproduced results of Watts and Strogatz' 1998 experiment, with the calculated value 'small-worldliness' added, normalized to values between 0 and 1.
Adding small-worldliness to the graph clearly shows a small-worldliness optimum just before P=0.1 as seen in Figure 10. The raw values for C, L and SW in the Table 1 show a great decrease in C, L and SW. Please note small-worldliness peaks at P=0.06.

20
Value P
C Cmax 0.06667 0
Cmin 0.009223 1
L Lmax 50.45 0
Lmin 3.268 1
SW SWmax 0.1109 0.06
SWmin 0.002822 1
Table 1: Watts & Strogatz replication n=1000
Discussion of results (experiment 1) The results of this experiment show that it is possible to accurately reproduce the results of Watts and Strogatz’ 1998 Small-world experiment. The adding of small-worldliness (the ratio C/L) to the graph underlines their statement that a small amount of rewires greatly decreases path length while initially keeping a high C.
21
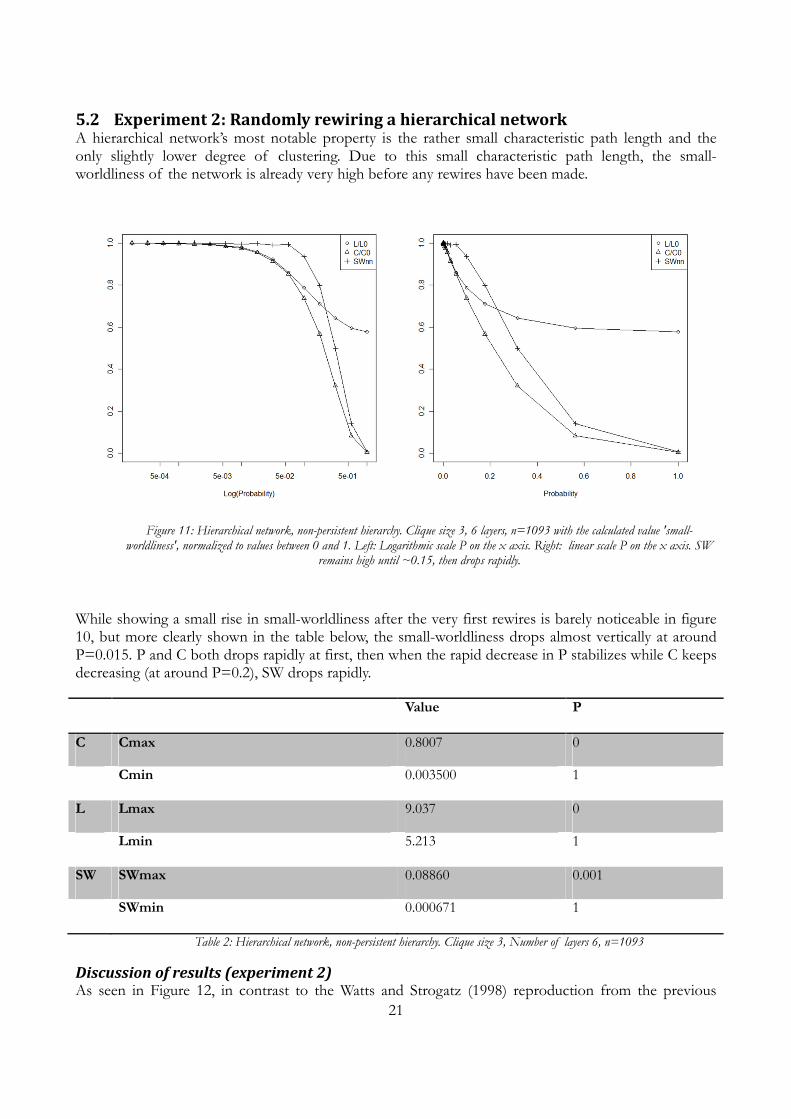
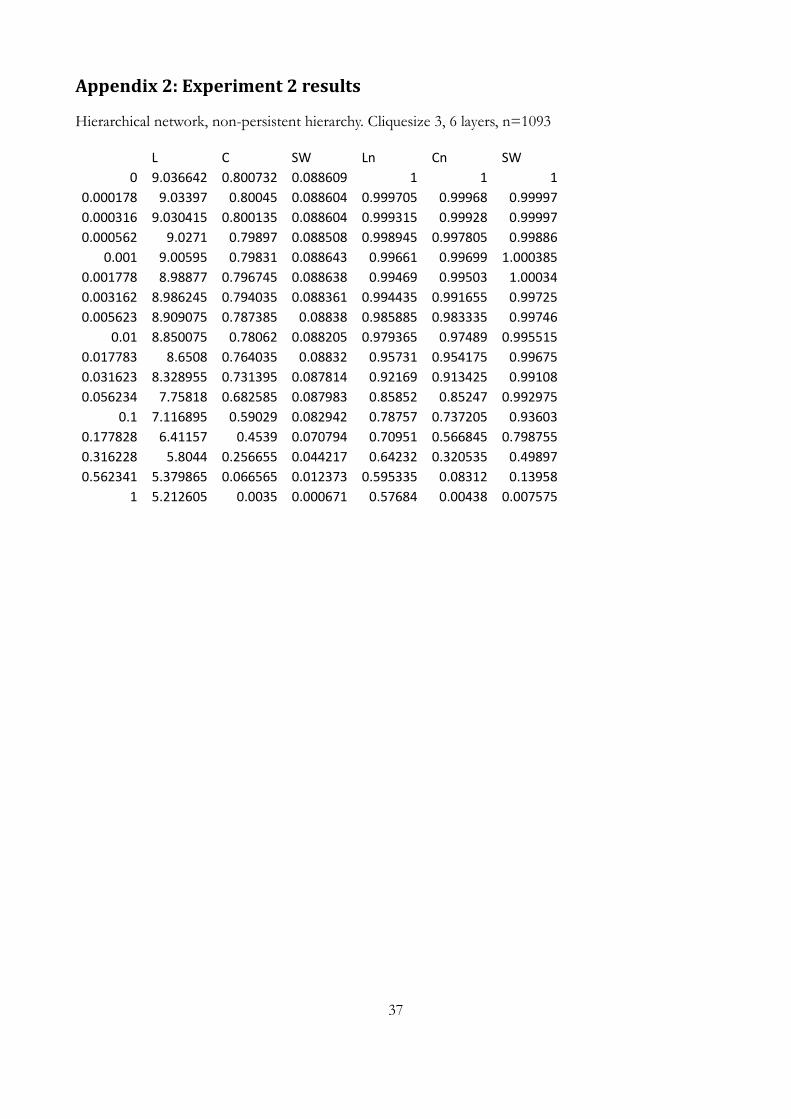
5.2 Experiment 2: Randomly rewiring a hierarchical network A hierarchical network’s most notable property is the rather small characteristic path length and the only slightly lower degree of clustering. Due to this small characteristic path length, the small-worldliness of the network is already very high before any rewires have been made.
Figure 11: Hierarchical network, non-persistent hierarchy. Clique size 3, 6 layers, n=1093 with the calculated value 'small-worldliness', normalized to values between 0 and 1. Left: Logarithmic scale P on the x axis. Right: linear scale P on the x axis. SW
remains high until ~0.15, then drops rapidly.
While showing a small rise in small-worldliness after the very first rewires is barely noticeable in figure 10, but more clearly shown in the table below, the small-worldliness drops almost vertically at around P=0.015. P and C both drops rapidly at first, then when the rapid decrease in P stabilizes while C keeps decreasing (at around P=0.2), SW drops rapidly.
Value P
C Cmax 0.8007 0
Cmin 0.003500 1
L Lmax 9.037 0
Lmin 5.213 1
SW SWmax 0.08860 0.001
SWmin 0.000671 1
Table 2: Hierarchical network, non-persistent hierarchy. Clique size 3, Number of layers 6, n=1093
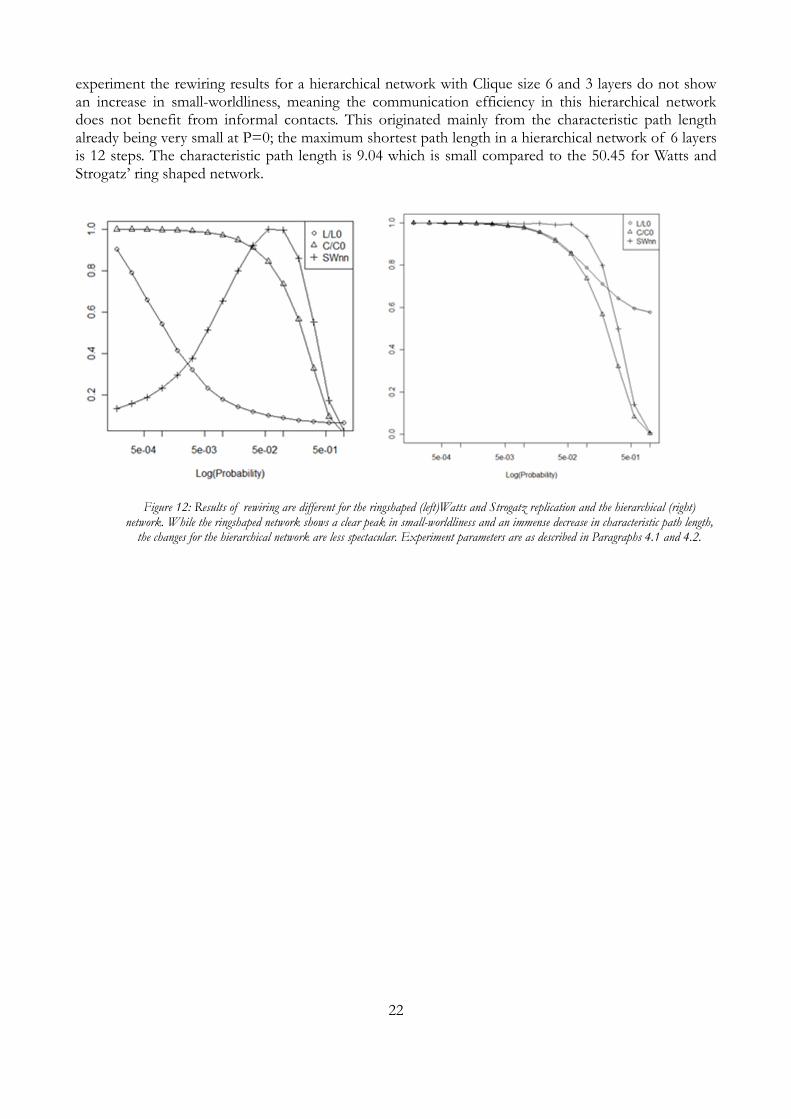
Discussion of results (experiment 2) As seen in Figure 12, in contrast to the Watts and Strogatz (1998) reproduction from the previous
22
experiment the rewiring results for a hierarchical network with Clique size 6 and 3 layers do not show an increase in small-worldliness, meaning the communication efficiency in this hierarchical network does not benefit from informal contacts. This originated mainly from the characteristic path length already being very small at P=0; the maximum shortest path length in a hierarchical network of 6 layers is 12 steps. The characteristic path length is 9.04 which is small compared to the 50.45 for Watts and Strogatz’ ring shaped network.
Figure 12: Results of rewiring are different for the ringshaped (left)Watts and Strogatz replication and the hierarchical (right) network. While the ringshaped network shows a clear peak in small-worldliness and an immense decrease in characteristic path length,
the changes for the hierarchical network are less spectacular. Experiment parameters are as described in Paragraphs 4.1 and 4.2.
23
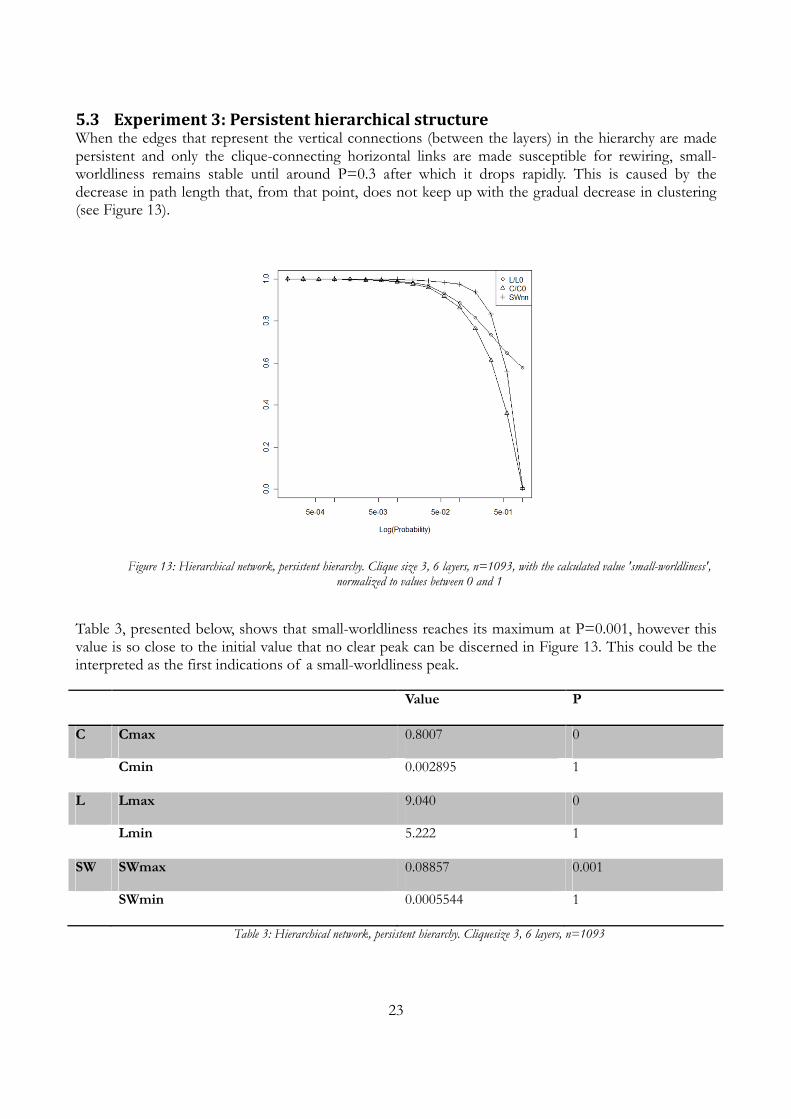
5.3 Experiment 3: Persistent hierarchical structure When the edges that represent the vertical connections (between the layers) in the hierarchy are made persistent and only the clique-connecting horizontal links are made susceptible for rewiring, small-worldliness remains stable until around P=0.3 after which it drops rapidly. This is caused by the decrease in path length that, from that point, does not keep up with the gradual decrease in clustering (see Figure 13).
Figure 13: Hierarchical network, persistent hierarchy. Clique size 3, 6 layers, n=1093, with the calculated value 'small-worldliness', normalized to values between 0 and 1
Table 3, presented below, shows that small-worldliness reaches its maximum at P=0.001, however this value is so close to the initial value that no clear peak can be discerned in Figure 13. This could be the interpreted as the first indications of a small-worldliness peak.
Value P
C Cmax 0.8007 0
Cmin 0.002895 1
L Lmax 9.040 0
Lmin 5.222 1
SW SWmax 0.08857 0.001
SWmin 0.0005544 1
Table 3: Hierarchical network, persistent hierarchy. Cliquesize 3, 6 layers, n=1093
24
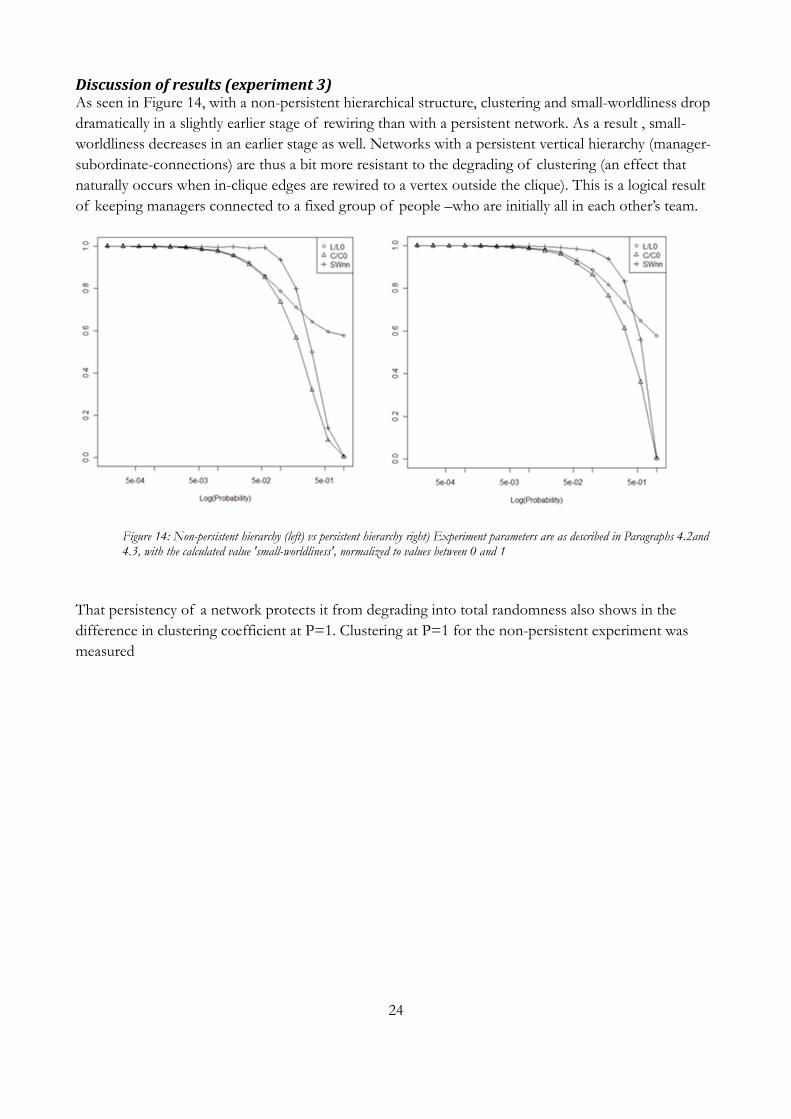
Discussion of results (experiment 3) As seen in Figure 14, with a non-persistent hierarchical structure, clustering and small-worldliness drop
dramatically in a slightly earlier stage of rewiring than with a persistent network. As a result , small-
worldliness decreases in an earlier stage as well. Networks with a persistent vertical hierarchy (manager-
subordinate-connections) are thus a bit more resistant to the degrading of clustering (an effect that
naturally occurs when in-clique edges are rewired to a vertex outside the clique). This is a logical result
of keeping managers connected to a fixed group of people –who are initially all in each other’s team.
Figure 14: Non-persistent hierarchy (left) vs persistent hierarchy right) Experiment parameters are as described in Paragraphs 4.2and 4.3, with the calculated value 'small-worldliness', normalized to values between 0 and 1
That persistency of a network protects it from degrading into total randomness also shows in the
difference in clustering coefficient at P=1. Clustering at P=1 for the non-persistent experiment was
measured
25
5.4 Experiment 4: Varying hierarchy depth In this Paragraph, we present and discuss the results for a rewiring ‘shallow’ (Number of layers < Clique size) and a ‘deep’ hierarchical network (Number of layers > Clique size).
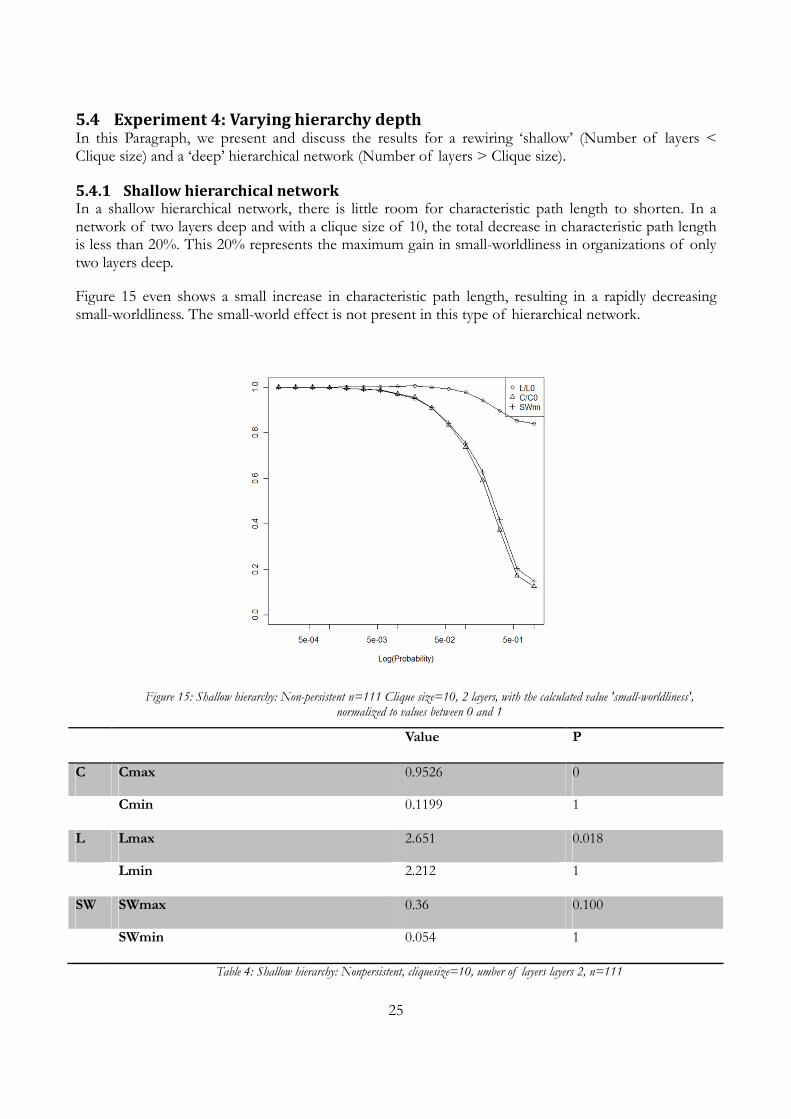
5.4.1 Shallow hierarchical network In a shallow hierarchical network, there is little room for characteristic path length to shorten. In a network of two layers deep and with a clique size of 10, the total decrease in characteristic path length is less than 20%. This 20% represents the maximum gain in small-worldliness in organizations of only two layers deep.
Figure 15 even shows a small increase in characteristic path length, resulting in a rapidly decreasing small-worldliness. The small-world effect is not present in this type of hierarchical network.
Figure 15: Shallow hierarchy: Non-persistent n=111 Clique size=10, 2 layers, with the calculated value 'small-worldliness', normalized to values between 0 and 1
Value P
C Cmax 0.9526 0
Cmin 0.1199 1
L Lmax 2.651 0.018
Lmin 2.212 1
SW SWmax 0.36 0.100
SWmin 0.054 1
Table 4: Shallow hierarchy: Nonpersistent, cliquesize=10, umber of layers layers 2, n=111
26
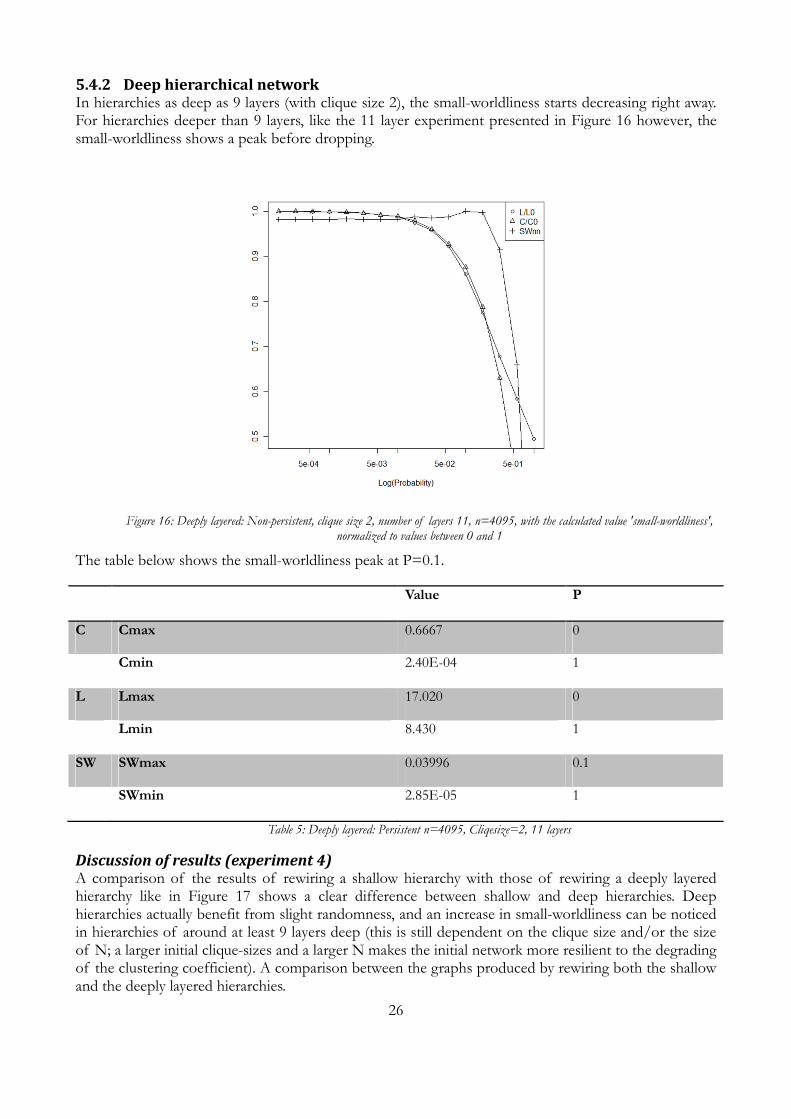
5.4.2 Deep hierarchical network In hierarchies as deep as 9 layers (with clique size 2), the small-worldliness starts decreasing right away. For hierarchies deeper than 9 layers, like the 11 layer experiment presented in Figure 16 however, the small-worldliness shows a peak before dropping.
Figure 16: Deeply layered: Non-persistent, clique size 2, number of layers 11, n=4095, with the calculated value 'small-worldliness', normalized to values between 0 and 1
The table below shows the small-worldliness peak at P=0.1.
Value P
C Cmax 0.6667 0
Cmin 2.40E-04 1
L Lmax 17.020 0
Lmin 8.430 1
SW SWmax 0.03996 0.1
SWmin 2.85E-05 1
Table 5: Deeply layered: Persistent n=4095, Cliqesize=2, 11 layers
Discussion of results (experiment 4) A comparison of the results of rewiring a shallow hierarchy with those of rewiring a deeply layered hierarchy like in Figure 17 shows a clear difference between shallow and deep hierarchies. Deep hierarchies actually benefit from slight randomness, and an increase in small-worldliness can be noticed in hierarchies of around at least 9 layers deep (this is still dependent on the clique size and/or the size of N; a larger initial clique-sizes and a larger N makes the initial network more resilient to the degrading of the clustering coefficient). A comparison between the graphs produced by rewiring both the shallow and the deeply layered hierarchies.
27
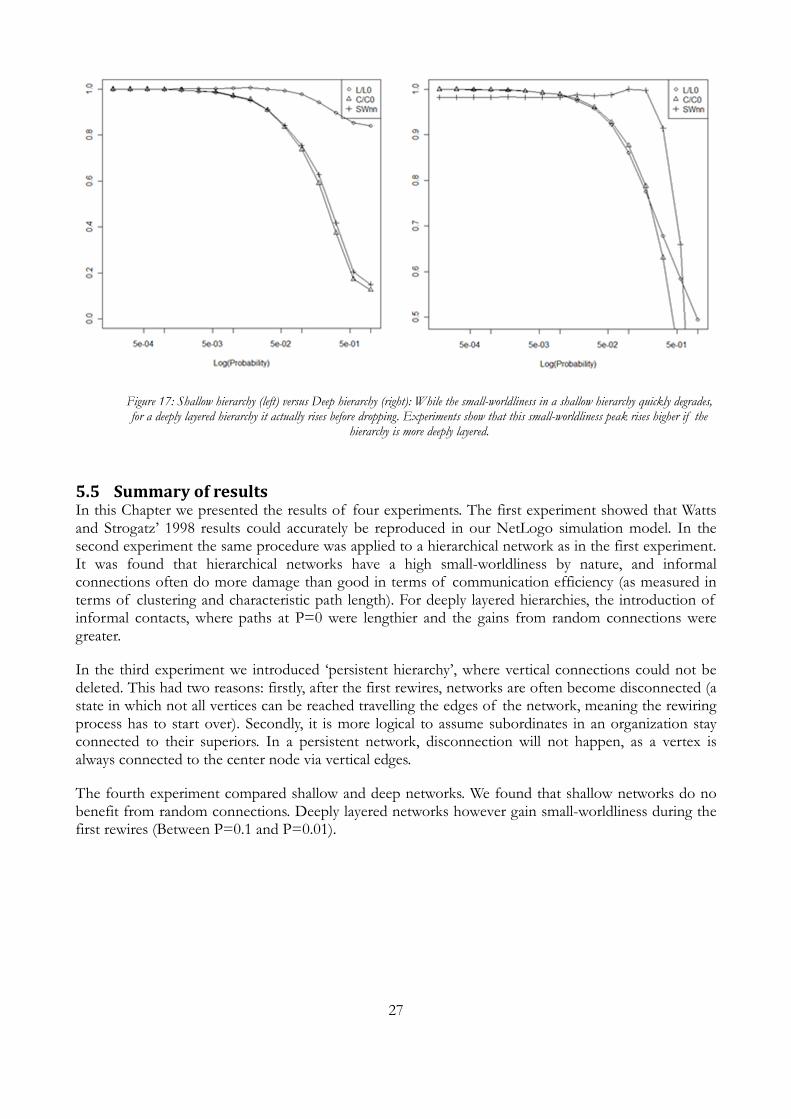
Figure 17: Shallow hierarchy (left) versus Deep hierarchy (right): While the small-worldliness in a shallow hierarchy quickly degrades, for a deeply layered hierarchy it actually rises before dropping. Experiments show that this small-worldliness peak rises higher if the
hierarchy is more deeply layered.
5.5 Summary of results In this Chapter we presented the results of four experiments. The first experiment showed that Watts and Strogatz’ 1998 results could accurately be reproduced in our NetLogo simulation model. In the second experiment the same procedure was applied to a hierarchical network as in the first experiment. It was found that hierarchical networks have a high small-worldliness by nature, and informal connections often do more damage than good in terms of communication efficiency (as measured in terms of clustering and characteristic path length). For deeply layered hierarchies, the introduction of informal contacts, where paths at P=0 were lengthier and the gains from random connections were greater.
In the third experiment we introduced ‘persistent hierarchy’, where vertical connections could not be deleted. This had two reasons: firstly, after the first rewires, networks are often become disconnected (a state in which not all vertices can be reached travelling the edges of the network, meaning the rewiring process has to start over). Secondly, it is more logical to assume subordinates in an organization stay connected to their superiors. In a persistent network, disconnection will not happen, as a vertex is always connected to the center node via vertical edges.
The fourth experiment compared shallow and deep networks. We found that shallow networks do no benefit from random connections. Deeply layered networks however gain small-worldliness during the first rewires (Between P=0.1 and P=0.01).
28
6 Discussion
In this Chapter we discuss the technical results presented in the previous Chapter in three parts and put them into an organizational context. Thereafter, limitations of our model will be briefly discussed. Finally, recommendations for further research will be given.
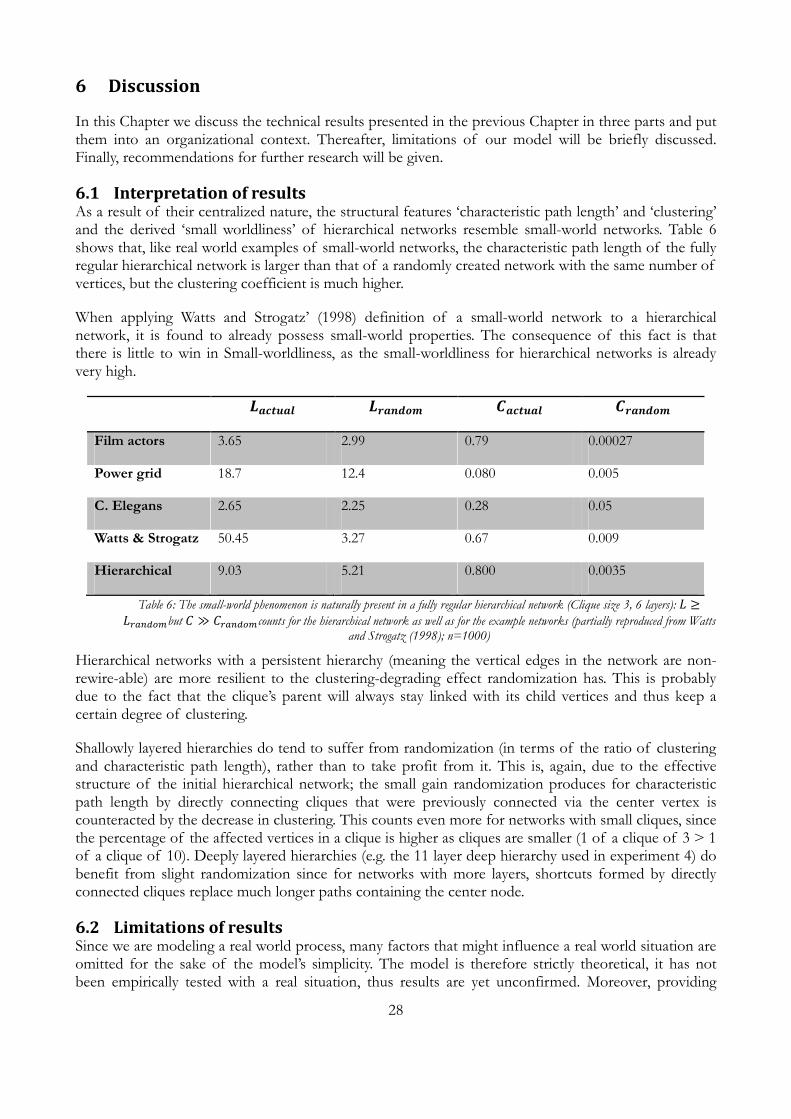
6.1 Interpretation of results As a result of their centralized nature, the structural features ‘characteristic path length’ and ‘clustering’ and the derived ‘small worldliness’ of hierarchical networks resemble small-world networks. Table 6 shows that, like real world examples of small-world networks, the characteristic path length of the fully regular hierarchical network is larger than that of a randomly created network with the same number of vertices, but the clustering coefficient is much higher.
When applying Watts and Strogatz’ (1998) definition of a small-world network to a hierarchical network, it is found to already possess small-world properties. The consequence of this fact is that there is little to win in Small-worldliness, as the small-worldliness for hierarchical networks is already very high.
-./01.2 -3.4567 8./01.2 83.4567
Film actors 3.65 2.99 0.79 0.00027
Power grid 18.7 12.4 0.080 0.005
C. Elegans 2.65 2.25 0.28 0.05
Watts & Strogatz 50.45 3.27 0.67 0.009
Hierarchical 9.03 5.21 0.800 0.0035
Table 6: The small-world phenomenon is naturally present in a fully regular hierarchical network (Clique size 3, 6 layers): � ≥�:;<=>?but � ≫ �:;<=>?counts for the hierarchical network as well as for the example networks (partially reproduced from Watts
and Strogatz (1998); n=1000)
Hierarchical networks with a persistent hierarchy (meaning the vertical edges in the network are non-rewire-able) are more resilient to the clustering-degrading effect randomization has. This is probably due to the fact that the clique’s parent will always stay linked with its child vertices and thus keep a certain degree of clustering.
Shallowly layered hierarchies do tend to suffer from randomization (in terms of the ratio of clustering and characteristic path length), rather than to take profit from it. This is, again, due to the effective structure of the initial hierarchical network; the small gain randomization produces for characteristic path length by directly connecting cliques that were previously connected via the center vertex is counteracted by the decrease in clustering. This counts even more for networks with small cliques, since the percentage of the affected vertices in a clique is higher as cliques are smaller (1 of a clique of 3 > 1 of a clique of 10). Deeply layered hierarchies (e.g. the 11 layer deep hierarchy used in experiment 4) do benefit from slight randomization since for networks with more layers, shortcuts formed by directly connected cliques replace much longer paths containing the center node.
6.2 Limitations of results Since we are modeling a real world process, many factors that might influence a real world situation are omitted for the sake of the model’s simplicity. The model is therefore strictly theoretical, it has not been empirically tested with a real situation, thus results are yet unconfirmed. Moreover, providing
29
results over generalized situations, implies that a simple computer model will never be able to behave exactly like every natural communication network, and produce equally generalized results.
The model itself is subject to several limitations, of which we list the following three:
Firstly, with each rewire, we replaced formal connections with informal connections, implicating that when spending more time on informal contacts, less time is spent on formal contacts. This assumption that every added connection deletes another one might be exaggerated. In the real world, it is very well possible for agents to make new contacts while keeping old ones, but there were two main reasons for this choice: Firstly this kept the different experiments comparable. Secondly, only adding new connections would eventually result in a fully connected network, and all measured values would automatically be optimal.
Secondly, measuring a network’s effectiveness by only clustering and characteristic path length might be a bit too focused for actual practical application. There are many factors that are important to many different kinds of organizations, like creativity, message propagation speed, message quality, etc. For some organizations, clustering is more important, while for others shorter path lengths are. When taking only clustering and characteristic path length into account, the ratio can be varied depending on the application.
Lastly, hierarchical networks take a central role in this thesis. Since today, many organizations are far from strictly hierarchical, but rather of a holistic, networked, flexible and even self-organizing nature, it is only applicable to a limited set of organizations. This limitation could be removed by expanding or replacing the communication structure or the dynamics of the model.
6.3 Future research We presented an explorative study in which we made many assumptions and practical decisions for the sake of simplicity of the model. We would like to invite other scientists to convert other organizational communication structures to a network graph and use (parts of) our model to their advantage. We see two ways of using this explorative study as a basis for further research.
Firstly, it might be interesting to extend the model with the following:
• Measure the average first, second and third degree network size of an agent. These are indications of the availability of information available to the agent.
• Add message or contact quality, possibly by incorporating weighted connections. This is an important factor in communication, but hard to model accurately.
• Replacing the hierarchical network with those found in other organization forms. Currently, most organizations are far from solely hierarchically structured. Matrix organizations are potentially interesting subjects, as they are more contemporary organization structures than the strictly hierarchical one assumed in this thesis and will most probably show very different results.
Secondly, the created model has not been validated in real world situations. Empirical validation of the model would bring new insights on how to adjust and interpret the model and the interpretation of its results.
30
7 Conclusions
This thesis presented a model of adding informal contacts to a hierarchical organizational communication network. In the first Chapter, three research questions were introduced that will be answered subsequently in the following three Paragraphs.
7.1 Modeling a hierarchical communication network RQ 1: How should the effect of informal connections on communication efficiency in hierarchical organizations be modeled?
The goal of research question 1 was to incorporate these components in a model that could be used to determine the effect of informal contacts on communication efficiency in organizations. In Paragraph 1.3, we recognized the following three components in the problem statement: hierarchical organizations, informal connections, and communication efficiency.
We conclude that the effect of informal connections on communication efficiency in hierarchical organizations should be modeled as a hierarchical network where randomizing connections represent informal contacts, and clustering coefficient, characteristic path length, and their ratio, small-worldliness stand for the network’s communication efficiency.
The hierarchical organization was represented by a hierarchical structure that forms the basis of the basis of the model. Its vertical, hierarchical manager-subordinate-relations form the first of two types of contacts that constitute the bureaucratic communication lines. The second type of contact is the relation between direct colleagues in each team. Since it is very unlikely that a communication line between subordinate and his superior breaks, the vertical bonds in the hierarchy are persistent in our model and only bonds between “colleagues” can be broken. Together, the vertical hierarchical structure and the horizontally formed cliques form the formal network on which we conducted our experiments.
Informal contacts are represented by randomly altering the initial, fully hierarchical network, introducing random connections between nodes in the network resembling contacts that randomly meet and connect. By deleting a contact for every contact added, the total number of contacts in the organization was kept fixed. This had two reasons: firstly, only adding connections without deleting any would result in a fully connected graph , and secondly, the amount of contacts an agent can maintain are limited, connections were rewired instead of added, meaning a random connection A-B is removed and reconnected to A-C.
Communication efficiency is measured in terms of the degree of connectedness within teams (high clustering) and communication distance (characteristic path length). Their ratio ‘small-worldliness’ provides denotes both properties in a single value. The higher this value, the more efficient the communication network.
The event of introducing randomness to regular network graphs inevitably lead to the work of Watts & Strogatz (1998). They found that many real world networks, including communication networks, share the properties of what they called a ‘small-world network’; a small characteristic path length and a high degree of clustering. Watts and Strogatz also presented an experiment in which they created such a network. This thesis used a model similar to theirs, but with a hierarchical network, programmed in the NetLogo environment (Wilensky, 1999).
7.2 Consequences of random connections RQ 2: Do the structural properties of organizational communication networks change when informal connections are formed?
31
The answer to this research question is: “Yes.” Adding informal connections to an organizational communication network adds potentially shorter communication lines than the traditional hierarchy allowed for.
In 1998, Watts and Strogatz concluded shortening path length while maintaining high clustering. Since hierarchical networks already have a short path length there is a relatively small decrease in path length. In shallow networks (until approximately 9 layers deep), the small-worldliness peak is diminished into an initial stalling of the decreasing trend. As hierarchies get deeper than 9 layers, the random connections have the opportunity of bridging greater distances and small-worldliness actually peaks in the early stages of rewiring and the small-worldliness graphs are comparable to those of the Watts and Strogatz replication experiment mentioned in the first Paragraphs of the Chapters 5 and 6.
7.3 Hierarchy variations RQ 3: Do informal connections affect different variations of organizational communication structures equally?
The answer to this research question is a qualified: “No.” While organizations with many hierarchical layers do benefit from informal connections, very shallow organizations have very little to improve in terms of communication path length. The degrading of clustering of teams still applies, thus resulting in a lower overall effectiveness for those small organizations. Also, clustering tends to decline faster when organizational teams are smaller. This effect is similar to small teams with individuals that are very well connected outside their team and have few links with their direct colleagues.
In organizational context, these results could be interpreted as informal contacts being important for efficient communication in large, multilayer, complex organizations, while smaller, shallow organizations benefit more from a hierarchical with only some informal contacts. It seems that especially in small organizations the limitations of this model come into play, as in small organizations everybody is likely to know each other and probably the number of agents in the organization probably exceeds the limit on the amount of contacts.
7.4 Final words In the onset of this thesis, we presented the following problem statement: “How do informal contacts impact the communication efficiency of a hierarchical organizational communication structure?”. In line with the presented results, our experiments indicate the following:
While informal contacts have a positive effect on (decreasing) the length of communication paths in hierarchical organizations, in most of our experiments, the clustering of teams tends to decrease at a similar or even greater rate, resulting in a declining small-worldliness (and thus communication efficiency). Assumed that informal contacts replace formal, hierarchically imposed contacts, the adding of informal contacts slowly degrades the clustering of the network. Generally, for complex organizations with large teams and many organizational layers, this degrading of team clustering takes place at a slower pace than the fast decline of the communication path length, resulting in a rise in overall communication efficiency.
We conclude that in the effort to keep organizational teams clustered while minimizing communication path lengths, informal contacts play an invaluable role in large organizations. In smaller organizations simulation results show that the decrease in communication path length pairs with a decrease in clustering of colleagues in teams and decreases overall efficiency after the first informal contacts are made. There are however several limitations that prevent practical applications of this theoretical simulation model. We recommend enhancing the realism of the model by adding the factors creativity, and quality of transferred information. Also, there has been no verification with any practical situations.

32
We hope that this thesis will contribute to further modeling studies on communication networks and inspire other scientists to elaborate on the presented model.
33
References
Aral, S., Brynjolfsson, E., & Van Alstyne, M. (2007). Productivity effects of information diffusion in network. Preliminary draft version, MIT Sloan School of Management.
Barabási, A.-L. (1999). Diameter of the world-wide web. Nature, 401, 130-131.
Bian, Y. (1997). Bringing strong ties back in: Indirect ties, network bridges, and job searches in China. American Sociological Review, 62(3), 366-385.
Brzozowski, M. (2011). Who should I follow?: Recommending people in directed social networks. Proceedings of the Fifth International AAAI Conference on Weblogs and Social Media. Retrieved November 20, 2011 from http://www.aaai.org/ocs/index.php/ICWSM/ICWSM11/paper/view/2867
Burt, R. (1992). Structural holes: The social structure of competition. Cambridge, MA, Harvard University Press.
Collins, R. (1998). The sociology of philosophies: A précis. Management Communication Quarterly, 19, 653-660.
Cormen, T., Leiserson, C., Rivest, R., & Stein, C., (2001). Introduction to Algorithms. (2nd ed.). Cambridge, MA, MIT Press and McGraw-Hill. pp. 595-601.
Davis, W. & O’Connor, R. (1976). Serial transmission of information: A study of the grapevine. Journal of Applied Communication Research, 5, 61-72.
Dörner, C., Pipek, V., & Won, M. (2007). Supporting expertise awareness: Finding out what others know. Proceedings of the 2007 symposium on Computer human interaction for the management of information technology. ACM New York, NY, USA.
DiFonzo, N., & Bordia, P. (2007). Rumor psychology: Social & organizational approaches. Washington, DC, American Psychological Association.
Dijkstra, E. (1959). A note on two problems in connexion with graphs. Numerische Mathematik 1, 269-271.
Edmonds, B. (2001). Complexity and Scientific Modelling. Foundations of Science. 5(3), 379-390.
Erdős, P., Rényi, A. (1959). On random graphs. I. Publicationes Mathematicae, 6, 290-297.
Faloutsos, M., Faloutsos, P., & Faloutsos, C. (1999). On the power-law relationships of the internet topology. Computer Communications Review, 29, 251-262.
Fell, D., & Wagner, A. (2001). The small world of metabolism. Nature, 18, 1121-1122.
Granovetter, M. (1973). The strength of weak ties. American Journal of Sociology, 6, 1360-1380.
Granovetter, M. (1983) The strength of weak ties: A network theory revisited. Sociological Theory. 1, 201–233.
Hansen, M. (1999). The search-transfer problem: The role of weak ties in sharing knowledge across organization subunits. Administrative Science Quarterly, 44(1), 82-111.
34
Holland, P., & Leinhardt, S. (1971). Transitivity in structural models of small groups. Comparative Group Studies, 2, 107-124.
Jeong, H., Tombor, B., Albert, R., Oltvai, Z., & Barabási, A.-L. (2000). The large-scale organization of metabolic networks. Nature, 407, 651-654.
Holland, P.W. & Leinhardt, S. (1971). Transitivity in structural models of small groups. Comparative Group Studies, 2, 107-124.
Jalili, M. (2011).Synchronizability of dynamical scale-free networks subject to random errors. Physica A, 390, 4588-4595.
John, A. & Seligmann, D. (2006). Collaborative tagging and expertise in the enterprise. Edinburgh, UK: Unpublished. Retrieved November 20, 2011 from http://wwwiti.cs.uni-magdeburg.de/iti_db/lehre/Seminar%20Virtual%20Engineering/Paper/folksonomy2.pdf
Krackhardt, D., (1992). The strength of strong ties: The importance of philos in organizations. In N. Nohria & R. Eccles (Eds.), Networks and Organizations, 216-239. Boston, M, Harvard Business School Press.
Krackhardt D., & Hanson, R. (1993). Informal Networks: The company behind the chart. Harvard Business Review. 71(4), 104-111.
McMillan, E. (2002). Considering organisation structure and design from a complexity paradigm perspective. In G. Frizzelle & H. Richards, (Eds.) Tackling industrial complexity: The ideas that make a difference. Institute of Manufacturing, University of Cambridge.
Milgram, S. (1967). The small-world problem. Psychology Today, 1(1), 61‐67. Mintzberg, H. (1980). Structure in 5s: A synthesis of the research on organization design. Management
Science. 26(3), 322-341.
Mintzberg, H. (1983). Structures in fives: Designing effective organizations. Upper Saddle River, NJ, Prentice Hall.
Newman, M., Barabási, A.-L., & Watts, D., (2006). The structure and dynamics of networks. Princeton, NJ, Princeton University Press.
Pool, I., & Kochen, M. (1978). Contacts and influence. Social Networks, 1(79), 5-51.
Rapoport, A. & Horvath, W. (1961). A study of a large sociogram. Behavioral Science, 6, 279-291.
Reagans, R., & McEvily, B. (2003). Network structure and knowledge transfer: The effects of cohesion and range. Administrative Science Quarterly, 48, 240-267.
Uzzi, B., & Spiro, J. (2005). Collaboration and creativity: The small world problem. American Journal of Sociology, 111(2), 447-504.
Walsh, T. (1999). Search in a small world. In Dean, T. (Ed.), Proceedings of the Sixteenth International Joint Conference on Artificial Intelligence (pp. 1172-1177). San Francisco, CA, Morgan Kaufman Publishers Inc.
Watts, D. (1999). Networks, dynamics, and the small-world. American Journal of Sociology, 105(2), 493-527.

35
Watts, D. & Strogatz, S., (1998). Collective dynamics of small-world networks. Nature, 393, 440-442.
Wilensky, U. (1999). NetLogo. Center for Connected Learning and Computer-Based Modeling, Northwestern University, Evanston, IL. Retrieved Nov 20, 2010 from: http://ccl.northwestern.edu/netlogo/
Wilensky, U. (2005). NetLogo Small Worlds model. Retrieved Nov 20, 2010 from: http://ccl.northwestern.edu/netlogo/models/SmallWorlds. Center for Connected Learning and Computer-Based Modeling, Northwestern University, Evanston, IL.
Wu, L., Waber, B., Aral, S., Brynjolfsson, E., & Pentland, A. (2008). Mining face-to-face interaction networks using sociometric badges: Predicting productivity in an IT configuration task. Draft. Retrieved on September 20, 2012 from: http://ssrn.com/abstract=1130251
36
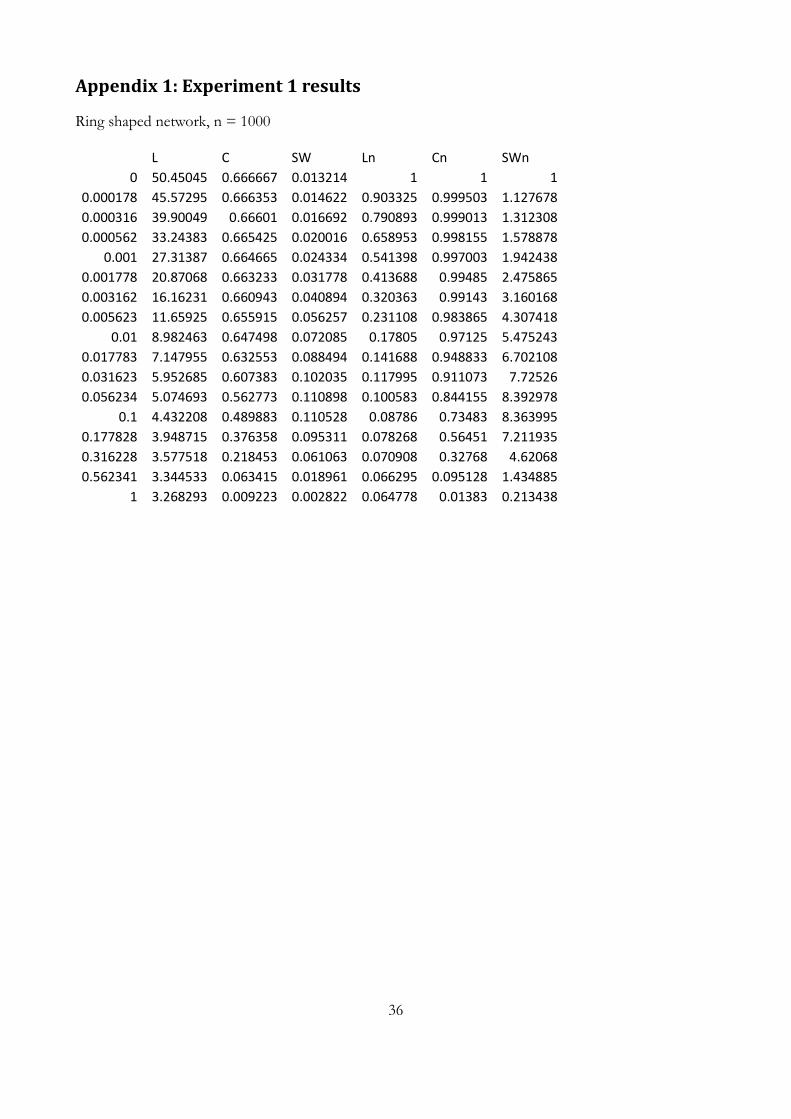
Appendix 1: Experiment 1 results
Ring shaped network, n = 1000
L C SW Ln Cn SWn 0 50.45045 0.666667 0.013214 1 1 1
0.000178 45.57295 0.666353 0.014622 0.903325 0.999503 1.127678 0.000316 39.90049 0.66601 0.016692 0.790893 0.999013 1.312308 0.000562 33.24383 0.665425 0.020016 0.658953 0.998155 1.578878
0.001 27.31387 0.664665 0.024334 0.541398 0.997003 1.942438 0.001778 20.87068 0.663233 0.031778 0.413688 0.99485 2.475865 0.003162 16.16231 0.660943 0.040894 0.320363 0.99143 3.160168 0.005623 11.65925 0.655915 0.056257 0.231108 0.983865 4.307418
0.01 8.982463 0.647498 0.072085 0.17805 0.97125 5.475243 0.017783 7.147955 0.632553 0.088494 0.141688 0.948833 6.702108 0.031623 5.952685 0.607383 0.102035 0.117995 0.911073 7.72526 0.056234 5.074693 0.562773 0.110898 0.100583 0.844155 8.392978
0.1 4.432208 0.489883 0.110528 0.08786 0.73483 8.363995 0.177828 3.948715 0.376358 0.095311 0.078268 0.56451 7.211935 0.316228 3.577518 0.218453 0.061063 0.070908 0.32768 4.62068 0.562341 3.344533 0.063415 0.018961 0.066295 0.095128 1.434885
1 3.268293 0.009223 0.002822 0.064778 0.01383 0.213438
37
Appendix 2: Experiment 2 results
Hierarchical network, non-persistent hierarchy. Cliquesize 3, 6 layers, n=1093
L C SW Ln Cn SW 0 9.036642 0.800732 0.088609 1 1 1
0.000178 9.03397 0.80045 0.088604 0.999705 0.99968 0.99997 0.000316 9.030415 0.800135 0.088604 0.999315 0.99928 0.99997 0.000562 9.0271 0.79897 0.088508 0.998945 0.997805 0.99886
0.001 9.00595 0.79831 0.088643 0.99661 0.99699 1.000385 0.001778 8.98877 0.796745 0.088638 0.99469 0.99503 1.00034 0.003162 8.986245 0.794035 0.088361 0.994435 0.991655 0.99725 0.005623 8.909075 0.787385 0.08838 0.985885 0.983335 0.99746
0.01 8.850075 0.78062 0.088205 0.979365 0.97489 0.995515 0.017783 8.6508 0.764035 0.08832 0.95731 0.954175 0.99675 0.031623 8.328955 0.731395 0.087814 0.92169 0.913425 0.99108 0.056234 7.75818 0.682585 0.087983 0.85852 0.85247 0.992975
0.1 7.116895 0.59029 0.082942 0.78757 0.737205 0.93603 0.177828 6.41157 0.4539 0.070794 0.70951 0.566845 0.798755 0.316228 5.8044 0.256655 0.044217 0.64232 0.320535 0.49897 0.562341 5.379865 0.066565 0.012373 0.595335 0.08312 0.13958
1 5.212605 0.0035 0.000671 0.57684 0.00438 0.007575
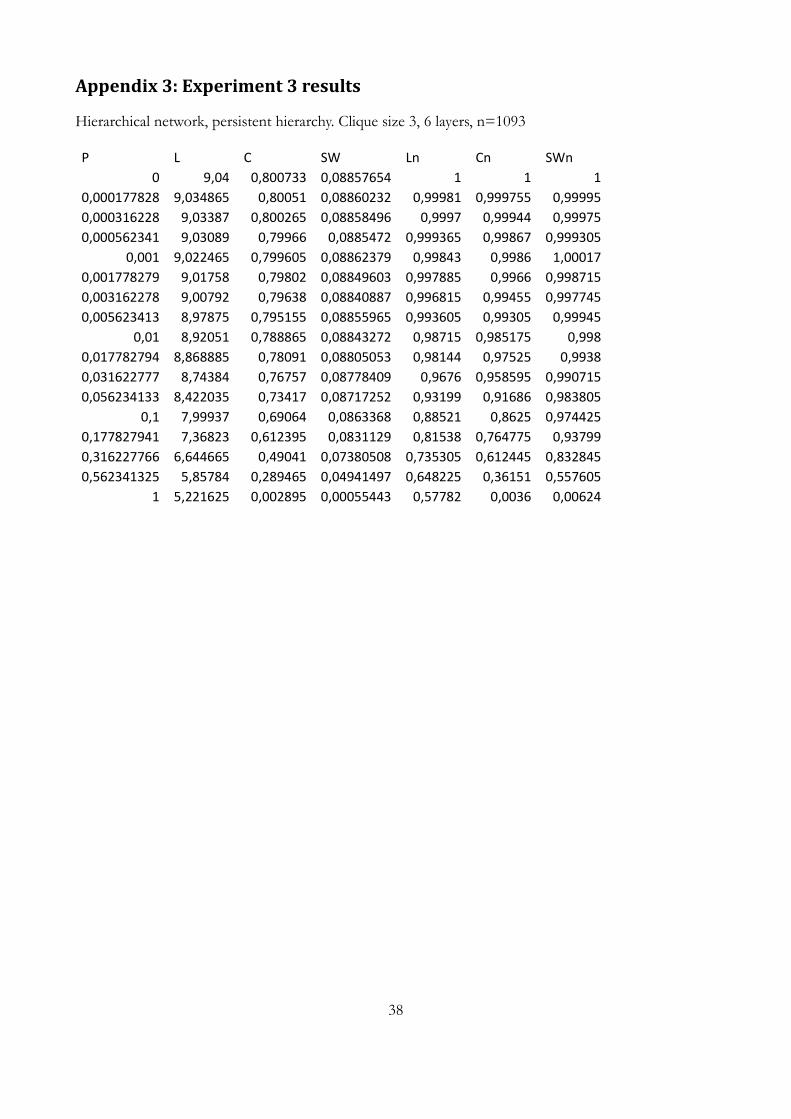
38
Appendix 3: Experiment 3 results
Hierarchical network, persistent hierarchy. Clique size 3, 6 layers, n=1093
P L C SW Ln Cn SWn 0 9,04 0,800733 0,08857654 1 1 1
0,000177828 9,034865 0,80051 0,08860232 0,99981 0,999755 0,99995 0,000316228 9,03387 0,800265 0,08858496 0,9997 0,99944 0,99975 0,000562341 9,03089 0,79966 0,0885472 0,999365 0,99867 0,999305
0,001 9,022465 0,799605 0,08862379 0,99843 0,9986 1,00017 0,001778279 9,01758 0,79802 0,08849603 0,997885 0,9966 0,998715 0,003162278 9,00792 0,79638 0,08840887 0,996815 0,99455 0,997745 0,005623413 8,97875 0,795155 0,08855965 0,993605 0,99305 0,99945
0,01 8,92051 0,788865 0,08843272 0,98715 0,985175 0,998 0,017782794 8,868885 0,78091 0,08805053 0,98144 0,97525 0,9938 0,031622777 8,74384 0,76757 0,08778409 0,9676 0,958595 0,990715 0,056234133 8,422035 0,73417 0,08717252 0,93199 0,91686 0,983805
0,1 7,99937 0,69064 0,0863368 0,88521 0,8625 0,974425 0,177827941 7,36823 0,612395 0,0831129 0,81538 0,764775 0,93799 0,316227766 6,644665 0,49041 0,07380508 0,735305 0,612445 0,832845 0,562341325 5,85784 0,289465 0,04941497 0,648225 0,36151 0,557605
1 5,221625 0,002895 0,00055443 0,57782 0,0036 0,00624
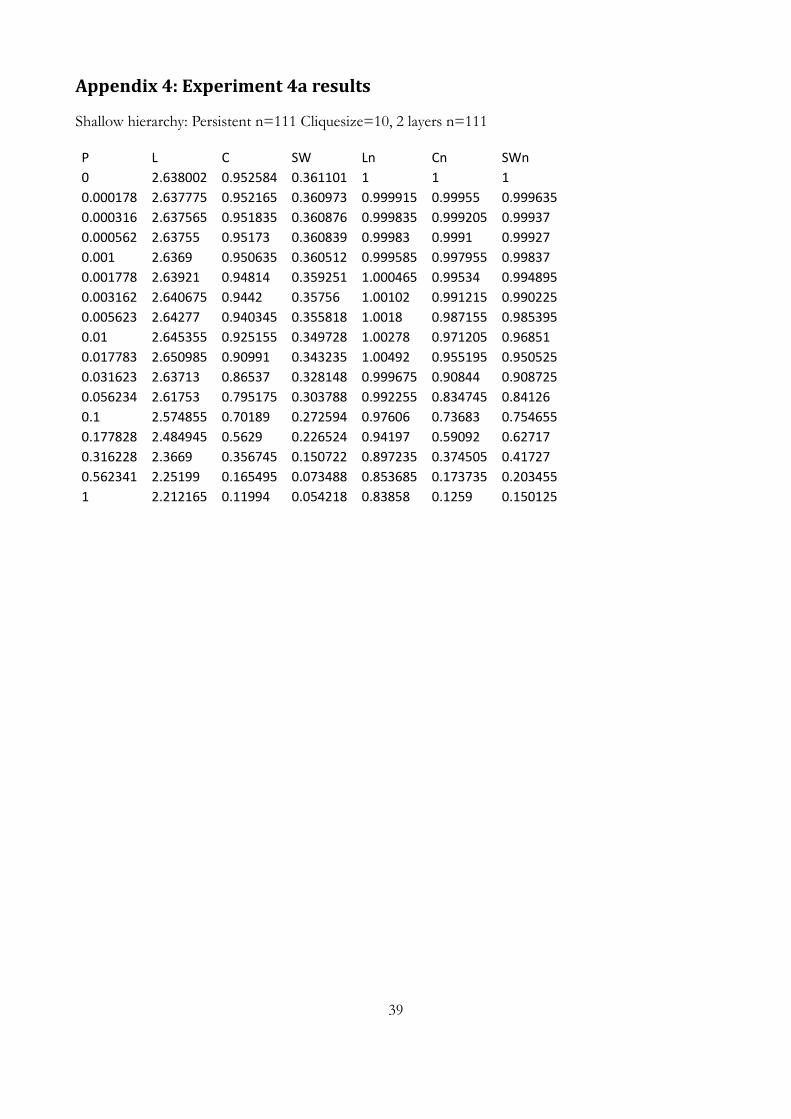
39
Appendix 4: Experiment 4a results
Shallow hierarchy: Persistent n=111 Cliquesize=10, 2 layers n=111
P L C SW Ln Cn SWn
0 2.638002 0.952584 0.361101 1 1 1
0.000178 2.637775 0.952165 0.360973 0.999915 0.99955 0.999635
0.000316 2.637565 0.951835 0.360876 0.999835 0.999205 0.99937
0.000562 2.63755 0.95173 0.360839 0.99983 0.9991 0.99927
0.001 2.6369 0.950635 0.360512 0.999585 0.997955 0.99837
0.001778 2.63921 0.94814 0.359251 1.000465 0.99534 0.994895
0.003162 2.640675 0.9442 0.35756 1.00102 0.991215 0.990225
0.005623 2.64277 0.940345 0.355818 1.0018 0.987155 0.985395
0.01 2.645355 0.925155 0.349728 1.00278 0.971205 0.96851
0.017783 2.650985 0.90991 0.343235 1.00492 0.955195 0.950525
0.031623 2.63713 0.86537 0.328148 0.999675 0.90844 0.908725
0.056234 2.61753 0.795175 0.303788 0.992255 0.834745 0.84126
0.1 2.574855 0.70189 0.272594 0.97606 0.73683 0.754655
0.177828 2.484945 0.5629 0.226524 0.94197 0.59092 0.62717
0.316228 2.3669 0.356745 0.150722 0.897235 0.374505 0.41727
0.562341 2.25199 0.165495 0.073488 0.853685 0.173735 0.203455
1 2.212165 0.11994 0.054218 0.83858 0.1259 0.150125
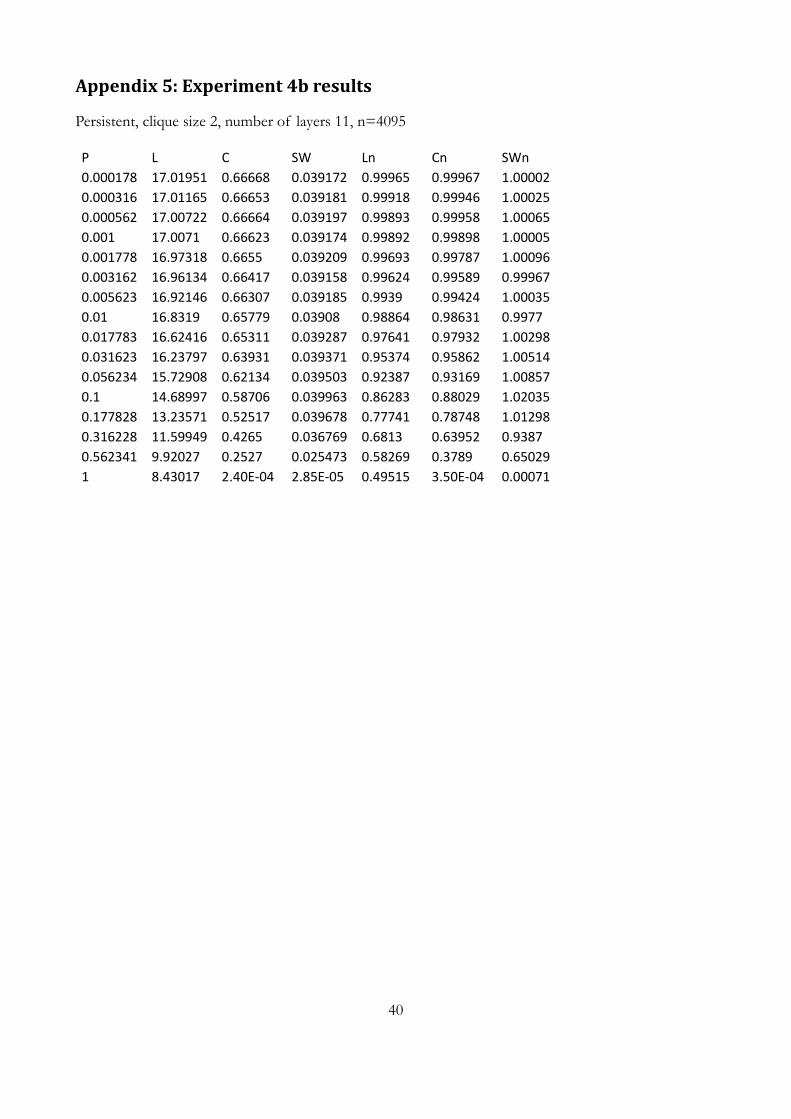
40
Appendix 5: Experiment 4b results
Persistent, clique size 2, number of layers 11, n=4095
P L C SW Ln Cn SWn
0.000178 17.01951 0.66668 0.039172 0.99965 0.99967 1.00002
0.000316 17.01165 0.66653 0.039181 0.99918 0.99946 1.00025
0.000562 17.00722 0.66664 0.039197 0.99893 0.99958 1.00065
0.001 17.0071 0.66623 0.039174 0.99892 0.99898 1.00005
0.001778 16.97318 0.6655 0.039209 0.99693 0.99787 1.00096
0.003162 16.96134 0.66417 0.039158 0.99624 0.99589 0.99967
0.005623 16.92146 0.66307 0.039185 0.9939 0.99424 1.00035
0.01 16.8319 0.65779 0.03908 0.98864 0.98631 0.9977
0.017783 16.62416 0.65311 0.039287 0.97641 0.97932 1.00298
0.031623 16.23797 0.63931 0.039371 0.95374 0.95862 1.00514
0.056234 15.72908 0.62134 0.039503 0.92387 0.93169 1.00857
0.1 14.68997 0.58706 0.039963 0.86283 0.88029 1.02035
0.177828 13.23571 0.52517 0.039678 0.77741 0.78748 1.01298
0.316228 11.59949 0.4265 0.036769 0.6813 0.63952 0.9387
0.562341 9.92027 0.2527 0.025473 0.58269 0.3789 0.65029
1 8.43017 2.40E-04 2.85E-05 0.49515 3.50E-04 0.00071
41
Appendix 6: NetLogo code (non-persistent model)
A digital version of this model is available at: http://remkoarts.nl/masterthesis/netlogo/
1 globals 2 [
3 clust-coeff ;; the clustering coefficient of the network 4 ;; this is the average of clustering coefficients of all nodes 5 average-path-length ;; average path length of the network 6 clustering-coefficient-of-lattice ;; the clustering coefficient of the initial lattice 7 average-path-length-of-lattice ;; average path length of the initial lattice 8 ;; used to denote distance between two nodes which 9 ;; don't have a connected or unconnected path between them 10 num-valid-nodes 11 n1 12 n2 13 is-connected? 14 skipped-rewires ;; Due to the planned rewire resulting in a disconnected graph 15 disconnect-repeats 16 avg_K 17 ]
18 19 turtles-own 20 [
21 distance-from-other-nodes 22 node-clustering-coefficient 23 clique-iterator-number ;; Iterates within each clique 24 clique-number ;; Number of the clique the turtle is in 25 manager 26 is-manager 27 my-clustcoeff 28 ]
29 30 ;;;;;;;;;;;;;;;;;;;;;;;;;;;;;;;; 31 ;;; Initial setup procedures ;;; 32 ;;;;;;;;;;;;;;;;;;;;;;;;;;;;;;;; 33 34 ;; Setup small world topology 35 to initial-setup 36 set disconnect-repeats 1
37 ca 38 if delete-file? [
39 ifelse file-exists? "output.csv" 40 [
41 file-close-all 42 carefully [ file-delete "output.csv" ] [ print error-message ]
43 ][
44 print "File output.csv not deleted: file does not exist" 45 ]
46 ]
47 set-default-shape turtles "outlined circle" 48 49 create-turtles num-nodes 50 ask turtles [reset-node]
51 create-tree 52 do-layout 53
54 set is-connected? do-calculations
55 set clustering-coefficient-of-lattice clust-coeff
56 set average-path-length-of-lattice average-path-length
42
57 set avg_K (( 2 * count links) / count turtles)
58 refresh-colors 59 display 60 print "Output format: Rewiring probability P , Avg path length L , Clustering coefficient C" 61 print-init-values 62 end 63 64 to create-tree 65 let managing_turtle 0
66 let clique_iterator 1
67 let clique_number 0
68 foreach (but-first (sort [who] of turtles)) [
69 if clique_iterator > clique-size [
70 set clique_iterator 1
71 set managing_turtle (managing_turtle + 1)
72 set clique_number (clique_number + 1)
73 ]
74 ask turtle ? [
75 create-link-with turtle managing_turtle 76 ;; Set the turtle's clique iterator number 77 set clique-iterator-number clique_iterator
78 ;; Set the turtle's clique number 79 set clique-number clique_number
80 ;; Clique: interconnect with rest of clique 81 if clique-iterator-number > 1 [
82 let i ((clique-iterator-number) - 1 )
83 while [ i > 0 ] [
84 create-link-with turtle (who - i)
85 set i (i - 1)
86 ]
87 ]
88 ]
89 ask turtle ? [set manager managing_turtle]
90 ask turtle managing_turtle [set is-manager true]
91 set clique_iterator (clique_iterator + 1)
92 ]
93 end 94 95 ;;;;;;;;;;;;;;;;;;;;;;;;;; 96 ;;; Runtime procedures ;;; 97 ;;;;;;;;;;;;;;;;;;;;;;;;;; 98 99 to repeat-vary-p 100 if file-output? [ file-write-init-values ]
101 print "repeat-vary-p [ RUNNING ]" 102 let testnumber 1
103 repeat repeat-vary-rewiring [
104 type "vary-p testnumber: " 105 type testnumber 106 type " / " 107 print repeat-vary-rewiring 108 vary-p 109 set testnumber ( testnumber + 1 )
110 ]
111 print "repeat-vary-p [ DONE ]" 112 end 113 114 to vary-p 115 ;; Temporarily set delete-file? to off during vary-p. Put back to initial value after running. 116 let init-del-file? delete-file?
117 set delete-file? false
118

43
119 clear-plot 120 initial-setup 121 set rewiring-probability 0.0
122 let log-rewire-prob -4
123 if logarithmic? [
124 set rewiring-probability (10 ^ log-rewire-prob)
125 ]
126 print "vary-p [ RUNNING ]" 127 ifelse logarithmic? [
128 set rewiring-probability 0
129 while [log-rewire-prob <= 0] [
130 ; foreach [-4.0 -3.5 -3 -2.5 -2 -1.5 -1 -0.5 0] [ 131 set log-rewire-prob log-rewire-prob + 0.25
132 ; print se "log-rewire-prob =" log-rewire-prob 133 set rewiring-probability (10 ^ log-rewire-prob)
134 setup 135 ]
136 ][
137 while [rewiring-probability <= 1.0] [
138 setup 139 set rewiring-probability rewiring-probability + 0.005
140 ]
141 ]
142 print "vary-p [ DONE ]" 143 print "----" 144 if file-output? [ do-filewriting-linebreak ]
145 ;; If delete-file? was set to off at the start vary-p, is is put back to the initial value. 146 set delete-file? init-del-file?
147 end 148 149 to setup 150 set is-connected? false
151 ;; If the network is disconnected, run setup. Otherwise output results. 152 while [not is-connected?] [
153 set disconnect-repeats disconnect-repeats + 1
154 print se "disconnect-repeats:" disconnect-repeats 155 ; print "Graph not connected [ RUNNING setup ]" 156 ;; Refresh tree 157 ask turtles [reset-node]
158 ask links [die]
159 create-tree 160 rewire-network 161 set is-connected? do-calculations
162 ]
163 ;do-layout 164 if plot-output? [ do-plotting ]
165 if file-output? [ do-filewriting ]
166 if print-output? [ do-printing ]
167 refresh-colors 168 display 169 end 170 171 to rewire-network 172 ; print "rewire-network [ ... ]" 173 ask links 174 [
175 if ( not ( [who] of end1 = [manager] of end2 )) [
176 if (random-float 1) < rewiring-probability
177 [
178 ask end1 179 [
180 create-link-with one-of other turtles with [not link-neighbor? myself ]
181 [set color black + 1.5]
44
182 ]
183 die 184 ]
185 ]
186 ]
187 ; print "rewire-network DONE" 188 end 189 190 ; ************************ 191 ; Update Procedures 192 ; ************************ 193 194 to-report num-nodes 195 ;; Start with president 196 let numnodes 1
197 ;; Add nodes per layeron 198 let i layers
199 while [i > 0] [
200 set numnodes (numnodes + clique-size ^ i)
201 set i (i - 1)
202 ]
203 report numnodes 204 end 205 206 to reset-node 207 set color gray - 0.75
208 set size 2.1
209 end 210 211 to refresh-colors 212 ask turtles with [is-manager = true] [set color blue]
213 ask turtle 0 [set color red]
214 ask turtles [
215 ifelse show-clustcoeff?[
216 set label (precision my-clustcoeff 3)
217 ][
218 set label ""
219 ]
220 ]
221 ask links [
222 set color gray + 1.5
223 ifelse ( [who] of end1 = [manager] of end2 ) [
224 set color red - 1.5
225 ] [
226 if ( [clique-number] of end1 = [clique-number] of end2 ) [
227 set color sky
228 ]
229 ]
230 ]
231 end 232 233 ;; Tree layout all nodes and links 234 to do-layout 235 layout-radial turtles links (turtle 0)
236 ;; space out turtles to see clustering 237 ask turtles [
238 facexy 0 0 239 ;; Let "even" turtles step forward to create a better view of cliques 240 if clique-iterator-number mod 2 = 0 [ fd 4 ]
241 ]
242 end 243 244 to-report do-calculations 245 ;; set up a variable so we can report if the network is disconnected
45
246 let connected? false
247 248 ;; Check whether network got disconnected 249 let avpl __average-path-length turtles links
250 if ( avpl > -1 ) [
251 ; print "Graph connected: [ PROCEEDING ]" 252 set average-path-length avpl
253 set connected? true
254 ;; find the clustering coefficient and add to the aggregate for all iterations 255 cluster-coeff 256 ]
257 ;; report whether the network is connected or not 258 report connected? 259 end 260 261 ; ************************ 262 ; calculation of clustering coefficient as described by Watts and Strogatz 263 ; ************************ 264 to cluster-coeff 265 let numqualifyingnodes 0
266 let clustcoeffsum 0
267 268 ;; Calculate clustercoefficient per turtle, adding found clustering coefficient and +1 numqualifyingnodes for each node 269 ask turtles [
270 let tot-links 0 ;; The number of links among neighbors of this link
271 let current-node self
272 ask link-neighbors [
273 set tot-links (tot-links + count link-neighbors with [link-neighbor?
current-node])
274 ]
275 276 ;; Note: Links are all counted twice (A-B & B-A), but doing the same with
possible-links cancels this out 277 set tot-links tot-links
278 279 let num-neighbors count link-neighbors
280 ;; ?? What to do with num-neighbors == 1 ?? 281 if (num-neighbors > 1) [
282 ;; Watts and Strogatz cc = neighbors * (neighbors-1) / 2. 283 ;; Note: Since tot-links are counted twice (A-B & B-A) as well, the / 2 is left out. 284 let possible-links (num-neighbors * (num-neighbors - 1))
285 ;; Calculate the clustering coefficient for this node 286 let clustcoeff (tot-links / possible-links)
287 ;; Add the clustering coefficient to the sum of cc's 288 set clustcoeffsum (clustcoeffsum + clustcoeff)
289 ;; Set turtle variable my-clustcoeff for label display purposes 290 set my-clustcoeff clustcoeff
291 set numqualifyingnodes numqualifyingnodes + 1
292 ]
293 ]
294 set clust-coeff (clustcoeffsum / (count turtles))
295 end 296 297 ;;;;;;;;;;;;;;;;;;;;;;;;;;;;;;;;;;;;;;;;;;;;;;;;;;;;;;;;;;;;;; 298 ;;; Plotting, filewriting and printing (to command center) ;;; 299 ;;;;;;;;;;;;;;;;;;;;;;;;;;;;;;;;;;;;;;;;;;;;;;;;;;;;;;;;;;;;;; 300 to do-plotting 301 ;; plot the number of infected individuals at each step 302 set-current-plot "Normalized C and L" 303 set-current-plot-pen "av-path" 304 plotxy rewiring-probability average-path-length / average-path-length-of-
lattice
46
305 306 set-current-plot-pen "cc" 307 ;; note: dividing by initial value to normalize the plot 308 plotxy rewiring-probability clust-coeff / clustering-coefficient-of-lattice
309 set-current-plot-pen "C/L" 310 plotxy rewiring-probability ( ( clust-coeff / clustering-coefficient-of-
lattice ) /
( average-path-length / average-path-length-of-lattice ) )
311 end 312 313 to file-write-init-values 314 file-open "output.csv" 315 file-print "====" 316 file-print "Initial values (cliquesize, levels, num-nodes, L, C)" 317 file-type "Team-size : " file-print clique-size 318 file-type "layers : " file-print layers 319 file-type "# nodes : " file-print count turtles 320 file-type "Initial L : " file-print average-path-length-of-lattice 321 file-type "Initial C : " file-print clustering-coefficient-of-lattice 322 file-type "Samples : " file-print repeat-vary-rewiring 323 file-print " " 324 file-print "Output format: Rewiring probability P , Avg path length L , Clustering coefficient C, Normalized Avg path length L , Normalized Clustering coefficient C, Smallworldliness C(norm)/L(norm)" 325 file-print "====" 326 file-flush 327 file-close-all 328 end
329 330 to print-init-values 331 print "Initial values (cliquesize, levels, num-nodes, L, C)" 332 type clique-size type ", " 333 type layers type ", " 334 type count turtles 335 type ", " 336 type precision average-path-length-of-lattice 4 337 type ", " 338 print precision clustering-coefficient-of-lattice 4 339 end 340 341 to do-filewriting 342 file-open "output.csv" 343 file-type precision rewiring-probability 10 file-type ";" 344 file-type precision average-path-length 4 file-type ";" 345 file-type precision clust-coeff 4 file-type ";" 346 ;; L, Normalized with initial L 347 file-type precision ( average-path-length / average-path-length-of-lattice )
4 file-type ";" 348 ;; C, Normalized with initial C 349 file-type precision ( clust-coeff / clustering-coefficient-of-lattice ) 4
file-type ";" 350 ;; Smallworldliness C(norm) / L(norm) 351 file-print precision ( ( clust-coeff / clustering-coefficient-of-lattice ) /
(
average-path-length / average-path-length-of-lattice ) ) 4
352 file-flush 353 end 354 355 to do-filewriting-linebreak 356 file-open "output.csv" 357 file-print "" 358 file-print "P;L;C;Ln;Cn;SW" 359 file-flush 360 end
47
361 362 to do-printing 363 type precision rewiring-probability 10 type ";" 364 type precision average-path-length 4 type ";" 365 type precision clust-coeff 4 type ";" 366 ;; L, Normalized with initial L 367 type precision ( average-path-length / average-path-length-of-lattice ) 4
type ";" 368 ;; C, Normalized with initial C 369 type precision ( clust-coeff / clustering-coefficient-of-lattice ) 4 type
";" 370 ;; Smallworldliness C(norm) / L(norm) 371 print precision ( ( clust-coeff / clustering-coefficient-of-lattice ) / (
average-path-length / average-path-length-of-lattice ) ) 4
372 end 373 374 ; *** NetLogo 4.0 Model Copyright Notice *** 375 ; 376 ; This model was adopted by Eytan Bakshy and Lada Adamic from 377 ; the model below: 378 ; 379 ; Copyright 2005 by Uri Wilensky. All rights reserved. 380 ; 381 ; Permission to use, modify or redistribute this model is hereby granted,
382 ; provided that both of the following requirements are followed: 383 ; a) this copyright notice is included. 384 ; b) this model will not be redistributed for profit without permission 385 ; from Uri Wilensky. 386 ; Contact Uri Wilensky for appropriate licenses for redistribution for 387 ; profit. 388 ; 389 ; To refer to this model in academic publications, please use: 390 ; Wilensky, U. (2005). NetLogo Small Worlds model. 391 ; http://ccl.northwestern.edu/netlogo/models/SmallWorlds. 392 ; Center for Connected Learning and Computer-Based Modeling, 393 ; Northwestern University, Evanston, IL. 394 ; 395 ; In other publications, please use: 396 ; Copyright 2005 Uri Wilensky. All rights reserved. 397 ; See http://ccl.northwestern.edu/netlogo/models/SmallWorlds 398 ; for terms of use. 399 ; 400 ; *** End of NetLogo 4.0 Model Copyright Notice *** 401
48
Appendix 7: NetLogo code (persistent model)
A digital version of this model is available at: http://remkoarts.nl/masterthesis/netlogo/
1 globals 2 [
3 clust-coeff ;; the clustering coefficient of the network 4 ;; this is the average of clustering coefficients of all nodes 5 average-path-length ;; average path length of the network 6 clustering-coefficient-of-lattice ;; the clustering coefficient of the initial lattice 7 average-path-length-of-lattice ;; average path length of the initial lattice 8 ;; used to denote distance between two nodes which 9 ;; don't have a connected or unconnected path between them 10 num-valid-nodes 11 n1 12 n2 13 is-connected? 14 skipped-rewires ;; Due to the planned rewire resulting in a disconnected graph 15 disconnect-repeats 16 avg_K 17 ]
18 19 turtles-own 20 [
21 distance-from-other-nodes 22 node-clustering-coefficient 23 clique-iterator-number ;; Iterates within each clique 24 clique-number ;; Number of the clique the turtle is in 25 manager 26 is-manager 27 my-clustcoeff 28 ]
29 30 ;;;;;;;;;;;;;;;;;;;;;;;;;;;;;;;; 31 ;;; Initial setup procedures ;;; 32 ;;;;;;;;;;;;;;;;;;;;;;;;;;;;;;;; 33 34 ;; Setup small world topology 35 to initial-setup 36 set disconnect-repeats 1
37 ca 38 if delete-file? [
39 ifelse file-exists? "output.csv" 40 [
41 file-close-all 42 carefully [ file-delete "output.csv" ] [ print error-message ]
43 ][
44 print "File output.csv not deleted: file does not exist" 45 ]
46 ]
47 set-default-shape turtles "outlined circle" 48 49 create-turtles num-nodes 50 ask turtles [reset-node]
51 create-tree 52 do-layout 53 54 set is-connected? do-calculations
55 set clustering-coefficient-of-lattice clust-coeff
56 set average-path-length-of-lattice average-path-length
57 set avg_K (( 2 * count links) / count turtles)
49
58 refresh-colors 59 display 60 print "Output format: Rewiring probability P , Avg path length L , Clustering coefficient C" 61 print-init-values 62 end 63 64 to create-tree 65 let managing_turtle 0
66 let clique_iterator 1
67 let clique_number 0
68 foreach (but-first (sort [who] of turtles)) [
69 if clique_iterator > clique-size [
70 set clique_iterator 1
71 set managing_turtle (managing_turtle + 1)
72 set clique_number (clique_number + 1)
73 ]
74 ask turtle ? [
75 create-link-with turtle managing_turtle 76 ;; Set the turtle's clique iterator number 77 set clique-iterator-number clique_iterator
78 ;; Set the turtle's clique number 79 set clique-number clique_number
80 ;; Clique: interconnect with rest of clique 81 if clique-iterator-number > 1 [
82 let i ((clique-iterator-number) - 1 )
83 while [ i > 0 ] [
84 create-link-with turtle (who - i)
85 set i (i - 1)
86 ]
87 ]
88 ]
89 ask turtle ? [set manager managing_turtle]
90 ask turtle managing_turtle [set is-manager true]
91 set clique_iterator (clique_iterator + 1)
92 ]
93 end 94 95 ;;;;;;;;;;;;;;;;;;;;;;;;;; 96 ;;; Runtime procedures ;;; 97 ;;;;;;;;;;;;;;;;;;;;;;;;;; 98 99 to repeat-vary-p 100 if file-output? [ file-write-init-values ]
101 print "repeat-vary-p [ RUNNING ]" 102 let testnumber 1
103 repeat repeat-vary-rewiring [
104 type "vary-p testnumber: " 105 type testnumber 106 type " / " 107 print repeat-vary-rewiring 108 vary-p 109 set testnumber ( testnumber + 1 )
110 ]
111 print "repeat-vary-p [ DONE ]" 112 end 113 114 to vary-p 115 ;; Temporarily set delete-file? to off during vary-p. Put back to initial value after running. 116 let init-del-file? delete-file?
117 set delete-file? false
118 119 clear-plot
50
120 initial-setup 121 set rewiring-probability 0.0
122 let log-rewire-prob -4
123 if logarithmic? [
124 set rewiring-probability (10 ^ log-rewire-prob)
125 ]
126 print "vary-p [ RUNNING ]" 127 ifelse logarithmic? [
128 set rewiring-probability 0
129 while [log-rewire-prob <= 0] [
130 ; foreach [-4.0 -3.5 -3 -2.5 -2 -1.5 -1 -0.5 0] [ 131 set log-rewire-prob log-rewire-prob + 0.25
132 ; print se "log-rewire-prob =" log-rewire-prob 133 set rewiring-probability (10 ^ log-rewire-prob)
134 setup 135 ]
136 ][
137 while [rewiring-probability <= 1.0] [
138 setup 139 set rewiring-probability rewiring-probability + 0.005
140 ]
141 ]
142 print "vary-p [ DONE ]" 143 print "----" 144 if file-output? [ do-filewriting-linebreak ]
145 ;; If delete-file? was set to off at the start vary-p, is is put back to the initial value. 146 set delete-file? init-del-file?
147 end 148 149 to setup 150 set is-connected? false
151 ;; If the network is disconnected, run setup. Otherwise output results. 152 while [not is-connected?] [
153 set disconnect-repeats disconnect-repeats + 1
154 print se "disconnect-repeats:" disconnect-repeats 155 ; print "Graph not connected [ RUNNING setup ]" 156 ;; Refresh tree 157 ask turtles [reset-node]
158 ask links [die]
159 create-tree 160 rewire-network 161 set is-connected? do-calculations
162 ]
163 ;do-layout 164 if plot-output? [ do-plotting ]
165 if file-output? [ do-filewriting ]
166 if print-output? [ do-printing ]
167 refresh-colors 168 display 169 end 170 171 to rewire-network 172 ; print "rewire-network [ ... ]" 173 ask links 174 [
175 if ( not ( [who] of end1 = [manager] of end2 )) [
176 if (random-float 1) < rewiring-probability
177 [
178 ask end1 179 [
180 create-link-with one-of other turtles with [not link-neighbor? myself ]
181 [set color black + 1.5]
182 ]
51
183 die 184 ]
185 ]
186 ]
187 ; print "rewire-network DONE" 188 end 189 190 ; ************************ 191 ; Update Procedures 192 ; ************************ 193 194 to-report num-nodes 195 ;; Start with president 196 let numnodes 1
197 ;; Add nodes per layeron 198 let i layers
199 while [i > 0] [
200 set numnodes (numnodes + clique-size ^ i)
201 set i (i - 1)
202 ]
203 report numnodes 204 end 205 206 to reset-node 207 set color gray - 0.75
208 set size 2.1
209 end 210 211 to refresh-colors 212 ask turtles with [is-manager = true] [set color blue]
213 ask turtle 0 [set color red]
214 ask turtles [
215 ifelse show-clustcoeff?[
216 set label (precision my-clustcoeff 3)
217 ][
218 set label ""
219 ]
220 ]
221 ask links [
222 set color gray + 1.5
223 ifelse ( [who] of end1 = [manager] of end2 ) [
224 set color red - 1.5
225 ] [
226 if ( [clique-number] of end1 = [clique-number] of end2 ) [
227 set color sky
228 ]
229 ]
230 ]
231 end 232 233 ;; Tree layout all nodes and links 234 to do-layout 235 layout-radial turtles links (turtle 0)
236 ;; space out turtles to see clustering 237 ask turtles [
238 facexy 0 0 239 ;; Let "even" turtles step forward to create a better view of cliques 240 if clique-iterator-number mod 2 = 0 [ fd 4 ]
241 ]
242 end 243 244 to-report do-calculations 245 ;; set up a variable so we can report if the network is disconnected 246 let connected? false
247
52
248 ;; Check whether network got disconnected 249 let avpl __average-path-length turtles links
250 if ( avpl > -1 ) [
251 ; print "Graph connected: [ PROCEEDING ]" 252 set average-path-length avpl
253 set connected? true
254 ;; find the clustering coefficient and add to the aggregate for all iterations 255 cluster-coeff 256 ]
257 ;; report whether the network is connected or not 258 report connected? 259 end 260 261 ; ************************ 262 ; calculation of clustering coefficient as described by Watts and Strogatz 263 ; ************************ 264 to cluster-coeff 265 let numqualifyingnodes 0
266 let clustcoeffsum 0
267 268 ;; Calculate clustercoefficient per turtle, adding found clustering coefficient and +1 numqualifyingnodes for each node 269 ask turtles [
270 let tot-links 0 ;; The number of links among neighbors of this link
271 let current-node self
272 ask link-neighbors [
273 set tot-links (tot-links + count link-neighbors with [link-neighbor?
current-node])
274 ]
275 276 ;; Note: Links are all counted twice (A-B & B-A), but doing the same with
possible-links cancels this out 277 set tot-links tot-links
278 279 let num-neighbors count link-neighbors
280 ;; ?? What to do with num-neighbors == 1 ?? 281 if (num-neighbors > 1) [
282 ;; Watts and Strogatz cc = neighbors * (neighbors-1) / 2. 283 ;; Note: Since tot-links are counted twice (A-B & B-A) as well, the / 2 is left out. 284 let possible-links (num-neighbors * (num-neighbors - 1))
285 ;; Calculate the clustering coefficient for this node 286 let clustcoeff (tot-links / possible-links)
287 ;; Add the clustering coefficient to the sum of cc's 288 set clustcoeffsum (clustcoeffsum + clustcoeff)
289 ;; Set turtle variable my-clustcoeff for label display purposes 290 set my-clustcoeff clustcoeff
291 set numqualifyingnodes numqualifyingnodes + 1
292 ]
293 ]
294 set clust-coeff (clustcoeffsum / (count turtles))
295 end 296 297 ;;;;;;;;;;;;;;;;;;;;;;;;;;;;;;;;;;;;;;;;;;;;;;;;;;;;;;;;;;;;;; 298 ;;; Plotting, filewriting and printing (to command center) ;;; 299 ;;;;;;;;;;;;;;;;;;;;;;;;;;;;;;;;;;;;;;;;;;;;;;;;;;;;;;;;;;;;;; 300 to do-plotting 301 ;; plot the number of infected individuals at each step 302 set-current-plot "Normalized C and L" 303 set-current-plot-pen "av-path" 304 plotxy rewiring-probability average-path-length / average-path-length-of-
lattice 305 306 set-current-plot-pen "cc"
53
307 ;; note: dividing by initial value to normalize the plot 308 plotxy rewiring-probability clust-coeff / clustering-coefficient-of-lattice
309 set-current-plot-pen "C/L" 310 plotxy rewiring-probability ( ( clust-coeff / clustering-coefficient-of-
lattice ) /
( average-path-length / average-path-length-of-lattice ) )
311 end 312 313 to file-write-init-values 314 file-open "output.csv" 315 file-print "====" 316 file-print "Initial values (cliquesize, levels, num-nodes, L, C)" 317 file-type "Team-size : " file-print clique-size 318 file-type "layers : " file-print layers 319 file-type "# nodes : " file-print count turtles 320 file-type "Initial L : " file-print average-path-length-of-lattice 321 file-type "Initial C : " file-print clustering-coefficient-of-lattice 322 file-type "Samples : " file-print repeat-vary-rewiring 323 file-print " " 324 file-print "Output format: Rewiring probability P , Avg path length L , Clustering coefficient C, Normalized Avg path length L , Normalized Clustering coefficient C, Smallworldliness C(norm)/L(norm)" 325 file-print "====" 326 file-flush 327 file-close-all 328 end 329 330 to print-init-values 331 print "Initial values (cliquesize, levels, num-nodes, L, C)" 332 type clique-size type ", " 333 type layers type ", " 334 type count turtles 335 type ", " 336 type precision average-path-length-of-lattice 4 337 type ", " 338 print precision clustering-coefficient-of-lattice 4 339 end 340 341 to do-filewriting 342 file-open "output.csv" 343 file-type precision rewiring-probability 10 file-type ";" 344 file-type precision average-path-length 4 file-type ";" 345 file-type precision clust-coeff 4 file-type ";" 346 ;; L, Normalized with initial L 347 file-type precision ( average-path-length / average-path-length-of-lattice )
4 file-type ";" 348 ;; C, Normalized with initial C 349 file-type precision ( clust-coeff / clustering-coefficient-of-lattice ) 4
file-type ";" 350 ;; Smallworldliness C(norm) / L(norm) 351 file-print precision ( ( clust-coeff / clustering-coefficient-of-lattice ) /
(
average-path-length / average-path-length-of-lattice ) ) 4
352 file-flush 353 end 354 355 to do-filewriting-linebreak 356 file-open "output.csv" 357 file-print "" 358 file-print "P;L;C;Ln;Cn;SW" 359 file-flush 360 end 361 362 to do-printing
54
363 type precision rewiring-probability 10 type ";" 364 type precision average-path-length 4 type ";" 365 type precision clust-coeff 4 type ";" 366 ;; L, Normalized with initial L 367 type precision ( average-path-length / average-path-length-of-lattice ) 4
type ";" 368 ;; C, Normalized with initial C 369 type precision ( clust-coeff / clustering-coefficient-of-lattice ) 4 type
";" 370 ;; Smallworldliness C(norm) / L(norm) 371 print precision ( ( clust-coeff / clustering-coefficient-of-lattice ) / (
average-path-length / average-path-length-of-lattice ) ) 4
372 end 373 374 ; *** NetLogo 4.0 Model Copyright Notice *** 375 ; 376 ; This model was adopted by Eytan Bakshy and Lada Adamic from 377 ; the model below: 378 ; 379 ; Copyright 2005 by Uri Wilensky. All rights reserved. 380 ; 381 ; Permission to use, modify or redistribute this model is hereby granted, 382 ; provided that both of the following requirements are followed: 383 ; a) this copyright notice is included. 384 ; b) this model will not be redistributed for profit without permission 385 ; from Uri Wilensky. 386 ; Contact Uri Wilensky for appropriate licenses for redistribution for 387 ; profit. 388 ; 389 ; To refer to this model in academic publications, please use: 390 ; Wilensky, U. (2005). NetLogo Small Worlds model. 391 ; http://ccl.northwestern.edu/netlogo/models/SmallWorlds. 392 ; Center for Connected Learning and Computer-Based Modeling, 393 ; Northwestern University, Evanston, IL. 394 ; 395 ; In other publications, please use: 396 ; Copyright 2005 Uri Wilensky. All rights reserved. 397 ; See http://ccl.northwestern.edu/netlogo/models/SmallWorlds 398 ; for terms of use. 399 ; 400 ; *** End of NetLogo 4.0 Model Copyright Notice *** 401