Embed Size (px)
Citation preview

i
The Impact of Government R&D Subsidy on
Firm Performance: Evidence from Korean SMEs
Beom Cheol Cin1, YoungJun Kim
2, Nicholas S. Vonortas
3
Abstract: This paper empirically explores the R&D promotion policy effects on SME
performance measured by value-added productivity. We use a unique large panel data
set on public R&D subsidy for Korean manufacturing firms. Econometrically, we
control for counter-factual outcomes employing the DID (difference in differences)
estimation procedure as well as for endogeneity of the R&D subsidy using the 2-stage
Tobit/Logit-DPD (dynamic panel data) procedure. We find significant evidence for
positive productivity effect of the public R&D subsidy. The subsidy has successfully
raised the R&D expenditure and value added productivity of Korean manufacturing
SMEs. It is thus fostering entrepreneurial activity and economic growth.
1 Professor, Department of Economics, Kyonggi University, Suwon, Korea.
E-mail: [email protected] 2 (Corresponding Author) Professor, Department of Management of Technology, Graduate
School of Management of Technology, Korea University, Seoul, Korea.
Email: [email protected] 3 (Corresponding Author) Professor, Center for International Science and Technology Policy &
Department of Economics, The George Washington University, Washington, DC, USA. Email:
Acknowledgement
We are grateful for helpful comments from Prof. Kuhlmann and participants in the Asian
Research Policy Symposium 2013, “Asian Model of Innovation: Innovation and Creative Economy,” Seoul, Korea.
1
1. Introduction
Economic growth depends on innovation and the application of new knowledge in order
to develop improved products and processes. In particular, research and development
(R&D) investment is considered to be one of the most important factors for enhancing
technological progress and economic growth for developed and developing countries
(Romer, 1990; Grossman and Helpman, 1991; Aghion and Howitt, 1992; Wang et al.
2007). This has provided a strong signal to policy decision-makers to endorse
technology-enhancing R&D policy for enhancing economic growth.
Absent of government intervention in R&D markets, it is expected that the social rate
of return to R&D expenditure may exceed the private rate, leading to a socially
suboptimal rate of investment in R&D (Leyden and Link, 1991; David et al. 2000).
Positive externalities due to incomplete appropriability of the results and uncertainty
about their success further push private R&D expenditure below socially optimal levels
(Nelson, 1959; Arrow, 1962). The central rationale for government R&D promotion
policy such as subsidy for new technology development is to correct this type of market
failure by reducing capital costs of R&D activities. In Korea there are expectations that
the subsidy might also foster entrepreneurial activities and economic growth.
Korean small and medium sized enterprises (SMEs) have traditionally spent little on
R&D. They have also found it difficult to undertake risky R&D projects with external
funding in the absence of well-established capital markets. As elsewhere, small firms are
more reliant on internal financing which exposes them to the higher default risk. High
default risk and high capital costs have long been expected to result in under- provision of
R&D investment by SMEs.
The R&D subsidy policy for SMEs in Korea has evolved since the 1980s when the
first large-scale government R&D project was initiated. During 1982-1986, the
government prepared a legal framework targeting support for SMEs’ R&D activities.
During 1987-1996, along with the foundation of the Korea Technology Credit Guarantee
Fund (KOTEC), a series of R&D subsidy programs were introduced. The active
government support for SME R&D activities finally generated the so-called ‘venture
boom’ in the early 2000s. The number of SMEs involved in R&D activities increased
remarkably from 6,472 in 1999 to 18,101 in 2002. Similarly, SME R&D expenditure

2
increased from 595 billion Korean won in 1999 to 2.2 trillion Korean won in 2002.
Thanks to continuous support by subsequent government administrations SME R&D
expenditure in Korea, especially in the manufacturing sector, rose from 2.4 trillion
Korean won in 2003 to 5.1 trillion Korean won in 2007. R&D intensity also increased
from 1.37 percent in 2000 to 2.63 percent in 2012. The overall share of R&D
expenditure by SMEs across all industries increased sharply from 11.4 percent in 1995
to 25.8 percent of the total in 2011.
Figure 1 shows the changing tendency of R&D expenditure and the R&D intensity
of SMEs in the manufacturing sector. The amount of R&D expenditure by SMEs was as
little as 64.2 billion Korean won in 1985 at the start of public R&D promotion policy.
This amount increased significantly during 1985–1996 and then again from 1999 to
2007. Both periods coincide with active public R&D promotion policy including R&D
subsidy.
Figure 1. R&D Expenditure of SMEs in Manufacturing Sectors
(Unit: Billion Korean Won, 1,000 Korean Won is equivalent to about 1 US dollar, %)
1.5 1.5 1.4 1.3 1.4 1.4
1.9
2.3 2.2 2.2 2.5 2.6 2.9 2.5 2.5 2.8 2.5 2.6
0.0
1.0
2.0
3.0
0
10000
20000
30000
40000
1985 1996 1999 2002 2005 2008 2011
No. of R&D Activities Total R&D R&D Intensity
Source: Korea Federation of SMEs, Korean SME Statistics, various issues.
The issue of whether public R&D spending or government subsidy is complementary
and additional to private spending or it substitutes for and tends to crowd out private
R&D has been discussed in many prior studies such as Scott (1984), Levin and Reiss
(1984), Leyden and Link (1991), Lichtenberg (1984, 1988), Kauko (1996) and Wallsten
3
(2000) (U.S. firms), Holeman and Sleuwaegen (1988) (Belgian firms), Klette and Moen
(1999) (Norwegian firms), Gorg and Strobl (2007) (Irish firms), and Gonzalez and Pazo
(2008) (Spanish firms). While, however, numerous countries have introduced R&D
support programs aimed at increasing private R&D effort, studies about how
government R&D subsidies affect private companies in terms of their productivity are
relatively hard to find. To the best of our knowledge, no prior studies have addressed the
impact of public R&D subsidies on the performance of Korean SMEs by using actual
subsidy data provided by the Korean government.
This paper fills this gap and contributes to the literature by empirically investigating
the productivity effect of R&D subsidy with the help of a unique large panel data set on
public R&D subsidies for Korean manufacturing SMEs (listed and non-listed). We
employ both the DID (difference-in-deference) methodology to mitigate sample
selection bias and the two stage Tobit/Logit-GMM procedure to control for simultaneity
bias of the government subsidy for new technology development. We find a positive and
significant effect of public R&D subsidies on the performance of the examined SMEs.
The rest of the paper is organized as follows. Section 2 specifies the theoretical model
and describes the empirical methodology including the data. Section 3 discusses the
empirical methodology in detail and describes the main results. Section 4 concludes.
2. Model specification and estimation method
2.1 Model specification
We start from the typical Cobb-Douglas production function which has been frequently
used in R&D investment literature.1 The production function is given as 1 2Q AK L
,
and total factor productivity (A) is assumed to depend on private R&D investment
1 This production approach is similar to Griliches(1986, 1995), Basant and Fikkert(1998), and Guelec
and Van Pottelsberhe De La Potterie(2004), Tsang et al. (2008).

4
(R&D), R&D subsidy (D) realized in the R&D investment, education and job training
expenses for employees (Edu), and firm age (Age):
31 2 4( & ) ( ) ( )D
A C R D Edu Age .
Where C is a constant term and D is a zero-one indicator for R&D subsidy.
Dividing both sides of the production function by labor (L) and taking logarithms we
get the following labor productivity model:
, 0 1 , 2 , ,
1 , , 3 , 4
ln( / ) ln( & / ) D ln( & / )
ln( / ) ln ln( / ) ln( )
i t i t i t i t
i t i t i t i
Q L R D L R D L
K L L Edu L Age
( 1 , 2 , , 1i N t T (1)
Where 0 ln(C) , and 1 2 1 2 3( 1) . A cross-product term of public
subsidy (D) and private R&D investment (ln(R&D/L)) reflects the fact that the subsidy
can affect labor productivity indirectly by raising the private R&D investment.
Herein we are interested in the effect of the public R&D subsidies on company
productivity. The firms (SMEs) considered in this study are divided into two groups,
those subsidized by the government and those not subsidized. Only a segment of the total
SME population would receive the government R&D subsidy in a particular period t. Let
,D
i tbe a zero-one indicator that equals unity if a firm received the government subsidy
and zero otherwise.
Re-expressing the equation (1) gives us the following static labor productivity
model:
0 ( ) ', , , , , ,1 2
Rq D R Xi t i t i t i t i t i i t
(2)
where labor productivity ln( / )q Q L , R&D investment per employee
ln( & / )R R D L , 2 reflects the indirect subsidy effects on productivity, X is a vector

5
of explanatory variables such as capital intensity ln( / )K L , number of employees
ln(L) , education and job training expenses per employee ln(Edu/ L), Age ln( )Age ,
i denotes a time-invariant effect unique to firm i , and
,i t is a time varying error
distributed independently across firms and independently of all i .
Estimation of model (2) as a special case of the error component model has been
discussed in the literature. When i
is a random component with a distribution
independent of the observed right-hand side variables, then conventional generalized
least squares produces a consistent and efficient estimator.
However, if the firm specific effect, i
is correlated with ,i t
then OLS estimation
of the policy parameter 2 in equation (2) could produce simultaneity bias. A popular way
of getting consistent estimators involves first differencing (1) over time:
( ) 'R, , , , , ,1 2
q D R Xi t i t i t i t i t i t
(3)
The first differencing eliminates the unobservable time-invariant firm-specific effects
which can cause endogeneity of ,
Ri t
or ,
Di t
in equation (1). Suppose, for simplicity,
that the sample consists of only two periods: period (t-1) which is before the firm receives
the subsidy for technology development and period t. Let the group s represent the firms
which are subsidized and the group n represent the firms which are not subsidized. As
Lach (2002) suggests, if equation (2) is applied to the firms without a subsidy at
(t-1), 0, 1
Di t
, then , ,
D Di t i t
and thus we get:
( ) 'R R, , , , , ,1 2
q D Xi t i t i t i t i t i t
(4)
From (4), it follows that:

6
, ,( )S N
i t i tE q q
( | , R, 1, 0) ( | , R, 0, 0), , , ,, 1 , 1
S NE q X D D E q X D Di t i t i t i ti t i t
( | , R 1, 0) ( | ,R , 0, 0), , , , , ,, 1 , 1
S NE X D D E X D Di t i t i t i t i t i ti t i t
Under the assumption that ,i t
is mean independent of the subsidy dummy variable
,D
i tat time t, the expected difference conditional on X and 0
, 1D
i t between the
growth rate of subsidized (,Sqi t
) and non-subsidized firms (,Nqi t
) can be identified as
policy parameter 2 :
( | , R, 1, 0) ( | , R, 0, 0), , , ,, 1 , 1
S NE X D D E X D Di t i t i t i ti t i t ,
( ) 0,, ,
E D ti t i t
(5)
If 0, 1
Di t
, and ( ) 0, ,
E Xi t i t
(Lach, 2002), then both the first differencing
estimator and the DID estimator are equivalent, meaning that the traditional panel
analysis can be applied. It is not unusual, however, that the R&D subsidy dummy
variable ,
Di t
is correlated to the temporary error term,i t
. This issue is closely related to
the bias in the OLS estimation of 2 which is attributed to the endogenous selection of
firms, referring to either the firm’s own decision to apply for the subsidy or to the
selection process by the government. DID fails to control for idiosyncratic factors
affecting simultaneously the level of R&D investment and the probability of receiving a
subsidy which is in turn affected by determinants of the decision to apply for the subsidy.
In order to control for both simultaneity and selection bias of the government subsidy for
technology development, we employ both the DID methodology and the 2-stage
Tobit/Logit-GMM procedure.
The DID estimator equals the difference between the mean R&D change between the
previous period (t-1) and the current period t among the subsidized and not subsidized
firms conditional on not having received a subsidy at the period (t-1). The fixed effect and

7
the DID estimators do not only share the same asymptotic distribution but they are also
computationally identical under some assumptions.
Finally, considering the dynamic nature of productivity as well as time and industry
effects in equation (2), the estimated model can be rewritten in the following dynamic
panel data (DPD) framework:
, 0 , 1 , ,
1 , 3 , 4
, 1
),2
,
ln( / ) ln ln( & / ) ( ln( & / )
ln( / ) ln( / ) ln( )
ln( / )
i t i t i t i t
i t i t i
i t k k j jk j
Di t
i t
Q L L R D L R D L
K L Edu L Age
Q L Industry Year
(6)
Where is an adjustment parameter in the dynamic productivity model, Industry is a
dummy variable for the SMEs belonging to a specific industry to control for factors
specific to industries that may explain variation in firm performance across industries –
for instance technological opportunity and stage of the technology life cycle – and Year
is a dummy variable for a specific year to reflect unobserved time variation factors.
In the DPD model, if 1 0 then private R&D investment can affect positively
labor productivity. When 2 0 , an R&D subsidy that raises private R&D investment
can enhance labor productivity indirectly.
Equation (6) shows that current productivity is influenced by lagged productivity as
well as by the current explanatory variables. When the model includes the lagged
dependent variable, for small T but large N, the fixed effect (FE) and the random effect
(RE) GLS estimators can be biased and inconsistent because the lagged dependent
variable is correlated with the disturbance term (Arellano 2003).2 Thus, without any
endogeneity and counter-factual outcome problems, traditional panel data estimation
methods such as FE and RE estimation cannot produce unbiased results any more.
One method to mitigate the problem is to employ the Anderson and Hsiao (1981)
procedure which is to wipe out the individual effects and estimate the first-differencing
model using lags of the dependent variable as instruments. As an extension of the
2 See Baltagi (2013) p.155 for further details.
8
Anderson and Hsiao estimator, Arellano and Bond (1991) proposed a generalized method
of moment (GMM) procedure that should be more efficient than the Anderson and Hsiao
estimator. Building on the Arellano and Bond (1991), Arellano and Bover (1995) and
Blundell and Bond (1998) propose an alternative estimation method of the dynamic panel
model (system GMM), by using additional non-linear moment restrictions not exploited
by the GMM estimator. Blundell and Bond (2000) argue that using the system GMM
estimator can overcome many problems with the standard GMM estimator for dynamic
panel models. In this paper, we use the system GMM method to estimate the dynamic
labor productivity model, given by equation (6), considering endogeneity of private
R&D investment and government R&D subsidy.
2.2 Data
The panel data to estimate the model is constructed by merging the Annual Report of the
Financial Statement of the Korean manufacturing firms and public subsidy data. We
collect firm financial data from the NICE (National Information and Credit Evaluation).
The financial data set includes individual accounting items from the balance sheet as well
as the profit and loss statement of listed and unlisted companies over the period
2000-2007. The advantage of these data is an extensive coverage of private companies
with a variety of firm size for all industries. The data on government R&D subsidy were
provided by the Small and Medium Business Administration (SMBA). This data set was
not publicly available. The sample period for the subsidy also covers fiscal years 2000 to
2007.
Table 1 shows the operating definition for the variables used in the paper. As a
dependent variable of labor productivity we use value-added productivity, or
value-added (VA) per employee.3 Since quantity produced is not available and many
firms produce multiple products, we use the firm’s VA as a proxy for firm production
(Tsang et al., 2008). Firm total sales are frequently used as a proxy for production but
3 We use the definition from The Bank of Korea (i.e. the central bank in Korea) for value-added (VA).
See OECD (2001) for further discussion about various productivity measures.

9
they are over-estimated because intermediate material costs are not excluded. Since
firms intermediate material costs are not exactly known, we calculate the VA following
the definition of the Korean central bank as shown in the Table.
Table 1. Definition of variables used
Variables Definition/Description
VA
Ln(Q/L)
Value added = (operating surplus + labor costs + interest expenses +
taxes & dues + depreciation & amortization)
Dependent variable: Value-added productivity = Ln(VA/L)
Ln(K/L) Capital Intensity = Ln(Fixed asset of the firm per employee)
Ln(L) Ln(Number of employees)
Ln(Edu/L) Ln(Education and job training expenses per employee)
Sales Firm total sales
R&D
R&D expenses = ordinary development expenses + ordinary
research and development expenses + amortization of research
and development expenses + changes of research and
development expenses
Ln(R&D/L) Ln(R&D/L)
Subsidy Government financial subsidy for new technology development and
technology transfer
D D=1 if the firm received government R&D subsidy; Otherwise, D=0.
Ln(Age) Firm age; Ln(2008-founding year)
Industry A dummy variable; take the value 1 if the SME belongs to k industry
and 0 otherwise,
Year A dummy variable for a specific year
The independent variable R&D subsidy refers to direct financial support through
some government program and excludes loans and tax benefits to SMEs. The subsidy is
not required for amortization. The Korean SMBA chooses the firms and the amount of
subsidy they will receive based on an evaluation of the SME’s performance and the
validity of the public R&D subsidy program. Table 2 shows the number of firms
receiving and not receiving this financial assistance over the period 2000-2007. R&D
subsidies by year and by firm size are presented in Tables 3 and 4 respectively.

10
Table 2. R&D subsidy recipients by industry
ISIC Industry Name No. of Firms
w/o Subsidy
No. of Firms
w/ Subsidy
Total No.
of Firms
15 Manufacture of food products and beverages 2,024 28 2,052
16 Manufacture of tobacco products 19 0 19
17 Manufacture of textiles 1,717 34 1,751
18 Manufacture of wearing apparel; dressing and dyeing of
fur 1,215 1 1,216
19 Tanning and dressing of leather; manufacture of
luggage, handbags, saddlery, harness and footwear 393 4 397
20
Manufacture of wood and of products of wood and cork,
except furniture; manufacture of articles of straw and
plaiting materials
240 0 240
21 Manufacture of paper and paper products 864 3 867
22 Publishing, printing and reproduction of recorded media 1,201 4 1,205
23 Manufacture of coke, refined petroleum products and
nuclear fuel 194 8 202
24 Manufacture of chemicals and chemical products 3,742 190 3,932
25 Manufacture of rubber and plastics products 2,304 91 2,395
26 Manufacture of other non- non-metallic mineral products 1,941 37 1,978
27 Manufacture of basic metals 2,834 58 2,892
28 Manufacture of fabricated metal products, except
machinery and equipment 2,539 64 2,603
29 Manufacture of machinery and equipment n.e.c. 5,295 357 5,652
30 Manufacture of office, accounting and computing
machinery 593 40 633
31 Manufacture of electrical machinery and apparatus n.e.c. 1,943 132 2,075
32 Manufacture of radio, television and communication
equipment and apparatus 4,862 283 5,145
33 Manufacture of medical, precision and optical
instruments, watches and clocks 1,243 145 1,388
34 Manufacture of motor vehicles, trailers and semi 3,626 144 3,770
35 Manufacture of other transport equipment 890 38 928
36 Manufacture of furniture; manufacturing n.e.c. 797 24 821

11
37 Recycling 229 1 230
Total 40,705 1,686 42,391
Note) ISIC denotes International Standard Industrial Classification of All Economic Activities by UN Revision 3.1
Table 3. R&D subsidy recipients by year
Year No. of Firms w/o Subsidy No. of Firms w/ Subsidy Total No. of Firms
2000 3,932 143 4,075
2001 4,256 174 4,430
2002 4,565 172 4,737
2003 4,883 204 5,087
2004 5,189 231 5,420
2005 5,633 230 5,863
2006 6,166 258 6,424
2007 6,081 274 6,355
Total 40,705 1,686 42,391
Table 4. R&D subsidy by firm size
100<workers<300 50<workers<=100
ISIC No. of Firms w/o
Subsidy
No. of Firms w/
Subsidy
Total No. of
Firms
No. of Firms w/o
Subsidy
No. of Firms w/
Subsidy
Total No. of
Firms
15 666 3 669 589 5 594
16 0 0 0 6 0 6
17 620 12 632 515 13 528
18 392 1 393 308 0 308
19 138 2 140 92 1 93
20 51 0 51 52 0 52
21 280 1 281 225 0 225
22 409 1 410 251 1 252
23 55 1 56 75 3 78
24 1,233 39 1,272 1,051 41 1,092
25 687 19 706 720 18 738
26 431 5 436 537 11 548
27 630 13 643 837 12 849
28 566 13 579 679 11 690
29 1,129 54 1,183 1,453 80 1,533
30 153 7 160 170 8 178
31 595 34 629 602 41 643
32 1,376 55 1,431 1,285 62 1,347

12
33 321 35 356 336 36 372
34 1,322 42 1,364 1,030 29 1,059
35 180 9 189 251 10 261
36 249 5 254 215 6 221
37 61 1 62 64 0 64
Total 11,544 352 11,896 11,343 388 11,731
Table 4. R&D subsidy by firm size (cont’d)
10<workers<=50 workers<=10
ISIC No. of Firms w/o
Subsidy
No. of Firms w/
Subsidy
Total No. of
Firms
No. of Firms w/o
Subsidy
No. of Firms w/
Subsidy
Total No. of
Firms
15 556 9 565 211 1 212
16 8 0 8 5 0 5
17 419 4 423 163 0 163
18 363 0 363 152 0 152
19 119 1 120 44 0 44
20 97 0 97 39 0 39
21 274 1 275 84 1 85
22 393 1 394 146 0 146
23 53 1 54 10 0 10
24 1,123 54 1,177 331 8 339
25 647 28 675 247 8 255
26 750 6 756 217 0 217
27 988 15 1,003 374 4 378
28 976 15 991 316 2 318
29 2,084 100 2,184 620 21 641
30 196 11 207 70 3 73
31 547 15 562 197 3 200
32 1,591 59 1,650 607 24 631
33 459 35 494 123 4 127
34 880 29 909 390 11 401
35 326 10 336 132 2 134
36 250 3 253 80 4 84
37 81 0 81 23 0 23
Total 13,180 397 13,577 4,581 96 4,677
Note) ISIC denotes International Standard Industrial Classification of All Economic Activities by UN Revision 3.1
Incomplete observations for the variables are excluded from the regression analysis.
If there were any missing values in the list of dependent, independent, and control

13
variables of a firm in a particular year, the observation related to the firm in that year is
automatically excluded. We also deflate all nominal variables such as the value added,
fixed assets, private R&D spending by Korean industrial wholesale price indices.
Table 5 presents descriptive statistics and the correlation matrix for variables is
reported in Table 6.
Table 5. Descriptive statistics for all sample and DID Sample (million Won)
Full Sample DID Sample
Mean Std. Dev. Mean Std. Dev.
Ln(VA/L) 17.24 0.81 17.24 0.80
Ln(K/L) 18.46 1.14 18.43 1.13
Ln(L) 4.35 1.19 4.10 0.93
Ln(R&D/L) 4.30 9.20 3.96 9.08
D 0.04 0.19 0.03 0.17
Ln(Edu/L) 8.14 5.91 7.82 5.98
Ln(Age) 2.72 0.63 2.68 0.60
Notes: The DID sample is created by excluding the firms which received the government subsidies in the
period (t-1): That is, if 11, tiD , then the firm is excluded.
Table 6. Correlation Matrix for variables in DID sample
Ln(VA/L) Ln(K/L) Ln(L) Ln(R&D/L) Ln(Subsidy) Ln(Edu/L)
Ln(K/L) 0.3030*
Ln(L) -0.1735* -0.0796*
Ln(R&D/L) 0.1164* -0.0246* 0.1836*
Ln(Subsidy) -0.0031 -0.0097* -0.0157* 0.0583*
Ln(Edu/L) 0.1540* 0.0501* 0.2891* 0.2355* 0.0207*
Ln(Age) -0.0099* 0.0725* 0.1765* 0.0088 -0.0234* 0.0274*
Note) * indicates 5% significance levels.
3. Estimation method and results

14
In order to examine the effect of public R&D subsidy on firm performance, we estimate
the labor productivity model by several different methods for the DID samples during the
period 2001-2007. First, we estimate the static labor productivity model by simple
pooled-OLS estimation (pooled OLS) and by traditional panel estimation methods such
as random effect (RE) and fixed effect (FE) estimation methods. Table 7 presents the
results of this estimation.
Table 7. Effects of R&D subsidies on labor productivity using DID sample: RE & FE Model
Variables Pooled
OLS RE RE FE FE
Ln(K/L) 0.151*** 0.159*** 0.145*** 0.167*** 0.151***
(0.003) (0.005) (0.005) (0.005) (0.005)
Ln(L) -0.216*** -0.245*** -0.285*** -0.264*** -0.300***
(0.004) (0.007) (0.007) (0.006) (0.006)
Ln(R&D/L) 0.012*** 0.015*** 0.013*** 0.016*** 0.015***
(0.000) (0.000) (0.000) (0.000) (0.000)
Ln(R&D/L)*D -0.003 -0.000 -0.001 0.000 0.000
(0.002) (0.001) (0.001) (0.002) (0.002)
Ln(Age) 0.032*** 0.070*** 0.075***
(0.007) (0.012) (0.012)
Ln(Edu/L) 0.024*** 0.023***
(0.001) (0.001)
Year Dummy Yes Yes Yes Yes Yes
Industry Dummy Yes Yes Yes NA NA
R2
0.0169 0.168 0.198 0.163 0.192
H0: No Hetero 18454.0*** 18260.1*** 7.23*** 5.52***
F 250.041 694.451 752.198
No. of Observations 39,084 39,084 39,084 39,084 39,084
Notes 1) **, * indicates 1% and 5% significance levels, respectively. 2) The DID sample is created by excluding the
firms which received the government subsidies in the period (t-1). 3) RE stands for Random Effect Models, FE for
Fixed Effect Models.
The empirical results can be summarized as follows. First, the Breusch-Pagan LM test
statistics indicates that the null hypothesis of no hetergeneity effects can be rejected at

15
the 1% level for all cases. This implies that the simple pooled-OLS estimation should
lead to biased results. Second, all estimated coefficients for private R&D investment are
significant at the 1% level, implying that expansion of private R&D investment should
play an important role on enhancing productivity and thus as a prime driver of
economic growth. Third, for all models, the estimated coefficients for workers are found
to be negatively significant, suggesting that corporate performance is negatively
associated with firm size even within the SME population. Fourth, the estimated
coefficients for government subsidy are not statistically significant. Furthermore, the
estimated coefficients for the cross-product term of R&D investment and subsidy
dummy are not significant for all cases in the traditional static panel models.
However, and as explained earlier, the estimated results in Table 7 could be biased
due to ignorance of potential endogeneity for private R&D investment and R&D
subsidy: while private R&D investment can positively affect labor productivity, better
performing SMEs can also invest more in R&D. This bi-directional causality can cause
endogeneity bias. Moreover, the R&D subsidy can also positively affect labor
productivity indirectly through a crowding-in effect: the subsidy raises private R&D
investment. Conversely, and very importantly, the better performing SMEs may have
higher chance to receive public R&D support. To remind, the Korean SMBA chooses
the SMEs to be supported and determines the level of support on the basis of an
appraisal of company performance and the perceived relevance of the specific R&D
subsidy program to the specific company.
Figure 2 shows that the distribution of the means of corporate R&D expenditures. It
can be easily observed that most R&D expenditure data observations in our panel take the
value zero with positive probability. The use of OLS in the first step can lead to biased
results because of the truncated distribution of the R&D expenditures.

16
Figure 2. Censored distribution of firm R&D expenditures
0.2
.4.6
.8
0 10 20 30log(R&D)
To control for the potential endogeneity of private R&D investment and public R&D
subsidy, we use a two-step RE estimation (2 Stage-RE) method. In the first step, we
regress private R&D investment on instrument variables (such as lagged total sales in
logs) in the panel model and on the R&D subsidy in the Logit model framework,
respectively. In the second step, we re-estimate the static labor productivity model,
including the expected values of private R&D investment (ln(R&D))E and of the R&D
subsidy (D)E instead of the current period of R&D investment and subsidy.
The 2nd
and 3rd
columns (2 Stage-RE) in Table 8 below show the results of the
two-stage RE estimation. It can be observed now that the estimated coefficients for
capital intensity are not significant any longer and the estimated coefficients for the
cross-product term are negatively significant. However, these results should be biased
too because of ignoring the nature of the censored distribution of R&D investment
support.
To alleviate such a distribution problem, we employ the Tobit-RE estimation
procedure: in the first step, we regress the private R&D investment on the same
instrument variable in the Tobit model instead of the RE model framework; in the

17
second step we use the same RE estimation procedure even though we include the
lagged dependent variable.
Table 8. Effects of R&D subsidies on labor productivity using DID sample:
2-Stage Model
Variables 2 Stage-RE 2 Stage-RE Tobit-RE Tobit-RE
Ln(K/L) 0.207* 0.009 0.065*** 0.116***
(0.123) (0.113) (0.003) (0.006)
Ln(L) -0.279 -0.404*** -0.294*** -0.410***
(0.170) (0.142) (0.007) (0.009)
E(Ln(R&D/L)) 0.177** 0.318*** 0.188*** 0.148***
(0.084) (0.095) (0.011) (0.014)
E(Ln(R&D/L))*E(D) -4.493** -7.214*** 0.065*** 0.048***
(2.133) (2.139) (0.005) (0.006)
Ln(Age) -0.350 -0.035***
(0.240) (0.006)
Ln(Edu/L) 0.028 0.043** 0.011*** 0.021***
(0.017) (0.020) (0.001) (0.001)
Ln(VA/L)t-1 0.531*** 0.171***
(0.005) (0.006)
Year Dummy Yes Yes Yes Yes
Industry Dummy No Yes Yes No
Overall R2
0.001 0.001 0.517 0.367
No. of Observations 30,078 30,078 30,078 30,078
Notes 1) **, * indicates 1% and 5% significance levels, respectively. 2) The DID sample is created by excluding the
firms which received the government subsidies in the period (t-1). 3) RE stands for Random Effect Models, FE for
Fixed Effect Models.
Considering the censored distribution, the results are shown in the 4th
and 5th
columns of Table 8. The estimated results show that coefficients for private R&D
investment and cross-product term are positively significant at 1% level, implying that
government subsidies can raise labor productivity indirectly through promotion of R&D
investment. However, this result can be also biased because of ignoring the potential
18
endogeneity of the lagged dependent variable. When the model includes the lagged
dependent variable, the random effect (RE) GLS estimator is biased because the
firm-specific effect i is correlated with the disturbance term it
. (Arellano 2003). Thus,
even if we consider any endogeneity and counter-factual outcome problems, traditional
panel data estimation such as FE and RE estimation cannot produce unbiased results any
more due to the lagged dependent variable.
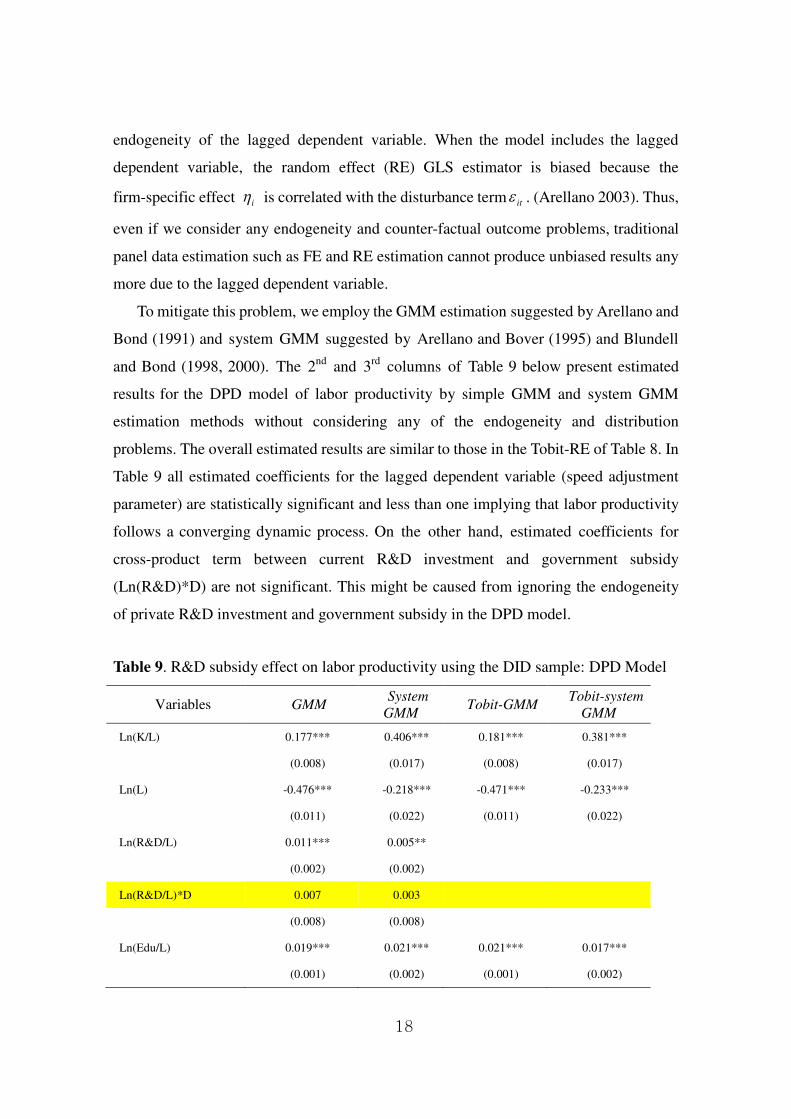
To mitigate this problem, we employ the GMM estimation suggested by Arellano and
Bond (1991) and system GMM suggested by Arellano and Bover (1995) and Blundell
and Bond (1998, 2000). The 2nd
and 3rd
columns of Table 9 below present estimated
results for the DPD model of labor productivity by simple GMM and system GMM
estimation methods without considering any of the endogeneity and distribution
problems. The overall estimated results are similar to those in the Tobit-RE of Table 8. In
Table 9 all estimated coefficients for the lagged dependent variable (speed adjustment
parameter) are statistically significant and less than one implying that labor productivity
follows a converging dynamic process. On the other hand, estimated coefficients for
cross-product term between current R&D investment and government subsidy
(Ln(R&D)*D) are not significant. This might be caused from ignoring the endogeneity
of private R&D investment and government subsidy in the DPD model.
Table 9. R&D subsidy effect on labor productivity using the DID sample: DPD Model
Variables GMM System
GMM Tobit-GMM
Tobit-system
GMM
Ln(K/L) 0.177*** 0.406*** 0.181*** 0.381***
(0.008) (0.017) (0.008) (0.017)
Ln(L) -0.476*** -0.218*** -0.471*** -0.233***
(0.011) (0.022) (0.011) (0.022)
Ln(R&D/L) 0.011*** 0.005**
(0.002) (0.002)
Ln(R&D/L)*D 0.007 0.003
(0.008) (0.008)
Ln(Edu/L) 0.019*** 0.021*** 0.021*** 0.017***
(0.001) (0.002) (0.001) (0.002)

19
Ln(VA/L)t-1 0.326*** 0.610*** 0.348*** 0.640***
(0.011) (0.019) (0.011) (0.018)
E(Ln(R&D/L)) 0.115*** 0.072**
(0.016) (0.031)
E(Ln(R&D/L))*E(D) 0.030*** 0.028***
(0.004) (0.007)
Year Dummy Yes Yes Yes Yes
Industry Dummy No No No No
Wald Chi
4952.7*** 416893*** 4981.1*** 202798***
No. of Observations 22,616 30,078 30,078 30,078
Notes 1) **, * indicates 1% and 5% significance levels, respectively. 2) The DID sample is created by excluding the
firms which received the government subsidies in the period (t-1). 3) RE stands for Random Effect Models, FE for
Fixed Effect Models.
To control for the endogeneity, we employ the 2-stage Tobit/Logit-GMM and
Tobit/Logit-system GMM. More accurately, we use Tobit estimation for private R&D
investment and Logit estimation for public subsidy in the first stage but GMM or
system GMM estimation for labor productivity in the second stage.
The 4th
(Tobit-GMM) and 5th
(Tobit-system GMM) columns in Table 9 present the
estimated results for the DPD productivity model. These results are similar to those of
the simple GMM and system GMM estimation without considering any endogeneity.
Labor productivity is positively associated with capital intensity whereas it is negatively
affected by the number of workers (used as a proxy for firm size).
Now the estimated coefficients for the predicted R&D investment are significant
(E(ln(R&D/L)) and those for the predicted cross-product term (E(R&D/L)*E(D)) turn
out to be positively significant at 1% level. The results suggest that government subsidy
raises labor productivity indirectly through stimulating private R&D investment, which
provides support to the crowding-in argument. These findings are consistent with those
of Guellec and Pottelsberghe (2001) but they are in contrast to those of Lichtenberg
(1984), Kauko (1996), Wallsten (2000), and Gorg and Strobl (2009). The result implies
that sharing the cost and the underlying risk of R&D investment with the government
could stimulate R&D expenditures of SMEs in Korea.

20
4. Concluding Remarks
R&D projects typically require large fixed costs, and these costs are generally sunk
costs in many cases. Firms with large revenue streams can allocate sufficient internal
resources to R&D activities whereas SMEs cannot. In addition, imperfect capital markets
will make external finance available to only a small subset of startups and other SMEs, a
phenomenon well understood for sometime (David et al., 2000; Guellec 2001). The
resulting market failure is understood to invite government intervention. Such
intervention can take many different forms – R&D subsidies, R&D tax breaks, loan
guarantees, etc (Ben Ari and Vonortas, 2007) – depending on the perceived cause of the
market failure the policy is trying to correct such as impecfect capital markets,
technological uncertainty, market risk, inadequate appropriability, and asymmetric
information between investors and small companies. Some of those instruments are more
neutral than others. For instance R&D tax breaks do not involve selection of companies
that will be assisted, contrary to R&D subsidies which does. While economists have long
debated which type of intervention is preferable and are frequently reluctant to prescribe
direct subsidies (picking winners), others perceive that the lack of information and
information asymmetry between stakeholders creates very serious problems for policy
makers, investors, and researchers alike (Tversky and Kahneman, 1974; Slovic et al.,
1980). R&D subsidies to SMEs then can have the additional benefit of providing a quality
signal to private investors helping them improve the subjective judgments and heuristics
they use for investments in R&D (Fischhoff et al., 1980; Finucane et al., 2000).
While the debate on whether public R&D subsidies improve firm performance has
been going on in developed countries for a long time, there is very limited hard evidence
in newly industrialized economies, especially when SMEs are involved. This paper has
empirically examined this topic using a unique panel data set on Korean manufacturing
SMEs and government R&D subsidies. In doing so, we employ a battery of econometric
techniques to control for the selection and simultaneity biases of the government subsidy
for new technology development. The impact of the subsidy is approximated by the

21
average change between the R&D investment of the subsidized firms and that of the
control group of non-subsidized firms.
Our empirical results point in one clear direction: the public subsidy stimulates
private R&D investment in SMEs thus affecting labor productivity positively. Several
possible explanations for this positive effect have been offered in the literature including
cost sharing, risk sharing, and the inducement of external investment through the
provision of qualitative information to investors to facilitate decision making.
Our empirical findings provide at least partial support to the Korean government
R&D promotion policy for SMEs through subsidy. Such subsidies seem to have
enhanced firm performance. It is our conjexture that by stimulating corporate R&D
investment and enhancing productivity the government policy measures have also
contributed to fostering entrepreneurial activity in knowledge-intensive manufacturing
fields. The next step would be to empirically show if and how this might have happened.
22
References
Aghion, Philippe, and Peter Howitt, 1992. "A Model of Growth through Creative
Destruction," Econometrica 60, pp. 323-351.
Anderson, E. B., and C, Hsiao, 1981. “Estimation of Dynamic Models with Error Components.” Journal of the American Statistical Association 76, no. 3, pp. 598-606.
Arellano, M., 2003. Panel Data Econometrics, Advance Texts in Econometrics, Oxford
University Press.
Arellano, M. and S. Bond, 1991. "Some Tests of Specification for Panel Data: Monte
Carlo Evidence and An Application to Employment Equations," Review of Economic
Studies 58, pp. 277-97.
Arellano, M., and O. Bover, 1995. “Another Look at the Instrumental Variables Estimation of Error-Component Models.” Journal of Econometrics 68, no. 1, pp. 29-51.
Arrow, Kenneth J., 1962. “Economic Welfare and Allocation of Resources for
Invention” (pp. 609-626), in National Bureau of Economic Research, The Rate and
Direction of Inventive Activity: Economic and Social Factors (Princeton: Princeton
University Press).
Baltagi, B. H., 2013. Econometric Analysis of Panel Data, John Wiley & Sons,
England.
Basant, R. and B. Fikkert, 1996. “The Effects of R&D, Foreign Technology Purchase, and Domestic and International Spillovers on Productivity,” Review of Economics and
Statistics, pp.187-199.
Ben-Ari, G. and N. S. Vonortas, 2007. “Risk Financing for Knowledge-Based
Enterprises: Mechanisms and Policy Options,” Science and Public Policy, 34(7), pp.
475-488.
Blundell, R. and S. Bond, 1998. "Initial Conditions and Moment Restrictions in
Dynamic Panel Data Models," Journal of Econometrics, 87, pp. 111-143.
Blundell, R. and S. Bond, 2000. “GMM estimation with persistent panel data: an application to production functions.” Econometric Reviews, 19(3), pp. 321-340.
David, P. A., B. H. Hall, and A. A. Toole, 2000. “Is public R&D a complement or substitute for private R&D? A review of the econometric evidence”, Research Policy 29,
pp. 472-495.
Fischhoff, B. P. Slovic, and S. Lichtenstein, 1980. Labile values: A challenge for risk
assessment in: J. Conrad(Eds.) Society, Technology and Risk Assessment, Academic
Press.

23
Finucane, M. L., A. Alhakami, P. Slovic, and S. Johnson, 2000. “The affect heuristic in judgments of risks and benefits,” Journal of Behavior and Decision Making 13, pp.
1-17.
Gonzalez, X. and C. Pazo, 2008. “Do public subsidies stimulate private R&D spending?” Research Policy 37, pp. 371-389.
Gorg, H. and E. Strobl, 2007. “The effect of R&D subsidies on private R&D,” Economica 74, pp. 215-234
Griliches, Z., 1986. “Productivity, R&D and basic research at firm level in 1970s,” American Economic Review 76, pp.141-154.
Griliches, Z., 1995. “R&D and ProductivityL Econometric results and measurement issues,” in P. Stoneman (Ed), Handbook of the Economics and Technological Change,
Oxford, UK.
Grossman, Gene M., and Elhanan Helpman, "Quality Ladders in the Theory of
Growth,"The Review of Economic Studies 58 (1991), 43-61. Blackwell, pp. 52-89.
Guellec, D. and B. Van Pottelsberghe De La Potterie, 2001. “R&D and productivity growth: Panel data analysis of 16 OECD countries,” OECD STI Working Paper.
Guellec, D. and B. Van Pottelsberghe De La Potterie, 2004. “From R&D to Productivity Growth: Do the Institutional Settings and the Source of Funds of R&D Matter?,” Oxford Bulletin of Economics and Statistics, 66(3), pp.353-378.
Holeman, B., and L. Sleuwaegen, 1988. “Innovation expenditure and the role of government in Belgium,” Research Policy 17, pp. 375-379.
Kauko, K., 1996. “Effectiveness of R&D subsidies - A skeptical note on the empirical
literature,” Research Policy 25, pp. 321-323.
Klette, T. and J. Moen, 1999. “From growth theory to technology policy: Coordination problems in theory and practice,” Nordic Journal of Political Economy 25.
Lach, S., 2002. “Do R&D subsidies stimulate or displace private R&D? Evidence from Israel,” Journal of Industrial Economics 50, pp. 369-390.
Leyden, D. P., and A. N. Link, 1991. “Why are Governmental R&D and Private R&D Complements?” Applied Economics, 23, pp. 1673-1681.
Levin, R. and P. Reiss, 1984. “Test of a Schumpeterian model of R&D and market structure” in: Z. Griliches (Eds.), R&D, Patents and Productivity, University Chicago
Press.
24
Lichtenberg, F. R., 1984. “The relationship between federal contract R&D and company R&D,” American Economic Review 74(2), pp.73-78.
Lichtenberg, F. R., 1988. “The private R&D investment response to federal design and
technical competitions,” American Economic Review 78(3), pp. 550-559.
Nelson, Richard R., 1959. "The Simple Economics of Basic Scientific Research," The
Journal of Political Economy 67, pp. 297-306.
OECD, 2001. Measuring Productivity. Measurement of Aggregate and Industry-Level
Productivity Growth, OECD Manual, OECD.
Romer, Paul M., 1990. "Endogenous Technological Change," Journal of Political
Economy 98, pp. S71-S102.
Scott, J. T., 1984. Firms versus industry variability in R&D in: Z. Griliches (Eds.),
R&D, Patents and Productivity, University Chicago Press.
Slovic, P. and B. Fischhoff, S. Lichtenstein, 1980. “Facts versus fears: Understanding perceived risk,” in: Societal Risk Assessment: How Safe is Safe Enough, Plenum Press.
Tsang, E. W. K., P. S. L. Yip, and M. H. Toh, 2008. “The Impact of R&D on value added for domestic and foreign firms in a newly industrial economy,” International
Business Review, Vol.17, Issue 4, pp.423-441.
Tversky, A., and D. Kahneman, 1974. “Judgment under uncertainty: Heuristics and
biases,” Science 185, pp. 1124-1131.
Wallsten, S. J., 2000. “The effects of government-industry R&D programs on private
R&D: the case of the small business innovation research program,” Rand Journal of
Economics 31(1), pp. 82-100.
Wang, T. Y., S. C. Chien, and C. Kao, 2007. “The role of technology development in national competitiveness – Evidence from Southeast Asian countries,” Technological
Forecasting & Social Change, 74, pp. 1357-1373.