Embed Size (px)
Citation preview
The impact of go-shop provisions in merger agreements
Sridhar Gogineni University of Wyoming
Department of Economics & Finance, College of Business, 1000 E. University Avenue, Laramie, Wyoming 82071. Phone: 307-766-3848. Fax: 307-766-5090. E-mail: [email protected]
John Puthenpurackal
University of Nevada – Las Vegas Department of Finance, 537 Beam Hall, College of Business, UNLV, Las Vegas. NV 89154-6008.
Ph: 702.895.1184. Fax: 702-895-4650 Email: [email protected]
Abstract
Go-shop provisions in merger agreements drastically alter the bidding process by shifting the solicitation of bids to after a merger agreement is signed with a particular bidder. Using a large sample of merger agreements from 2003 to 2012, we examine whether go-shops are used to benefit target shareholders or for agency/entrenchment reasons. We find deals with go-shops are more likely to be faced with a competing bid and more likely to have an upward revision of the initial offer price. We also find that while a go-shop provision increases the probability of a particular bid being jumped by another bid, it does not appear to affect the probability of the target being ultimately taken over. We also document that go-shops have a non-negative association with announcement period and long run target returns. Collectively, our results appear to indicate that go-shops are used to further target shareholder interests and not to secure deals with favored bidders at the expense of target shareholders.
2
1. Introduction
The introduction of “go-shop” clauses in merger agreements has been an important
innovation in merger contracting provisions. The board of directors and management of target
firms have a fiduciary duty to obtain the highest possible price for their shareholders. Go-shop
clauses represent a radical departure from how this fiduciary duty has traditionally been fulfilled.
In deals with go-shop clauses, the target board of directors typically negotiates with only one
bidder, and then sign and publicly announce a definitive merger agreement with that bidder. The
go-shop clause then allows the target firm to actively solicit other bids during a “go-shop” period
of typically 30-45 days which starts on the day of the public announcement of the merger
agreement. By actively seeking superior bids after a definitive merger agreement is announced,
target boards claim to fulfill their fiduciary duty to target shareholders.
In contrast, fiduciary duty has traditionally been demonstrated through a pre-public
takeover process which includes contacting potential bidders, signing confidentiality/standstill
agreements and accepting private bids (Boone and Mulherin, 2007a; Gogineni and
Puthenpurackal, 2013). The target board then negotiates with the bidders for the highest possible
price. If an acceptable price is obtained from a bidder, a definitive merger agreement is signed
and a public announcement is made. Typically, after the public announcement of a merger
agreement, target boards do not actively solicit new bids although superior bids can still be
considered.
There is an extensive finance literature on merger events and on different types of merger
provisions and clauses. However, partly due to their relatively recent introduction, there has been
virtually no study of go-shop provisions, with only a few business law articles examining their
potential impact (Sauter, 2008; Subramanium, 2008). In this paper, we test two explanations for
3
go-shop usage. The first explanation, based on managerial agency problems, argues that target
management use go-shop provisions to secure deals with favored bidders and curb the bidding
activity of hostile but potentially higher value bidders. The second explanation, based on
shareholder interest and efficiency arguments, proposes that targets use go-shop provisions to
improve incentives for bidding. That is, by giving a particular bidder a favored position, the
bidder is compensated for negotiation costs and information externalities and is thus encouraged
to invest in the transaction and make a bid. To determine empirical support for either
explanation, we examine (1) which firm and deal characteristics are correlated with the use of
go-shop provisions; (2) whether go-shop provisions affect the likelihood of a competing offer by
another bidder as well as the likelihood of upward revisions to the initial offer price; (3) whether
go-shop provisions impact the probability of a deal being completed; and (4) how go-shop
provisions are associated with target returns.
Most deals with go-shop provisions also have target termination fee provisions. Target
termination fee clauses require a payment by the target to the bidder if the target dissolves the
merger agreement. Traditionally, this fee averages about 3 percent of the deal value and
represents an additional cost to a competing bidder wishing to outbid the initial bidder. A tiered
termination fee provision is however present in go-shop deals, with a reduced termination fee
(typically 50-60% of the full termination fee) if a new successful bidder emerges during the go-
shop period. If however successful bidders make their bids after the go-shop period, the target
has to pay the full termination fee to the initial bidder. Similar to go-shop provisions, termination
fee provisions can potentially be used for agency reasons or for target shareholder interests, i.e.,
they may limit competition from potentially higher value bidders but can also improve incentives
for bidding. Bates and Lemmon (2003) and Officer (2003) carefully examine the impact of
4
termination fees and conclude that they appear to be used in the interest of target shareholders. In
this paper, we are careful to control for the presence of target termination fee provisions while
estimating the incremental impact of go-shop provisions.
Using a large sample of merger agreements over the 2003 to 2012 period, we find that
go-shop provisions are more likely in deals involving negotiation selling method, financial
buyers and all cash financing. Go-shops are also associated with a higher likelihood of a
competing bid. Thus, go-shops do not appear to be a superficial attempt to demonstrate fiduciary
duty: active solicitation of new bids and the tiered termination fee structure of go-shop deals
appear to be effective in facilitating competing bids. We also find deals with go-shops are less
likely to be completed, which is consistent with the above result that go-shops are associated
with a higher likelihood of a competing bid. This raises the question whether go-shop provisions
reduce the probability of target shareholders capturing takeover premiums. To explore this, we
perform target level (not deal level) analysis and find that go-shop provisions are not
significantly related to the probability of takeover completion. Thus, while a go-shop provision
increases the probability of a particular deal being jumped by another bid, it does not appear to
affect the probability of the target being ultimately taken over.
Further, using target level analysis, we find that there is a higher probability of an upward
revision of the initial offer price when go-shops deals are involved. Finally, we find that the
incidence of go-shop provisions has a non-negative association with both target announcement
returns and long run target returns. Collectively, our findings suggest that the use of go-shop
clauses in merger agreements is consistent with target management and boards acting in the
interests of target shareholders.
5
The rest of the paper is organized as follows. We review related literature and develop
our hypotheses in section 2. Sample selection and variables used are discussed in section 3. We
present our empirical findings in section 4 and conclude in section 5.
2. Related literature and hypotheses
The Delaware Supreme Court’s 1986 decision Revlon, Inc. v. MacAndrews & Forbes
Holdings Inc., has shaped the fiduciary duty expectations of target boards. It stated that target
boards should take steps to ensure the maximization of target shareholder value and that target
directors should foster competitive bidding to obtain the highest possible price. Although this
initially suggested an auction type model, other deal making approaches such as negotiations
with a few bidders have also been adopted. Some papers show that properly structured
negotiations can result in target returns similar to those using auctions (Hansen, 2001; Povel and
Singh, 2006; Boone and Mulherin, 2007a). Hence, it appears that a target board can adopt
different approaches while selling a firm and still continue to fulfill their fiduciary duty to obtain
the highest possible price.
Go-shop provisions significantly alter the takeover process since typically the target
negotiates with only one bidder and signs a definitive agreement with that bidder. Since target
termination fee provisions are present in almost all go shop deals, it appears to give an upfront
advantage to the initial bidder relative to other potential bidders. That is, other bidders now have
to bear a termination fee if they choose to bid. If the applicable target termination fee exceeds the
difference between the reservation prices of the new potential bidders and the initial bid, the
bidders will not make an offer. Note however that the burden of the target termination fee is
6
lower in go-shop deals since there is a reduced termination fee if a new successful bid emerges
during the go-shop period.
The main findings of Bates and Lemmon (2003) and Officer (2003) on the impact of
target termination fees are as follows. Deals with termination fees have higher deal completion
rates and greater takeover premiums than deals without such clauses. Officer (2003) also finds
weak evidence of target termination fees deterring competing bidders. Both these papers
conclude that target termination fees serve as an efficient contracting device, and not a means of
deterring competitive bidding to the detriment of target shareholders. These findings support
evidence documented on the use of poison pills and lockup options. For example, Schwert
(2000) concludes that target managements’ tough bargaining stance with potential acquirers are
consistent with a bargaining strategy that is beneficial to target shareholders on average.
Similarly, Comment and Schwert (1995) conclude that the adoption of poison pills benefit target
shareholders on average. Burch (2001) finds the use of lockup options in corporate mergers is
more consistent with managers using lockup options to enhance bargaining power than with
lockup options harming shareholder wealth. Hence, although target termination fees, poison pills
and lockup options can conceivably be used to the detriment of shareholders, they appear on
average to be used to benefit target shareholders. Similar to the above papers, we explore two
potential explanations of go-shop usage.
2.1. Agency problem hypothesis
Go-shop provisions can potentially be used by target management to secure deals with
favored bidders and curb the bidding activity of hostile, but potentially higher value bidders. This
is because a new bidder is now faced with termination fee costs and also the target management
team may already be aligned with the initial bidder. If the bidding process is curtailed due to
7
these reasons, target shareholders may obtain lower takeover premiums. If this is the case,
legitimate concerns can be raised about whether the use of go-shop provisions adequately fulfills
the fiduciary duty of target boards and management. The agency problem hypothesis thus
predicts lower target returns for go-shop deals. If go-shop provisions are merely window
dressing to superficially fulfill fiduciary duty, the agency problem hypothesis also predicts that
that the incidence of competing bids after the merger agreement announcement and the incidence
of upward revisions to the initial offer price will be no higher in go-shop deals. Finally, the
agency problem hypothesis predicts a success rate for go-shop deals that is not different from
other deals.
2.2. Shareholder interest hypothesis
This hypothesis argues that go-shop provisions are a contracting mechanism that
improves incentives for bidding. As discussed by Bates and Lemmon (2003) and Officer (2003),
the public announcement of a bid for a target creates a positive externality by providing third
parties with information about the potential value creation associated with the target. The initial
bidder is thus exposed to the risk that a higher value bidder, free riding on information contained
in the prior bids, may submit an ultimately successful competing bid. In addition, bidders bear
direct costs such as valuation and negotiation with the target. Hence, by granting favored status
to a particular bidder, a deal with termination fee and go-shop provisions provides incentives to
that bidder to make deal-specific investments in the transaction and make a bid to the benefit of
target shareholders.
The predictions of the shareholder interest hypothesis are as follows. The active
solicitation of new bids and the tiered structure of termination fees in go-shop deals should
increase the incidence of competing bids and upward revisions of the initial offer price. This
8
suggests a lower deal completion rate of a given bid since there is a higher likelihood of any
given bid being jumped by a competing bid. However for go-shops to be value adding to target
shareholders, the likelihood of the target being successfully taken over by any one bidder should
not be lower. Finally, the shareholder interest hypothesis predicts that target returns will be no
lower in go-shop deals since there is an adequate market check in the takeover process.
3. Sample construction and variable description
Our initial sample of 2,996 merger announcements of publicly traded U.S. targets
between January 1, 2003 and December 31, 2012 is provided by Merger Metrics. Of these, 2,246
deals have CRSP and COMPUSTAT data available. We supplement this dataset with information
from ThomsonOne (formerly SDC) where available. Inside ownership data is obtained from
ThomsonReuters insiders filings and measures the fractional ownership of the target firm’s
officers and directors in the year prior to the acquisition bid. Go-shop provisions are present in
147 deals. Our final sample therefore consists of 2,099 no go-shop deals and 147 go-shop deals.
As proxies for firm size, we use book value of total assets in the fiscal year prior to bid
announcement and market value of equity computed 42 trading days prior to bid announcement.
Our measure of prior firm performance is net of market return calculated as the difference
between the buy-and-hold return of the target and that of the value weighted CRSP index over
the months -12 to -1 relative to the announcement month of the acquisition. Our proxy for firm
profitability and potential free cash flow problems is free cash flow, computed as operating
income before depreciation minus total taxes minus change in deferred taxes minus gross interest
expense minus any preferred and common dividends paid, scaled by total assets. We follow
Smith and Watts (1992) and include the target’s ratio of market-to-book assets in the fiscal year
9
prior to the announcement year as a proxy of the firm’s growth opportunities. We note that firms
with higher growth opportunities are often associated with greater information asymmetry
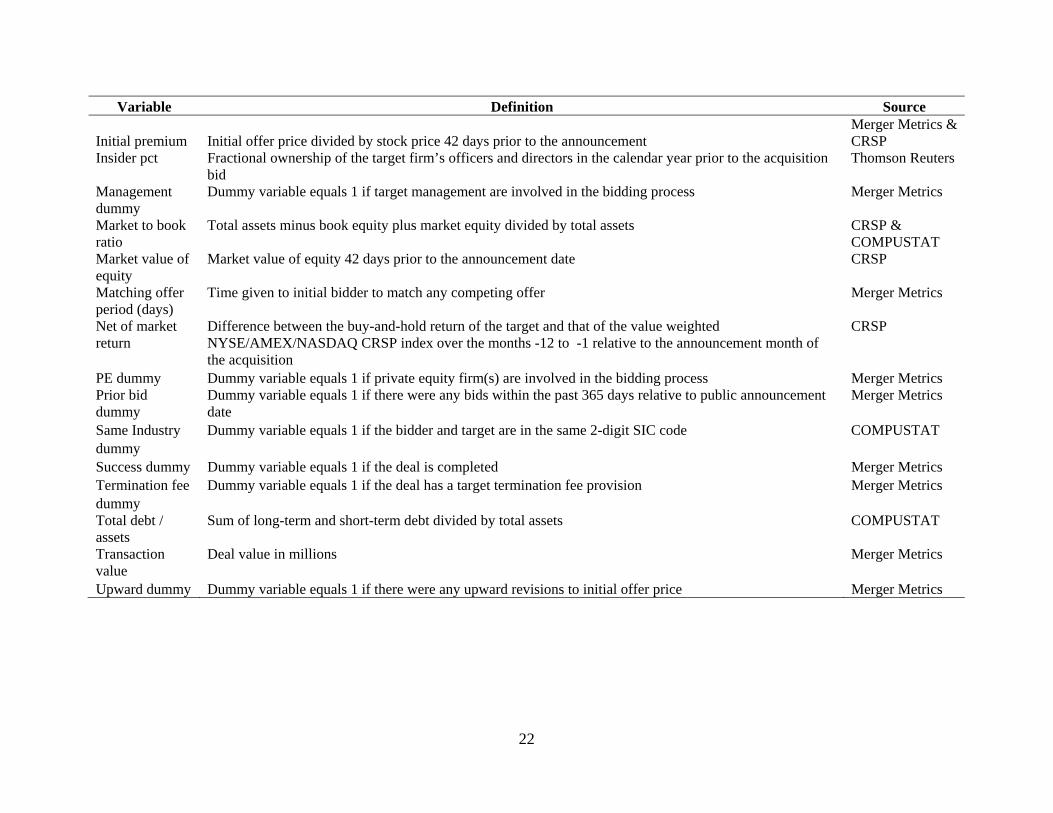
between insiders and outsiders. Please refer to Appendix for definitions of all the variables used
in our analyses.
4. Empirical analysis
4.1. Sample description and univariate statistics
Panel A of Table 1 provides the distribution of the sample by year. There does not
appear to be clustering of observations in any particular year. About 84 percent of the full sample
have target termination fees and this proportion is fairly uniform across years, ranging from 72
percent (in 2008) to 92 percent (in 2003). These statistics are similar to those reported by Boone
and Mulherin (2007b) who note that the lower incidence of termination fee provisions reported
in earlier research on termination fee provisions was a result of underreporting in the SDC
database. Since 97 percent of go-shop deals also have target termination fee provisions, we are
careful to control for target termination fee provisions while examining the incremental impact
of go-shop provisions.
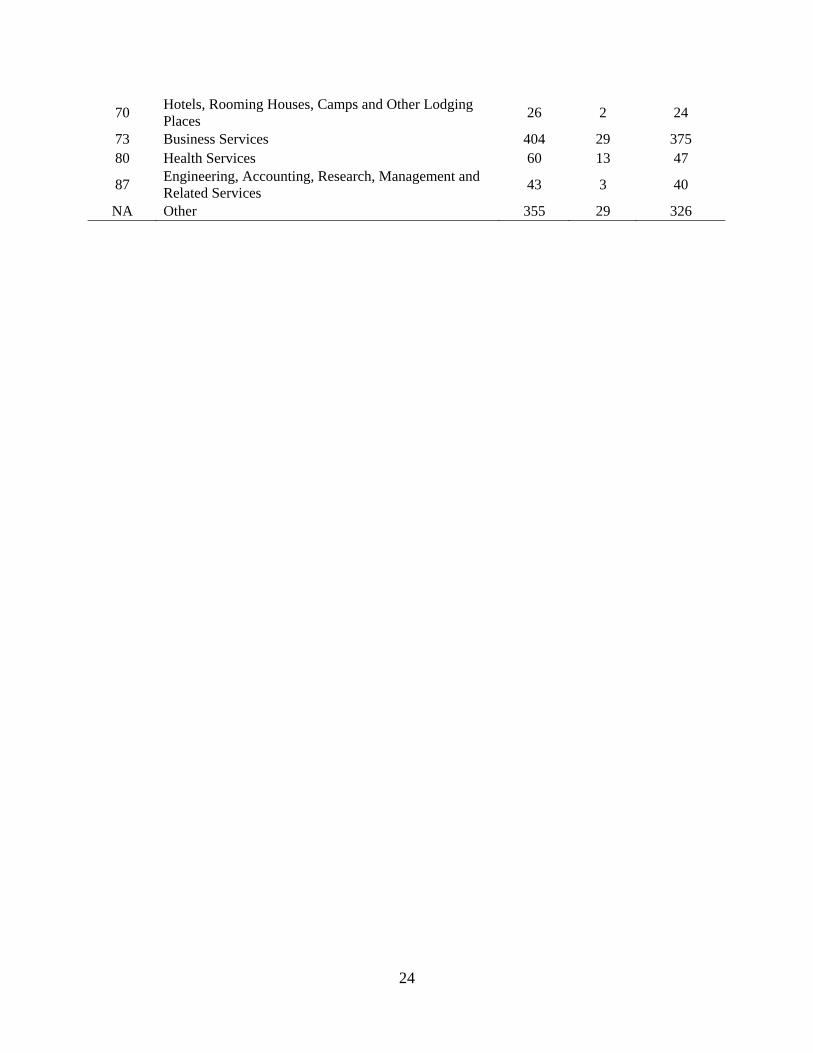
Panel B of Table 1 reports the industry distribution of the sample using two-digit SIC
codes for industry classifications. For go-shop deals, the sample is well represented across all
industry groups with Business Services and Health Services having the highest representation.
For no go-shop deals, the sample is again well represented across industries with Business
Services, Financials and Chemical and Allied Products having the highest representation.
We provide univariate statistics of deal and target characteristics for the full sample in
Table 2. Definitions of all variables are provided in Appendix. To gain an understanding of deal
10
and target characteristics that are different in go-shop deals, we also provide univariate statistics
for go-shop and no go-shop deals and test for differences in means and medians. Starting with
deal characteristics, cash offers (all cash) comprise 66.4 percent, 91.8 percent and 64.6 percent,
of the full sample, go-shop sample and no go-shop sample, respectively. This indicates that go-
shop deals are mostly cash deals. Auction selling method (auction dummy) comprises 34.3
percent, 25.2 percent and 35 percent, of the full sample, go-shop sample and no go-shop sample,
respectively. Hence, while a majority (74.8 percent) of go-shop deals used a negotiation selling
method involving one bidder, go-shop provisions are sometimes present in auction deals.
For completed go-shop deals, it takes, on average, 115 days after the announcement to
get completed and the corresponding figure for no go-shop deals is 123 days (days to
completion). The differences of means and medians of days to completion for go-shop and no go-
shop deals are not statistically significant. After the announcement of an agreement, on average,
a competing bid (competing bid dummy) arises in 12.9 percent of go-shop deals and in 7.5
percent of no go-shop deals and the difference is significant at the 10 percent level. Further 78.2
percent of announced go-shop deals are completed (success dummy) while 81.5 percent of no go-
shop deals are completed. The initial offer price is revised upwards (upward dummy) in 16.3
percent of go-shop deals and in 9.5 percent of no go-shop deals and this difference is significant
at the 5 percent level. The univariate evidence on the incidence of competing bids, deal success
rate and upward revision of the initial offer price suggests that go-shops appear to allow for a
robust market check after the merger agreement by actively soliciting new bids and lowering the
cost for a new bidder to make a bid, consistent with the shareholder interest hypothesis.
The deal attitude in our sample is mainly friendly (hostile dummy) with only about 5
percent deals considered hostile. Hostile deals are even rarer among go-shop deals (1.4 percent).
11
Financial buyers (financial buyer dummy), of which private equity firms are the predominant
group, account for 21.7 percent, 64.6 percent and 18.7 percent, of the full sample, go-shop
sample and no go-shop sample, respectively. The corresponding figures for private equity firms
(PE dummy) are 17.8 percent, 59.9 percent and 14.8 percent, respectively. This indicates that go-
shop deals often involve financial buyers and PE firms. The desire for a favored bidder status is
likely to be greater among financial buyers since the cost of information externalities could be
more pronounced for them. Specifically, since the gains from a deal are unlikely to be unique to
a particular financial buyer, other bidders may be able to free ride on the information revealed in
the initial bid and offer a competing bid. The target management (management dummy) is
involved as a bidder in 9.5 percent of go-shop deals and in 2.4 percent of no go-shop deals and
this difference is significant at the 1 percent level. The mean (median) transaction value of go-
shop and no go-shop deals are 1,080 mill. (387 mill.) and 1,663 mill. (361 mill.), respectively
and the difference in means is significant at the 1 percent level.
The mean (median) go-shop window is 35.4 (30) days while the mean (median) go-shop
termination fee is 17.1 mill. (7.5 mill.). The mean (median) ratio of go-shop termination fee to
full termination fee is 0.53 (0.5). The initial bidder often has matching rights wherein the initial
bidder has a certain number of days to match a new bid. The matching offer period for both the
go-shop and no go-shop deals is about 4 days.
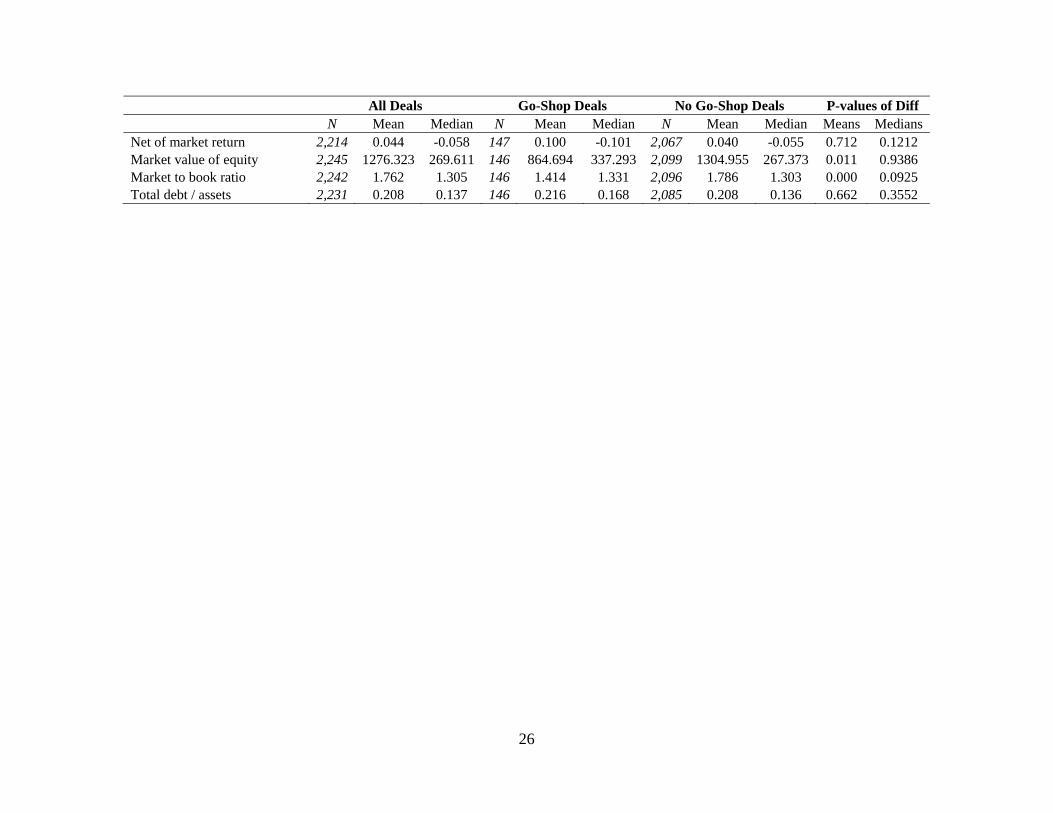
With respect to target firm characteristics, the mean (median) total assets of go-shop
deals is 1244 mill. (440 mill.) while that for no go-shop deals is 3046 mill. (414 mill.) and the
means are significant at the 1 percent level. The mean (median) market value of equity 42 days
prior to the bid announcement date is 865 mill. (337 mill.) for go-shop deals and 1305 mill. (267
mill.) for no go-shop deals. The difference in means is significant at the 5 percent level. Both the
12
mean and median free cash flow to total assets ratio is higher for go-shop targets, significant at
the 1 percent level. The debt to assets ratio is similar for go-shop and no go-shop targets while
the market to book ratio, a measure of growth opportunities, is significantly lower for go-shop
targets.
We measure announcement period target returns using short-run cumulative abnormal
returns (CARs). We follow Schwert (1996) by estimating market model parameters, using CRSP
value-weighted index as the market proxy, for each target firm using daily returns from day -379
to day -127 relative to the deal announcement date. We calculate CARs for (-1,+1) and (-2,+2)
windows with day 0 being the deal announcement date. The mean (median) 3-day announcement
period target returns for go-shop deals is 29.7 (22) percent while that for no go-shop deals is 23.6
(19) percent. Both the mean and median are significant at the 5 percent level. We obtain similar
results using 5-days CARs. These univariate results suggest that go-shop provisions are used to
further shareholder interests, consistent with the shareholder interest hypothesis.
4.2. Likelihood of go-shop provisions
Although the above univariate statistics provide some insight into the differences in deal
and target characteristics between go-shop and no go-shop deals, we next conduct logistic
regressions to identify characteristics that are correlated to the incidence of go-shop provisions in
a multivariate framework. As reported in Model 1 of Table 3, go-shop provisions are less likely
to be present in deals with auction selling method, consistent with the univariate results. Go-
shops are also more likely to be present in deals where a financial buyer is involved as a bidder
and less likely to be present in hostile deals. In Model 2 of Table 3, we include additional
control variables, year and industry dummy variables. The findings of Model 1 generally remain
intact except for the hostile offer variable. In addition, cash offer deals and targets with lower
13
market to book ratios are more likely to have go-shop provisions, consistent with the univariate
results.
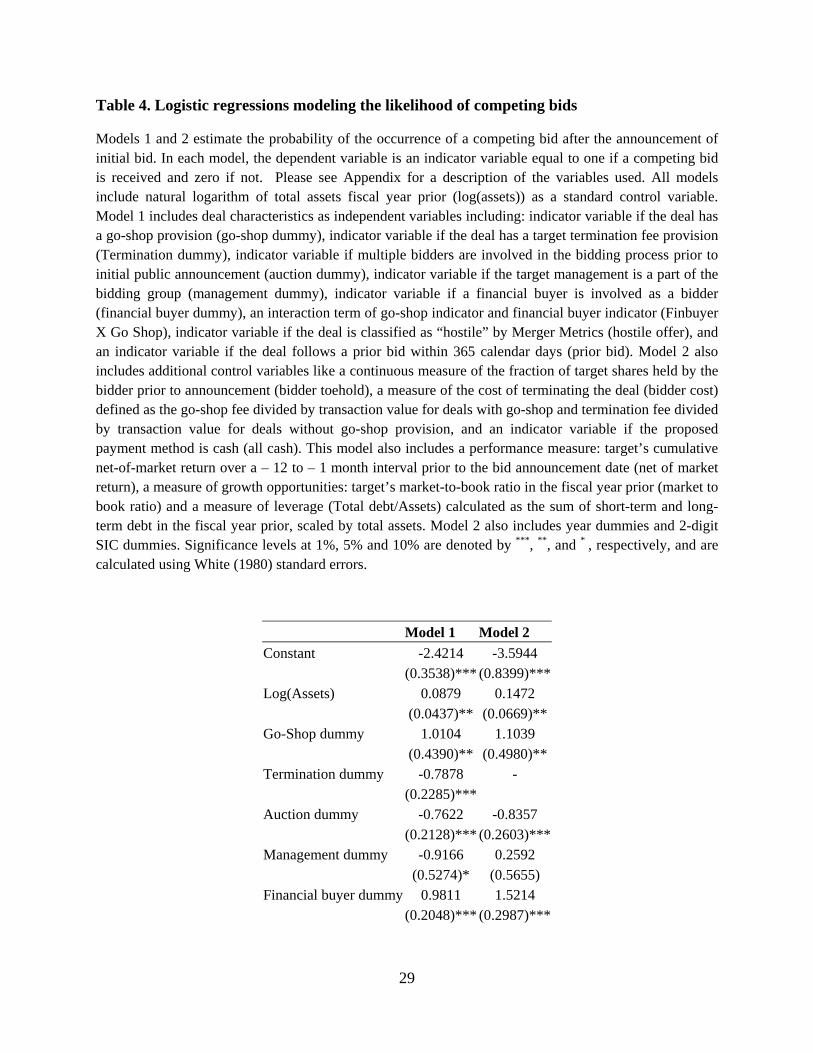
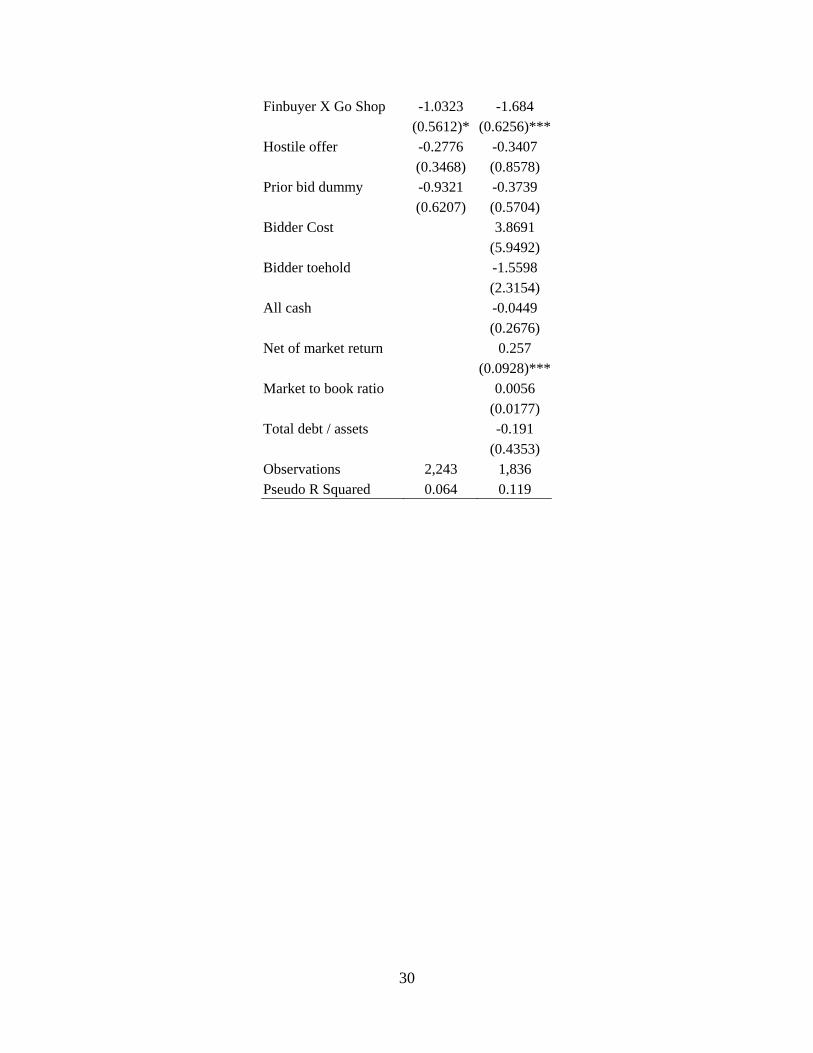
4.3. Go-shop provisions and the incidence of competing bids
We next attempt to provide more direct evidence on whether go-shop provisions, through
the active solicitation of new bids and the tiered termination fee structure, allow for a robust
takeover market check. We examine the association between go-shop provisions and the
likelihood of a competing public bid. As reported in Model 1 of Table 4, go-shops are positively
associated with the likelihood of a competing bid, significant at the 5 percent level. In addition,
deals with auction selling method are less likely to receive a competing bid after the
announcement of a merger agreement. Larger targets and deals with financial buyers are more
likely to receive a competing bid while deals with termination fee are less likely to receive a
competing bid. In Model 2, we include additional control variables (termination fee dummy gets
dropped due to collinearity). We find that go-shops continue to be positively associated with the
likelihood of a competing bid, again significant at the 5 percent level. The findings of Model 1
generally remain intact. In addition, deals involving targets with strong net of market returns
prior to the merger announcement are more likely to receive a competing bid.
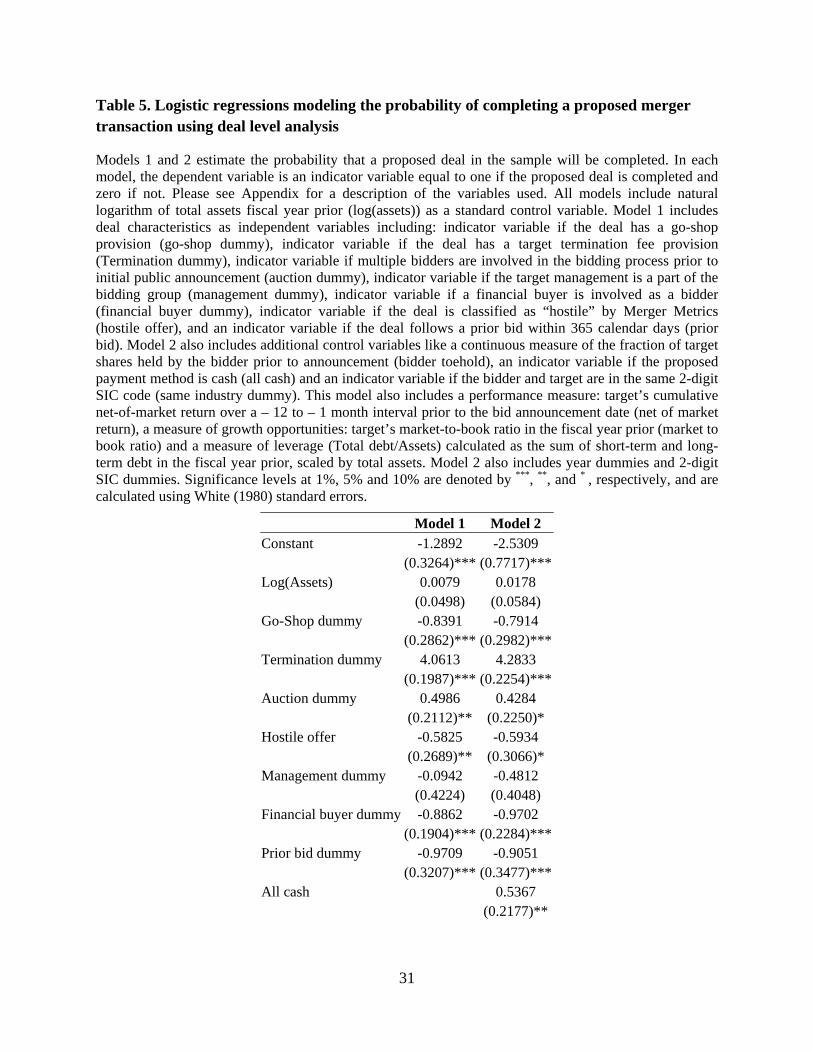
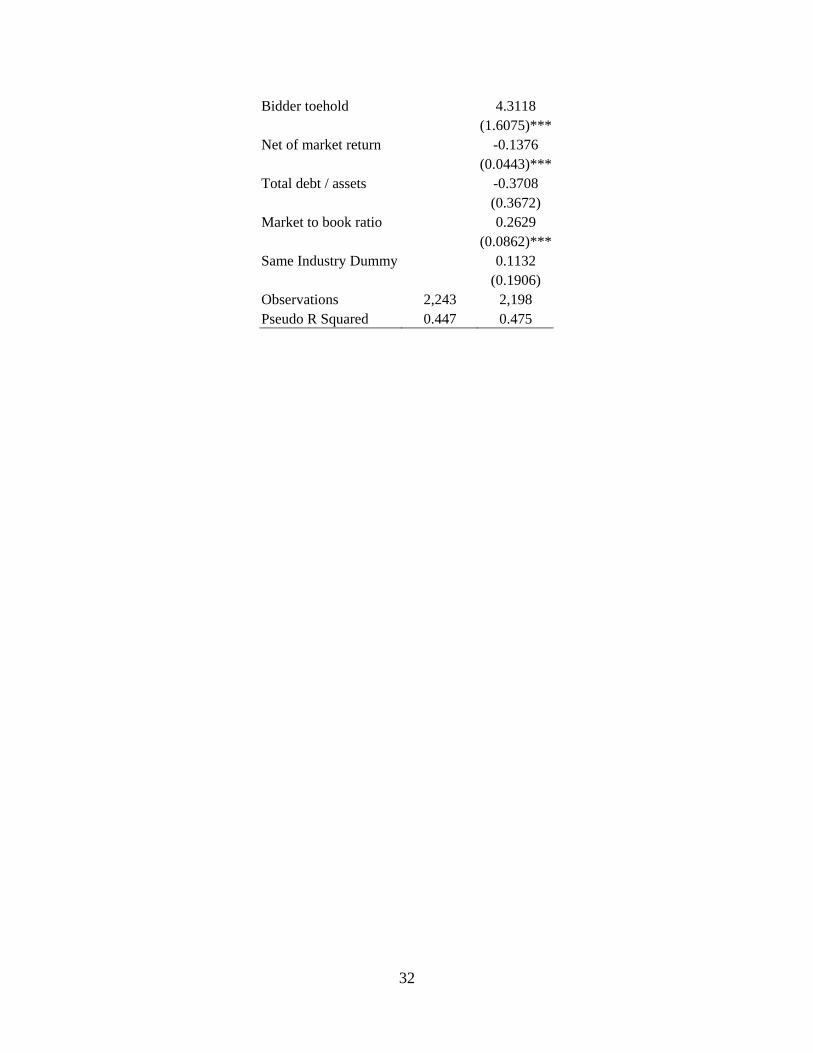
4.4. Go-shop provisions and deal completion
We next study whether the presence of go-shop provisions significantly affects the
likelihood of deal completion in a multivariate setting. The results of logistic regressions that
model the probability of deal completion are reported in Table 5. As reported in Model 1, the
more parsimonious model, we find that go-shop provisions are negatively associated with the
14
likelihood of deal completion, significant at the 1 percent level. This suggests that go-shop
provisions are not mere window dressing but do result in a robust market check wherein the
initial bid may be jumped by a new bid. Consistent with Bates and Lemmon (2003) and Officer
(2003), deals with termination fees have higher deal completion rates. Deals with financial
buyers are associated with lower completion rates. In Model 2, we include additional control
variables. The significant variables of Model 1, including the go-shop variable, remain
significant in Model 2. In addition, we find that deals involving targets with weaker net of
market returns prior to the merger announcement are more likely to be completed. Cash offer
deals and deals with bidder toeholds are more likely to be completed. Overall, go-shop
provisions are negatively associated with the likelihood of deal completion.
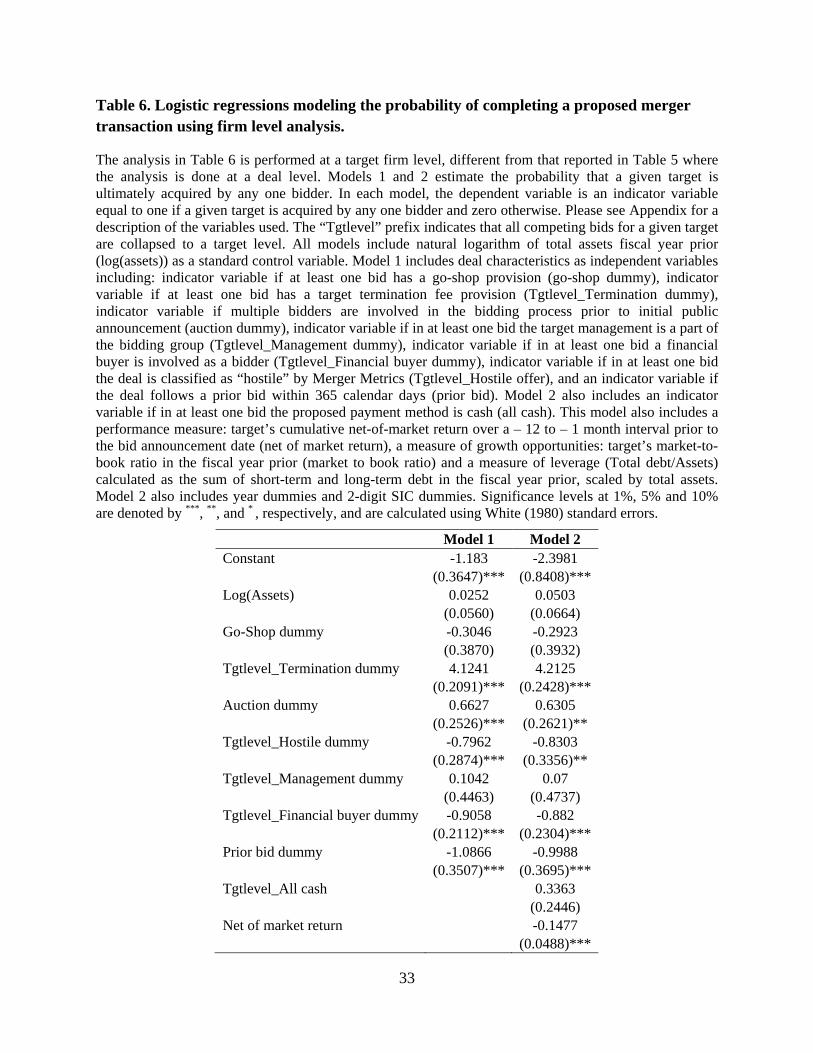
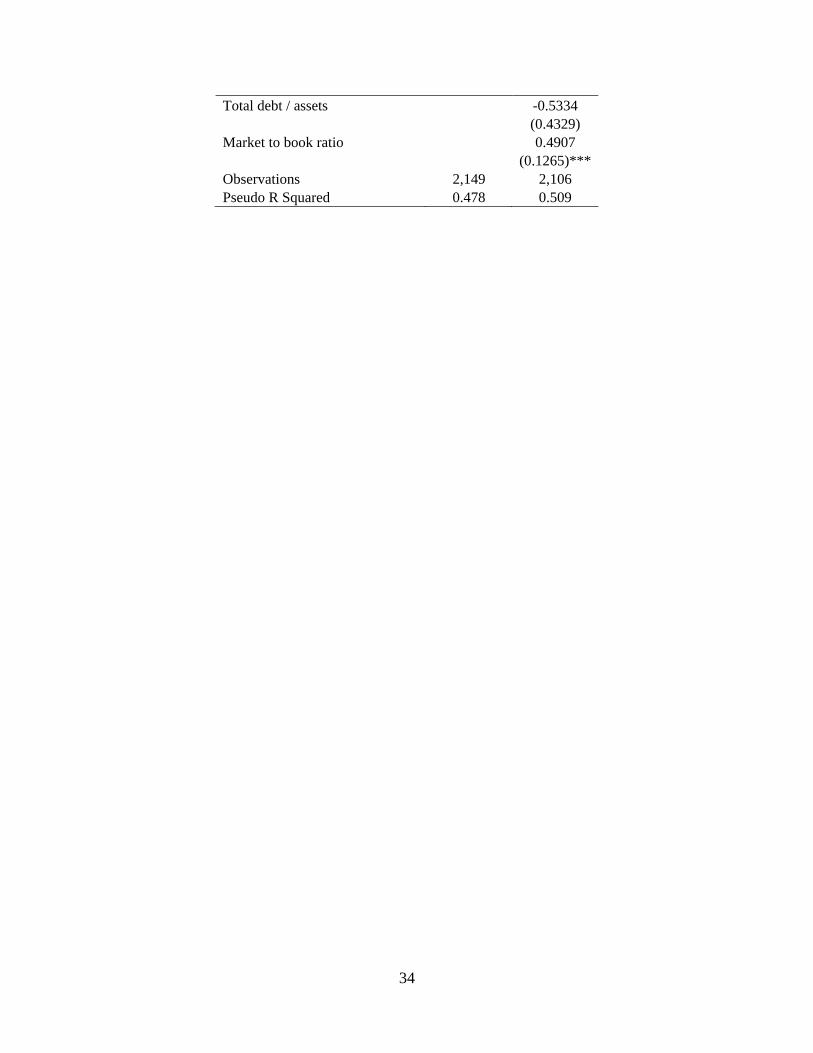
While the above finding indicates that go-shop provisions provide a robust market check,
it raises the question whether go-shop provisions reduce the probability of target shareholders
capturing takeover premiums. To explore this, we next perform target level analysis, not the deal
level analysis described above. In the target level analysis, we are interested in whether the target
is ultimately acquired by any one bidder, even if an earlier deal involving a particular bidder was
jumped by another bid. The target level results are reported in Table 6. In both Models 1 and 2,
go-shop provisions are not significantly related to the probability of completion. Most control
variables have similar signs and significant to those in the deal level analysis reported in Table 5.
Thus, while a go-shop provision increases the probability of a particular deal being jumped by
another bid, it does not appear to affect the probability of the target being ultimately taken over.
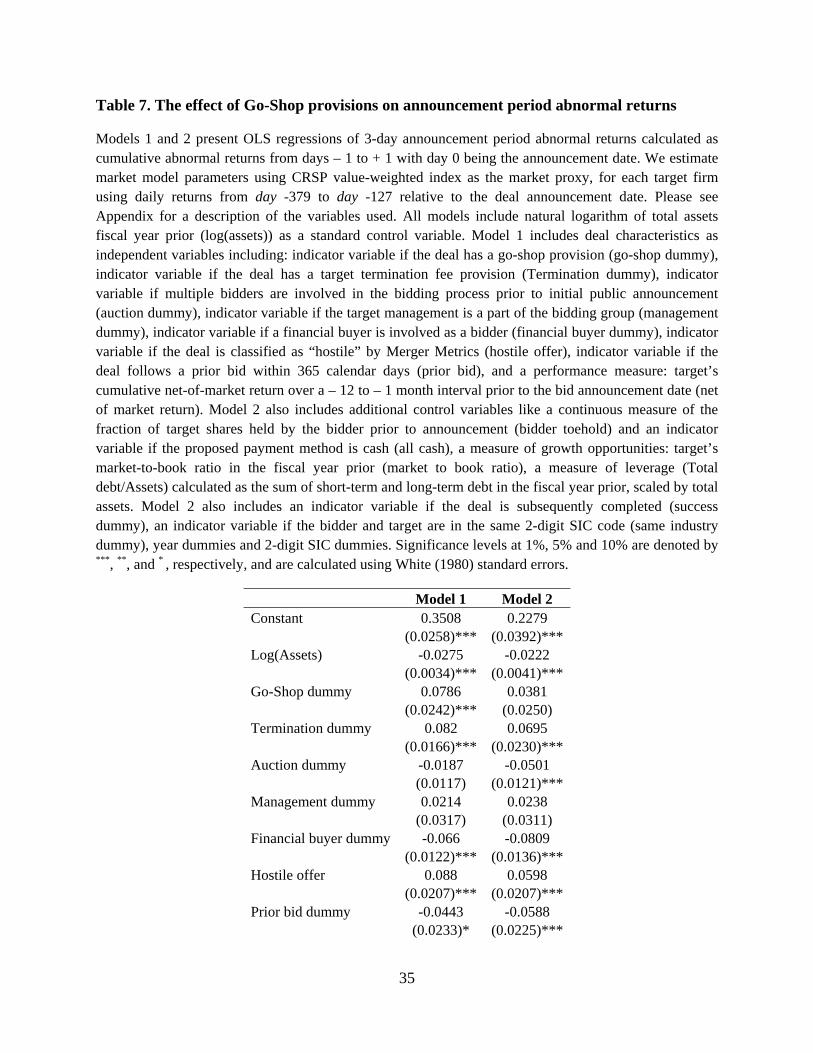
4.5. Go-shop provisions and target returns
Our findings so far appear to support the shareholder interest hypothesis. However, the
primary concern of target shareholders are the returns they receive in the merger. The univariate
15
results reported in Table 2 indicated higher target announcement returns for go-shop deals. We
next examine the association of go-shop provisions with announcement period target returns in a
multivariate framework. As reported in Model 1 of Table 7, we find that go-shop is positively
associated with 3-day announcement period returns, CAR(-1,+1), significant at the 1 percent
level. Consistent with prior literature (Bargeron et al., 2008; Officer et al., 2010), we also find
that larger targets have smaller announcement period returns. Consistent with Bates and
Lemmon (2003) and Officer (2003), deals with termination fee provisions have higher target
returns. Friendly deals and deals with prior bids also have lower announcement period returns.
Targets with weak net of market returns prior to the merger announcement have higher
announcement period returns. Deals involving financial buyers have lower target returns.
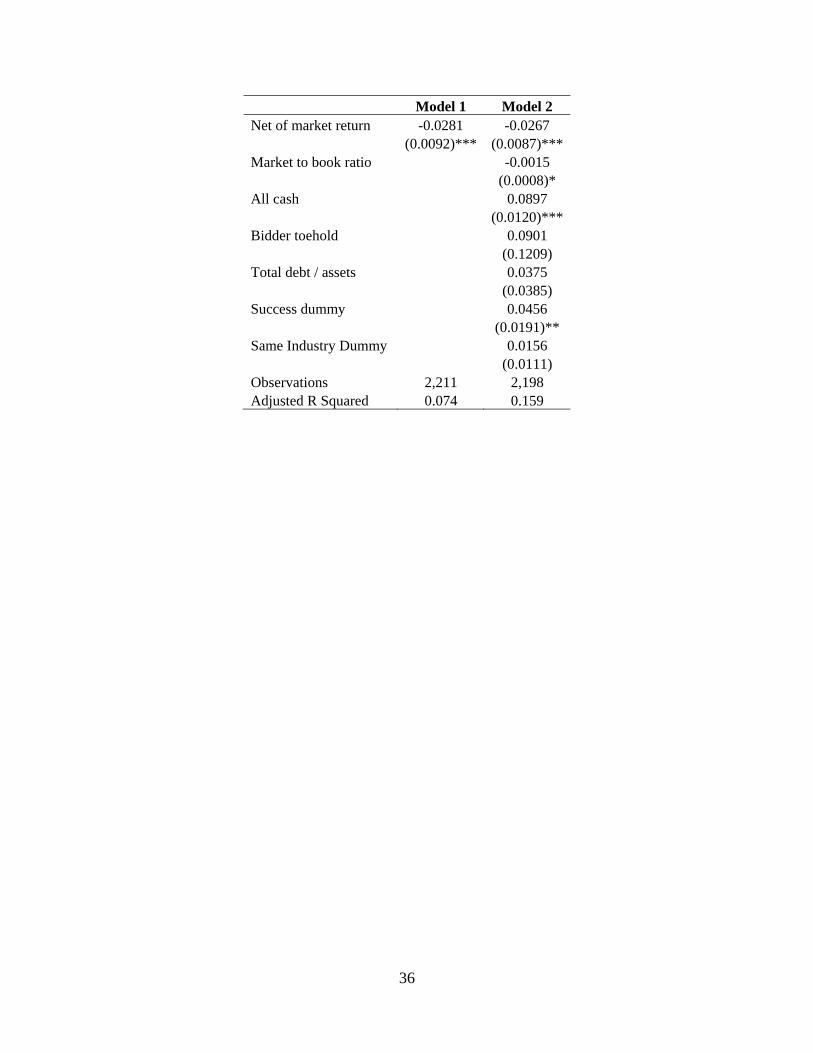
In Model 2, we include additional control variables. The go-shop variable continues to be
positive but is no longer significant. Cash offer deals tend to have higher announcement period
returns. Overall, the return results are consistent with the shareholder interest hypothesis since
target returns in go-shop deals appear to be no lower than that of no go-shop deals.
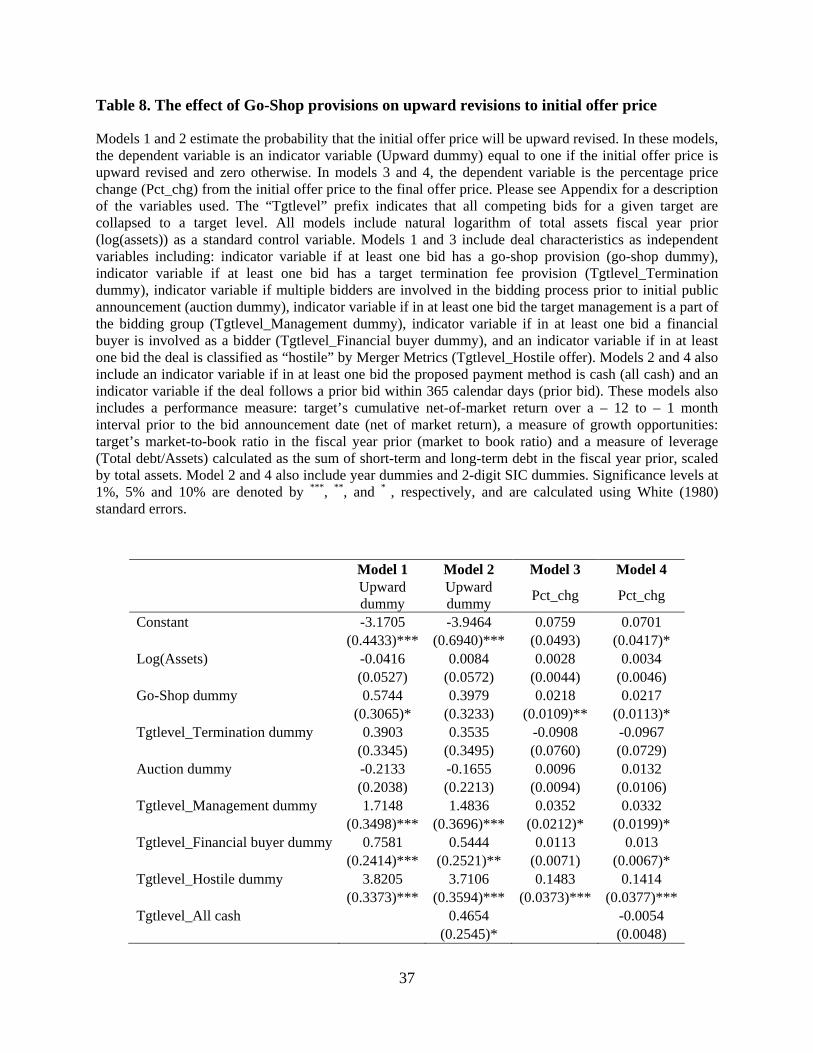
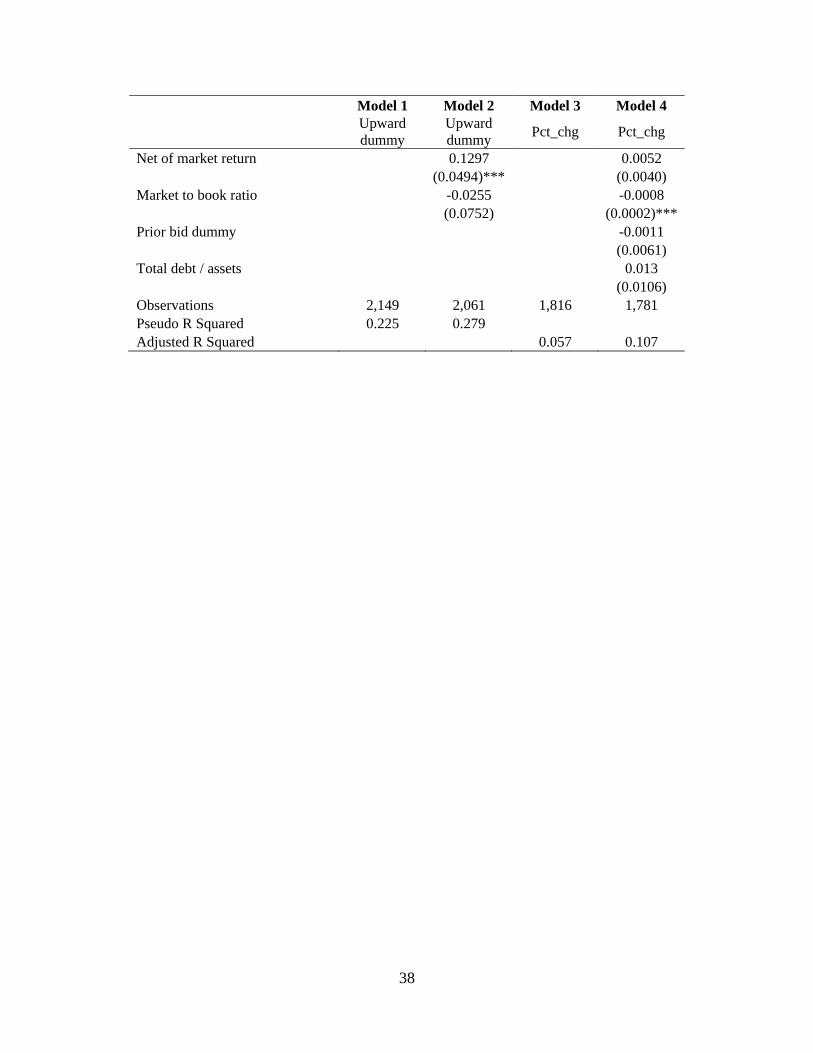
4.6. Go-shop provisions and upward price revisions
We next examine the association between go-shop provisions and the likelihood of an
upward price revision of the initial offer price. As reported in Table 8 Model 1, go-shop
provisions are positively and significantly associated with the likelihood of an upward revision.
Consistent with Gogineni and Puthenpurackal (2013), we find that deals where target
management are involved as a bidder are more likely to have the initial offer price upward
revised. In addition, hostile deals are more likely to have an upward offer price revision. In
Model 2, we include additional control variables and find that the go-shop coefficient is positive
but no longer significant.
16
In Models 3 and 4, the dependent variable is the percentage price change from the initial
price to final price. We find that go-shop provisions are positively and significantly associated
with percentage price changes. Overall, results from Table 8 are consistent with the shareholder
interest hypothesis in that go-shop provisions appear to result in a robust market check with more
frequent incidences of upward price revisions to the initial offer price and greater percentage
changes to the initial offer price.
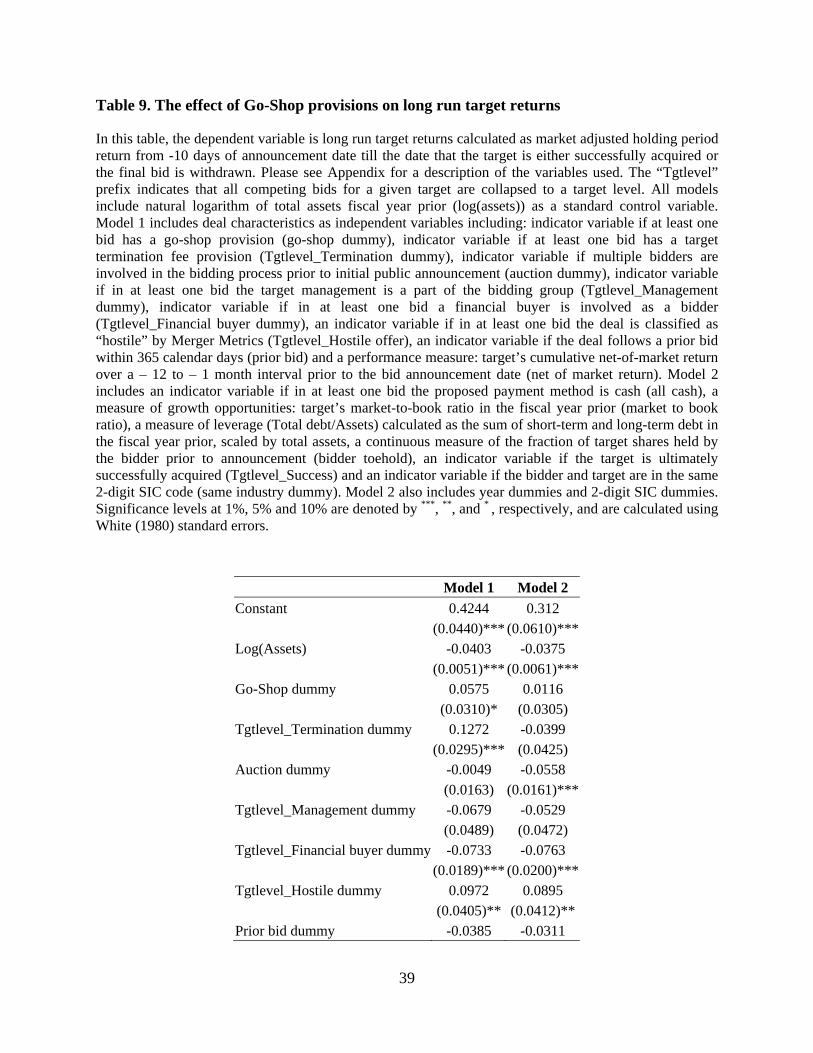
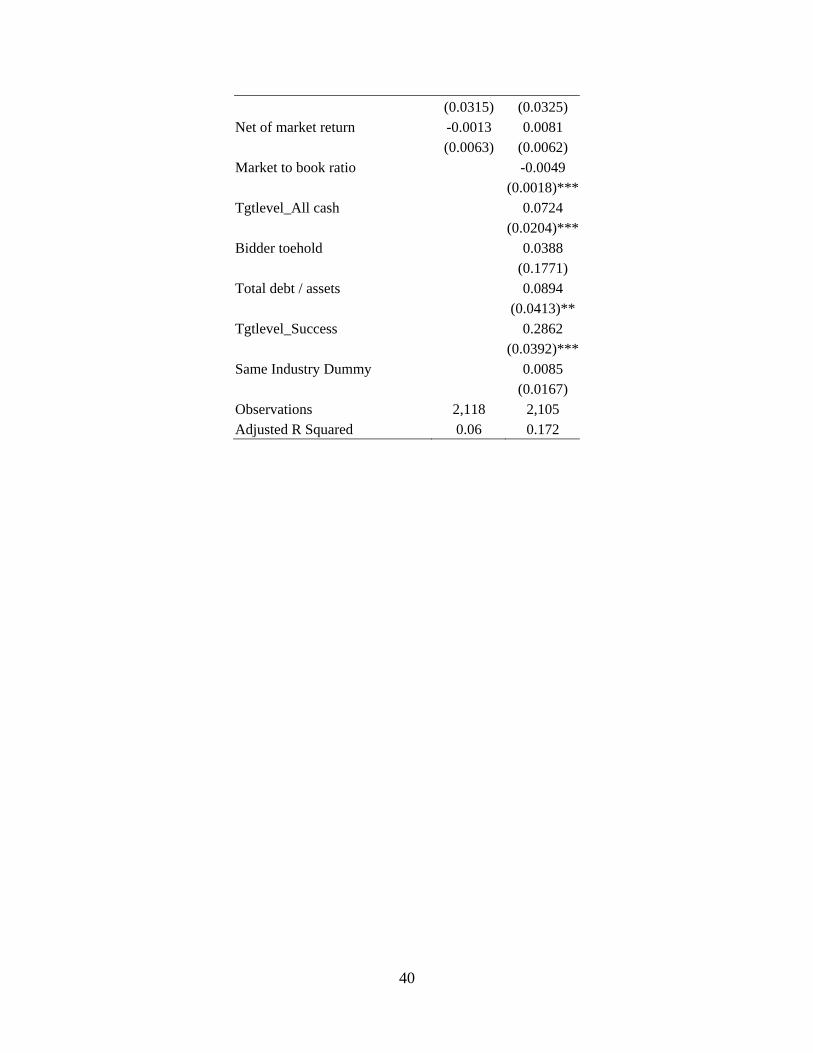
4.7. Go-shop provisions and long run target returns
Since there is a possibility of revisions to the initial offer price as well as uncertainty
about deal completion, we also compute long run target returns calculated as market adjusted
holding period return from -10 days of announcement date till the date that the target is either
successfully acquired or the final bid is withdrawn. We report regressions in Models 1 and 2 of
Table 9 with this long run target return measure as dependent variable. The coefficient of the Go-
shop dummy variable is positive in both models and significant in the first model. As expected,
target returns in completed deals are higher than that of withdrawn deals. Larger targets, deals
involving financial buyers and friendly deals are associated with lower target returns. Thus,
using both announcement period and long run target returns, we find a non-negative association
between go-shop provisions and target returns, consistent with the shareholder interest
hypothesis.
5. Conclusions
Go-shop provisions are a relatively recent feature in merger agreements which drastically
alter the bidding process by shifting the solicitation of bids to after a merger agreement is signed
with a particular bidder. Go-shop provisions thus represent a significant change in how fiduciary
17
duty is demonstrated by target boards and management. Using a comprehensive sample of 147
go-shop deals and a large sample of merger deals over the 2003 to 2012 period, we examine
whether go-shops are used to benefit target shareholders or for managerial agency cost reasons.
To determine support for either hypothesis, we examine the association of go-shop provisions
with the likelihood of competing bids, the likelihood of deal completion, upward revisions to the
initial offer price, announcement period target returns and long run target returns. We also study
the determinants of go-shop provisions.
We find that go-shop provisions are more likely in deals involving negotiation selling
method, financial buyers and all cash financing. Go-shop provisions are also associated with a
higher likelihood of a competing bid. Thus, go-shop provisions appear to demonstrate adequate
fiduciary duty by ensuring a robust market check: the active solicitation of new bids and the
tiered termination fee structure of go-shop deals appear to be effective in facilitating competing
bids. We find deals with go-shops are less likely to be completed, which is consistent with the
above result that go-shops are associated with a higher likelihood of a competing bid. Using
target level (not deal level) analysis however, we find that go-shop provisions are not
significantly related to the probability of completion. Thus, while a go-shop provision increases
the probability of a particular deal being jumped by another bid, it does not appear to affect the
probability of the target being ultimately taken over.
Further, using target level analysis, we find that there is a higher probability of an upward
revision of the initial offer price and greater percentage changes to the initial offer price when
go-shops deals are involved. Finally, we find that the incidence of go-shop provisions has a non-
negative association with both target announcement period returns and long run target returns.
Collectively, our findings suggest that the use of go-shop clauses in merger agreements is
18
consistent with target management and boards acting in the interests of target shareholders and
support our shareholder interest hypothesis.
19
References
Bargeron, L., F. Schlingemann, R. Stulz, and C. Zutter, 2008, “Why do private acquirers pay so little compared to public acquirers?”, Journal of Financial Economics, 89(3), 375-390.
Bates, T., and M. Lemmon, 2003, “Breaking up is hard to do? An analysis of termination fee
provisions and merger outcomes”, Journal of Financial Economics, 69, 469-504. Boone, A. L., and J. H. Mulherin, 2007a, “How are firms sold?”, Journal of Finance, 62, 847-
875. Boone, A. L., and J. H. Mulherin, 2007b, “Do termination provisions truncate the takeover
bidding process?”, Review of Financial Studies, 20(2), 461-489. Burch, T., 2001, “Locking out rival bidders: the use of lockup options in corporate mergers”,
Journal of Financial Economics 60, 103–142. Comment, R., and G.W. Schwert, 1995, “Poison or placebo? Evidence on the deterrence and
wealth effects of modern antitakeover measures”, Journal of Financial Economics 39, 3–43.
Gogineni, S., and J. Puthenpurackal, 2013, “Target management involved buyouts: Impact on
takeover competition, litigation risk and shareholder returns”, University of Wyoming/ University of Nevada-Las Vegas Working paper.
Hansen, R., 2001, “Auctions of companies”, Economic Inquiry, 39, 30–43. Officer, M., 2003, “Termination fees in mergers and acquisitions”, Journal of Financial
Economics, 69, 431-467. Officer. M., O. Ozbas and B. Sensoy, 2010, “Club deals in leveraged buyouts”, Journal of
Financial Economics, 98, 214-240. Povel, P., and R. Singh, 2006, “Takeover contests with asymmetric bidders”, Review of
Financial Studies, 19(4), 1399-1431. Sautter, C.M., 2008, “Shopping during extended store hours: From no shops to go-shops – The
development, effectiveness, and implications of go-shop provisions in change of control transactions”, Brooklyn Law Review, 73, p.525.
Schwert, G.W., 1996, “Markup pricing in mergers and acquisitions”, Journal of Financial
Economics, 41, 153-192. Schwert, G.W., 2000, “Hostility in takeovers: in the eyes of the beholder?”, Journal of Finance
55, 2599–2640.
20
Smith, C., and R. Watts, 1992, “The investment opportunity set and corporate financing, dividends, and compensation policies”, Journal of Financial Economics 32, 263–292.
Subramanium, G., 2008, “Go-shop provisions in private equity deals: Evidence and
Implications”, Business Lawyer 63, p.729.
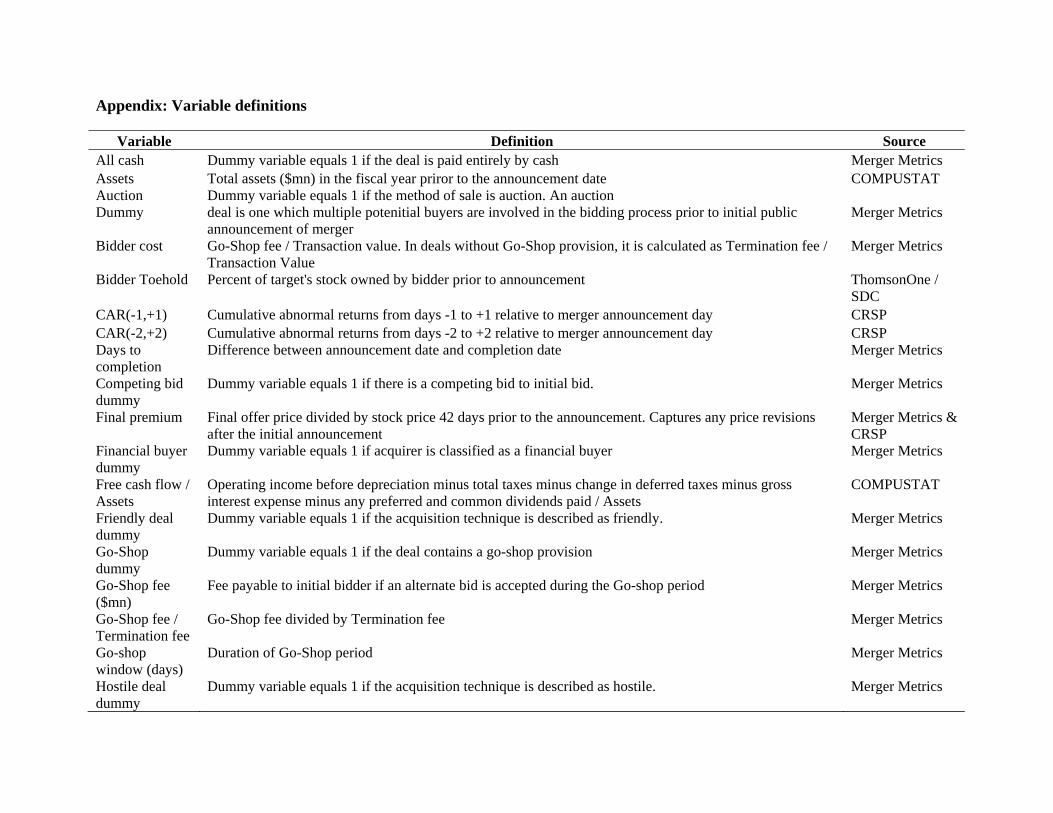
Appendix: Variable definitions
Variable Definition Source All cash Dummy variable equals 1 if the deal is paid entirely by cash Merger Metrics Assets Total assets ($mn) in the fiscal year priror to the announcement date COMPUSTAT Auction Dummy
Dummy variable equals 1 if the method of sale is auction. An auction deal is one which multiple potenitial buyers are involved in the bidding process prior to initial public announcement of merger
Merger Metrics
Bidder cost
Go-Shop fee / Transaction value. In deals without Go-Shop provision, it is calculated as Termination fee / Transaction Value
Merger Metrics
Bidder Toehold
Percent of target's stock owned by bidder prior to announcement
ThomsonOne / SDC
CAR(-1,+1) Cumulative abnormal returns from days -1 to +1 relative to merger announcement day CRSP CAR(-2,+2) Cumulative abnormal returns from days -2 to +2 relative to merger announcement day CRSP Days to completion
Difference between announcement date and completion date
Merger Metrics
Competing bid dummy
Dummy variable equals 1 if there is a competing bid to initial bid.
Merger Metrics
Final premium
Final offer price divided by stock price 42 days prior to the announcement. Captures any price revisions after the initial announcement
Merger Metrics & CRSP
Financial buyer dummy
Dummy variable equals 1 if acquirer is classified as a financial buyer
Merger Metrics
Free cash flow / Assets
Operating income before depreciation minus total taxes minus change in deferred taxes minus gross interest expense minus any preferred and common dividends paid / Assets
COMPUSTAT
Friendly deal dummy
Dummy variable equals 1 if the acquisition technique is described as friendly.
Merger Metrics
Go-Shop dummy
Dummy variable equals 1 if the deal contains a go-shop provision
Merger Metrics
Go-Shop fee ($mn)
Fee payable to initial bidder if an alternate bid is accepted during the Go-shop period
Merger Metrics
Go-Shop fee / Termination fee
Go-Shop fee divided by Termination fee
Merger Metrics
Go-shop window (days)
Duration of Go-Shop period
Merger Metrics
Hostile deal dummy
Dummy variable equals 1 if the acquisition technique is described as hostile.
Merger Metrics
22
Variable Definition Source
Initial premium Initial offer price divided by stock price 42 days prior to the announcement Merger Metrics & CRSP
Insider pct
Fractional ownership of the target firm’s officers and directors in the calendar year prior to the acquisition bid
Thomson Reuters
Management dummy
Dummy variable equals 1 if target management are involved in the bidding process
Merger Metrics
Market to book ratio
Total assets minus book equity plus market equity divided by total assets
CRSP & COMPUSTAT
Market value of equity
Market value of equity 42 days prior to the announcement date
CRSP
Matching offer period (days)
Time given to initial bidder to match any competing offer
Merger Metrics
Net of market return
Difference between the buy-and-hold return of the target and that of the value weighted NYSE/AMEX/NASDAQ CRSP index over the months -12 to -1 relative to the announcement month of the acquisition
CRSP
PE dummy Dummy variable equals 1 if private equity firm(s) are involved in the bidding process Merger Metrics Prior bid dummy
Dummy variable equals 1 if there were any bids within the past 365 days relative to public announcement date
Merger Metrics
Same Industry Dummy variable equals 1 if the bidder and target are in the same 2-digit SIC code COMPUSTAT dummy Success dummy Dummy variable equals 1 if the deal is completed Merger Metrics Termination fee Dummy variable equals 1 if the deal has a target termination fee provision Merger Metrics dummy Total debt / assets
Sum of long-term and short-term debt divided by total assets
COMPUSTAT
Transaction value
Deal value in millions
Merger Metrics
Upward dummy Dummy variable equals 1 if there were any upward revisions to initial offer price Merger Metrics
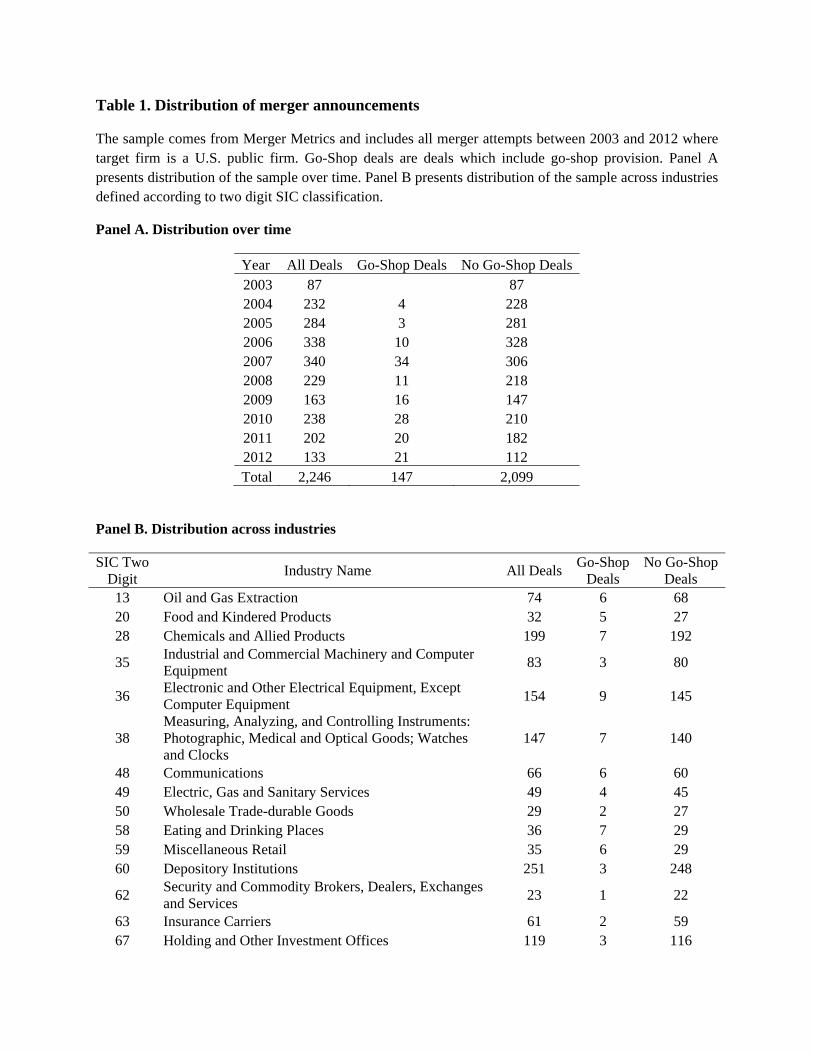
Table 1. Distribution of merger announcements
The sample comes from Merger Metrics and includes all merger attempts between 2003 and 2012 where target firm is a U.S. public firm. Go-Shop deals are deals which include go-shop provision. Panel A presents distribution of the sample over time. Panel B presents distribution of the sample across industries defined according to two digit SIC classification.
Panel A. Distribution over time
Year All Deals Go-Shop Deals No Go-Shop Deals 2003 87 87 2004 232 4 228 2005 284 3 281 2006 338 10 328 2007 340 34 306 2008 229 11 218 2009 163 16 147 2010 238 28 210 2011 202 20 182 2012 133 21 112 Total 2,246 147 2,099
Panel B. Distribution across industries
SIC Two Digit
Industry Name All DealsGo-Shop
Deals No Go-Shop
Deals 13 Oil and Gas Extraction 74 6 68 20 Food and Kindered Products 32 5 27 28 Chemicals and Allied Products 199 7 192
35 Industrial and Commercial Machinery and Computer Equipment
83 3 80
36 Electronic and Other Electrical Equipment, Except Computer Equipment
154 9 145
38 Measuring, Analyzing, and Controlling Instruments: Photographic, Medical and Optical Goods; Watches and Clocks
147 7 140
48 Communications 66 6 60 49 Electric, Gas and Sanitary Services 49 4 45 50 Wholesale Trade-durable Goods 29 2 27 58 Eating and Drinking Places 36 7 29 59 Miscellaneous Retail 35 6 29 60 Depository Institutions 251 3 248
62 Security and Commodity Brokers, Dealers, Exchanges and Services
23 1 22
63 Insurance Carriers 61 2 59 67 Holding and Other Investment Offices 119 3 116
24
70 Hotels, Rooming Houses, Camps and Other Lodging Places
26 2 24
73 Business Services 404 29 375 80 Health Services 60 13 47
87 Engineering, Accounting, Research, Management and Related Services
43 3 40
NA Other 355 29 326
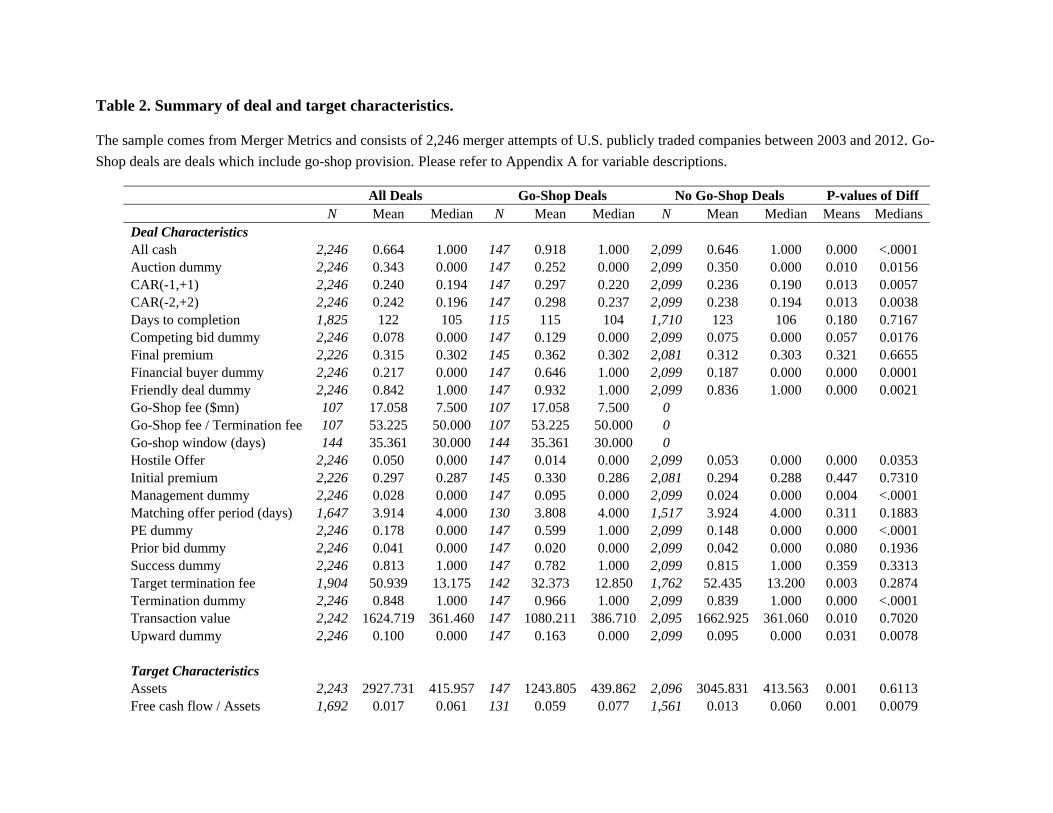
Table 2. Summary of deal and target characteristics.
The sample comes from Merger Metrics and consists of 2,246 merger attempts of U.S. publicly traded companies between 2003 and 2012. Go-
Shop deals are deals which include go-shop provision. Please refer to Appendix A for variable descriptions.
All Deals Go-Shop Deals No Go-Shop Deals P-values of Diff N Mean Median N Mean Median N Mean Median Means Medians Deal Characteristics All cash 2,246 0.664 1.000 147 0.918 1.000 2,099 0.646 1.000 0.000 <.0001 Auction dummy 2,246 0.343 0.000 147 0.252 0.000 2,099 0.350 0.000 0.010 0.0156 CAR(-1,+1) 2,246 0.240 0.194 147 0.297 0.220 2,099 0.236 0.190 0.013 0.0057 CAR(-2,+2) 2,246 0.242 0.196 147 0.298 0.237 2,099 0.238 0.194 0.013 0.0038 Days to completion 1,825 122 105 115 115 104 1,710 123 106 0.180 0.7167 Competing bid dummy 2,246 0.078 0.000 147 0.129 0.000 2,099 0.075 0.000 0.057 0.0176 Final premium 2,226 0.315 0.302 145 0.362 0.302 2,081 0.312 0.303 0.321 0.6655 Financial buyer dummy 2,246 0.217 0.000 147 0.646 1.000 2,099 0.187 0.000 0.000 0.0001 Friendly deal dummy 2,246 0.842 1.000 147 0.932 1.000 2,099 0.836 1.000 0.000 0.0021 Go-Shop fee ($mn) 107 17.058 7.500 107 17.058 7.500 0 Go-Shop fee / Termination fee 107 53.225 50.000 107 53.225 50.000 0 Go-shop window (days) 144 35.361 30.000 144 35.361 30.000 0 Hostile Offer 2,246 0.050 0.000 147 0.014 0.000 2,099 0.053 0.000 0.000 0.0353 Initial premium 2,226 0.297 0.287 145 0.330 0.286 2,081 0.294 0.288 0.447 0.7310 Management dummy 2,246 0.028 0.000 147 0.095 0.000 2,099 0.024 0.000 0.004 <.0001 Matching offer period (days) 1,647 3.914 4.000 130 3.808 4.000 1,517 3.924 4.000 0.311 0.1883 PE dummy 2,246 0.178 0.000 147 0.599 1.000 2,099 0.148 0.000 0.000 <.0001 Prior bid dummy 2,246 0.041 0.000 147 0.020 0.000 2,099 0.042 0.000 0.080 0.1936 Success dummy 2,246 0.813 1.000 147 0.782 1.000 2,099 0.815 1.000 0.359 0.3313 Target termination fee 1,904 50.939 13.175 142 32.373 12.850 1,762 52.435 13.200 0.003 0.2874 Termination dummy 2,246 0.848 1.000 147 0.966 1.000 2,099 0.839 1.000 0.000 <.0001 Transaction value 2,242 1624.719 361.460 147 1080.211 386.710 2,095 1662.925 361.060 0.010 0.7020 Upward dummy 2,246 0.100 0.000 147 0.163 0.000 2,099 0.095 0.000 0.031 0.0078
Target Characteristics Assets 2,243 2927.731 415.957 147 1243.805 439.862 2,096 3045.831 413.563 0.001 0.6113 Free cash flow / Assets 1,692 0.017 0.061 131 0.059 0.077 1,561 0.013 0.060 0.001 0.0079
26
All Deals Go-Shop Deals No Go-Shop Deals P-values of Diff N Mean Median N Mean Median N Mean Median Means Medians Net of market return 2,214 0.044 -0.058 147 0.100 -0.101 2,067 0.040 -0.055 0.712 0.1212 Market value of equity 2,245 1276.323 269.611 146 864.694 337.293 2,099 1304.955 267.373 0.011 0.9386 Market to book ratio 2,242 1.762 1.305 146 1.414 1.331 2,096 1.786 1.303 0.000 0.0925 Total debt / assets 2,231 0.208 0.137 146 0.216 0.168 2,085 0.208 0.136 0.662 0.3552
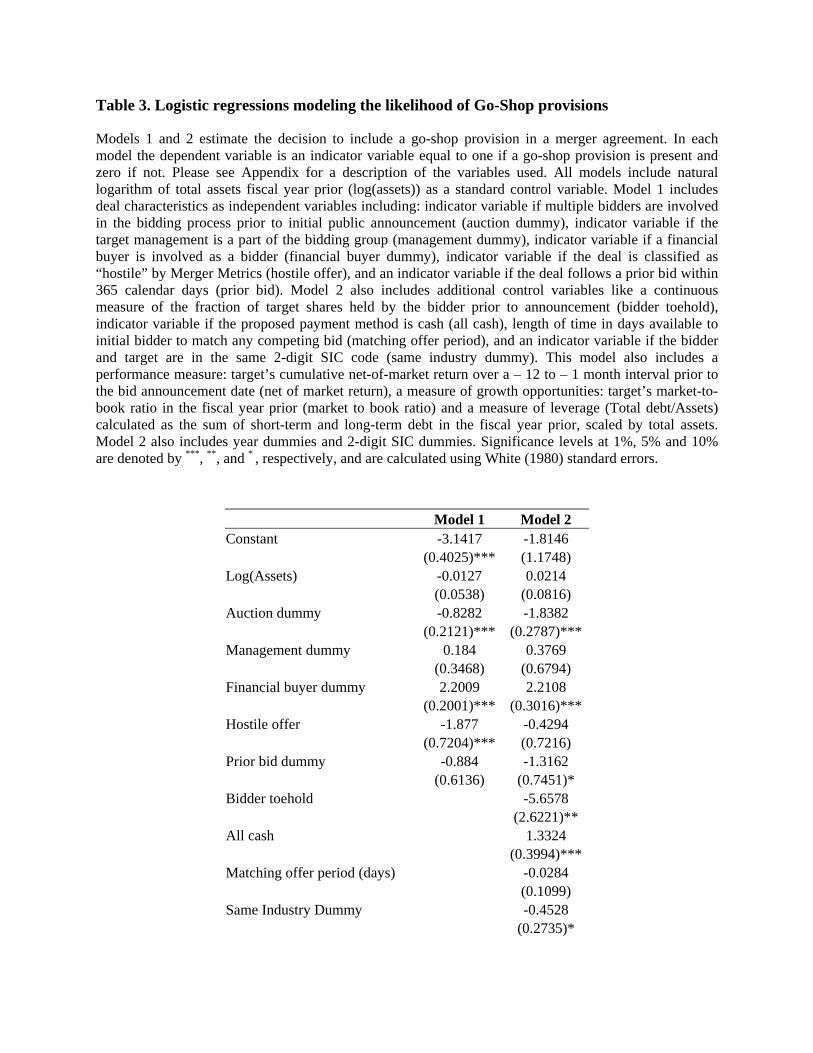
Table 3. Logistic regressions modeling the likelihood of Go-Shop provisions
Models 1 and 2 estimate the decision to include a go-shop provision in a merger agreement. In each model the dependent variable is an indicator variable equal to one if a go-shop provision is present and zero if not. Please see Appendix for a description of the variables used. All models include natural logarithm of total assets fiscal year prior (log(assets)) as a standard control variable. Model 1 includes deal characteristics as independent variables including: indicator variable if multiple bidders are involved in the bidding process prior to initial public announcement (auction dummy), indicator variable if the target management is a part of the bidding group (management dummy), indicator variable if a financial buyer is involved as a bidder (financial buyer dummy), indicator variable if the deal is classified as “hostile” by Merger Metrics (hostile offer), and an indicator variable if the deal follows a prior bid within 365 calendar days (prior bid). Model 2 also includes additional control variables like a continuous measure of the fraction of target shares held by the bidder prior to announcement (bidder toehold), indicator variable if the proposed payment method is cash (all cash), length of time in days available to initial bidder to match any competing bid (matching offer period), and an indicator variable if the bidder and target are in the same 2-digit SIC code (same industry dummy). This model also includes a performance measure: target’s cumulative net-of-market return over a – 12 to – 1 month interval prior to the bid announcement date (net of market return), a measure of growth opportunities: target’s market-to-book ratio in the fiscal year prior (market to book ratio) and a measure of leverage (Total debt/Assets) calculated as the sum of short-term and long-term debt in the fiscal year prior, scaled by total assets. Model 2 also includes year dummies and 2-digit SIC dummies. Significance levels at 1%, 5% and 10% are denoted by ***, **, and * , respectively, and are calculated using White (1980) standard errors.
Model 1 Model 2 Constant -3.1417 -1.8146
(0.4025)*** (1.1748) Log(Assets) -0.0127 0.0214
(0.0538) (0.0816) Auction dummy -0.8282 -1.8382
(0.2121)*** (0.2787)*** Management dummy 0.184 0.3769
(0.3468) (0.6794) Financial buyer dummy 2.2009 2.2108
(0.2001)*** (0.3016)*** Hostile offer -1.877 -0.4294
(0.7204)*** (0.7216) Prior bid dummy -0.884 -1.3162
(0.6136) (0.7451)* Bidder toehold -5.6578
(2.6221)** All cash 1.3324
(0.3994)*** Matching offer period (days) -0.0284
(0.1099) Same Industry Dummy -0.4528
(0.2735)*
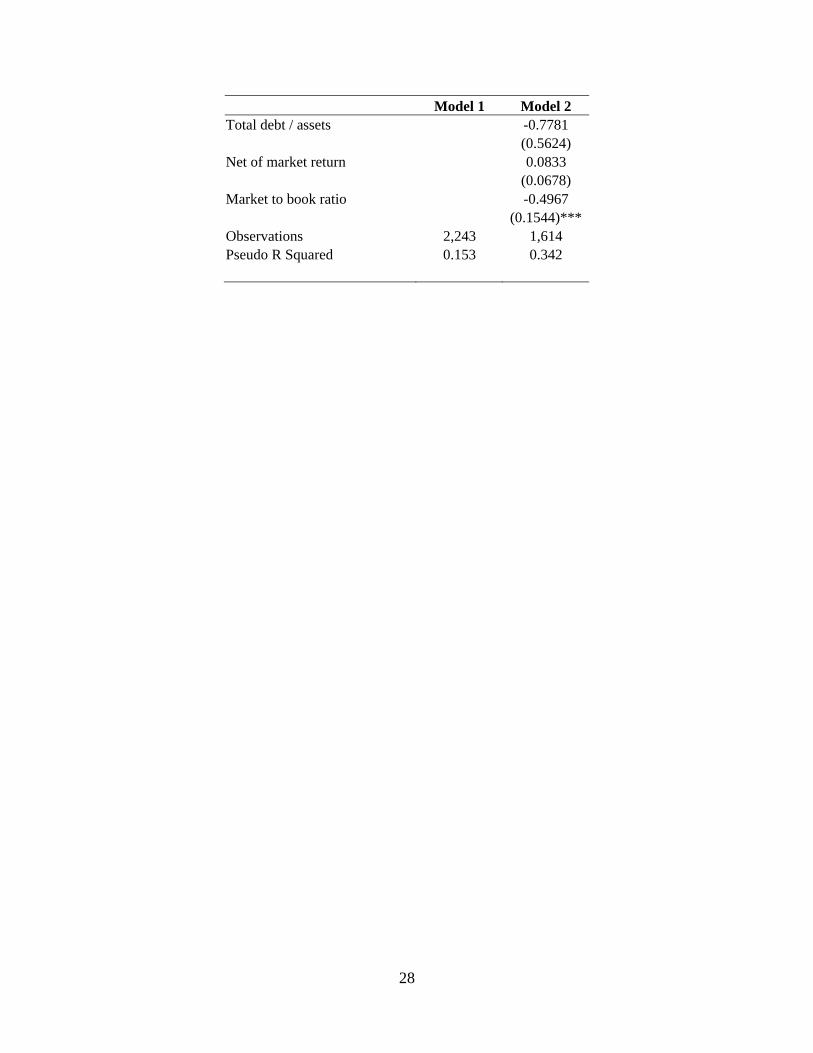
28
Model 1 Model 2 Total debt / assets -0.7781
(0.5624) Net of market return 0.0833
(0.0678) Market to book ratio -0.4967
(0.1544)*** Observations 2,243 1,614 Pseudo R Squared 0.153 0.342
29
Table 4. Logistic regressions modeling the likelihood of competing bids
Models 1 and 2 estimate the probability of the occurrence of a competing bid after the announcement of initial bid. In each model, the dependent variable is an indicator variable equal to one if a competing bid is received and zero if not. Please see Appendix for a description of the variables used. All models include natural logarithm of total assets fiscal year prior (log(assets)) as a standard control variable. Model 1 includes deal characteristics as independent variables including: indicator variable if the deal has a go-shop provision (go-shop dummy), indicator variable if the deal has a target termination fee provision (Termination dummy), indicator variable if multiple bidders are involved in the bidding process prior to initial public announcement (auction dummy), indicator variable if the target management is a part of the bidding group (management dummy), indicator variable if a financial buyer is involved as a bidder (financial buyer dummy), an interaction term of go-shop indicator and financial buyer indicator (Finbuyer X Go Shop), indicator variable if the deal is classified as “hostile” by Merger Metrics (hostile offer), and an indicator variable if the deal follows a prior bid within 365 calendar days (prior bid). Model 2 also includes additional control variables like a continuous measure of the fraction of target shares held by the bidder prior to announcement (bidder toehold), a measure of the cost of terminating the deal (bidder cost) defined as the go-shop fee divided by transaction value for deals with go-shop and termination fee divided by transaction value for deals without go-shop provision, and an indicator variable if the proposed payment method is cash (all cash). This model also includes a performance measure: target’s cumulative net-of-market return over a – 12 to – 1 month interval prior to the bid announcement date (net of market return), a measure of growth opportunities: target’s market-to-book ratio in the fiscal year prior (market to book ratio) and a measure of leverage (Total debt/Assets) calculated as the sum of short-term and long-term debt in the fiscal year prior, scaled by total assets. Model 2 also includes year dummies and 2-digit SIC dummies. Significance levels at 1%, 5% and 10% are denoted by ***, **, and * , respectively, and are calculated using White (1980) standard errors.
Model 1 Model 2
Constant -2.4214 -3.5944 (0.3538)*** (0.8399)***
Log(Assets) 0.0879 0.1472 (0.0437)** (0.0669)**
Go-Shop dummy 1.0104 1.1039 (0.4390)** (0.4980)**
Termination dummy -0.7878 - (0.2285)***
Auction dummy -0.7622 -0.8357 (0.2128)*** (0.2603)***
Management dummy -0.9166 0.2592 (0.5274)* (0.5655)
Financial buyer dummy 0.9811 1.5214 (0.2048)*** (0.2987)***
30
Finbuyer X Go Shop -1.0323 -1.684 (0.5612)* (0.6256)***
Hostile offer -0.2776 -0.3407 (0.3468) (0.8578)
Prior bid dummy -0.9321 -0.3739 (0.6207) (0.5704)
Bidder Cost 3.8691 (5.9492)
Bidder toehold -1.5598 (2.3154)
All cash -0.0449 (0.2676)
Net of market return 0.257 (0.0928)***
Market to book ratio 0.0056 (0.0177)
Total debt / assets -0.191 (0.4353)
Observations 2,243 1,836 Pseudo R Squared 0.064 0.119
31
Table 5. Logistic regressions modeling the probability of completing a proposed merger transaction using deal level analysis
Models 1 and 2 estimate the probability that a proposed deal in the sample will be completed. In each model, the dependent variable is an indicator variable equal to one if the proposed deal is completed and zero if not. Please see Appendix for a description of the variables used. All models include natural logarithm of total assets fiscal year prior (log(assets)) as a standard control variable. Model 1 includes deal characteristics as independent variables including: indicator variable if the deal has a go-shop provision (go-shop dummy), indicator variable if the deal has a target termination fee provision (Termination dummy), indicator variable if multiple bidders are involved in the bidding process prior to initial public announcement (auction dummy), indicator variable if the target management is a part of the bidding group (management dummy), indicator variable if a financial buyer is involved as a bidder (financial buyer dummy), indicator variable if the deal is classified as “hostile” by Merger Metrics (hostile offer), and an indicator variable if the deal follows a prior bid within 365 calendar days (prior bid). Model 2 also includes additional control variables like a continuous measure of the fraction of target shares held by the bidder prior to announcement (bidder toehold), an indicator variable if the proposed payment method is cash (all cash) and an indicator variable if the bidder and target are in the same 2-digit SIC code (same industry dummy). This model also includes a performance measure: target’s cumulative net-of-market return over a – 12 to – 1 month interval prior to the bid announcement date (net of market return), a measure of growth opportunities: target’s market-to-book ratio in the fiscal year prior (market to book ratio) and a measure of leverage (Total debt/Assets) calculated as the sum of short-term and long-term debt in the fiscal year prior, scaled by total assets. Model 2 also includes year dummies and 2-digit SIC dummies. Significance levels at 1%, 5% and 10% are denoted by ***, **, and * , respectively, and are calculated using White (1980) standard errors.
Model 1 Model 2 Constant -1.2892 -2.5309
(0.3264)*** (0.7717)***Log(Assets) 0.0079 0.0178
(0.0498) (0.0584) Go-Shop dummy -0.8391 -0.7914
(0.2862)*** (0.2982)***Termination dummy 4.0613 4.2833
(0.1987)*** (0.2254)***Auction dummy 0.4986 0.4284
(0.2112)** (0.2250)* Hostile offer -0.5825 -0.5934
(0.2689)** (0.3066)* Management dummy -0.0942 -0.4812
(0.4224) (0.4048) Financial buyer dummy -0.8862 -0.9702
(0.1904)*** (0.2284)***Prior bid dummy -0.9709 -0.9051
(0.3207)*** (0.3477)***All cash 0.5367
(0.2177)**
32
Bidder toehold 4.3118 (1.6075)***
Net of market return -0.1376 (0.0443)***
Total debt / assets -0.3708 (0.3672)
Market to book ratio 0.2629 (0.0862)***
Same Industry Dummy 0.1132 (0.1906)
Observations 2,243 2,198 Pseudo R Squared 0.447 0.475
33
Table 6. Logistic regressions modeling the probability of completing a proposed merger transaction using firm level analysis.
The analysis in Table 6 is performed at a target firm level, different from that reported in Table 5 where the analysis is done at a deal level. Models 1 and 2 estimate the probability that a given target is ultimately acquired by any one bidder. In each model, the dependent variable is an indicator variable equal to one if a given target is acquired by any one bidder and zero otherwise. Please see Appendix for a description of the variables used. The “Tgtlevel” prefix indicates that all competing bids for a given target are collapsed to a target level. All models include natural logarithm of total assets fiscal year prior (log(assets)) as a standard control variable. Model 1 includes deal characteristics as independent variables including: indicator variable if at least one bid has a go-shop provision (go-shop dummy), indicator variable if at least one bid has a target termination fee provision (Tgtlevel_Termination dummy), indicator variable if multiple bidders are involved in the bidding process prior to initial public announcement (auction dummy), indicator variable if in at least one bid the target management is a part of the bidding group (Tgtlevel_Management dummy), indicator variable if in at least one bid a financial buyer is involved as a bidder (Tgtlevel_Financial buyer dummy), indicator variable if in at least one bid the deal is classified as “hostile” by Merger Metrics (Tgtlevel_Hostile offer), and an indicator variable if the deal follows a prior bid within 365 calendar days (prior bid). Model 2 also includes an indicator variable if in at least one bid the proposed payment method is cash (all cash). This model also includes a performance measure: target’s cumulative net-of-market return over a – 12 to – 1 month interval prior to the bid announcement date (net of market return), a measure of growth opportunities: target’s market-to-book ratio in the fiscal year prior (market to book ratio) and a measure of leverage (Total debt/Assets) calculated as the sum of short-term and long-term debt in the fiscal year prior, scaled by total assets. Model 2 also includes year dummies and 2-digit SIC dummies. Significance levels at 1%, 5% and 10% are denoted by ***, **, and * , respectively, and are calculated using White (1980) standard errors.
Model 1 Model 2 Constant -1.183 -2.3981
(0.3647)*** (0.8408)*** Log(Assets) 0.0252 0.0503
(0.0560) (0.0664) Go-Shop dummy -0.3046 -0.2923
(0.3870) (0.3932) Tgtlevel_Termination dummy 4.1241 4.2125
(0.2091)*** (0.2428)*** Auction dummy 0.6627 0.6305
(0.2526)*** (0.2621)** Tgtlevel_Hostile dummy -0.7962 -0.8303
(0.2874)*** (0.3356)** Tgtlevel_Management dummy 0.1042 0.07
(0.4463) (0.4737) Tgtlevel_Financial buyer dummy -0.9058 -0.882
(0.2112)*** (0.2304)*** Prior bid dummy -1.0866 -0.9988
(0.3507)*** (0.3695)*** Tgtlevel_All cash 0.3363
(0.2446) Net of market return -0.1477
(0.0488)***
34
Total debt / assets -0.5334 (0.4329)
Market to book ratio 0.4907 (0.1265)***
Observations 2,149 2,106 Pseudo R Squared 0.478 0.509
35
Table 7. The effect of Go-Shop provisions on announcement period abnormal returns
Models 1 and 2 present OLS regressions of 3-day announcement period abnormal returns calculated as cumulative abnormal returns from days – 1 to + 1 with day 0 being the announcement date. We estimate market model parameters using CRSP value-weighted index as the market proxy, for each target firm using daily returns from day -379 to day -127 relative to the deal announcement date. Please see Appendix for a description of the variables used. All models include natural logarithm of total assets fiscal year prior (log(assets)) as a standard control variable. Model 1 includes deal characteristics as independent variables including: indicator variable if the deal has a go-shop provision (go-shop dummy), indicator variable if the deal has a target termination fee provision (Termination dummy), indicator variable if multiple bidders are involved in the bidding process prior to initial public announcement (auction dummy), indicator variable if the target management is a part of the bidding group (management dummy), indicator variable if a financial buyer is involved as a bidder (financial buyer dummy), indicator variable if the deal is classified as “hostile” by Merger Metrics (hostile offer), indicator variable if the deal follows a prior bid within 365 calendar days (prior bid), and a performance measure: target’s cumulative net-of-market return over a – 12 to – 1 month interval prior to the bid announcement date (net of market return). Model 2 also includes additional control variables like a continuous measure of the fraction of target shares held by the bidder prior to announcement (bidder toehold) and an indicator variable if the proposed payment method is cash (all cash), a measure of growth opportunities: target’s market-to-book ratio in the fiscal year prior (market to book ratio), a measure of leverage (Total debt/Assets) calculated as the sum of short-term and long-term debt in the fiscal year prior, scaled by total assets. Model 2 also includes an indicator variable if the deal is subsequently completed (success dummy), an indicator variable if the bidder and target are in the same 2-digit SIC code (same industry dummy), year dummies and 2-digit SIC dummies. Significance levels at 1%, 5% and 10% are denoted by ***, **, and * , respectively, and are calculated using White (1980) standard errors.
Model 1 Model 2 Constant 0.3508 0.2279
(0.0258)*** (0.0392)***Log(Assets) -0.0275 -0.0222
(0.0034)*** (0.0041)***Go-Shop dummy 0.0786 0.0381
(0.0242)*** (0.0250) Termination dummy 0.082 0.0695
(0.0166)*** (0.0230)***Auction dummy -0.0187 -0.0501
(0.0117) (0.0121)***Management dummy 0.0214 0.0238
(0.0317) (0.0311) Financial buyer dummy -0.066 -0.0809
(0.0122)*** (0.0136)***Hostile offer 0.088 0.0598
(0.0207)*** (0.0207)***Prior bid dummy -0.0443 -0.0588
(0.0233)* (0.0225)***
36
Model 1 Model 2 Net of market return -0.0281 -0.0267
(0.0092)*** (0.0087)***Market to book ratio -0.0015
(0.0008)* All cash 0.0897
(0.0120)***Bidder toehold 0.0901
(0.1209) Total debt / assets 0.0375
(0.0385) Success dummy 0.0456
(0.0191)** Same Industry Dummy 0.0156
(0.0111) Observations 2,211 2,198 Adjusted R Squared 0.074 0.159
37
Table 8. The effect of Go-Shop provisions on upward revisions to initial offer price
Models 1 and 2 estimate the probability that the initial offer price will be upward revised. In these models, the dependent variable is an indicator variable (Upward dummy) equal to one if the initial offer price is upward revised and zero otherwise. In models 3 and 4, the dependent variable is the percentage price change (Pct_chg) from the initial offer price to the final offer price. Please see Appendix for a description of the variables used. The “Tgtlevel” prefix indicates that all competing bids for a given target are collapsed to a target level. All models include natural logarithm of total assets fiscal year prior (log(assets)) as a standard control variable. Models 1 and 3 include deal characteristics as independent variables including: indicator variable if at least one bid has a go-shop provision (go-shop dummy), indicator variable if at least one bid has a target termination fee provision (Tgtlevel_Termination dummy), indicator variable if multiple bidders are involved in the bidding process prior to initial public announcement (auction dummy), indicator variable if in at least one bid the target management is a part of the bidding group (Tgtlevel_Management dummy), indicator variable if in at least one bid a financial buyer is involved as a bidder (Tgtlevel_Financial buyer dummy), and an indicator variable if in at least one bid the deal is classified as “hostile” by Merger Metrics (Tgtlevel_Hostile offer). Models 2 and 4 also include an indicator variable if in at least one bid the proposed payment method is cash (all cash) and an indicator variable if the deal follows a prior bid within 365 calendar days (prior bid). These models also includes a performance measure: target’s cumulative net-of-market return over a – 12 to – 1 month interval prior to the bid announcement date (net of market return), a measure of growth opportunities: target’s market-to-book ratio in the fiscal year prior (market to book ratio) and a measure of leverage (Total debt/Assets) calculated as the sum of short-term and long-term debt in the fiscal year prior, scaled by total assets. Model 2 and 4 also include year dummies and 2-digit SIC dummies. Significance levels at 1%, 5% and 10% are denoted by ***, **, and * , respectively, and are calculated using White (1980) standard errors.
Model 1 Model 2 Model 3 Model 4
Upward dummy
Upward dummy
Pct_chg Pct_chg
Constant -3.1705 -3.9464 0.0759 0.0701 (0.4433)*** (0.6940)*** (0.0493) (0.0417)*
Log(Assets) -0.0416 0.0084 0.0028 0.0034 (0.0527) (0.0572) (0.0044) (0.0046)
Go-Shop dummy 0.5744 0.3979 0.0218 0.0217 (0.3065)* (0.3233) (0.0109)** (0.0113)*
Tgtlevel_Termination dummy 0.3903 0.3535 -0.0908 -0.0967 (0.3345) (0.3495) (0.0760) (0.0729)
Auction dummy -0.2133 -0.1655 0.0096 0.0132 (0.2038) (0.2213) (0.0094) (0.0106)
Tgtlevel_Management dummy 1.7148 1.4836 0.0352 0.0332 (0.3498)*** (0.3696)*** (0.0212)* (0.0199)*
Tgtlevel_Financial buyer dummy 0.7581 0.5444 0.0113 0.013 (0.2414)*** (0.2521)** (0.0071) (0.0067)*
Tgtlevel_Hostile dummy 3.8205 3.7106 0.1483 0.1414 (0.3373)*** (0.3594)*** (0.0373)*** (0.0377)***
Tgtlevel_All cash 0.4654 -0.0054 (0.2545)* (0.0048)
38
Model 1 Model 2 Model 3 Model 4
Upward dummy
Upward dummy
Pct_chg Pct_chg
Net of market return 0.1297 0.0052 (0.0494)*** (0.0040)
Market to book ratio -0.0255 -0.0008 (0.0752) (0.0002)***
Prior bid dummy -0.0011 (0.0061)
Total debt / assets 0.013 (0.0106)
Observations 2,149 2,061 1,816 1,781 Pseudo R Squared 0.225 0.279 Adjusted R Squared 0.057 0.107
39
Table 9. The effect of Go-Shop provisions on long run target returns
In this table, the dependent variable is long run target returns calculated as market adjusted holding period return from -10 days of announcement date till the date that the target is either successfully acquired or the final bid is withdrawn. Please see Appendix for a description of the variables used. The “Tgtlevel” prefix indicates that all competing bids for a given target are collapsed to a target level. All models include natural logarithm of total assets fiscal year prior (log(assets)) as a standard control variable. Model 1 includes deal characteristics as independent variables including: indicator variable if at least one bid has a go-shop provision (go-shop dummy), indicator variable if at least one bid has a target termination fee provision (Tgtlevel_Termination dummy), indicator variable if multiple bidders are involved in the bidding process prior to initial public announcement (auction dummy), indicator variable if in at least one bid the target management is a part of the bidding group (Tgtlevel_Management dummy), indicator variable if in at least one bid a financial buyer is involved as a bidder (Tgtlevel_Financial buyer dummy), an indicator variable if in at least one bid the deal is classified as “hostile” by Merger Metrics (Tgtlevel_Hostile offer), an indicator variable if the deal follows a prior bid within 365 calendar days (prior bid) and a performance measure: target’s cumulative net-of-market return over a – 12 to – 1 month interval prior to the bid announcement date (net of market return). Model 2 includes an indicator variable if in at least one bid the proposed payment method is cash (all cash), a measure of growth opportunities: target’s market-to-book ratio in the fiscal year prior (market to book ratio), a measure of leverage (Total debt/Assets) calculated as the sum of short-term and long-term debt in the fiscal year prior, scaled by total assets, a continuous measure of the fraction of target shares held by the bidder prior to announcement (bidder toehold), an indicator variable if the target is ultimately successfully acquired (Tgtlevel_Success) and an indicator variable if the bidder and target are in the same 2-digit SIC code (same industry dummy). Model 2 also includes year dummies and 2-digit SIC dummies. Significance levels at 1%, 5% and 10% are denoted by ***, **, and * , respectively, and are calculated using White (1980) standard errors.
Model 1 Model 2
Constant 0.4244 0.312 (0.0440)*** (0.0610)***
Log(Assets) -0.0403 -0.0375 (0.0051)*** (0.0061)***
Go-Shop dummy 0.0575 0.0116 (0.0310)* (0.0305)
Tgtlevel_Termination dummy 0.1272 -0.0399 (0.0295)*** (0.0425)
Auction dummy -0.0049 -0.0558 (0.0163) (0.0161)***
Tgtlevel_Management dummy -0.0679 -0.0529 (0.0489) (0.0472)
Tgtlevel_Financial buyer dummy -0.0733 -0.0763 (0.0189)*** (0.0200)***
Tgtlevel_Hostile dummy 0.0972 0.0895 (0.0405)** (0.0412)**
Prior bid dummy -0.0385 -0.0311
40
(0.0315) (0.0325) Net of market return -0.0013 0.0081
(0.0063) (0.0062) Market to book ratio -0.0049
(0.0018)*** Tgtlevel_All cash 0.0724
(0.0204)*** Bidder toehold 0.0388
(0.1771) Total debt / assets 0.0894
(0.0413)** Tgtlevel_Success 0.2862
(0.0392)*** Same Industry Dummy 0.0085
(0.0167) Observations 2,118 2,105 Adjusted R Squared 0.06 0.172