Embed Size (px)
Citation preview
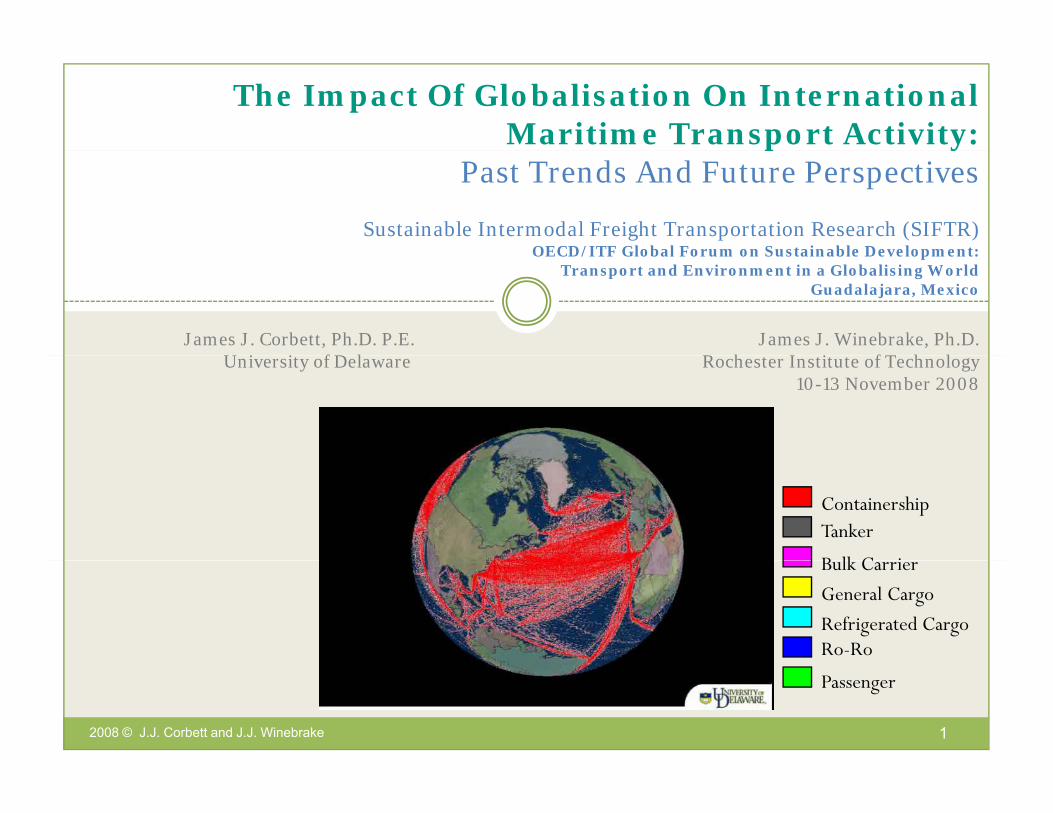
The Impact Of Globalisation On International Maritime Transport Activity: p y
Past Trends And Future Perspectives
Sustainable Intermodal Freight Transportation Research (SIFTR)OECD/ITF Global Forum on Sustainable Development: OECD/ITF Global Forum on Sustainable Development:
Transport and Environment in a Globalising WorldGuadalajara, Mexico
James J. Corbett, Ph.D. P.E. James J. Winebrake, Ph.D.U i i f D l R h I i f T h lUniversity of Delaware Rochester Institute of Technology
10-13 November 2008
ContainershipTanker
B lk C iBulk Carrier
General Cargo
Refrigerated CargoRo-Ro
Passenger
2008 © J.J. Corbett and J.J. Winebrake 1

Overview of Paper and Presentation
Maritime shipping and multimodal goods movementpp g g
Global economic growth coupled with shipping, trade
Maritime technology responds to globalization signals
Maritime energy use and environmental impactsEnergy and power trendsCharacterizing fleets using activity-based data vs. statisticsT f iti hi i i t l i tTaxonomy of maritime shipping environmental impacts
Sustainable intermodal freight transport and shipping
2008 © J.J. Corbett and J.J. Winebrake 2
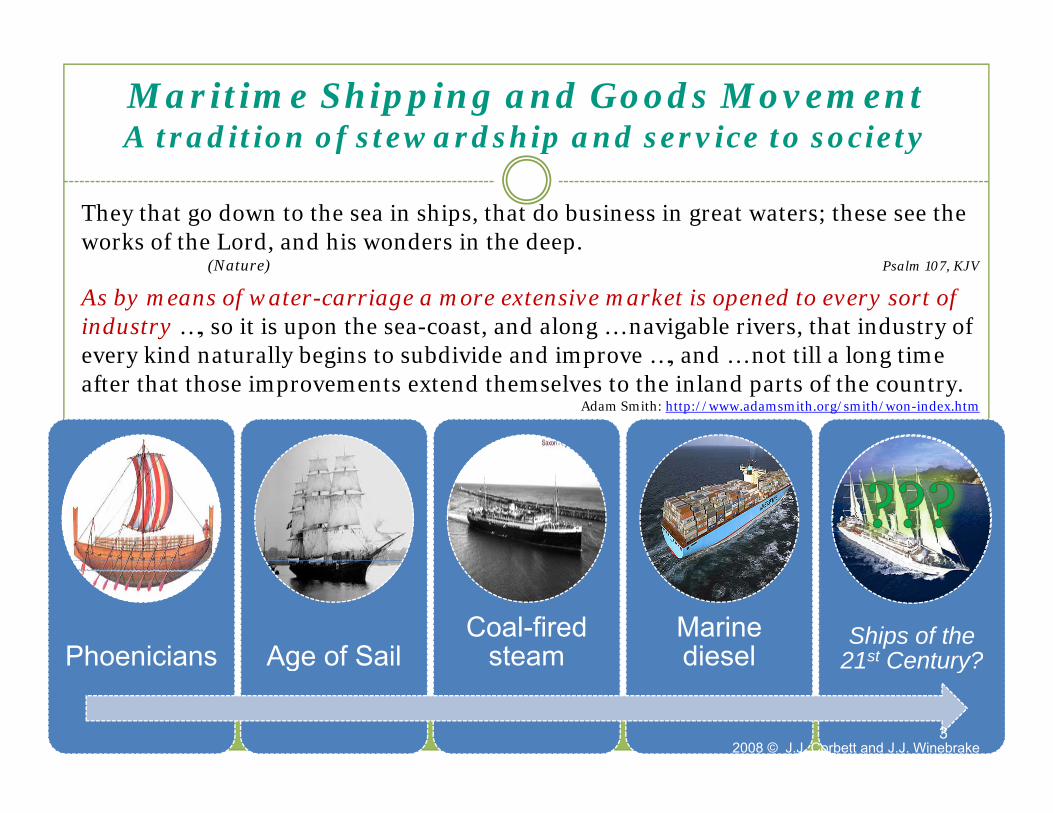
Maritime Shipping and Goods MovementA tradition of stewardship and service to societyf p y
They that go down to the sea in ships, that do business in great waters; these see the works of the Lord, and his wonders in the deep. , p
(Nature) Psalm 107, KJV
As by means of water-carriage a more extensive market is opened to every sort of industry …, so it is upon the sea-coast, and along … navigable rivers, that industry of every kind naturally begins to subdivide and improve and not till a long time every kind naturally begins to subdivide and improve …, and … not till a long time after that those improvements extend themselves to the inland parts of the country.
Adam Smith: http://www.adamsmith.org/smith/won-index.htm
Phoenicians Age of SailCoal-fired
steamMarine diesel
Ships of the 21st Century?Phoenicians Age of Sail steam diesel 21 Century?
2008 © J.J. Corbett and J.J. Winebrake 3

Ocean shipping among intermodal transport
Global freight transportation system: ocean and coastal routes, inland waterways, railways, roads, and air freight
Ocean shipping serves both as a substitute and as a complement for other freight modes
2008 © J.J. Corbett and J.J. Winebrake First published in the IMO Study of Greenhouse Gases from Ships (Skjølsvik et al, 2000). 4
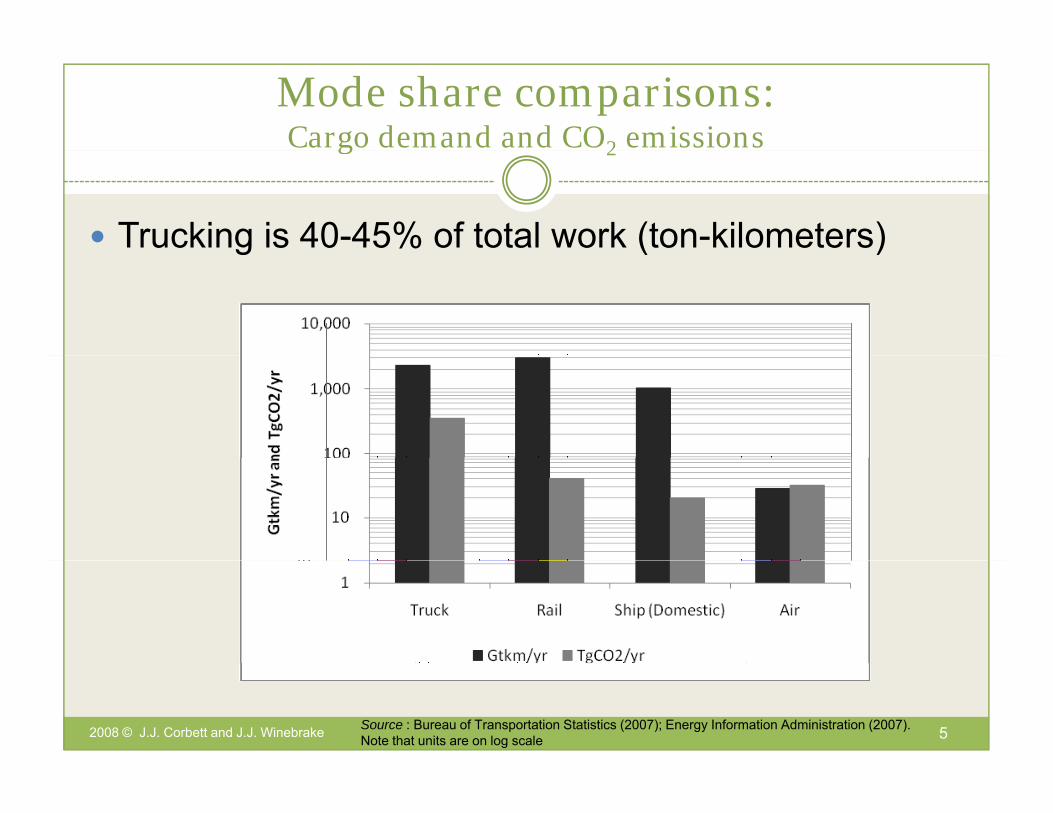
Mode share comparisons: Cargo demand and CO2 emissionsg 2
Trucking is 40-45% of total work (ton-kilometers)g ( )
100,000
1,000
10,000
me
(Gtk
m)
10
100
Car
go V
olum
1
10
Road Shipping Aviation Rail
U S Freight EU25 Freight Seaborne Trade
2008 © J.J. Corbett and J.J. Winebrake
U.S. Freight EU25 Freight Seaborne Trade
5Source : Bureau of Transportation Statistics (2007); Energy Information Administration (2007). Note that units are on log scale

Unitized cargoes grow faster than bulk cargoes
Globalization has encouraged transactions of goods and i i ll k t d li d “j t i ti ”services in smaller packets delivered “just-in-time”
2,500
3,000
go
1,500
2,000
Metric Tons Carg
0
500
1,000
Million
Labor advantages and inexpensive transport allow materials on one continent to be shipped to another for intermediate processing moved
1975 1980 1985 1990 1995 2000 2005
Liquid Bulk Dry Bulk Containerized and Other Cargo
continent to be shipped to another for intermediate processing, moved to a third continent for assembly, and then delivered to market
2008 © J.J. Corbett and J.J. Winebrake 6
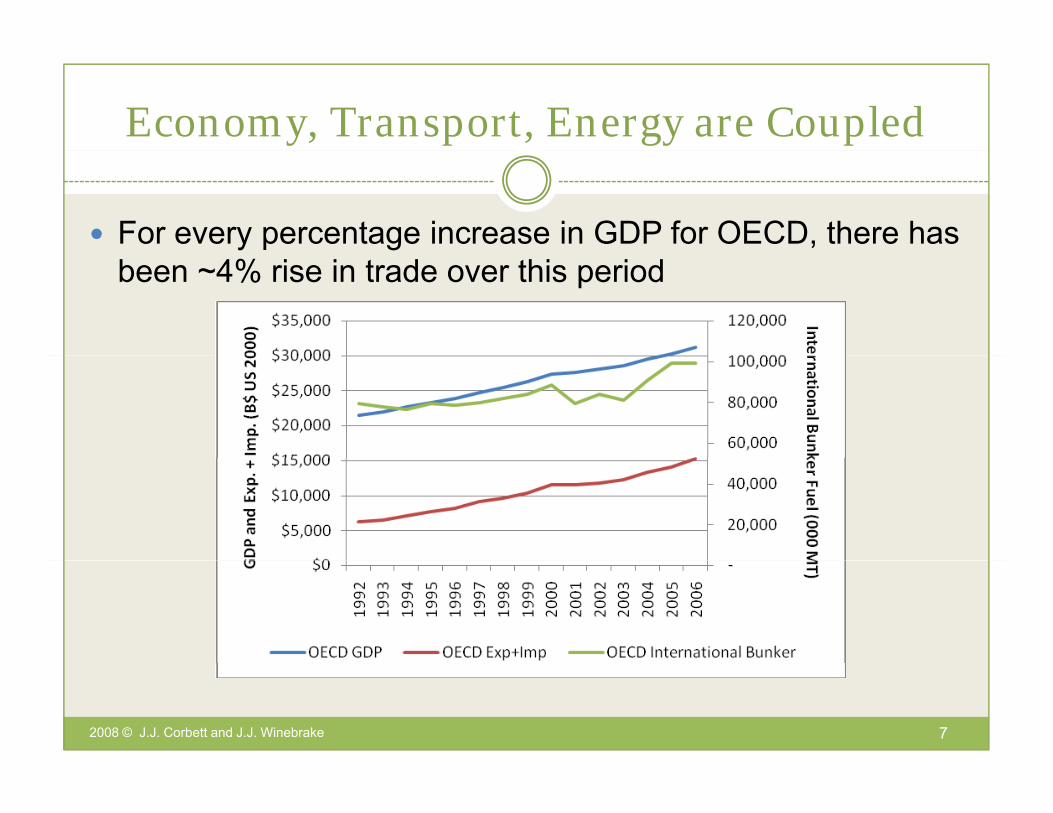
Economy, Transport, Energy are Coupled
For every percentage increase in GDP for OECD, there has been ~4% rise in trade over this period
2008 © J.J. Corbett and J.J. Winebrake 7

Relationship between OECD economic growth and growth in exports and importsg p p
For every one percentage increase in GDP for OECD, there has been ~4% rise in trade over 1992-2006
14.0%
8.0%
10.0%
12.0%
+ Im
ports
4.0%
6.0%
Growth in
Exports +
y = 4.067x ‐ 0.044R² = 0.899
‐2.0%
0.0%
2.0%% G
2008 © J.J. Corbett and J.J. Winebrake 8
0.0% 0.5% 1.0% 1.5% 2.0% 2.5% 3.0% 3.5% 4.0% 4.5%
% Growth in GDP

Economic coupling with goods movement can be directly measuredcan be directly measured
Relationship between cargo shipments and container traffic (TEUs) and GDP as measured in ton-miles for the U.S
2008 © J.J. Corbett and J.J. Winebrake 9

Technology shift during last century10
T iti b b f hi l th b t
gy g y
Transition by number of ships slower than by tonnage
100,000Steam & MotorSteam
700,000,000Steam & MotorSteam
60,000
70,000
80,000
90,000
Ship
s
SteamMotorSail & BargesTotal
400,000,000
500,000,000
600,000,000
oss
SteamMotorSail & BargesTotal
20,000
30,000
40,000
50,000
Num
ber o
f S
200,000,000
300,000,000Tons
Gro
-
10,000
1900 1910 1920 1930 1940 1950 1960 1970 1980 1990 2000-
100,000,000
1900 1910 1920 1930 1940 1950 1960 1970 1980 1990 2000
Gross maritime shipping tonnageNumber of ships in fleet
Corbett, J.J., Marine Transportation and Energy Use, in Encyclopedia of Energy, edited by C.J. Cleveland, pp. 745-748, Elesvier Science, San Diego, CA, 2004 2008 © J.J. Corbett
Gross maritime shipping tonnage by vessel technology
Number of ships in fleet by vessel technology

Trends in global fleet cargo capacity
Fleet capacity (gross tonnage) increased significantly with globalizationV l fl h l l t iti d f OECD ti t thVessel flags have largely transitioned from OECD nations to others
600,000,000
700,000,000
400,000,000
500,000,000
, ,
n Flee
t
World Total
OECD Nations
200,000,000
300,000,000
Gross Ton
s in
OECD with Second Flag
Liberia
Panama
Other Selected Nations
0
100,000,000
1948 1958 1968 1978 1988 1998 2008
This is associated with a shift to more international seafaring labor …2008 © J.J. Corbett and J.J. Winebrake
1948 1958 1968 1978 1988 1998 2008
11

Seafaring professions use international labor
Qualified seafarers hired according to economic (not residency) criteria
12 00014,00016,00018,00020,000
60%70%80%90%100%
rs in
Sam
ple
nal Sam
ple
4,0006,0008,00010,00012,000
20%30%40%50%60%
er of Seafarer
cent of N
atio
02,000
0%10%
USA
orway
UK
rmany
Greece
Russia
China
Croatia
Po
land
kraine
pp
ines
India
Latvia Num
b e
Perc
Professionally skilled seafarers across ranks and nationalities remains
N Ge G C P U
Philip
Own Flag Foreign flag
Professionally skilled seafarers across ranks and nationalities remains an issue of international importance to safety and environment
2008 © J.J. Corbett and J.J. Winebrake 12Source: Obando-Rojas, B. (2001), The Global Labour Market Study, Cardiff University

International marine fuel sales by nation as percent of world bunkers, 2003 - 2005
Nations selling most fuel to ships are typically nations with
percent of world bunkers, 2003 2005
strong interests in cargoes or services those ships provide
Million tonnes fuel 2003 2004 2005W ld 150 568 100% 167 734 100% 175 330 100%World 150,568 100% 167,734 100% 175,330 100%OECD 81,425 54% 91,326 54% 99,140 57%OECD North America 20,873 14% 26,213 16% 27,930 16%United States 19,559 13% 24,828 15% 26,455 15%
OECD Europe 47,860 32% 51,442 31% 53,787 31%OECD Pacific 12,692 8% 13,671 8% 17,419 10%Non OECD 69,143 46% 76,408 46% 76,190 43%Singapore 20 809 14% 19 567 12% 25 479 15%
(OECD) nations account for roughly half of these fuel sales
Singapore 20,809 14% 19,567 12% 25,479 15%
2008 © J.J. Corbett and J.J. Winebrake 13Source: International Energy Agency and OECD (2007a) and (2007b)

Trend in average installed power (kW) for world-wide vessel fleet
Switch to more fuel-efficient engines was more than offset by increased engine power requirements to meet rapidly expanding demand for more and faster global trade
1 80
1.40
1.60
1.80
wer (1
999 = 1)
0.80
1.00
1.20
verage
Installed Po
w
0.20
0.40
0.60
Inde
x of Fleet‐av
2008 © J.J. Corbett and J.J. Winebrake
0.00
1970 1975 1980 1985 1990 1995 2000 2005
14

Activity-based methodologyData confidence higher than fuel sales data onlyData confidence higher than fuel sales data only
Fleet statistics Fleet activity
Fleet fuel consumption
Fuel and combustion
characteristics(Lloyds)
y(AIS, industry data, other)
Fleet emissions
characteristics(BLG 12/6/INF.10,
IPCC, etc.)
Average installed power
Average operating
timeAverage
engine loadAverage SFOC
Average Carbon contentpower
• Confidence Hightime
• Confidence moderate
• Known variability high
• Dominates output
g
• Confidence moderate
• Known variability moderate
• Second most
• Confidence highcontent
• Confidence high• Some variability
due to fuel characteristics
Dominates output range
Second most influential to output range
2008 © J.J. Corbett and J.J. Winebrake 15
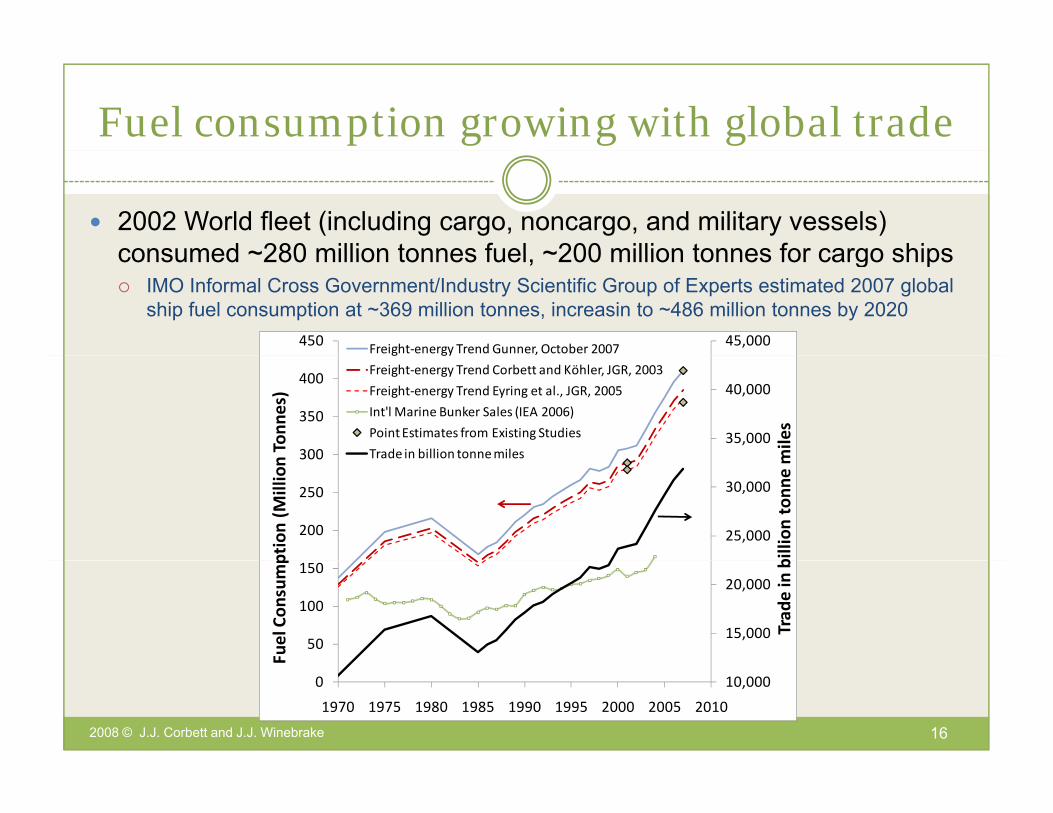
Fuel consumption growing with global trade
2002 World fleet (including cargo, noncargo, and military vessels) consumed ~280 million tonnes fuel ~200 million tonnes for cargo shipsconsumed ~280 million tonnes fuel, ~200 million tonnes for cargo ships
IMO Informal Cross Government/Industry Scientific Group of Experts estimated 2007 global ship fuel consumption at ~369 million tonnes, increasin to ~486 million tonnes by 2020
45,000450 Freight‐energy Trend Gunner, October 2007
35,000
40,000
300
350
400
miles
n Tonn
es)
g gy
Freight‐energy Trend Corbett and Köhler, JGR, 2003
Freight‐energy Trend Eyring et al., JGR, 2005
Int'l Marine Bunker Sales (IEA 2006)
Point Estimates from Existing Studies
Trade in billion tonnemiles
25,000
30,000
200
250
300
billion
ton
ne m
ption (M
illion Trade in billion tonne miles
15,000
20,000
50
100
150
Trad
e in b
Fuel Con
sump
2008 © J.J. Corbett and J.J. Winebrake
10,0000
1970 1975 1980 1985 1990 1995 2000 2005 2010
16

Taxonomy of Environmental Impacts
Episodic environmental events Routine environmental eventsVessel-based
Oil spills Engine air emissionsOOcean dumping Invasive species introductions
(ballast water/hull fouling)Sewage discharges Hull coating toxics releasesOily wastewater Underwater noiseOily wastewater Underwater noiseVessel collisionsShip-strikes with marine life
Port-basedD d i St t ffDredging Storm water runoffPort expansion Vessel wake erosionShip construction, breaking Cargo-handling air emissions
2008 © J.J. Corbett and J.J. Winebrake 17

Efforts are now underway to evaluate and reduce air pollution from shipsreduce air pollution from ships
Emissions → Pollution fate/transport → Exposure → Impact
1.E+01
1.E+02
1.E+03
Fuel and CO2 Traditional Air Pollutants and Black Carbon HFCs
1.E-01
1.E+00
1.E 01
Tg p
er Y
ear
1.E-03
1.E-02
Use s C)
s N)
s S)
PM HC HC
ane
MHC
bon
bon
ants
Regist
ered F
leet F
uel U
s
Regist
ered F
leet C
O2 (as
C
Regist
ered F
leet N
Ox (as
Regist
ered F
leet S
Ox (as
Regist
ered F
leet P
Regist
ered F
leet E
ngine
H
Cargo H
Methan
Total N
MHBlac
k Carb
oOrga
nic C
arbo
Refrige
ran
Summary of global emissions from maritime shipping, 20022008 © J.J. Corbett and J.J. Winebrake 18

List of example air pollution control technologies for maritime shippingtechnologies for maritime shipping
Emissions → Pollution fate/transport → Exposure → Impact → Mitigation
Example technologies (not complete list)Likely to include operations, logistics to fully address GHGs
Stage Control technology Target PollutantPre-combustion Fuel water emulsification NOx
Humid air motor NOxCombustion air saturation system NOx
In-engine Aftercooler upgrades NOxEngine derating NOxInjection timing delay NOxEngine efficiency improvements NOx, SOx, PM, CO2
Post-engine Selective catalytic reduction NOxSeawater scrubbing SOxDiesel particulate filters PMDiesel oxidation catalysts PM
Vessel designs Hull form CO2, energy ratio pollutantsPropeller CO2, energy ratio pollutants
2008 © J.J. Corbett and J.J. Winebrake 19
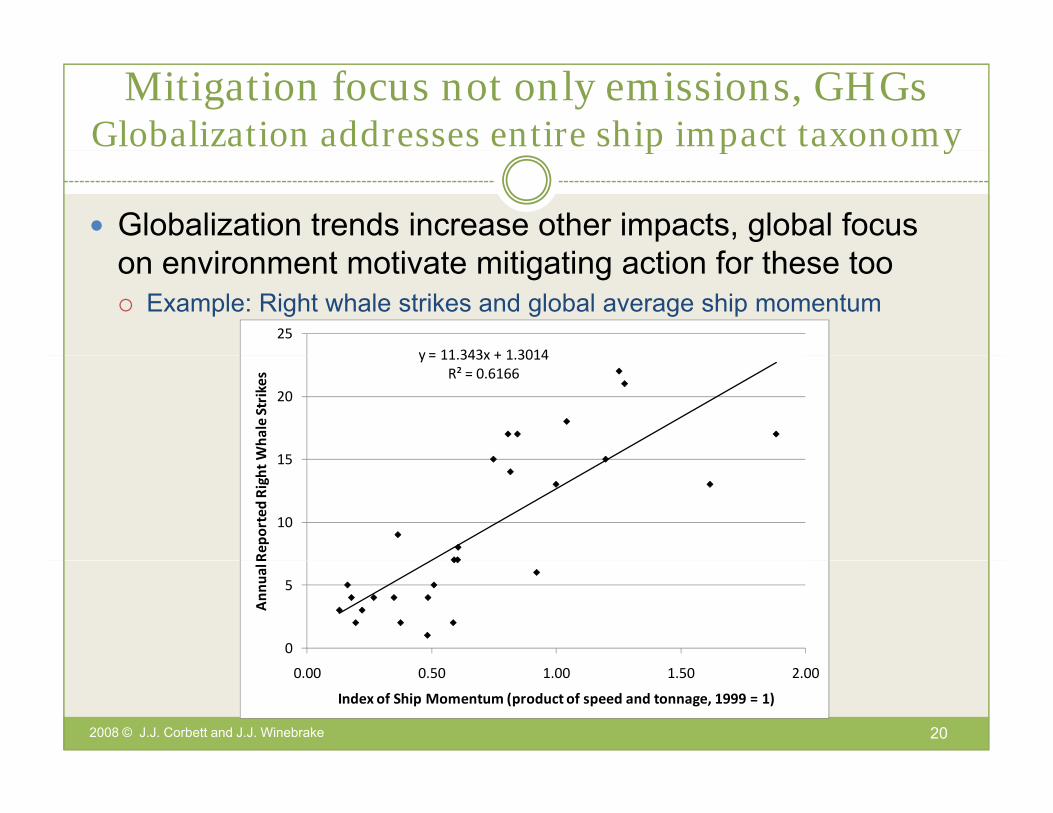
Mitigation focus not only emissions, GHGsGlobalization addresses entire ship impact taxonomyp p y
Globalization trends increase other impacts, global focus i t ti t iti ti ti f th ton environment motivate mitigating action for these too
Example: Right whale strikes and global average ship momentum
y = 11 343x + 1 301425
y = 11.343x + 1.3014R² = 0.6166
15
20
Wha
le Strikes
10
15
Rep
orted Right W
0
5
Ann
ual R
2008 © J.J. Corbett and J.J. Winebrake
0.00 0.50 1.00 1.50 2.00
Index of Ship Momentum (product of speed and tonnage, 1999 = 1)
20

Creating a Sustainable Intermodal Freight System Summaryy
Intrinsic connection between maritime transport, trade, globalization continue to be coupled (e.g., IPCC SRES)
Industry responds to regulatory, market-driven, & advocacyy p g y, , ypressure to improve environmental performance
Environmental and security policy shifting to internationalEnvironmental and security policy shifting to international agreements and global frameworks for regional policy
A sustainable intermodal freight system is preferred to aA sustainable intermodal freight system is preferred to a mode-by-mode approach for at least two reasons:
It can show where shipping modes offer least-cost mitigationIt can identify where shipping offers the least polluting transport service
2008 © J.J. Corbett and J.J. Winebrake 21

Discussion Welcome
C O N TA C T:C O N TA C T:J A M E S J . C O R B E T T, P. E .U N I V. O F D E L AWA R EJ C O R B E T T @ U D E L . E D U
J A M E S J . W I N E B R A K E , P H . D .R O C H E S T E R I N S T. O F T E C H .J W I N E B R A K E @ R I T. E D U@
T E L : 3 0 2 - 8 3 1 - 0 7 6 8
222008 © J.J. Corbett and J.J. Winebrake 22
@T E L : 5 8 5 - 4 7 5 - 4 6 4 8