Embed Size (px)
Citation preview

Accepted Manuscript
The Impact of forest use and reforestation on soil hydraulic conductivity in the
Western Ghats of India: Implications for surface and sub-surface hydrology
M. Bonell, B.K. Purandara, B. Venkatesh, Jagdish Krishnaswamy, H.A.K.
Acharya, U.V. Singh, R. Jayakumar, N. Chappell
PII: S0022-1694(10)00417-8
DOI: 10.1016/j.jhydrol.2010.07.004
Reference: HYDROL 17211
To appear in: Journal of Hydrology
Received Date: 24 March 2010
Revised Date: 10 June 2010
Accepted Date: 4 July 2010
Please cite this article as: Bonell, M., Purandara, B.K., Venkatesh, B., Krishnaswamy, J., Acharya, H.A.K., Singh,
U.V., Jayakumar, R., Chappell, N., The Impact of forest use and reforestation on soil hydraulic conductivity in the
Western Ghats of India: Implications for surface and sub-surface hydrology, Journal of Hydrology (2010), doi:
10.1016/j.jhydrol.2010.07.004
This is a PDF file of an unedited manuscript that has been accepted for publication. As a service to our customers
we are providing this early version of the manuscript. The manuscript will undergo copyediting, typesetting, and
review of the resulting proof before it is published in its final form. Please note that during the production process
errors may be discovered which could affect the content, and all legal disclaimers that apply to the journal pertain.

ACCEPTED MANUSCRIPT � ��
HYDROL9755_FINAL Version June 10 2010 The Impact of forest use and reforestation on soil hydraulic conductivity in the Western Ghats of India: Implications for surface and sub-surface hydrology M. Bonell*, The UNESCO IHP- HELP Centre, The University of Dundee, Dundee DD1 4HN, Scotland, UK ([email protected]) B.K. Purandara, Hard Rock Regional Centre, National Institute of Hydrology, Belgaum, Karnataka – 590 001, India B.Venkatesh, Hard Rock Regional Centre, National Institute of Hydrology, Belgaum, Karnataka – 590 001, India Jagdish Krishnaswamy, Suri Sehgal Centre for Conservation Science, Ashoka Trust for Research in Ecology and the Environment (ATREE) Royal Enclave, Sriramapura, Jakkur Post, Bangalore, 560064, India H.A.K. Acharya, Dept. of Agriculture, Dharwad, Karnataka, India U.V. Singh, Karnataka State Forest, Aranya Bhawan, 18th Cross, Malleswaram, Bangalore, Karnataka – 560 018, India. R. Jayakumar, UNESCO, Jianguomenwai, Waijiaogongyu, 5-15-3, Beijing, China. N. Chappell, Lancaster Environment Centre, Lancaster University, Lancaster LA1 4YW, UK * Contact author

ACCEPTED MANUSCRIPT � ��
ABSTRACT ��
There is comparatively limited information in the humid tropics on the surface and ��
sub-surface permeability of i) forests which have been impacted by multi-decades of ��
human occupancy, and ii) forestation of land in various states of degradation. Even ��
less is known about the dominant stormflow pathways for these respective ��
scenarios. We sampled field saturated hydraulic conductivity, K* at 23 sites at four ��
depths (0m, n=166), 0.10m, n=139), 0.45-0.60m,n=117, 1.35-1.50m, n=117) under ��
less disturbed forest (Forest), disturbed production forest of various local species �
(Degraded Forest) and tree-plantations (Acacia Auriculiformes, 7 – 10 years old, �
Tectona Grandis, ~25-30 years old, Casuarina equisetifolia, 12 years old) in the ���
Uttar Kannada district , Karnataka, India, in the Western Ghats. The sampling ���
strategy was also undertaken across three physiographic blocks and under three ���
main soil types. Subsequently the determined K* were then linked with rainfall ���
intensity –duration-frequency (IDF) characteristics to infer the dominant stormflow ���
pathways. ���
The Degraded Forest shows an order of magnitude decline in K* at the surface as ���
result of human impacts at decadal to century time scales. The lowest surface ���
permeability is associated with the Degraded Forests over the Laterite (Eutric ��
Nitosols and Acrisols) and Red soils (Eutric Nitosols) and infiltration-excess overland ��
flow, IOF probably occurs. Further there is a progressive decline in K* with depth in ���
these soils supporting Degraded Forests. The Acacia Auriculiformes plantations ���
over the Red and Lateritic soils are progressively restoring the near-surface K*, but ���
their K* still remain quite low when compared to the less disturbed Forest ���
permeability. Consequently these plantations still retain the ‘memory’ from the ���
previous degraded state. In contrast the permeability of the Black soils (Vertisols) are ���

ACCEPTED MANUSCRIPT � ��
relatively insensitive to Tectona Grandis plantations and this soil group has a very ���
low K*, irrespective of land cover, so that IOF likely prevails. Overall, Lateritic soils ���
are vary varied compared to the other soils. Thus when compared to other studies, ��
IOF is probably more prevalent in this region. More especially so, when taking into ��
account the marked reduction in surface K* during the wet season when compared ���
to dry season measurements. In addition, we have demonstrated the potential for the ���
‘infiltration – trade off’ hypothesis to be realized in this landscape under certain ���
conditions of land degradation and restoration. It is most relevant to the combination ���
of degraded sites and Acacia Auriculiformes plantations on Red or Laterite soils ���
using the less disturbed forests as the baseline. The intensity of forest use and ���
effects of monoculture plantations on soil ecology (relative to native, mixed forests) is ���
likely to be the critical factor in affecting surface K* over time. Predicted changes in ���
the intensity of rain events in the future is likely to enhance overland flow on ��
degraded sites on all soils and especially on Black soils, and restoration efforts by all ��
stake-holders, preferably using native or non-invasive species, are needed to ���
address this concern. ���
Keywords: field saturated hydraulic conductivity, rainfall intensity-duration-frequency, ���
dominant stormflow pathways, forestation, Western Ghats, India, humid tropics ���
���
���
1.0. INTRODUCTION ���
���
��
Over the last few decades, dramatic land use (LU) and land cover (LC) changes ��
(defined and described in Drigo, 2004, 2006) have taken place in the humid tropics ���
(Chang and Lau, 1993) which have resulted in rapid rates of deforestation. In ���
response, Giambelluca ( 2002) remarked that hydrologists have traditionally focused ���

ACCEPTED MANUSCRIPT � ��
on the hydrological impacts of forest conversion to cleared, actively used land, that ���
is, at the respective extremes of this LC taxonomy (e.g. Bruijnzeel 1990, 1996, 2004; ���
Costa, 2004; Grip et al, 2004). The LC of the tropics is now becoming more ���
fragmented and highly complex, and secondary forest is now emerging as the ���
dominant forest type interspersed with remnants of old-growth forest and other ���
intermediate LCs (Giambelluca, 2002 ; Drigo, 2004 ; Holscher et al, 2004; Cuo et al, ��
2008). These intermediate LCs include degraded, previously converted forest land ��
now under various LUs as well as degraded forest (Lal, 1987; Scott et al, 2004; ���
Safriel, 2007). ���
���
The storm runoff hydrology of these intermediate LCs from multi-decades of human ���
occupancy, and ‘forestation’ (afforestation – reforestation, defined in Scott et al, 2004 ���
and Wiersum, 1984) of land in various states of degradation, have been much less ���
studied across a range of soils and scales (Giambelluca, 2002; Bruijnzeel, 2004; ���
Holscher et al, 2004; Scott et al, 2004; van Dijk and Keenan, 2007; Ilstedt et al, ���
2007; Malmer et al, 2010). The need for such attention is emphasized when one ��
considers that globally an increasing proportion of the population in the humid tropics ��
are becoming dependent on these intermediate LCs for their livelihoods and ���
ecosystem services because of decreasing availability and access to less disturbed ( ���
or old - growth ) tropical forest (Drigo, 2004; Chazdon et al 2008). For example ���
within South and Southeast Asia, it was estimated that about 45% of the total land ���
area has been affected by human – induced soil degradation (Eswaran et al, 2001; ���
Scott et al, 2004). At the small scale (~1Km2); Ziegler et al (2004, 2007) presented a ���
case study from northern Vietnam that demonstrates the surface hydrologic ���

ACCEPTED MANUSCRIPT � ��
consequences of landscape fragmentation and a predictive frame-work for ���
restoration scenarios. ��
��
Contrary to results from controlled, paired experimental research basins (Hewlett ��
and Fortson, 1983; Andreassian, 2004; Bruijnzeel, 2004), there are an increasing ��
number of reports from both degraded and converted tropical forests of the ��
occurrence of Horton-type (infiltration-excess) overland flow IOF, across various ��
scales of investigation (e.g. Pereira, 1989,1991; Sandstrom, 1995, 1996, 1998 ; ��
Chandler and Walter, 1998; Zhou et al, 2001; Costa et al, 2003; Bruijnzeel, 2004 ; ��
Ziegler et al, 2004; Chandler, 2006; de Moraes et al, 2006; Cuo et al, 2008;Chaves ��
et al, 2008; Mehta et al, 2008; Zimmermann and Elsenbeer, 2008, 2009). The ��
reason for this dichotomy is that most of the controlled experiments relate to the two-�
class land –cover taxonomy of Giambelluca (2002) where the various states of �
resilience of different soils to disturbance have remained high. Further the short ��
duration of most controlled experiments has not captured the hydrological responses ��
to multi-decadal degradation (Bruijnzeel, 1989, 2004; Sandstrom, 1998). ��
Consequently the soils in the controlled experiments have retained comparatively ��
high infiltration rates towards those of pre-disturbed conditions, and so LC change ��
had a minimal effect on the dominant stormflow pathways (Chappell et al, 2007, e.g. ��
subsurface stormflow, SSF). In the context of the ‘infiltration trade-off’ hypothesis of ��
Bruijnzeel (2004), the preceding description would be fit within the ‘non-degraded ��
scenario’. �
�
The principal reason for enhanced IOF is a significant reduction in soil infiltrability ����
(Hillel, 1980) and permeability due to various forms of disturbance at multi-decadal ����

ACCEPTED MANUSCRIPT � ��
time scales (e.g. Scott et al, 2004). Strictly however in situ measurements made ����
above a water table to represent saturated hydraulic conductivity, Ksat are known ����
as field, saturated hydraulic conductivity, K* because the latter can be as low as 0.5 ����
Ksat (Bouwer, 1996; Talsma and Hallam, 1980; Talsma,1987). Following Williams and ����
Bonell (1988), K* will be thus adopted in this work. Further K* and ‘permeability’ will ����
be used interchangeably for the same reasons as outlined in Zimmermann and ����
Elsenbeer (2009). ���
���
A common cause for enhancing the occurrence of IOF is surface soil compaction ����
arising from various trampling pressures such as intensive over-grazing, human ����
pathways and roads (Ziegler et al, 2004; Hamza and Anderson, 2005; Cuo et al, ����
2008; Zimmermann and Elsenbeer, 2008, 2009). Moreover selected soils in the ����
tropics are particularly vulnerable to significant changes in structure as a result of ����
human disturbance (e.g. Gilmour, 1977; Schack – Kirchner et al, 2007). Additional ����
causes are the exposure of unprotected soils to high rainfall intensities which can ����
result in raindrop compaction and sealing (Sandstrom, 1998; Grip et al, 2004; Scott ����
et al, 2004).Thus the overall reduction in surface permeability (and thus infiltration) ���
results in a change of the dominant stormflow pathways from SSF (supplemented by ���
SOF) to IOF. It will also affect the vertical percolation (VP) flux in the uppermost soil ����
layers. These circumstances are part of the ’degraded scenario’ of the ‘infiltration ����
trade-off’ hypothesis (Bruijnzeel, 2004). ����
����
The fragmented LCs of the Karnataka State part of the Western Ghats in India are ����
typical of those commonly found in the more highly elevated and densely populated ����
parts of the humid tropics. Further in this area, a mix of State Government and ����

ACCEPTED MANUSCRIPT � �
community–based forestation programmes have been implemented for more than ����
two decades within degraded forests and severely degraded, former forest –covered ���
land (Pomery et al, 2003; Ramachandra et al, 2004). Consequently this area offered ���
an opportunity to make a preliminary assessment of first, the impacts of long –term, ����
land-forest degradation at multi-decadal to century time scales on both soil ����
permeability and inferred runoff generation processes (Blanchart and Julka, 1997; ����
Menon and Bawa, 1998; Pomeroy et al, 2003; Pontius and Pacheco, 2004; Seen et ����
al, 2010). A second objective is to evaluate the corresponding hydrological impacts ����
of subsequent rehabilitation of this degraded land- forest through forestation. ����
Further it is believed that this is the first study to present soil permeability data for ����
Indian tropical forests. ����
���
The long time scales of disturbance in the Western Ghats forests are typical of the ���
densely populated Asian region where similar hydrological studies have been ����
undertaken (Chandler and Walter, 1998; Chandler, 2006; Zhou et al, 2001; Ziegler et ����
al, 2004, 2007; Cuo et al, 2008). Elsewhere reports from similar work being ����
undertaken in the Amazon basin and montane Ecuador are monitoring the ����
hydrological impacts of comparatively recent disturbance of approximately 20-30 ����
years (Tomasella and Hodnett, 1996; Elsenbeer et al, 1999; Godsey and Elsenbeer, ����
2002; Zimmermann et al, 2006; de Moraes et al, 2006; Chaves et al, 2008; ����
Zimmermann and Elsenbeer, 2008, 2009; Germer et al, 2010). Consequently some ����
of the results from that South American work will provide an interesting comparison ���
with the present study. ���
Following a description of the study area, the research questions will then be listed ����
by drawing upon selected issues previously raised from global reviews (Bruijnzeel, ����

ACCEPTED MANUSCRIPT � �
2004; Holscher et al, 2004; Scott et al, 2004; van Dijk and Keenan, 2007; Ilstedt et ����
al, 2007). A comparative overview of K* across soil groups and land covers is then ����
presented. Subsequently using a strategy similar to that undertaken elsewhere in the ����
tropics and sub-tropics, field measurements of K* are compared with various rainfall ����
characteristics (IDF, Intensity-Duration-Frequency) to infer dominant stormflow ����
pathways (Chappell et al, 2007; and using the terminology of Chorley, 1978) under ����
the more extreme rainfalls (Bonell et al, 1983; Gilmour et al, 1987; Elsenbeer et al, ���
1999; Godsey and Elsenbeer, 2002; Zimmermann and Elsenbeer, 2009). Finally the ���
implications for forest management, hydrologic restoration and likely changes in ����
hydrologic response under climate change scenarios will be briefly examined. ����
����
2.0. THE STUDY AREA ����
����
2.1 The Physical Background ����
����
The study area is shown in Figure 1. Apart from Uttara Kannada, part of the ����
Shimoga and Dharwad Districts were incorporated in the field campaign, which gave ���
a combined area of ~16,000 km2. ���
����
The geology is highly complex with the most important formations being i) the ����
Archaean (Peninsular Gneiss), ii) the Archaean to Lower Proterozoic (Dharwar ����
schist) belt, iii) the Upper Proterozoic (granite) and iv) pockets of Paleocene to ����
Recent laterite in the coastal hinterland (Geological Survey of India, 1981). Such ����
geological formations results in an equally complex distribution of soil groups, soil ����
orders and associated permeability (Shivaprasad et al, 1998). ����

ACCEPTED MANUSCRIPT � ��
The geomorphology reflects the complex geology by resulting in a sharp, contrasting ����
topography. Within Uttar Kannada district, there are gentle undulating hills which rise ���
steeply from a narrow coastal strip bordering the Arabian Sea to a plateau at an ���
altitude of 500 m with occasional hills rising above 600–860 m. Using the landform ���
classification of the National Bureau of Soil Survey and Land Use Planning, ���
NBSSLUP (NBSSLUP, 1993), the study area can be thus broadly categorised into ���
three distinct blocks that is, i) the Coastal Lands ii) the mostly forested Sahyadrian ���
interior corresponding to the Western Ghats proper (Malnad) and iii) the Eastern ���
Margin where the table land or plateau begins that merges with the Deccan plateau. ���
Following the landscape groupings of Gunnell and Radhakrishna (2001), these ���
blocks are termed respectively as Coastal, Mid-Ghat/Mid-lands and Up-Ghat. ���
��
Gunnell (1997) outlined the climatic features of the Western Ghats in some detail, ��
which is distinctly monsoonal. The rainfall is dominated by the orographic uplift of ���
moist, southwest monsoon airflow with the topographic barrier of the “Western ���
Ghats-Central Sahyadri” during the months June – September (Pascal, 1982; Gadgil ���
and Joshi, 1983; Singh, 1986). Spatially annual rainfalls are highly variable and ���
range from 1150mm to greater than 5000mm over the highest topography. There is ���
a distinct drying gradient on the eastern slopes and onwards towards the Deccan ���
plateau. ���
���
The complex geology, geomorphology, climate of the Western Ghats is reflected in a ��
corresponding diversity of vegetation and soils. The vegetation of the Western ��
Ghats has been classified using criteria such as physiognomy, phenology and ����
floristic composition (Pascal, 1982, 1984, 1986, 1988; Ramesh and Pascal, 1997; ����

ACCEPTED MANUSCRIPT � ��
Ramesh, Swaminath et al, 1999). There are five major floristic types, namely ����
evergreen and semi-evergreen forest (low, medium, high elevation) and deciduous ����
forest (dry type, moist type); all of which are closely correlated with the temperature ����
and rainfall regimes (Pascall, 1986). Following other tropical countries which contain ����
very old landscapes and soils (e.g. Brazil, Oliveira et al, 1992, as highlighted by ����
Elsenbeer et al, 1999 and de Moraes et al, 2006; Australia, Isbell, 2002, McKenzie et ����
al, 2004, as adopted by Bonell, 2004, Bonell et al, 1983), India has its own soil ���
classification of the NBSSLUP (1993) which we will use as the preferred ���
identification of the soils (Figure 1). Shivaprasad et al (1998) mapped the soils at a ����
coarse scale of 1: 250 000 using the more traditional soil groups of the NBSSLUP ����
(Table 4.8 in Shivaprasad et al, 1998). These writers noted that the dominant soil ����
groups are the Black soils, Laterite soils and Red soils, or respectively Vertisols and ����
a mixture of Alfisols and Ultisols for the USDA (Soil Survey Staff, 1975, 1999); and ����
likewise for the FAO-UNESCO classification (FAO-UNESCO, 1974; 1988; FAO, ����
1998), Vertisols and a mixture Eutric Nitosols and Acrisols. ����
����
2.2 Placing the Western Ghats of India in the context of degraded land cover - ���
runoff generation issues ���
����
As a result of degradation of forests over multi-decadal to century time scales, the ����
land cover is complex (Blanchart and Julka, 1997; Menon and Bawa, 1998; Pomeroy ����
et al, 2003; Pontius and Pacheco, 2004; Seen et al, 2010). Patches of remnant ����
forest, which are less disturbed and less used by people are at one end of the ����
disturbance gradient and at the other end are a heterogeneous category of disturbed ����
and heavily used forest which consist of open forest, grassland and savannah ����

ACCEPTED MANUSCRIPT � ��
woodlands. Livestock grazing, fuel wood and fodder extraction, fire as well as ����
extraction of leaf-manure and cropland are major land-uses in these highly disturbed ���
or degraded sites which provide local communities with substantial “provisioning” ���
ecosystem services (MA, 2005) and sustain many livelihoods (Lele, 1993; Rai, ����
2004). However the trade-offs of these provisioning services with respect to ����
hydrologic functions and services (Elmqvist et al, 2010) is relatively unknown. ����
Further within the humid tropics, Rai (1999) estimated that nearly 80% of forestation ����
using both native and exotic species was taking place in India and the Karnataka ����
State portion of the Western Ghats has taken a lead in such forest restoration. Many ����
degraded patches of land cover have been reforested with Tectona Grandis ����
plantations, pre-1980 (from here on referred to as ‘Teak’), exotic Acacia ����
Auriculiformes plantations, post-1980 (‘Acacia’) and more locally, Casuarina ���
equisetifolia plantations, post-1980 (‘Casuarina’) (Pomeroy et al, 2003; Pontius and ���
Pacheco, 2004; Ramachandra et al 2004). ����
Consequently the Western Ghats (Karnataka State) offers an opportunity to ����
evaluate LC impacts on permeability at contrasting time scales namely the impacts ����
on soil permeability of: ����
i) forest land use and degradation, ����
ii) forestation over previously degraded land, relative to less used native forest. ����
Both these land cover scenarios are in line with the storm runoff generation issues ����
highlighted above. ����
���
3.0 SCIENTIFIC OBJECTIVES ���
����

ACCEPTED MANUSCRIPT � ��
Using the relatively less disturbed evergreen forest –semi evergreen forest - moist ����
deciduous forest ( now referred to as ‘Forest’) at one end of the LC spectrum and ����
heavily-used production forest land ( including some grassland/Savannah-����
Woodlands) at the other (hereon referred to as ‘Degraded Forest’), the following ����
issues will be addressed: ����
i. To what extent is K* altered due to long-term degradation of forests? ����
ii. To quantify any changes in permeability following forestation of landscapes in ����
various states of degradation using plantations of Teak or Acacia? ���
iii. To what extent are the inferred dominant stormflow pathways comparable ���
with other reports from elsewhere in the humid tropics? ����
iv. To quantify what is the likely effect of wet-season conditions on actual ����
hydraulic conductivities in contrast to measurements made in the dry-season ����
that are the normal procedure for field measurements? What implications ����
does this have for predicting hydrologic consequences of forest degradation? ����
����
4.0 METHODS ����
4.1 Sampling design ����
���
4.1.1. Land covers and Physiographic Blocks ���
The sampling sites scattered across the ~16 000km2 area were selected based on ����
the five principal land covers associated with land-forest management (Figure 1). ����
They included less disturbed, natural forest (‘Forest’) , disturbed production forest of ����
various local species (‘Degraded Forest’) and tree-plantations (Acacia, Teak, ����
Casuarina). The total number of K* samples (n) for these respective LCs across all ����
tested soil depths were Forest (n= 205), Degraded Forest (n=174), Acacia (n= 142), ����

ACCEPTED MANUSCRIPT � ��
Teak (n= 53) and Casuarina (n=18). The sampling design also included the three ����
principal soil groups (Black, Laterite, and Red) and the three physiographic blocks, ����
namely the Coastal, the Mid-Ghat and the Up-Ghat (Figure 1). These blocks are ���
characterized by distinct topographic position and associated rainfall regimes (Gadgil ���
et al, 1988). ���
���
In consultation with the Karnataka Forest Department, patches of distinct land-cover ���
and land-use that were considered homogeneous were surveyed and selected using ���
topographic maps and ground-surveys (Pomeroy et al, 2003; Karnataka Forest ���
Department, 1997; Khanna, 1996). In addition, the soil types were identified initially ���
using the mapping of Shivaprasad et al (1998) and later confirmed from samples ���
taken for laboratory analyses. ���
��
4.1.2. Total number of sites ��
���
Based on logistical constraints of access and the limitations of transporting ���
equipment and large quantities of water over large distances for the permeability ���
measurements, finally, a total of 23 sites were selected (Figure 1). These included 7 ���
in the Coastal, 5 in the Mid-Ghat and 11 in the Up-Ghat region. ���
���
���
4.1.3. Number of sites by land cover ���
��
When concerning LC, the sites included 5 Acacia plantations (varying from 7 – 10 ��
years old), 7 Degraded Forests and 7 Forests, supplemented by, 3 Teak plantations ����
ACCEPTED MANUSCRIPT � ��
(~25-30 years old) and 1 Casuarina plantation (12 years old) (Pomeroy et al, 2003). ����
With the exceptions of the Teak and Casuarina, all other land covers are ����
represented across the three physiographic blocks (Figure 1). Two of the three Teak ����
plantations are confined to the Mid-Ghat in association with the Black soils. The ����
additional Teak plantation, as well as that of the Casuarina, is located over Red soils ����
in the Up-Ghat region (Figure 1). A subset of these sites (17 in all) covered replicate ����
sites for Forest, Acacia and Degraded Forest on Red and Laterite soils. This ����
procedure resulted in the respective replicates of 5 sites (Forest), 5 sites (Acacia) ���
and 7 sites (Degraded Forest). ���
����
4.1.4. Number of sites by soil group ����
����
The three soil groups were not evenly spread across all three physiographic blocks. ����
For example, the Black soils are concentrated in the Mid-Ghat (4 sites) and the Red ����
soils (7 sites) are located in the Up-Ghat. The Laterite soil group (12 sites) is the only ����
one which is represented across all three physiographic blocks. ����
����
���
4.1.5. Sampling strategy within each site or plot ���
����
At each site, the plot sizes for K* sampling ranged from 10x10m to 20x20m ����
depending on suitable ground for measurement and constraints such as density of ����
vegetation, tree roots and rocks. Soil was sampled for K* at points randomly selected ����
within each plot up to 1.5 metres at four depths: 0, 0.1, 0.45- 0.60 and 1.20-1.50 m. ����
The number of samples taken at each depth depended on the size of the land-cover ����

ACCEPTED MANUSCRIPT � ��
patch as well as logistical considerations. But at least 5 samples were taken by ����
depth and at some sites up to 18 points were measured for selected soil layers. ����
When concerning the presentation of the results, the latter will be abbreviated here ���
on using the lower depths, viz, 0.60 and 1.50m. Table 1 summarizes the number of ���
K* samples across the four sampling depths for each soil group. Table 2 shows the ����
corresponding sample sizes for the replicate sites for Forest, Acacia and Degraded ����
Forest on Red and Laterite soils ����
����
4.2. Determination of field, saturated hydraulic conductivity, K* ����
����
For the surface and 0.1m depth, the disc permeameter was used for the ����
determination of soil hydraulic properties (Perroux and White, 1988; McKenzie et al ����
(2002). Close attention was given to problems with the method and data quality ���
control linked with any individual tests (as outlined in detail by Perroux and White, ���
1988 and McKenzie et al, 2002). This particularly applied to the Black soils during ����
tests undertaken during the dry season due to the appearance of soil cracks from the ����
clay dominant texture. Any tests affected by short-circuiting, which counters the ����
assumption of matrix flow theory, had to be rejected and replicated again (Wooding, ����
1968; Perroux and White, 1988; McKenzie et al, 2002). ����
For the deeper layers, the field logistics of water transport in difficult terrain restricted ����
the determination of K* to the 0.45-0.60m and 1.20-1.50m depths using an ����
adaptation of the constant head well permeameter (CHWP) of Talsma and Hallam ����
(1980) (Reynolds et al, 1983, 1985; Philip, 1985; Reynolds and Elrick, 1987; ���
Mackenzie, 2002). The use of the CHWP was restricted to the dry season to ���

ACCEPTED MANUSCRIPT � ��
minimise errors from “smearing” of the auger hole walls (Mackenzie, 2002; Chappell ����
and Lancaster, 2007). ����
����
The disc permeameter (or its predecessor, the Talsma infiltrometer ring, Talsma, ����
1969) and CHWP are now commonly used as part of inferring dominant stormflow ����
pathways in the humid tropics (e.g. Elsenbeer and Vertessy, 2000). On the other ����
hand, there has been extensive discussion on the inherent weaknesses and ����
uncertainty in these methods for providing a true representation of K* linked with the ����
methodologies themselves and the fact they only measure at a point-scale (e.g. ���
Talsma, 1987; Sherlock et al, 2000; Mackenzie, 2002; McKenzie et al , 2002; ���
Chappell & Lancaster, 2007). From the hillslope scale upwards (Keller et al, 1986, ����
1988; Bazemore et al, 1994; Noguchi et al, 1997; Brooks et al, 2004; Uhlenbrook, ����
2006; Jourde et al, 2007) the order of magnitude of K* can be much higher due to a ����
greater incorporation of conductive macropores. The description by Putty (Putty and ����
Prasad, 2000a, b; Putty, 2006) for a headwater, catchment study located south of ����
the Study Area within the Dakshina –Kannada district of the Western Ghats ����
emphasizes this point. Within the evergreen forest of that study, the conveyance of ����
SSF was principally by pipes (ranging for a few mm to 1 metre diameter) and the ����
corresponding percolation rates (100-300mmh-1) were high. ���
Thus there are several issues which potentially affect the reliability of measured K* ���
(viz, scale effects, insufficient incorporation of macropores and pipes, a bias towards ����
the soil matrix, and experimental errors even at the point scale). Taking these into ����
account, then the K* data presented here might be better considered more as ����
‘indicators’ when inferring pathways of stormflow. ����
����

ACCEPTED MANUSCRIPT � �
����
����
4.3 The temporal variability of the surface K* ����
���
���
The surface K* data were also based on measurements taken in the dry season. On ���
the other hand, for some time there has been recognition that the surface K* can ���
exhibit both temporal as well as spatial variability (Topalidis and Curtis, 1982; Gish ���
and Star, 1983; Bonell and Williams, 1986; Elsenbeer et al, 1999; Chappell and ���
Lancaster, 2007). Such temporal variability is particularly marked in the tropics ���
where the kinetic energy of rainfall is high. This results in mechanically-based ���
disruption of the surface soil structure over areas not protected by a low vegetation ���
cover, i.e. compaction from raindrop impact (McIntyre, 1958a, b; Mott et al, 1979). In ���
addition, physical-chemical changes can occur in soils of high clay content (e.g. the ��
Black soils) due to swelling on contact with percolating rainwater. Mechanical ��
disruption to surface soil aggregates also occurs where overland flow is frequent. ���
To check for such temporal variability of surface K*, one set of spot estimates for ���
both the dry season and the wet season respectively were taken at 15 sites. These ���
sites were selected to include the range of soil types and land covers. The disc ���
permeameter was placed over the same sampling points within each plot. ���
���
4.4. Rainfall intensity-duration-frequency analysis (IDF) ���
���
In the study area, Water Resources Development Organization of the Govt. of ��
Karnataka is maintaining a rain gauge network, within which, there are 12 recording ��
and about 90 of the non-recording type of rain gauges. In an earlier study carried out ����
by Gadgil et al (1988) these writers identified three zones in the study area using a ����

ACCEPTED MANUSCRIPT � �
disparity index (defined in Gadgil et al, 1988) and the monthly rainfall distribution as ����
the principal indicators, viz, i) the Coastal zone, ii) Mid-Ghat zone and iii) the Up-����
Ghat. However a key problem is the poor spatial representation of these zones by ����
the limited number of rain recorders (Figure 1) and the short duration of continuous ����
records (ranging from 6 to 25 years). This led to pooling to form a larger regional ����
data set. The rainfall intensity for each of the 15 minutes duration was then ����
calculated up to 5hrs. Subsequently the values of annual maximum rainfall intensity ���
(mmh-1) were regressed against duration (15 minutes to 5 hrs). The Weibull plotting ���
position procedure, as described by Sharma (1987) was then used to estimate the ����
return periods. ����
����
Elsewhere for rainfall analysis in India, Kothyari et al, 1990 had used the intensity ����
values obtained after fitting the Gumbel distribution in deriving the IDF equation. This ����
approach is to some extent acting as a representation of the Gumbel distribution ����
itself; whereas, the method of Sharma (1987) avoids the preceding problem to derive ����
the IDF. Moreover the rainfall characteristics and environmental circumstances in ����
which the method of Sharma (1987) was developed, matches with the conditions of ���
the current study area (the exception is the Coastal region). Hence it was decided to ���
adopt the Sharma (1987) approach in developing the IDF characteristics. ����
����
����
����
4.5 Data analysis ����
����

ACCEPTED MANUSCRIPT � ��
The untransformed, point K* measurements classified by soil group and land cover ����
will be presented using box plots. Box plots show a measure of central tendency ����
(median) and a measure of dispersion (inter-quartile range), upper and lower ���
quartiles and outliers. They are one of the most useful diagnostic graphical tools for ���
comparing highly heterogeneous variables such as hydraulic conductivities across ����
soil types or land-cover categories. When the untransformed point K* data are used ����
in the box plots, the dispersion reflects both within- plot and across site variability. ����
����
On the other hand, in view of the fact we are comparing widely separated sites ����
across a very large study area, there is need for an alternative approach which ����
shows inter-site variability across the landscape only and does not include intra-����
site variability as well. A first step was to calculate the geometric (or log-average) ����
mean from the individual K* data at a specific depth within each site. These plot - ���
averaged geometric K* means were taken as representative of each depth in the ���
sites concerned. We will use strip charts (R version 2.9.1; http://www.r-project.org) to ����
compare these plot averaged K* across all soil types and land-cover categories. ����
Stripcharts produce one dimensional scatter plots (or dot plots) of the given data and ����
they are a good alternative to box plots when sample sizes (i.e. no. of sites) are ����
small. Further ‘jittering’ (using R software above) has been applied to enable similar ����
valued or coincident data points to be viewed clearly. ����
�����
�����
A statistical summary of the plot averaged K* by soil group and land-cover will be ���
presented. The 95% confidence intervals about the medians will be bounded by zero ���
at the lower end. ����

ACCEPTED MANUSCRIPT � ��
����
The rain IDF characteristics will be superimposed on both the box plots and strip ����
charts so that the dominant storm pathways can be inferred, i.e. under extreme ����
rainfalls. The assumption will be for near-saturated, antecedent soil moisture ����
conditions (typical of optimal conditions of wetness during the summer monsoon ����
season) so that any vertically percolating rainwater (VP) will be controlled by vertical ����
changes in K* under a unit hydraulic gradient (in line with Darcy’s law) ( Gilmour et ����
al, 1987). ���
���
����
The differences in seasonal K* at the surface will be statistically examined using the ����
nonparametric Mann-Whitney U Test which is suitable for comparing two populations ����
consisting of small samples (Siegel, 1956, p 116). Further the respective wet and dry ����
season K* data were lumped and compared also using box plots. These plots will ����
illustrate any changes in the central tendency and the dispersion of K* about the ����
median. ����
����
5.0. RESULTS ���
���
This section will compare the K* data with the rainfall IDF. ����
����
����
����
5.1. Rainfall Intensity – Frequency – Duration analysis (IDF) ����
����
Overall the IDF characteristics shown in Table 3 are in line with the earlier ����
observations of Putty and co-workers (Putty et al, 2000; Putty and Prasad, 2000a, b). ����
This is an environment of high daily totals but relatively weak, short-term intensities ���
in comparison with other humid tropics rain stations, c.f. Bonell et al (2004). ���

ACCEPTED MANUSCRIPT � ��
5.2. Field saturated hydraulic conductivity, K*, for specific layers ���
���
In line with early work (e.g. Talsma, 1969; Rogowski, 1972; Nielsen et al, 1973; ���
Baker, 1978); the K* data often have a logarithmic statistical distribution. In this study ���
the pooled K* data when transformed with a log10- transform produced a ���
symmetrical distribution indicating that the underlying distribution is log-normally ���
distributed. Elsewhere other researchers have applied different transformations for ���
selected shallow, soil layers (e.g. Elsenbeer et al, 1992; Zimmermann et al, 2006; ���
Zimmermann and Elsenbeer, 2008). The former two studies thus used root ��
transformations of K* data such as the fourth – root transformation as a better ��
descriptor of this variable for the upper soil 0.1m. layer whilst reverting to the log ���
transformation below 0.1m depth. Whereas Zimmermann and Elsenbeer (2008) ���
used either the square root, or reciprocal of the square root, for data taken at 0.125m ���
and 0.20m depths in the case of two of the eight land covers considered. Otherwise ���
they found the logarithm transformation was the most appropriate. ���
���
For a comparison across soil types and LCs in the present study, emphasis is made ���
on the medians (when concerning the box plots) and the log-average or geometric ���
means (expressed in original standard units of mmh-1 following taking the antilog) ��
rather than the arithmetic means for any graphical or statistical comparisons across ��
soil type or land-cover. In view of the errors connected with the field methods, it is ����
probably more realistic to place greater emphasis on the order of magnitude ����
differences between K* (mmh-1) and the equivalent hourly rain intensities (for ����
specified durations and return periods), rather than solely depend on absolute ����
values, for inferring dominant stormflow pathways. ����
����

ACCEPTED MANUSCRIPT � ��
5.3. A comparison of the distribution of the untransformed, point K* data ����
using box plots with the strip charts including geometric mean K* ����
���
���
Box plots are presented by soil groups (Figure 2a-d) and land cover (Figure 4a-d). ����
These are adjoined with the respective strip charts (Fig.3a-d and Fig 5a-d). Also ����
included are the average rainfall intensities (in mmh-1 equivalent) for 15 minutes ����
duration over the study area by different return periods from one (1) year upwards. ����
These provide a diagnostic for inferring the dominant storm runoff pathways under ����
the most intense rainfalls. ����
����
5.3.1. Soil Groups ����
���
The rank order of median K* persists at all depths (Figure 2a-d, Table 4). Thus the ���
Red soils are the most permeable and the medians retain the same order of ����
magnitude of K* down to 1.5m. depth. In contrast the Black soils have persistently ����
the lowest K* throughout the soil profile, irrespective of land cover, or when ����
concerning both intra-site and inter-site variability (Figures 2a-d and 3a-d, Table 4). ����
����
The Laterite and Red soil groups also show considerable dispersion in the box plots ����
and is a feature which persists at all depths (Figures 2a-d). On the other hand, it is ����
the Laterites which are more variable across the landscape as shown in Figure 3 and ����
elsewhere by the corresponding 95% confidence intervals in Table 4. The box plots ���
offer an explanation for such variability. The lower quartiles in Figure 2a-d for the ���
Laterite are almost on parity as those shown for the Black soils and in line with the ����
lower bound of zero in the K* data (Table 4). Further many of the geometric mean K* ����
points in Figure 3a-d are not too dissimilar between the Laterite and Black soils. The ����

ACCEPTED MANUSCRIPT � ��
complex geology and topography of the study area and the corresponding, complex ����
genesis of this Laterite group maybe a causal factor for such variability. ����
����
5.3.2. Land Cover ����
����
Figure 2a has already shown that the Black soils are impermeable and thus there ���
are no marked impacts of land cover on surface K*. ���
����
For the LCs with adequate sampling replicates (incorporating the Laterite and Red ����
soils), as expected the median surface K* (Figure 4a, Table 5) is the lowest for the ����
Degraded Forest and the highest for the Forest. This aspect is also clearly evident ����
across sites, as shown in Figure 5a. In addition the Acacia plantations enhance ����
surface K* so that the box plot median (Figure 4a) occupies an intermediate position ����
in rank order between the Forest and the Degraded Forest. At the 0.1 m depth ����
(Figure 4b), the main change is that the median K* in the Forest has markedly ����
reduced (Table 5) which is also evident by the inter-site comparison of K* geometric ���
means (Figure 5a,b). ���
����
At the lower depths (0.6m and 1.5m) (Figure 4c and 4d, Table 5) whilst the rank ����
order of median K* remains the same as for the more shallow depths, the differences ����
between the Acacia and Forest are much less. In addition there is greater dispersion ����
in K* for the both the Acacia and Forest in contrast to the Degraded Forest. Figure ����
5c and 5d also highlights the wide range of site geometric means under Acacia and ����
Forest supported by the larger 95% confidence intervals, as shown in Table 5. ����

ACCEPTED MANUSCRIPT � ��
This pattern maybe in part a reflection of the variability in permeability of the Red, ����
and even more so, the Laterite soils underlying the Forest and Acacia plantations. ���
Using the Degraded Forest as benchmark, the Acacia plantations over the Laterite ���
and Red soils are increasing K* in the surficial horizons (�0.1m depth). These ����
shallow depths are more directly affected by the incorporation of soil organic matter ����
and a reduction in human use and disturbance. Nonetheless the surface K* between ����
the Degraded Forest and Acacia plantations have the same order of magnitude ����
when compared the Forest (Table 5) linked with the land-use history (as described ����
above). This trend supports the ‘degraded scenario’ of the ‘infiltration trade-off’ ����
hypothesis. ����
����
In summary, the rank of median K* is Forest > Acacia plantations> Degraded Forest ���
for the upper soil layers (� 0.1m depth). At 0.6m and below, the above trends in the ���
median K* for each LC surprisingly remains the same (Table 5). The causes for the ����
persistence of higher permeability beneath the Acacia when compared to the ����
Degraded Forest however are inconclusive. ����
Two of the Teak plantations are associated with the Black soils (incorporated in ����
Figure 2 only and Table 4) where a low median value of K* (and associated ����
geometric mean K*) persists across all depths. This indicates these plantations have ����
no appreciable impact on K* over the Black soils, c.f. Acacia. ����
����
5.3.3 Inferred dominant stormflow pathways ���
���
Soil Groups ���
���

ACCEPTED MANUSCRIPT � ��
It is evident from both Figures 2a and 3a for the Black soils that the IDF ���
characteristics far exceed the entire range of K* at the surface and infiltration-excess ���
overland flow dominates. Further the IDF characteristics continue to far exceed all K* ���
(Figures 2b-d, 3b-3d,Table 4), at lower depths for this soil group as well. Thus ���
vertical percolation is limited. ���
���
Whilst most IDF characteristics are above the medians for the Red and Laterite soils ��
in Figure 2a (the 1 in 1 year is the exception for the Red soil group), there are still ��
many K* data which still exceed the 1 in 5 yr return period in the upper quartiles. The ���
site geometric means (Figure 3a) however, suggest such comments are only ���
confined to two Laterite sites and one Red. Most site geometric mean K* are below ���
the 1 in 1 year return period. Consequently for these two soils groups either IOF or ���
infiltration occurs, and more so IOF, when site rather than individual K* data are ���
considered. Such options occur in the Laterite and Red soils because of their ���
inherent, high variability in K*. Consequently IOF probably dominates in particular ���
where the lower quartile of K* in the box plot (Figure 2a) or the site geometric means ���
for the Laterite (Figure 3a) are on parity with the Black soils. At the other extreme, ��
the highest measured site K* in the survey (geometric mean K* ~ 250mmh-1 ) occurs ��
also in the Laterite group and thus favours VP (Figure 3a). ����
����
At 0.1 m depth (Figure 2b), all medians for the Red and Laterite soils are exceeded ����
by the IDF characteristics. Likewise only one Red site and two Laterite sites (Figure ����
3b) are above the 1 in 1 year return period. These data indicate that for the Red and ����
Laterite soils where infiltration prevails, a subsequent impedance to VP is possible at ����
0.1m. depth and thus SSF (and SOF and RF) may develop. On the other hand ����

ACCEPTED MANUSCRIPT � ��
taking into account the range of K* at the surface (discussed above), overall the ����
runoff generation process in these soil groups is complex. Three dominant ���
pathways (IOF, SSF and associated SOF+RF, VP) are all possible depending on ���
the point K* measured or the corresponding site geometric mean of K*. ����
At 0.6m and 1.5m all IDF characteristics exceed the median K* for the Red soils ����
(Figure 2c and 2d) and the site geometric means ( except one, Figure 5c, d ) despite ����
retaining a moderate permeability at depth. By contrast some K*, as represented in ����
the upper quartiles for the Laterite and Red soils , remain above the 1 in 1 year or 2 ����
year IDF. Thus in these circumstances VP is indicated except for the more extreme ����
rainfalls. ����
����
Land Cover ���
���
The IDF characteristics (Figure 4a) exceed the surface K* medians for both the ����
Degraded Forest and Acacia (but only marginally so for the latter). The exceptions ����
are the very highest K*, as represented by the upper quartiles of the Acacia. The ����
latter are reflected by two sites where the respective geometric mean K* are being ����
intersected by the 1 in 2 year return period line in Figure 5a. Overall these ����
circumstances suggest that IOF probably remains prevalent despite some recovery ����
in surface permeability associated with forestation. The exceptions are at the ����
mentioned two sites above, where infiltration is now indicated for the more frequent ����
rainfalls in response to the small to moderate amelioration of surface K* by the ���
Acacia. Not surprising infiltration is inferred in the Forest where the median K* ���
exceeds the more frequent extreme rain events (up to 1 in 2 years return period), but ����
not for events from 1 in 5 years upwards and so IOF is thus possible (Figure 4a). By ����

ACCEPTED MANUSCRIPT � �
contrast Figure 5a suggests IOF probably occurs at 2 sites (geometric mean K* < 1 ����
in 1 year return period of rainfall) whereas infiltration prevails even for return periods ����
greater than 50 years at another 2 sites. On the other hand, at 0.1m. depth the IDF ����
characteristics exceed the median K*,and also some of the geometric means of K* ����
for the Forest (Figures 4b,5b ). Consequently SSF (and SOF with RF) is suggested. ����
����
At the lower depths (0.6m and 1.5m) (Figure 4c and 4d) some K* in the upper ���
quartiles of the Acacia and Forest exceed the lower return periods of 1 in 1 year (and ���
2 year) and thus could facilitate VP. Likewise 2 sites each for these respective LCs ����
have geometric mean K* at or above the 1 in 2 year return period. For the most part, ����
however, K* are impeding to vertical water fluxes at these depths when compared to ����
the IDF characteristics. ����
����
Summary ����
����
In summary the overall picture is one of prevalent IOF over the Black soils during ����
extreme rainfalls, irrespective of land cover. At the highest end of the permeability ���
spectrum, IOF or SSF (and SOF and RF) may develop within some of the Red soils. ���
Nonetheless the large variability in K* within the Red soils, and even more so in the ����
Laterites (especially across the landscape), leads to up to three dominant pathways ����
(IOF, SSF and associated SOF+RF, VP) all being possible depending on the ����
individual point K* or site geometric mean of K* and the rain IDF. ����
����
For both the Degraded Forest and Acacia, IOF remains prevalent. A re-direction ����
from IOF to infiltration in two of the Acacia sites however was inferred in response to ����
ACCEPTED MANUSCRIPT � �
enhanced K* linked with that LC. Thus a movement towards the dominant stormflow ����
pathway identified with the Forest, that is, SSF (with SOF and RF) seems to be an ���
emerging scenario at the above Acacia sites. Paradoxically, Figure 5a suggests that ���
IOF could occur at two of the Forest Sites. ����
����
����
����
5.3.4. The temporal variability of the surface K* ����
����
����
Table 6 presents a comparison of one set of spot estimates for both the dry season ����
and the wet season respectively. ���
���
In spite of the very small sample sizes taken, most sites in Table 6 (dry season) ����
indicate log mean K* in the same order of magnitude as those used in the main data ����
set (Figures 2 and 3, Tables 4 and 5) which were also based on dry season ����
measurements. During the wet season, a decline in log mean K* by an order of ����
magnitude is evident especially at many of the sites with Laterite soils. For the ����
remaining soil groups, there is mostly a reduction in the absolute values of K*. A ����
consequence of this reduction is to increase the potential frequency of occurrence of ����
IOF much more than was suggested during the discussion of the larger data set. ����
���
The non parametric Mann-Whitney U Test was used for comparing the K* (as ���
presented in Table 6). After aggregating the K* from individual sites into two groups ���
(soil and land cover), the non parametric Mann-Whitney U Test was used to test for ���
differences in measured permeability between seasons. The amalgamation of sites ���
by soil group and land cover also has the advantage of increasing the sample sizes. ���
ACCEPTED MANUSCRIPT � ��
The exception was the Casuarina Plantation (site 5) which could only be considered ���
separately because it is the only site. ���
���
If a significance level of p=0.05 (two –tailed test) is adopted then the Black and ���
Laterite soils show differences between seasons at the p<0.01 level. Further the ��
Red soils are also prone to this phenomena (p=0.04), even though the associated ��
K* values (Table 6) suggest that these soils maybe more resilient to seasonal ���
disruption of the soil structure. ���
���
When the LC is considered, the Casuarina plantation (p= 0.25) and the Forest (p= ���
0.20) show no differences. For the Forest one might expect this result due to the ���
greater protective effect of the organic litter layer over the forest floor. All other LC’s ���
are different (p<0.05) between seasons. ���
���
When lumping all the data together by season, the box plot in Figure 6 highlights the ��
lowering in K* between the dry and wet season measurements. The average ��
reduction in K* is 61% when compared to the dry season test values, and the ����
corresponding non parametric Mann-Whitney U Tests confirm this reduction(p-����
value= 0.02 for the paired test and p-value=0.0235 for the lumped test). ����
����
6.0 DISCUSSION ����
To ensure that a proper comparison with other published materials, a more detailed ����
overview will be made. ����
Using the Forest cover over the Laterites (Eutric Nitosols and Acrisols) and Red ����
soils (Eutric Nitosols) as a baseline, the Degraded Forest shows an order of ���

ACCEPTED MANUSCRIPT � ��
magnitude decline in K* at the surface as result of human impacts at decadal to ���
century time scales. The profile of K* with depth however for this combined data set ����
does not show a progressive increase and then decrease within the subsoil ����
permeability for the Degraded Forest. This feature contrasts with other reports ����
elsewhere for converted forest to pasture) where surface compaction has led to the ����
highest K* being measured in the subsoil (Tomasella and Hodnett, 1996; ����
Zimmermannn and Elsenbeer, 2008. Rather, Table 5 for the Degraded Forest shows ����
a gradual decrease in K* with depth similar to that reported in Rondonia , Brazil by ����
Elsenbeer et al (1999) and elsewhere in Malaysia (Ziegler et al , 2006). Closer ����
inspection of the individual site data however, did detect that a minority of the K*- ���
depth profiles did show similar characteristics as reported in the above South ���
American studies. ����
����
This gradual decrease in K* with depth also makes it difficult to be conclusive at ����
what depth human pressure impacts on permeability terminate. In contrast a decline ����
in permeability up to about 0.20m depth (from cattle grazing) was noted in some of ����
the South American studies and elsewhere (Godsey and Elsenbeer, 2002; ����
Zimmermann et al, 2006; Hamza and Anderson (2005).The inclusion of two soils ����
groups in which the Laterite soils in particular have been shown to have a high ����
variability in K*, adds a further complication. Such aggregation of soils groups may ���
also account for the much lower subsoil K* below the Degraded Forest when ���
compared with the Forest. ����
����
The Acacia plantations over the Laterite and Red soils show an increase in K* at the ����
surface only. Such increases are in line with several other findings (Gilmour et al, ����

ACCEPTED MANUSCRIPT � ��
1987; Bruijnzeel, 2004; Holscher et al, 2004 ; Scott et al, 2004; Zimmermannn et al, ����
2006; Ilstedt et al, 2007). But in agreement with Gilmour et al (1987), the recovery ����
time required for these Acacia plantations to even approach the “background” ����
permeability of the Forests is still likely to take several decades. Further the ����
preceding “background” in permeability may never be achieved because of the ���
different soil ecology under monoculture plantations compared to less disturbed, old-���
growth forest (Rossi and Blanchart, 2005; Ashwini and Sridhar, 2008). ����
The above progressive recovery or lack of recovery of K* at the Acacia sites could ����
be linked to, and constrained by, changes in soil organic matter and the ability of ����
associated fauna to restore macro-pores and thus soil hydraulic properties (Lal, ����
1988; Giertz et al, 2005; Chazdon, 2008). In the Western Ghats the quantity and ����
quality of leaf-litter deposition, fine root biomass, as well as composition and ����
abundance of soil macro-fauna are all a function of forest type, climate and the ����
disturbance regime (Ashwini and Sridhar; 2008; Rossi and Blanchart, 2005; ����
Sundarapandian and Swamy, 1996, 1999; Blanchart and Julka, 1997). For example ���
the biomass of Pill millipedes Arthrosphaera was found to be sensitive to soil organic ���
matter compared to other soil properties (Aswini and Sridhar, 2008: Kadamannaya ����
and Sridhar, 2009). In addition soil macro-fauna (earthworms and millipedes) are ����
most abundant in less disturbed, old-growth forest when compared to pastures and ����
Acacia auriculiformes plantations (Rossi and Blanchart, 2005). The latter is an ����
argument for forestation using native species, but there are enormous silvicultural ����
challenges (Rai, 1999; Lamb et al, 2005). We therefore suggest that that it is the ����
intensity of forest use and effects of monoculture plantations on soil ecology that is ����
the critical factor. For example human activities in the Degraded Forest may have ����
reduced soil fauna. Further these activities indirectly may have reduced macro-���

ACCEPTED MANUSCRIPT � ��
porosity and hydraulic conductivity over time when compared to less-used and ���
disturbed native forests. ����
Significantly forestation with Teak plantations over the Black soils (Vertisols) has no ����
major impact on K* (geometric mean K*�5mmh-1 for all LCs and all depths). The ����
collection of leaf litter and regular burning during the dry season further prevents the ����
incorporation of organic matter in the Teak plantations. On the basis of the above ����
discussion, such activities will also reduce the influence of soil macrofauna and ����
macropore development on K* and thus minimise surface infiltrability (Hillel, 1980). It ����
is the inherent soil properties (physical and chemical) of the Black soils that ����
dominate K* rather than LC. The overall picture given for this soil group is then one ���
of consistent low permeability which is in line with other remarks for Vertisols ���
elsewhere (Costa, 1938 cited in Bruijnzeel, 2004). By contrast when concerning the ����
Kandiudults (an Acrisol) of Zimmermann et al (2006), they established a significant ����
increase in surface infiltrability within a Teak plantation (which was similar to other ����
LCs namely capoeira and banana) when compared to pasture. ����
When concerning inferred dominant stormflow pathways by soil type, IOF prevails ����
over the Black soils due to this soil group being at the lowest part of the permeability ����
spectrum. Further IOF is indicated for many of the IDF characteristics when ����
concerning selected Laterite and Red soils, despite the latter being at the most ����
permeable part of the K* spectrum. Overall however, the dominant stormflow ���
pathways are complex in both the Red, and even more so, the Laterite soils as a ���
result of the broad distribution of K*. All storm flow pathways (IOF, SOF, RF, SSF ���
and VP) are possible depending on the IDF. With regard to the Laterites, this is in ���
response to some K* being close to those of the Black soils and others to the Red ���
soil group, and it is therefore a very spatially varied and complex soil group. ���

ACCEPTED MANUSCRIPT � ��
���
When concerning land cover, IOF is even possible in some of the Forests over the ���
Laterites and for selected Red soils. Otherwise SSF (in combination with SOF and ���
RF) is suggested which is typical of ‘Acrisol-type’ soils from other work in humid ���
tropical forests (Elsenbeer and Vertessy, 2000; Elsenbeer, 2001; Bonell, 2004; ��
Chappell et al, 2007). By comparison, the reduction in surface K* within the ��
Degraded Forest is analogous with an ‘apparent’ upward translation to the surface of ���
the subsoil impeding layer of the Forest (Bonell, 1993; Ziegler et al, 2004; ���
Zimmermann and Elsenbeer, 2008). The result in an increase in the occurrence of ���
IOF within this degraded land cover under extreme rainfalls. These circumstances ���
support findings from other studies in South America and Asia (Chandler and Walter, ���
1998; Zhou et al, 2001; Costa et al, 2003; Ziegler et al, 2004; Chandler, 2006; de ���
Moraes et al, 2006; Cuo et al, 2008; Chaves et al, 2008; Mehta et al, 2008; ���
Zimmermann and Elsenbeer, 2008, 2009). On the other hand for selected rainfall ���
IDF, the SSF (and SOF+RF) pathway identified with the Forest remains still feasible ��
in the Degraded Forest as well. Thus for the latter LC, the runoff generation process ��
can be complex. Such findings emphasize the point that IOF does not automatically ���
occur as a result of long-term human impacts on surface K*. This issue was ���
highlighted in the studies of Godsey and Elsenbeer, (2002) and Zimmermannn et al, ���
(2006) where the Ferrasols and Acrisols (FAO, 1998) remained sufficiently resilient ���
to disturbance to retain SSF, supplemented by increases in SOF, as the dominant ���
pathway. ���
���
The inferred occurrence of IOF within the Acacia plantations over the degraded ���
Laterite and Red soils means that the surface K* still retains a ‘memory’ of the ��

ACCEPTED MANUSCRIPT � ��
previous LC in line with work in China by Zhou et al (2001). In the longer term, ��
however, it is these soil groups -plantation combination which potentially could ���
moderately change the dominant stormflow pathway from IOF towards SSF ���
(supplemented by SOF) in response to the recovery of surface infiltrability. The strip ���
charts indicated that such re-direction of stormflow might be already occurring at two ���
sites. Such changes are in line with the additional stormflow pathways suggested ���
elsewhere from forestation (e.g. SOF, SSF, RF; Godsey and Elsenbeer, 2002). In ���
contrast the inherent, low permeability at all depths within the Black soils (Vertisols) ���
results in IOF being the dominant stormflow pathway, irrespective of land cover or ���
forestation using Teak. ��
��
The above interpretations are based on dry season measurements when there is a ���
tendency for surface K* to be a higher order of magnitude at many soil sites in ���
contrast to measurements taken in the wet season. Consequently there is a ���
likelihood of IOF being more frequent in occurrence than suggested across all soils ���
and LC’s during the wet season.. ���
���
The fact that IOF is prevalent over the region however is a surprising result taking ���
into account that short-term rainfall intensities are not exceptional by humid tropics ���
standards (Bonell et al, 2004). Such low rain intensities are offset however by the ��
comparatively low K* across the region when placed in the global context (c.f. ��
Elsenbeer, 2001; Bonell, 2004; Chappell et al, 2007). These circumstances favour ���
the occurrence of IOF, in particular, at many of the disturbed LCs in line with the ���
conclusions of Putty (Putty and Prasad, 2000a, b; Putty, 2006), and elsewhere in a ���
disturbed, headwater basin in Benin (Giertz and Diekkruger, 2003). ���

ACCEPTED MANUSCRIPT � ��
���
Supplementary to addressing the questions of this investigation, some comments on ���
the relevance of the ‘infiltration – trade off’ hypothesis of Bruijnzeel (2004) as well as ���
linkages with climate change are included. ���
��
The changes in surface K* within the Acacia plantations over the Red and Laterite ��
soils indicate the early stages of a movement away from a ‘degraded scenario’ ���
(dominated by IOF) towards higher infiltration and potentially more recharge to deep ���
groundwater (i.e. the ‘non-degraded scenario’). With the Red soils being more ���
inherently permeable, such observations may apply less because of their “good ���
condition” status (Bruijnzeel, 2004). Moreover, the lower surface K* associated with ���
the Degraded Forests supports the ‘degraded scenario’ of the ‘infiltration – trade off’ ���
hypothesis. By contrast the 'infiltration-trade off’ hypothesis is not appropriate to the ���
Black soils due to the persistence of very low permeability across all depths and ���
LCs. Further from a forest - water management perspective, Teak does not really ��
improve recharge to groundwater by VP within the Vertisols. ��
���
Earlier Lal et al (2001) highlighted the predicted increase in rainfall and rainfall ���
intensities in the Western Ghats under existing climate change scenarios. ���
Subsequently the application of a high resolution model by Rajendran and Kitoh ���
(2008), projects a substantial and spatially heterogeneous increase in heavy rainfall ���
events over most parts of India including parts of the Western Ghats by the end of ���
the 21st Century. Taking into account such predicted increases in rainfall and rainfall ���
intensities, and our observations of the reduction in soil hydraulic conductivities ���
under wet-conditions, there could be potentially a further major shift in dominant ��

ACCEPTED MANUSCRIPT � ��
stormflow pathways. These would be from SSF and deep percolation towards a ��
greater occurrence of overland flow in the future. Such increases in overland flow will ���
enhance associated soil erosion in the Degraded Forests and over vulnerable soils ���
such as the Black Soil, as indicated by our study. Restoration of these highly ���
vulnerable soils and land covers, preferably using native or non-invasive species, for ���
sustaining hydrologic functions and associated services, and with the participation of ���
local stake-holders, should be a high priority in the next few decades. ���
���
7.0. CONCLUSIONS ���
��
��
i. The lowest surface permeability over the Laterite (Eutric Nitosols and ���
Acrisols) and Red soils (Eutric Nitosols) is associated with the Degraded ���
Forests. These characteristics lend support to the notion of a loss of macro-���
porosity due to enhanced compaction and a reduction in soil fauna from multi-���
decadal disturbance, as reported elsewhere in the humid tropics. Further ���
when combining the permeability data for all Degraded Forests over Laterite ���
and Red soils, there is a progressive decline in K* down the soil profiles. ���
There is no gradual increase and then decrease of K* with depth resulting ���
from long-term human pressure at the surface in contrast to reports from ��
selected other studies. ��
ii. Following forestation (~10 years) of degraded land using exotic Acacia ��
Auriculiformes plantations over the Red and Laterite soils, a small increase ��
in the surface permeability was detected. But the surface K* within these ��
plantations still remain low when compared to most of the less disturbed, ��
natural Forest. Thus the Acacia Plantations still retain a “memory” from the ��
previous degraded state linked with long-term, human occupancy as found in ��

ACCEPTED MANUSCRIPT � �
other studies. Such circumstances are accentuated by a slow recovery of the ��
soil fauna population linked with available organic matter in these production ��
forests. Significantly forestation with Tectona Grandis plantations (Teak) over �
the Black soils (Vertisols) has minimal impact on soil permeability. The �
collection of leaf litter and regular burning during the dry season within these ��
Teak plantations further prevents the incorporation of organic matter to ��
influence surface infiltrability. ��
iii. The Red soil sites have the most consistently high K* and the Black soils the ��
lowest. Thus when concerning intra-site variability in permeability for both the ��
Red and Laterite soils, all dominant storm flow pathways (IOF, SSF with SOF ��
and VP) can probably occur depending on the rainfall IDF characteristics ��
under consideration. However, the greatest inter-site variability in permeability ��
is shown by the Laterite soil group and thus the runoff generation process is �
more likely to be the most complex. Laterite soils therefore merit further �
investigation in terms of soil physical and chemical properties, mineralogy and ���
soil evolutionary characeteristics. The low permeability of the Black soils ���
favours IOF. ���
iv. The less disturbed, natural Forest has a dominant stormflow pathway typical ���
of ‘Acrisol –type’ soils (SSF supplemented by SOF) but IOF still remains ���
possible. The Degraded Forests and Acacia plantations over the over the ���
Laterite and Red soils are also probably dominated by IOF. But there are ���
already indications of a change in the dominant stormflow pathway in some of ���
the Acacia plantations from IOF towards SSF (with SOF) in response to a ��
detected recovery of surface permeability. With the Black soils (Vertisols) ��
being located at the lowest end of the K* spectrum, IOF dominates across all ���

ACCEPTED MANUSCRIPT � �
land covers connected with this soil type including forestation by Teak ���
plantations. Thus IOF is prevalent over the region and is a surprising finding ���
taking into account that short-term rainfall intensities are not exceptional by ���
humid tropics standards. Such low rain intensities are offset however by the ���
comparatively low K* across the region when placed in the global context. ���
Thus continued human –impact pressures leading to continued forest ���
degradation (e.g. from trampling, reduction in soil fauna, litter and soil organic ���
matter) will only enhance the occurrence of IOF in the future. ��
��
v. The above interpretations are based on dry season measurements when ���
there is a tendency for surface K* to have a higher order of magnitude at ���
many soil sites in contrast to spot measurements taken in the wet season. ���
Consequently there is a likelihood of IOF being more frequent in occurrence ���
across all soils and LC’s during the wet season than suggested when using ���
dry season data. ���
���
vi. We have demonstrated the potential for the ‘infiltration – trade off’ hypothesis’ ���
to be realized in this landscape under certain conditions of land degradation ��
and restoration and this needs to be tested with catchment hydrology data. ��
���
8.0. ACKNOWLEDGEMENTS ���
���
This work originated from a chance meeting between one of us (MB) and Dr.S.N Rai, ���
until recently Principal Chief Conservator of Forests, Karnataka Forest Department, ���
KFD, who encouraged this study. Strong appreciation is expressed to Dr Rai for ���

ACCEPTED MANUSCRIPT � ��
facilitating the site selection and arranging field logistic support through the KFD ���
Field station at Dharwad and to this Station’s Managers Sh. G.S. Kariyappa and Sh. ���
Jagat Ram, and their staff for reliably underpinning the logistics of this field survey ��
across very difficult terrain. In addition, within the National Institute of Hydrology we ��
received strong support and interest from Dr. G.C. Mishra and Dr.B.Soni, former ���
Scientists and former Directors of NIH, Roorkee Dr. S.M. Seth and Dr. K.D. Sharma, ���
and all the scientists and staff of Regional Centre, National Institute of Hydrology, ���
Belgaum. This work was also funded by allocations from the Regular Programme ���
budget of the UNESCO International Hydrology Programme from both Paris ���
Headquarters and the New Delhi Field Office. We thank Ford-Foundation for ���
additional financial support to enhance the data base. M.C. Kiran of the Ashoka ���
Trust for Ecology and the Environment (ATREE) assisted with preparation of the site ���
map and figures. ��
9.0 REFERENCES ��
Andreassian,V. 2004. Waters and forests: from historical controversy ���
���
to scientific debate. Journal of Hydrology 291, 1–27 ���
���
Ashwini, K.M., Sridhar, K.R., 2008. Distribution of pill millipedes (Arthosphaera) and ���
associated soil fauna in the Western Ghats and west coast of India. Pedosphere ���
18(6), 749 – 757. ���
���
Baker, F.G., 1978. Variability of hydraulic conductivity within and between nine ��
Wisconsin soil series. Water Resources Research. 14,103-108. ��

ACCEPTED MANUSCRIPT � ��
Bazemore, D. E., Eshleman, K. N., Hollenbeck, K. J., 1994. The role of soil water in ���
stormflow generation in a forested headwater catchment: synthesis of natural tracer ���
and hydrometric evidence. Journal of Hydrology 162, 47–75. ���
Blanchart, E., Julka, J.M., 1997. Influence of forest disturbance on earthworm ���
(Oligochaeta) communities in the Western Ghats (South India). Soil Biology and ���
Biochemistry 29(3-4), 303-306. ���
Bonell, M., 1993. Progress in the understanding of runoff generation dynamics ���
���
in forests. Journal of Hydrology 150, 217–275. ��
Bonell, M., 2004. Runoff generation in tropical forests. In: Bonell, M. and Bruijnzeel, ��
L.A. (Eds), Forests, Water and People in the Humid Tropics : Past, Present and ���
Future Hydrological Research for Integrated Land and Water Management, ���
UNESCO International Hydrology Series---Cambridge University Press : Cambridge, ���
U.K., pp. 314-406. ���
Bonell, M., Callaghan, J., Connor, G., 2004. Synoptic and mesoscale rain producing ���
systems in the humid tropics. In: Bonell, M. and Bruijnzeel, L.A.(Eds), Forests, Water ���
and People in the Humid Tropics - Past, Present and Future Hydrological Research ���
for Integrated Land and Water Management, UNESCO International Hydrology ���
Series---Cambridge University Press : Cambridge, U.K.,pp.194-266. ��
Bonell, M., and Williams, J., 1986. The two parameters of the Philip infiltration ��
equation: Their properties and the spatial and temporal heterogeneity in red earth of ��
tropical semiarid Queensland. Journal of Hydrology 87, 9-31. ��
Bonell, M., Gilmour,D.A., Cassells, D.S., 1983. A preliminary survey of the hydraulic ��
properties of rainforest soils in tropical north-east Queensland and their implication ��

ACCEPTED MANUSCRIPT � ��
ofor the runoff process. In: J.de Ploey (Ed.), Rainfall Simulation, Runoff and Soil ��
Erosion, Catena Supplement 4,pp. 57-78. ��
Bouwer, H., 1966. Rapid field measurement of air entry value and hydraulic ��
conductivity of soils as significant parameters in flow system analysis. Water ��
Resources Research 2, 729-738. �
Brooks, E.S., Boll, J., McDaniel, P.S., 2004. A hillslope-scale experiment to measure �
later saturated hydraulic conductivity. Water Resources Research 40, WO4208.doi ��
10.1029/2003WR002858.2004. ��
Bruijnzeel, L. A., 1989. (De)forestation and dry season flow in the tropics: A closer ��
look. Journal of Tropical Forest Science 1 (3), 229-243. ��
Bruijnzeel, L.A., 1990. Hydrology of Moist Tropical Forest and Effects of Conversion: ��
a State of Knowledge Review. UNESCO, Paris and Vrije Universiteit, Amsterdam, ��
The Netherlands, 226pp. ��
Bruijnzeel, L.A., 1996. Predicting the hydrological effects of land cover ��
transformation in the humid tropics: the need for integrated research. In: Gash, �
J.D.C., Nobre, C.A., Roberts, J.M. and Victoria, R.L. Eds., Amazonian Deforestation �
and Climate, , Wiley, Chichester, pp.15-55. �����
Bruijnzeel, L.A., 2004. Hydrological functions of tropical forest : not seeing the soil for �����
the trees ? Agriculture, Ecosystems and Environment104,185-228, �����
doi:10.1016/j.agee.2004.01.015. �����
Chambers, J. M., Hastie, T. J., 1992. Statistical Models in S, Wadsworth & �����
Brooks/Cole, Pacific Grove, California. �����

ACCEPTED MANUSCRIPT � ��
Chang, J.H., Lau, L.S.,1993. A definition of the humid tropics. In: Bonell, M., �����
Hufschmidt, M.M. and Gladwell, J.S.(Eds), Hydrology and Water Management in the �����
Humid Tropics- Hydrological Research Issues and Strategies for Water ����
Management, , UNESCO International Hydrology Series---Cambridge University ����
Press : Cambridge, U.K., pp. 571-574. �����
Chandler, D.G., Walter, M.F., 1998. Runoff responses among common land uses in �����
the uplands of Matalom, Leyte, Phillipines. Transactions of the American Society of �����
Agricultural Engineers 41(6), 1635-1641. �����
Chandler, D.G. 2006. Reversibility of forest conversion impacts on water budgets in �����
tropical karst terrain. Forest Ecology and Management 224, 95–103 �����
�����
Chappell, N.A., Lancaster, J.W., 2007. Comparisons of methodological uncertainties �����
within permeability measurements. Hydrological Processes 21,2504-2514, DOI ����
10.1002/hyp.6416.. ����
Chappell, N.A, Sherlock, M., Bidin, K., Macdonald, R. Najman, Y., Davies, G., 2007. �����
Runoff processes in Southeast Asia : role of soil, regolith, and rock type. In: �����
Swada,H., Araki, M., Chappell, N.A., LaFrankie, J.V. and Shimizu,A.(Eds.), Forest �����
Environments in the Mekong River Basin,. Springer-Verlag, Tokyo, pp. 3-23. �����
(Available from http://www.es.lancs.ac.uk/people/nickc/ChappellSherlocketal107.pdf) �����
Chaves, J., Neill, C., Germer, S., Neto, S.G., Krusche, A., Elsenbeer, H., 2008. �����
Land management impacts on runoff sources in small Amazon watersheds. �����
Hydrological Processes 22,1766-1775, DOI : 10.1002/hyp.6803. �����

ACCEPTED MANUSCRIPT � ��
Chazdon, R.L. 2008. Beyond Deforestation: Restoring Forests and Ecosystem ����
services on Degraded Lands. Science13, no. 5882, 1458 - 1460. ����
Chorley R.J, 1978. Glossary of Terms. In : Kirkby, M.J. (Ed.), Hillslope Hydrology, �����
Wiley : Chichester, UK, pp. 365-375. �����
Costa, C., 1938. Oppervlakkige afstrooming en erosie op Java ( Surficial runoff and �����
erosion on Java). Tectona 31,613-728 ( in Dutch and discussed in Bruijnzeel, 2004). �����
Costa, M.H., 2004. Large scale hydrological impacts of tropical forest conversion. In: �����
Bonell,M. and Bruijnzeel, L.A (Eds), Forests, Water and People in the Humid �����
Tropics : Past, Present and Future Hydrological Research for Integrated Land and �����
Water Management, UNESCO International Hydrology Series---Cambridge �����
University Press, Cambridge, U.K., pp. 590-597. ����
Costa, M.H., Botta, A., Cardile, J.A., 2003. Effects of large-scale changes in land ����
cover on the discharge of the Tocantins River, Amazonia. Journal of Hydrology 283, �����
206-217. �����
Cuo, L., Giambelluca, T.W., Ziegler, A.D., Nullet, M.A. 2008. The roles of roads �����
and agricultural land use in altering hydrological processes in Nam Mae Rim �����
watershed, northern Thailand. Hydrological Processes 22, 4339–4354, DOI: �����
10.1002/hyp.7039. �����
�����
de Moraes J.M., Schuler A.E., Dunne, T., Figueiredo, R.O., Victoria, R.L., 2006. �����
Water storage and runoff processes in plinthic soils under forest and pasture in ����
eastern Amazonia. Hydrological Processes 20, 2509–2526. ����

ACCEPTED MANUSCRIPT � ��
Drigo, R., 2004. Trends and Patterns of tropical land use changes. In: Bonell,M. and �����
Bruijnzeel, L.A (Eds), Forests, Water and People in the Humid Tropics : Past, �����
Present and Future Hydrological Research for Integrated Land and Water �����
Management, UNESCO International Hydrology Series---Cambridge University �����
Press, Cambridge, U.K., pp. 9-39. �����
Drigo, R., 2006. Overview of land cover change in tropical regions. In : Demuth, S., �����
Gustard, A., Planos, E., Scatena, F. & Servat, E., Eds., Climate Variability and �����
Change – Hydrological Impacts, Proc. International 5th FRIEND Conf., Havanna, �����
Cuba, IAHS Publication No. 308, pp. 672-678. ����
Elmqvist, T., Tuvendal, M., Krishnaswamy, J., ����
Hylander, K. 2010. Ecosystem Services: Managing trade-offs between provisioning �����
and regulating services. In: Kumar, P. and Mike Wood, M. (Eds), Valuation of �����
Regulating Services of Ecosystems: Methodology and Applications, Routledge �����
London and New York (in press). �����
Elsenbeer, H., 2001. Hydrologic flowpaths in tropical rainforest soilscapes - a review. �����
Hydrological Processes 15, 1751-1759. �����
Elsenbeer, H., Vertessy, R.A., 2000. Stormflow generation and flowpath �����
characteristics in an Amazoonian rainforest catchment. Hydrological Processes 14, �����
2367-2381. ����
Elsenbeer, H., Bradely, E., Newton, Dunne, T., Moraes, J.M., 1999. Soil hydraulic ����
conductivites of latosols under pasture,forest and teak in Rondonia, Brazil. �����
Hydrological Processes 13,1417-1422. �����

ACCEPTED MANUSCRIPT � ��
Elsenbeer,H., Cassel,K., Castro,J., 1992. Spatial analysis of hydraulic conductivity �����
in a tropical rainforest catchment, Water Resources Research 28, 3201-3214. �����
Eswaran, H., Lal, R., Reich, P.F., 2001. In: Bridges, E.M., Hannam, I.D., Oldeman, �����
L.R., Penning de Vries, F.W.T., Scherr, S.J.and Sombatpanit,S., Eds, Land �����
degradation : an overview. In: Response to Land Degradation, , Science Publishers �����
Inc, Enfield (NH),USA, pp.20-35. �����
FAO-UNESCO, 1974. FAO-UNESCO Soil map of the world. Vol. 1, legend, ����
UNESCO Press, Paris. Later revised as FAO-UNESCO (1988) Soil map of ����
the world. Revised legend. World Soil Resources Report 60, FAO, Rome. ����
FAO, 1998. World Reference Base for Soil Resources. FAO-UN, Rome. ����
Gadgil,S., Joshi, N.V.,1983. Climatic clusters of the Indian region. Journal of ����
Climatology 3, 47-63. ����
Gadgil,S., Gowri, R., Yadumani., 1988. Coherent rainfall zones: a Case study for ����
Karnataka. Proceedings of Indian Academy of Science (Earth Planet Science) 97 ����
(1) July, 63-79. ����
Geological Survey of India, 1981. Geological and Mineral Map of Karnataka and ����
Goa. Geological Survey of India. Calcutta. ���
Germer, S., Neill, C., Krusche, A.V., Elsenbeer, H. 2010. Influences of land-use ���
change on near-surface hydrological processes: Undisturbed forest to pasture. ����
Journal of Hydrology 380, 473-480. ����
Gilmour, D.A., 1977. Logging and the environment, with particular reference to soil ����
and stream protection in tropical rainforest situations. In : Kunkle, S.M. and Thames, ����

ACCEPTED MANUSCRIPT � ��
J.L., Eds., Guidelines for Watershed Management, FAO Consevation Guide No.1, ����
FAO, Rome, pp.223-235. ����
Giambelluca,T.W., 2002. Hydrology of altered tropical forest. Hydrological Processes ����
16, 1665-1669. ����
Giertz, S and Diekkruger, B. 2003. Analysis of the hydrological processes in a small ���
headwater catchment in Benin (West Africa). Physics and Chemistry of the Earth 28 ���
,1333- 1341. �����
Giertz, S., Junge, B., Diekkruger, B., 2005. Assessing the effects of land use change �����
on soil physical properties and hydrological processes in the sub-humid tropical �����
environment of West Africa. Physics and Chemistry of Earth Parts A/B/C 30(8-10), �����
485 – 496. �����
Gilmour, D.A., Bonell, M., Cassells, D.S., 1987. The effects afforestation on soil �����
hydraulic properties in the Middle Hills of Nepal : A preliminary assessment. �����
Mountain Research and Development 7,239-249. �����
Gish, T.J., Starr, J.L., 1983. Temporal variability of infiltration under field conditions. ����
In: Proc. Nat. Conf. on Advances in Infiltration, 12-13 Dec. 1983. Chicago, III Amer. ����
Sco. Agric. Engrs., St. Joseph, Mich., pp. 122-131. �����
Godsey, S., Elsenbeer, H., 2002. The soil hydrologic response to forest regrowth: A �����
case study from southwestern Amazonia. Hydrological Processes 16,1519-1522. �����
Grip, H., Fritsch, J.M., Bruijnzeel, L.A., 2004. Soil and water impacts during forest �����
conversion and stabilization to new land use. In: Bonell, M. and Bruijnzeel, L.A., �����
Eds., Forests, Water and People in the Humid Tropics. Past, Present and Future �����
Hydrological Research for Integrated Land and Water Management. , UNESCO �����

ACCEPTED MANUSCRIPT � �
International Hydrology Series--Cambridge University Press, Cambridge, U.K., pp. �����
561-589. ����
Gunnell, Y., 1997. Relief and climate in South Asia: The influence of the Western ����
Ghats on the current climate pattern of peninsular India. International Journal of �����
Climatology 17,169-1182. �����
Gunnell, Y., Radhakrishna B.P., 2001. Sahyadri : The Great Escarpment of the �����
Indian Subcontinent (Patterns of Landscape Development in the Western �����
Ghats). Geological Society of India, Bangalore, 1054 pp. �����
�����
Hamza, M.A., Anderson, W.K. 2005. Soil compaction in cropping systems �����
�����
A review of the nature, causes and possible solutions. Soil and Tillage Research 82, ����
����
121–145. �����
�����
Hewlett, J.D., Fortson, J.C., 1983. The paired catchment experiment. In:Hewlett, �����
J.D., Ed., Forest Water Quality University of Georgia, School of Forest Resources, �����
Athens, Ga., pp. 11-14. �����
Hillel, D., 1980. Fundamentals of Soil Physics. Academic Press : New York, USA. �����
413pp. �����
Holscher, D., Mackensen, J., Roberts, J.M., 2004. Forest recovery in the humid �����
tropics: changes in vegetation structure, nutrient pools and the hydrological cycle. In: ����
Bonell, M. and Bruijnzeel, L.A., Eds, Forests, Water and People in the Humid tropics ����
- Past, Present and Future Hydrological Research for Integrated Land and Water �����
Management, UNESCO International Hydrolo gy Series -Cambridge University �����
Press , Cambridge, U.K., pp. 598-621. �����

ACCEPTED MANUSCRIPT � �
Ilstedt, U., Malmer, A., Verbeeten, E., Murdiyarso, D., 2007. The effect of �����
afforestation on water infiltration in the tropics: A systematic review and meta-�����
analysis. Forest Ecology and Management 251, 45–51. �����
�����
Isbell, R.F., 2002. Australian Soil Classification, revd edn, Australian Soil and Land �����
Survey Handbook Series, Vol.4, Melbourne: CSIRO Publishing, 144pp. ����
Jourde, H., Fenart, P., Vinches, M., Pistre, S., Vayssade,B., 2007. Relationship ����
between the geometrical and structural properties of layered fractured rocks and �����
their effective permeability tensor. A simulation study. Journal of Hydrology 337, 117-�����
132. �����
Kadamannaya, B.S., Sridhar, K.R., 2009. Leaf litter ingestion and assimilation by two �����
endemic pill millipedes (Arthrosphaera). Biology and Fertility of Soils 45 , 761- 768 �����
Katiyar, V.S., 1990. The Indian Monsoon and its Frontiers. Inter India Publications : �����
New Delhi, 280 pp. �����
Karnataka Forest Department.1997. Western Ghats Forestry Project- Extract from �����
Independent Study of Implementation Experience in Kanara Circle. Bangalore KFD ����
Head Office : India 243pp. ����
Keller, C.K., Vanderkamp, G., Cherry, J.A., 1986. Fracture Permeability and �����
Groundwater-Flow in Clayey Till near Saskatoon, Saskatchewan. Canadian �����
Geotechnical Journal 23 (2), 229-240. �����
Keller, C.K., Vanderkamp, G., Cherry, J.A., 1988. Hydrogeology of 2 Saskatchewan �����
Tills. 1. Fractures, Bulk Permeability, and Spatial Variability of Downward Flow. �����
Journal of Hydrology 101 (1-4), 97-121. �����
�����

ACCEPTED MANUSCRIPT � ��
Khanna, L. S., 1996. Principles and Practice of Silviculture. Khanna Publishers : �����
Dehradun, India, 40 pp ����
Kothyari, U.C., Verma, S.K., Garde, R.J., 1990. Rainfall intensity duration frequency ����
analysis. Mausam 41(3), 483-486. �����
Lal, Murari., Nozawa, T., S. Emori, Harasawa, H., Takahashi, K., Kimoto, M., �����
Abe-Ouchi, A., Nakajima, T., Takemura, T., Numaguti, A. 2001. Future Climate �����
Change: Implication for Indian Summer Monsoon and its variability. Current Science �����
(81), 9,1196-1207. �����
Lal, R., 1987. Tropical Ecology and Physical Edaphology. New York, J.Wiley, 732pp. �����
Lal, R., 1988. Effects of macrofauna on soil properties in tropical ecosystems. �����
Agriculture, ecosystems and environment 24(1-3), 101 – 116. �����
Lamb D, Erskine P.D., Parrotta J.A. 2005 Restoration of degraded tropical forest ����
landscapes. Science 310, 1628- 1632. ����
Lele, S., 1993. Degradation, Sustainability, or Transformation: A case study of ����
villagers' use of forest lands in the Malnaad region of Uttara Kannada district, ����
India. Ph.D. Thesis, Energy & Resources Group, University of California, ����
Berkeley. ����
McIntyre, D.S., 1958a. Permeability measurements of soil crusts formed by raindrop ����
impact. Soil Sciience 85, 185-189. ����
McIntyre, D.S., 1958b. Soil splash and the formation of surface crusts by raindrop ����
impact. Soil Sciience 85, 261-266. ����
McKenzie, N.J., Cresswell, H.P., Green, T.W., 2002. Field measurement of ���
unsaturated hydraulic conductivity using tension infiltrometers. In : McKenzie, N., ���

ACCEPTED MANUSCRIPT � ��
Coughlan, K., Cresswell, H., Eds, Soil Physical Measurement and Interpretation for ����
Land Evaluation, CSIRO Publishing : Melbourne, pp. 119- 130. ����
McKenzie, N., Jacquier, D., Isbell, R., Brown, K., 2004. Australian Soils and ����
Landscapes : An Illustrated Compendium., Melbourne : CSIRO Publishing, 432pp. ����
Mackenzie, D.H., 2002. Field measurement of saturated hydraulic conductivity using ����
the well permeameter. In : McKenzie, N., Coughlan, K., Cresswell, H., Eds,, Soil ����
Physical Measurement and Interpretation for Land Evaluation, CSIRO Publishing : ����
Melbourne, pp. 131- 149. ����
Malmer, A., Murdiyarso, D., Bruijnzeel, L.A. ( Sampurno), Ilstedt, U. 2010. Carbon ���
sequestration in tropical forests and water: a critical look at the basis for commonly ���
used generalizations. Global Change Biology 16, 599–604, doi: 10.1111/j.1365-�����
2486.2009.01984.x �����
�����
�����
Mehta, V.K., Sullivan, P.J., Walter, T.M., Krishnaswamy, J., DeGloria, S.D. 2008. �����
Impacts of disturbance on soil properties in a dry tropical forest in Southern India . �����
Ecohydrology1 (2), 161-175. �����
Menon, S., Bawa, K.S., 1998. Deforestation in the tropics : reconciling disparities in �����
estimates for India. AMBIO 27, 576-577. ����
Millennium Ecosystem Assessment (2005) General Synthesis Report. Island Press, ����
Washington DC. �����
�����
Mott, J., Bridge, B.J., Arndt, W., 1979. Soil seals in tropical tall grass pastures of �����
Northern Australia. Australian Journal of Soil Research 17, 483-494. �����

ACCEPTED MANUSCRIPT � ��
NBSSLUP, 1993. Land Evaluation for Land Use Planning. Bull.No.42, National �����
Bureau of Soil Survey and Land Use Planning, Nagpur, India. �����
Nielson, D.R., Biggar, J.W., Erh, K.T., 1973. Spatial variability of field measured soil �����
water properties. Hilgardia 42(7),215-259. �����
Noguchi, S., Abdul Rahim, N., Kasran, B., Tani, M., Sammori, T., Morisada, K. ����
1997. Soil physical properties and preferential flow pathways in tropical rainforests, ����
Bukit Tarek, Peninsular Malaysia. Journal of Forest Research 2, 115-120. �����
Oliveira, J.B., Jacomine, P.K.T, Camargo, M.N., 1992. Classes gerais de solos do �����
Brasil: guia auxiliar para seu reconhecimento. Jaboticabal: FUNEP, 1992. 201pp. �����
Pascal, J.P., 1982. Bioclimates of the Western Ghats on 1/500,000, 2 sheets. �����
Institute francais de Pondichery, travaux de la Section Scientifique et technique, �����
Hors serie No.17. �����
Pascal, J.P., 1984. (with the collaboration of Shyam Sunder, S.& Meher – �����
Hornji,V.M.). Forest Map of South India- Sheet: Belgaum-Dharwar-Panaji. Published �����
by the Karnataka and Goa Forest Department and the French Institute of ����
Pondicherry. Inst. Fr. Pondichery, trav. Sec. sci. tech. Hors Serie 18c. ����
Pascal, J.P., 1986. Explanatory Booklet on the Forest Map of South India- Sheets : �����
Belgaum-Dharwar-Panaji ; Shimoga ; Mercara-Mysore. Karnataka Forest �����
Department and the French Institute of Pondicherry, Rapport Institut français �����
Pondichéry, trav.sec.sci.tech. Hors serie 18, India. �����
Pascal, J.P.,1988. Wet evergreen forests of the Western Ghats of India. Inst. fr. �����
Pondichery, trav. sec. sci. tech., Tome 20 bis, p.345. �����

ACCEPTED MANUSCRIPT � ��
Pereira, H.C., 1989. Policy and Practice of Water Management in Tropical Areas. �����
Westview Press, Boulder, CO, p.237. �����
Pereira, H.C., 1991. The role of forestry in the management of tropical watersheds. ����
In : Parde, J., Blanchard, D, ( Eds), Forests , A Heritage for the Future, Proc. 10th ����
World Forestry Congress, Paris, Sept.1991, Revue Forestiere Francaise, Hors Serie �����
No. 3, (Proc.3), ENGREF, F- 54042 Nancy Cedex, pp. 139-150. �����
Perroux, K.M., White, I., 1988. Designs for disc permeameters. Soil Science of �����
America Journal 52, 1205-1215. �����
Philip, J.R., 1985. Steady infiltration from spheroidal cavities in isotropic and �����
anisotropic soils. Water Resources Research 22, 1874-1880. �����
Pomeroy, M., Primack, R., Rai, S.N. 2003. Changes in four rainforest plots of the �����
Western Ghats, India, 1939 – 93. Conservation and Society 1, 113 – 135. �����
Pontius, R.G., Pacheco, P., 2004. Calibration and validation of a model of forest ����
disturbance in the Western Ghats, India 1920-1990. GeoJournal 61(4) , 325-334. ����
DOI 10.1007/s10708-004-5049-5. �����
Putty, M.R.Y., Prasad, V.S.R.K., Ramaswamy, R., 2000. A study of the rainfall �����
intensity pattern in Western Ghats, Karnataka. In: Varadan, K.M., Ed, Proc. �����
Workshop on Watershed Development in the Western Ghats Region of India, 28-29 �����
February 2000, Centre for Water Resources Development and Management, �����
Kozhikode- 673 571 : Kerala: pp. 44-51. �����
Putty, M. R. Y., Prasad, R., 2000a. Run off processes in head water catchment - An �����
experimental study in Western Ghats in South India . Journal of Hydrology 235, 63-�����
71. ����

ACCEPTED MANUSCRIPT � ��
Putty, M. R. Y., Prasad, R., 2000b. Understanding run off processes using a ����
watershed model - A case in the Western Ghats in South India. Journal of �����
Hydrology 228, 215-227. �����
Putty, M.R.Y., 2006. Salient features of the hydrology of the Western Ghats in �����
Karnataka. In : Krishnaswamy, J., Lele, S., and Jayakumar, R.,Eds, Hydrology and �����
Watershed Services in the Western Ghats of India. Tata-McGraw Hill Publication : �����
New Delhi, pp. 65-80. �����
Rai, S.N., 1999. Nursery and Planting Techniques of Forest Trees in Tropical South-�����
Asia. Punarvasu publications, Dharwad, Karantaka – Eastern Press, Bangalore, �����
India, 217pp. ����
Rai, N,D, 2004. The socio-economic and ecological impact of Garcinia gumm-gutta ����
fruit harvest in the Western Ghats, India. Forest Products, Livelihoods and �����
Conservation. Case Studies of Non-Timber Forest Product Systems. Volume 1-Asia. �����
Edited by Koen Kusters and Brian Belcher.. CIFOR, pp 23- 42. �����
Rajendran, K., Kitoh, A. 2008. Indian summer monsoon in future climate �����
projection by a super high-resolution global model. Current Science 95 (11), 1560 – �����
1569. �����
�����
Ramachandra, T.V, Kamakshi, G., Shruthi, B.V. 2004. Bioresource status in �����
Karnataka. Renewable and Sustainable Energy Reviews. 8,:,1-47. ����
����
Ramesh, B.R., Pascal, J., 1997. Atlas of Endemics of the Western Ghats (India): ����
Distribution of tree species in the evergreen and semi-evergreen forests. Institut ����
Francais de Pondichery, Publications du department d’ecologie, vol 38. ����

ACCEPTED MANUSCRIPT � ��
Ramesh, B.R., Swaminath, M.H., (with many collaborators), 1999. Assessment and ����
Conservation of Forest Biodiversity in the Western Ghats of Karnataka, India. French ����
Institute of Pondicherry in collaboration with the Karnataka Forest Department and ����
Fonds Français de l’Environnement Mondial, December 1999, Report available from ����
l’Insitut Français de Pondicherry : 126pp text plus bibliography, maps, colour plates, ����
5 Annexes. ���
Reynolds, W.D., Elrick, D.E., Topp, G.C., 1983. A re-examination of the constant ���
head well permeameter method for measuring saturated hydraulic conductivity ����
above the water. Soil Science 136, 250-268. ����
Reynolds, W.D., Elrick, D.E., Clothier, B.E., 1985. The constant head well ����
permeameter: Effect of unsaturated flow. Soil Science 139, 172-180. ����
Reynolds, W.D., Elrick, D.E. 1987. A laboratory and numerical assessment of the ����
Guelph Permeameter method. Soil Science 144 , 282-292. ����
Rogowski, A.S., 1972. Watershed physics: Soil variability criteria. Water Resources ����
Research 8, 1015-1023. ����
Rossi, J.P., Blanchart, E., 2005. Seasonal and land use induced variations of soil ���
microfauna composition in the Western Ghats, southern India. Soil Biology and ���
Biochemistry 37(6), 1093-1104 �����
�����
Safriel, U.N. 2007. The assessment of global trends in land degradation. In: �����
Sivakumar, M.V.K. and Ndiang’ui, Eds., Climate and Land Degradation, Springer, �����
pp 1 -38. �����
�����

ACCEPTED MANUSCRIPT � ��
Sandstrom, K., 1995. Forest and Water – Friends or Foes? Hydrological �����
Implications of Deforestation and Land Degradation in Semi-Arid Tanzania. Ph.D. �����
thesis, Loinkoping Studies in Arts andScience 120, Linkoping Univesity, S-581 83 ����
Linkoping, Sweden. 69pp+6 supporting manuscripts. ����
Sandstrom, K., 1996. Hydrochemical deciphering of streamflow generation in semi-�����
arid East Africa. Hydrological Processes 10, 703-720. �����
Sandstrom, K., 1998. Can forest “provide” water: Widespread myth or scientific �����
reality?, AMBIO 27, 132-138. �����
Schaak – Kirchener, H., Fenner, P.T., Hilderbrand, E.E., 2007. Different responses �����
in bulk density and saturated hydraulic conductivity to soil deformation by logging �����
machinery on a Ferrasol under native forest. Soil Use and Management 23, 286-293. �����
Scott, D.F., Bruijnzeel, L.A., Mackensen, J., 2004. The hydrological impacts of �����
reforestation of grasslands, natural and degraded and of degraded forest in the ����
tropics. In: Bonell,M., L.A. Bruijnzeel, Eds., Forests, Water and People in the Humid ����
Tropics : Past, Present and Future Hydrological Research for Integrated Land and �����
Water Management, UNESCO International Hydrology Series - Cambridge �����
University Press : Cambridge, U.K., pp. 622-651. �����
Seen, D.L., Ramesh, B.R., Nair, K.M., Martin, M., Arrouay, D. Bourgeon, G. 2010. �����
Soil carbon stocks, deforestation and land-cover changes in the Western Ghats �����
biodiversity hotspot (India). Global Change Biology 16, 1777–1792, doi: �����
10.1111/j.1365-2486.2009.02127.x �����
�����
����

ACCEPTED MANUSCRIPT � ��
Sharma, T.C., 1987. Modelling extreme rain sequences in Zambia. Journal of ����
Hydrology 93, 101-111. �����
Sherlock, M.D., Chappell, N.A., McDonnell, J.J., 2000. Effects of experimental �����
uncertainty on the calculation of hillslope flow paths. Hydrological Processes 14, �����
2457-2471. �����
Shivaprasad, C. R., Reddy, R. S., Sehgal, J., Velayutham, M., 1998. Soils of �����
Karnataka, Soils of India Series, National Bureau of Soil Survey and Land Use �����
Planning (NBSSLUP), Publ. No 47, 88pp. �����
Siegel, S. 1956. Nonparametric Statistics for the Behavioural Sciences. McGraw-�����
Hill, Tokyo, 312pp. ����
Singh, N., 1986. On the duration of the rainy season over different parts of India. ����
Theoretical and Applied Climatolology 37, 51-62. �����
Soil Survey Staff 1975 ( later 2nd edition 1999). Soil Taxonomy : A Basic System of �����
Soil Classification for Making and Interpreting Soil Surveys. US Department of �����
Agriculture Handbook No. 436 , 754pp. �����
Sundarapandian, S.M., Swamy, P.S., 1996. Fine root biomass distribution and �����
productivity under open and closed canopies of tropical forest ecosystems at �����
Kodayar in Western Ghats, South India. Forest Ecology and Management 86(1-3), �����
181-192. �����
Sundarapandian, S.M., Swamy, P.S., 1999. Litter production and leaf-litter ����
decomposition of selected tree species in tropical forests at Kodayar in the Western ����
Ghats, India. Forest Ecology and Management 123(2-3), 231-244. �����
ACCEPTED MANUSCRIPT � �
Talsma, T., 1969. In situ measurement of sorptivity. Australian Journal of Soil �����
Research 7 , 269-276. �����
�����
Talsma, T., 1987. Re-evaluation of the well permeameter as a field method for �����
measuring hydraulic conductivity. Australian Journal of Soil Research 25, 361-368. �����
�����
Talsma, T., Hallam, P.M., 1980. Hydraulic conductivity measurement of forest �����
catchments. Australian Journal of Soil Research 18, 139-148. ����
����
Tomasella, J., Hodnett, M.G., 1996. Soil hydraulic properties of an oxisol under �����
pasture in central Amazonia. In: Gash, J.H.C., Nobre, C.A., Roberts, J.M., Victoria, �����
R.L (eds), Amazonian Deforestation and Climate, Wiley : Chichester, UK., pp. 141-�����
146. �����
Topalidis, S., Curtis, A.A., 1982. The effect of antecedent soil water conditions and �����
rainfall variations on runoff generation in a small eucalypt catchment. In: O’Loughlin, �����
E.M., Bren, K.J., Eds., The First National Symposium on Forest Hydrology, �����
Melbourne. Vic. Institite of Engineers, Australia : Canberra, A.C.T., Australia, pp. 43-�����
49. ����
Uhlenbrook, S., 2006. Catchment hydrology – a science in which all processes are ����
preferential. Hydrological Processes 20, 3581-3585. DOI :10.1002/hyp.6564 �����
van Dijk, A. I.J.M. and Rodney J. Keenan, R.J. 2007. Overview - Planted forests and �����
�����
water in perspective. Forest Ecology and Management 251, 1–9. �����
�����

ACCEPTED MANUSCRIPT � �
Wiersum, K.F., (ed.) 1984. Strategies and Designs for Afforestation, Reforestation, �����
and Tree Planting. Proceedings of an International Symposium. �����
PUDOC :Wageningen, Netherlands. �����
����
Williams, J., Bonell, M, 1988. The influence of scale of measurement on the spatial ����
and temporal variability of the Philip infiltration parameters: an experimental study in ����
an Australian savannah woodland. Journal of Hydrology 104, 33-51. ����
Wooding, R.A. 1968. Steady infiltration from a shallow circular pond. Water ����
Resources Research 4, 1259-1273. ����
����
Zhou, G.Y., Morris, J.D., Yan, J.H., Yu., Z.Y., Peng, S.L., 2001. Hydrological impacts ����
of reafforestation with eucalypts and indigenous species: a case study in southern ����
China. Forest Ecology and Management 167, 209-222. ����
Ziegler, A.D., Giambelluca, T.W., Vana, T.T., Nullett, M.A., Fox, J., Tran, D.V., ���
Pitthong, J., Maxwell, J.F. Evett, S., 2004. Hydrological consequences of landscape ���
fragmentation in mountainous northern Vietnam: Evidence of accelerated overland ����
flow generation. Journal of Hydrology 287, 124-146. ����
Ziegler, A.D., Negishi, J.N., Sidle, R.C., Noguchi, S., Nik, A.R. 2006. Impacts of ����
logging disturbance on hillslope saturated hydraulic conductivity in a tropical forest in ����
Peninsular Malaysia. Catena 67(2), 89-104, doi:10.1016/j.catena.2006.02.008. ����
Ziegler, A.D., Giambelluca,T.W., Plondke, D., Leisz, S., Tran, L.T., Fox, J., Nullet, ����
M.A., Troung, D.M., Vien, T.D. 2007. Hydrological consequences of landscape ����

ACCEPTED MANUSCRIPT � ��
fragmentation in mountainous Northern Vietnam : Buffering of Hortonian overland ����
flow. Journal of Hydrology 337 (1-2), 52-67. DOI : 10.1016/j.jhydrol.2007.01.031. ���
Zimmermann, B., Elsenbeer, H., de Moraes, J.M., 2006. The influence of land-use ���
changes on soil hydraulic properties : Implications for runoff generation. Forest �����
Ecology and Management 222, 29-38. �����
Zimmermann, B., Elsenbeer, H. 2008. Spatial and temporal variability of saturated �����
hydraulic conductivity in gradients of disturbance. Journal of Hydrology 361 (1-2), 78-�����
95. �����
�����
Zimmermann, B., Elsenbeer, H. 2009. The near-surface hydrological �����
consequences of:disturbance and recovery: a simulation study. Journal of Hydrology �����
364 (1-2), 115-127.�����
����
�����
�����
�����
�����
�����
�����
�����
�����
����
����
�����
�����

ACCEPTED MANUSCRIPT � ��
�����
�����
�����
�����
FIGURE CAPTIONS HYDROL9755 (Bonell et al) �����
�����
FIGURE 1. The Study Area. Highlighted are i) the three Blocks (Coastal, mid-Ghat, ����
Up-Ghat), ii) the soil-land cover sites and iii) the network of continuous rainfall ����
recorders. �����
FIGURE 2. The box plots of K* by Soil Type for a) Surface b) the 0.1m depth c) �����
0.6m depth and d) 1.5m depth and the rainfall intensities (mmh-1) for the 15 minutes �����
duration for the selected return periods (1 in 1 year, 2 years, 5 years, 10 years, 25 �����
years, and 50 years). �����
FIGURE 3. Strip charts of the geometric mean K* by Soil Type for a) Surface b) the �����
0.1m depth c) 0.6m depth and d) 1.5m depth and the rainfall intensities (mmh-1) for �����
the 15 minutes duration for the selected return periods (1 in 1 year, 2 years, 5 years, �����
10 years, 25 years, and 50 years). The soil types are Black, Laterite (Lat) and Red. ����
Jittering has been used to enable similar valued or coincident data points to be ����
viewed clearly. �����
�����
FIGURE 4. The box plots of K* by Land Cover with sampling replicates only ( i.e., �����
excluding the LCs over the Black soils and the Casuarina Plantation) for a) Surface �����
b) the 0.1m depth c) 0.6m depth and d) 1.5m depth and the rainfall intensities (mmh-�����
1) for the 15 minutes duration for the selected return periods. �����
FIGURE 5. Strip charts of the geometric mean K* by Land-cover for a) Surface b) the �����
0.1m depth c) 0.6m depth and d) 1.5m depth and the rainfall intensities (mmh-1) for �����
the 15 minutes duration for the selected return periods (1 in 1 year, 2 years, 5 years, ����
10 years, 25 years, and 50 years). The land-cover types are Acacia, Degraded (Deg) ����
and Natural forest (For). Jittering has been used to enable similar valued or �����
coincident data points to be viewed clearly. �����
�����
FIGURE 6. The box plots of K*sampled at the surface at 15 sites for i) the dry and ii) �����
the wet seasons respectively. �����
�����
������
�����

ACCEPTED MANUSCRIPT

ACCEPTED MANUSCRIPT

ACCEPTED MANUSCRIPT

ACCEPTED MANUSCRIPT

ACCEPTED MANUSCRIPT
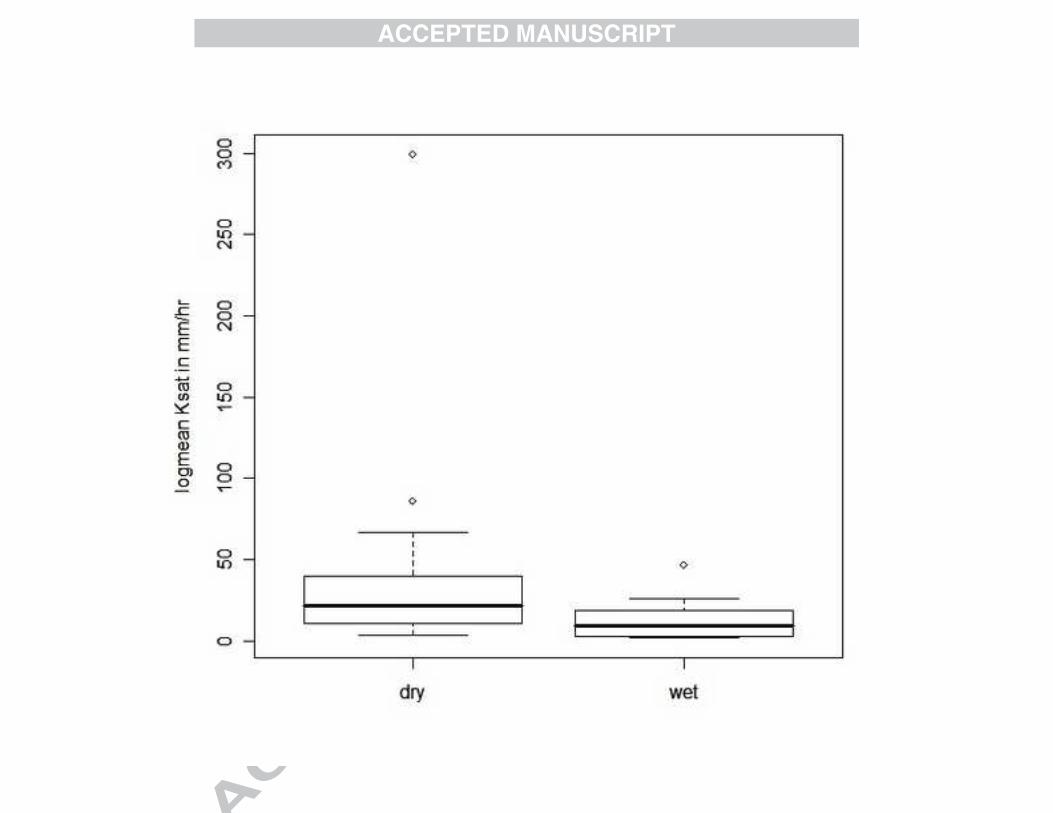
ACCEPTED MANUSCRIPT

ACCEPTED MANUSCRIPT
TABLE 1 The sample sizes of K* for each soil group
Sample sizes by depth
surface 0.1m 0.60m
Soil Group
Black 22 17 16
Laterite 57 47 45
Red 87 75 56

ACCEPTED MANUSCRIPT
TABLE 2 The sample sizes of K* for each soil group land cover (sub-set of replicate land covers)
Sample sizes by depth
surface 0.1m 0.60m
Land Cover
Forest 46 46 39
Acacia 44 36 31
Degraded 55 45 37
Forest

ACCEPTED MANUSCRIPT
TABLE 3: The Rainfall Intensity-Duration- Frequency (IDF). Estimates using the method of Sharma (1987)
of Rainfall Intensity (in mmh-1
equivalent)-Duration and Frequency (selected return periods are given) for
the entire region.
Entire Region with
station names Duration
Return Periods
1 yr 2 yr 5 yr 10 yr 25 yr 50 yr 75 yr 100 yr
15 min 49.15 56.65 79.86 95.23 114.65 129.06 137.43 143.36
30 min 38.00 43.52 60.59 71.89 86.17 96.76 102.92 107.28
45 min 30.92 35.84 51.07 61.16 73.90 83.35 88.85 92.73
1 hr 25.83 29.80 42.08 50.21 60.48 68.10 72.52 75.66
(12 raingauges, 2 hr 17.42 20.06 28.24 33.65 40.49 45.56 48.51 50.60
Kumta, Hattikeri,
Bhatkal,Sirsi, Yellapur,
Joida,
Siddapur,Barchi,Mundgod,
Bachaniki, Dharma,
Haliyal
3 hr 14.37 16.39 22.63 26.77 31.99 35.87 38.12 39.72
4 hr
12.27 14.19 20.13 24.06 29.03 32.72 34.86 36.37
5 hr 10.81 12.41 17.35 20.62 24.76 27.82 29.61 30.87

ACCEPTED MANUSCRIPT
Table 4. Comparisons of plot averaged (geometric) hydraulic conductivities, K*
between soil groups at different depths. The medians (in bold) and corresponding 95 %
confidence intervals about medians, constrained to zero on lower bound are shown. The
number of sites is shown as n.
Depth Black, n=4 Laterite, n=12 Red, n=7
0 4.685, 3.658-5.712 22.69, 5.408-39.971 35.5, 27.761-43.239
0.1 4.180, 0.566-7.794 15.87, 0-32.171 35.64, 30.026-41.253
0.6 3.74, 0-11.785 11.465, 0-28.836 29.3, 14.379-44.221
1.5 2.275, 0-5.214 9.305, 0-26.792 17.36, 1.994-32.725

ACCEPTED MANUSCRIPT
Table 5. Comparisons of plot averaged (geometric) hydraulic conductivities, K*
between land-covers at different depths. The medians (in bold) and corresponding 95
% confidence intervals about the medians, constrained to zero on lower bound are
shown.
Depth Degraded Forest n=7 Acacia n=5 Undisturbed Forest n=5
0 15.88, 7.337-24.423
43.93, 26.816-61.043
107.11, 26.445-187.775
0.1 5.640, 0-13.424 35.64, 19.487-51.793 40.37, 27.757-52.983
0.6 5.55, 2.489-8.611 15.88, 0-53.167 30.90, 0-72.582
1.5 1.920, 0.352-3.488 11.94, 0-53.537 22.70, 0-57.585

ACCEPTED MANUSCRIPT
DRY SEASONSite Sation Soil Type Land coverNumber of K* mmh-1
Number Name samples
Log mean Range
14 Barchi Black OGF 4 6.64 4.75-13.93
17 Jenmuri Black T 3 11.19 7.8-13.93
15 Kuligi Black OGF 4 3.64 2.20-5.50
18 Thattihalla Black T 4 9.71 7.06-22.80
6 Anabebail Lateritic DF 4 13.92 5.70-72.20
11 Patoli Lateritic OGF 4 299.26 256.0-367.30
1 Anthrahalli Lateritic AcP 4 33.75 23.70- 48.30
2 KolagibeesLateritic AcP 4 67.15 55.50-88.81
7 Talagadde Lateritic DF 4 7.1 3.60-14.50
3 Hattikeri Lateritic AcP 4 85.43 64.40-104.70
8 Urothota Lateritic DF 4 21.64 12.70-34.23
9 Yettinabail Lateritic DF 4 13.1 9.90-17.15
5 Siddapur Red CP 4 30.57 21.40-53.75
13 Dodmane Red OGF 4 34.71 25.76-39.90
16 Yellapur Red T 4 44.91 24.70-84.70
Key: OGF Old Growth Forest
DF Degraded forest
AcP Acacia Plantation
CP Casuarina Plantation
T Teak Plantation
TABLE 6 A COMPARISON OF THE SURFACE HYDRAULIC CONDUCTIVITY BETWEEN DRY AND WET SEASON MEASUREMENTS AT SELECTED SITES