Embed Size (px)
Citation preview

Available online at www.ijournalse.org
Emerging Science Journal
Vol. 4, No. 4, August, 2020
Page | 228
The Impact of Foreign Direct Investment on Unemployment:
Panel Data Approach
Mustafa Alalawneh a, b*
, Azizun Nessa c
a PhD Student, Business School, Economic Department, Middlesex University, London, United Kingdom
b Economic Department, Khazar University, Baku 1009, Azerbaijan
c Professor, Business School, Economic Department, Middlesex University, London, United Kingdom
Abstract
The purpose of this study was to investigate the impact of foreign direct investment on
unemployment in six countries in the Middle East and North Africa, Egypt, Jordan, Lebanon,
Morocco, Tunisia, and Turkey, as this region is considered one of the most regions in the world with
a high rate of unemployment. The study employed panel data for the period from 1990 to 2018,
where three economic models were used to examine the impact of FDI on unemployment, male
unemployment, and female unemployment, in the long run, using the Fixed Effect Model (FEM)
and Random Effect Model (REM), in addition to finding the causal relationship in the short term
using Panel VAR (Granger causality tests). The results showed that FDI reduces the unemployment
rate, the male unemployment rate, and the female unemployment rate in the long run. The results of
the study also revealed that there is no causal relationship in the short term between FDI and
unemployment in its various forms, while there is a bidirectional causal relationship between FDI
and exports according to the three economic models. This paper is the first of its kind in terms of
examining the effect of FDI on unemployment in the six countries as a grouped and a sample of the
MENA region.
Keywords:
Foreign Direct Investment;
Unemployment Rate;
Panel Data;
Granger Causality;
MENA.
Article History:
Received: 20 May 2020
Accepted: 29 July 2020
Published: 01 August 2020
1- Introduction
The unemployment problem is currently one of the most important challenges facing the countries of the world
with different levels of progress in their economic, social, and political systems. And also considered one of the most
important features of the global economic crisis is the increase of unemployment rates, as this problem is in both
developed and developing countries, so we find that unemployment rates Distributed throughout the world [1]. Many
economic studies and theories have sought and attempted to explain this phenomenon and know its causes and
consequences, and reducing its rates was one of the most important priorities of decision-makers and economic and
social policy theorists [2].
Classical and neoclassical economic theories only recognize voluntary and frictional unemployment, while
Keynesian theory recognizes the existence of another type of unemployment that is compulsory unemployment which,
according to the opinion of its pioneers, is due to insufficient aggregate demand for goods and services, while the
modern theories show that the main cause of unemployment is the presence of imbalances On the labor market [3].
The interdependence between foreign direct investment and aspects of the labor market is an important topic in the
economic literature on the study of foreign direct investment and its impact on unemployment. There are many
hypotheses and assumptions that foreign direct investment works to achieve economic savings for workers in the form
* CONTACT: [email protected]
DOI: http://dx.doi.org/10.28991/esj-2020-01226
© 2020 by the authors. Licensee ESJ, Italy. This is an open access article under the terms and conditions of the Creative Commons Attribution (CC-BY) license (https://creativecommons.org/licenses/by/4.0/).

Emerging Science Journal | Vol. 4, No. 4
Page | 229
of increasing their real wages and increasing their productive capabilities, through training the workforce in advanced
techniques and technical means to raise production efficiency [4]. In addition to that, foreign investments will increase
the state's tax revenues, which in turn will lead to increased government spending and local investments, the creation
of new job opportunities, the stability of seasonal employment, and the creation of labor-intensive projects that are
characterized by the use of modern technology and thus the creation and diversification of new job opportunities [5].
Also, one of the indirect effects of foreign direct investment is to limit the brain drain, competencies and capital by
preserving these productive factors from workers and capital to work with the investor in the home country instead of
leaving the national economy [6].
Some other hypotheses show that foreign direct investment plays an important role in reducing the problem of
unemployment through a direct impact in increasing employment opportunities in complementary front and back
industries, but this effect is largely dependent on the way investment is established, if it is foundational it will
undoubtedly create new work opportunities, while in the case of mergers and acquisitions, this type of investment may
lead to an increase in the unemployment rate, given the new company’s attempt to lay off some workers due to the
technology used or replacing local workers with foreigners, where this effect is related to the sector in which the
foreign investor invests, for example, foreign direct investment in the services sector may not create job opportunities
such as the industrial sector, which is considered a labor-intensive work [7].
Government policies to reduce unemployment rates focus on economic growth and assume that an increase in it
leads to an increase in the employment rate. In a study considered the first of its kind, American economist Arthur
Okun was able to determine the relationship between changes in the production gap and changes in unemployment
rates, wherein 1962, through his analysis of American data between 1947-1960, he showed the dynamic relationship
between economic growth and unemployment, and was found during Those years are that when the difference
between GDP and potential GDP declines to three points, unemployment decreases by one point. This relationship is
called the Okun's law, with each 3% rise in GDP offset by a one percentage point decrease in the unemployment rate
[8]. However, country studies have shown that the value of Okun’s law varies from country to country, and the
adoption of different methodologies in building statistics also leads to a difference in assessing the strength of the
relationship, as subsequent studies indicated that growth was less than what Okun found sufficient to reduce
unemployment by One point in some countries, and in others, requires more than 3% growth to reduce unemployment
by one point [9].
The countries of the Middle East and North Africa, like other developing countries, suffer from several economic
imbalances and development challenges; the most important of them is the reduction of the unemployment problem.
These countries seek to attract foreign direct investment as one of the solutions to raise economic growth in them and
increase exports and reduce unemployment. This study examined six countries from the Middle East and North Africa,
namely Jordan, Lebanon, Egypt, Tunisia, Morocco and Turkey. These countries share a set of characteristics, the most
important of which are developing and non-oil exporting countries and seek to attract foreign direct investment as one
of the alternative solutions to external borrowing and solve the problem of increasing unemployment rates, and they
are among the countries that take serious steps towards economic openness and provide many exemptions and
incentives to attract foreign investment especially the foundational ones. In addition, all of these countries are
members of the Organization of Islamic Cooperation and have been characterized by economic and political stability
in the past three decades, and these countries are similar in their interest in human capital and export of qualified
workers abroad, especially to the Arab Gulf countries, and because of the common factors in these countries, the study
assumes that the effect of Foreign direct investment on unemployment will be close and similar.
The study relies on its importance as it is the first of its kind in studying the impact of foreign direct investment on
unemployment in these countries and using the panel data approach for the period between 1990 and 2018. What
distinguishes this paper from other is that it combines an investigating the relationship between the study variables, In
the long run, using the various effect models (Common, Fixed, Random), and also finding Granger causality in the
short term using Vector Auto-Regressive model (VAR), and applying the Okun's Law to estimate the relationship
between unemployment and economic growth in each of the six countries.
2- Literature Review
Many economists believe that FDI inflows can affect the unemployment rate and decline it in the host country, like
Tegep et al. (2019) [10] aimed to discover and test macroeconomic variables that can mediate the relationship between
Foreign Direct Investment (FDI) and the unemployment rate in Indonesia. Employing an integrated alternative model
using macroeconomic variables as mediating factors, it used path analysis to test panel data from 36 Indonesian
provinces within 17 years (422 observations). In order to calculate inter-variables direct effects, it employed a
bootstrapping method. This study successfully found that gross domestic product (GDP) and provincial minimum
wage can directly mediate FDI and reduce the unemployment rate. On the other hand, domestic investment and the
number of workforces cannot mediate the relationship between FDI and the unemployment rate. These results confirm

Emerging Science Journal | Vol. 4, No. 4
Page | 230
that the relationship of FDI with unemployment is negative and indirect and FDI cannot explain the change in the
unemployment rate without using economic growth and the minimum wages as intermediating variables.
Johnny et al. (2018) [11] studied the impact of FDI on the unemployment rate in Nigeria from 1980 to 2015. The
study revealed that: There is a negative and significant relationship between FDI and the unemployment rate, and there
is a positive and significant relationship between capital formation and the unemployment rate. Based on the results,
the study recommended that the government should implement policies that improve the investment climate in Nigeria
and also ensure that all resources for productive activities are fully utilized before entering into any form of savings.
Balcerzak and Żurek (2011) [4] study analyzed the correlation between foreign direct investment and the
unemployment rate in the Polish labor market, the study used VAR methodology on quarterly data for the period from
1995 to 2011. The study showed that foreign direct investment led to a decrease in the unemployment rate in Poland in
the short-term, and the study recommended the need to reform government policies that would attract foreign direct
investment and create conditions for a positive impact in the long term.
Irpan et al. (2018) [12] focused on the impact of FDI on the employment rate in Malaysia. Other factors such as the
number of foreign workers, gross domestic product (GDP), and exchange rate (EXCR) were also included in the
study. Data used in the study is annual data spanning from 1980 to 2012. The autoregressive distributed lag (ARDL)
model was used to determine the long-run relationship between the variables. The study found that FDI and GDP
significantly influence and reduce the unemployment rate in Malaysia.
According to Dritsakis and Stamatiou (2018) [13] study which examined the causality relationships between
foreign direct investments, exports, unemployment, and economic growth in the fifteen old EU members using panel
data covering the period 1970-2015. Fixed Effect model was applied in order to estimate the panel VAR equations for
Granger causality tests. The results revealed three bidirectional causalities between economic growth and exports,
exports and FDI, and exports and unemployment and three unidirectional causalities running from FDI to economic
growth, FDI to unemployment, and from economic growth to unemployment.
However, other economists have a passive view of the effect of foreign direct investment on the unemployment
rate in the host country in terms of the lack of an evident effect on unemployment or causing its rate to rise, such as
Grahovac and SoftićIn (2017) [14] examined the correlation between global unemployment rates and flows of FDI in
the Western Balkan countries and presented comparative analysis with chosen countries during the period from 2000
to 2014. The analysis showed that since 2009, there was a significant reduction of net investments, which is more
obvious in the case of FDI due to a lower domestic and external demand as a result of the global economic crisis that
led to a decreasing number of employees and rising unemployment. Results, also, showed the absence of a positive
impact of FDI on employment, which was present in most CEE countries during the transition period, as shown in
numerous empirical studies.
Igant (2016) [15] empirically investigated if international trade has an impact on aggregate unemployment in the
presence of labor market institutions. Using data for twenty OECD countries for the years 1961-2008, this study found
that an increase in trade leads to higher aggregate unemployment as it interacts with rigid labor market institutions,
whereas it may reduce aggregate unemployment if the labor market is characterized by flexibility. The study showed
that in a country with an average degree of the labor market rigidities, an increase in trade has no significant effect on
unemployment rates.
Omar Mohammad (2018) [16] used the analysis of the vector autoregressive model (VAR), to examine the
relationship between foreign direct investment and unemployment in Sudan for 1990-2016. The study concluded that
the FDI volume does not affect the unemployment rate, and that unemployment is not attracting FDI in Sudan.
Stamatiou and Dritsakis (2014) [17] study, which aimed to investigate the relationship between exports, foreign
direct investments (FDI) and economic growth in five Eurozone countries (Greece, Portugal, Ireland, Spain, and Italy)
using panel data for the period 1970 to 2011. The panel data causality results revealed that there is bidirectional
causality between exports and economic growth, while there is no causality between economic growth and FDI nor
between FDI and exports.
According to Bayar (2014) [18] examined the relationship between unemployment, economic growth, export, and
foreign direct investment inflows in Turkey during the period of 2000:Q1-2013: Q3 by using bound testing approach
based on autoregressive distributed lag. The study found that there was a long-run relationship between
unemployment, economic growth, export, and FDI inflows. Moreover empirical findings demonstrated that economic
growth and export undermine the unemployment rate, while FDI boosts it.
While reviewing previous studies in the literature, it can be understood that there are several different studies that
focus on the impact of FDI on Unemployment, some of these studies used time series data and the others used cross
sectional panel data. In addition to this situation, it is also identified that many different methodologies are considered
in these studies, such as vector error correction, autoregressive distributed lag, generalized method of moment, cross-
Emerging Science Journal | Vol. 4, No. 4
Page | 231
section common effect model, cross-section fixed effect model, panel VAR (causality) and so on. However, it is
determined that there is a rare study that considers the leading the impact of FDI on Unemployment for MENA
countries (maybe the first of its kind examined this region).
Findings are different across studies so it can't be ascertained how FDI affects unemployment in MENA countries.
More so when no study actually looked at these countries separately, a new study that covers this region will be very
beneficial to the literature. In general, from the researcher's point of view, the relationship between FDI and
Unemployment differs from country or region to another based on the economic structure of the countries, type of
received foreign direct investment in host countries, and also, from period span to another.
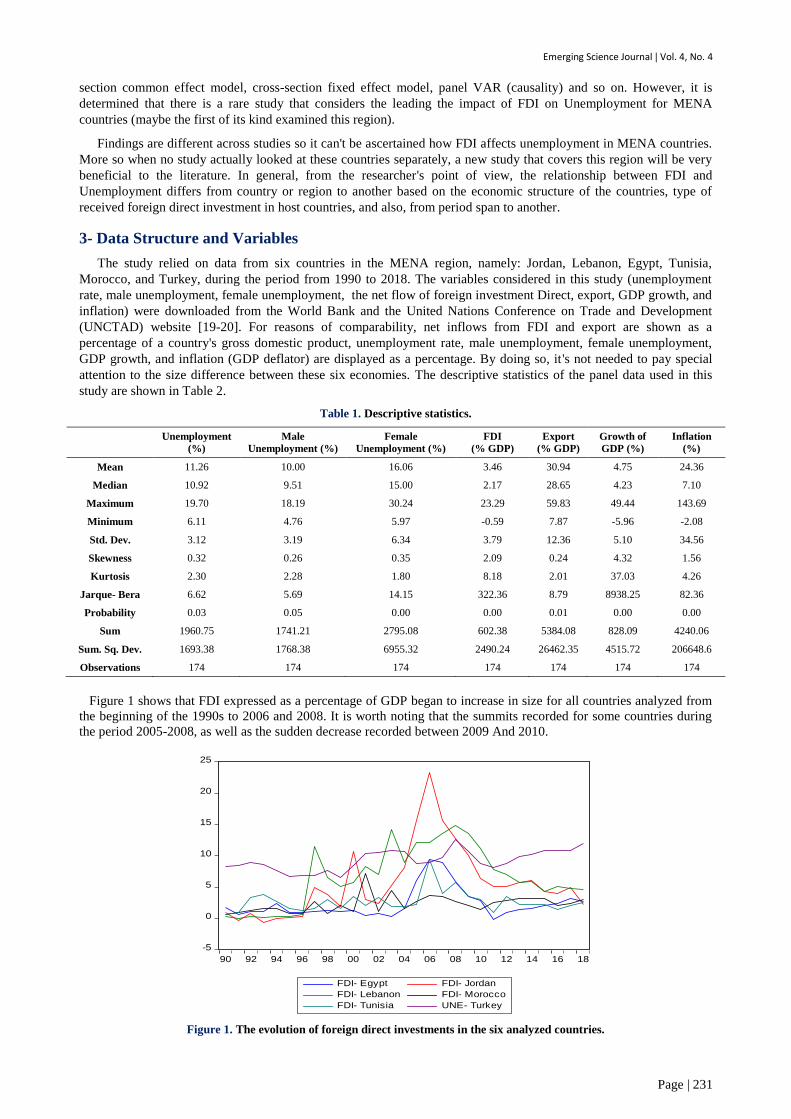
3- Data Structure and Variables
The study relied on data from six countries in the MENA region, namely: Jordan, Lebanon, Egypt, Tunisia,
Morocco, and Turkey, during the period from 1990 to 2018. The variables considered in this study (unemployment
rate, male unemployment, female unemployment, the net flow of foreign investment Direct, export, GDP growth, and
inflation) were downloaded from the World Bank and the United Nations Conference on Trade and Development
(UNCTAD) website [19-20]. For reasons of comparability, net inflows from FDI and export are shown as a
percentage of a country's gross domestic product, unemployment rate, male unemployment, female unemployment,
GDP growth, and inflation (GDP deflator) are displayed as a percentage. By doing so, it's not needed to pay special
attention to the size difference between these six economies. The descriptive statistics of the panel data used in this
study are shown in Table 2.
Table 1. Descriptive statistics.
Unemployment
(%)
Male
Unemployment (%)
Female
Unemployment (%)
FDI
(% GDP)
Export
(% GDP)
Growth of
GDP (%)
Inflation
(%)
Mean 11.26 10.00 16.06 3.46 30.94 4.75 24.36
Median 10.92 9.51 15.00 2.17 28.65 4.23 7.10
Maximum 19.70 18.19 30.24 23.29 59.83 49.44 143.69
Minimum 6.11 4.76 5.97 -0.59 7.87 -5.96 -2.08
Std. Dev. 3.12 3.19 6.34 3.79 12.36 5.10 34.56
Skewness 0.32 0.26 0.35 2.09 0.24 4.32 1.56
Kurtosis 2.30 2.28 1.80 8.18 2.01 37.03 4.26
Jarque- Bera 6.62 5.69 14.15 322.36 8.79 8938.25 82.36
Probability 0.03 0.05 0.00 0.00 0.01 0.00 0.00
Sum 1960.75 1741.21 2795.08 602.38 5384.08 828.09 4240.06
Sum. Sq. Dev. 1693.38 1768.38 6955.32 2490.24 26462.35 4515.72 206648.6
Observations 174 174 174 174 174 174 174
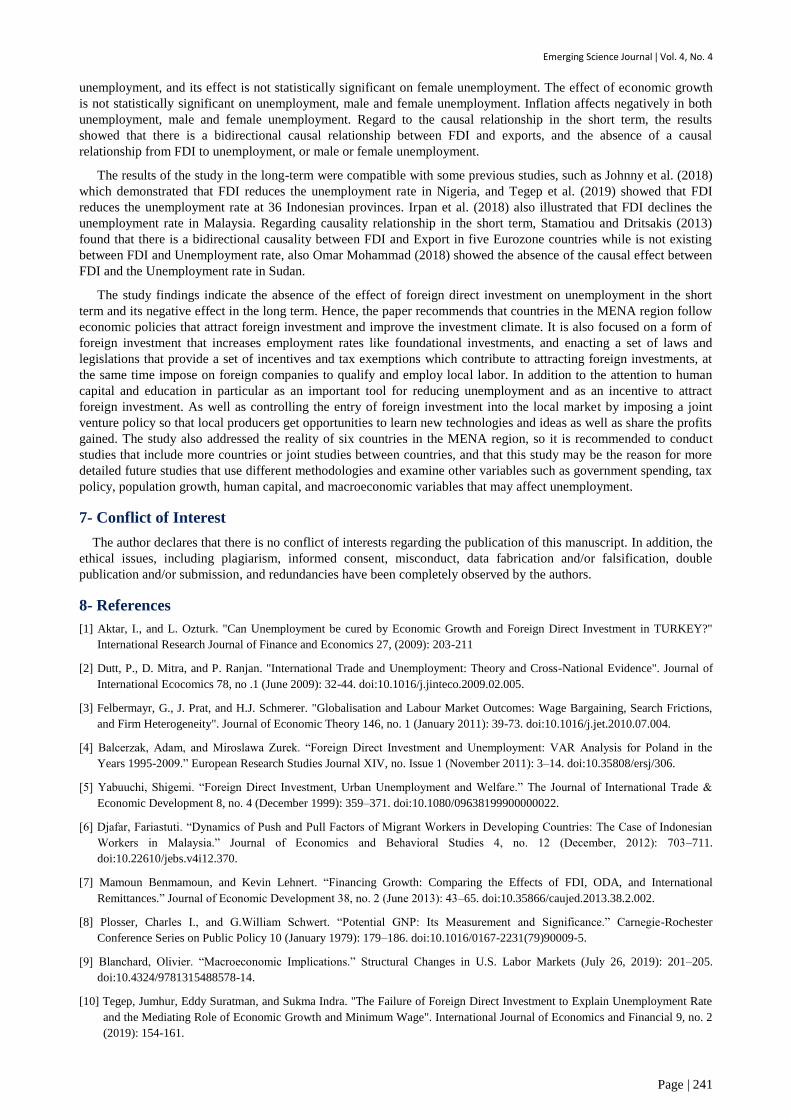
Figure 1 shows that FDI expressed as a percentage of GDP began to increase in size for all countries analyzed from
the beginning of the 1990s to 2006 and 2008. It is worth noting that the summits recorded for some countries during
the period 2005-2008, as well as the sudden decrease recorded between 2009 And 2010.
-5
0
5
10
15
20
25
90 92 94 96 98 00 02 04 06 08 10 12 14 16 18
FDI- Egypt FDI- Jordan
FDI- Lebanon FDI- Morocco
FDI- Tunisia UNE- Turkey
Figure 1. The evolution of foreign direct investments in the six analyzed countries.

Emerging Science Journal | Vol. 4, No. 4
Page | 232
6
8
10
12
14
16
18
20
90 92 94 96 98 00 02 04 06 08 10 12 14 16 18
UNE- Egypt UNE- Jordan
UNE- Lebanon UNE- Morocco
UNE- Tunisia UNE- Turkey
Figure 2. The evolution of unemployment in the six analyzed countries.
Based on the previous studies, the study variables were chosen, and the form of the theoretical relationship
between unemployment and foreign direct investment was also clarified in the introduction to the study. To clarify the
relationship between unemployment and the other variables considered in this study, such as economic growth,
inflation, and exports, it is necessary to review the Phillips curve and Okun's law.
The economics scientist Philips published a statistical study on the historical relationship between inflation and
unemployment targeting the British economy for the period between 1861 to 1957, and the study showed that the
relationship between unemployment and inflation is a decreasing function ((U)= Δ𝑤⁄𝑤 where 𝑓(𝑈)′ < 0), and it is non-
linear (the slope is not fixed) and it is a stable and constant relationship (does not change in the long run) [21]. Phillips
explained that the rate of change in monetary wages is high when unemployment is low, and vice versa, so that wages
according to Philips are the unemployment function, w = f(U) [22].
For the purposes of this study, Okun's law was applied to estimate the relationship between change in
unemployment and economic growth for the six countries. Ordinary Lest Square Method (Time Series Data) was used
as standard tool for each country and Common Effect Model (Panel Data) for the pooled countries.
Table 2. Unemployment and Economic growth (Okun' Law).
Country Okun's Law (ΔUt = C – k Δ𝑌t + µt) Δ𝑌~ ΔU= 0
Egypt ΔU= 0.275 - 0.044*Δ𝑌 6.15%
Jordan ΔU= 0.659 - 0.120 *Δ𝑌 5.5%
Lebanon ΔU= 0.071 - 0.011 *Δ𝑌 6.2%
Morocco ΔU= 0.028 - 0.034 *Δ𝑌 0.85%
Tunisia ΔU= 0.080 - 0.016 *Δ𝑌 5%
Turkey ΔU= 0.130 - 0.029 *Δ𝑌 4.4%
Pooled countries ΔU= 0.107 - 0.017 *Δ𝑌 6.3%
Table 3 shows the application of the Okun law to the six countries, and it's observed through the estimated results
that the relationship between economic growth and the change in unemployment is inverse, and the results also
showed that the economic growth required for the stability of unemployment in these countries differs from the
economic growth estimated in the Okun study, where growth What is required in Egypt, Jordan, Lebanon, Tunisia,
and Turkey exceed 3%, and in Morocco less than 1%, while growth in the combined countries (pooled) reaches 6%.
4- Research Methodology
The study used three statistical models to cover all classifications of unemployment from general unemployment,
male unemployment, and female unemployment. Thus, the study clearly demonstrated the impact of foreign direct
investment on unemployment in the six countries that represent the MENA region.
According to traditional economic theory and previous studies, a linear economic model was used. Since FDI
requires a long time to show its impact on host economies, attention was paid to the long-term relationship of
variables, so the standard model was based on the results of the diagnostic tests as follows:
UNEt= α1+ β1 FDIt+ 𝛾1 EXPt+ 𝜑1 GGDPt+ ω1 INFt + µt (1)

Emerging Science Journal | Vol. 4, No. 4
Page | 233
UNEMt= α2+ β2 FDIt+ 𝛾2 EXPt+ 𝜑2 GGDPt+ ω2 INFt + µt (2)
UNEFt= α3+ β3 FDIt+ 𝛾3 EXPt+ 𝜑3 GGDPt+ ω3 INFt + µt (3)
Where:
UNE: Unemployment rate (%);
UNEM: Male Unemployment rate (%);
UNEF: Female Unemployment rate (%);
FDI: Net FDI inflows (% of GDP);
EXP: Export (% of GDP);
GGDP: Growth of GDP (%);
INF: Inflation (%);
α, β, 𝛾, 𝜑, ω: Parameters of the model;
µ: random error;
t: Time period.
The study began by testing the unit root of variables and because the recent literature proposes several methods for
unit root tests in panel data and since these methods may give different results, the study selected Breitung (2000)
[23], Levin, Lin and Chu (2002) (LLC) [24], Im, Perasan and Shin W-test (2003) (IPS) [25], ADF Fisher Chi-square
test (1979 and 1981) (ADF-Fisher) [26-27], PP Fisher Chi-Square test (Maddala and Wu, 1999) (PP-Fisher) [28] and
Hadri (2000) [29] to perform panel data unit root tests. In all these tests except Hadri, the null hypothesis is that the
variable contains a unit root (in Hadri test, null hypothesis is that the variable is stationary).
In order to examine the long- term relationship between the variables, the paper employed panel data regression
models in this study and considered various assumptions about the intercept, the slope coefficients, and the error term.
This procedure requires selecting between Fixed Effects Model (FEM), Random Effects Model (REM) and Common
Effects Model (pooled regression) [30]. For selecting between these three models, we used Redundant Fixed Effects
test and Hausman test; where Redundant Fixed Effects test to choose between Common Effects Model and Fixed
Effects Model [31], and Hausman test to choose between Fixed Effects Model and Random Effects Model [32]. And
regarding to test the causality relations among the examined variables, the study specified a vector autoregressive
model (VAR), where the main advantage of the VAR model is that it treats each variable of the system as endogenous
and relates each variable to its own past values and to past values of all other variables included in the model [33]. The
following flowchart illustrates the econometric methodology which followed in this paper.
Figure 3. Flowchart of the research methodology.

Emerging Science Journal | Vol. 4, No. 4
Page | 234
5- Empirical Results and Discussion
The results of the unit root test are presented in Table 4. It's found that the variables are non-stationary at their
levels but they are stationary at first difference, being integrated of order one, I(1). This implies that our variables are
non-stationary in levels but stationary in their first differences. In other words, they follow the integration of order
one, I(1), processes , and that allows us to proceed to the panel data regression model.
Table 3. Panel Data Unite Root Tests.
Level Unit Root Test Results I(0)
Variables Breitung LLC IPS ADF PP Hadri
UNE
Intercept - -0.53070 -0.38573 12.2524 9.28146 4.82533***
Intercept
and trend -0.80152 -0.87632 -0.24160 13.9209 5.86572 3.31604***
UNEM
Intercept - -1.32410* -1.00651 -17.5703 12.0442 5.04332***
Intercept and trend
-1.51924* -1.55850* -1.14921 15.8763 7.30581 2.82375***
UNEF
Intercept - -0.73220 -0.26695 13.1751 12.0725 4.69231***
Intercept
and trend -1.92112** -0.36649 -0.11908 11.6564 9.11658 2.42325***
FDI
Intercept - -0.74467 -1.33135* 14.9532 40.8264 1.57409***
Intercept and trend
-2.50067*** 1.18374 0.47970 6.55987 32.7302 4.57216***
EXP
Intercept - -0.97053 -1.13542 18.9495 9.49742 4.19688***
Intercept
and trend -1.60953* -1.02159 -1.86176 23.0607 16.5120 2.36823***
GGDP
Intercept - -0.25583 -7.54404 14.9243 92.7185* 3.75775***
Intercept
and trend -2.10397** 1.42599 -6.43469 25.0576 148.237 3.88568***
INF
Intercept - -0.15307 -3.02462 40.0198 39.1112 6.21180***
Intercept and trend
-2.06240** -1.22268 -3.57374 35.9930 33.7236 2.86300***
First Difference Unit Root Test Results I(1)
Variables Breitung LLC IPS ADF PP Hadri
UNE
Intercept - -3.89194*** -4.98423*** 47.6174*** 87.7998*** -
Intercept
and trend -2.88252*** -2.70249*** -3.56180*** 33.3137*** 70.5324*** -
UNEM
intercept - -6.42435*** -5.46318*** 52.0500*** 71.6511*** -
Intercept
and trend -6.11753*** -5.31163*** -4.11904*** 37.8239*** 52.8308*** -
UNEF
Intercept - -4.31573*** -5.27076*** 49.9028*** 108.806*** -
Intercept and trend
-6.00940*** -2.83901*** -3.78383*** 34.6116*** 87.6971*** -
FDI
Intercept - -3.34052*** -15.1449*** 130.483*** 117.904*** -
Intercept
and trend -6.88730*** -12.6862*** -14.1963*** 218.928*** 366.610*** -
EXP
Intercept - -9.61549*** -9.67280*** 95.6887*** 112.990*** -
Intercept and trend
-4.58145*** -8.26082*** -8.16006*** 73.1532*** 94.6027*** -
GGDP
Intercept - -16.8896*** -20.5033*** 191.299*** 146.688*** -
Intercept
and trend -2.74736*** -11.6908*** -16.4357*** 185.025*** 916.576** -
INF
Intercept - -16.2474*** -15.3974*** 150.534*** 152.023*** -
Intercept
and trend -4.63620*** -11.8264*** -12.6922*** 129.176*** 761.850*** -
Notes:
1. Panel data include all countries.
2. The numbers in parentheses denote p-values.
3. ***, **, * denotes rejection of null hypothesis at the 1%, 5% and 10% level of significance, respectively.
4. The null hypothesis of these tests is that the panel series has a unit root (nonstationary series) except Hadri test.
5. Lag length selection automatic based on Schwarz criterion.
5-1- The First Model (Unemployment Rate)
As explained in the study methodology, both the Redundant Fixed Test and Hausman Test were used to determine
the appropriate panel data regression model. Tables 5 and 6 show the result of these tests.

Emerging Science Journal | Vol. 4, No. 4
Page | 235
Table 4. Redundant Fixed Tests.
Effects Test Statistics d.f. Prob
Cross- section F 39.146 (5, 164) 0.000***
Cross-section Chi-square 136.675 5 0.000***
1. *** denotes rejection of null hypothesis at less than, 5% level of significance.
2. The null hypothesis of these tests is that the panel data regression model is Common Effects Model.
3. The alternative hypothesis of these tests is that the panel data regression model is Fixed Effects Model.
Table 5. Hausman Test.
Test Summary Chi-Sq. Statistic Chi-Sq. d.f. Prob
Cross-section random 56.851 4 0.000***
1. *** denotes rejection of null hypothesis at less than, 5% level of significance.
2. The null hypothesis of these tests is that the panel data regression model is Random Effect Model.
3. The alternative hypothesis of these tests is that the panel data regression model is Fixed Effects Model.
The Redundant Fixed Tests indicate rejection of the null hypothesis and acceptance of the alternative, in other
words, rejection of the Common Effect Model and accept the Fixed Effect Model. And then to choose between the
Fixed Effect model and the Random Effect Model, the Hausman test was applied, and the result indicates rejection of
the Random Effect Model and acceptance of the Fixed Effect Model. Table 6 shows the estimation results of the Fixed
Effect Model for the first model (unemployment rate).
Table 6. Fixed Effect Model (FEM) estimation and test results.
Panel A: Panel Least Squares results
Dependent Variable: UNE
UNE = 14.286 – 0.0916 FDI – 0.0625 EXP – 0.0111GGDP – 0.0292 INF + [CX=F] -1 فصل
Variables Coefficient St. error t- statistic
FDI -0.091623** 0.039985 -2.291422
EXP -0.062530*** 0.021205 -2.948815
GGDP -0.011140 0.023616 -0.471721
INF -0.029241*** 0.006283 -4.653895
Intercept 14.28633*** 0.697169 20.49193
Panel B: Residual Diagnostics and Effects Specification
𝐽𝐵𝑁= 3.83 [0.147], 𝐹𝑠𝑡𝑎𝑡𝑖𝑠𝑡𝑖𝑐= 61.8 [0.0000], R-squared = 0.7705, Adjusted R 2 = 0.7579.
Panel C: Cross-section Fixed Effects
CROSSID 1 2 3 4 5 6
Effect 5.979992
-4.341370 3.820563 -2.445638 -1.991924 -1.021623
Notes: *, ** and *** indicate significance levels at 10%, 5% and 1% , and; 𝐽𝐵𝑁and 𝐹𝐹𝐹 indicate Jarque-Bera and F-statistic to test the null
hypotheses of normal distribution and the significance probability of the model respectively, and; R-squared and Adjusted R-squared to indicates
the ability of independent variables to interpret the dependent variable change, and; CROSSID 1,2,3,4,5,6 indicate Jordan, Lebanon, Tunis, Turkey,
Egypt and Morocco respectively.
Table 6 shows the estimated parameters for the independent variables in the long term. Through the above model,
it's noticed the following:
The results show that the adjusted-R square (adj-R2) was 76.0%. This means the independent variables combined
explain 76.0% of the change in the unemployment rate, and the results indicate that all parameters except (GGDP) in
the model are statistically significant (FDI at 5% significant level, EXP at 1% significant level and INF at 1%
significant level).
For the FDI coefficient it is negative, if the FDI increases 1%, the unemployment rate (UNE) will decrease by
0.092%, with the stability of other factors. This result is consistent with the hypothesis and assumptions that see that
foreign direct investment works to achieve economic savings for workers represented in the increase in their real
wages and increase their productive capabilities, and creating of vertical and horizontal integrations and the
encouragement of supportive projects Investments and thus creating new job opportunities. The results of this study
are consistent with many previous studies such as the study of Johnny et al. (2018) showed that FDI decreases the
unemployment rate in Nigeria, and the study of Bayar (2014) also, showed that FDI declines the unemployment rate in
Turkey.

Emerging Science Journal | Vol. 4, No. 4
Page | 236
According to the (EXP) coefficient, it is negative, if (EXP) increases by 1%, the unemployment rate (UNE) will
decrease by 0.062%, with the stability of the other factors. This result is consistent with the logic of economic theory
that indicates that exports increase economic growth leading to an increase in the employment rate and thus a decrease
in unemployment rates. This result is also consistent with many previous studies such as the study of Dritsakis and
Stamatiou (2018) that showed that there is an inverse bidirectional causal relationship between export and
unemployment rate.
The results also showed that the effect of (GGDP) on the unemployment rate is negative but not statistically
significant. The study shows that this is because the relationship between (GGDP) and (UNE) is indirect and we can
explain the relationship through the influence of intermediate variables such as foreign direct investment, exports,
government spending, and other economic variables that are closely related to economic growth.
Finally, for the (INF) coefficient, it is negative, if the (INF) increases 1%, the unemployment rate (UNE) will
decrease by 0.03%, with the stability of other factors. This finding is consistent with Philips' theory (Phillips curve) in
that the relationship between inflation and unemployment is inverse relation.
In order to analyze the causal relationships between the examined variables the study used panel data VAR with
lag order (2). The optimal lag length selected by the minimum value of Schwarz criterion. Table 7 presents the
estimated coefficient for the six countries and the Granger causality directions are based on the Wald test of
coefficients.
Table 7. Panel data Granger causality tests for the group of countries.
Dependent Variables DUNE DFDI DEXP DGGDP DINF
Model FEM FEM FEM FEM FEM
Coeff.
C (c1)
-0.00453
(0.9588)
0.087630
(0.6492)
0.150174
(0.5537)
-0.417696
(0.1683)
-0.13944
(0.8662)
DUNE(-1)
(c2)
0.015534
(0.8569)
-0.43142
(0.0227)
-0.14784
(0.5523)
-0.875457
(0.0033)
-0.61580
(0.4484)
DUNE(-2) (c3)
0.003660
(0.9664)
-0.08657
(0.6499)
0.140353
(0.5762)
0.367385
(0.2210)
0.375416
(0.6470)
DFDI(-1)
(c4)
-0.01079
(0.7714)
-0.28373
(0.0005)
0.264012
(0.0141)
0.139019
(0.2784)
-0.20225
(0.5637)
DFDI(-2) (c5)
-0.01678
(0.6444)
-0.01358
(0.8648)
0.331527
(0.0017)
0.047612
(0.7044)
-0.06688
(0.8453)
DEXP(-1)
(c6)
-0.04707
(0.0875)
0.146896
(0.0151)
0.008541
(0.9144)
0.118112
(0.2137)
0.395505
(0.1276)
DEXP(-2) (c7)
0.009209
(0.7404)
0.114768
(0.0601)
-0.06939
(0.3873)
0.118686
(0.2161)
0.049849
(0.8491)
DGGDP
(-1) (c8)
0.013894
(0.5000)
0.023802
(0.5984)
0.074445
(0.2109)
-0.501427
(0.0000)
0.845502
(0.0000)
DGGDP (-2) (c9)
0.005108
(0.7996)
0.023962
(0.5873)
0.006318
(0.9134)
-0.060935
(0.3803)
0.530332
(0.0053)
DINF(-1)
(c10)
-0.01211
(0.1249)
-0.01340
(0.4385)
-0.02362
(0.2998)
-0.059693
(0.0285)
-0.39906
(0.0000)
DINF(-2) (c11)
-0.00404
(0.5897)
-0.01097
(0.5045)
-0.03754
(0.0830)
-0.019186
(0.4581)
-0.19766
(0.0053)
Wald test of Coefficients
Causality
Direction (1)
Ho
F-stat
B
[0.245564] (0.8845)
A [5.298070]
(0.0707)
UNE→FDI*
A
[0.718021] (0.6984)
A [10.75772]
(0.0046)
UNE→GDP***
A
[0.839753] (0.6571)
Wald test of
Coefficients Causality
Direction (2)
Ho F-stat
C
[2.983215]
(0.2250)
C
[10.03178] (0.0066)
EXP→FDI***
B
[12.93363] (0.0016)
FDI→EXP***
B
[1.188476]
(0.5520)
B
[0.336189]
(0.8453)
Wald test of Coefficients
Causality
Direction (3)
Ho
F-stat
D
[0.471283] (0.7901)
D
[0.373274] (0.8297)
D
[2.008339] (0.3663)
C
[3.269136] (0.1950)
C
[2.403814] (0.3006)
Wald test of
Coefficients Causality
Direction (4)
Ho
F-stat
E
[2.404203]
(0.3006)
E [0.861988]
(0.6499)
E
[3.470182] (0.1764)
E
[4.887678] (0.0868)
INF→GDP*
D
[19.28027] (0.0001)
GGD→INF***
Notes: The numbers in ( ) denote p-values and in [ ] denote Chi-square value. ***, **,* denotes rejection of null hypothesis at the 1%, 5% and 10% level of significance,
respectively. H0=null hypothesis, F-stat=F-statistic. In Wald test of coefficients, the null hypothesis A is c2= c3=0, B is c4= c5=0, C is c6= c7=0, D is c8= c9=0, E is
c10=c11=0 respectively.

Emerging Science Journal | Vol. 4, No. 4
Page | 237
Table 7 shows the estimated parameters in the short-term, in addition to Granger causality findings. The results are
as follows:
From the first equation (DUNE) of Table 7, the results illustrate that there is no unidirectional causality relation
between the explained variable (DUNE) and the explanatory variables (DFDI, DEXP, DGGDP and DINF). These
findings indicate that all of the independent variables don't affect unemployment in the short term, and the effect may
appear in the long term.
The second equation (DFDI) from Table 7 indicates that there is a weak unidirectional causal relationship that
extends from unemployment to FDI and a strong unidirectional causality that extends from export to FDI. The
explanation of the first result in that unemployment and its high rates are one of the indicators that the economy in the
host country faces a state of stagnation and economic obstacles, and therefore unemployment is one of the factors
inhibiting the investment climate. As for the explanation of the second result, this result support that the expansion of
exports has a significant impact on FDI. Exports in combination with other factors such as tax breaks, low
bureaucracy, and proper administration can be the trigger for more FDI.
The third equation (DEXP) from Table 7 shows that there is a strong unidirectional causal relationship extending
from FDI to export. And this result can be explained by the fact that the most important tools and mechanisms of
foreign direct investment are multinational companies that can expand their production operations because of their
large capital and their ability to borrow from international markets, and thus benefit from economies of scale, and
because they possess the latest generation of productive technologies as a result of their huge spending on research
And project development. This gives it a competitive advantage over local companies, so it produces export-oriented
products, and thus increases its exports as a result of its knowledge of the international market and international
marketing channels, enabling it to enter into export contracts abroad and thus increase the exports of the host country.
According to the fourth equation (DGGDP) from Table 7, the findings show that there is a unidirectional causal
relationship that extends from unemployment to economic growth and from inflation to economic growth. The inverse
relationship between unemployment and economic growth is consistent with Okun’s law. Increasing the
unemployment rate means increasing the economic waste of human resources, which are the main component of
economic growth and economic development. Also, for the relationship of inflation to economic growth, it's noticed
that it is weak significant at 10% significance.
Finally, the fifth equation (DINF) from Table 7 illustrates that there is a strong unidirectional causal relationship
spanning from economic growth to inflation. The classic interpretation may be the best fit for this result, as economic
growth increases the amount of money in the market and results in a significant increase in aggregate demand that
outpaces the increase in production (Excess demand) and thus the speed of money circulation and higher price levels.
Eventually, the findings of Table 8 show that there are two bidirectional causality relationships between FDI and
Export, and economic growth and inflation, and two unidirectional causality relationships from unemployment to FDI
and from unemployment to economic growth.
5-2- The Second Model (Male Unemployment Rate)
Based on the Redundant Fixed Tests and Hausman Test, the fixed-effect model was used and the results showed
that all independent variables negatively affect the Male Unemployment Rate, and also that all estimated coefficients
were statistically significant except for the growth in GDP (FDI, EXP, and INF at 1% significant level).
Table 8. Fixed Effect Model (FEM) estimation and test results.
Panel A: Redundant Fixed Tests.
Effects Test Statistics d.f. Prob
Cross- section F 44.290 (5, 164) 0.000***
Cross-section Chi-square 148.690 5 0.000***
Panel B: Hausman Test.
Test Summary Chi-Sq. Statistic Chi-Sq. d.f. Prob
Cross-section random 33.677 4 0.000***
Panel C: Panel Least Squares results.
Dependent Variable: UNEM
Variables Coefficient St. error t- statistic
FDI -0.112031*** 0.040813 -2.744972
EXP -0.086031*** 0.021644 -3.974720

Emerging Science Journal | Vol. 4, No. 4
Page | 238
GGDP -0.005824 0.024106 -0.241604
INF -0.028646*** 0.006413 -4.466721
Intercept 13.78268*** 0.711610 19.36831
UNEM = 13.782 – 0.1120 FDI – 0.0860 EXP – 0.0058GGDP – 0.0286 INF + [CX=F]
Panel D: Residual Diagnostics and Effects Specification.
𝐽𝐵𝑁= 8.89 [0.011], 𝐹𝑠𝑡𝑎𝑡𝑖𝑠𝑡𝑖𝑐= 61.4 [0.0000], R-squared = 0.7710, Adjusted R 2 = 0.7585.
Panel E: Cross-section Fixed Effects
CROSSID 1 2 3 4 5 6
Effect 6.028319 -3.988239 4.042680 -1.751239 -4.439493 0.107971
Notes: *, ** and *** indicate significance levels at 10%, 5% and 1% , and; 𝐽𝐵𝑁and 𝐹𝐹𝐹 indicate Jarque-Bera and F-statistic to test the null
hypotheses of normal distribution and the significance probability of the model respectively, and; R-squared and Adjusted R-squared to
indicates the ability of independent variables to interpret the dependent variable change, and; CROSSID 1,2,3,4,5,6 indicate Jordan,
Lebanon, Tunis, Turkey, Egypt and Morocco respectively.
The results of Table No. 8 show that the independent variables explain 76% of the change in the male
unemployment (UNEM) and that a 1% increase in FDI leads to a decrease in the UNEM by 0.011%, and an increase
in exports by 1% will lead to a decrease in the UNEM by 0 0.08%, and finally, the 1% increase in inflation will
decrease the UNEM by 0.02%.
The findings of the second model analysis are in line with the findings of the original model (first model), which
makes the study results more robust and supports the main argument of the study for the effect of FDI on the
Unemployment in these 6 countries.
In order to analyse the causal relationships in short-term between the variables of the second model, Table 9 shows
that there are bidirectional causality relationships between FDI and Export, and three unidirectional causality
relationships from inflation to male unemployment, from male unemployment to economic growth and from economic
growth to inflation.
Table 9. Panel data Granger causality tests for the group of countries.
Dependent Variables DUNEM DFDI DEXP DGGDP DINF
Model FEM FEM FEM FEM FEM
Coeff.
C (c1)
-0.08951
(0.2221)
0.09685
(0.6185)
0.13701
(0.5917)
-0.43372
(0.1474)
-0.19488
(0.8149)
DUNEM(-1) (c2)
0.18763
(0.0220)
-0.39838
(0.0668)
-0.10907
(0.7020)
-1.23361
(0.0002)
-0.87592
(0.3459)
DUNEM(-2) (c3)
-0.17911
(0.0308)
0.24661
(0.2621)
-0.06314
(0.8269)
0.76107
(0.0246)
0.06262
(0.9469)
DFDI(-1) (c4)
-0.01924
(0.5324)
-0.28185
(0.0006)
0.24581
(0.0224)
0.10030
(0.4254)
-0.26309
(0.4524)
DFDI(-2)
(c5)
-0.02566
(0.3994)
-0.00374
(0.9631)
0.32474
(0.0023)
0.06339
(0.6101)
-0.08254
(0.8114)
DEXP(-1)
(c6)
-0.03429
(0.1321)
0.14525
(0.0164)
0.00251
(0.9748)
0.10794
(0.2455)
0.38119
(0.1406)
DEXP(-2)
(c7)
0.02685
(0.2436)
0.11141
(0.0686)
-0.06044
(0.4515)
0.11173
(0.2347)
0.06047
(0.8171)
DGGDP
(-1) (c8)
-0.02789
(0.1042)
0.04342
(0.3404)
0.06782
(0.2568)
-0.48181
(0.0000)
0.83172
(0.0000)
DGGDP
(-2) (c9)
-0.01004
(0.5476)
0.02694
(0.5436)
0.00187
(0.9744)
-0.07989
(0.2416)
0.50045
(0.0085)
DINF(-1)
(c10)
-0.01712
(0.0094)
-0.00975
(0.5769)
-0.02393
(0.2972)
-0.04971
(0.0647)
-0.39517
(0.0000)
DINF(-2)
(c11)
-0.00572
(0.3584)
-0.01029
(0.5341)
-0.03712
(0.0880)
-0.02397
(0.3465)
-0.25138
(0.0046)
Wald test of Coefficients
Causality
Direction (1)
Ho
F-stat
B
[0.88394] (0.6428)
A
[4.10966] (0.1281)
A
[0.22416] (0.8940)
A [16.6339]
(0.0002)
UNEM→GDP***
A
[0.89521] (0.6392)
Wald test of
Coefficients
Causality Direction (2)
Ho
F-stat
C [3.46787]
(0.1766)
C
[9.57575]
(0.0083) EXP→FDI***
B
[11.7127]
(0.0029) FDI→EXP***
B [0.73209]
(0.6935)
B [0.56682]
(0.7532)

Emerging Science Journal | Vol. 4, No. 4
Page | 239
Wald test of
Coefficients
Causality Direction (3)
Ho
F-stat
D [2.74816]
(0.2530)
D [0.92342]
(0.6302)
D [1.86023]
(0.3945)
C [2.91092]
(0.2333)
C [2.26916]
(0.3216
Wald test of Coefficients
Causality
Direction (4)
Ho
F-stat
E [6.93569]
(0.0312)
INF→UNEM**
E
[0.58193] (0.7475)
E
[3.42649] (0.1803)
E
[3.75597] (0.1526)
D [18.4070]
(0.0001)
GGD→INF***
Notes: The numbers in ( ) denote p-values and in [ ] denote Chi-square value. ***, **,* denotes rejection of null hypothesis at the 1%, 5% and 10% level of
significance, respectively. H0=null hypothesis, F-stat=F-statistic. In Wald test of coefficients, the null hypothesis A is c2= c3=0, B is c4= c5=0, C is c6= c7=0,
D is c8= c9=0, E is c10=c11=0 respectively.
The short-term results for the second model came identical and similar to the first model. This confirms the
robustness of the study results and the absence of a causal relationship between FDI and unemployment in the short
term while in the long-term we find that FDI reduces unemployment in general and male unemployment (as shown in
Tables 6 and 8).
5-3- The Third Model (Female Unemployment Rate)
In this study, the effect of FDI on female unemployment was investigated to make the picture clearer and the
results more reliable. Through the Hausman test, the random-effect model was used, and the results were similar to the
previous two models, as FDI reduces female unemployment (1% increase in FDI leads to a decrease in the UNEM by
0.011%) as well as inflation (1% increase in inflation will decrease the UNEM by 0.02%). However, both exports and
economic growth had no statistically significant effect.
Table 10. Random Effect Model (REM) estimation and test results.
Panel A: Redundant Fixed Tests.
Effects Test Statistics d.f. Prob
Cross- section F 166.523 (5, 164) 0.000***
Cross-section Chi-square 313.983 5 0.000***
Panel B: Hausman Test.
Test Summary Chi-Sq. Statistic Chi-Sq. d.f. Prob
Cross-section random 1.613 4 0.806
Panel C: Panel Least Squares results.
Dependent Variable: UNEF
UNEF = 16.130 – 0.1389 FDI + 0.0457 EXP – 0.0043GGDP – 0.0402 INF + [CX=R]
Variables Coefficient St. error t- statistic
FDI -0.138986*** 0.058258 -2.385684
EXP 0.045756 0.030793 1.485927
GGDP -0.004325 0.034436 -0.125604
INF -0.040272 0.009132 -4.409810
Intercept 16.13096*** 3.976735 4.409810
Panel D: Residual Diagnostics and Effects Specification.
𝐽𝐵𝑁= 17.82 [0.000], 𝐹𝑠𝑡𝑎𝑡𝑖𝑠𝑡𝑖𝑐= 7.66[0.0000], R-squared = 0.1536, Adjusted R 2 = 0.1335.
Panel E: Cross-section Fixed Effects
CROSSID 1 2 3 4 5 6
Effect 9.905324 -5.756231 1.132830 -5.531825 5.921899 -5.671997
Notes: *, ** and *** indicate significance levels at 10%, 5% and 1% , and; 𝐽𝐵𝑁and 𝐹𝐹𝐹 indicate Jarque-Bera and F-statistic to test the null hypotheses of
normal distribution and the significance probability of the model respectively, and; R-squared and Adjusted R-squared to indicates the ability of independent
variables to interpret the dependent variable change, and; CROSSID 1,2,3,4,5,6 indicate Jordan, Lebanon, Tunis, Turkey, Egypt and Morocco respectively.
The findings of Table 10 showed that the third model differs from the previous models using the random-effect
model, where the Hausman test showed that the null hypothesis must be accepted and therefore the random-effect
model was used and the fixed effect model was rejected. In addition to the effect of exports in these six countries is not
significant on female unemployment, whereas, it is significant and reduced the impact of unemployment and male
unemployment. In contrast, the three models showed that foreign direct investment reduces unemployment, male and
female unemployment in the long-term.

Emerging Science Journal | Vol. 4, No. 4
Page | 240
To find the causal relationship in the short-term between the explanatory variables and female unemployment,
Table 11 shows that:
Table 11. Panel data Granger causality tests for the group of countries.
Dependent Variables DUNEF DFDI DEXP DGGDP DINF
Model REM REM REM REM REM
Coeff.
C (c1)
0.03611
(0.7605)
0.10398
(0.5929)
0.15766
(0.5323)
-0.38912
(0.2144)
-0.11718
(0.8866)
DUNEF(-1)
(c2)
-0.01723
(0.8228)
-0.09066
(0.4884)
-0.21995
(0.1995)
-0.14965
(0.4777)
-0.68436
(0.1563)
DUNEF(-2) (c3)
-0.02009
(0.7960)
0.166921
(0.1912)
0.06400
(0.6993)
0.05191
(0.8007)
0.44248
(0.4121)
DFDI(-1)
(c4)
-0.01088
(0.8267)
-0.27629
(0.0007)
0.24541
(0.0207)
0.10528
(0.4233)
-0.25117
(0.4665)
DFDI(-2) (c5)
0.01937
(0.6937)
-0.00300
(0.9704)
0.32858
(0.0018)
0.04668
(0.7197)
-0.06446
(0.8502)
DEXP(-1)
(c6)
-0.04931
(0.1870)
0.15295
(0.0128)
0.01676
(0.8332)
0.01022
(0.3008)
0.43640
(0.0925)
DEXP(-2) (c7)
0.04871
(0.1916)
0.11851
(0.0531)
-0.06629
(0.4041)
0.15920
(0.1067)
0.04949
(0.8483)
DGGDP
(-1) (c8)
0.01771
(0.5143)
0.04185
(0.3479)
0.06956
(0.2295)
-0.49050
(0.0000)
0.83927
(0.0000)
DGGDP (-2) (c9)
0.04542
(0.0908)
0.02892
(0.5115)
-0.00236
(0.9670)
-0.06856
(0.3340)
0.50384
(0.0069)
DINF(-1)
(c10)
-0.01990
(0.0627)
-0.01129
(0.5197)
-0.02269
(0.3195)
-0.06076
(0.0318)
-0.39279
(0.0000)
DINF(-2) (c11)
-0.00055
(0.9561)
-0.00630
(0.7021)
-0.03874
(0.0706)
-0.00954
(0.7193)
-0.20072
(0.0041)
Wald test of
Coefficients Causality
Direction (1)
Ho F-stat
B [0.26425]
(0.8762)
A [2.35689]
(0.3087)
A [1.92346]
(0.3822)
A [0.60124]
(0.7401)
A [2.89892]
(0.2347)
Wald test of Coefficients
Causality
Direction (2)
Ho
F-stat
C
[3.26604]
(0.1953)
C [10.5613]
(0.0051)
EXP→FDI***
B [12.3003]
(0.0021)
FDI→EXP***
B
[0.66760]
(0.7162)
B
[0.53089]
(0.7669)
Wald test of
Coefficients
Causality Direction (3)
Ho
F-stat
D [2.94053]
(0.2299)
D [0.92092]
(0.6310)
D [2.05834]
(0.3573)
C [3.88445]
(0.1434)
C [2.92047]
(0.2322)
Wald test of
Coefficients
Causality Direction (4)
Ho
F-stat
E [3.60430]
(0.1649)
E [0.47658]
(0.7880)
E [3.66109]
(0.1603)
E
[4.63872]
(0.0983)
INF→GDP*
D
[20.0711]
(0.0000) GGD→INF***
Notes: The numbers in ( ) denote p-values and in [ ] denote Chi-square value. ***, **,* denotes rejection of null hypothesis at the 1%, 5% and 10% level of
significance, respectively. H0=null hypothesis, F-stat=F-statistic. In Wald test of coefficients, the null hypothesis A is c2= c3=0, B is c4= c5=0, C is c6= c7=0,
D is c8= c9=0, E is c10=c11=0 respectively.
Table 11 shows a bidirectional causal relationship between foreign direct investment and exports, and between
GDP growth and inflation. Causality results also came in the short term consistent with the results of the previous two
models, as there is no causal relationship in the short term between foreign direct investment and unemployment in all
its forms, whether unemployment, male unemployment or even female unemployment, while it is present in the long-
term.
6- Conclusion
The MENA region is considered one of the highest regions in the world in terms of unemployment rates, especially
the youth unemployment rate [34]. In response to this challenge, the governments of the region have adopted a set of
policies and measures, the most important of which is attracting FDI. Therefore, this study was conducted on 6
countries, as a group, from this region to investigate the impact of FDI on unemployment in the long term, as well as
the causal relationship in the short term, and the major findings in the long term were as follows: FDI reduces
unemployment, male unemployment, and Female unemployment. Exports reduce unemployment and male
Emerging Science Journal | Vol. 4, No. 4
Page | 241
unemployment, and its effect is not statistically significant on female unemployment. The effect of economic growth
is not statistically significant on unemployment, male and female unemployment. Inflation affects negatively in both
unemployment, male and female unemployment. Regard to the causal relationship in the short term, the results
showed that there is a bidirectional causal relationship between FDI and exports, and the absence of a causal
relationship from FDI to unemployment, or male or female unemployment.
The results of the study in the long-term were compatible with some previous studies, such as Johnny et al. (2018)
which demonstrated that FDI reduces the unemployment rate in Nigeria, and Tegep et al. (2019) showed that FDI
reduces the unemployment rate at 36 Indonesian provinces. Irpan et al. (2018) also illustrated that FDI declines the
unemployment rate in Malaysia. Regarding causality relationship in the short term, Stamatiou and Dritsakis (2013)
found that there is a bidirectional causality between FDI and Export in five Eurozone countries while is not existing
between FDI and Unemployment rate, also Omar Mohammad (2018) showed the absence of the causal effect between
FDI and the Unemployment rate in Sudan.
The study findings indicate the absence of the effect of foreign direct investment on unemployment in the short
term and its negative effect in the long term. Hence, the paper recommends that countries in the MENA region follow
economic policies that attract foreign investment and improve the investment climate. It is also focused on a form of
foreign investment that increases employment rates like foundational investments, and enacting a set of laws and
legislations that provide a set of incentives and tax exemptions which contribute to attracting foreign investments, at
the same time impose on foreign companies to qualify and employ local labor. In addition to the attention to human
capital and education in particular as an important tool for reducing unemployment and as an incentive to attract
foreign investment. As well as controlling the entry of foreign investment into the local market by imposing a joint
venture policy so that local producers get opportunities to learn new technologies and ideas as well as share the profits
gained. The study also addressed the reality of six countries in the MENA region, so it is recommended to conduct
studies that include more countries or joint studies between countries, and that this study may be the reason for more
detailed future studies that use different methodologies and examine other variables such as government spending, tax
policy, population growth, human capital, and macroeconomic variables that may affect unemployment.
7- Conflict of Interest
The author declares that there is no conflict of interests regarding the publication of this manuscript. In addition, the
ethical issues, including plagiarism, informed consent, misconduct, data fabrication and/or falsification, double
publication and/or submission, and redundancies have been completely observed by the authors.
8- References
[1] Aktar, I., and L. Ozturk. "Can Unemployment be cured by Economic Growth and Foreign Direct Investment in TURKEY?"
International Research Journal of Finance and Economics 27, (2009): 203-211
[2] Dutt, P., D. Mitra, and P. Ranjan. "International Trade and Unemployment: Theory and Cross-National Evidence". Journal of
International Ecocomics 78, no .1 (June 2009): 32-44. doi:10.1016/j.jinteco.2009.02.005.
[3] Felbermayr, G., J. Prat, and H.J. Schmerer. "Globalisation and Labour Market Outcomes: Wage Bargaining, Search Frictions,
and Firm Heterogeneity". Journal of Economic Theory 146, no. 1 (January 2011): 39-73. doi:10.1016/j.jet.2010.07.004.
[4] Balcerzak, Adam, and Miroslawa Zurek. “Foreign Direct Investment and Unemployment: VAR Analysis for Poland in the
Years 1995-2009.” European Research Studies Journal XIV, no. Issue 1 (November 2011): 3–14. doi:10.35808/ersj/306.
[5] Yabuuchi, Shigemi. “Foreign Direct Investment, Urban Unemployment and Welfare.” The Journal of International Trade &
Economic Development 8, no. 4 (December 1999): 359–371. doi:10.1080/09638199900000022.
[6] Djafar, Fariastuti. “Dynamics of Push and Pull Factors of Migrant Workers in Developing Countries: The Case of Indonesian
Workers in Malaysia.” Journal of Economics and Behavioral Studies 4, no. 12 (December, 2012): 703–711.
doi:10.22610/jebs.v4i12.370.
[7] Mamoun Benmamoun, and Kevin Lehnert. “Financing Growth: Comparing the Effects of FDI, ODA, and International
Remittances.” Journal of Economic Development 38, no. 2 (June 2013): 43–65. doi:10.35866/caujed.2013.38.2.002.
[8] Plosser, Charles I., and G.William Schwert. “Potential GNP: Its Measurement and Significance.” Carnegie-Rochester
Conference Series on Public Policy 10 (January 1979): 179–186. doi:10.1016/0167-2231(79)90009-5.
[9] Blanchard, Olivier. “Macroeconomic Implications.” Structural Changes in U.S. Labor Markets (July 26, 2019): 201–205.
doi:10.4324/9781315488578-14.
[10] Tegep, Jumhur, Eddy Suratman, and Sukma Indra. "The Failure of Foreign Direct Investment to Explain Unemployment Rate
and the Mediating Role of Economic Growth and Minimum Wage". International Journal of Economics and Financial 9, no. 2
(2019): 154-161.

Emerging Science Journal | Vol. 4, No. 4
Page | 242
[11] Johnny, Nelson, Ekokeme Tamaroukro Timipere, and Okoyan Krokeme. “Impact of Foreign Direct Investment on
Unemployment Rate in Nigeria (1980-2015).” International Journal of Academic Research in Business and Social Sciences 8,
no. 3 (March 22, 2018). doi:10.6007/ijarbss/v8-i3/3905.
[12] Muhd Irpan, Hamidah, Rosfadzimi Mat Saad, Abu Hassan Shaari Md Nor, Abd Halim Md Noor, and Noorazilah Ibrahim.
“Impact of Foreign Direct Investment on the Unemployment Rate in Malaysia.” Journal of Physics: Conference Series 710
(April 2016): 012028. doi:10.1088/1742-6596/710/1/012028.
[13] Dritsakis, Nikolaos, and Pavlos Stamatiou. “Causal Nexus between FDI, Exports, Unemployment and Economic Growth for
The Old European Union Members. Evidence from Panel Data.” International Journal of Economic Sciences VII, no. 2 (2018).
doi:10.20472/es.2018.7.2.002.
[14] Grahovac, Dijana, and Senad Softić. “Impact of the FDI on Unemployment Rate in Countries of West Balkan.” Review of
Innovation and Competitiveness 3, no. 2 (July 2017): 65–82. doi:10.32728/ric.2017.32/4.
[15] Stepanok, Ignat. “Creative Destruction and Unemployment in an Open Economy Model.” Canadian Journal of
Economics/Revue Canadienne D’économique 49, no. 3 (August 2016): 931–948. doi:10.1111/caje.12219.
[16] Mohamed, Omer Ahmed Sayed. “Vector Autoregressive Analysis - VAR Foreign Direct Investment and Unemployment :
Sudan, 1990 - 2016.” Global Journal of Economic and Business 4, no. 2 (April 2018): 224–235. doi:10.12816/0047941.
[17] Dritsakis,, Nikolaos, and Pavlos Stamatiou. “Exports, Foreign Direct Investment, and Economic Growth for Five European
Countries: Granger Causality Tests in Panel Data.” Applied Economics Quarterly 60, no. 4 (December 2014): 253–272.
doi:10.3790/aeq.60.4.253.
[18] Bayar, Yilmaz. “Effects of Foreign Direct Investment Inflows and Domestic Investment on Economic Growth: Evidence from
Turkey.” International Journal of Economics and Finance 6, no. 4 (March 25, 2014). doi:10.5539/ijef.v6n4p69.
[19] UNCTAD, "World Investment Report, FDI from Developing and Transition Economics: Implications for Development".
United Nations Conference on Trade and Development (UNCTAD) World Investment Report (WIR) (April 2018). Available
Online: http://www.unctad.org/en/docs/wir2018_en.pdf. (accessed on 21 May 2020).
[20] " National Accounts Data". World Bank (1990 - 2018). Available Online: https://data.worldbank.org/country. (accessed on 17
April 2020).
[21] Janusz Czapiński, Janusz Czapiński. “Introduction.” Contemporary Economics 5, no. 3 (September 30, 2011): 13.
doi:10.5709/ce.18979254.53.
[22] Phillips, A. W. “The Relation Between Unemployment and the Rate of Change of Money Wage Rates in the United Kingdom,
1861-1957.” Economica 25, no. 100 (November 1958): 283. doi:10.2307/2550759.
[23] Breitung, Jörg. “The Local Power of Some Unit Root Tests for Panel Data.” Nonstationary Panels, Panel Cointegration, and
Dynamic Panels (n.d.): 161–177. doi:10.1016/s0731-9053(00)15006-6.
[24] Levin, Andrew, Chien-Fu Lin, and Chia-Shang James Chu. “Unit Root Tests in Panel Data: Asymptotic and Finite-Sample
Properties.” Journal of Econometrics 108, no. 1 (May 2002): 1–24. doi:10.1016/s0304-4076(01)00098-7.
[25] Im, Kyung So, M.Hashem Pesaran, and Yongcheol Shin. “Testing for Unit Roots in Heterogeneous Panels.” Journal of
Econometrics 115, no. 1 (July 2003): 53–74. doi:10.1016/s0304-4076(03)00092-7.
[26] Dickey, David A., and Wayne A. Fuller. “Distribution of the Estimators for Autoregressive Time Series with a Unit Root.”
Journal of the American Statistical Association 74, no. 366a (June 1979): 427–431. doi:10.1080/01621459.1979.10482531.
[27] Dickey, David A., and Wayne A. Fuller. “Likelihood Ratio Statistics for Autoregressive Time Series with a Unit Root.”
Econometrica 49, no. 4 (July 1981): 1057. doi:10.2307/1912517.
[28] Maddala, G. S., and Shaowen Wu. “A Comparative Study of Unit Root Tests with Panel Data and a New Simple Test.” Oxford
Bulletin of Economics and Statistics 61, no. s1 (November 1999): 631–652. doi:10.1111/1468-0084.61.s1.13.
[29] Hadri, Kaddour. “Testing for Stationarity in Heterogeneous Panel Data.” The Econometrics Journal 3, no. 2 (December 1,
2000): 148–161. doi:10.1111/1368-423x.00043.
[30] Webel, Karsten. “Greene, W. H., Econometric Analysis.” Statistical Papers 52, no. 4 (February 21, 2010): 983–984. doi:
10.1007/s00362-010-0315-8.
[31] Baltagi, Badi H. “Panel Data.” Wiley StatsRef: Statistics Reference Online (September 29, 2014). doi:
10.1002/9781118445112.stat03160.
[32] Hausman, J. A. “Specification Tests in Econometrics.” Econometrica 46, no. 6 (November 1978): 1251. doi:10.2307/1913827.
[33] Sims, Christopher A. “Macroeconomics and Reality.” Econometrica 48, no. 1 (January 1980): 1. doi:10.2307/1912017.
[34] Kabbani, Nader and Ekta Kothari. “Youth Employment in the MENA Region: A Situational Assessment”. The World Bank,
Social Protection Discussion Paper, no. 534 (September 2005). Available online: documents.worldbank.org/curated/en/
491271468050966800/Youth-employment-in-the-MENA-region-a-situational-assessment. (accessed on 17 March 2020).