Embed Size (px)
Citation preview

THE IMPACT OF FISCAL INCENTIVES IN THE PRE-SALT OIL BUSINESS
IN BRAZIL
Patrícia Pereira Pedra
Dissertação de Mestrado apresentada ao Programa de
Pós-graduação em Planejamento Energético, COPPE,
da Universidade Federal do Rio de Janeiro, como parte
dos requisitos necessários à obtenção do título de
Mestre em Planejamento Energético.
Orientador: Alexandre Salem Szklo
Rio de Janeiro
Março de 2020

THE IMPACT OF FISCAL INCENTIVES IN THE PRE-SALT OIL BUSINESS IN
BRAZIL
Patrícia Pereira Pedra
DISSERTAÇÃO SUBMETIDA AO CORPO DOCENTE DO INSTITUTO ALBERTO LUIZ
COIMBRA DE PÓS-GRADUAÇÃO E PESQUISA DE ENGENHARIA DA
UNIVERSIDADE FEDERAL DO RIO DE JANEIRO COMO PARTE DOS REQUISITOS
NECESSÁRIOS PARA A OBTENÇÃO DO GRAU DE MESTRE EM CIÊNCIAS EM
PLANEJAMENTO ENERGÉTICO.
Orientador: Alexandre Salem Szklo
Prof. Alexandre Salem Szklo
Prof. Roberto Schaeffer
Prof. Edmar Luiz Fagundes de Almeida
RIO DE JANEIRO, RJ - BRASIL
MARÇO DE 2020

iii
Pedra, Patrícia Pereira
The Impact of Fiscal Incentives in the Pre-Salt Oil
Business in Brazil / Patrícia Pereira Pedra. – Rio de Janeiro:
UFRJ/COPPE, 2020.
XIII, 98 p.: il.; 29,7 cm.
Orientador: Alexandre Salem Sklo
Dissertação (mestrado) – UFRJ/ COPPE/ Programa de
Planejamento Energético, 2020.
Referências Bibliográficas: p. 72-83.
1. Oil production 2. Pre-salt. 3. Fiscal Incentives 4.
Economic Analysis I. Szklo, Alexandre Salem. II.
Universidade Federal do Rio de Janeiro, COPPE, Programa
de Planejamento Energético. III. Título.

iv
AGRADECIMENTOS
Agradeço à minha família, especialmente ao meu marido Paulo Brandão, por seu amor
em todos os momentos.
Meus filhos, pela compreensão das horas deles retiradas para o estudo. Meus pais que
sempre me apoiaram e incentivaram a nunca parar de aprender.
Ao Prof. Alexandre Salem Szklo, pelas conversas e orientação e por ser um exemplo
de mestre.
Aos professores Roberto Schaeffer e Edmar Almeida pela participação na banca de
mestrado.
Aos meus amigos e colegas de turma do PPE, partilhamos muitas horas de estudo juntos
e foi maravilhosa a convivência. Especialmente à Fernanda que foi uma ótima experiência
reencontrar após mais de 20 anos!
Aos professores do PPE que partilharam seus conhecimentos e experiências.
Aos funcionários do PPE, especialmente à Sandrinha que está sempre à disposição para
nos ajudar.
E à Deus por me presentear com mais uma benção!

v
Resumo da Dissertação apresentada à COPPE/UFRJ como parte dos requisitos necessários
para a obtenção do grau de Mestre em Ciências (M.Sc.)
O IMPACTO DOS INCENTIVOS FISCAIS NO PRÉ-SAL BRASILEIRO
Patrícia Pereira Pedra
Março/2020
Orientador: Alexandre Salem Szklo
Programa: Planejamento Energético
Sob uma perspectiva econômica, social e ambiental, é válido avaliar se a renda
petrolífera do pré-sal brasileiro está sendo devidamente apropriada pelo Estado, dada a
existência de incentivos fiscais na indústria nacional por mais de vinte anos. O petróleo
representa uma parcela de 40% no consumo de energia primária do país e a produção e
exportação do mesmo é fundamental para a balança comercial do país (i.e., foi o terceiro item
com maior participação de valor nas exportações em 2017). Após a descoberta da província de
óleo chamada pré-sal, o governo brasileiro expandiu até 2040 os termos do regime especial
fiscal chamado Repetro, que, entre outras provisões, permite isenções fiscais, ainda que
temporárias, para a indústria. No entanto, no contexto de uma recessão econômica, crescente
problemas sociais e compromissos com baixas emissões de carbono, é importante verificar se
tais incentivos são mesmo necessários para fazer com que os campos de pré-sal sejam atrativos
economicamente. Após análise de alguns tipos diferentes de campos de pré-sal, para um
cenário de preços acima de $60/bbl, os incentivos não são necessários para fazer com que os
maiores campos sejam economicamente viáveis, se tornando então subsídios indiretos para a
indústria nesses casos. Verificou-se também que o ajuste dos termos fiscais do contrato de
partilha existente permite adequar a participação governamental na partilha a diferentes
cenários de preço de petróleo.

vi

vii
Abstract of Dissertation presented to COPPE/UFRJ as a partial fulfillment of the requirements
for the degree of Master of Science (M.Sc.)
THE IMPACT OF FISCAL INCENTIVES IN THE PRE-SALT OIL BUSINESS
IN BRAZIL
Patrícia Pereira Pedra
Março/2020
Advisor: Alexandre Salem Szklo
Department: Energy Planning
From an economic, social and environmental perspective, it is worthwhile to assess if
oil rents from petroleum production in the Brazilian pre-salt fields are being appropriately
perceived by the State, given the current long-lasting fiscal incentives to the industry in Brazil.
Crude oil accounts for 40% of the country´s primary energy consumption, and is key to its
trade balance (e.g., the third export good in value in 2017). After the discovery of the oil
province called pre-salt, the Brazilian government expanded to 2040 and deepened the terms
of the special tax regime called Repetro that provides tax exemptions to the oil industry.
However, in the light of an economic recession allied with increasing social problems and
commitments to a low carbon world, the question that arises is weather these fiscal incentives
are truly needed to make pre-salt projects economic attractive. By evaluating some pre-salt
fields, under an oil price scenario of $60/bbl, this study shows that, for some fields, fiscal
incentives are not necessary, being, then, hidden subsidies. Moreover, the adjustment of the
existing production sharing contract terms allows a better fit of the government take within
different oil prices scenarios.

viii
TABLE OF CONTENTS
1 INTRODUCTION ............................................................................................................. 1
1.1 Hypothesis and Objective............................................................................................ 4
1.2 Dissertation Structure .................................................................................................. 5
2 PETROLEUM FISCAL SYSTEMS .................................................................................. 6
2.1 Oil and gas exploration and production commercial models ...................................... 6
2.1.1 Fiscal terms premises ........................................................................................... 6
2.1.2 Concession Contracts ......................................................................................... 14
2.1.3 Production Sharing Agreements ........................................................................ 16
2.1.4 Service Contracts ............................................................................................... 17
2.1.5 Others ................................................................................................................. 19
2.2 Discounted Cashflow Analysis ................................................................................. 20
2.3 Application of petroleum fiscal systems .................................................................. 23
3 BRAZIL´S OIL AND GAS FISCAL REGIMES ............................................................ 23
3.1 Oil and gas history in Brazil ...................................................................................... 24
3.1.1 Legal Framework history of the industry in Brazil ............................................ 26
3.1.2 Terms of the Concession Contract in Brazil ...................................................... 31
3.1.3 Transfer of Rights in Brazil (Onerous Assignment) .......................................... 33
3.1.4 Production Sharing Agreement in Brazil ........................................................... 34
3.2 Brazilian tax system .................................................................................................. 34
3.2.1 Changes made by Law 13,586/17 ...................................................................... 36
4 METHODOLOGY .......................................................................................................... 38
4.1 Fiscal Incentives ........................................................................................................ 42
4.2 Economic Metrics and Assumptions ......................................................................... 43
4.2.1 Oil Prices ............................................................................................................ 43
4.2.2 Metrics ............................................................................................................... 44
ix
4.2.3 Signature Bonus, Profit Oil and Cost Oil Rates ................................................. 46
4.3 Input Data – Base Case and Sensitivities .................................................................. 49
4.3.1 Base Case ........................................................................................................... 49
4.3.2 Sensitivity Cases ................................................................................................ 56
4.4 Yet to Find Pre-Salt Volumes ................................................................................... 56
5 RESULTS ........................................................................................................................ 58
5.1.1 Base Case ........................................................................................................... 58
5.1.2 Sensitivities ........................................................................................................ 62
6 CONCLUSIONS.............................................................................................................. 70
7 REFERENCES ................................................................................................................ 72
Annex I – Special Participation Tax (SPT) .............................................................................. 84
Annex II – Petroleum Fiscal Regimes Examples .................................................................... 89
II.1 Indonesia ................................................................................................................... 89
II.2 Iran ............................................................................................................................ 91
II.3 Norway ...................................................................................................................... 94
II.4 United States of America .......................................................................................... 96
Annex III – Results from ANP Pre-Salt Bid Rounds until 2019 ............................................. 98

x
FIGURES
Figure 1: Typical oil and gas offshore, conventional reservoir cashflow .................................. 8
Figure 2: Typical oil and gas offshore, unconventional reservoir cashflow.………………………... 9
Figure 3: Concession contract structure…………………………………...……………………….. 15
Figure 4: General production sharing agreement structure………………..………………………... 17
Figure 5: General revenue-shared contract structure……………………...……………………….. 18
Figure 6: General risked-service contract structure……………………….………………………... 18
Figure 7: General pure-service contract structure………………………...………………………... 19
Figure 8: Straight Line Depreciation……………………………………………..………………………... 22
Figure 9: Unit of Production Depreciation………………………………..………………………... 22
Figure 10: Brazil’s historical oil production and consumption ……………….….……………... 26
Figure 11: Example of normal and accelerated unit of production depreciation.………………... 43
Figure 12: Profit Oil Matrix…………………………………………………….………………... 48
Figure 13: Field of 58 mln bbl…………………………………………………………………... 51
Figure 14: Field of 65 mln bbl…………………………………………………………………... 51
Figure 15: Field of 243 mln bbl ………………………………………………………………... 51
Figure 16: Field of 311 mln bbl………………………………………………………………... 52
Figure 17: Field of 364 mln bbl………………………………………………………………... 52
Figure 18: Field of 1117 mln bbl……………………………………………………….……... 52
Figure 19: Field of 2008 mln bbl…………………………………………………………..…... 53
Figure 20: Field of 2119 mln bbl……………………………………………………………… 53
Figure 21: Field of 5445 mln bbl………………………………………………………………... 53
Figure 22: Field of 7877 mln bbl …………………………………………………………….54
Figure 23: Average production per well after plateau…………………….………………………... 55
Figure 24: Impact of profit oil and signature bonus in IRR at $50/bbl…...………………………... 65
Figure 25: Impact of profit oil and signature bonus in IRR at $60/bbl…...………………………... 65
Figure 26: Impact of profit oil and signature bonus in IRR at $70/bbl.………….…………………... 66
xi
Figure 27: Impact of profit oil and oil price in IRR at US$2000 million Bonus …….………... 67
Figure 28: Impact of profit oil and oil price in IRR at US$4000 million Bonus …….………... 67
Figure 29: Impact of profit oil and oil price in IRR at US$8000 million Bonus …….………... 68
Figure 30: Impact of profit oil and oil price in IRR at US$2000 million Bonus with the fixed
case …………………………………………………………………………….…….………... 69
Figure 31: Indonesia’s historical oil production and consumption………….……………………... 90
Figure 32: Iran’s historical oil production and consumption….……………………………………... 93
Figure 33: Norway’s historical oil production and consumption.……………………….……………... 95
Figure 34: USA’s historical oil production and consumption …………………………………………...97

xii
TABLES
Table 1: Constitutional changes comparison. .......................................................................... 29
Table 2: Legal Framework for the Concession Contract in Brazil .......................................... 30
Table 3: Legal framework for the pre-salt and strategical areas in Brazil. .............................. 31
Table 4: Tax categories, average tax allocation - with Repetro. .............................................. 41
Table 5: Tax categories, average cost allocation and average tax rates - without Repetro ..... 41
Table 6: Summary of Fiscal Incentives of Repetro ................................................................ 42
Table 7: IOCs´ Selected Financial Information. ...................................................................... 45
Table 8: Bonus and Profit Oil estimation based on actual values. ........................................... 47
Table 9: Summary of development premises and costs. .......................................................... 49
Table 10: FPSO platforms costs according to production capacity – as of 2014 .................... 50
Table 11: Potential Evolution of E&P project costs in Brazil $/bbl ........................................ 54
Table 12: Well productivity in the world in 2015 (bbl/d) ........................................................ 55
Table 13: Number of Fields in each scenario. ......................................................................... 57
Table 14: Base Case results at $50/bbl, $60/bbl and $70/bbl without Incentive. .................... 58
Table 15: Base Case results at $50/bbl, $60/bbl and $70/bbl with Repetro. ........................... 59
Table 16: Base Case results at $50/bbl, $60/bbl and $70/bbl with Repetro and Depreciation
Incentive ................................................................................................................................... 59
Table 17: Delta NPV (US$ mln) from the Incentives case to the IRR 11.29% for each oil price
.................................................................................................................................................. 60
Table 18: Average Extra Rent (US$ mln) per Field Size for each oil price ............................ 60
Table 19: Total Extra Rent Generated in the Low Yet-to-find Volumes scenario (US$ mln).61
Table 20: Total Extra Rent Generated in the Medium Yet-to-find Volumes scenario (US$ mln).
.................................................................................................................................................. 61
Table 21: Total Extra Rent Generated in the High Yet-to-find Volumes scenario (US$ mln).61
Table 22: Estimation for the Extra rent based on Yet-to-Find Pre-Salt Volumes (US$ mln) 61

xiii
Table 23: Sensitivities results at $50/bbl, $60/bbl and $70/bbl with no Incentive. ................. 63
Table 24: Sensitivities results at $50/bbl, $60/bbl and $70/bbl with Repetro
Incentive..……………………………………………………………………………...……..63
Table 25: Sensitivities results at $50/bbl, $60/bbl and $70/bbl with Repetro and Depreciation
Incentives……………………………………………………………………………...……..63
Table 26: Impact of geological risk on the base case with both incentives ...………...……..64

xiv
ACRONYMS
ANP Brazil Petroleum National Agency
Bbbl Billions of barrels
Bbp/d Billions of barrels per day
Boe Barrel of oil equivalent
BRL Brazilian Reais (currency)
IOC International oil company
IPCC Intergovernmental Panel of Climate Change
Mbbl Millions of barrels
Mbpd Millions of barrels per day
NOC National oil commpany
OPEC Organization of Petroleum Exporting Countries
PPSA Pre-Sal Petróleo S.A
SRF Secretaria da Receita Federal
UDC Unit development cost
UOC Unit operating cost

1
1 INTRODUCTION
In the last 150 years, the use of fossil fuels leaded to undeniable benefits to humankind
(SMIL, 2007; WILSON, 2012). However, negative externalities derive from the production
and use of fossil fuels, with a major threat being associated to global climate change (BRASIL,
2015). Subsidies (hidden or not) to fossil fuels are also relevant to explain their use (CHEON;
URPELAINEN; LACKNER, 2013; COADY et al., 2010).1
Governments dispose of subsidies (hidden or not) to generate impacts in the economy
that otherwise would not happen, or would take much more time than desired to occur. In the
oil industry, they can be used to produce different impacts, which can be, among others, to
increase overall production, to stimulate development of marginal fields, to benefit certain
segments like local industries or even to promote regional development of frontier areas that
cannot depend solely upon market conditions. Despite the benefits of the subsidies, if given
without discretion, they can generate distortions in the economy by transferring more benefits
to the industry than actually necessary, preventing a proper allocation of government resources.
Although oil discoveries had been present since the ancient times, the modern oil
industry as known today started with the Drake well discovery in USA. The “oil rush”
expanded worldwide and by 1910 significant oil fields had been discovered in the Dutch East
Indies (1885, in Sumatra), Persia (1908, in Masjed Soleiman), Peru (1863, in Zorritos District),
Venezuela (1914, in Maracaibo Basin), and Mexico, and were developed at an industrial level
(YERGIN, 1991). The prospection of oil required geological and technical knowledge that
most of the countries, where the initial discoveries were made, did not have, requiring
governments and companies to establish commercial terms to monetize the host countries’
natural resources and generating profit to the corporations. Under this scenario, the world
watched the establishment of different arrangements to regulate the activity of exploring and
producing petroleum.
Just as in the land use, the oil industry also presents a differential rent based on the
“quality of the land”. Davi Ricardo´s Theory of Rent identified that depending on the
productivity of the land the costs to produce food could be reduced generating a differential
rent to its owner (RICARDO, 1817). The same way, the oil business generates rent depending
1 Hidden subsidies or indirect subsidies are those that do not involve direct payment of funds to an specific industry
(VICTOR, 2009)(STEFANSKI, 2017)(KOPLOW, 2012)(BENES et al., 2015)

2
on the location and quality of the resources. As rent is the surplus created after remuneration
of the cost of capital and all the production factors involved in this activity, many discussions
arise regarding who should benefit from the differential rent. It is the key concept for regulating
the oil industry when trying to balance attractiveness for the contractors with government take.
In the beginning of the twentieth century, the predominant commercial arrangement was
the concession contracts2, under which governments allowed international companies to
explore and produce their natural resources usually for a long period of time, over a large area
with limited or no intervention of the governments in the operations, against payment of a
signature bonus and royalties (JOHNSTON, 1994). It started with the signature of the Persian
contract in 1904 (SMITH, 2000a) considered therefore as the classical concession. However,
the unbalanced terms of the contracts in favor of the companies soon became noticeable
triggering attempts to revise them. Slowly, the host countries started to act towards exercising
more control over its natural resources. The chosen alternatives included renegotiation of the
terms, creation of new types of arrangements and even a complete banishment of the
international companies, as Mexico did in 1933 when it nationalized its petroleum industry
(YERGIN, 1991).
One of the new structures created to replace the concession contract was the production
sharing agreement (JOHNSTON, 1994). An attempt made by Indonesia, after its independence,
to increase control over its natural resources growing the Government´s profits
(TOLMASQUIM, 2011). As the ownership was being shifted to the Government, they would
now decide how the companies would take their share, part based on the investment made and
part built on the amount of profit the State would allow the companies to have. This model,
after its implementation in the early sixties, became very popular as an alternative for the
nations to restrict the dominance of the international oil companies in their territories and obtain
a higher take of the generated oil rent. and suffered several modifications accommodating
different needs each country had (JOHNSTON, 1994). On top of the classic concessions and,
productions sharing agreements, participation agreements and service agreements were also
used by host countries according to their discretion (DZIENLOWSKI, 2000; SMITH, 2000b).
In Brazil, the use of oil increased in the fifties with a late industrialization, creating an
oil-based economy (IBGE, 2018). Initially, the national oil industry was heavily dependent on
2 Concession contracts, production sharing agreements and service contracts are types of petroleum fiscal
models that will be described in more details in chapter 2.

3
imports but, as in many other countries, the increase of crude oil prices in the seventies,
generated, among other consequences, an intensification of efforts to increase national oil
production to reduce the dependency on the imported oil (NOGUEIRA HALLACK et al.,
2017).
Until 1997, the exploration and production of crude oil was a national monopoly
exercised by Petrobras. During that time, the first fields of 2 to 3 bln bbls were found,
inaugurating a cycle of giant field discoveries (MORAIS, 2013). In 2007, Petrobras announced
the existence of a major oil basin with estimated recoverable resources up to 176 bln bbl3
(JONES; CHAVES, 2016; LIMA; LIMA, 2017). This represented more than ten times the
country's reserves 4in 2007. Actually, 11 years after the first discovery, the pre-salt represents
more than 50% of the whole country's production reaching 1.8 mln boe/d in 2018, also
impacting other countries such as Portugal whose 43% of its oil comes from the Brazilian pre
salt (ANP, 2018a).
When the exploration and production segment was opened to foreign capital in 1997, the
government implemented several changes aiming to create a competitive scenario in the
industry. Particularly, an independent regulatory petroleum agency (ANP) was created and the
fiscal policy applied to petroleum production was reviewed. Brazil has several taxes at
different levels (national and subnationals) applied to goods and services for national and
imported materials. As oil and gas production depends on long-term projects, most of the
investment is made in the early years before receiving any revenues (UNITED NATIONS,
2017). This cash flow usually justifies fiscal incentives aiming at reducing taxes on costs at the
early years, but shifting their payment for when production had already started generating
revenue.
Moreover, at the end of the 1990s, Brent oil price was around $20/bbl (EIA, 2020a) and
Brazil wanted to attract investors. Therefore, a particular fiscal incentive was created in 1999,
the so-called Repetro (BRASIL, 1999), being established as a temporary special tax regime to
exempt taxes from imported and nationalized products associated with the country´s oil
industry. Twenty years later, despite a recently revision of the fiscal regime, this incentive
remains essentially the same, but now it was set to last until 2040 (LIMA, 2017).
3 Although these are not proved reserves, this resource value is for P90, showing a higher confidence to be
compared with Brazil proved reserves. 4 The proved oil reserves in 2007 were 12.6 bln bbl.(ANP, 2018c)

4
As mentioned before, this kind of incentives or hidden subsidies is commonly used in the
economy as a mechanism to stimulate specific segments of the business when they cannot,
under market conditions, provide return on investments and, consequently, would not happen
otherwise. As oil is still an energy source with strategical value to most economies,
governments want to increase their production and can make use of incentives or hidden
subsidies for this purpose (BHATTACHARYYA, 2011; CHEVALIER J.-M, 2004; SILVA,
2018; SOVACOOL, 2007) But they would have to balance the initiatives to increase
production with their revenues as taxes over oil activities compose a relevant fraction of
governments´ primary revenue (GERASIMCHUK et al., 2019; KOJIMA, 2009).
It is noted that oil business has many inefficient hidden subsidies, even with commitment
from countries such as US, China, India and European Union to remove them (ERICKSON et
al., 2017). Those subsidies are not needed to promote the production. Instead, they end up
enlarging producers’ profits. Actually, incentives are given to promote projects that would be
developed anyway (ERICKSON et al., 2017). Under the aegis of the theory of exhaustible
resources, Hartwick proposed that the scarcity rents from producing those resources should be
reinvested in reproducible capital (HARTWICK, 1977). Besides, from the perspective of an
energy transition from fossil fuels to renewable energy sources (WILSON, 2012), this rent
could be used to promote not yet competitive domestic low-carbon energy sources
(GOLDEMBERG et al., 2014), with the potential co-benefit of generating income and jobs
(COLLINS; HANSEN; HENDRYX, 2012; SANTOS et al., 2016; SORIA et al., 2015).
1.1 Hypothesis and Objective
There is a chance that the fiscal incentives given to the pre-salt oil industry in Brazil are
generating excessive petroleum rents to the oil companies in detriment of the Stat Therefore,
this dissertation aims to estimate the impact of the fiscal incentive Repetro and accelerate
depreciation on Brazilian petroleum fields in the oil frontier called “pre-salt”, which is ruled
by production sharing contracts (PSC). If the existence of unnecessary (hidden) fiscal
incentives is proved, these should be classified as extra rent (windfall profit) for the contractors
(or operators), which, at the same time, reduces the government take. Moreover, in the light
of climate change challenges and commitments assumed by the country in Paris (BRASIL,
2015), and Brazil´s urgent social needs, unnecessary fiscal incentives shall be reviewed

5
towards investments in innovative energy systems beyond the peak of oil supply and demand
in Brazil.
1.2 Dissertation Structure
In order to meet the objective, this dissertation is structured into 6 chapters including this
introductory one. Chapter 2 presents the main existing petroleum fiscal systems for oil and gas,
including the main concepts involving the fiscal terms and examples from countries with a
significant participation in the global oil industry history. That chapter also includes a brief
description of how the economic analysis is performed by the oil companies, highlighting the
drivers for an investment decision. In Chapter 3, Brazil’s petroleum fiscal system is described
including a brief history of how the country´s oil industry started and reached the level of
importance it has today, including the legal framework behind the different moments of oil
regulation in Brazil. In this part, the actual existing fiscal system and in place tax incentives for
the industry are presented. The methodology and the database used in this dissertation for both
the base and sensitivity cases are described in Chapter 4. Chapter 5 is where the results are
presented along with the discussion of findings. Finally, chapter 6 contains the conclusions and
suggestions for future work.

6
2 PETROLEUM FISCAL SYSTEMS
This chapter presents the commercial terms under which governments contract operators
to extract value from their hydrocarbon resources and how the contractors assess the value of
the areas, including:
• The discounted cashflow method applied to oil and gas industry;
• The fiscal terms used in the oil and gas industry to extract rent;
2.1 Oil and gas exploration and production commercial models
In the early years of the modern oil industry, oil exploration and production proceeded
from a reduced number of countries with a commercial model based on direct negotiations
between host countries and oil companies, the main actors of the industry at that time
(YERGIN, 1991). Classical concession contracts were the preferred instrument to regulate the
contract based on long term relationships and royalty payment, most of the time (BRAGA;
SZKLO, 2014; BRAZIL, 2015; MATHIAS, 2008; YERGIN, 1991; ). With time, the actors and
the roles they played changed based on the world conjunctural social, political, economic and
technological factors. It drove the creation of other types of contractual arrangements to
remunerate host countries and companies in oil and gas business such as production sharing
agreements and service contracts.
The drivers behind the contracting arrangements were a weight between risk and reward
for the governments and companies given the lifecycle and nature of oil and gas projects
(JOHNSTON, 1994).
2.1.1 Fiscal terms premises
In order to describe the main modalities under which hydrocarbons were and still are
explored and produced, three main concepts that drive the fiscal systems commercial structures
need to be described. The first one is related to the lifecycle of the projects and how it impacts
the fiscal terms. The second one is the ownership of reserves, which is directly related to how
a company, either national or multinational, have access to the reserves and the third one is
related to the types of taxes the fiscal system are composed of, which are they and how they

7
have been used throughout the time by host countries as instruments to appropriate part of the
rent generated in the petroleum activity.
2.1.1.1 Oil and gas projects lifecycle
Oil and gas projects can be explored and produced in different ways, depending on the
location of the resources, the type of reservoir and available technology, among other factors.
For a large offshore conventional reservoir, the lifecycle of a typical oil and gas project includes
the phases of licensing, exploration, appraisal, development, production and abandonment (DA
HORA et al., 2019; TORDO, 2007). The first phase, licensing is when the government grants
a license to a company to execute activities of exploration, and production. It can be granted
through a competitive action or through direct negotiations and usually is for a limited period
of time. The exploration phase is associated with risk, despite the current available technologies
for prospecting hydrocarbons. Geophysical and geological methods to prospect hydrocarbons
are based on complex theories (THOMAS, 2001), but only after drilling wells there is certainty
about oil accumulations. Moreover, it takes dry holes, more or less, depending on the area, to
get to a successful well. The world offshore success exploration rate was around 32% in 2018
and since 1990, this value has never gone over 50%, with an average for the period just below
40% (KUNJAN, 2016; RIPED, 2019). Going forward, if oil and or gas are found, the appraisal
phase will start to delimitate the volumes and collect more information to select the best
development option for the field. The development phase is when all the necessary equipment
to produce oil/gas over the life of a field, which is on the range of 30 to 40 years5, is put in
place. It is the phase where the major investments are made. Profits, however, will only come
after oil or gas is produced in the production phase.
For the lifecycle of an oil and gas project, it is important to mention the difference
between conventional and unconventional resources. The first situation, that will be the basis
for this dissertation, includes the traditional reservoirs where permeability and porosity allow
the extraction of the resources through vertical wells with minimal stimulation and the
resources are trapped by rock formations. On the other hand, unconventional resources, due to
low porosity and permeability requires stimulation methods to extract them, such as hydraulic
fracturing.
5 This is not valid for unconventional fields, such as light tight oil in the United States.
8
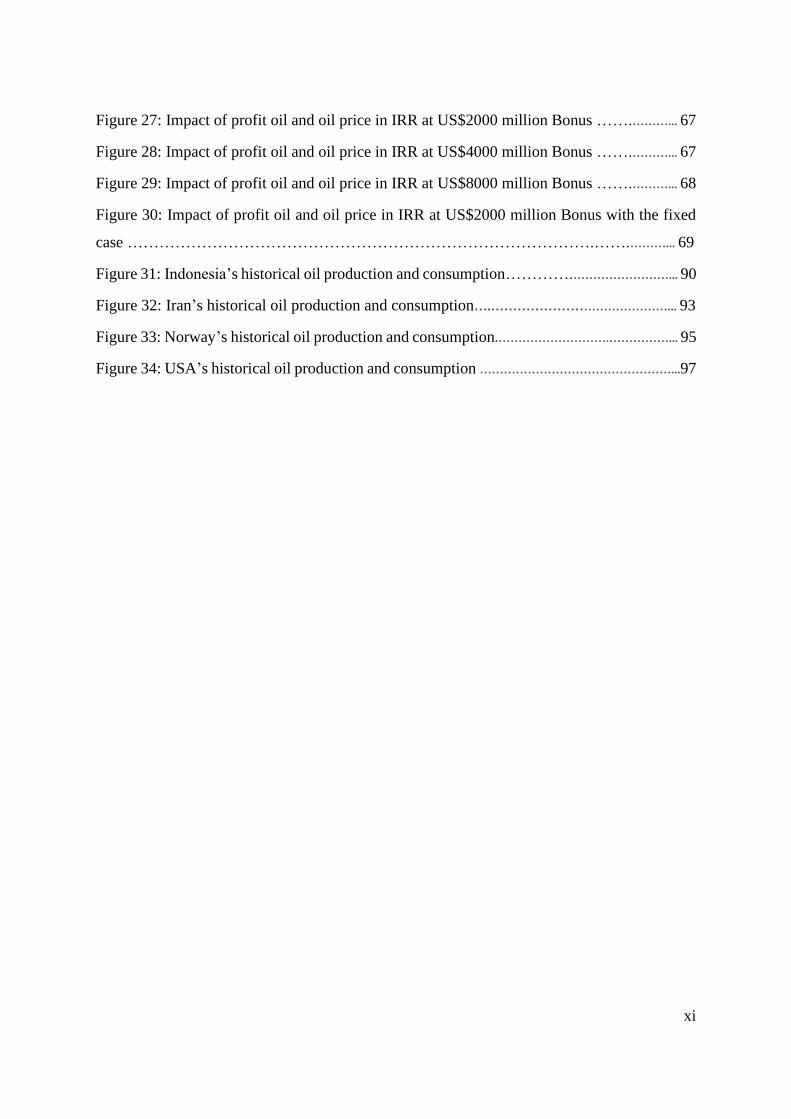
Figure 1 below illustrates the life time of a conventional reservoir project, where the
whole development takes place prior to the generation of revenue. It is an investment decision
that requires the revenue from production to payout for the early investment, which usually
happens in 5 years on a typical offshore field (LUCCHESI, 2011; SZKLO; CARNEIRO;
MACHADO, 2008). The cashflow follows the production profile that, for a conventional
reservoir start ramping-up until reaching a plateau that will last for some years depending on
the existing reservoir pressures. After that, the production and consequently the revenues start
to decline until the field is ready for abandonment when the costs to operate it is greater than
the revenue.
Figure 1: Typical oil and gas offshore, conventional reservoir cashflow
Source: Based on (LUCCHESI, 2011)
As a comparison, in Figure 2 there is an example cashflow for an unconventional
reservoir field. In this case the investment and production happen almost simultaneously as the
production profiles have a peak and fast decline, requiring many wells to be drilled throughout
the life of the field.
1 2 3 4 5 6 7 8 9 10 11 12 13 14 15 16 17 18 19 20
Years
Revenue Capex Opex Cashflow

9
Figure 2: Typical oil and gas offshore, unconventional reservoir cashflow
Source: Based on (KLEINBERG et al., 2016)
Therefore, given the nature of the typical offshore conventional reservoir cashflow, large
investments are required prior to monetizing the hydrocarbons. Usually, host countries do not
have the technical, human or financial resources to make investments that will take a long
period to mature.
For this reason, governments establish their petroleum law, or make direct negotiations
with the companies to allow them to make the required investment to generate profit in the
future for the companies but also to remunerate the governments. This balance between
government take and the companies return has been done under different types of contractual
arrangements over the time, being influenced by external factors, among others, such as price,
supply and demand for oil.
2.1.1.2 Ownership of reserves
To discuss ownership of reserves in fiscal terms, first it is necessary to determine how
the nations control their natural resources and what are the options they have to grant the private
companies the access to it.
Although today the sovereign of a nation signifies total control over a country resource,
in the past, the situation was that clear. There were situations when some countries faced
external pressure when deciding to unilaterally breaking existing oil and gas commercial
contracts, with even severe economic consequences. The main example was Mexico. In 1938,
1 2 3 4 5 6 7 8 9 10 11 12 13 14 15 16 17 18 19 20
Years
Revenue Capex Opex Cashflow

10
they nationalized their oil industry expropriating all foreign oil companies´ assets. At the same
time, they created Pemex, their national oil company (SMITH, 2000a). The leaving companies
promoted an international boycott to Mexican oil and seek support for an official American
retaliation on international trade to the country (MAURER, 2011). Although the US
government did not engage in the call, it still took Mexico some time to find new markets for
its exported oil and new suppliers for the imported machinery (MAURER, 2011).
Mexico was the first, of a series of nations, that took actions towards increasing the
control over their mineral resources in detriment of private contractors. The next actions
included nor only nationalization but also revision of contractual terms in oil and gas
exploration and production. However, in the late events, the countries did not suffer the same
as Mexico. The main reason was the adoption, by the United Nations General Assembly (vote
of 87 to 2 with 12 abstentions), in 1963, of a Resolution on Permanent Sovereignty over Natural
Resources. By supporting this resolution, the countries, including the United States
“expressively sanctioned actions by foreign governments that unilaterally changed or revoke
long-term mineral development agreements” (SMITH, 2000a). This was the case for Iran in
1951 and lately the creation of OPEC in 1960, a collective act of sovereignty of oil exporters
(SMITH, 2000a).
Nowadays, according to the legal concept of ownership, “all mineral ownership regimes
are based on the jurisprudential theory of state sovereignty. The sovereign of a defined
geographical area has exclusive legal dominion over the area, including its natural resources.
Based on this concept, the petroleum law will define how property is assigned to mineral
resources. The sovereign can recognize private ownership of these resources or it can treat
them as State-owned. The sovereign can require all development of State-owned minerals to
be accomplished by a State agency, or it can authorize development by private companies,
including foreign corporations” (SMITH, 2000a).
Ownership of oil resources is important for companies as their value is directly associated
to the amount of reserves they have in their books. From a government perspective, maintaining
an oil stock can be strategical for economic and geopolitical purpose, as most economies are
based on oil products. Therefore, ownership is a key point taken into consideration when fiscal
terms are designed by host countries.
For a long time, governments allowed foreign companies to explore and produce their
mineral resources by conceding them areas where they could act by prospecting, extracting,

11
exporting and monetizing the oil against a tax payment, usually through royalties. By
conceding the companies a geographical area to work, the governments are giving them
ownership over the resources obtained in that area, it is a transfer of rights from the State to the
companies once they have permission to dispose the resources in their best interest.
This is the case in most jurisdictions where petroleum law establishes State ownership
for mineral resources, but there are exceptions such as USA, Canada and possibly same other
small countries (SMITH, 2000a) The principles of English common law provide that the owner
of the soil owns the minerals beneath his land, with the except of gold and silver which are
traditionally owned by the sovereign. United Kingdom, however, have changed their law to
rule against the principles of common law declaring, in 1884, that ownership of oil and gas is
in the Crown. Other countries also changed their law the other way around. Mexico which
originally followed the civil law basis of mineral law ownership regime, have changed its
legislation providing that petroleum and natural gas were the property of the owner of the soil
in 1892, reverting back to its original principal in the Constitution of 1917 (SMITH, 2000a).
Even in common law countries where there is provision for ownership of mineral resources by
the owner of the land, the State still holds the majority of oil accounting for the offshore
reserves, which are owned exclusively by the state (SMITH, 2000a)
Although concession of a land and ownership is still used in many countries as a fiscal
model to explore and produce hydrocarbons, there are other ways to allow companies, State-
owned or private, to develop a country’s mineral resources. These modalities usually include
more restrictions to the resources, at different grades, which can vary from treating them strictly
as contractors to a more hybrid combination of benefiting from their services but also allowing
them some discretion on disposing of the oil. The contracts can be called service contracts or
production sharing agreements, which will be described in more details further in this chapter.
Based on their sovereignty, the countries define their mineral law according to how
ownership, if any, will be assignment to the companies, with the broad type of fiscal terms
included in concession, service contracts or production sharing agreements.
2.1.1.3 Taxes commonly used in fiscal systems
Taxes are the instrument governments use to fund their activity. The amount of
collected taxes will vary according to how each jurisdiction understands the State participation
(UNITED NATIONS, 2017). A tax system can be composed of different types of taxes at
12
different jurisdictional levels, but usually taxes are charged on individual and companies´
incomes. In economic terms, taxation transfers wealth from households or businesses to the
government. The same way, taxes applied to oil business aims to promote a balance distribution
of the petroleum rent between the State and companies (UNITED NATIONS, 2017).
The existence of a petroleum rent in the same sense of the land rent proposed by David
Ricardo in his work “On the Principles of Political Economy and Taxation” from 1817
(RICARDO, 1817), is based on the principle that petroleum fields, as lands, might have
different costs of production, with some being more productive than others, generating an
economic advantage and therefore a petroleum rent. The reason behind the existence of these
rents are based on the following factors (TOLMASQUIM, 2011):
• Rent of mines: this type of rent differentiates the oil fields according to the
accessibility of the resources, like onshore and deepwater offshore fields, high
permeability vs low permeability reservoirs; fields with high productivity wells
vs low productivity wells;
• Rent of position: the rent here is attribute to the fields located closer to the
consuming centers, reducing their transportation costs and therefore increasing
the rent for those fields with better position;
• Rent of quality: in this case the rent comes from the quality of the resources that
provides a high commercial value for it, like higher API grade and lower level of
contaminants;
• Rent of technology: technology can make production more efficient and therefore
create a rent in the oil industry (TOLMASQUIM, 2011).
The petroleum rent is related to the economic or supernormal profit (JOHNSTON, 1994),
a gain that exceeds the normal profit obtained after remunerating the costs and the invested
capital. Assessing the petroleum rents and creating a reasonable distribution between the States
6and Companies is not a straightforward task.
The regular national tax system is usually not sufficient to extract the petroleum rent, the
reason why petroleum fiscal systems are put in place. When building or selecting an oil and
6 For democratic regimes, the production period of a conventional resource is longer than their terms, making
this a State decision that will last through different governments.

13
gas fiscal model, governments are trying to optimize their government take from the oil
business. Although taxes can be created in many formats, historically oil and gas fiscal systems
have some traditional instruments described in the list below:
• Bonus: this tax can be used in different ways throughout the life of the oil field.
It is usually associated to an acquisition cost of an area to be explored (SZKLO;
CARNEIRO; MACHADO, 2008), but it is not limited to this use. It can also be
paid as a compensation for extra production, as a production bonus (TORDO,
2007). It can be a lump sum payment or paid at different moments of a field life
(TORDO, 2007). If associated with an acquisition it will be paid when the area is
obtained, either through a competitive bid or through a direct negotiation. A lump
sum payment at the beginning of a project shall have a balance value in
comparison with the gains that will come in the future, as the cashflow of such
projects present a long time of pure investments before making profit. A key
element for setting the acquisition bonuses’ values are the risks involved in a
project. A different perception of those risks from the government, setting the
bonus, and companies, aiming to acquire blocks, might create a situation of low
or high competition if bonus are set too high or too low, respectively, according
to the companies’ views. For sure, the attractivity of an area is not determined
only by a bonus payment, it is a combination of factors, but since it is usually an
early lump sum payment, it can have a significant impact in the cashflow.
• Royalties – the taxes paid to the landowners for the right to explore minerals in
their land. The origin of this word is related to royal family as they were the first
owners of the land. The world remains the same but the owners are now
represented by the State or the actual land owner according to the type of
jurisdiction. Royalties are usually applied on the gross revenue, making it a firm
return to governments independent of how profitable the project is. It can be a
fixed amount throughout the life of the field (TORDO, 2007) but it can also come
in tranches, according to production (TORDO, 2007). Royalties can be collected
in cash or in kind. Given the importance of oil for governments to maintain their
security reserves, if they do not have a national oil company from where they can
promptly obtain oil, they can choose to receive the royalties´ payment in oil, i.e.,
in kind, as is the case in USA (MCMICHAEL; SPENCER, 2001).

14
• R-Factor – this is a tool used to adapt taxes to be charged in a sliding scale manner
(JOHNSTON; JOHNSTON, 2015; TORDO, 2007). This way the R-factor can be
determined based on a variable parameter that can reflect the profitability of the
field and therefore adjust the taxes according to its size and productivity7
(JOHNSTON; JOHNSTON, 2015). It can be used as an incentive to small fields
development. Royalty, for example could be a sliding scale rate based on the net
profit of the field (JOHNSTON; JOHNSTON, 2015), making the net profit the
R-factor in this case.
• Taxes on profits – usually defined by regular national income taxes, but there can
also be surtaxes, extra taxes on profits if excessive (windfall) returns are achieved.
Income taxes are common in most countries as part of the standard economy, not
particular to an oil and gas industry. This is a way the companies share their gains
with governments. In oil and gas industry, profit takes some years to be achieved
and governments usually recognize the investment made in the early years of the
project by allowing a late recovery through depreciation or carrying losses for a
period of time. However, governments can also create restrictions to establish
what can be deducted or not from income tax purposes, like signature bonuses for
example (TORDO, 2007).
Depending on how a fiscal system is created it can be more progressive or regressive.
Both concepts are related to how the investment decisions impact the results A model is more
progressive if the taxes are collected based on the results of the project, the better the results
the higher the taxes. In this sense, the taxes will not distort the results when an investment
decision is made. On the other hand, taxes that are payed up front, like bonus, or that will be
charged independently of the results of the project, are considered regressive. Although they
create a firm revenue for the governments, they distort the impact of the investment decisions
once those taxes will be collected in case of good or bad results (TORDO, 2007).
2.1.2 Concession Contracts
“Historically, leases and concessions have been the most commonly used agreements
between oil companies and governments or mineral owners. In such agreements, the host
7 The Brazilian Special Participation Tax is a R-Factor as it is applicable in the profit based on the productivity
of the field.

15
government or mineral owner grants the producing company the right to explore for, develop,
produce, transport, and market hydrocarbons or minerals within a fixed area for a specific
amount of time. The concession and production and sale of hydrocarbons from the concession
is then subject to rentals, royalties, bonuses, and taxes. Under these types of agreements, the
company typically bears all risks and costs for exploration, development, and production and
generally would hold title to all resources that will be produced while the agreement is in effect.
Reserves consistent with the net working interest (after deduction of any royalties owned by
others) that can be recovered during the term of the agreement are typically reported by the
upstream contractor. Ownership of the reserves producible over the term of the agreement is
normally taken by the company; however, if the contract is voided for any reason, ownership
reverts back to the mineral owner or government (MCMICHAEL; YOUNG, 2001).”
The figure below illustrates how the revenue is divided with the between the contractor
and the government. In this case, the f is under the contractor´s control. He is the one
responsible to collect royalties and taxes to the government and also to make all the required
investment to the project. The project income is normally subjected to taxes. The middle
column indicates the project and the arrows indicate which part, either the government or the
contractor is responsible for what.
Figure 3: Concession contract structure
Source: Based on (JOHNSTON, 1994)
Revenue
Royalty
Costs
Profit
Taxes
Contractor Government
Total Profit
Received

16
2.1.3 Production Sharing Agreements
“In a production-sharing agreement between a contractor and a host government, the
contractor typically bears all risks and costs for exploration, development, and production. In
return, if exploration is successful, the contractor is given the opportunity to recover the
investment from production (cost hydrocarbons), subject to specific limits and terms. The
contractor also receives a stipulated share of the production remaining after cost recovery
(profit hydrocarbons). Ownership is retained by the host government; however, the contractor
normally receives title to the prescribed share of the volumes as they are produced. Reserves
consistent with the cost recovery plus profit hydrocarbons that are recoverable under the terms
of the contract are typically reported by the upstream contractor. ” (MCMICHAEL; YOUNG,
2001)
The production sharing agreement (PSA) started in Indonesia in an effort to exercise
more control over their resources, increase the participation of the State on the projects profits
and start a transfer of knowledge to the country (TOLMASQUIM, 2011) . Soon many countries
followed the example with the same intent.
The traditional structure for a PSA assumes a cost recoverable rate and a profit oil rate.
The first one is the percentage under which the contractors will recover their costs. After the
recovery of the costs the remaining volume is shared between the government and the
contractor. The first PSC did not have royalties payment, nor taxes, but with the time, different
jurisdictions adapted this type of contract making modifications (TORDO, 2007; UNITED
NATIONS, 2017). The figure below describes a PSC with royalty and taxes. The middle
column representing the project and the contractor and government columns to illustrate the
flow of income, costs and taxes.

17
Figure 4: General production sharing agreement structure
Source: Based on (JOHNSTON, 1994)
2.1.4 Service Contracts
2.1.4.1 Revenue-Sharing/Risked-Service Contracts
“Revenue-sharing contracts are very similar to the production-sharing contracts
described before, with the exception of contractor payment. With a risked-service contract, the
contractor usually receives a defined share of revenue rather than a share of the production. As
in the production sharing contract, the contractor provides the capital and technical expertise
required for exploration and development. If exploration efforts are successful, the contractor
can recover those costs from the sale revenues.” (MCMICHAEL; YOUNG, 2001)
“A very similar type of agreement is commonly known as a risked-service contract. This
type of agreement is often used when the contracting party provides expertise and capital to
rehabilitate or implement improved recovery operations in an existing field. Provided that the
requirements for reserves recognition are satisfied, reported reserves are typically based on the
economic interest held or the financial benefit received.” (MCMICHAEL; YOUNG, 2001)
The same way, as in the prior petroleum fiscal models description, in figures 5 and 6 the
project and the flow views for contractors and government are described.
Revenue
Royalty
Cost Recovery
Profit Split
Taxes
Contractor Government
Cost Oil
Profit Oil % Profit Oil
(100 - %)
Total
Entiltlement Oil

18
Figure 5: General revenue-shared contract structure
Source: Based on (JOHNSTON, 1994)
Figure 6: General risked-service contract structure
Source: Based on (JOHNSTON, 1994)
2.1.4.2 Pure-Service Contracts
“A pure-service contract is an agreement between a contractor and a host government
that typically covers a defined technical service to be provided or completed during a specific
period of time. The service company investment is typically limited to the value of equipment,
tools, and personnel used to perform the service. In most cases, the service contractor’s
reimbursement is fixed by the terms of the contract with little exposure to either project
performance or market factors. Payment for services is normally based on daily or hourly rates,
a fixed turnkey rate, or some other specified amount.
Revenue
Royalty
Cost Recovery
Revenue Split
Taxes
Contractor Government
Cost Revenue
Profit
Revenue% Profit Revenue
(100 - Oil %
Total Revenue
received
Revenue
Investment
Expertise
Peformance
Taxes
Contractor Government
In-kind or
monetary
payment
Remainder after
contractor
payment
Total payment
received
Contractor payment

19
Payments may be made at specified intervals or at the completion of the service.
Payments, in some cases, may be tied to the field performance, operating cost reductions, or
other important metric.
Risks of the service company under this type of contract are usually limited to
nonrecoverable cost overruns, losses owing to client breach of contract, default, or contract
dispute. These agreements generally do not have exposure to production volume or market
price; consequently, reserves are not usually recognized under this type of agreement.”
(MCMICHAEL; YOUNG, 2001)
Figure 7 below illustrates the model.
Figure 7: General pure-service contract structure
Source: Based on (JOHNSTON, 1994)
2.1.5 Others
“There are other types of petroleum fiscal contracts that resume the ownership of the
resources on the financial resource holder. Under this category are the loan agreements, where
the contract is executed under a loan agreement that will be remunerated in case of success;
production loan, forward sales, carried interest, purchase contract, production payment and
conveyances. In all cases, there is a third party involved with the contract in a position of
financial investor, that have vested rights over the field, and will be remunerated through a
compensations scheme, production itself, a higher participation share in the future, buyers of
the contract itself or the buyers of the future revenue.” (MCMICHAEL; YOUNG, 2001)
Revenue
Investment
Expertise
Peformance
Taxes
Contractor Government
Monetary
payment Remainder after
contractor
payment
Total payment
received
Contractor payment
Taxes
20
2.2 Discounted Cashflow Analysis
When accessing the value of oil and gas assets, it is possible to use a market or an income
approach. The market approach consists on comparing the asset or company being assessed
with similar assets traded in the market. This method is based on external information, on how
investors see the value of that asset. The income approach relies on the income value the asset
will generate, based on intrinsic company data. The discounted cashflow is a type of income
methodology (KIBBEY; RASOR; BOSTWICK, 2017).
The discounted cashflow (DCF) is widely accepted in oil and gas business due to the
singular geology nature of the projects. In this method, the asset is evaluated based on the
cashflow it will generate in the future, throughout its lifetime. However, in this method it is
necessary to have a detailed information about the asset and reasonable assumptions for future
macroeconomic and commercial parameters on top of the good understanding for the location
tax system.
The results will be a projected annual free cash flow of the asset for its lifecycle that is
discounted to present using a discount rate. This rate is variable according to each company’s
Weighted Average Cost of Capital (“WACC”), that reflects the risk of the projected cash flows.
The limitation of a DCF analysis lie on the level data required and the uncertainties related to
future projections such as macroeconomic and commercial variables.
An economic analysis can be done at different levels of details and scope, especially if
aggregated with financial considerations. One important point is related to whether the cost of
financing the project is included or not in the analysis, meaning geared or ungeared assessment,
respectively. For asset economics in upstream projects usually ungeared analysis are made
based on the equity only. Therefore, a typical simplified cashflow structure considering only
income taxes will be as follows:
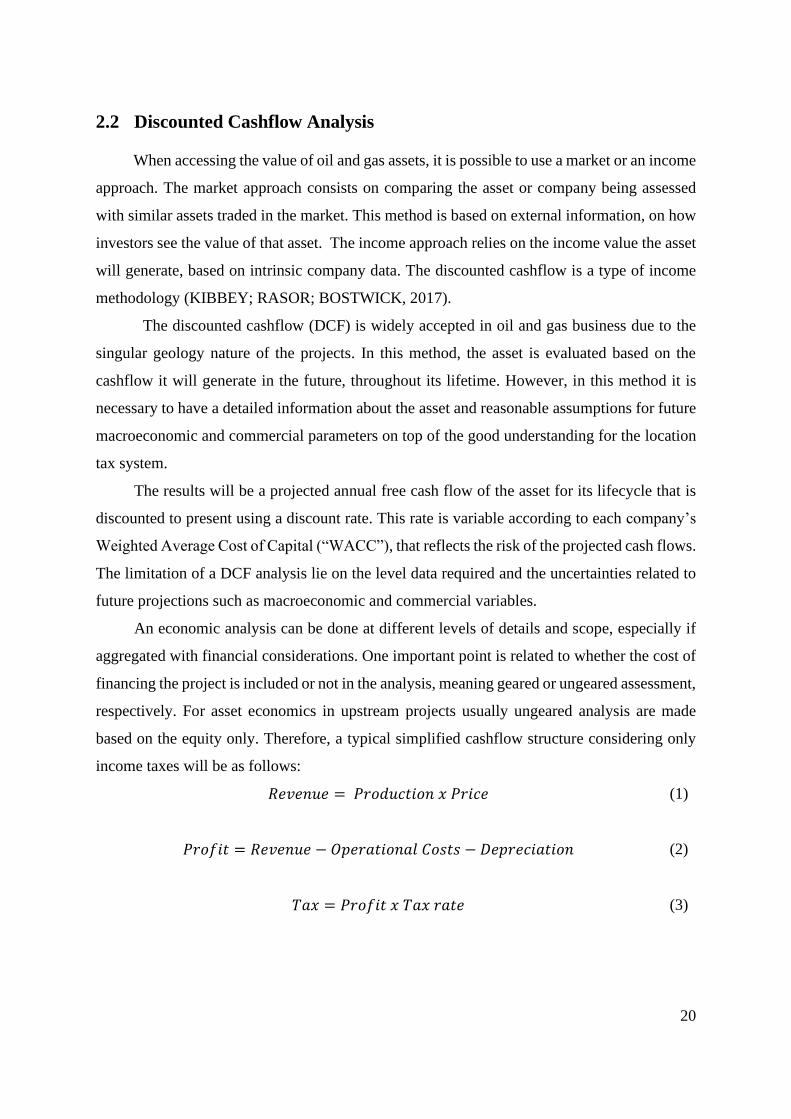
𝑅𝑒𝑣𝑒𝑛𝑢𝑒 = 𝑃𝑟𝑜𝑑𝑢𝑐𝑡𝑖𝑜𝑛 𝑥 𝑃𝑟𝑖𝑐𝑒 (1)
𝑃𝑟𝑜𝑓𝑖𝑡 = 𝑅𝑒𝑣𝑒𝑛𝑢𝑒 − 𝑂𝑝𝑒𝑟𝑎𝑡𝑖𝑜𝑛𝑎𝑙 𝐶𝑜𝑠𝑡𝑠 − 𝐷𝑒𝑝𝑟𝑒𝑐𝑖𝑎𝑡𝑖𝑜𝑛 (2)
𝑇𝑎𝑥 = 𝑃𝑟𝑜𝑓𝑖𝑡 𝑥 𝑇𝑎𝑥 𝑟𝑎𝑡𝑒 (3)

21
𝐶𝑎𝑠ℎ 𝑓𝑙𝑜𝑤 = 𝑅𝑒𝑣𝑒𝑛𝑢𝑒 − 𝑂𝑝𝑒𝑟𝑎𝑡𝑖𝑜𝑛𝑎𝑙 𝐶𝑜𝑠𝑡𝑠 − 𝐼𝑛𝑣𝑒𝑠𝑡𝑚𝑒𝑛𝑡 𝐶𝑜𝑠𝑡 − 𝑇𝑎𝑥
− 𝐷𝑒𝑐𝑜𝑚𝑖𝑠𝑠𝑖𝑜𝑛𝑖𝑛𝑔 𝐶𝑜𝑠𝑡𝑠 + 𝑆𝑎𝑙𝑣𝑎𝑔𝑒 𝑉𝑎𝑙𝑢𝑒
(4)
This operation will occur on an annual basis until the costs for operating the fields
exceeds the revenue generated by the production. Those yearly cashflows will then be
discounted to the present date according to the following formula:
𝑃𝑉 =𝐶𝑇
(1 + 𝑟)𝑇
(5)
Where:
PV is the present value
CT is the cashflow in the period T
T is the period
r is the discount rate.
At the end the sum of all the present values will the net present value (NPV) of the
cashflow. This is the metric used to demonstrate the absolute value of a project.
Another important metric that can be extracted from the cashflow is the internal rate of
return (IRR). This metric is related to the discount rate. It is the discount rate at which the NPV
will be zero. The value of this metric is to given indication of the discount rate, which can be
different according to the companies´ ability to finance their projects and assume risk.
Part of the costs to the deducted for taxes calculation is the depreciation. Depreciation is
an accounting instrument to consider the aging of the equipment used in a project. Profit
calculation considers the deduction of the operational costs from the revenue, once both of
them occur in the same counting period. Equipment is used throughout the life of the field or
for a long time, requiring a different methodology to be discounted from the revenue to generate
the profit. The depreciation is a way to account for the life of the asset and discount it from the
profit over a period.
The depreciation can be done in different ways, the straight-line basis and units of
production are two of them(TORDO, 2007) . The first one assumes the investment schedule
will be linear for a period of time. The second one assumes the asset will last throughout the
life of the field and will be depreciated on the same production profile. Figures 3 and 4 below
illustrates both depreciation methods for an example of a US$ 2000 mln investment:

22
Figure 8: Straight line depreciation
Source: Based on (MOTTA; CALÔBA, 2002)
Figure 9: Unit of production depreciation
Source: Based on (MOTTA; CALÔBA, 2002)
Depreciation can be used as a fiscal incentive as it impacts directly the taxable profit,
reducing it and consequently reducing the due income taxes. For this reason different
depreciation schedules that could anticipate the deduction would mean early benefits to a
project (TORDO, 2007) . One of the options to benefit the tax payer is through an accelerated
depreciation. In this modality, the method of depreciation is the same, but the distribution of
the depreciated costs over the time is different, with more value occurring earlier.
0
50
100
150
200
250
0
20
40
60
80
100
120
1 2 3 4 5 6 7 8 9 10 11 12 13 14 15 16 17 18 19 20 21 22 23
US
$ m
illi
on
tho
usa
nd
bar
rels
per
day
Production Depreciation Straigh line
0
50
100
150
200
250
0
20
40
60
80
100
120
1 2 3 4 5 6 7 8 9 10 11 12 13 14 15 16 17 18 19 20 21 22 23U
S$
mil
lio
n
tho
usa
nd
bar
rels
per
day
Production Depreciation UOP

23
2.3 Application of petroleum fiscal systems
Worldwide, countries make use of the fiscal systems to balance incentives to private
investments in the oil business and the government take. This balance requires constant
revision to accommodate the global changes in politics, economics and technology that have
impact on oil and gas products supply and demand. Some examples of how these instruments
have been applied are described in Appendix III highlighting the variety of fiscal regimes and
also how they changed over the time, the countries regulatory history, their relevance on global
oil and gas production and reserves and their current fiscal system.
Other countries experiences serve as examples for new policies and adjustments of the
existing fiscal terms in Brazil. Although each country has its own singularities, it is still
possible to infer conclusions from the correlation of production changes in fiscal terms over
the time. In Annex II there is a description of the fiscal systems in Indonesia, Iran, Norway and
United States.
3 BRAZIL´S OIL AND GAS FISCAL REGIMES
The national oil and gas industry had gone through different phases all over the years.
Brazil started its history as a massive oil importer becoming a net oil exporter only in this
century (ANP, 2018a; LUCCHESI, 1998). At the same time, the regulatory model went
through moments of State monopoly period but also of openness to private investors. From
1953 to 1997, Petrobras was the only company allowed to invest in exploration and production.
After this period until the present data, the oil market in the country is opened to private
investors, which can make investments under concession contracts or production sharing
contacts, depending on the area (LUCCHESI, 2011). The general fiscal system of the country
includes the use of indirect taxes and special tax regimes created for the industry (COIMBRA;
ALMEIDA, 2012).
This chapter describes the oil and gas industry in Brazil and the legal framework that
permeated the changes over the time of the fiscal regimes established in the country. Also
included is a summary of the country´s general fiscal system applicable to the industry.

24
3.1 Oil and gas history in Brazil
Kerosene was first petroleum byproduct used commercially in Brazil replacing the
whales’ oil in the lightening system of the major cities in the country (ANP, 2019). Electricity
soon replaced the use of oil in the lightening system, but oil became even more necessary in
the incipient automobile industry at that time (SHELL, 2012). In 1910, Brazil's economy was
driven mostly by coffee exportation, but the society was already experiencing the use of cars.
The first models were imported, but from 1920, Ford and General Motors, started a line of
assembly in the country, all material were imported but the cars were assembly in Brazil
(NASCIMENTO, 2016). The major international oil companies, Shell, Standard Oil and
Texaco, were already in the country (ANP, 2019) first selling kerosene to latter participating
with gasoline and fuel oil (SHELL, 2012).
This initial period of the century was also marked by an intense search for oil. On the
global scenario, this period encompasses big discoveries in USA, Persia and Indonesia, driving
private efforts to find oil (YERGIN, 1991). Although, the first Brazilian discovery took place
in São Paulo between 1892-1897 (LUCCHESI, 1998), it was not until 1939 that the first
commercial discovery was made in the Lobato well in Bahia (LUCCHESI, 1998).
After both global wars, the use of oil had become strategical and have expanded, with
also the petrochemical industries (TORRES, 1997; YERGIN, 1991).
In the fifties, Brazil´s economy went through changes, with many investments in the
industrialization, moving from a predominantly rural based economy (FURTADO, 2005). The
restrictions imposed by World War II, impacted the availability of international goods,
stimulating the creation of a national industry to replace the items that were no longer available
(FURTADO, 2005).
The strategic value of the oil was reflected in Brazil as an internal movement to
nationalize the industry (DIAS; QUAGLINO, 1993). In 1953, the major international oil
companies were present in both the upstream and downstream segments and were severe
affected when Petrobras, the national oil company, was created in that year to hold the
monopoly of the activities of exploration, production, commercialization, refining and research
(DIAS; QUAGLINO, 1993). The only segment of the industry still opened for the private
companies was the distribution of fuels (DIAS; QUAGLINO, 1993).
Petrobras pace to make discoveries was slow at the beginning. While counting on the
revenues from the Bahia onshore production, the company invested in developing the

25
knowledge in geology and petroleum science, by training people mainly in the United States
to perform studies on the sedimentary basins all over the country. Many wells were drilled at
that time but fewer discoveries were made (LUCCHESI, 1998).
The oil shocks in 1973 and 1975, increased the cost of imported oil impacting the most
economies, including Brazil (EIA,2020; Yergin,1994). The country dependency on imported
oil aggravated the need to find reserves. At that time, based on the frustration about the
domestic exploration results, an international branch of Petrobras was created to look for oil
outside the country (LUCCHESI, 1998).
However, the increase in oil prices also enabled deeper offshore exploration, which
continued based on the initial drilling on the continental platform with the discoveries of the
Garoupa, Namorado and Enchova, among others (DE MENDONÇA; SQADINI; MILANI,
2003; LUCCHESI, 1998).
The deeper offshore proved to be prolific and in the eighties the first big discoveries were
made, first in 1979 with the Albacora field, than with Marlin, Barracuda and Roncador fields,
with oil in place estimated from 2.7 to 9 bln bbl (DE MENDONÇA; SQADINI; MILANI,
2003).
In 1997, changes were made in the regulatory system , opening the industry to private
investors and creating new players in the industry (LUCCHESI, 2011). The discoveries
continued to happen increasing the countries production and reserves (MENDONÇA;
SPADINI; MILANI, 2003). However, in 2007, a new oil province was found which changed
the country´s position for production and reserves, it was the pre-salt.
The discovery of the pre-salt province, a thick layer of rocks created before the salt and
located under this salt layer, created a new perspective in terms of reserves and production in
the Campos and Santos basins (PEDROSA JR; CORRÊA, 2014). According to (Jones and
Chaves, 2016) the area can aggregate 144 bln boe and in 2019, the proved reserves were around
13 bln boe (EIA, 2020b). If all the estimated volumes were to be included as reserves, that
would shift Brazil from the 15th position to the 5th, behind only Venezuela, Saudi Arabia,
Canada and Iran (EIA, 2020b). The graph below illustrates the increase of production in Brazil
after the discovery of the pre-salt.

26
Figure 10: Brazil’s historical oil production and consumption
Source: EIA, 2020a
3.1.1 Legal Framework history of the industry in Brazil
Brazil oil regulation history alternated moments with less and more State intervention,
with a long State monopoly period before opening the market to private investors in 1997 until
now (ALMADA; PARENTE, 2013; ANP, 2019). The current legal framework combines the
existence of concessions contacts, production sharing agreement and a third modality called
transfer of rights or onerous assignment contract (Transfer of Rights) (ALMADA; PARENTE,
2013).
Brazil oil industry remotes to the nineteenth century. At that time, there were not specific
regulations related to oil and gas industry. In this scenario, the first concession contract was
awarded to a British citizen to extract oil and other mineral for 90 years on Camamu and Ilhéus
counties in 1864 (LUCCHESI, 1998). Those areas never produced oil but it was a
demonstration of the participation of private entrepreneurs in the oil industry and the
application of a classical concession model in Brazil.
Below are described the key regulations related to oil and gas industry until 1953 (PPSA,
2018), when Petrobras, the national oil company (NOC) was created. They represent the
growing of petroleum participation in the political and economic life of the country at the same
time this source of energy was reaching a higher participation in the world economies.
• Constitution of 1824 – there was no clear provision in this law regarding the
mining rights, but doctrine understood that there was a separation of surface and
0
500
1000
1500
2000
2500
3000
3500
4000
19
73
19
75
19
77
19
79
19
81
19
83
19
85
19
87
19
89
19
91
19
93
19
95
19
97
19
99
20
01
20
03
20
05
20
07
20
09
20
11
20
13
20
15
20
17
tho
usa
nd
bar
rels
per
day
Production Consumption

27
subsurface rights, with the subsurface belonging to the State in the best interest
of the society. In this case, the State could authorize a private agent to explore
the subsurface through concessions. In this period, the Emperor Dom Pedro II,
gave 3 exploration concessions, one to explore petroleum in the Province of
Bahia and two in the Province of São Paulo (PPSA, 2018).
• Constitution of 1891 – this was the first constitution under the republican
government and it was influenced by the American model. Therefore, it included
expressively in its article 72 that the owner of the land was also the owner of the
subsurface and consequently would have control over the existing minerals in
the land (BRASIL, 1891).
• Federal Decree no 6323/1907 – created the Geological and Mineralogical Service
in Brazil to study and maintain geological data of the country (BRASIL, 1907).
• Federal Decree no 2933/1915 (Calógeras Law) – it was the first mining
legislation in Brazil to regulate its ownership. In its text it includes oil as a
possible as a mine product. It also had provision to separate the surface and
subsurface rights (BRASIL, 1915).
• Law no 4265/1921 – in this law there was a new regulation of the property but
it was also the first time the mining exploitation activity was regulated. In this
law the term fossil fuels were included as a mining product, expanding the
possibilities to also natural gas (BRASIL, 1921).
• Constitution of 1934 – this new constitution was done under the Mexican
influence and in recognition of the petroleum as a strategical resource. For this
reason, the article 118 brought an express separation of the surface and
subsurface rights, being the State responsible for the control, supervision and
concession of those areas (BRASIL, 1934a).
• Federal Decree no 23979/1934 – Creates the National Department of Mineral
Production (DNPM) (BRASIL, 1934b).
• Federal Decree no 24642/1934 – First Code of Mines including definitions of oil
and gas deposits and clear statement of the State ownership of the all those
resources. (BRASIL, 1934c).
• Federal Decree no 366/1938 – includes a section dedicated to oil and gas in the
Code of Mines (BRASIL, 1938a).
28
• Federal Decree no 395/1938 – rules about commerce of oil, including
importation, exportation, distribution. It also nationalized the refining sector in
the country and created a separate agency from the DNPN to oversee and regulate
the oil industry (BRASIL, 1938b).
• Federal Decree no 3236/1941 – defines areas and conditions to exercise the oil
exploration in the country (BRASIL, 1938c).
• Law no 2004/1953 – creates Petrobras and established the State monopoly of the
whole segment in Brazil with the exception of the distribution (BRASIL, 1953).
Until 1976, Petrobras was the only company acting in the segment, and since its creation
it dedicated most of the time to understand and search for oil in the sedimental onshore basins
in Brazil. The results were not material compared with the increase in oil demand and
consequently importation of crude. The first oil shock in 1973 increased he oil barrel from
$3/bbl to $12/bbl (YERGIN, 1991) increasing the weight of imported oil the country´s trade
balance. In this scenario, in 1976, the government released a program to invite private oil
companies to look for oil in Brazil under a service contract (LUCCHESI, 1998). They were
also risk contracts as the costs incurred with exploration would not be compensated in case of
not finding oil, only if a commercial field was found and developed than the company would
have its costs reimbursed. International companies like Shell, Exxon, Texaco, BP and also
national such as Camargo Correa and Paulipetro participated in the exploratory campaign but
only one discovery was considered commercial to be developed (LUCCHESI, 1998). It was
the Merluza field discovered by Pecten (LUCCHESI, 2011).
As the national production and discoveries were not increasing fast enough to face the
growth in demand, the government create an international branch for Petrobras aiming to find
reserves outside the country. It had presence in Colombia, Egypt, Madagascar and Iraq, among
others. In this last country Petrobras made the discovery of the giant field of Majnoon, that they
have lately negotiated with the Iraq government (DIAS; QUAGLINO, 1993).
Meanwhile, Petrobras continued its exploration activity in Brazil focusing, however on
offshore basins after an intensive onshore drilling with modest discoveries. The advance of
seismic technology and higher oil prices made offshore exploration and development
competitive. The outcome was discoveries that increased the country´s production over 3 times
from 1980 to 1990. Before 1980, the production had remained on the level of 1 80 kbbl/d for

29
over 12 years. And the production continued to grow. In 1997 the production reached 900
kbbl/d (ANP, 2018a; DE MENDONÇA; SQADINI; MILANI, 2003; LUCCHESI, 1998).
During the Petrobras monopoly period the fiscal regime was a tax-royalty system with
5% royalties for onshore and offshore production (BRASIL, 1953). Besides that, the company
was subject to the country tax system rules including income tax, and several jurisdictions VAT
type taxes.
In 1997 significant changes were introduced to the oil industry. After forty three years of
Petrobras monopoly, the existing legislations were replaced to open the market to private
investors.
At that that time, the latest Constitution of 1988, kept the Petrobras’ monopoly in its
terms but even so, an amendment to the Constitution (Amendment 9 from 1995) was approved
creating the option for the government to make concessions to private companies. This
modification allowed the Congress to legislate the terms under which those concessions would
happen, which was further defined in Law 9.478 from 1997 (ALMADA; PARENTE, 2013).
In the table below there are the original 1988 Constitution version along with the
modified text after Amendment 9 from 1995.
Table 1: Comparison of constitutional changes in 1988 Constitution
Original Version After Amendment 9 of 1995
Article. 177. The Union’s monopoly:
I- The exploration and mining of depo-
sits of oil and natural gas and other hy-
drocarbon fluids; . . . §1 The monopoly
referred to in this article includes the ris
ks and results arising from the activities
mentioned therein, being forbidden the
Union transferring or granting any kind
of participation, in kind or in value, the
exploitation of oil or natural gas depo
sits, except as provided in art. 20, § 1.
Article. 177. The Union’s monopoly: I The
exploration and mining of deposits of oil
and natural gas and other hydrocarbon
fluids; . . . § 1 The Union may contract
with State-owned enterprises or private,
carrying out activities referred to in
sections I to IV of this article and
complying with the conditions established
by law. § 2 The law referred to in § 1 shall
be provided on: I- the security of supply of
petroleum products throughout the national
territory; II- the recruitment conditions;
III- the structure and tasks of the Union’s
monopoly regulator ;
Source: Based on (ALMADA; PARENTE, 2013; BRASIL, 1988, 1995)
The changes in the Constitution enable the creation of a legal framework that was the
basis for the new model to be followed. In 1997, the Government enacted the Law 9478, known

30
as the petroleum law, where it established the rules for the concession contracts in Brazil and
how they would be applicable to all players that would come to join the recent opened market.
The new legal scenario included the creation of ANP, the Petroleum National Agency,
an independent regulatory agency. Its objective, among others, was to exercise regulation and
oversees the recent established rules for the market (LUCCHESI, 2011).
The legal framework for the concession model in Brazil is described in the table 2 below:
Tabela 2: Legal Framework for the Concession Contract in Brazil
Year Law Description
1995 Amendment 9 of
1988 Constitution
Created the possibility for the Government to make
concessions of areas to private investors explore and
produce hydrocarbons.
1997 Law 9.478 Established the parameters for the concession contracts,
created the National Petroleum Agency (ANP) and the
National Council for Energy Policies (CNPE), among
other provisions.
1998 Decree 2.705 Defined criteria for the calculation and collection of
government stakes referred to in Law 9.478 applicable to
the activities of exploration, development and production
of oil and natural gas, and makes other provisions.
Source: Based on (BRASIL, 1998; LUCCHESI, 2011)
The new model also required an adjustment to the fiscal system to increase the attractivity
of the industry. During the monopoly period, the companies providing services to Petrobras
were eligible to the suspension of taxes on the goods imported on a temporary basis, according
to the instruction SFR no 136/87. The benefit was conceived to any type of service for all stages
of petroleum chain, including refining, transportation, research, beyond activities directed
related to exploration and production. With the entry of the new companies, the Government
adjusted this benefit ruling to create a similar, but no equal, special tax regime, called Repetro
(DA SILVA, 2008).
The first pre-salt discovery happened in 2005, but it was in 2007 when Petrobras and
the Government announced the huge potential of the play, after Tupi discovery in 2006

31
(PEDROSA JR; CORRÊA, 2014). Based on the new facts, the Government created a new
fiscal regime to be applicable to the pre-salt and strategic areas, based on the production sharing
contract. Before that, some areas already under control of Petrobras were offered to the
company on a special transfer of rights regime called onerous assignment (PEDROSA JR;
CORRÊA, 2014).
After the announcement, in 2007, of the pre-salt play discovery, the discussions over the
proposed changes suspended the bid rounds activity, which had been happening, until then, on
an annual basis, at least. The first pre-salt area offered on a public auction was Libra, in 2013.
And it remained the only leased pre-salt area until 2017, when the pre-salt bid rounds started
to happen on a regular basis (ANP, 2018b).
The legal framework for the fiscal regimes created after the pre-salt was discovered is
described in table 3 below:
Tabela 3: Legal framework for the pre-salt and strategical areas in Brazil
Year Law Description
2010 Law 12.276 Created the Transfer of Rights regime, where the
Government transferred to Petrobras the right to produce
up to 5 bln bbl in the pre-salt area. Petrobras payment for
right was to be made with government bonds.
2010 Law 12.304 Creates the PPSA, the government company that
represents the State on the pre-salt contracts and on the
unitization agreements.
2010 Decree 12.351 Created the production sharing agreement for the pre-salt
and strategical areas and established the parameters for
the execution of them, among other provisions.
Source: Based on (BRASIL, 2010a, 2010b, 2010c; PEDROSA JR; CORRÊA, 2014)
3.1.2 Terms of the Concession Contract in Brazil
Law 9.478/1997 included the principles to be followed for the concession contract. The
key provisions according to (BRASIL, 1997a) were:
• The new exploratory areas would now be offered in auctions, the bid rounds,
promoted by the recent created agency, ANP;

32
• The contracts would have a term, divided into exploration and production phases,
with a possibility of extension for both phases. A declaration of commerciality
and a field development plan were the requirements to move from one phase to
the other;
• There would be a minimum exploration program, defined by ANP;
• ANP would promote the use of local content and the research of new
technologies.
The obligations associated to ANP were fulfilled with the bid parameters the agency
create on the Bid Rounds. On the first round, only the signature bonus was part of the auction
offer. In future rounds, however, the minimum exploration program, local content factor and
minimum exploration program were also part of the offer (ANP, 2018b).
As per the (BRASIL, 1997b) the government would participate on the rent of the projects
through the following contributions: signature bonuses, royalties, special participation and
retention fee for the area.
The royalties’ rates were defined to be 10% and would be applicable on the gross revenue
to calculate the due royalty. ANP, however could reduce the rate up to 5%, depending on the
attributions of the area. The gross revenue calculation was given by the volumes of oil and gas
produced on the fields every month multiplied by their respective prices. In the gas royalty
calculation unallowed flared and consumed gas were subjected to royalties’ payments as well,
while the gas used to increase production, as injected gas, was exempt of royalties. The
hydrocarbon prices were, initially (until 2017), defined as the higher of the average selling
price or the minimum prices set by ANP. In a recent revision of the prices to be used in the
gross revenue for royalties payment the price is now base on a basket of four similar oils
(BRASIL, 1997b, 1998, 2017a).
The special participation tax was created as part of the concessions contract. It can be
classified as an R-factor sliding scale marginal income tax rate, as the rates were based on field
productivity but applicable on profit, just like income tax. The rates vary according to different
water depths and different stages of the field, if it is in the beginning of production or in a more
mature phase. Annex I contains all the law terms related to the special participation tax
(BRASIL, 1997b).

33
The signature bonus, also created by (BRASIL, 1997b), was defined as part of the offer
made to acquire exploratory areas. The law assigned to ANP the responsibility to define the
bid rounds format but include the signature bonus a minimum requirement to compose the
offers. ANP also had the attribution to promote the development of local content and the oil
industry market. In this sense the parameters under which the companies competed for the areas
start with the bonus but later evolved to offers comprised of minimum exploration program
and local content commitments. Despite the changes over the years in the bid round terms, the
signature bonus continued to represent an important value to be paid upfront by the companies.
Another participation, part of the concession contract, was the retention fee. The value is
defined in each bid round for each area and is charged on a monetary value per area, varying
according to the phase the project is currently in (BRASIL, 1997b).
In order to fulfil its commitment to promote innovation and technology, ANP, included,
as part of the concession contracts obligations, a 1% rate to be applicable on the gross revenue
as a research and development fee, which is only due when special participation is being paid
(BRASIL, 1998).
3.1.3 Transfer of Rights in Brazil (Onerous Assignment)
In conjunction with the enactment of the Production Sharing Agreement Law, Brazil
enacted the Law 12,276/2010. The law authorized the Federal Union to give Petrobras the right
to explore and to produce up to five billion barrels equivalent of crude oil. Also, under this law,
the payment was made by Petrobras in federal debt securities (ALMADA; PARENTE, 2013;
BRASIL, 2010b).
The referred law provided the following terms for the contract:
• term of 40 (forty) years as from the date of its execution. This period may be
extended by a maximum of 5 (five) years, upon request of Petrobras;
• the rights were not transferable,
• the consideration to be paid by Petrobras included:
o the price to explore and produce oil and natural gas to the limit of 5 (five)
billions of barrels of oil equivalent of oil, in pre-salt areas
o royalties on the same conditions established by (BRASIL, 1997b, 1998)
with a rate of 10% of the gross revenue;

34
• ANP would have control over the operations performed by Petrobras.
(ALMADA; PARENTE, 2013)
The areas included in this contract, at the time it was made, were: Sul de Tupi, Florim,
Nordeste de Tupi, Peroba, Sul de Guará, Franco and Entorno de Iara (GAFFNEY, 2010).
3.1.4 Production Sharing Agreement in Brazil
The Brazilian production sharing contract (PSC) was established in 2010 by Law
12,351/2010, justified by the expected productivity of the newly discovered pre-salt areas
(Braga and Szklo, 2014). This new regulatory framework was based on typical PSCs, according
to which the oil output is shared between costs (cost oil) and profit (profit oil). In Brazil, the
contract terms also included the payment of royalties (levied on the gross revenue), which is
not worldwide usual. Cost oil recovery is limited and defined in the contracts; royalties are set
at 15% of the gross revenue; and the profit oil is shared between the State and the contractor,
according to the offer made in the auctions (bid rounds). Therefore, the contractor's gross
revenue is composed of cost oil, royalties, as the contractor receives royalties in kind for
payment in cash; and the contractor´s share of the profit oil. Income taxes are applicable on
profits. For the calculation of the profit and the payment or not of income tax, the operational
costs and depreciation of the assets are deducted.
3.2 Brazilian tax system
The Brazilian tax system is based on the principles and provisions in the Constitution of
1988 and the Tax Code of 1966. Three jurisdictions of tax collection are defined in the law,
federal, state and municipal, where each of them will have their specific due taxes (COIMBRA;
ALMEIDA, 2012).
The country´s tax regime is very complex, with three fiscal regimes and many special tax
regimes. The fiscal regimes are the parameters used to calculate the due income tax and social
contribution tax, which are part of the federal income. The three fiscal regimes are the simple,
presumed profit and actual profit. The first two have restrictions to be used according to the
income the companies have in the first case and according to the kind of business the company
performs. The actual profit is the only method applicable to all companies and is based on
companies´ net book profit adjusted by certain inclusions and deductions provided by the
legislation (KPMG, 2016). In Brazil the rate of the income tax is composed of a basic rate of

35
15%, a surplus tax of 10% for yearly annual income over R$ 240,000.00 (US$ 60,835 in 2019)
and 9% for the Social Contribution Tax on Profits (CSLL) (BRASIL, 2020), totalizing 34% of
the taxable income. The taxable income is composed of the revenues minus allowed
deductions. Part of the taxable income deductions is the depreciation. In oil and gas business,
until 2017, there was not a specific legislation for the depreciation, creating different
interpretations of the method to be used (ROCHA, 2017; SOUSA; MATTOS, 2017). In 2017,
the government released Resolution 1.786/2018 defining the units of production as the
depreciation methodology applicable to oil industry. In the same rule, they also created a
benefit of accelerate depreciation by a factor of 2.5. (BRASIL, 2018)
Among the existing taxes, it is important to emphasize the classification as to the
incidence on individual characteristics of the taxpayer or not. Direct taxes are those that affect
individual characteristics of the taxpayer (income, profit), while indirect taxes are levied on
transactions (purchase, sale), (Atikson, 1977 apud (COIMBRA; ALMEIDA, 2012).
(COIMBRA; ALMEIDA, 2012) described the main taxes applicable to the oil industry goods
and services in Brazil. They are:
• PIS/COFINS – federal taxes on the gross revenue of the companies. The combined rate
is 9.12%.
• Industrialized Product Tax (IPI) - federal tax on industrialized products. The aliquots
are variable, averaging 12% for the oil industry. The basis of incidence is the selling
price in domestic transactions plus import charges and other fees in the case of imported
products.
• Importation Tax (II) - federal tax levied on imported products. The basis of calculation
is the value of the imported good including freight and insurance and the average rate
is 15% for the oil industry.
• Value Added Tax (ICMS)8 - state tax whose rates vary according to the region where
the product or service circulates. In case of being in the same state ranges between 17%
and 19%.
• Service Tax (ISS) - municipal tax. The basis of calculation is the price of the service.
The rates vary from 2% to 5%, depending on the municipality and service provided.
8 This tax is not currently applicable on exported crude oil due to Law no 87/1996 (Kandir´ Law), only on oil
and gas sold in the country (BRASIL, 1996).

36
Since 1987, the oil industry had the benefit of taxes exemptions for temporary imported
goods used in the industry. The goal of this policy was to achieve a self-sufficiency on oil
production (DA SILVA, 2008), With the advent of the new regime proposed by (BRASIL,
1997b) the government adapted this old regulation to create Repetro. This special customs
regime was created in 2000, providing for the exemption of federal taxes and reduction of state
taxes for goods temporarily admitted to Brazil for the use in the oil industry. (COIMBRA;
ALMEIDA, 2012)
Repetro was composed of other special customs regimes9,10 that create a complexity on
its operations and supervision, also including the need to have a company outside the country,
from where the items would be utilized through a leasing contract (DA SILVA, 2008).
Therefore, during the period of its existence, the implementation of Repetro triggered a series
of misunderstandings of the law, even creating possibilities for tax evasion through the use of
charted contracts, as it required property to be established outside the country to make use of
the Repetro tax exemptions (MINISTÉRIO DA FAZENDA, 2017). Another consequence of
Repetro was the need to carry out fictitious export by the domestic industry to benefit from
Repetro. Goods were produced in Brazil, but they needed to be “exported” to benefit from the
drawback regime, which was the benefit the industry of exports has when acquiring imported
inputs for their products, which for the oil industry end up happening without the good leaving
the national territory. "The traded product is paid in foreign currency to the foreign subsidiary
and is therefore considered exported for tax purposes." (COIMBRA; ALMEIDA, 2012).
3.2.1 Changes made by Law 13,586/17
Law 13,586/17 changed the Repetro special tax regime and created other benefits for the
oil industry as the accelerated depreciation.
When it was first proposed there was a debate related to the impact of the new legislation,
including arguments in favor and against the initiative. Initially a study made by the Legislative
advisor (LIMA, 2017) estimated the losses to the government at R$ 1 trillion, which happened
9 Drawback, fictitious exportation and temporary admission. The first one consisted on tax exemptions for
imported items that would be used as part of items to be exported. As the items were to be used in the local
industry, they had to be exported on a fictitious way to receive the benefit of temporary admission of imported
goods. 10 Brazil has many special tax regimes on top of the three fiscal regimes. Those special regimes create a series of
complex tax incentives through either subsidized loan financing and tax exemptions or reduction.

37
to be a misunderstanding of the proposal. Despite of the mistake being corrected by two other
studies, one from the same house (SOUSA; MATTOS, 2017), and another from the Ministry
of Finance and the Budget and Financial Inspection Consulting (COFF) of the Chamber of
Deputies (ROCHA, 2017), the law was constantly associate to a large loss.
The first article is about the tax treatment given to expenditures in the development phase
of a project. According to Decree 62/66, Petrobras, for profit calculation, had the prerogative
to deduct development costs in the year they had occurred, not the depreciation over time.
There were uncertainties about the applicability of this premise to other companies, generating
a tax litigation regarding the subject (Fazenda, 2017). In the first article of Law 13,586/17 the
legislator standardized the procedure for all companies, allowing all them to depreciate
development costs. However, an accelerated depreciation modality was created for this case.
COFF estimates that the cost of accelerated depreciation, compared to non-acceleration, is a
loss of revenue of about R$ 19.7 billion from 2018 to 2020. However, it also mentions that,
compared to the deduction in the year of spending, which was the understanding of the courts,
the gain was R$ 17.9 billion (SOUSA; MATTOS, 2017)
The second article of the law is about the tax treatment of international charter services.
As the freight of vessels was exempt from taxes, the companies tried to maximize their
expenses in the freight rather than the service portion, where there is an incidence of taxes,
using a ratio of around 90% and 10% respectively (MINISTÉRIO DA FAZENDA, 2017). In
2014, the Government enacted a law defining minimum percentages for that proportion. The
Internal Revenue Service did not agree, since it understood that 100% of the expenses should
be taxable, and with that understanding it fined many companies. However, in 2014, a
parliamentary amendment regulated such modalities by setting percentages from 85% to 60%
for the freight part and consequently legally voided the understanding of the Revenue that was
based on 100% of revenues being taxable (MINISTÉRIO DA FAZENDA, 2017). In the
13,586/17 law, these percentages were revised again, increasing the taxable base and
consequently increasing the collection. According to COFF, at that time, this gain would be R$
353 million in 2018 and 2019 together (SOUSA; MATTOS, 2017). In paragraph 3 of the same
article, there was a permit for companies with contracts below 2014 to comply with the most
recent law by paying the taxes due. This point, according to the COFF will lead to a loss of
revenue of R$ 11.14 billion reais, damaging the Union, however, according to the Ministry of

38
Finance there is a great risk of losing the argument in the courts (MINISTÉRIO DA
FAZENDA, 2017).
The last item of the law concerns the modification in the Repetro making it permanent.
Part of the modifications include the equalization of exemptions to domestic goods as well,
eliminating the need for fictitious exportation, possibility of exemption on final importation
and increased control of items subject to taxation (MINISTÉRIO DA FAZENDA, 2017).
The tax changes made by Law 13,586/17 were intended for the petroleum sector as a
whole, without specificities related to the different models of oil exploration and production in
the country.
In relation to the production sharing agreement, since its creation in 2010, it underwent
legal modifications that made it more attractive to the private investor.
The first one is related to operatorship. Law 12,351/10 established that only Petrobras
could be operator in a pre-salt field. In 2016 a new law (13,365/16) was enacted giving
Petrobras the preemptive right to nominate blocks of interest to operate, but not making it
compulsory.
Changes in the local content requirements for the contract were also relaxed in terms of
rates and methodology of calculation. In the Libra contract, for example, the obligation was
defined based on an extensive list of items to be acquired during the project, according to the
phases, with percentages of local content for each item and also for each phase, both the non-
compliance of the item and the phase led to payment of fines and the average requirement was
57% (ANP, 2013). In the new contracts, there has been a simplification in the control and the
average requirements, which is now between 25% and 40% (ANP, 2018).
Finally, another update happened in the cost oil rate. Libra contract had cost oil of 50%,
while, most of the new contracts have now rates of 80% This rate accelerates the cost recovery
benefiting the contractors.
4 METHODOLOGY
The assessment of the fiscal incentive impact on the economic feasibility of Brazilian pre-
salt oil fields is performed using an economic model with discounted cash flow (DCF) analysis.
The model was an excel based tool accounting for the production sharing terms applicable to
pre-salt fields in Brazil, as described in section 3.1.4. The analysis requires inputs to the
economic model such as production profiles, oil prices, costs and fiscal terms.

39
In 2010, a detailed study, named “Gaffney Cline Report”, was performed by an external
consultant to determine the value of some pre-salt areas (GAFFNEY, 2010).11 At that time, the
Brazilian Government had established the special concession regime of onerous assignment,
under which Petrobras would acquire some areas against payment (BRAGA; SZKLO, 2014).
For this reason, a complete independent analysis was performed for each of the four discoveries
and six oil prospects identified at that time, including a detailed development plan with
production profiles and costs. (LIMA, 2010).
The ten reported fields´ volumes ranged from 58 mln bbl to 7.8 bln bbl, a sample with a
wide difference of fields’ sizes. Therefore, for the purpose of this study, they represent
equivalent size fields in pre-salt for which no data are available yet.
In the report, each field was analyzed according to the available data. Although some of
them were prospects with no exploration wells drilled yet, the report did not account for a
probability of failure. The geological chance of success associated with these profiles were
considered to be 70% due to the characteristics of the pre-salt: “a near perfect seal, a generally
thick and hydraulically connected reservoir underlain by a very rich, mature source rock”
(GAFFNEY, 2010), which distinguish them from conventional accumulations. The same way,
in this dissertation, the exploration risks were not accounted in the analysis, assuming a
probability of success of 100% for a pre-salt exploratory well. This assumption is not far from
reality as the success rate for exploratory wells in the pre-salt from 2005 to 2015 was 90%
(PETROBRAS, 2015 apud (STUCKART; PACHECO; SILVA, 2019)), much more than the
world average wildcat success of 38% between 2007 and 2012 (NELON et al.,2013 apud
(STUCKART; PACHECO; SILVA, 2019)), reinforcing the nature of the pre-salt play in
opposition to the conventional ones.
For each of the fields, the productions curves were based on the reservoir properties such
as net reservoir thickness, porosity, permeability and oil saturation values (GAFFNEY, 2010).
Those factors were used to determine the volumes in place and the recovery factors, which was
21% on average for the analyzed areas (GAFFNEY, 2010). Costs are categorized according to
a typical pre-salt oil project. The exploratory phase includes wells drilled to determine the
existence of resources, called wildcats, to test reservoir characteristics (long-term tests or
TLDs), in addition to seismic and geological studies. After petroleum discoveries are
11 The fields included in (GAFFNEY, 2010) are designated here according to their volumes, instead of their
names.

40
confirmed, the development phase includes FPSOs (Floating, Production, Storage and
Offloading units), production and injection wells, with their respective subsea equipment. After
the production begins, costs become OPEX. Based on this structure, the costs for the purpose
of this study are categorized into seismic; wildcat for the exploration well; wells, which
includes appraisal, production and injection wells costs; subsea, with all the subsurface safety
equipment and the connection lines; FPSO, including the hull and topsides and OPEX for all
the operational costs.
As the economic evaluation of this study refers to the life time of a pre-salt field project
(starting in 2018), all premises need to be estimated at the same basis for the analysis.
In the fiscal inputs are included the premises for income tax calculation, indirect taxes
assumptions, along with the premises for the production sharing contract. The income tax
calculation follows the rules described in section 3.2. For indirect taxes calculation, as each
specific item used in the project is subject to a different taxation depending on how the good
or service was acquired, it is necessary to aggregate the items into categories to make it possible
an estimation the indirect taxes. The analysis utilizes the aggregation of costs based on a
previous study (ALMEIDA; COIMBRA, 2012). In order to be able to estimate the amount of
indirect tax for each cost category, first it was necessary to make estimations for how the costs
were being spent, if with goods or services, if locally or imported, for example. For this reason,
key cost allocation categories were established requiring estimations for percentage of the costs
that represents services and goods; of those goods and services, how much is acquired locally
and how much derives from importation, the part that is done through a leasing contract locally
and imported and which part of goods would be subjected to Repetro benefit.
For the average tax rate for each category of cost allocation, (ALMEIDA; COIMBRA,
2012) aggregated the following indirect taxes:
• Repetro Goods: subjected only to ICMS of 3.09% rate.
• Non-Repetro Goods – National: subject to IPI, ICMS, PIS and COFINS making
a 59.98% rate.
• Non Repetro Goods – Imported: subject to IPI, ICMS, PIS and COFINS and II,
making a 73.98% rate.
• National services: subject to ISS, PIS and COFINS making a 16.08% rate.
• International services: subject to ISS, CIDE, IR, IS and COFINS making a 45.5%
rate.

41
• Leasing – National: subject to PIS and COFINS making a 10.19% rate.
• Leasing – Imported: subject to no taxes making a 0% rate.
Therefore, in the DCF analysis, this study aggregated due taxes, with and without
Repetro, according to the following categories: Repetro goods, non-Repetro goods (national
and imported), national and international services and leasing, as proposed by (ALMEIDA;
COIMBRA, 2012). In the end, an average tax is calculated per cost item based on a weighted
average allocation.
Table 4 –Tax categories, average tax allocation - with Repetro
Allocation Seismic Wildcat Wells Subsea FPSO Opex Tax rates
Repetro Goods 0% 0% 0% 75% 95% 0% 3.1%
Non-Repetro Goods - National 0% 18% 18% 0% 2% 25% 60%
Non Repetro Goods - Imported 0% 11% 11% 0% 0% 5% 74%
National services 20% 16% 16% 10% 2% 30% 16%
International services 80% 4% 4% 5% 0% 15% 46%
Leasing – National 0% 3% 3% 3% 0% 25% 10%
Leasing – Imported 0% 48% 48% 7% 1% 0% 0%
Total 100% 100% 100% 100% 100% 100%
Average Tax per cost category 40% 24% 24% 7% 4% 33%
Source: Based on (ALMEIDA; COIMBRA, 2012).
Table 5 –Tax categories, average cost allocation and average tax rates - without Repetro
Allocation Seismic Wildcat Wells Subsea FPSO Opex Tax rates
Repetro Goods 0% 0% 0% 0% 0% 0% 3.1%
Non Repetro Goods - National 0% 18% 18% 0% 2% 25% 60%
Non Repetro Goods - Imported 0% 11% 11% 75% 95% 5% 74%
National services 20% 16% 16% 10% 2% 30% 16%
International services 80% 4% 4% 5% 0% 15% 46%
Leasing – National 0% 3% 3% 3% 0% 25% 10%
Leasing – Imported 0% 48% 48% 7% 1% 0% 0%
Total 100% 100% 100% 100% 100% 100%
Average Tax per cost category 40% 24% 24% 60% 72% 33%
Source: Based on (ALMEIDA; COIMBRA, 2012).

42
As can be noticed, the difference between the two tables is the allocation made to the
subsea equipment and FPSO items, as those items are the ones subject to Repetro exemption.
The law 13586 from 2017 have made the benefit of Repetro permanent and also removed the
obligation of a fictitious importation to receive the benefit, making the leasing no longer
necessary. As the average tax rate for Repetro goods and the Leasing – imported are similar
and close to zero, por the purpose of this study the same structure of tax allocation from
(ALMEIDA; COIMBRA, 2012) was maintained.
4.1 Fiscal Incentives
The fiscal incentives applicable to the oil and gas fields used in this analysis are the
Repetro and an acceleration depreciation method. Repetro is a special tax regime created in
1999 to last for twenty years with the objective to stimulate the industry. In 2017 it was
reviewed maintaining, however, the same tax benefits as before on top of other changes,12 and
its duration was expanded to 2040 (BRASIL, 2017b). According to Repetro, some items
dedicated to the oil and gas industry benefit from tax exemptions. In this study, they were
aggregated into categories having a summarized tax rate (Table 6).
Table 6: Summary of Fiscal Incentives of Repetro
Cost Item Tax with Repetro Tax without Repetro
Seismic 40% 40%
Wildcat 24% 24%
Wells 24% 24%
Subsea 7% 60%
FPSO 4% 72%
Opex 33% 33%
Source: Based on (ALMEIDA; COIMBRA, 2012)
12 Actually, the Law approved in 2017 not only expanded the benefits of the original Repetro, but also removed
the obligation to temporary import the goods included in Repetro. This used to be done through a lease structure
of acquisition. Therefore, this study does not account for any purchase through leasing according to the recent
revision of Repetro.
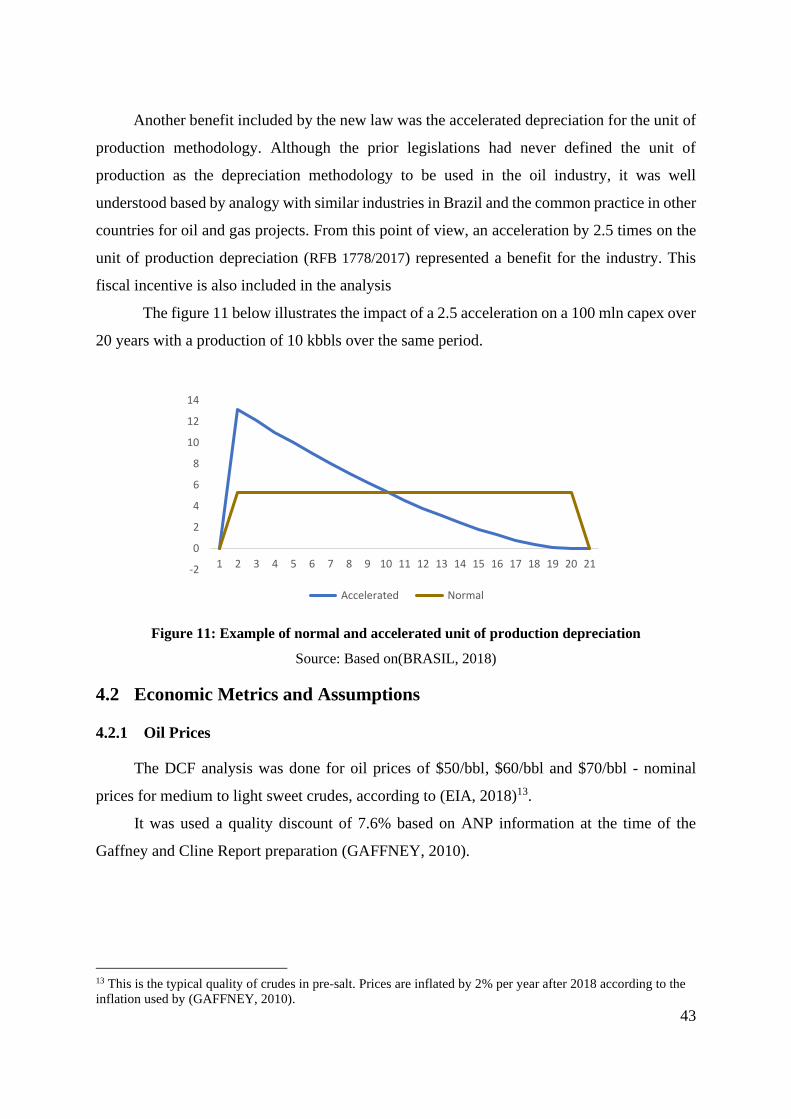
43
Another benefit included by the new law was the accelerated depreciation for the unit of
production methodology. Although the prior legislations had never defined the unit of
production as the depreciation methodology to be used in the oil industry, it was well
understood based by analogy with similar industries in Brazil and the common practice in other
countries for oil and gas projects. From this point of view, an acceleration by 2.5 times on the
unit of production depreciation (RFB 1778/2017) represented a benefit for the industry. This
fiscal incentive is also included in the analysis
The figure 11 below illustrates the impact of a 2.5 acceleration on a 100 mln capex over
20 years with a production of 10 kbbls over the same period.
Figure 11: Example of normal and accelerated unit of production depreciation
Source: Based on(BRASIL, 2018)
4.2 Economic Metrics and Assumptions
4.2.1 Oil Prices
The DCF analysis was done for oil prices of $50/bbl, $60/bbl and $70/bbl - nominal
prices for medium to light sweet crudes, according to (EIA, 2018)13.
It was used a quality discount of 7.6% based on ANP information at the time of the
Gaffney and Cline Report preparation (GAFFNEY, 2010).
13 This is the typical quality of crudes in pre-salt. Prices are inflated by 2% per year after 2018 according to the
inflation used by (GAFFNEY, 2010).
-2
0
2
4
6
8
10
12
14
1 2 3 4 5 6 7 8 9 10 11 12 13 14 15 16 17 18 19 20 21
Accelerated Normal

44
4.2.2 Metrics
The net present values (NPV) and internal rate of return (IRR) are economic metrics
possible to be calculated for a project. Although both of them are well accepted in the industry,
NPVs require the knowledge of companies’ discount rates, which can vary among them. IRRs,
on the other hand, sets the line that divides positive to negative cashflows. Therefore, to assess
the oil companies’ discount rates for investment decisions, a possible criterion is the weighted
average cost of capital (WACC), which accounts for both the costs of equity and the debt.
Following (HEGAR, 2017), the average cost of equity of 11.29% p.a. could be seen as a proxy
for the opportunity cost of capital of international oil companies (IOCs), as of 2017.
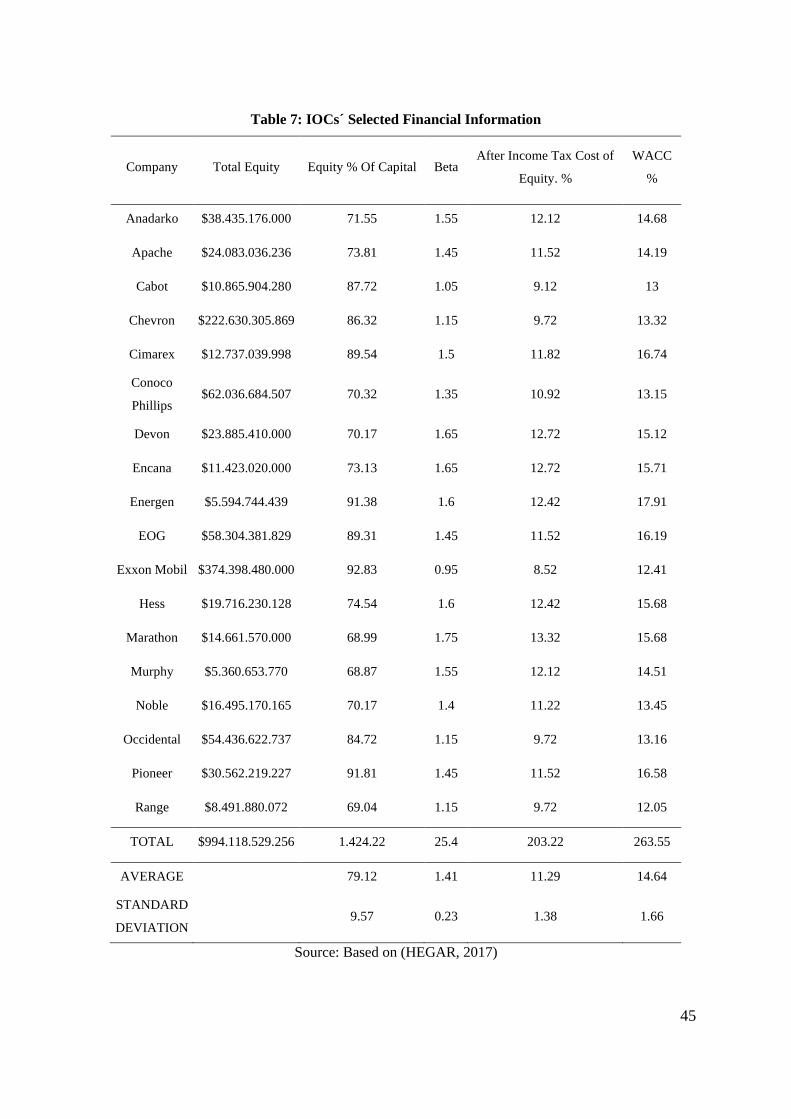
45
Table 7: IOCs´ Selected Financial Information
Company Total Equity Equity % Of Capital Beta After Income Tax Cost of
Equity. %
WACC
%
Anadarko $38.435.176.000 71.55 1.55 12.12 14.68
Apache $24.083.036.236 73.81 1.45 11.52 14.19
Cabot $10.865.904.280 87.72 1.05 9.12 13
Chevron $222.630.305.869 86.32 1.15 9.72 13.32
Cimarex $12.737.039.998 89.54 1.5 11.82 16.74
Conoco
Phillips $62.036.684.507 70.32 1.35 10.92 13.15
Devon $23.885.410.000 70.17 1.65 12.72 15.12
Encana $11.423.020.000 73.13 1.65 12.72 15.71
Energen $5.594.744.439 91.38 1.6 12.42 17.91
EOG $58.304.381.829 89.31 1.45 11.52 16.19
Exxon Mobil $374.398.480.000 92.83 0.95 8.52 12.41
Hess $19.716.230.128 74.54 1.6 12.42 15.68
Marathon $14.661.570.000 68.99 1.75 13.32 15.68
Murphy $5.360.653.770 68.87 1.55 12.12 14.51
Noble $16.495.170.165 70.17 1.4 11.22 13.45
Occidental $54.436.622.737 84.72 1.15 9.72 13.16
Pioneer $30.562.219.227 91.81 1.45 11.52 16.58
Range $8.491.880.072 69.04 1.15 9.72 12.05
TOTAL $994.118.529.256 1.424.22 25.4 203.22 263.55
AVERAGE 79.12 1.41 11.29 14.64
STANDARD
DEVIATION 9.57 0.23 1.38 1.66
Source: Based on (HEGAR, 2017)

46
Hence, this study adopted IRR as the economic metric to measure the profitability of pre-
salt prospects in Brazil. The DCF result is compared to the international oil companies (IOC´s)
average cost of equity of 11.29% p.y.14 Another comparison can be made with the breakeven
cost to produce oil. For pre-salt this was $45/bbl on average in 2016 (ALMEIDA et al., 2016),
while some studies indicate breakeven costs of $30/bbl (PETROBRAS, 2017).
Finally, one critical input variable of the DCF analysis is the profit-oil share offered in
the bid rounds. These shares, as set by the Brazilian PSC, is determined by a matrix that
combines wells productivity and oil prices, and vary from a single share offered by the winning
consortium of oil companies at the bid round. This means that, before the bid round, the
government sets a minimum acceptable profit oil share. Then, the result of the bid can exceed
this minimum, depending on the area attractiveness and the companies´ risk management
(ANP, 2018b).
4.2.3 Signature Bonus, Profit Oil and Cost Oil Rates
Another variable defined by ANP for the bid round is the signature bonus. In the pre-salt
projects, the value of signature bonus is pre-defined and it is not a bid parameter. It is required
to paid independently of the profit oil offer. As signature bonus are paid upfront and are not
cost oil recovery, the amount spent with this category is completely sunk in the early stage, of
the project. Even if the project is marginal, the bonus must be paid. Projects with a high bonus
instead of higher profit oil will present and characteristics of a regressive fiscal system.
The signature bonuses, the profit oil and cost oil rates were also selected reflecting the
results of the Brazilian bidding rounds so far. Since 2013, six pre-salt biding rounds were done
until 2019 with 15 areas being awarded. Although there is no available information regarding
the areas recovery volumes in order to make an analogy with this study fields, it is possible to
make correlation between the signature bonus and profit oil rates. Signature bonus is a lump
sum paid by the winning company of the auction by the signing of the contract (Szklo et al.,
2007). For the pre-salt blocks this is a fixed amount while the profit oil is set to a minimum but
it can variate according to offer made. For this reason, the regulator aims to adjust the bonus
and profit oil in parallel to balance upfront and latter taxation. The fields in the study were
divided in three groups according to their size. The first group includes the areas ranging from
58 to 364 mln bbl, the second group is from presents volumes from 1.1 to 2.1 bln bbl and the
14 However, some companies can accept lower returns such as 8.52% p.y., as compiled in (HEGAR, 2017).

47
third tier is for the larger fields of 5.4 and 7.8 bln bbls. The actual paid bonuses so far for the
15 areas already awarded range from US$ 19.2 mln to US$ 15.9 bln. Therefore, the bonus
values were also divide into three tiers, where the first one goes up to US$ 157 mln, the second
goes from US$ 411 mln to US$ 940 mln, the last tier includes the larger two bonus paid which
were or exactly the same fields used in this dissertation, as those areas were already awarded.
The average profit oil was calculated according to the division made for tier 1, tier 2 and tier
3, resulting on the values of 42%, 53% and 32%, respectively. In this sense, it was assumed
that the bonus paid so far was according to the volumes, the higher the volumes the higher the
bonuses values. Actually, as the profit oil offers are an adjustable parameter that defines the
acquisition of the area, it is possible for the contractors to wave part of the extra rent of the
project in exchange for winning the bid.
Under the Brazilian production sharing agreement regime, this is a way to transfer back
to the government part of the benefits generated with fiscal incentives, if competition exists.
Otherwise, the minimum offer will always be preferred. One the other hand, the variability of
profit oil shares also allows the contractors to adjust for situations with lower profitability, such
as those without fiscal incentives, by reducing their profit oil share offers. Hence, the results
of the simulated DCF are presented including different levels of profit oil account for the block
attractiveness
Although there are other factors that would influence in the signature bonus
determination, for this study, only the volumes were considered. The table below illustrates
the results for average bonus and average profit oil rates used in the DCF model (ANP, 2018b).
Table 8: Bonus and Profit Oil estimation based on actual values15
Actual ANP Awarded Areas
Actual Bonus
US$ mln Average Bonus
Per Tier
Actual Profit Oil Winning
Bid %
Average Profit Oil Per Tier %
Fields dissertation
Area 1 19
TIER 1 AVERAGE $82 mln
10.01
42 From 58
mln bbl to 364 mln bbl
Area 2 27 49.95
Area 3 31 11.53
Area 4 63 80.00
Area 5 109 16.43
Area 6 110 28.87
Area 7 137 63.79
Area 8 157 75.80
15 Annex III has a table with the results from all the pre-salt Bid Rounds until 2019

48
Area 9 411
TIER 2 AVERAGE $712 mln
18.15
53 From 1.1 to 2.1 bln
bbl
Area 10 627 79.97
Area 11 725 75.49
Area 12 855 23.49
Area 13 940 67.12
Area 14 6,977 TIER 3 AVERAGE $11418
41.65 32
From 5.4 to 7.8 bln
bbl Area 15 15,859 23.24
Source: Based on ANP, 2018a
The profit oil rate offered at the bidding round is an input matrix that combines oil prices
and well productivity. Depending on those factors the profit oil increases or diminishes. Each
bidding round presents how the profit oil will vary. The first pre-salt bidding round was held
in 2013 when the oil prices were around $90/bbl, impacting its profit oil matrix towards a high
price scenario. The second pre-salt bidding round took place in 2017, when the global oil
market had come to around $55/bbl.
The profit oil matrix used in the DFC model is the same applied for bidding rounds 2
to 5 and it is described in figure 12 below:
Figure 12: Profit Oil Matrix
Source: Based on (ANP, 2018a)
The cost oil rate also suffered variation from the first bidding round to the others held
later. In the Libra auction, the cost oil rate was set to 30% with a possibility to be 50% until
costs were recovered. From bidding rounds three to five there were blocks awarded with a 50%
cost oil rate, however most of them presented 80%. For simplification the value used in the
DCF analysis was 80%.
De 0 2.001 4.001 6.001 8.001 10.001 12.001 14.001 16.001 18.001 20.001 22.001 > 24.001
até 2.000 4.000 6.000 8.000 10.000 12.000 14.000 16.000 18.000 20.000 22.000 24.000
0 20 1% -54,96pp -27,12pp -16,24pp -10,64pp -6,81pp -4,10pp -2,19pp -1,05pp +0,16pp +0,87pp +1,89pp +2,36pp
20,01 40 -97,49pp -38,18pp -17,56pp -9,51pp -5,44pp -2,51pp -0,63pp +0,79pp +1,65pp +2,66pp +3,09pp +3,90pp +4,17pp
40,01 60 -75,31pp -28,37pp -11,96pp -5,58pp -2,40pp OFERTA +1,40pp +2,53pp +3,23pp +4,11pp +4,39pp +5,08pp +5,22pp
60,01 80 -61,74pp -22,12pp -8,52pp -3,18pp -0,36pp +1,41pp +2,87pp +3,79pp +4,33pp +4,82pp +5,26pp +5,66pp +6,02pp
80,01 100 -45,92pp -15,10pp -4,53pp -0,37pp +1,82pp +3,20pp +4,33pp +5,05pp +5,47pp +5,85pp +6,19pp +6,50pp +6,78pp
100,01 120 -35,85pp -10,64pp -1,99pp +1,41pp +3,20pp +4,34pp +5,26pp +5,85pp +6,19pp +6,50pp +6,78pp +7,03pp +7,26pp
120,01 140 -28,88pp -7,55pp -0,23pp +2,65pp +4,16pp +5,12pp +5,91pp +6,40pp +6,69pp +6,95pp +7,19pp +7,41pp +7,60pp
140,01 160 -23,77pp -5,28pp +1,06pp +3,56pp +4,87pp +5,70pp +6,38pp +6,81pp +7,06pp +7,29pp +7,49pp +7,68pp +7,85pp
-15,47pp -1,60pp +3,16pp +5,03pp +6,01pp +6,64pp +7,14pp +7,47pp +7,66pp +7,83pp +7,98pp +8,07pp +8,25pp
Média de Produtividade dos Poços Produtores (bbld)
Pre
ço
Date
d B
ren
t
>160,01
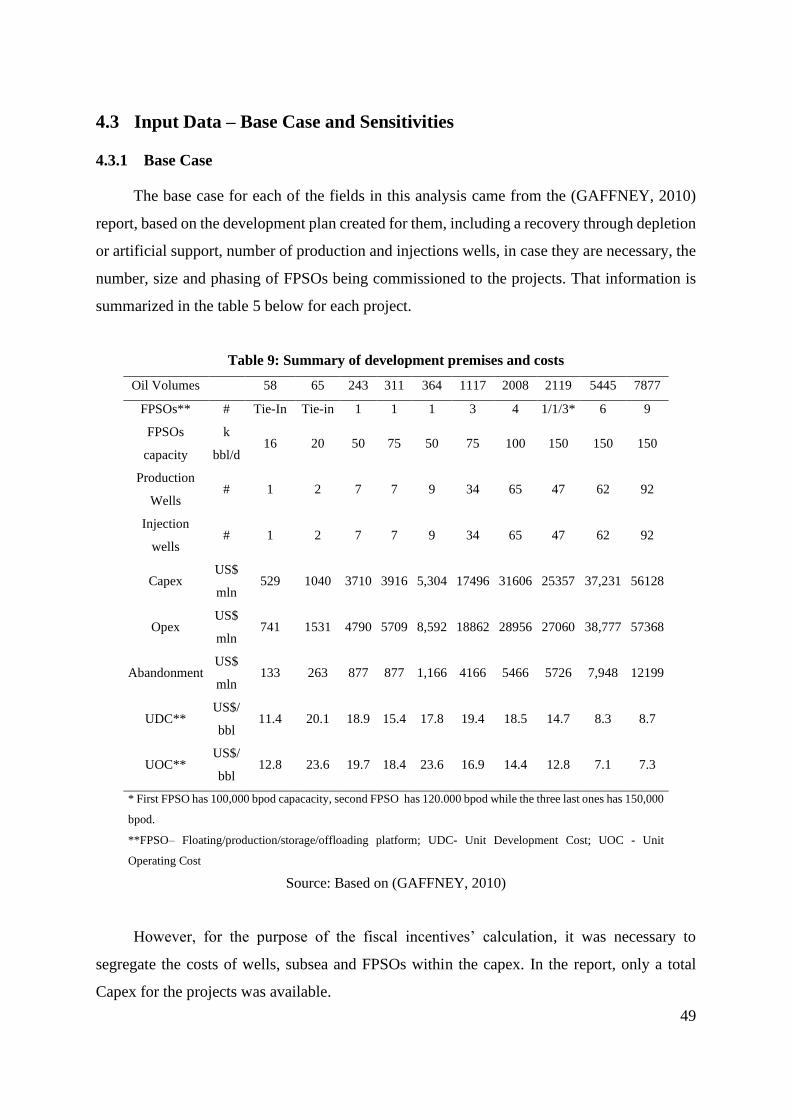
49
4.3 Input Data – Base Case and Sensitivities
4.3.1 Base Case
The base case for each of the fields in this analysis came from the (GAFFNEY, 2010)
report, based on the development plan created for them, including a recovery through depletion
or artificial support, number of production and injections wells, in case they are necessary, the
number, size and phasing of FPSOs being commissioned to the projects. That information is
summarized in the table 5 below for each project.
Table 9: Summary of development premises and costs
Oil Volumes 58 65 243 311 364 1117 2008 2119 5445 7877
FPSOs** # Tie-In Tie-in 1 1 1 3 4 1/1/3* 6 9
FPSOs
capacity
k
bbl/d 16 20 50 75 50 75 100 150 150 150
Production
Wells # 1 2 7 7 9 34 65 47 62 92
Injection
wells # 1 2 7 7 9 34 65 47 62 92
Capex US$
mln 529 1040 3710 3916 5,304 17496 31606 25357 37,231 56128
Opex US$
mln 741 1531 4790 5709 8,592 18862 28956 27060 38,777 57368
Abandonment US$
mln 133 263 877 877 1,166 4166 5466 5726 7,948 12199
UDC** US$/
bbl 11.4 20.1 18.9 15.4 17.8 19.4 18.5 14.7 8.3 8.7
UOC** US$/
bbl 12.8 23.6 19.7 18.4 23.6 16.9 14.4 12.8 7.1 7.3
* First FPSO has 100,000 bpod capacacity, second FPSO has 120.000 bpod while the three last ones has 150,000
bpod.
**FPSO– Floating/production/storage/offloading platform; UDC- Unit Development Cost; UOC - Unit
Operating Cost
Source: Based on (GAFFNEY, 2010)
However, for the purpose of the fiscal incentives’ calculation, it was necessary to
segregate the costs of wells, subsea and FPSOs within the capex. In the report, only a total
Capex for the projects was available.

50
4.3.1.1 Capex Breakdown
Capex values were aggregated into wells, subsea and FPSO categories. FPSO platforms
costs were based on (ALMEIDA et al., 2016) –Table 10. For smaller FPSOs than those
available in the previous mentioned study, a linear interpolation was used.
Table 10: FPSO platforms costs according to production capacity – as of 2014
Thousand
barrels/day US$ Billions
100 1.6
120 1.8
150 2.0
180 2.5
Source: Based on (ALMEIDA et al., 2016)
Costs can correlate with oil prices. For instance, with the increase of prices, more projects
become feasible. The opposite happens when oil prices go down. Toews and Naumov
(TOEWS; NAUMOV, 2015) associate 10% increase (or reduction) in international oil prices
with an increase of 4% in drilling activity and 3% increase in drilling costs in one year and a
half (ALMEIDA et al., 2016).
As the current Brent price is around 13% lower than the prices at which the data on costs
were collected, this could represent a reduction of around 4% on costs. Nevertheless, for the
purpose of this study, given the small difference found, this percentage was not applied on the
FPSO costs to adjust for the ‘time” difference.
4.3.1.2 Production Profiles
The figures 13 to 22 below describe the production and costs profiles for each field used
in the evaluation:
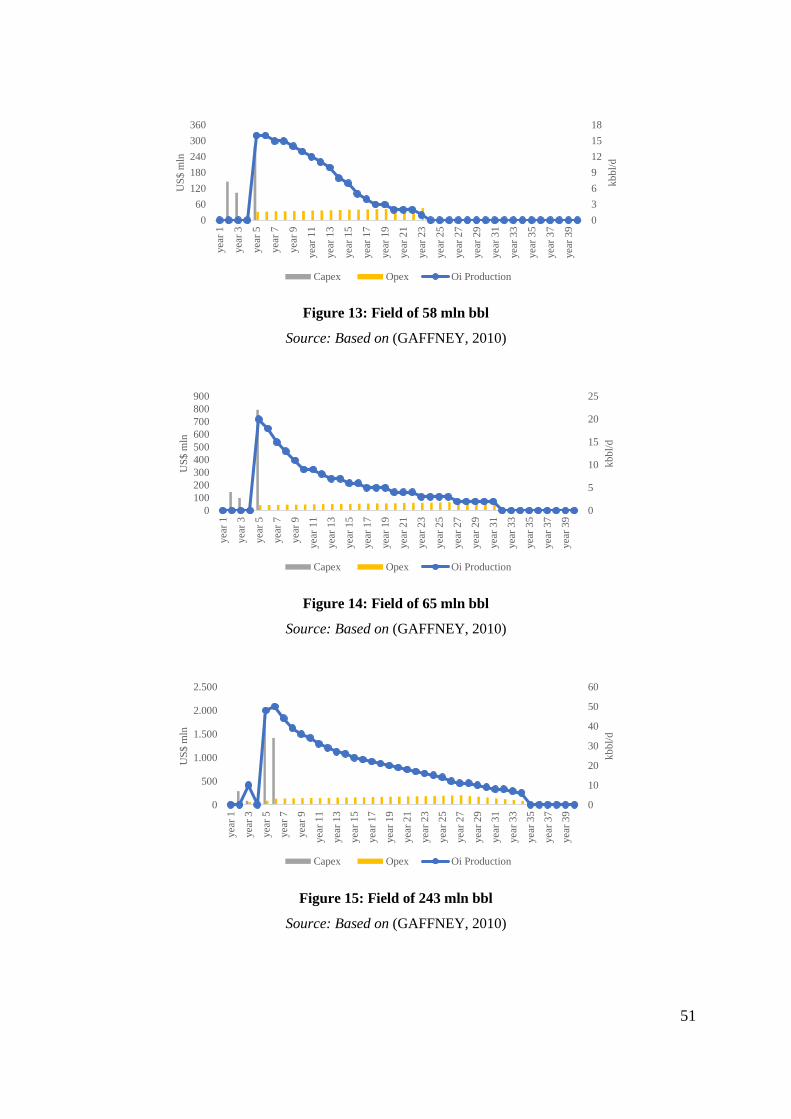
51
Figure 13: Field of 58 mln bbl
Source: Based on (GAFFNEY, 2010)
Figure 14: Field of 65 mln bbl
Source: Based on (GAFFNEY, 2010)
Figure 15: Field of 243 mln bbl
Source: Based on (GAFFNEY, 2010)
0
3
6
9
12
15
18
0
60
120
180
240
300
360
yea
r 1
yea
r 3
yea
r 5
yea
r 7
yea
r 9
yea
r 1
1
yea
r 1
3
yea
r 1
5
yea
r 1
7
yea
r 1
9
yea
r 2
1
yea
r 2
3
yea
r 2
5
yea
r 2
7
yea
r 2
9
yea
r 3
1
yea
r 3
3
yea
r 3
5
yea
r 3
7
yea
r 3
9
kb
bl/
d
US
$ m
ln
Capex Opex Oi Production
0
5
10
15
20
25
0
100
200
300
400
500
600
700
800
900
yea
r 1
yea
r 3
yea
r 5
yea
r 7
yea
r 9
yea
r 1
1
yea
r 1
3
yea
r 1
5
yea
r 1
7
yea
r 1
9
yea
r 2
1
yea
r 2
3
yea
r 2
5
yea
r 2
7
yea
r 2
9
yea
r 3
1
yea
r 3
3
yea
r 3
5
yea
r 3
7
yea
r 3
9
kb
bl/
d
US
$ m
ln
Capex Opex Oi Production
0
10
20
30
40
50
60
0
500
1.000
1.500
2.000
2.500
yea
r 1
yea
r 3
yea
r 5
yea
r 7
yea
r 9
yea
r 1
1
yea
r 1
3
yea
r 1
5
yea
r 1
7
yea
r 1
9
yea
r 2
1
yea
r 2
3
yea
r 2
5
yea
r 2
7
yea
r 2
9
yea
r 3
1
yea
r 3
3
yea
r 3
5
yea
r 3
7
yea
r 3
9
kb
bl/
d
US
$ m
ln
Capex Opex Oi Production

52
Figure 16: Field of 311 mln bbl
Source: Based on (GAFFNEY, 2010)
Figure 17: Field of 364 mln bbl
Source: Based on (GAFFNEY, 2010)
Figure 18: Field of 1117 mln bbl
Source: Based on (GAFFNEY, 2010)
0
10
20
30
40
50
60
70
80
0
500
1.000
1.500
2.000
yea
r 1
yea
r 3
yea
r 5
yea
r 7
yea
r 9
yea
r 1
1
yea
r 1
3
yea
r 1
5
yea
r 1
7
yea
r 1
9
yea
r 2
1
yea
r 2
3
yea
r 2
5
yea
r 2
7
yea
r 2
9
yea
r 3
1
yea
r 3
3
yea
r 3
5
yea
r 3
7
yea
r 3
9
kb
bl/
d
US
$ m
ln
Capex Opex Oi Production
0
20
40
60
80
100
0
500
1.000
1.500
2.000
2.500
yea
r 1
yea
r 3
yea
r 5
yea
r 7
yea
r 9
yea
r 1
1
yea
r 1
3
yea
r 1
5
yea
r 1
7
yea
r 1
9
yea
r 2
1
yea
r 2
3
yea
r 2
5
yea
r 2
7
yea
r 2
9
yea
r 3
1
yea
r 3
3
yea
r 3
5
yea
r 3
7
yea
r 3
9
kb
bl/
d
US
$ m
ln
Capex Opex Oi Production
0
50
100
150
200
250
0
1.000
2.000
3.000
4.000
5.000
6.000
yea
r 1
yea
r 3
yea
r 5
yea
r 7
yea
r 9
yea
r 1
1
yea
r 1
3
yea
r 1
5
yea
r 1
7
yea
r 1
9
yea
r 2
1
yea
r 2
3
yea
r 2
5
yea
r 2
7
yea
r 2
9
yea
r 3
1
yea
r 3
3
yea
r 3
5
yea
r 3
7
yea
r 3
9
kb
bl/
d
US
$ m
ln
Capex Opex Oi Production

53
Figure 19: Field of 2008 mln bbl
Source: Based on (GAFFNEY, 2010)
Figure 20: Field of 2119 mln bbl
Source: Based on (GAFFNEY, 2010)
Figure 21: Field of 5445 mln bbl
Source: Based on (GAFFNEY, 2010)
0
50
100
150
200
250
300
350
400
0
1.000
2.000
3.000
4.000
5.000
6.000
7.000
yea
r 1
yea
r 3
yea
r 5
yea
r 7
yea
r 9
yea
r 1
1
yea
r 1
3
yea
r 1
5
yea
r 1
7
yea
r 1
9
yea
r 2
1
yea
r 2
3
yea
r 2
5
yea
r 2
7
yea
r 2
9
yea
r 3
1
yea
r 3
3
yea
r 3
5
yea
r 3
7
yea
r 3
9
kb
bl/
d
US
$ m
ln
Capex Opex Oi Production
0
100
200
300
400
500
600
0
1.000
2.000
3.000
4.000
5.000
6.000
7.000
yea
r 1
yea
r 3
yea
r 5
yea
r 7
yea
r 9
yea
r 1
1
yea
r 1
3
yea
r 1
5
yea
r 1
7
yea
r 1
9
yea
r 2
1
yea
r 2
3
yea
r 2
5
yea
r 2
7
yea
r 2
9
yea
r 3
1
yea
r 3
3
yea
r 3
5
yea
r 3
7
yea
r 3
9
kb
bl/
d
US
$ m
ln
Capex Opex Oi Production
0
200
400
600
800
1000
0
1.000
2.000
3.000
4.000
5.000
6.000
yea
r 1
yea
r 3
yea
r 5
yea
r 7
yea
r 9
yea
r 1
1
yea
r 1
3
yea
r 1
5
yea
r 1
7
yea
r 1
9
yea
r 2
1
yea
r 2
3
yea
r 2
5
yea
r 2
7
yea
r 2
9
yea
r 3
1
yea
r 3
3
yea
r 3
5
yea
r 3
7
yea
r 3
9
kb
bl/
d
US
$ m
ln
Capex Opex Oi Production

54
Figure 22: Field of 7877 mln bbl
Source: Based on (GAFFNEY, 2010)
4.3.1.3 Unit Costs
A simple way to compare different projects is to evaluate the unitary costs per barrel for
Capex and Opex. Therefore, for assessing the validity of the inputs used in the DCF the input
data selected for this dissertation was compared to other references for the Brazilian pre-salt
development and operational costs as per described in Table 11 below.
Table 11: Potential Evolution of E&P project costs in Brazil $/bbl
Capex 2014 Opex 2014 Capex 2016 Opex 2016
8.2 10.0 6.1 8.7
Source: Based on (Almeida et al., 2016)
Petrobras, the major pre-salt operator, announced in 2017 that its pre-salt extraction cost
reached $7.1/bbl, (PETROBRAS, 2017). On top of that, a learning curve for drilling and
completion efficiency reduced costs. In 2010 the average drilling time was 310 days while in
2016 it was 89, being reduced by two thirds (PETROBRAS, 2015). In this study, the base case
data for a 5 bln bbl project has a UDC of $8.3/bbl and UOC of $7.1/bbl, corresponding to the
high 2014 development costs and the current data for operational costs, respectively.
4.3.1.4 Wells Productivity
Another way to balance the inputs used in the base case is through well productivity. The
pre-salt play has wells among the most productive in the world. Table as per the figure below:
0
200
400
600
800
1000
1200
1400
0
1.000
2.000
3.000
4.000
5.000
6.000
7.000
yea
r 1
yea
r 3
yea
r 5
yea
r 7
yea
r 9
yea
r 1
1
yea
r 1
3
yea
r 1
5
yea
r 1
7
yea
r 1
9
yea
r 2
1
yea
r 2
3
yea
r 2
5
yea
r 2
7
yea
r 2
9
yea
r 3
1
yea
r 3
3
yea
r 3
5
yea
r 3
7
yea
r 3
9
kb
bl/
d
US
$ m
ln
Capex Opex Oi Production

55
Table 12: Well productivity in the world in 2015 (bbl/d)
Country Average well productivity
USA 30
Canada 80
Russia 100
Mexico 800
North Sea 1300
Saudi Arabia 9000
Caspian Sea 20000
Brazil Pre-Salt 40000
Source: Based on (SANDREA, 2017)
For the fields used in this dissertation, their wells plateaus are represented in the Figure
23 below.
Figure 23: Average production per well after plateau in 103 bbl/d
Source: Based on (GAFFNEY, 2010)
For the higher volumes fields, the wells productivity reach 20 kbbl/d, the remaining
operates from 10 to 15 kbbl/d on average. The actual production data from 2017 and 2018
presents wells productivity values ranging from 8 to 22 thousand barrels per day of average
well production (ANP, 2018a), which is line with base case data, despite the base being
prepared in 2010.
0
5
10
15
20
25
58 65 243 311 364 1117 2008 2119 5445 7877
10
3 b
bl/
d
Volumes of the fields mln barrels

56
4.3.2 Sensitivity Cases
Apart from the base case, a sensitivity case is also analyzed based on the unit costs and
learning curves for drilling.
As such, the base case is composed of data from (GAFFNEY, 2010), with a sensitivity
to a lower development cost (a reduction of around 25%). Although in reality a reduced Capex
would require a new development plan, for the sake of the analysis, the 25% reduction factor
was applied evenly for all years in the capital costs.
The sensitivity case also includes the impact of a risk of not finding commercial reserves
in the exploration activity. Although this is a very small risk, it is present in the business.
Therefore the probability of success (POS) in the sensitivity case is of 90% according to the
existing pre-salt risk (PETROBRAS, 2015 apud (STUCKART; PACHECO; SILVA, 2019).
For the exploration well cost used in the risked scenario, the value was US$ 60 million. The
first pre-salt wells were drilled at US$ 250 million but in 2008 this cost went down to US$ 60
million (SANT’ ANA, 2008).
4.4 Yet to Find Pre-Salt Volumes
The fiscal incentives impact, as per the base case, is calculated over ten fields. Although
the sample is representative in terms of field sizes, it is small if compared to the total volumes
of pre-salt yet to be found in Brazil. (JONES; CHAVES, 2016) have estimated the volumes of
pre-salt yet to be discovered in Brazil. Their study was based on the number of fields yet to be
discovered and the amount of volumes they carry, which in a deterministic scenario would be
as simple as multiplying the two variables to have the total volume. However, in a probabilistic
way, both variables are not a single value, instead, they assume a distribution that fits with the
available data and the assumptions made by (JONES; CHAVES, 2016). For their analysis they
used a commercial cut-off of 100 mln boe, which means that fields below this threshold were
not included in the total volume. The distribution for the number of individual fields over a
commercial cut-off is 49, 61 and 77 for the probability of occurrence of 90%, 50% and 10%
respectively. The same way, the size of the fields has a P90 value of 423 mln boe, P50 of 1860
and P10 of 6730, making the distribution for the yet-to-find volumes to be 130, 177 and 233
bln boe at P90, P50 and P10 respectively.

57
The sample of fields used in this dissertation is in line with the distribution for field size
presented by (JONES; CHAVES, 2016). However, in order to extend the fiscal incentives
impact to the fields yet to find, it is necessary to identify how many fields represent the P90
size of 423 mln bbl, how many represent the P50 of 1860 and how many represent the P10 of
6730. It is not possible to use the distribution of the number of the fields once for each
probability of occurrence there are a combination of field size.
Therefore, to obtain the number of fields representing the P90, P50 and P10 filed size,
a simplification to a deterministic analysis was made based on some assumptions.
The first one is assuming that all distributions were triangular making the P90, P50, P10,
the low, mid and high values of the distribution. The distributions presented by (JONES;
CHAVES, 2016) are not skewed following a normal behavior. Triangular keeps the non-
skewness, but uses discrete points. Therefore, for the sake of simplicity, there were proposed
3 scenarios for the yet-to find volumes, a low, under which the volumes to be discovered is 130
mln bbls, a medium with 177 mln bbl and a high scenario with 233 bln bbl to be found. The
low is composed of 49 fields, the medium has 51 fields while the high has 77 fields.
The second assumption is related to how the small, medium and high field sizes are
distributed into each low, medium and high yet to find scenarios. (HURST; BROWN;
SWANSON, 2000) proposed an approximation method to calculate the expected value of a
normal distribution using three points, He established what was called the Swanson’s Law
under which the 30% of the occurrences are in the P90, 40% in the P50 and 10% in the P10,
therefore, by adding the multiplication of P90 by 30%, P50 by 40% and P10% by 30% it will
be approximately equal to the expected value.
At the end, by applying the Swanson’s law to the number of fields in each scenario the
values are obtained as shown in Table 13 below:
Table 13: Number of Fields in each scenario
Approximation 3 points (Swanson´s
Rule) 30% 40% 30% 100%
Number of fields Low Volumes 15 20 15 49
Number of fields Medium Volumes 18 24 18 61
Number of fields High Volumes 23 31 23 77
Source: (Chaves and Jones, 2016)

58
5 RESULTS
The results are presented for the base and sensitivity cases, including and excluding the
fiscal benefits. This chapter discusses also the impact of signature bonus and profit oil, as they
are not fixed values. And, for last, the results found for the ten fields where data was available
are extrapolated for the yet-to-find pre-salt volumes, so the impact can be assessed for the
whole play.
5.1.1 Base Case
5.1.1.1 Base Case Available Fields
Tables 14 and 15 and 16 present results for the base case, which does not consider the
recent cost reductions in pre-salt prospects nor any exploration risk. They represent the success
cases for the ten different size fields available for analysis. In the tables, the cases where IRRs
are higher than 11.29% p.y. are highlighted.
Table 14: Base Case results at $50/bbl, $60/bbl and $70/bbl without Incentive
$ 50/bbl $ 60/bbl $ 70/bbl
mln bbl NPV IRR NPV IRR NPV IRR
58 -94 6% -24 9% 43 12%
65 -409 NA16 -312 -7% -224 4%
243 -1316 -1% -999 2% -704 5%
311 -690 3% -318 7% 23 10%
364 -1480 NA10 -994 1% -557 5%
1117 -4672 0% -3517 3% -2503 5%
2008 -4974 3% -3174 5% -1550 8%
2119 -2626 5% -522 9% 1253 12%
5445 -1582 9% 2771 12% 6906 13%
7877 1595 11% 7227 13% 12622 15%
16 Not applicable. The NPV is always negative.

59
Table 15: Base Case results at $50/bbl, $60/bbl and $70/bbl with Repetro Incentive
$ 50/bbl $ 60/bbl $ 70/bbl
mln bbl NPV IRR NPV IRR NPV IRR
58 -32 8% 37 12% 102 15%
65 -270 NA10 -181 3% -96 7%
243 -643 3% -347 6% -81 9%
311 -82 9% 264 14% 574 18%
364 -581 NA10 -143 8% 252 13%
1117 -2387 3% -1395 6% -537 8%
2008 -1789 6% -138 10% 1290 13%
2119 611 12% 2462 17% 4110 23%
5445 2043 11% 6294 14% 10375 16%
7877 6091 13% 11639 15% 16963 17%
Table 16 Base Case results at $50/bbl, $60/bbl and $70/bbl with Repetro and Depreciation
Incentive
$ 50/bbl $ 60/bbl $ 70/bbl
mln bbl NPV IRR NPV IRR NPV IRR
58 -11 9% 57 13% 122 16%
65 -249 NA10 -146 4% -54 8%
243 -521 4% -207 8% 67 11%
311 64 11% 408 16% 718 21%
364 -375 3% 56 11% 446 16%
1117 -1811 4% -819 7% 39 10%
2008 -909 8% 751 12% 2179 15%
2119 1441 14% 3321 21% 4970 27%
5445 2885 12% 7137 14% 11217 16%
7877 7120 14% 12667 16% 17991 18%
For the $60/bbl and $70/bbl oil price scenarios, the larger projects remain profitable
without the Repetro fiscal incentives. Therefore, fiscal incentives are not needed for those
projects. It is a typical case where the windfall profits are transferred to the contractor
(ERICKSON et al., 2017) – i.e., hidden subsidies. On average the differences of IRR rates with
and without Repetro incentive is 5-10%, in line with a prior study (ALMEIDA; COIMBRA,
2012), with the exception of the scenario for 2,119 bln bbl based on a development already on
stream. In this case, an FPSO, which is impacted by Repetro, was included in the first year of
the cashflow leading to a larger difference between the cases with and without the incentive,
illustrating the impact of time on the development plan.
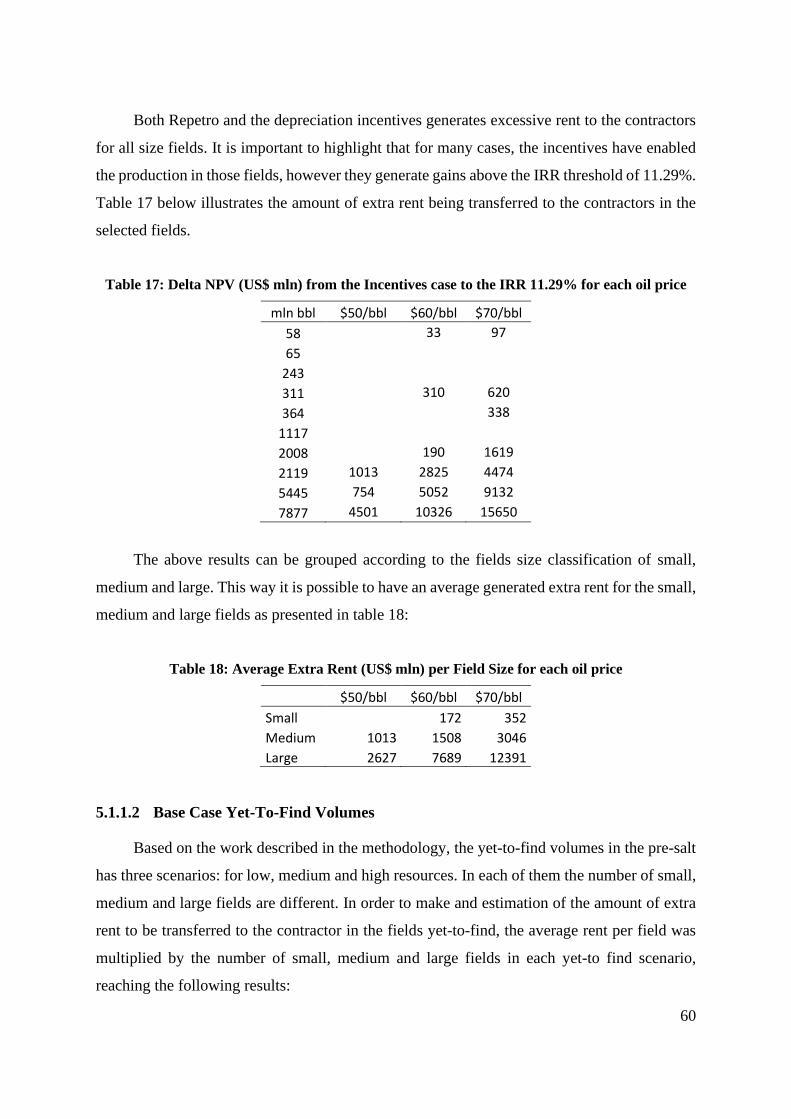
60
Both Repetro and the depreciation incentives generates excessive rent to the contractors
for all size fields. It is important to highlight that for many cases, the incentives have enabled
the production in those fields, however they generate gains above the IRR threshold of 11.29%.
Table 17 below illustrates the amount of extra rent being transferred to the contractors in the
selected fields.
Table 17: Delta NPV (US$ mln) from the Incentives case to the IRR 11.29% for each oil price
mln bbl $50/bbl $60/bbl $70/bbl
58 33 97
65
243
311 310 620
364 338
1117
2008 190 1619
2119 1013 2825 4474
5445 754 5052 9132
7877 4501 10326 15650
The above results can be grouped according to the fields size classification of small,
medium and large. This way it is possible to have an average generated extra rent for the small,
medium and large fields as presented in table 18:
Table 18: Average Extra Rent (US$ mln) per Field Size for each oil price
$50/bbl $60/bbl $70/bbl
Small 172 352
Medium 1013 1508 3046
Large 2627 7689 12391
5.1.1.2 Base Case Yet-To-Find Volumes
Based on the work described in the methodology, the yet-to-find volumes in the pre-salt
has three scenarios: for low, medium and high resources. In each of them the number of small,
medium and large fields are different. In order to make and estimation of the amount of extra
rent to be transferred to the contractor in the fields yet-to-find, the average rent per field was
multiplied by the number of small, medium and large fields in each yet-to find scenario,
reaching the following results:

61
Table 19: Total Extra Rent Generated in the Low Yet-to-find Volumes scenario (US$ mln)
Number of Fields Field Size $50/bbl $60/bbl $70/bbl
15 Small 0 2522 5169
20 Medium 19848 29552 59707
15 Large 38622 113032 182148
Total 58470 145106 247024
Table 20: Total Extra Rent Generated in the Medium Yet-to-find Volumes scenario (US$ mln)
Number of Fields Field Size $50/bbl $60/bbl $70/bbl
18 Small 0 3140 6435
24 Medium 24709 36789 74329
18 Large 48081 140713 226756
Total 72789 180642 307519
Table 21: Total Extra Rent Generated in the High Yet-to-find Volumes scenario (US$ mln)
Number of Fields Field Size $50/bbl $60/bbl $70/bbl
23 Small 0 3964 8123
31 Medium 31189 46438 93825
23 Large 60692 177621 286233
Total 91882 228023 388180
Based on the results, if we consider a conservative low scenario yet-to-find volumes in
the pre-salt play with the mid oil price of $60/bbl, the value being transferred to contractor is
estimated to be around US$ 113 bln at the for large fields. However, this estimation assumes
that all the yet-to-find fields will have the same timing of the average case, meaning that they
will all be discovered and enter into production at the same time, which is not true. Therefore,
under the assumption that one discovery will be made every year, this value is reduced to US$
48 bln, roughly half of the impact, but still a high number. If a more phased exploration and
development of the new discoveries is considered, the impact can be divided by four reaching
the values according to the table below:
Table 22: Estimation for the Extra rent based on Yet-to-Find Pre-Salt Volumes (US$ mln)
Yet-to-find Scenario
$50/bbl $60/bbl $70/bbl
Low 14618 36276 61756
Medium 18197 45160 76880
High 22970 57006 97045

62
These estimated values are a present value for fields that will be producing for the next
42 years. Despite the uncertainty regarding the future of oil demand, for some period this extra
rent could help increase the participation of the renewables in the country´s energy matrix. In
(GOLDEMBERG et al., 2014), the authors estimates the amount required to invest in CSP and
in and agency to promote this activity would be US$ 700 mln per year for 17 years, which
makes a total of US$ 11.9 bln, without other time impact considerations. The available extra
rent would be enough in any scenario or price presented here to cover those investments. Those
values represent 0.9% to 6% of Brazil’s PIB in 2019.
It is also important to highlight that the average IRR rate used for comparison might be
lower for international oil companies that have a global portfolio and can made investment
decisions elsewhere based on higher profitability. In this sense the available rent would be
lower than the prospected here. On the other hand, however, NOCs might have different
investment drivers, based on being funded by the governments, not heavily dependent on
private interest rates.
Another important point is related to oil price. What is being noted as an extra rent under
the presented prices, can also be incentives to keep the current level of production if the oil
prices fall too much.
5.1.2 Sensitivities
5.1.2.1 Development Costs Reduction
As expected, when the development costs were reduced by 25%, IRRs increased
considerably, although there is some compensation for the inclusion of a risk of 10% to make
a commercial discovery. However, this highlights even more that projects over 2,000 mln
barrels hardly need fiscal incentives to be economical. Tables 23, 24 and 25 also highlight the
cases where IRRs are higher than 11.29% p.y.. For oil prices above $60/bbl, even small projects
generate extra rent.

63
Table 23: Sensitivities results at $50/bbl, $60/bbl and $70/bbl with no Incentive
$ 50/bbl $ 60/bbl $ 70/bbl
mln bbl NPV IRR NPV IRR NPV IRR
58 -26 8% 44 13% 100 15%
65 -224 NA10 -137 4% -61 8%
243 -643 2% -368 6% -125 9%
311 -158 8% 160 12% 441 17%
364 -678 NA10 -267 6% 94 11%
1117 -2258 3% -1352 6% -588 8%
2008 -1723 6% -229 9% 1061 13%
2119 130 10% 1814 15% 3315 21%
5445 1422 11% 5263 13.3% 8946 15%
7877 5001 13% 10010 15% 14813 17%
Table 24: Sensitivities results at $50/bbl, $60/bbl and $70/bbl with Repetro Incentive
$ 50/bbl $ 60/bbl $ 70/bbl
mln bbl NPV IRR NPV IRR NPV IRR
58 -18 9% 82 15% 138 18%
65 -215 NA10 -49 8% 21 11%
243 -635 2% 51 11% 273 15%
311 -150 8% 532 21% 807 27%
364 -669 NA10 283 15% 622 21%
1117 -2249 3% -34 10% 661 13%
2008 -1715 6% 1685 15% 2841 19%
2119 138 10% 3696 27% 5079 35%
5445 1430 11% 7600 15% 11247 17%
7877 5010 13% 12949 17% 17708 19%
Table 25: Sensitivities results at $50/bbl, $60/bbl and $70/bbl with Repetro and Depreciation
Incentives
$ 50/bbl $ 60/bbl $ 70/bbl
mln bbl NPV IRR NPV IRR NPV IRR
58 38 13% 96 16% 151 19%
65 -99 4% -19 9% 53 13%
243 -96 8% 153 13% 376 17%
311 337 18% 629 24% 904 30%
364 43 11% 416 18% 753 24%
1117 -464 8% 354 12% 1049 15%
2008 900 13% 2285 18% 3441 21%
2119 2718 23% 4277 31% 5659 38%
5445 4390 13% 8169 15% 11816 17%
7877 8701 15% 13643 17% 18402 19%

64
Overall, if a regression is made for the cases without incentive, under $70/bbl oil price
the volume breakeven for the base case would be 4000 mln bbl. In the sensitivity case, the
volume breakeven is close to 0 mln bbl.
5.1.2.2 Geological Risk
The sensitivities’ results considered a geological risk of 10% to find commercial
discoveries. Although this is in line with the literature for the pre-salt exploration risk, or a
relatively new play, it is possible that the new discoveries do not present the same geological
risk. For this reason, a sensitivity analysis was made using different exploration risks for the
5445 mln bbl field.
Table 26: Impact of geological risk on the base case with both incentives
$50/bbl $60/bbl $70/bbl
POS NPV IRR NPV IRR NPV IRR
100% 2,885 11.77% 7,137 14.09% 11,217 16.05%
90% 2,593 11.77% 6,420 14.09% 10,092 16.05%
70% 2,009 11.76% 4,985 14.08% 7,841 16.04%
50% 1,425 11.75% 3,551 14.06% 5,591 16.02%
30% 840 11.72% 2,116 14.03% 3,340 15.98%
10% 256 11.55% 681 13.84% 1,089 15.78%
Findings show that for a field with a material success case value, and a failure17 case of
one single exploration well of US$ 60 mln, the impact of the geological risk is very small,
almost unnoticeable on the IRR, although the risk is directly applicable on the NPV and this
metric is significantly reduced when the POS18 is reduced. On the other hand, however, in a
smaller success case, the increase of a geological risk will have a larger impact on the IRR.
The same way this impact can be increased if the geological campaign includes more than one
exploration well and if the wells are more expensive.
17 For the purpose of the failure cost calculation it was assumed that the company would benefit from the tax
deductions of the failure case, i.e., it was not ring fenced. 18 Probability of success

65
5.1.2.3 Signature Bonus Analysis
Despite the high amount of extra rent available in the current fiscal incentive analysis,
the pre-salt fiscal terms are structured to enable extracting the extra rent, using the profit oil
and signature bonus. A sensitivity was done for both variables having the oil prices fixed, using
the large field of 5.4 bln bbl. The results are described for the three oil prices in figures 24, 25
and 26.
Figure 24: Impact of profit oil and signature bonus in IRR at $50/bbl
Figure 25: Impact of profit oil and signature bonus in IRR at $60/bbl
0%
5%
10%
15%
20%
25%
30%
35%
40%
45%
0 2000 4000 6000 8000 10000 12000 14000 16000 18000
IRR
%
Signature Bonus US$ mln
Reference 20% 49% 60% 80%
0%
10%
20%
30%
40%
50%
60%
0 2000 4000 6000 8000 10000 12000 14000 16000 18000
IRR
%
Signature Bonus US$ mln
Reference 20% 49% 60% 80%

66
Figure 26: Impact of profit oil and signature bonus in IRR at $70/bbl
The results presented in the base case and sensitivities have fixed values for bonus and
profit oil rates. Although they were based on average real values, as described in the
methodology, they may not reflect the reality. It is possible to have a low profit oil rate for a
large field, as this is defined on the auction. In figures 29, 30 and 31, it is possible to see the
different combination of situations illustrating that for high oil prices, even on the situation
with high bonus, there is usually an extra rent available. On the other hand, for the oil price of
$50/bbl, the contractor can be significantly impacted if the combination of high volumes, high
profit oil occurs.
The signature bonus, being a fixed amount independent of the result of the field can
severely impact fields found latter to be small, therefore for this reason the profit oil is a better
instrument the increase the government take. The profit oil is obtained only after the field is
developed and profit is achieved. For the regulators, it is hard sometimes to balance both
factors on top of predictions for future oil prices, once the areas, despite the very low geological
risk, still carries some uncertainties that might influence the results. On the other hand, they
also have to balance upfront gains obtained with bonuses with profit oil, which will come latter.
But, in all means they have the tools, under the production sharing fiscal terms to reduce the
extra rent going to the contractors.
0%
10%
20%
30%
40%
50%
60%
70%
0 2000 4000 6000 8000 10000 12000 14000 16000 18000
IRR
%
Signature Bonus US$ mln
Reference 20% 49% 60% 80%

67
5.1.2.4 Depressed Oil Price Analysis
Again this sensitivity analysis is performed for the large field of 5.4 bln bbl. The oil prices
are an important factor to the analysis and depending on the combination of profit oil and
bonus, the amount of extra rent is increased or reduced. Below the results are presented fixing
the bonus payment and varying oil price and profit oil. In this scenario, a price of $30/bbl is
also included for analysis due to the current pandemic world condition that is leading to an
economic retraction, reducing the oil prices
Figure 27: Impact of profit oil and oil price in IRR at US$ 2000 million Bonus
Figure 28: Impact of profit oil and oil price in IRR at US$ 4000 million Bonus
0%
5%
10%
15%
20%
25%
30%
35%
40%
30 35 40 45 50 55 60 65 70 75
IRR
%
Oil Price US$/bbl mln
Reference 20% 40% 60% 80%
-20%
-10%
0%
10%
20%
30%
30 35 40 45 50 55 60 65 70 75
IRR
%
Oil Price US$/bbl mln
Reference 20.0% 40.0% 60.0% 80.0%

68
Figure 29: Impact of profit oil and oil price in IRR at US$ 8000 million Bonus
As it is possible to notice, for a high bonus value, it is necessary to have a low profit oil
rate to make sure the project will sustain scenarios of low oil price. For prices below $40/bbl,
a bonus above US$ 4000 million undermines the attractiveness of pre-salt production in Brazil.
As the results shown in this thesis refer to a large and more profitable field, findings would be
worse for smaller fields. In this case, even altering the profit oil share in favor of the contractor,
do not solve the problem, and the bonus has to be reviewed.
For a bonus of US$ 2000, in figure 27, the different curves for the different profit oil rate
have such an inclination that demonstrates how the projects are very sensitive to oil prices. In
this scenario, it would be necessary a big variation of profit oil to compensate for the price
difference. For the $60/bbl price the 80% profit oil is close to the reference IRR case, however,
if the price goes down to $30/bbl, the IRR goes down to 2.5%. In order to compensate for the
loss in price, it would be necessary to reduce the profit oil to 20%, a profit oil delta of 60%.
However, this movement is not possible under the current contractual terms. The same way, if
the opposite movement on price happens and the project was acquired under 20% profit oil
rate, if the oil price goes up to $60/bbl, an equivalent of 40% profit oil rate would be given to
contractor.
One possibility to reduce this discrepancy is through the profit oil matrix. Although they
are based on oil prices and wells productivity, the oil price range is from 0 to $160/bbl. In this
interval, for the average well productivity of 12 kbbl/d, the profit oil rate is around 11%. If we
consider the price internal of $60/bbl to $30/bbl, as in the example above, this profit oil range
goes down to 5%, very different from the 40% observed on figure 27 results. In this sense, if
the PSC terms had fixed profit oil rates, the same for all projects, with a wider range of profit
-15%
-10%
-5%
0%
5%
10%
15%
20%
25%
30 35 40 45 50 55 60 65 70 75
IRR
%
Oil Price US$/bbl mln
Reference 20% 40% 60% 80%

69
oil rates within the same well productivity, it would be possible to flat the curve by reducing
the contractor gains when prices are higher but also reducing their exposure for the low oil
price scenarios.
Figure 30 below includes a case with the profit oil rate of 5% for $20/bbl; 50% for
$40/bbl, 77% for oil price of $60/bbl and 80% for the price of $80/bbl. This new case is
represented as the “fixed” case.
Figure 30: Impact of profit oil and oil price in IRR at US$ 2000 million Bonus
with the fixed case
This suggestion is one option to solve the problem. It is still necessary to format the
conditions for this solution, especially because it would be focusing on a narrower price range
than the current profit oil matrix is doing. It is important to think how to adjust the ultrahigh
prices also.
0%
5%
10%
15%
20%
25%
30%
35%
40%
30 35 40 45 50 55 60 65 70 75
IRR
%
Oil Price US$/bbl mln
Reference 20% 40% 60% 80% Fixed

70
6 CONCLUSIONS
The Brazilian oil industry was significantly impacted by the pre-salt discovery. This
dissertation tested the hypothesis that fiscal incentives in Brazil, through the Repetro program,
generates windfall profits for contractors. To do so, this study developed detailed DCF analyses
for different typologies of fields, and, then, expanded them for evaluating if Repetro fiscal
incentives generate hidden subsidies in the pre-salt area, according to a frequency distribution
of the fields. Ten years past, half of Brazil´s petroleum production comes from this area, also
benefiting from a learning process reducing costs and time for development and production.
However, Brazil expanded the fiscal exemptions to this activity up to 2040.
The modifications made to the Repetro law illustrates the Government efforts to simplify
the application of the special tax regime and to incentive the investment in the pre-salt area.
However, findings show that there are projects that do not need any fiscal incentives to be
profitable, resulting in an extra rent to the contractor in detriment of the State (or the Brazilian
society) under certain oil prices. Moreover, the existing production sharing terms can be used,
respecting its limitations, to increase or reduce contractor rent, if necessary. However, the
Government has to play with three key variables, oil price, profit oil rate and signature bonus
to make it happen.
In the price scenario range of $50/bbl to $60/bbl, using average profit oil and signature
bonuses, the base case and sensitivities present volumes at which the IRRs are above the
average threshold. The giant fields, above 5,000 mln bbl, perceive extra rent from $60/bbl. At
$70/bbl oil price, volumes ranging from 2,500 mln bbl to 4,500 mln bbl could be feasible
without Repetro, depending on the profit oil share. For the sensitivity case, which considers
cost reductions in pre-salt and an exploration risk, this range becomes 1,000 mln bbl to 1,500
mln bbl.19
The breakeven price for a 5,000 mln bbl field with a 32% profit oil rate and US$ 11 bln
signature bonus, without Repetro, is around $49/bbl to $57/bbl in the sensitivity and the base
case, respectively. Thus, at oil prices above those values, the respective cases provide an extra-
rent to operators. However, at different profit oil rates and signature bonuses, those values can
be higher or lower. At the current oil prices on the level of $30/bbl, no extra rent is perceived.
19 Just to exemplify, existing pre-salt discoveries have declared recoverable volumes of 6500 mln bbl in the Lula
field, 1800 mln bbl in Iracema and 2100 mln bbl in Sapinhoá (FRAGA, 2012).

71
The existing fiscal incentives have the potential to generate around US$ 36 billion of
extra rent in the next 50 years if we consider the yet-to-find volumes of 130 bln bbl20 on the
pre-salt play at the oil price range of $60/bbl. If perceived as a government take, this extra rent
could increase the value of the social fund created to promote development in the education,
public health and environment among others.
The production sharing fiscal terms in Brazil can play a role for providing the necessary
incentive to small fields, just by regulating the minimum profit oil share and signature bonus,
Under the oil price range from $50/bbl to $70/bbl, the existing fiscal incentives are currently
generating extra rent on both small and giant fields, which can also be reduced by the use of
the production sharing fiscal terms. The adjustment is complex as it involves weighting
geological risks, future macroeconomic conditions. Therefore, there is a constant need for
revision of premises in order to assess the existence of extra rent and being able to give a proper
destination to it for the country, instead of increasing the contractors’ profit. This can be done
without undermining the attractiveness of the most valuable fields.
Some data shall also be revised in a future assessment of this topic, especially regarding
costs estimations and minimum IRR the companies would undertake. In fact, each oil company
has its own opportunity cost of capital, depending on different factors, such as leverage level,
investment portfolio, etc. Therefore, some companies might accept smaller than the average
industry IRR (e.g. for acquiring large volumes of oil), and others need to have higher IRR (for
example, to cope with higher level of leverages).
It is important to understand how the market is being adjusted for the current low oil
price scenario. This situation also requires a careful analysis of the PSC terms, in order a
evaluate opportunities for improvement. For instance, this study has shown that for a $30/bbl
price scenario, as the one faced today by the international petroleum industry, which might last
for some period, a better approach would be to focus on the better design of the profit oil range,
than on the higher bonus, whose impact concentrate in the begin of the DCF. This study has
shown that it is possible to keep the attractiveness of pre-salt oil fields under low oil prices, in
this case.
A future study could also appraise the use of this extra rent as a source for funding the
transition towards a low-carbon economy in Brazil.
20 This is the P90 volumes of Yet-to-find.

72
REFERENCES
ALMADA, L. P.; PARENTE, V. Oil & Gas Industry In Brazil : A Brief History And Legal
Framework. Panorama of Brazilian Law, v. 1, n. No 1, p. 223–252, 2013.
ALMEIDA, E. DE et al. Custos e Competitividade da Atividade de E&P no Brasil. Texto para
Discussão IBP, p. 1–36, 2016.
ALMEIDA, E. L. F. DE; COIMBRA, V. Modelagem Econômica e Fiscal de Projetos
Petrolíferos: impacto do REPETRO sobre a rentabilidade de projetos. Grupo de Economia da
Energia, v. 001, n. February 2012, p. 42, 2012.
ANP. Dados estatísticos: produção de petróleo e gás natural. Disponível em: <
http://www.anp.gov.br/dados-estatisticos >. Acesso em: 4 set. 2018b
ANP. Rodadas de licitações de petróleo e gás natural. Disponível em:
<http://rodadas.anp.gov.br/pt/ >. Acesso em: 4 set. 2018b.
ANP. Oil, Natural Gas and Biofuels Statistical Yearbook 2017. Disponível em:
<http://www.anp.gov.br/publicacoes/anuario-estatistico/oil-natural-gas-and-biofuels-
statistical-yearbook-2017#Others>. Acesso em: 8 mar. 2020c.
ANP. A História do Petróleo no Brasil. Disponível em:
<http://www.anp.gov.br/institucional/a-historia-do-petroleo>. Acesso em: 14 mar. 2020.
BENES, K. et al. LOW OIL PRICES : AN OPPORTUNITY FOR FUEL SUBSIDY
REFORM. Center om Global Energy Policy, p. 25, 2015.
BHATTACHARYYA, S. C. Energy Economics: Concepts, Issues, Markets and
Governance. 1st. ed. London: Springer-Verlag, 2011.
BRAGA, L. P.; SZKLO, A. S. The recent regulatory changes in Brazilian petroleum
exploration and exploitation activities. Journal of World Energy Law and Business, v. 7, n.
2, p. 120–139, 2014.
BRASIL. Constituição Da República Dos Estados Unidos Do Brasil ( De 24 De Fevereiro
De 1891). Disponível em:

73
<http://www.planalto.gov.br/ccivil_03/Constituicao/Constituicao91.htm>.
BRASIL. Decreto No 6.323, de 10 de janeiro de 1907. Disponível em:
<https://www2.camara.leg.br/legin/fed/decret/1900-1909/decreto-6323-10-janeiro-1907-
517453-publicacaooriginal-1-pe.html>. Acesso em: 12 fev. 2020.
BRASIL. Decreto No 2.933, de 6 de janeiro de 1915. Disponível em:
<https://www2.camara.leg.br/legin/fed/decret/1910-1919/decreto-2933-6-janeiro-1915-
574337-publicacaooriginal-97500-pl.html>. Acesso em: 20 fev. 2020.
BRASIL. Decreto No 4.265, de 15 de janeiro de 1921. Disponível em:
<https://www2.camara.leg.br/legin/fed/decret/1920-1929/decreto-4265-15-janeiro-1921-
568703-publicacaooriginal-92061-pl.html>.
BRASIL. Constituição Da República Dos Estados Unidos Do Brasil (De 16 De Julho De
1934). Disponível em:
<http://www.planalto.gov.br/ccivil_03/constituicao/constituicao34.htm>. Acesso em: 20 fev.
2020a.
BRASIL. Decreto no 23.979, de 8 de março de 1934. Disponível em:
<https://www2.camara.leg.br/legin/fed/decret/1930-1939/decreto-23979-8-marco-1934-
499088-publicacaooriginal-1-pe.html>. Acesso em: 20 fev. 2020b.
BRASIL. Decreto no 24.642 de 10 de julho de 1934. Disponível em:
<https://presrepublica.jusbrasil.com.br/legislacao/111068/decreto-24642-34>. Acesso em: 20
fev. 2020c.
BRASIL. Decreto-lei no 366, de 11 de abril de 1938. Disponível em:
<https://presrepublica.jusbrasil.com.br/legislacao/126755/decreto-lei-366-38>.
BRASIL. Decreto-Lei No 395, de 29 de abril de 1938. Disponível em:
<http://www.planalto.gov.br/ccivil_03/Decreto-Lei/1937-1946/Del0395.htm>. Acesso em: 20
fev. 2020b.
BRASIL. Decreto-Lei No 3.365, de 21 de junho de 1941. Disponível em:
<http://www.planalto.gov.br/ccivil_03/Decreto-Lei/Del3365compilado.htm>. Acesso em: 20

74
fev. 2020c.
BRASIL. Lei No 2.004, de 3 de outubro de 1953. Disponível em:
<https://www2.camara.leg.br/legin/fed/lei/1950-1959/lei-2004-3-outubro-1953-366242-
norma-pl.html>. Acesso em: 20 fev. 2020.
BRASIL. Constituição Da República Federativa Do Brasil De 1988. Disponível em:
<http://www.planalto.gov.br/ccivil_03/constituicao/constituicao.htm>. Acesso em: 25 fev.
2020.
BRASIL. Emenda Constitucional No 9, De 09 De Novembro De 1995. Disponível em:
<http://www.planalto.gov.br/ccivil_03/constituicao/Emendas/Emc/emc09.htm>. Acesso em:
25 fev. 2020.
BRASIL. Lei Complementar no 87/1996. Disponível em:
<http://www.planalto.gov.br/ccivil_03/leis/lcp/lcp87.htm>. Acesso em: 10 mar. 2020.
BRASIL. Lei No 9.478, de 6 de agosto de 1997. Disponível em:
<ttp://www.planalto.gov.br/ccivil_03/LEIS/L9478.htm>. Acesso em: 25 fev. 2020a.
BRASIL. Lei No 9.478, de 6 de agosto de 1997. Disponível em:
<http://www.planalto.gov.br/ccivil_03/LEIS/L9478.htm>. Acesso em: 25 fev. 2020b.
BRASIL. Decreto No 2.705, de 3 De agosto de 1998. Disponível em:
<http://www.planalto.gov.br/ccivil_03/decreto/D2705.htm>. Acesso em: 25 fev. 2020.
BRASIL. Decreto no .3161, de 02 de setembro de 1999. Disponível em:
<http://www.planalto.gov.br/ccivil_03/decreto/D3161.htm>. Acesso em: 31 ago. 2018.
BRASIL. Lei No 12.351, de 22 de dezembro de 2010. Disponível em:
<http://www.planalto.gov.br/ccivil_03/_Ato2007-2010/2010/Lei/L12351.htm>. Acesso em:
25 fev. 2020a.
BRASIL. Lei No 12.276, de 30 de junho de 2010. Disponível em:
<http://www.planalto.gov.br/ccivil_03/_Ato2007-2010/2010/Lei/L12276.htm>. Acesso em:
25 fev. 2020b.

75
BRASIL. Lei No 12.304, de 2 de agosto de 2010. Disponível em:
<http://www.planalto.gov.br/ccivil_03/_Ato2007-2010/2010/Lei/L12304.htm>. Acesso em:
25 fev. 2020c.
BRASIL. Intended Nationally Determined Contribution: Towards achieving the objective
of the United Nations Framework Convention on Climate ChangeUNFCCC. [s.l: s.n.].
Disponível em: <http://www4.unfccc.int/Submissions/INDC/Published
Documents/Brazil/1/BRAZIL iNDC english FINAL.pdf>.
BRASIL. Decreto No 9.042, de 2 de maio de 2017. Disponível em:
<http://www.planalto.gov.br/ccivil_03/_Ato2015-2018/2017/Decreto/D9042.htm>. Acesso
em: 2 mar. 2020a.
BRASIL. Lei no 13.586, de 28 de dezembro de 2017. Disponível em:
<http://www.planalto.gov.br/ccivil_03/_ato2015-2018/2017/lei/L13586.htm>. Acesso em: 20
jul. 2018b.
BRASIL. Instrução Normativa RFB no 1782, de 11 de janeiro de 2018. Disponível em:
<http://normas.receita.fazenda.gov.br/sijut2consulta/link.action?idAto=89433&visao=anotad
o>. Acesso em: 2 mar. 2020.
BRASIL. IRPJ (Imposto de renda sobre as pessoas jurídicas). Disponível em:
<http://receita.economia.gov.br/acesso-rapido/tributos/IRPJ>. Acesso em: 2 mar. 2020.
CHEON, A.; URPELAINEN, J.; LACKNER, M. Why do governments subsidize gasoline
consumption? An empirical analysis of global gasoline prices, 2002-2009. Energy Policy, v.
56, p. 382–390, 2013.
CHEVALIER J.-M. Les Grandes Batailles de l’énergie. Petit traité d’une économie
violente. Paris: Gallimard, 2004.
COADY, D. et al. Petroleum Product Subsidies: Costly, Inequitable, and Rising.IMF Staff
Position Note SPN/10/05. Washington D.C.: [s.n.].
COIMBRA, V. A.; ALMEIDA, E. F. Modelagem Econômica e Fiscal de Projetos Petrolíferos :
Impacto do Repetro sobre a Rentabilidade de Projetos. n. May, p. 1–10, 2012.

76
COLLINS, A. R.; HANSEN, E.; HENDRYX, M. Wind versus coal: Comparing the local
economic impacts of energy resource development in Appalachia. Energy Policy, v. 50, p.
551–561, 2012.
DA HORA, M. A. B. P. et al. Decision making to book oil reserves for different Brazilian fiscal
agreements using dependence structure. Energy Strategy Reviews, v. 26, n. July, 2019.
DA SILVA, T. P. F. Repetro - Regime aduaneiro especial de importação e exportação de
bens destinados à pesquisa e lavra de petróleo e gás: análise dos entraves e propostas de
soluções. 2008. 175f. Dissertação (Mestrado em Gestão Empresarial) - Escola Brasileira de
Administraçã Pública e de Empresas, Fundação Getúlio Vargas, Rio de Janeiro, 2008.
DE MENDONÇA, P. M. M.; SQADINI, A. R.; MILANI, E. J. Exploração na petrobras: 50
anos de sucesso. Boletim de Geociencias da Petrobras, v. 12, n. 1, p. 9–58, 2003.
DIAS, J. L. DE M.; QUAGLINO, M. A. A questão do Petróleo no Brasil: uma história da
PETROBRAS. Rio de Janeiro: CPDOC: PETROBRAS, 1993.
DZIENLOWSKI, J. S. Concession, Production Sharing and Participation. In: International
Petroleum Transactions. 2nd. ed. Denver: Rocky Mountain Mineral Law Foundation, 2000.
p. 1005.
EIA- ELECTRICITY - U.S. ENERGY INFORMATION ADMINISTRATION. Analysis &
projections. Disponível em: <https:// https://www.eia.gov/electricity/>. Acesso em: 7 mar.
2020a.
EIA. EIA Spot Prices. Disponível em:
<https://www.eia.gov/dnav/pet/PET_PRI_SPT_S1_D.htm>. Acesso em: 7 mar. 2020a.
EIA. International Data. Disponível em: <https://www.eia.gov/international/data/world>.
Acesso em: 15 mar. 2020b.
ERICKSON, P. et al. Effect of subsidies to fossil fuel companies on United States crude oil
production. Nature Energy, v. 2, n. 11, p. 891–898, 2017.
ERNST & YOUNG. Global oil and gas tax guide 2019. [s.l: s.n.]. Disponível em:
<http://www.ey.com/Publication/vwLUAssets/2013_global_oil_and_gas_tax_guide/$FILE/E

77
Y_Oil_and_Gas_2013.pdf>. Acesso em 20 nov, 2019.
FRAGA, C. T. Pre-Sal: Panorama e oportunidades. Rio de Janeiro: Petrobras, 2012.
Disponível em: < https://www.investidorpetrobras.com.br/services/_pub/siteri-
1/redirect.asp?grupo=5094&idioma=ptb&arquivo=ApresentacaoPRESALPetrobrasRi
20oOilandGasPortugues.pdf&tipo=arquivo&protocolo_atual=>. Acesso em 20 nov, 2019.
FURTADO, C. Formação Econômica do Brasil. 32. ed. São Paulo: Companhia Edtora
Nacional, 2005.
GAFFNEY, C. & A. Review and evaluation of ten selected discoveries and prospects in the
pre-salt play of the deepwater. Disponível em: <
https://www.ncbi.nlm.nih.gov/pubmed/10770985>. Acesso em 20 nov, 2017.
GERASIMCHUK, I. et al. Beyond Fossil Fuels : Fiscal Transition in Brics. Winnipeg:
International Institute for Sustainable Development. November, p. 35, 2019.
GOLDEMBERG, J. et al. Oil and natural gas prospects in South America: Can the petroleum
industry pave the way for renewables in Brazil? Energy Policy, v. 64, p. 58–70, 2014.
HARTWICK, J. M. American Economic Association Intergenerational Equity and the
Investing of Rents from Exhaustible Resources. The American Economic Review, v. 67, n.
5, p. 972–974, 1977.
HEGAR, G. 2017 Property Value Study: discount rate range for oil and gas properties. Texas
Controller of Public Accounts, n. September, p. 3–8, 2017.
HURST, A.; BROWN, G. C.; SWANSON, R. I. Swanson’s 30-40-30 Rule. AAPG, v. 84, n.
12, p. 1883–1891, 2000.
IBGE. Extração, importação, exportação e consumo aparente de petróleo liuto - 1935-87,
Estatísticas do século XX. Disponível em: < https://seculoxx.ibge.gov.br/economicas/tabelas-
setoriais/energia.html >. Acesso em 20 nov, 2019
JOHNSTON, D. International Petroleum Fiscal Systems and Production Sharing
Contracts. First Edit ed. [s.l.] Pennwell Pub, 1994.

78
JOHNSTON, D.; JOHNSTON, D. Fundamental Petroleum Fiscal Considerations. Oxford:
Oxford Energy Comment, 2015. Disponível em:
<https://www.oxfordenergy.org/.../Fundamental-Petroleum-Fiscal-Considerations.pdf>.
Acesso em 02 Mar, 2020.
JONES, C. M.; CHAVES, H. A. F. Assessment Of Brazilian Pre-Salt Yet-To-Find-Oil
Potential Under A Low Oil Price Scenario Assessment Of Brazilian Pre-Salt. Rio Oil and
Gas. Anais .Rio de Janeiro: IBP, 2016
KIBBEY, A.; RASOR, R.; BOSTWICK, B. Valuing Oil & Gas Assets: the Complexities
and Key Considerations. Disponível em: <https://www.finance-
monthly.com/2017/01/valuing-oil-gas-assets-the-complexities-and-key-considerations/>.
Acesso em: 15 mar. 2020.
KLEINBERG, R. L. et al. Tight oil development economics: Benchmarks, breakeven
points and inelasticities. Massashussets: [s.n.]. Disponível em: <https://www.kapsarc.org/wp-
content/uploads/2016/09/2016-012-Kleinberg-etal_MIT-Center_Hobbs.pdf> Acesso em: 15
mar. 2019.
KOJIMA, M. Government Response to Oil Price Volatility Government Response to Oil Price
Volatility. Extractive Industries for Development Series, v. 10, n. July, 2009.
KOPLOW, D. Phasing Out Fossil-Fuel Subsidies in the G20 a progress update. Oil Change
International. June, 2012.
KPMG. A Guide to Brazilian Oil & Gas Taxation. [s.l: s.n.]. Disponível em:
<www.kpmg.com/BR>. Acesso em: 15 mar. 2019
KUNJAN, B. Exploration Chance of Success Predictions - Statistical Concepts and Realities.
ASEG Extended Abstracts, v. 2016, n. 1, p. 1–8, 2016.
LIMA, P. C. R. Descrição e análise do contrato de cessão onerosa entre a União e a Petrobrás.
p. 35, 2010. Disponível em: <
http://bd.camara.gov.br/bd/bitstream/handle/bdcamara/4745/descricao_analise_lima.pdf?sequ
ence=3 > Acesso em: 15 mar. 2019

79
LIMA, P. C. R. Análise da Medida Provisória N o 795. 2017. Disponível em: < >. Acesso em:
15 mar. 2019
LUCCHESI, C. F. Petróleo. Estudos Avançados, v. 12, n. 33, p. 17–40, 1998. Disponível em:
< >.Acesso em: 15 mar. 2019
LUCCHESI, R. D. Regimes Fiscais de Exploração e Produção de Petróleo no Brasil e no
Mundo. 2011. p149. Dissertação (Mestrado em Planejamento Energético) - COPPE,
Universidade Federal do Rio de Janeiro, Rio de Janeiro, 2011.
MATHIAS, M. C. P. P. a Formação Da Indústria Global De Gás Natural: Definição,
Condicionantes E Desafios. 2008. p. 253. Tese (Doutorado em Planejamento Energético) -
COPPE, Universidade Federal do Rio de Janeiro, Rio de Janeiro, 2008.
MAURER, N. The Empire Struck Back: Sanctions and Compensation in the Mexican Oil
Expropriation of 1938. Journal of Economic History, v. 71, n. 3, p. 590–615, 2011.
MCMICHAEL, C. L.; SPENCER, A. Operational Issues. In: Guidelines for the Evaluation
of Petroleum Reserves and Resources. Richardson: Society of Petroleum Engineers, 2001.
p. 139. Disponível em: < https://www.spe.org/industry/docs/PRMS_Guidelines_Nov2011.pdf
>.Acesso em: 15 mar. 2019
MCMICHAEL, C. L.; YOUNG, E. D. Reserve Recognition Under Production-Sharing and
Other Nontraditional Agreements. In: Guidelines for the Evaluation of the Petroleum
Reserves and Resources. Richardson: Society of Petroleum Engineers, 2001. p. 109–130.
Disponível em: < https://www.spe.org/industry/docs/PRMS_Guidelines_Nov2011.pdf >.
Acesso em: 15 mar. 2019
MENDONÇA, P. M. DE; SPADINI, A. R.; MILANI, E. J. Exploração na Petrobras: 50 anos
de sucesso. B Geoci. Petrobras, v. 12, n. n.1, p. 9–58, 2003. Disponível em: <
https://www.researchgate.net/publication/295543459_Exploration_at_Petrobras_50_years_of
_success >.Acesso em: 15 mar. 2019
MINISTÉRIO DA FAZENDA. Nota técnica sobre os efeitos da Medida Provisória no 795
que trata da tributação da exploração de petróleo e gás. Disponível em:
<http://www.fazenda.gov.br/centrais-de-conteudos/notas-tecnicas/2017/2017-11-

80
24_notatenica_mf-rfb_mp-795.pdf/view>. Acesso em: 25 jul. 2018.
MORAIS, J. M. DE. Petróleo em águas profundas: Uma história tecnológica da Petrobras
na exploração e produção offshore. Brasília: Ipea, 2013. Disponível em: < >.Acesso em: 15
mar. 2019
MOTTA, R. DA R.; CALÔBA, G. M. Análise de Investimentos Tomada de Decisão em
Projetos industriais. São Paulo: Ed. Atlas, 2002.
NASCIMENTO, M. S. Implantação e Evolução da indústria Automobilística no Brasil.
Revista Tocantinense de Geografia, v. Ano 05, 07, n. Janeiro-Julho, p. 67–79, 2016.
NOGUEIRA HALLACK, L. et al. Curve-fitting variants to model Brazil’s crude oil offshore
post-salt production. Journal of Petroleum Science and Engineering, v. 159, n. July, p. 230–
243, 2017.
PEDROSA JR, O. A.; CORRÊA, A. C. DE F. A PPSA e os Desafios do Pré-Sal: Riscos e
Oportunidades para o País. 2014. Disponível em: < http://www.gr.unicamp.br/penses/wp-
content/uploads/2016/03/A-PPSA-e-os-Desafios-do-Pr%C3%A9-Sal.pdf >.Acesso em: 15
mar. 2019
PETROBRAS. Tecnologias pioneiras do pré-sal. Disponível em:
<https://presal.hotsitespetrobras.com.br/tecnologias-pioneiras/#6>. Acesso em: 4 set. 2018.
PETROBRAS. Vamos bater meta de produção e reduzir custos de extração, afirma
Parente, na OTC. Disponível em: <http://www.petrobras.com.br/fatos-e-dados/vamos-bater-
meta-de-producao-e-reduzir-custos-de-extracao-afirma-parente-na-otc.htm>. Acesso em: 30
ago. 2018.
PPSA. Marcos Históricos. Disponível em: <http://www.presalpetroleo.gov.br/ppsa/a-pre-sal-
petroleo/marcos-historicos>. Acesso em: 15 mar. 2020.
PWC. Oil and Gas in Indonesia. Investment and Taxation Guide 2019. Indonesia:
Investment and Taxation Guide, 2019 p 148. Disponível em
<https://www.pwc.com/id/en/pwc-publications/industries-publications/energy--utilities---
mining-publications/oil-gas-guide-2019.html>. Acesso em: 15 mar. 2019

81
RICARDO, D. On The Principles of Political Economy and Taxation. In: PIERO SRAFFA
(Ed.). . Works and Correspondence of David Ricardo. Cambridge: [s.n.]. v. Ip. 333.
RIPED, C. Global Oil & Gas Exploration Situation and Implication. 2019.
ROCHA, B. A. Nota Técnica no 39, de 2017 - Subsídios acerca da adequação orçamentária
e financeira da Medida Provisória no 795, de 17 de agosto de 2017. 2017. p. 10. Brasília:
Senado Federal, 2017. Disponível em: <
https://www12.senado.leg.br/orcamento/documentos/estudos/tipos-de-estudos/notas-tecnicas-
de-adequacao-orcamentaria-e-financeira/mpv-no-795-de-17-de-agosto-de-2017/view
>.Acesso em: 15 mar. 2019
SAHEBONAR, H.; FARD, A. T.; FARIMANI, F. M. Economic Analysis of New Iraniab
Petroleum Contract (IPC): The Case Study of Caspian Sea Fields. In Energy Economics
Emerging from the Caspian Region: Challenges and Opportunities, 1st IAEE Eurasian
Conference, p. 28–31, 2016.
SANDREA, R. New reservoir-quality index forecasts field well- productivity worldwide New
reservoir-quality index forecasts field well-productivity worldwide. n. December 2016, 2017.
SANT’ ANA, M. Petrobrás já perfurou 15 poços no pré-sal. Disponível em:
<https://www.camara.leg.br/noticias/122349-petrobras-ja-perfurou-15-pocos-no-pre-sal/>.
Acesso em: 15 mar. 2020.
SANTOS, V. E. N. et al. Chemicals, electricity and fuels from biorefineries processing Brazil’s
sugarcane bagasse: Production recipes and minimum selling prices. Renewable and
Sustainable Energy Reviews, v. 53, p. 1443–1458, 2016.
SHELL. Nossa História no Brasil. Disponível em: <https://www.shell.com.br/sobre-a-
shell/nossa-historia.html>. Acesso em 2 feb, 2020.
SILVA, F. DE P. F. Vulnerabilidade dos Países Exportadores de Petróleo à Própria
Riqueza: O Caso dos Países Membros da OPEP. 2018. p 258. Dissertação (Mestrado em
Planejamento Energético) - COPPE, Universidade Federal do Rio de Janeiro, Rio de Janeiro,
2018.

82
SMIL, V. Energy in Nature and Society General Energetics of Complex Systems. Boston:
MIT Press, 2007.
SMITH, E. E. World Energy Resources. In: International Petroleum Transactions. 2nd. ed.
Denver: Rocky Mountain Mineral Law Foundation, 2000a. p. 1005.
SMITH, E. E. Service Contracts, Technology Transfers, and Related Issues. In: International
Petroleum Transactions. 2nd. ed. Denver: Rocky Mountain Mineral Law Foundation, 2000b.
p. 1005.
SORIA, R. et al. Hybrid concentrated solar power (CSP)-biomass plants in a semiarid region:
A strategy for CSP deployment in Brazil. Energy Policy, v. 86, n. March 2014, p. 57–72, 2015.
SOUSA, F. J. R.; MATTOS, C. C. A. DE. Avaliação Do Estudo " Análise Técnica Da
Medida Provisória 795, De 2017 ". Disponível em: <https://www.camara.leg.br/assessoria-
de-imprensa/528392-consultoria-legislativa-publica-nota-tecnica-sobre-a-mp-que-trata-de-
tributacao-do-setor-petrolifero/>. Acesso em: 2 ago. 2018.
SOVACOOL, B. K. Solving the oil independence problem: Is it possible? Energy Policy, v.
35, n. 11, p. 5505–5514, 2007.
STEFANSKI, R. Dirty Little Secrets : Inferring Fossil-Fuel Subsidies from Patterns in
Emission Intensities. n. 1705, 2017.
STUCKART, B. R. L.; PACHECO, C. A. G.; SILVA, F. DE P. F. Brazilian Oil and Gas Report
2018/2019 Trends and Recent Development. EPE-DPG-BOR-2019, n. December, 2019.
SZKLO, A. S.; CARNEIRO, J. T. G.; MACHADO, G. Break-even price for upstream activities
in Brazil: Evaluation of the opportunity cost of oil production delay in a non-mature
sedimentary production region. Energy Policy, v. 33, p. 589–600, 2008.
THOMAS, J. E. (ORG. . Fundamentos da Engenharia do Petróleo. Rio de Janeiro:
Interciência, 2001.
TOEWS, G.; NAUMOV, A. The Relationship Between Oil Price and Costs in the Oil and
Gas IndustryOxCarre Working Papers 152. Oxford: Oxford Centre for the Analysis of
Resource Rich Economies. Disponível em < https://ideas.repec.org/p/oxf/oxcrwp/152.html>

83
Acesso em 20 Mar, 2019.
TOLMASQUIM, M. T. Marcos regulatórios da indústria mundial do petróleo/Maurício
Tomasquim, Helder Queiroz Pinto Junior (org.). Rio de Janeiro: Synergia: EPE, 2011.
TORDO, S. Fiscal Systems for Hydrocarbons: Design Issues. Washington D.C.: World
Bank Working Paper no. 123. 2007, p. 86. Washington D.C., 2019. Disponível em:
<https://books.google.com/books?id=NgIpoAXQnvIC&pgis=1>. Acesso em: 15 mar. 2019
TORRES, E. M. M. A Evolução da Indústria Petroquímica Brasileira. Química Nova, v. 20,
p. 49–54, 1997.
UNITED NATIONS. United Nations Handbook on Selected Issues for Taxation of the
Extractive Industries by Developing Coutries. New York: [s.n.]. Disponível em:
<https://www.un-ilibrary.org/economic-and-social-development/united-nations-handbook-
on-selected-issues-for-taxation-of-the-extractive-industries-by-developing-
countries_4632a533-en>. Acesso em: 15 mar. 2019
VICTOR, D. The Politics of Fossil-Fuel Subsidies. San Diego: The Global Subsidies
Initiative Untold Billions: fossil-fuel subsidies, their impacts and the path to reform,
International Institute for Sustainable Development, 2009. p. 34.
WILSON, C. Up-scaling, formative phases, and learning in the historical diffusion of energy
technologies. Energy Policy. Elsevier, v. 50, p. 81–94, 2012.
YERGIN, D. The Prize: The Epic Quest for Oil, Money and Power. 1st. ed. New York:
Simon and Schuster, 1991.

84
Annex I – Special Participation Tax (SPT)
§ 1º In the first year of production, for each field, from the first oil date, the SPT will be
calculated according to the following tables:
I – When the production occurs onshore, on lakes, rivers, fluvial or lake islands.
Quarterly production (thousand cubic meters oil equivalent)
Value to be deducted from the quarterly net profit (in BRL)
Rate ( %)
Until 450
0
Higher than 450 until 900 450xNP÷MPV 10
Higher than 900 until 1.350 675xNP÷MPV 20
Higher than 1.350 until 1.800 900x NP÷MPV 30
Higher than 1.800 until 2.250 360÷0,35xNP÷MPV 35
Higher than 2.250 1.181,25xNP÷MPV 40
where:
NP21 – is the quarterly net profit for each field, in BRL;
MPV22 – it is the quarterly measured production volume for each field, in thousand cubic meters
of oil equivalent.
II – When the production occurs on the continental platform in water depth up to 400 meters.
Quarterly production (thousand cubic meters oil equivalent)
Value to be deducted from the quarterly net profit (in BRL)
Rate ( %)
Until 900 - 0
Higher than 900 until 1.350 900xNP÷MPV 10
Higher than 1.350 until 1.800 1.125xNP÷MPV 20
Higher than 1.800 until 2.250 1.350xNP÷MPV 30
Higher than 2.250 until 2.700 517,5÷0,35xNP÷MPV 35
Higher than 2.700 1.631,25xNP÷MPV 40
21 Defined in Decree 2705/98 in article 3o, § VIII 22 Defined in Decree 2705/98 in article 3o, § X

85
III - When the production occurs on the continental platform in water depth higher than to 400 meters.
Quarterly production (thousand cubic meters oil equivalent)
Value to be deducted from the quarterly net profit (in BRL)
Rate ( %)
Until 1.350 - 0
Higher than 1.350 until 1.800 1.350xNP÷MPV 10
Higher than 1.800 until 2.250 1.575xNP÷MPV 20
Higher than 2.250 until 2.700 1.800xNP÷MPV 30
Higher than 2.700 until 3.150 675÷0,35xNP÷MPV 35
Higher than 3.150 2.081,25xNP÷MPV 40
§ 2º On the second year of production, for each field, from the first oil date, the SPT will be calculated according to the following tables:
I - When the production occurs onshore, on lakes, rivers, fluvial or lake islands.
Quarterly production (thousand cubic meters oil equivalent)
Value to be deducted from the quarterly net profit (in BRL)
Rate ( %)
Until 350 - 0
Higher than 350 until 800 350 x NP÷MPV 10
Higher than 800 until 1.250 575xNP÷MPV 20
Higher than 1.250 until 1.700 800xNP÷MPV 30
Higher than 1.700 until 2.150 325÷0,35xNP÷MPV 35
Higher than 2.150 1.081,25xNP÷MPV 40
II - When the production occurs on the continental platform in water depth up to 400 meters.
Quarterly production (thousand cubic meters oil equivalent)
Value to be deducted from the quarterly net profit (in BRL)
Rate ( %)
Until 750 - 0
Higher than 750 until 1.200 750xNP÷MPV 10
Higher than 1.200 until 1.650 975xNP÷MPV 20
Higher than 1.650 until 2.100 1.200xNP÷MPV 30
Higher than 2.100 until 2.550 465÷0,35xNP÷MPV 35
Higher than 2.550 1.481,25xNP÷MPV 40
III - When the production occurs on the continental platform in water depth higher than to 400 meters.

86
Quarterly production (thousand cubic meters oil equivalent)
Value to be deducted from the quarterly net profit (in BRL)
Rate ( %)
Until 1.050 - 0
Higher than 1.050 until 1.500 1.050xNP÷MPV 10
Higher than 1.500 until 1.950 1.275xNP÷MPV 20
Higher than 1.950 until 2.400 1.500xNP÷MPV 30
Higher than 2.400 until 2.850 570÷0,35xNP÷MPV 35
Higher than 2.850 1.781,25xNP÷MPV 40
§ 3º On the third year of production, for each field, from the first oil date, the SPT will be calculated according to the following tables:
I - When the production occurs onshore, on lakes, rivers, fluvial or lake islands.
Quarterly production (thousand cubic meters oil equivalent)
Value to be deducted from the quarterly net profit (in BRL)
Rate ( %)
Until 250 - 0
Higher than 250 until 700 250xRIP÷VPF 10
Higher than 700 until 1.150 475xNP÷MPV 20
Higher than 1.150 until 1.600 700xNP÷MPV 30
Higher than 1.600 until 2.050 290÷0,35xNP÷MPV 35
Higher than 2.050 981,25xNP÷MPV 40
II - When the production occurs on the continental platform in water depth up to 400 meters.
Quarterly production (thousand cubic meters oil equivalent)
Value to be deducted from the quarterly net profit (in BRL)
Rate ( %)
Until 500 - 0
Higher than 500 until 950 500xNP÷MPV 10
Higher than 950 until 1.400 775xNP÷MPV 20
Higher than 1.400 until 1.850 950xNP÷MPV 30
Higher than 1.850 until 2.300 377,5÷0,35xNP÷MPV 35
Higher than 2.300 1.231,25xNP÷MPV 40
III - When the production occurs on the continental platform in water depth higher than to 400 meters.
Quarterly production (thousand cubic meters oil equivalent)
Value to be deducted from the quarterly net profit (in BRL)
Rate ( %)

87
Until 750 - 0
Higher than 750 until 1.200 750xNP÷MPV 10
Higher than 1.200 until 1.650 975xNP÷MPV 20
Higher than 1.650 until 2.100 1.200xNP÷MPV 30
Higher than 2.100 until 2.550 465÷0,35xNP÷MPV 35
Higher than 2.550 1.481,25xNP÷MPV 40
§ 4º After the third year of production, for each field, from the first oil date, the SPT will be calculated according to the following tables:
I - When the production occurs onshore, on lakes, rivers, fluvial or lake islands.
Quarterly production (thousand cubic meters oil equivalent)
Value to be deducted from the quarterly net profit (in BRL)
Rate ( %)
Until 150
0
Higher than 150 until 600 150xNP÷MPV 10
Higher than 600 until 1.050 375xNP÷MPV 20
Higher than 1.050 until 1.500 600xNP÷MPV 30
Higher than 1.500 until 1.950 255÷0,35xNP÷MPV 35
Higher than 1.950 881,25xNP÷MPV 40
II - When the production occurs on the continental platform in water depth up to 400 meters.
Quarterly production (thousand cubic meters oil equivalent)
Value to be deducted from the quarterly net profit (in BRL)
Rate ( %)
Until 300
0
Higher than 300 until 750 300xNP÷MPV 10
Higher than 750 until 1.200 525xNP÷MPV 20
Higher than 1.200 until 1.650 750xNP÷MPV 30
Higher than 1.650 until 2.100 307,5÷0,35xNP÷MPV 35
Higher than 2.100 1.031,25xNP÷MPV 40
III - When the production occurs on the continental platform in water depth higher than to 400 meters.

88
Quarterly production (thousand cubic meters oil equivalent)
Value to be deducted from the quarterly net profit (in BRL)
Rate ( %)
Until 450
0
Higher than 450 until 900 45OxNP÷MPV 10
Higher than 900 until 1.350 675xNP÷MPV 20
Higher than 1.350 until 1.800 900xNP÷MPV 30
Higher than 1.800 until 2.250 360÷0,35xNP÷MPV 35
Higher than 2.250 1.181,25xNP÷MPV 40

89
Annex II – Petroleum Fiscal Regimes Examples
II.1 Indonesia
II.1.1 Regulatory history
Indonesia has a key role when talking about international petroleum fiscal systems as it
is the creator and the first country to use a production sharing contract (TOLMASQUIM,
2011).
Until 1945, Indonesia was a Dutch colony and their oil was produced under a concession
contract with favorable terms by foreign companies (TOLMASQUIM, 2011). When it became
independent the first attempt to reduce the benefits of the companies was to eliminate those
contracts, but the loss of revenue impacted the country making it propose an alternative to
maintain the gains but increasing the government control. Inspired by the system Indonesia had
for the agricultural business, it created the production sharing agreement. Under this new
modality oil and gas were under the State control and could delegated to a State company,
which could hire any company to execute the service on their behalf. On this new system, the
production was shared between the State company and the contractor, usually a foreign
company, the contractor had all the exploratory risks and, in case of success, it could recover
the costs up to a limit, called cost oil. The remaining oil, called profit oil, was divided between
the contractor and the State company according to established rates, and the foreign company
also had the obligation to supply the national market selling part of its profit oil to the state
company under and the price set be government. The initial contracts did not have royalties or
income tax on the contractor share, and the cost oil and profit oil for them were 40% and 35%,
respectively (TOLMASQUIM, 2011). Over the years, the contract terms changed to sometimes
favor the contractors and others to increase the government take, depending on political and
economic scenarios. The current institutional structure of the petroleum industry has separated
the role of the State into an oil company with the same attributions and an international oil
company and an agency with a regulation nature, to oversight of the commercial activities.
The country´s oil production has been declining since 1998, while its consumption is
increasing on a steady rate since 1979 (EIA, 2020b), as figure 31 below indicates. In 2018
Indonesia´s production corresponded to 0.91% of the total world production, while the
consumption was around 1.78% of the global use (EIA, 2020b).

90
Figure 31: Indonesia’ historical oil production and consumption
Source: (EIA, 2020b)
II.1.2 Fiscal regime
The fiscal regime applicable to oil and gas companies consists of production sharing
contracts (PSCs) between contractors and the Indonesian Government, through its
representatives. There is not a single PSC model as many generations of contracts are in place,
the latest terms will be described here.
The general concept of the PSC is that contractors bear all risks and costs of exploration
until production. If production does not proceed, these costs are not recoverable. If production
does proceed, the contractor can receive a share of production to meet its recoverable costs, the
cost oil, which no longer have a fixed rate, being determined by the cost recoverable rules. On
the remaining production the contractor acquires an equity, the profit oil, that is also determined
according to the contract (PWC, 2019) .
The PSC contracts requires a commitment to a minimum exploration program and a
schedule to relinquish part of the areas, when a development plan is approved (PWC, 2019).
Also included are rules to use of local content and development of local personal.
The fiscal system for oil and gas for the PSCs includes the following taxes (ERNST &
YOUNG, 2019; PWC, 2019):
• Bonus: signing, education and production bonus;
0
200
400
600
800
1000
1200
1400
1600
1800
2000
19
73
19
75
19
77
19
79
19
81
19
83
19
85
19
87
19
89
19
91
19
93
19
95
19
97
19
99
20
01
20
03
20
05
20
07
20
09
20
11
20
13
20
15
20
17
tho
usa
nd
bar
rels
per
day
Production Consumption

91
• Corporate income tax (CIT): tax rate depends on the PSC entered into, current
rate is 25%;
• Branch profits tax (BPT): current rate is 20%;
• Production share oil: variable
• Withholding tax: variable
• Investment credit: 17% to 55%, negotiable, this is a recognition of a late recover
of the costs, allowing a certain “interest” on the costs to be recovered.
• First tranche petroleum: before costs are recoverable, every year, the government
and the contractor are allowed to take part of the production, 20% in latest
contracts, which is divided between them according to the equity share.
• Domestic market obligation: after commencement of commercial production
from the contract area, a contractor is required to supply a specific portion of the
crude oil to the domestic market in Indonesia from its equity share. A DMO can
also apply to gas production. The DMO is negotiated for each agreement and
usually ranges from 15% to 25%.
• Indirect Taxes: generally, PSCs are subjected to value added taxes (VAT), import
and withholding taxes, However, there are previsions for exemptions for all of
them under the current legislation.
II.2 Iran
II.2.1 Regulatory history
Iran, on top of being a large producer, is important to the oil industry as the first
concession contract signed in the country in 1901 with William Knox D’Arcy became the
reference for the classical concession contract (TOLMASQUIM, 2011). After going through
some changes in the concession contract over the years, they nationalized the industry in 1951
establishing the association contracts until 1974. At that time, they created the risk service
contracts and in 1995 a pure service contract was then implemented until 2015 when the current
regime was created, called Iranian Petroleum Contract (IPC) (SAHEBONAR; FARD;
FARIMANI, 2016).
The concession contract signed in 1901 had very favorable terms to D’Arcy who got the
rights to prospect, explore, exploit, transport and sell oil in the 1.2 million km2 concession area

92
for 60 years (TOLMASQUIM, 2011). The upfront payment for such rights over 73% of the
country´s territory was 20 thousand pounds (TOLMASQUIM, 2011). Part of the contract also
included 20 thousand pounds in shares in the future company and 16% of the future net profit
as royalty (TOLMASQUIM, 2011).
The first discovery happened in 1908 and the Anglo-Persia Oil Company (APOC) was
created with all D’Arcy’ rights. Lately the British Government acquired 51% of the company,
taking control over it (TOLMASQUIM, 2011). Oil proved to be and strategical resource after
both world wars and the United Kingdom did not have significant production in its territory,
depending largely on imported volumes. Iran, however realized the terms of the contract did
not added value for them, making changes in 1933, although not
significantly(TOLMASQUIM, 2011).
In 1951, the country nationalized its oil industry and created their national oil company
to make, with the foreign companies, an association contract.(TOLMASQUIM, 2011) Under
those terms both companies had fifty per cent of the joint-venture (TOLMASQUIM, 2011).
Iran needed the know-how and capital of the foreign companies to develop the country
resources. In 1960, Iran with Iraq, Kuwait, Saudi Arabia and Venezuela created the
Organization of Petroleum Exporting Countries (OPEP) to strength their position as the
resources owners and increase their gains (TOLMASQUIM, 2011).
After the first oil shock in 1973, Iran created the risk-service contract increasing the
government take, however in 1979, after the Khomeini’s Iranian revolution, and the upcoming
Iran-Iraq 8 years conflict, the law changes forbid foreign investment in the country reducing
the domestic production and investments. In 1995, the country established a pure service
contract, the buy-backs agreements where the foreign companies could return to participate in
the oil industry although under the control of the NIOC. After the American embargo, a new
system was created in 2015 combining terms of production sharing and service contracts,
resulting in a risked service contract (TOLMASQUIM, 2011).
The country´s oil production suffered from the Iranian revolution, the Iran-Iraq war and
the American embargo from 2006 to 2015, but in 2017 the production have increased 3 times
1980´s level, as shown in figure 32 (EIA, 2020b). In 2017, Iran´s production corresponded to
4.48% of the total world production, while the consumption was around 1.84% of the global
use (EIA, 2020b).

93
Figure 32: Iran’s historical oil production and consumption
Source: (EIA, 2020b)
II.2.2 Fiscal regime
The current fiscal regime applicable to oil and gas companies consists of service contracts
(IPCs) based on the prior buy-backs agreements. In this new modality, there is a requirement
to make a joint-venture with the NIOC, where they have 51% of the new company
(SAHEBONAR; FARD; FARIMANI, 2016).
The general concept of the IPC is that the contractor divides the revenues with the
government and from the contractor share it is entitled to recovers the capex, opex, interest of
indirect costs and a remuneration fee. In IPCs, the contractor is present in all of the exploration,
development and production phases, different from the previous buy-backs where the
contractor could only participate in the exploration and development phases. Total petroleum
cost and remuneration fee should be recovered out of the 50% of revenue of crude oil
(SAHEBONAR; FARD; FARIMANI, 2016).
The fiscal system for oil and gas for the IPCs includes the following taxes (ERNST &
YOUNG, 2019; SAHEBONAR; FARD; FARIMANI, 2016).:
• Corporate income tax (CIT): tax rate depends on the type of the company ranging
from 22.5% to 25.0%;
• Contract Social Duties applied on contract work performed in Iran ranging from
7.78% to 16.67%, depending on the use of local suppliers;
0
500
1000
1500
2000
2500
3000
3500
4000
4500
5000
19
73
19
75
19
77
19
79
19
81
19
83
19
85
19
87
19
89
19
91
19
93
19
95
19
97
19
99
20
01
20
03
20
05
20
07
20
09
20
11
20
13
20
15
20
17
tho
usa
nd
bar
rels
per
day
Production Consumption

94
• Withholding tax: 3.75% on any remittance for the upstream industry.
• Custom duties: on all imported goods.
• Incentives: different tax and customs incentives are available, including special
benefits (tax exemptions and tax holidays) provided for various free-trade zones,
special economic areas, and areas designated as underdeveloped
• Indirect Taxes: subjected to value added tax (VAT) of 9% on most taxable goods
and services.
II.3 Norway
II.3.1 Regulatory history
Norway did not have an oil industry until the first big, offshore oil discovery of Ekofisk
field in 1969 (TOLMASQUIM, 2011). After then, the country discussed the best way to retain
the petroleum rent on a level that would be still attractive to the contractors. The key changes
in the industry were related to the level of State participation petroleum activities and
production, and the taxes levied to form the government take.
The discussions resulted in the creation in 1972 of Statoil, a 100% State oil company to
be part of all concession contracts, with at least 50% participation (TOLMASQUIM, 2011).
Norway always had the concession contracts as the petroleum fiscal regime, varying the terms
and rates throughout the time, to balance risk and reward.
In 1996, Norway had to adequate his model to a more open and competitive market to
reduce discrimination of foreign oil companies (TOLMASQUIM, 2011). This requirement was
part of the European Union (EU) rules of membership. The country reduced its participation
on the fields, with no longer obligation to have the State participating in all fields, and Statoil
merged with Norske Hydro in 2006, reducing the Governments’ participation in the company
to 67% (TOLMASQUIM, 2011). At the same time Statoil’s participation on the international
oil and industry increased. In 2018, Statoil changed its name to Equinor, but keeping the same
corporate and strategic structure.
The changes the concession contracts terms went through had the objective to increase
the government take when the technical and commercial conditions were favorable but also to
reduce when oil prices were low (TOLMASQUIM, 2011). After the first oil shock in
1974/1975, a special participation tax (SPT), with a 25% rate, was created applicable to the

95
taxable profit (TOLMASQUIM, 2011). After the second shock, this rate was increased to 35%
and lately reduced to 30% when oil prices were reduced in 1986 (TOLMASQUIM, 2011). At
that same time the royalties were reduced to 0 for new fields (TOLMASQUIM, 2011). In 1992,
another set of changes were implemented due to the participation in the EU with reductions in
the income tax rate and deductions, and further all fields had the same null royalty rate due to
geological challenges (TOLMASQUIM, 2011).
The country´s oil production is significantly higher than the internal consumption,
making the country an oil net exporter (EIA, 2020b). Even with a decline in the production
levels the country remains an important producer with 1.85% of the total world production,
while the consumption was around 0.22% of the global use (EIA, 2020b).
Figure 33: Norway’ historical oil production and consumption
Source: (EIA 2020b)
II.3.2 Fiscal regime
The current fiscal regime applicable to oil and gas companies consists of concession
contracts with a tax- royalty system. Currently, royalties and bonus are not required but income
tax rate and a resource rent tax is required.
The fiscal system for the oil and gas concession contract includes the following taxes
(ERNST & YOUNG, 2019):
• Corporate income tax (CIT): tax rate of 22% applicable on the net operating
profit;
0
500
1000
1500
2000
2500
3000
3500
4000
19
73
19
75
19
77
19
79
19
81
19
83
19
85
19
87
19
89
19
91
19
93
19
95
19
97
19
99
20
01
20
03
20
05
20
07
20
09
20
11
20
13
20
15
20
17
tho
usa
nd
bar
rels
per
day
Production Consumption

96
• Resource rent tax (CIT): tax rate of 56% applicable on the net operating profit;
• Contract Social Duties applied on contract work performed in Iran ranging from
7.78% to 16.67%, depending on the use of local suppliers;
• Withholding tax: might have exemptions depending on international treaties;
• Incentives: losses are carried forward indefinitely with an interest of 0.9%; an
exploration tax loss may be refunded.
• Indirect Taxes: subjected to value added tax (VAT) but the industry is exempted.
• Environmental taxes: CO2 taxes on gas consumed or flared; CO2 tax on imported
gas or LPG, NOx emission fee.
II.4 United States of America
II.4.1 Regulatory history
The United States were the pioneers on the modern oil industry. The first global
discovery, the Drake well, of this time was drilled in Pennsylvania and culminated with an oil
rush and many successful wells drilled at that time. It also drove the creation of the first
refineries in the region and the establishment of the first American oil corporation controlling
the commercial activities in that region(YERGIN, 1991).
Soon, other regions had discoveries, like Texas and California creating. The same
movement to the regions, oil explorers, refineries and oil corporations, with Texas Co23., and
Standard Oil24, being formed at that time.
The country's demand for oil was increasing exponentially largely because of the
expansion of the automobiles powered by petroleum fuels and the industrialization.
After the second war the United States increased even more its dependence on oil,
counting since there on an imported supply, as their companies have secured participation on
the global discoveries, and also on the expansion of the national exploration market moving to
an offshore exploration.
In 2017 USA´s production corresponded to 17.78% of the total world production, while
the consumption was around 20.86% of the global use (EIA, 2020b).
23 Lately called Texaco 24 Lately became Exxon

97
Figure 34: United States’ historical oil production and consumption
Source: (EIA 2020b)
II.4.2 Fiscal regime
The current fiscal regime applicable to oil and gas companies consists of concession
contracts with a tax- royalty system. A severance tax is also required (ERNST & YOUNG,
2019).
The fiscal system for the oil and gas concession contract includes the following taxes
(ERNST & YOUNG, 2019):
• Royalties: Onshore 12.5% to 30%, Offshore 18.75%
• Corporate income tax (CIT): tax rate of 21% applicable on the net operating
profit;
• Severance tax — Severance tax is payable to the US state where the product is
extracted, including onshore and offshore state waters. The tax rates and the tax
base vary by state; for example, states calculate the tax based on a flat amount
per volume produced or as a percentage of gross receipts. Additionally, it is
common for different tax rates to apply for different types of products produced.
• Incentives: exploration expenditure can be immediately deductible for income
tax purposes for independent producers, and 70% is deductible for integrated
producers.
0
5000
10000
15000
20000
25000
19
73
19
75
19
77
19
79
19
81
19
83
19
85
19
87
19
89
19
91
19
93
19
95
19
97
19
99
20
01
20
03
20
05
20
07
20
09
20
11
20
13
20
15
20
17
tho
usa
nd
bar
rels
per
day
Production Consumption

98
Annex III – Results from ANP Pre-Salt Bid Rounds until 2019
Ye
ar
Ro
un
d
Se
dim
en
tary
Ba
sin
Sa
nto
sC
am
po
sC
am
po
sC
am
po
sC
am
po
s
Off
ere
d A
re
as
Lib
ra
Su
do
este
Ta
rta
ru
ga
Ve
rd
e
Su
l d
e
Ga
to d
o
Ma
to
En
torn
o d
e
Sa
pin
ho
á
No
rte
de
Ca
rca
rá
Pa
u B
ra
sil
Pe
ro
ba
Alt
o d
e
Ca
bo
Frio
-
Oe
ste
Alt
o d
e
Ca
bo
Frio
-
Ce
ntr
al
Trê
s
Ma
ria
sU
ira
pu
ru
Ita
imb
e-
zin
ho
Do
is
Irm
ão
sS
atu
rn
oT
itã
Pa
u-
Bra
sil
Su
do
este
Ta
rta
ru
ga
Ve
rd
e
Ata
pu
Bú
zio
sIt
ap
uS
ép
ia
Min
imu
m p
ro
fit
oil
(%
)4
1.6
5%
12
.98
%1
1.5
3%
10
.34
%2
2.0
8%
24
.82
%1
3.8
9%
22
.87
%2
1.3
8%
8.3
2%
22
.18
%7
.07
%1
6.4
3%
17
.54
%9
.53
%2
4.8
2%
10
.01
%2
6.2
3%
23
.24
%1
8.1
5%
27
.88
%
Aw
ard
ed
pro
fit
oil
(%
)4
1.6
5%
No
off
er
11
.53
%8
0.0
0%
67
.12
%N
o o
ffe
r7
6.9
6%
22
.87
%7
5.8
6%
49
.95
%7
5.4
9%
No
off
er
16
.43
%7
0.2
0%
23
.49
%6
3.7
9%
10
.01
%N
o o
ffe
r2
3.2
4%
18
.15
%N
o o
ffe
r
Off
ere
d a
re
a (
km
²)1
,54
88
12
92
14
31
31
,18
41
,07
31
,38
33
,67
48
21
1,2
85
71
11
,41
41
,10
04
53
1,1
84
12
72
29
85
21
47
15
7
Sig
na
ture
Bo
nu
s (
US
$ m
ln)
6,9
52
03
16
39
40
06
27
11
01
57
27
72
50
10
98
55
85
51
37
19
01
7,2
86
44
80
Min
imu
m E
xp
lora
tio
n P
ro
gra
m
(U
S$
mln
)2
83
04
80
48
04
84
84
86
76
70
67
68
68
68
68
00
00
Lo
ca
l C
on
ten
t -
De
ve
lop
me
nt
Ph
ase
55
%6
5.0
%6
0.0
%3
0.0
%3
0.0
%3
0.0
%3
0.0
%3
0.0
%3
0.0
%3
0.0
%3
0.0
%3
0.0
%3
0.0
%3
0.0
%3
0.0
%3
0.0
%3
0.0
%3
0.0
%3
0.0
%3
0.0
%3
0.0
%
Ca
mp
os
Sa
nto
sS
an
tos
Sa
nto
sS
an
tos
Sa
nto
s
20
19
12
34
5T
ra
nsfe
r o
f R
igh
ts
20
13
20
17
20
17
20
18
20
18