Embed Size (px)
Citation preview
The American University in Cairo
School of Business
The Impact of Firms’ Compliance to Shariah on Stock
Price Synchronicity
A Thesis Submitted to The Department of Management
In partial fulfillment of the requirements for
The degree of Master of Science in Finance
By: Aya Mohamed Sharafeldin
Under the supervision of Dr. Neveen Ahmed & Dr. Mohammed Bouaddi
January 2020
2
ABSTRACT
The continuous growth in Islamic finance over the past decades grabbed the
interest of empirical researchers who investigated different aspects of Shariah compliant
firms. In this thesis, we are interested to explore the impact of Shariah compliance on
stock price synchronicity and informativeness. Our rational is that Shariah standard
forced compliant firms to release more firm-specific information compared with
conventional ones and given that Shariah compliant firms are more associated with
information transparency taking into consideration the impact of the Shariah on the
governance of the compliant firms. We claim that these features of Shariah compliant
firms lead to less price synchronicity compared with conventional firms. We use data
from 11 emerging and developed countries for the period of 2000 to 2018. Our findings
suggest that firms’ compliance to Shariah has a significant negative impact on stock price
synchronicity confirming that Shariah compliance decreases the co-movements of the
stocks. The results are consistent with the unique characteristics and the financial ratio
constrains of compliant firms increase the information transparency and accuracy.

3
Contents
Chapter I .......................................................................................................................................... 4
1. INTRODUCTION ........................................................................................................................... 4
Chapter II ......................................................................................................................................... 8
2. LITERATURE REVIEW AND HYPOTHESIS DEVELOPMENT ............................................................ 8
2.1 Shariah versus Non-Shariah compliant firms: ................................................................... 8
2.2 Stock Price Synchronicity: ................................................................................................ 14
Chapter III ...................................................................................................................................... 20
3. DATA AND RESEARCH METHODOLOGY ..................................................................................... 20
3.1 Description of data: ......................................................................................................... 20
3.2 Measuring firms’ compliance to Shariah ......................................................................... 20
3.3 Measuring stock price synchronicity ............................................................................... 22
3.4 Control variables:............................................................................................................. 23
3.5 Descriptive Statistics: ....................................................................................................... 24
3.6 Methodology and Model: ................................................................................................ 29
3.7 Model............................................................................................................................... 29
Chapter IV ...................................................................................................................................... 31
4. RESULTS ..................................................................................................................................... 31
4.1 Model results: ...................................................................................................................... 31
4.2 Sensitivity analysis results: .............................................................................................. 34
Chapter V ....................................................................................................................................... 35
5. Conclusion ................................................................................................................................. 35
References ..................................................................................................................................... 37
Appendix .................................................................................................................................... 37
4
Chapter I
1. INTRODUCTION
The rapid growth of Islamic finance is expected to continue as a result of the
strong economic growth in the countries with Muslim population exceeding 1.6 billion.
Islamic finance is related to firm’s compliant with the Shariah law, principle and rules
(IMF, 2017). Islamic investors are keen to invest in stocks that are committed to Shariah
standards. Firms classified as Shariah, has to meet the pre-determined screening criteria
including but limited to the source of earnings, business activity, along with other
financial indicators Ashraf (2016). Moreover, listed Shariah compliant firms witness
increase in the demand on their equity benefiting from the increase in the Islamic
population Hooy and Ali (2017).
Several studies focused on the religion impact on the financial and economic
performance by comparing the Shariah compliant firms with non-Shariah compliant
firms. Firms committed to Shariah are not necessary enforced to blindly apply Islamic
rules. Yet, they are more likely to deeply understand the vision of Islamic religion in
terms of business activities Sergius and Savas (2014). Being committed to Islamic rules
means that firms should give more attention to benefit the society not only focusing on
maximizing shareholders wealth in order to be aligned with the Islamic believes that
focus on the redistribution of wealth to insure better economic society Uddin (2003).
5
Many studies investigated the impact of the religion and cultural believes on
committed firms. Some studies documented that firms’ compliance to Shariah affected
their stock price informativness. Naz et al (2017) documented that Shariah compliant
firms have different financials structure compared with conventional one which might
improve the reflection of releasing firm specific information on the firms’ stock price.
Furthermore, more studies outlined the effect of the Shariah compliance on the
accuracy of released information. Shariah compliant firms are more likely to record
irregularity when reporting firm-specific information to external investors McGuire,
Omar, and Sharp (2012). Moreover, pervious literature provided evidences that firms
seeking compliance to Shariah tend to give more attention to avoid reporting asymmetric
information taking into consideration financial reporting ethical standard imposed by
Shari’ah law Sulaiman (2001).
Previous literatures introduced estimates for stock price synchronicity.
Researchers divided the available information into two aspects into firm-specific
information and market information. Firm-specific information represents the
information released by firm’s insiders to outsider investors. The financial performance
of the firm should reflect the released firm-specific information while the market
information affects the performance of all the stocks in the market. Yet, the reflection of
this information varies across different stocks Morck, et al (2000) Chan and Hameed
(2006). Thus, we investigate our hypothesis that Shariah compliant firms are forced to
release more firm-specific information to be aligned with Shariah standard by testing the
6
effect of Shariah compliance on the co-movements of the stocks in different stock
markets.
Therefore, we are interested to investigate the relationship between the Shariah
compliance, and price co-movement taking into account the amount of information
released by compliant firms. Hence, in this thesis, we use stock price synchronicity as a
measurement of the amount and accuracy of firms’ released information in different
financial markets. Consequently, the aim of this thesis it to study the impact of Shariah
compliance and stock price synchronicity given the Shariah standards which encourage
compliant firms to be more transparent in terms of releasing firm-specific information
compared to conventional ones Pepis and De Jong (2018). In addition, we believed that
the financial ratios constrains imposed on Shariah compliant firms affect the availability
of firms’ specific-information to public investors which would impact the co-movements
of the compliant firms.
We use panel data to estimate the link between Shariah compliance and stock
price synchronicity. We apply panel least squares regression with period fixed effect for
our data sample that includes 11 emerging and developed countries for the period of
2000-2018. We found that Shariah compliance causes lower stock price synchronicity
confirming our hypothesis and supporting the evidence provided in previous literature. In
addition, our findings support our expectation that Shariah compliance has positive effect
on firm’s information disclosure and increase firm’s information transparency.
Our thesis contributes to the literature as to the best of our knowledge no previous
papers investigated the effect of Shariah compliance on stock price synchronicity.
Accordingly, we are the first to provide empirical evidence that reports the significant

7
negative relationship between Shariah compliance and stock price synchronicity in
different stock markets.
This thesis proceeds as follows. In the next section, we review the previous
literature on Shariah compliance in section 2.1 and stock price synchronicity in section
2.2. In section 3, we discuss our data and research methodology. In section 4, we show
our results. Finally, section 5, provides concluding remarks.

8
Chapter II
2. LITERATURE REVIEW AND HYPOTHESIS
DEVELOPMENT
In this section, we review the literature on Shariah versus non-Shariah compliant
firms and stock price synchronicity. To our knowledge no previous study examined the
relation between Shariah compliance and stock price synchronicity. Yet, researchers were
interested in evaluating the performance and the characteristics of the Shariah compliant
firms versus Non-Shariah compliant firms with no consensus in their results as discussed
in more details below.
In section 2.1, we review literature on Shariah compliant firms versus non-Shariah
compliant firms while in section 2.2, we review literature on stock price synchronicity.
2.1 Shariah versus Non-Shariah compliant firms:
As a result of the continuous increase of the Islamic finance, the Shariah
compliance became an area of interest for researches. Shariah compliant firms are
distinguished form conventional firms by their business activities that should be within
the allowed (halal) according to Shariah standards. In addition firms have to be aligned in
their financial structure with the permitted level of debts, cash, and receivables declared
by the Shariah law. Previous studies introduced several classification methods for firms
to be defined as Shariah compliant firm versus non -Shariah compliant firm.
Previous studies compared the financial performance of Shariah versus non-
Shariah compliant firms. Mixed findings were found in literature with no fated
conclusion on Shariah or non-Shariah firms’ outperformance. A recent study by Masih,
9
Kamil, and Bacha (2018) concluded that the existing literature on the Islamic stocks is
not sufficient to give empirical results about the performance of the Islamic indices
against the conventional indices. Hence, we hope that this thesis contributes to the
existing literature by shedding the light on the co-movement of the Islamic stocks.
Several financial and Islamic institutions introduced Shariah screening standards
with minor variation among them such as Morgan Stanley Capital International (MSCI),
Financial Times Stock Exchange (FTSE), and Accounting and Auditing Organization for
Islamic Financial Institutions (AAOIFI), and Dow Jones. Ashraf and Khawaja (2016)
studied the difference in performance of different Shariah compliant firms’ portfolios that
were constructed using different screening methodologies of Shariah for a sample of data
from Canada, Europe, GCC, and Japan for the period of 2003 to 2013. They constructed
a model using Sharp (1964) and Lintner (1965) in their portfolio’s evaluation. They
found that Shariah screening methodologies have insignificant impact on the return of the
portfolios since the source of Qiyas used is almost the same for all them. Hence, the
similarity of the results for different portfolios is reasonable. In our research we refer to
the Dow Jones S&P Indices methodology for 2019 to conduct the Shariah screening
process.
Another study measured the effect of the degree of compliant of the Shariah on the
volatility using data from MENA region for the period of 2003 to 2013. Ahmed and
Farooq (2017) examined the volatility of the Shariah index against conventional index
using Component GARECH model. They added further classification approach to the
Shariah compliance by classifying the degree of compliant to Shariah to most compliant
and least compliant in order to construct two portfolios with different degree of
10
compliance to be compared with the conventional portfolio. They documented that the
degree of the compliance to Shariah affected the volatility. Moreover, they found that the
Shariah compliant portfolio outperformed the conventional one. Their results attributed to
better information environments associated with Shariah compliant firms that may reduce
volatility given the characteristics of compliant firms.
Supporting previous results, Pepis and De Jong (2018) investigated the Shariah
compliance effect on the long-run financial performance by comparing the long-run
financial performance and the stock return of the fully Shariah compliant firms with
several control groups in two different time periods from 1990 and 2018 using the return
of assets (ROA) and return on sales (ROE). They found that the long-run financial
performance of the fully Shariah compliant firms outperformed the non-Shariah
compliant firms. They added that aspects of Islamic faith encouraged culture of
transparency and accountability which would enhance the financial health of the Shariah
compliant firms and improve their financial performance over the long run.
In contrast with these findings, other scholars found that Shariah compliance leads
to underperformance. Farooq and Alahkam (2016) examined the difference in financial
performance between non-financial Shariah compliant firm’s and non-financial
conventional firms in MENA region using ordinary least square (OLS) regression. They
used market adjusted returns as a measurement for their analysis during the period of
2005 and 2009. They found that the non-financial Shariah compliant firms significantly
underperformed the non-financial conventional firms in both civil and common law
countries. They concluded that the underperformance of the Shariah compliant firms was
due to the ratio constrains imposed on compliant firms. They concluded that Shariah
11
compliant firms’ relatively low debt ratio may reflect less strict mechanism that would
impact their performance negatively. In addition, they documented that Shariah
compliant firms had relatively less cash and receivables compared to counterparty which
negatively affected their business connections and network along with funding large
capital expenditure.
Other studies indicates that there is no significant difference in performance of
Shariah and non-Shariah compliant firms Albaity and Ahmad (2011), Setiawan and
Oktariza (2013).
Furthermore, additional characteristics of Shariah compliant firms are proved to
have an impact on their financial performance. For instance, the degree of Shariah
compliant firms’ commitment to the environmental, social and governance triggered the
interest of researchers interested in Islamic finance. In addition, Social, culture
responsibility considered substantial for Shariah compliant firms in order to balance the
earnings with Shariah standard and to improve their contribution to benefit the economy
Said et al (2018) as external financial institutions and Islamic investors are more likely to
give higher attention to Shariah compliant firms to ensure that their businesses are
aligned with the aspects of Shariah standard with higher ethical manner.
Erragragui and Revelli (2016) designed an experimental portfolio consists of 238
U.S listed companies from 2007 to 2011. They used environmental, social, and
governance (ESG) screenings and socially responsible investments (SRI) to examine the
effect of integrating the Shariah rules on compliant firms which are also committed to
ESG and SRI to investigate whether socially responsible Shariah firm portfolio differ in
terms of performance from other Shariah compliant firm with less ESG scores. Using
12
single-factor model provided by Jensen’s, they found that higher ESG Shariah compliant
firms outperformed lower ESG Shariah compliant firms. Also, they used other models,
the four-factor models by Fama and French and robust industry-adjusted seven-factor
model, to support their findings. The results confirmed the outperformance of the Shariah
portfolios with more engagement in corporate governance compared to their
counterparty. However, they concluded that the outperformance of the ESG Shariah
portfolio hold only for governance engagement so that higher governance, products,
diversity, and environmental issues in Shariah firms leaded to better financial
performance. On the other hand, their results reported lower performance Shariah firms
committed to SRI compared to non-committed Shariah firm to SRI. They concluded that
their findings attributed to the difference in the methodology of calculating the ESG and
SRI screening process and scoring dimensions.
The positive impact of the governance for Shariah compliant firms were also
provided by Ali and Al-Owaihan (2008). They conducted a critical review on the ethics
of Islamic finance. They found that Islamic principles encouraged justice, hardworking,
and community commitments which helped the society to improve the economic
progress. In addition, they concluded that Shariah compliance put restriction on
committed firms to give more attention to ethical standard in business activity, financial
reporting, efforts, competition, and transparency.
Adding to that, a research conducted by Azam, Khalid, and Zia (2019) to investigate
the impact of board diversity on corporate social responsibility (CSR) and the interaction
effect of firm’s compliance to Shariah with religious and ethical principles. They used
data of 65 firms listed in Pakistan Stock market exchange (PSX) from 2012 to 2018 using
13
hierarchical moderated regression analysis to determine the moderating effect of the
Shariah compliance on the CSR. Their study found a high level of Shariah compliance
along with educational background and gender diversity significantly promoted the CSR
activities of the compliant firms.
Other studies enhancing the previous findings were documented by McGuire, Omar,
and Sharp (2012). They studied the impact of religion on financial reporting
irregularities. They used a database of over 610,000 interviews conducted nationwide by
the Gallup organization during 2008 and 2009 using factor analysis. Their results
suggested that religiosity appears to act as a mechanism for monitoring corporate
financial reporting behaviors. They investigated the impact of religious and social norms
in case of the availability of external monitoring such as debt holders and institutional
investors. They evidenced that religious influence is concentrated in more religious firms
especially when external monitoring is low in such firms. They also concluded that
financial reporting irregularities were affected by the religious attitudes of the population
surrounding corporate headquarters which indicate that local levels of religiosity
influence firms in a way that affected shareholder value and made religious people less
likely to see financial reporting manipulation as an acceptable behavior. Similarly, Hamdi
and Zarai (2013) found that firms operating with Islamic financial aspects are less likely
to be engaged in earning manipulation considering Islamic aspects to be monitoring tool
that improved the quality of reported earnings. In addition, they added that Islamic
behaviors encouraged managers to avoid behaviors that might violate Islamic standard
and ethics.
14
However, opposing results were documented by Alsaadi, Ebrahim, and Jaafar
(2016). They compared the Shariah compliance against Social Corporate responsibility
(CSR) with the earning quality. They used date sample comprises firms in ten European
Union countries for the period from 2003 to 2013 using cross sectional approach. They
found that firms engaged in CSR are less likely to manipulate earnings while being a
Shariah compliant firm does not play in important role in influencing ethical conduct of
firms. They concluded that being a part of Shariah index does not necessary mean that the
firm is adhere to ethical codes. They suggested that their findings attributed to the
Shariah screening process that only relies on the commitment of a firm to specific ratios
to be classified as Shariah rather being influenced by the religious aspects.
However, the financial ratios associated with firm’s classification as Shariah
(Debt ratio, cash ratio, and receivables ratio) were proven to have a strong impact on
firms’ information releasing. Richardson et al (2001) found that firms with no debts are
less likely to be engaged in earnings manipulation. In addition, other scholars
documented that firms with high accounting receivables and cash are more likely to have
less earnings quality Marquardt and Wiedman (2004) and Chung et al (2005).
Accordingly, in our thesis, we believe that the Shariah compliance has a positive
effect on firms’ transparency and releasing information. Hence, we test the hypothesis
that Shariah compliant firms exhibit lower price synchronicity than conventional firms.
2.2 Stock Price Synchronicity:
Theory of efficient market hypothesis declared that the changes in the stock prices
reflect all the available information (Fama, 1970) which makes the understanding of how
stock prices commove of the stocks an important area to be studied as part of the market
efficiency and allocation of the resources. In this thesis we refer to the co-movement of
15
the stocks by measuring stock price synchronicity. This grabbed the interest of many
scholars such as Roll (1988), Morck et al (2000) who measured the co-movement of the
stocks together in the same direction for a given period due to market-information and
firm-specific information Tang et al (2011). Many researchers referred to the findings
released by Roll (1988) and Morck et (2000) who proposed a simple regression equation
in which firms return is the depended variable while the market return is the independent
variable in order to report the 𝑅2 of this equation that measures how much of firms’
return is explained by market return. The recorded 𝑅2 represents the measurement of the
stock price synchronicity. High 𝑅2 indicates that firm’s return is more affected by the
market return while low 𝑅2 indicates that firm’s return is more affected by firm-specific
information which reflect high level of the stock’s price informativeness.
Previous studies investigated the relationship between stock price synchronicity
and different financial aspects such as gross domestic products (GDP) per capita,
earnings quality, and quality of information environment to find out the reason behind the
co-movement of the stock in certain market. However, another important aspect that was
not given as much attention is the culture differences among different stocks. Scholars
focused on other factors that affected stock price synchronicity such as corporate
governance, social and culture responsibility (CSR). In this section, we conduct a
literature review to investigate the different aspects that affected stock price
synchronicity in order to find the link between the Shariah compliance characteristics and
the co-movement of the committed firms.
16
A research conducted by Rao and Zhou (2018) examined the role of stock price
synchronicity on the return-sentiment relation. They collected data of 937 common stocks
in Shanghai stock exchange for the time period between 2006 and 2015 to construct a
model using the EGARCH model. Their empirical results showed that the return-
sentiment relation is positive and significant in different portfolios. In addition, they
concluded that the impact of individual stock investor sentiment on stock prices decreases
in stocks with stock price synchronicity. Their results confirmed that the role of
individual stock investor sentiment decreases among stocks with good information
environment with more firm-specific information impact than market specific
information.
Another study by Farooq, Ahmed, and Bouaddi (2018) examined the effect of the
stock price synchronicity on stock market volatility in MENA between 2005 and 2010
region. They documented that in regimes characterized by low volatilities, stock price
synchronicity is considered a better prediction. The reason behind their findings is that
their studies were conducted on stocks of conventional firms in emerging markets.
Other studies examine the cultural difference impact on the firms ‘stock
informativeness. Hermes and Emanuels (2015) studied the relationship between culture
and voluntary disclosure by specifically focusing on the voluntary disclosure of
information on internal financial controls. They used regression analysis for collected
panel data sample of 4,370 firm-year observations in 29 countries during the period of
2005 to 2007. They found that differences in observed corporate governance practices,
such as the disclosure of information on internal controls, were influenced by cultural
differences. Hence, stock prices of firms that had higher corporate governance and
17
associated with releasing firm-specific information to public investors were less likely to
record stock price synchronicity.
Another study investigated the effect of the culture differences on 𝑅2 conducted by
Eun, Wang, and Xiao (2015). They studied the impact of the culture on stock price
synchronicity in 47 countries from 1990 to 2010 using 𝑅2 as a measure for the co-
movement of the stocks understudy. They found that culture had a significant influence
on stock price synchronicity through affecting investors’ trading activities and a
country’s information environment.
Similar results were concluded by Morck et al (2000). They investigated the
reason behind the existing of stock price synchronicity in emerging markets using data
for 15,920 firms from 40 countries. They found that firms reporting higher synchronicity
were generally from the countries with poor investors’ property rights protection,
relatively low per capita gross domestic product, less developed equity markets, less
developed financial systems, and weaker legal regimes, which ideated that the differences
in the cultures, environment, and external economic factors affected stock price
synchronicity.
Adding to the previous findings, Jin and Myers (2006) provided evidence that
poor investor protection was not the only rational behind the increase in 𝑅2. They used a
sample of more than 40 stock markets from 1990 to 2001 for regression model. They
documented a positive relation between country-average 𝑅2 and several measures of
opaqueness supporting the argument that stock price synchronicity is affected by the level
of transparency, firm-specific information provided to outsider investors.
18
Other scholars shed the light on the impact of the social trust on the co-movement
of stock prices. Qiu, Yu, and Zhang (2019) investigated the effect of social trust on stock
price synchronicity using a large sample of data of Chinese listed companies excluding
financial companies and companies without unavailable information needed between
2006 and 2015. Applying a baseline regression model, they found that social trust had a
significantly positive effect on the amount of firm-specific information that affected stock
price synchronicity. They added that firms located in high social trust markets were more
likely to have smaller price crash risk and opportunistic behaviors. Their findings was
attributed to giving attention to emerging stock markets differentiated by weak formal
institutions yet more diverse culture that enhanced the importance of culture role on
firm’s financial performance.
Accordingly, we developed our hypothesis based on the following: as Shariah
compliant firms are more committed to ethical standard given the influence of the Islamic
culture that impacts the financial performance, information transparency, and releasing
information. Shariah firms should provide more firm-specific information compared to
non-Shariah compliant firms. On the other hand, we found that Stock price synchronicity
is affected by the culture differences of stocks in different markets in addition to the
amount and the accuracy of the firm-specific information compared to market
information. Therefore, we try to shed new light on the impact of Shariah compliance on
stock price synchronicity of the stocks by comparing the co-movement of the Shariah
compliant firms against Non-Shariah compliant firms. We expect that Shariah stock
prices should be more affected by firm’s specific information rather than market
information, the co-movement of Shariah compliant firms is unexpected. Consequently,

19
stock price synchronicity should be negatively impacted by firms’ compliance to Shariah
given Shariah compliant firms’ characteristics. Accordingly, we develop our hypothesis
as follows:
𝐻1: Shari’ah compliance has a negative impact on stock price synchronicity.
20
Chapter III
3. DATA AND RESEARCH METHODOLOGY
In this chapter, we describe the data used, the source of the data including countries,
number of observations in addition to the methodology used for our analysis to determine
the effect of Shariah compliance on stock price synchronicity. Also, we discuss the
control variables extracted from our research in literature. Section 3.1 includes
description of the data sample and source of data, section 3.2 includes the methodology
used for measuring the Shariah compliance, section 3.3 includes Stock price
synchronicity measurements, and section 3.4 includes the selected control variables from
previous literature, and 3.5 includes the descriptive statistics analysis, section 3.6
discusses the methodology used for determining the link between Shariah compliance
and stock price synchronicity given the selected control variables, and section 3.7
includes our model.
3.1 Description of data:
Our data sample includes 11 emerging and developed countries: Australia, China,
Hong Kong, India, United Kingdom, Ireland, Netherlands, Japan, Russia, Singapore, and
Germany for the period January 2000 to December 2018 obtained from DATASTREEM.
We ended up with a sample consists of 124,031 observations.
3.2 Measuring firms’ compliance to Shariah
In order to classify the firms’ observation to Shariah compliance firm or non-
Shariah compliant firm, we use the screening methods introduced by Dow Jones (2019).

21
First, The sector-based screening. We eliminate firms with a core business that is not
aligned with the accepted sectors according to Shariah standard. We eliminate firms that
operate in industries such as alcoholic drinks pork production, tobacco, pornography,
conventional insurance, conventional banking, and financial institutions or any other
activities that are not permissible. The following screening step is the quantitative
screening. Firms passed the first screening process are tested for being committed to the
Shariah financial ratios standard represented in three ratios Debt Ratio along with Cash
Compliance ratios which is related to Shariah rules of holding cash estimated using two
ratios Cash Ratio and Receivable ratio. To calculate the aforementioned ratios for each
firm we use the following formulas:
1) Debts ratio: leverage compliance represented in debt ratio that has to be less than
33% for a firm to be classified as Shariah compliant otherwise Non-Shariah
compliant calculated with the following formula:
1𝐷𝑒𝑏𝑡
2𝑀𝑎𝑟𝑘𝑒𝑡 𝑉𝑎𝑙𝑢𝑒 𝑜𝑓 𝐸𝑞𝑢𝑖𝑡𝑦
2) Cash Ratio: has to be less than 33% for a firm to be classified as Shariah
compliant otherwise Non-Shariah compliant calculated with the following
formula:
1 represents all interest bearing and capitalized lease obligations. It is the sum of long- and short-term debt. 2 Market value of equity is calculated used the market capitalization for the last 36 trailing months

22
3𝐶𝑎𝑠ℎ 𝑎𝑛𝑑 𝐼𝑛𝑡𝑒𝑟𝑒𝑠𝑡 𝐵𝑒𝑎𝑟𝑖𝑛𝑔 𝑆𝑒𝑐𝑢𝑟𝑖𝑡𝑖𝑒𝑠
𝑀𝑎𝑟𝑘𝑒𝑡 𝑉𝑎𝑙𝑢𝑒 𝑜𝑓 𝐸𝑞𝑢𝑖𝑡𝑦
3) Receivable Ratio: has to be less than 49% for a firm to be classified as Shariah
compliant otherwise Non-Shariah compliant calculated with the following
formula:
4𝐴𝑐𝑐𝑜𝑢𝑛𝑡 𝑅𝑒𝑐𝑒𝑖𝑣𝑎𝑏𝑙𝑒𝑠
𝑀𝑎𝑟𝑘𝑒𝑡 𝑉𝑎𝑙𝑢𝑒 𝑜𝑓 𝐸𝑞𝑢𝑖𝑡𝑦
3.3 Measuring stock price synchronicity
For the Measurement of stock price synchronicity, we follow the methodology
proposed by Roll (1998) and Morck et al. (2000). We obtain the daily stock returns for all
the firms including in our data. Further, we obtain the index daily returns for all the
countries included in our data sample. We run the following simple regression equation
in which the dependent variable is the firm’s return and the independent variables is the
index return. We report the 𝑅2 for each firm’s equation in our sample in order to find out
how much of firm’s return is explained by market return. :
𝑅𝑖,𝑡 = 𝛽0 + 𝛽1𝑅𝑚,𝑡 + 𝜀𝑡
Where 𝑅𝑖,𝑡 represents stock 𝑖 daily return in time 𝑡. 𝑅𝑚,𝑡 is market index return at time 𝑡.
We observe the recorded 𝑅2 out of the model in order to estimate the percent of variation
of the daily return of stock 𝑖 explained by the market return 𝑅𝑚,𝑡. A higher 𝑅2 signalizes
3 Cash: represents money available for use in the normal operations of the company. It is the most liquid of all the company's assets. It includes but is not restricted to marketable securities and cash equivalents 4 Account Receivables represents the amounts due to the company resulting from the sale of goods and services on credit to customers (after applicable reserves). These assets should reasonably be expected to be collected within a year or within the normal operating cycle of a business.
23
a high degree of stock price synchronicity which indicates that stock prices frequently
move together in this stock market.
However, 𝑅2 is unsuitable as dependent variable in regression because its values are
bounded with the intervals [0, 1]. Therefore, we adopt a standard economic remedy and
apply logistic transformation to resulted 𝑅2 values following Roll (1998) and Morck et al.
(2000), as follows:
𝑆𝑌𝑁𝐶𝑖,𝑡 = ln (𝑅2
1 − 𝑅2)
High 𝑆𝑌𝑁𝐶𝑖,𝑡 values indicate individual stock returns strongly co-move with market
returns reflecting relatively less firm specific information while low values of 𝑆𝑌𝑁𝐶𝑖,𝑡
indicate individual stock returns weakly co-move with market returns reflecting relatively
more firm-specific information.
3.4 Control variables:
We use control variables that affect stock price synchronicity following the previous
studies. We add firm’s size 𝑆𝑖𝑧𝑒𝑖,𝑡. Larger firms with more diverse operations are
believed to release more information compared to smaller firms kaife, Gassen, and
LaFond (2006) and Hutton et al (2009). We add assets growth rate as firms with higher
assets growth rate are believed to have lower returns with stronger effect in emerged
countries (more informationally efficient) than emerging countries Watanabe et al (2012).
We control for the capital expenditure as companies that have higher intention to expand
should be more transparent in terms of releasing information on order to attract more
investors and ease finding financing resource Jin and Myers (2006). Moreover, we use
the dividends payout ratio as firms associated with higher level of information
asymmetries are more likely to have higher dividends payout ratio to develop their
24
reputation Farouq and ELbannan (2019). We add the earnings per share to capture the
impact of the firm’s profitability. other control variables are added motivated by Hutton
et al. (2009) and Jin and Myers (2006) such as the skewness and Kurtosis. The skewness
of firm-specific daily return is the measure of asymmetry of the distribution of the series
around its mean. The skewness of a firm was found to have inverse relation with
𝑅2 measured by the following equation:
SKEWi,t = 1
𝑁 ∑𝑖=1
𝑁 (𝑦𝑖−�⃑�
�̂�)
3
In addition, we add kurtoses of firm-specific daily return which measures the peakedness
flatness of the distribution of the series believing that high kurtosis would cause lower 𝑅2
measured by the following equation:
𝐾𝑈𝑅𝑇𝑖,𝑡 = 1
𝑁 ∑𝑖=1
𝑁 (𝑦𝑖−�⃑�
�̂�)
4
3.5 Descriptive Statistics:
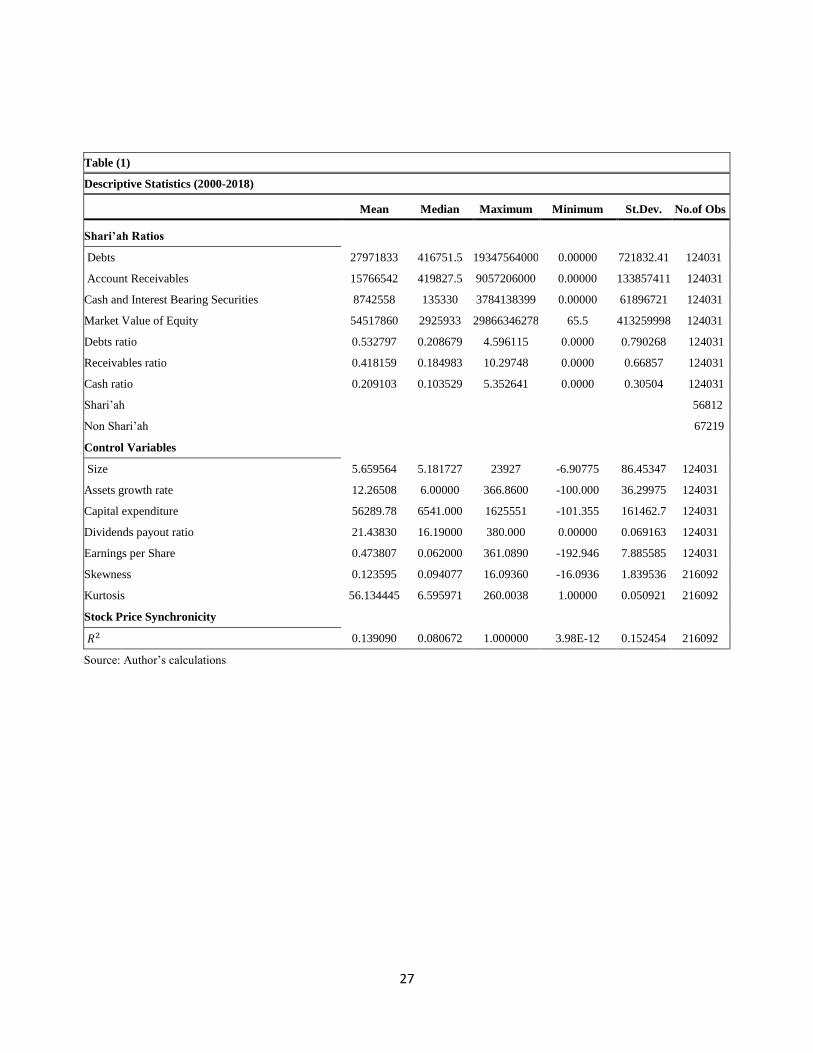
Table (1) and table (2) represent the descriptive statistics and the correlation
matrix for the depended variable, the main variable of interest, and other firm specific
control variables added from literature. Starting with the ratios calculated to determine
the firms’ compliance to Shariah against Non-Shariah compliance represented in Debts
ratio, receivables ratio, and cash ratio recoding a mean of 53%, 41%, and 20%
respectively noting that the mean of debt ratio exceeds the Shariah compliance standard
while the mean of receivables ratio and cash ratio are within the Shariah ratio ceiling.
Worth mentioning that our data sample contains 124,031 observations out of which
56,812 observation are Shariah compliant firms while 67, 219 observations are non-
Shariah compliant firms.
25
We calculated the descriptive for control variables. The firms’ size record a mean
of 5.66 and standard deviation of 86.45. Capital expenditure records a mean of 56289.78
and a standard deviation of 161462 while earning per share records 0.473807 and
standard deviation of 8,885585. These attributes to the variation in our data sample in
terms of countries and years. On the other hand, assets growth rate records a mean of
12.27% and standard deviation of 36.30 while dividends payout ratio records a mean of
21.43% and standard deviation of 6% due to the difference in firms’ payout ratios noting
that the minimum recorded 0% and the maximum recorded 380%.
Finally, we added descriptive statistics for the values of the 𝑅2 used to measure
the stock price synchronicity for each firm of our data sample. The mean is 13% and the
maximum is 100% which means that some firms of our data sample moved exactly in the
same direction with the market while the minimum was 3.98E-12 which reflected that
some firms’ movements are not affected by the market.
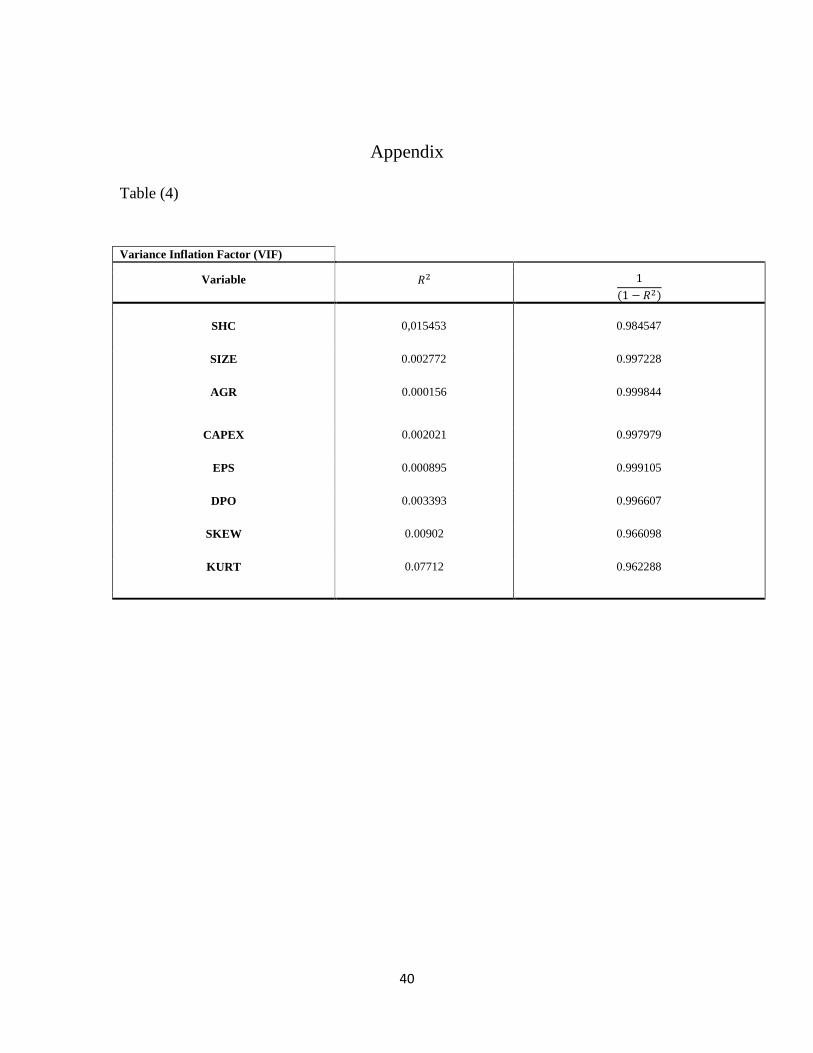
We run Variance Inflation factor (VIF) test that measure the multicollinearity among the
independent variables in a multiple regression model. The results5 show that there is no
multicollinearity recorded among our variables the variables.
The correlation matrix for all the variables used in our regression is shown below
in table (2). The results show that all the variables except the kurtosis are positively
correlated with stock price synchronicity. Whereas Shariah showed is positively
5 The results of the VIF is shown in table (4)

26
correlated with firm’s size, assets growth rate, dividends payout ratio, and skewness
which means that these variables are positively correlated with Shariah while negatively
correlated with the rest of the variables recorded. Firm’s size is positively correlated with
all the variables expect for the kurtosis. As for the assets growth rate, the ratio is
positively correlated with all variables except for dividends payout ratio and kurtosis that
are negatively correlated with growth rate. The capital expenditure is positively
correlated with all variables expect Shariah and kurtosis. While dividends payout ratio is
positively correlated with all variables except kurtosis and assets growth rate. Earnings
per share is positively correlated with all variables except for kurtosis and Shariah.
Finally, skewness is positively correlated with synchronicity, yet other variables
are negatively correlated. Finally, the kurtosis is negatively correlated with all variables.
27
Table (1)
Descriptive Statistics (2000-2018)
Mean Median Maximum Minimum St.Dev. No.of Obs
Shari’ah Ratios
Debts 27971833 416751.5 19347564000 0.00000 721832.41 124031
Account Receivables 15766542 419827.5 9057206000 0.00000 133857411 124031
Cash and Interest Bearing Securities 8742558 135330 3784138399 0.00000 61896721 124031
Market Value of Equity 54517860 2925933 29866346278 65.5 413259998 124031
Debts ratio 0.532797 0.208679 4.596115 0.0000 0.790268 124031
Receivables ratio 0.418159 0.184983 10.29748 0.0000 0.66857 124031
Cash ratio 0.209103 0.103529 5.352641 0.0000 0.30504 124031
Shari’ah 56812
Non Shari’ah 67219
Control Variables
Size 5.659564 5.181727 23927 -6.90775 86.45347 124031
Assets growth rate 12.26508 6.00000 366.8600 -100.000 36.29975 124031
Capital expenditure 56289.78 6541.000 1625551 -101.355 161462.7 124031
Dividends payout ratio 21.43830 16.19000 380.000 0.00000 0.069163 124031
Earnings per Share 0.473807 0.062000 361.0890 -192.946 7.885585 124031
Skewness 0.123595 0.094077 16.09360 -16.0936 1.839536 216092
Kurtosis 56.134445 6.595971 260.0038 1.00000 0.050921 216092
Stock Price Synchronicity
𝑅2 0.139090 0.080672 1.000000 3.98E-12 0.152454 216092
Source: Author’s calculations
28
The following table represented the correlation matrix of all the variables used regression
Table (2)
Correlation Matrix
Corr. SYNC SHC SIZE AGR CAPEX DPO EPS SKEW KURT
SYNC 1.0000
SHC 0.2015 1.0000
SIZE 0.0423 0.0109 1.0000
AGR 0.0309 0.0388 0.0047 1.0000
CAPEX 0.4961 -0.0387 0.0377 0.0166 1.0000
DPO 0.2199 0.0256 0.0113 -0.0191 0.1117 1.0000
EPS 0.0662 -0.0184 0.0012 0.0214 0.0561 0.1166 1.0000
SKEW 0.3704 0.1056 0.0209 0.0309 0.1072 0.1312 0.0362 1.0000
KURT -0.2009 -0.0651 -0.0135 -0.0197 -0.0494 -0.0825 -0.0244 -0.0608 1.0000
Source: Author’s calculations
29
3.6 Methodology and Model:
Our hypothesis is developed to investigate the link between firms’ compliance to
Shariah standard and stock price synchronicity. We use least squares multiple
regression model for the analysis of our panel data that included 11 countries out of
which are 9 emerged countries and 2 are developed countries. First, we run Hausman
test to determine the model used for our regression the results recommend fixed effect
model. We run Lagrange Multiplier test for fixed effect. We find that individual
effect is insignificant while the time effect is significant. We use period fixed effect
since our data contains categories that we want to control for their characteristics that
might affect our dependent variable.
3.7 Model
In this section, we discuss the model applied along with a brief description of the
variables used to recognize the effect of the Shariah compliance on the co-movement
of the stocks represented in the stock price synchronicity. We use least squares
regression with period fixed effects to investigate the significance of the main
independent variable of interest which is the Shariah compliance on our dependent
variable which is the stock price synchronicity. We include firm specific control
variables borrowed from literature to control for their effect on stock price
synchronicity. The used control variables are firm’s size, assets growth rate, capital
expenditure, dividends payout ratio, earnings per share, skewness, and kurtosis. In
addition, we do sensitivity analysis for our model to test the impact of each control
variables along and the main variable of interest on our dependent variable.
30
The following multiple equations represent our main regression model to test
whether Shariah Compliance has an impact on stock price synchronicity by including
a dummy variable for Shariah. The value of one represents Shariah compliant firm
otherwise the value is zero.
𝑆𝑌𝑁𝐶𝑖,𝑡 = 𝛽0 + 𝛽1𝑆𝐻𝐶 + 𝛽2𝑆𝐼𝑍𝐸𝑖,𝑡 + 𝛽3𝐴𝐺𝑅𝑖,𝑡 + 𝛽4𝐶𝐴𝑃𝐸𝑋𝑖,𝑡
+ 𝛽5𝐷𝑃𝑂𝑖,𝑡 + 𝛽6𝐸𝑃𝑆𝑖,𝑡 + 𝛽4 𝑆𝐾𝐸𝑊𝑖,𝑡 + 𝛽5𝐾𝑈𝑅𝑇𝑖,𝑡 + 𝜀𝑖,𝑡
- 𝑆𝐻𝐶, Measures Shariah compliance, we used a dummy variable. The Shariah
compliant firms are equal to 1, Non-Shariah compliant firms’ equal to 0.
- 𝑆𝑖𝑧𝑒𝑖,𝑡 is the natural log of the firm's market value of equity at the end of the
fiscal year.
- 6𝐴𝐺𝑅𝑖,𝑡 is firm’s assets growth rate at the end of the fiscal year.
- 7𝐶𝐴𝑃𝐸𝑋𝑖,𝑡 is the firms’ capital expenditure at the end of the fiscal year.
- 8𝐷𝑃𝑂𝑖,𝑡 is the firms’ dividends payout ratio at the end of the fiscal year.
- 9𝐸𝑃𝑆𝑖,𝑡 is the firm’s earnings per share at the end of the fiscal year.
- 𝑆𝐾𝐸𝑊𝑖,𝑡 is the skewness of firm-specific daily return over the fiscal year.
- 𝐾𝑈𝑅𝑇𝑖,𝑡 is the kurtosis of firm-specific daily return over the fiscal year.
6 Assets growth rate is the Current Year's Total Assets / Last Year's Total Assets - 1) * 100 7 Capital expenditure represents the funds used to acquire fixed assets other than those associated with acquisitions. It includes but is not restricted to: Additions to property, plant and equipment Investments in machinery and equipment 8 Dividends payout ratio Dividends Per Share / Earnings Per Share * 100 9 Earnings per share represents the earnings for the 12 months ended. It represents the fully diluted earnings per share for the companies.
31
Chapter IV
4. RESULTS
4.1 Model results:
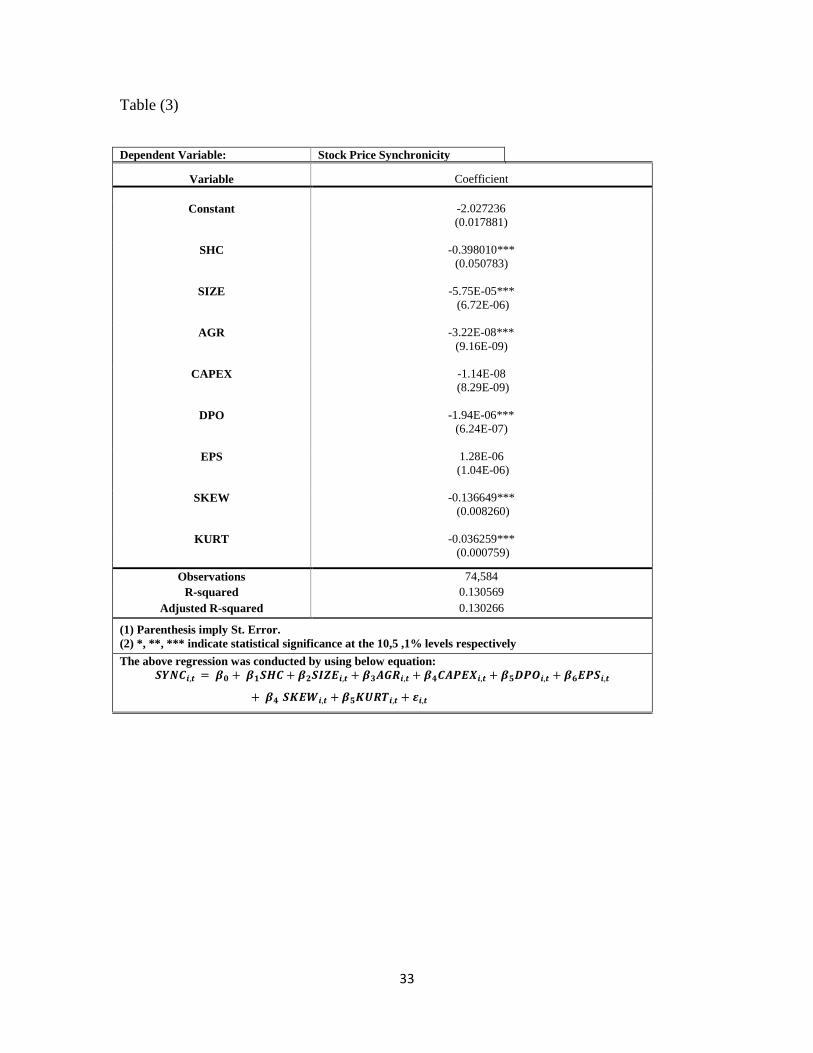
Model 1 results are documents in table (3). Using panel least squares multiple
regression method with period fixed effect, we find that Shariah compliance which is the
main variable of interest is significant measured by 𝑆𝐻𝐶 with a negative coefficient
which means that the Shari'ah compliance decreases stock price synchronicity. Hence, we
do not reject our first hypothesis that firm’s compliance to Shariah has a negative impact
on the co-movement of the Shariah stocks. We believe that this attributes to releasing
more of firms’ specific information by Shariah compliant firms compared to the
conventional ones due to the financial characteristic of Shariah compliant firms in terms
information transparency confirming the findings of McGuire, Omar, and Sharp (2012),
Hamdi and Zarari (2013), Ali and Al-Owaihan (2008) and Pepis and De Jong (2018) who
provided empirical evidence that Shariah compliance has an impact on the information
disclosure and transparency in a way that enforce compliant firms to have less
irregularity in reporting firm’s specific information and financial reporting. In addition,
our results confirm that financial ratios determined by Shariah standard have an effect on
releasing information supporting the outlined findings by Marquardt and Wiedman
(2004) and Chung et al (2005).
32
As for the control variables, our results show that firm’s size measured by 𝑆𝑖𝑧𝑒 is
significant with a negative coefficient supported the argument that larger firms are
believed to release more firm specific information compared to smaller firms kaife,
Gassen, and LaFond (2006) and Hutton et al (2009). In addition, the dividends payout
ratio represented in 𝐷𝑃𝑂 is significant with a negative coefficient which indicates that
higher dividends payout ratio decreased stock price synchronicity contradicting with
Farouq and ELbannan (2019) who documented that firms with higher dividends payout
ratio are believed to have less accurate information. As for the assets growth rate 𝐴𝐺𝑅
our results show that the ratio is significant with a negative impact on stock price
synchronicity confirming the findings of Watanabe et al (2012). Furthermore, the
Kurtosis 𝐾𝑈𝑅𝑇 shows a significant impact on our depended variable with a negative
coefficient. Stocks with high kurtosis recorded lower 𝑅2. Likewise, the skewness is
significant recording negative coefficient to support that firm’s skewedness is inversely
proportional to firm’s 𝑅2 confirming the results found by Hutton et al. (2009) and Jin and
Myers (2006). Other control variables such as Earnings per share 𝐸𝑃𝑆 and Capital
expenditure 𝐶𝐴𝑃𝐸𝑋 are insignificant.
33
Table (3)
Dependent Variable: Stock Price Synchronicity
Variable Coefficient
Constant -2.027236
(0.017881)
SHC -0.398010***
(0.050783)
SIZE -5.75E-05***
(6.72E-06)
AGR -3.22E-08***
(9.16E-09)
CAPEX -1.14E-08
(8.29E-09)
DPO -1.94E-06***
(6.24E-07)
EPS 1.28E-06
(1.04E-06)
SKEW -0.136649***
(0.008260)
KURT -0.036259***
(0.000759)
Observations 74,584
R-squared 0.130569
Adjusted R-squared 0.130266
(1) Parenthesis imply St. Error.
(2) *, **, *** indicate statistical significance at the 10,5 ,1% levels respectively
The above regression was conducted by using below equation:
𝑺𝒀𝑵𝑪𝒊,𝒕 = 𝜷𝟎 + 𝜷𝟏𝑺𝑯𝑪 + 𝜷𝟐𝑺𝑰𝒁𝑬𝒊,𝒕 + 𝜷𝟑𝑨𝑮𝑹𝒊,𝒕 + 𝜷𝟒𝑪𝑨𝑷𝑬𝑿𝒊,𝒕 + 𝜷𝟓𝑫𝑷𝑶𝒊,𝒕 + 𝜷𝟔𝑬𝑷𝑺𝒊,𝒕
+ 𝜷𝟒 𝑺𝑲𝑬𝑾𝒊,𝒕 + 𝜷𝟓𝑲𝑼𝑹𝑻𝒊,𝒕 + 𝜺𝒊,𝒕
34
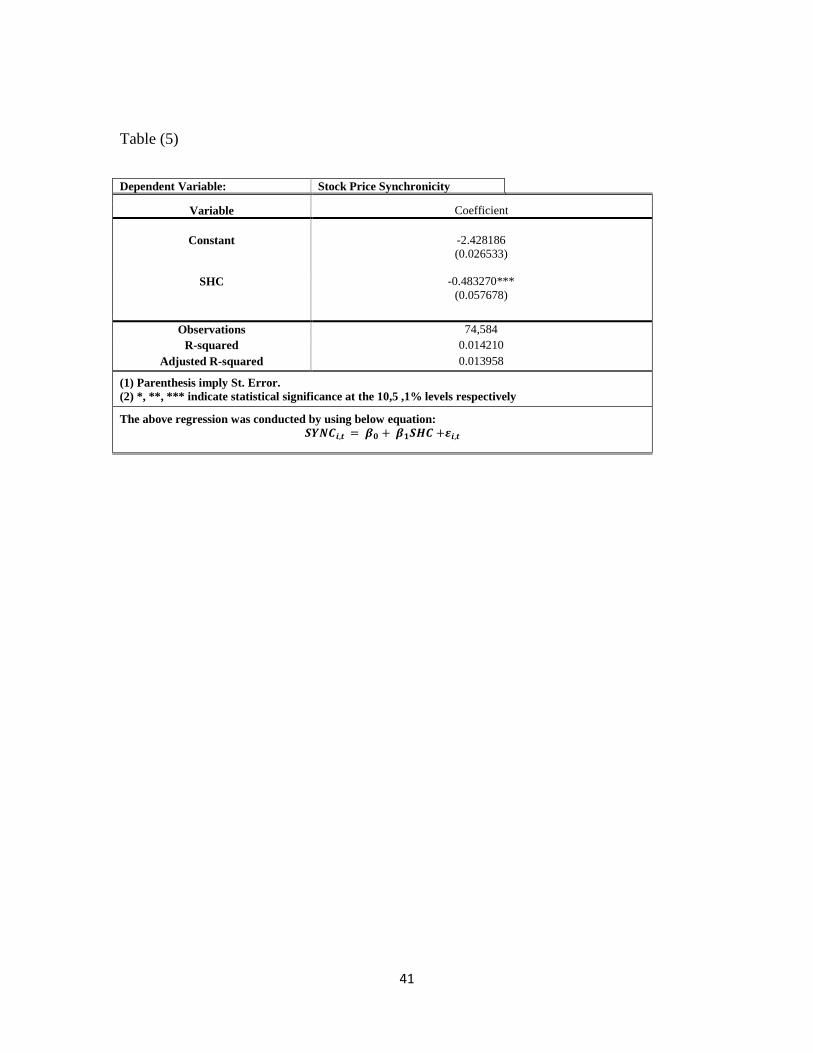
4.2 Sensitivity analysis results:
We start our sensitivity analysis a simple regression model that tests the impact of
the Shariah compliance on stock price synchronicity. The results in table (5) confirm the
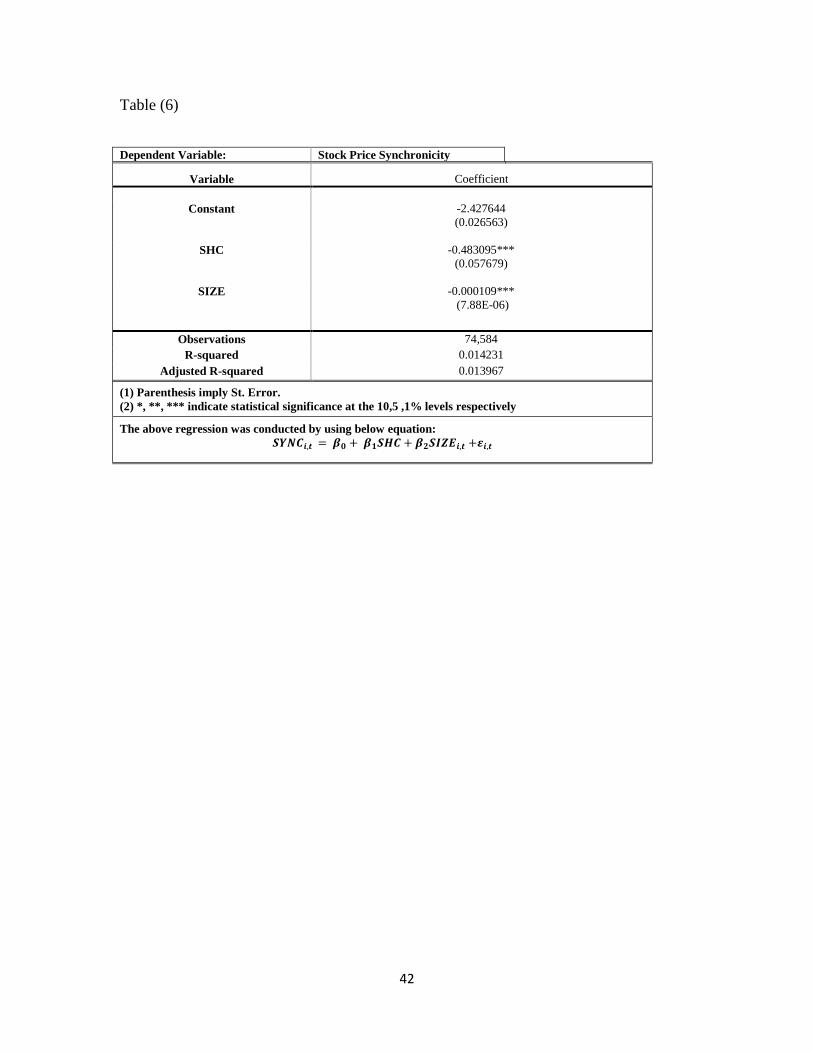
negative significant effect of Shariah on the co-movements of the stocks. We add firms’
size. The results in table (6) also confirm the negative significant impact of Shariah and
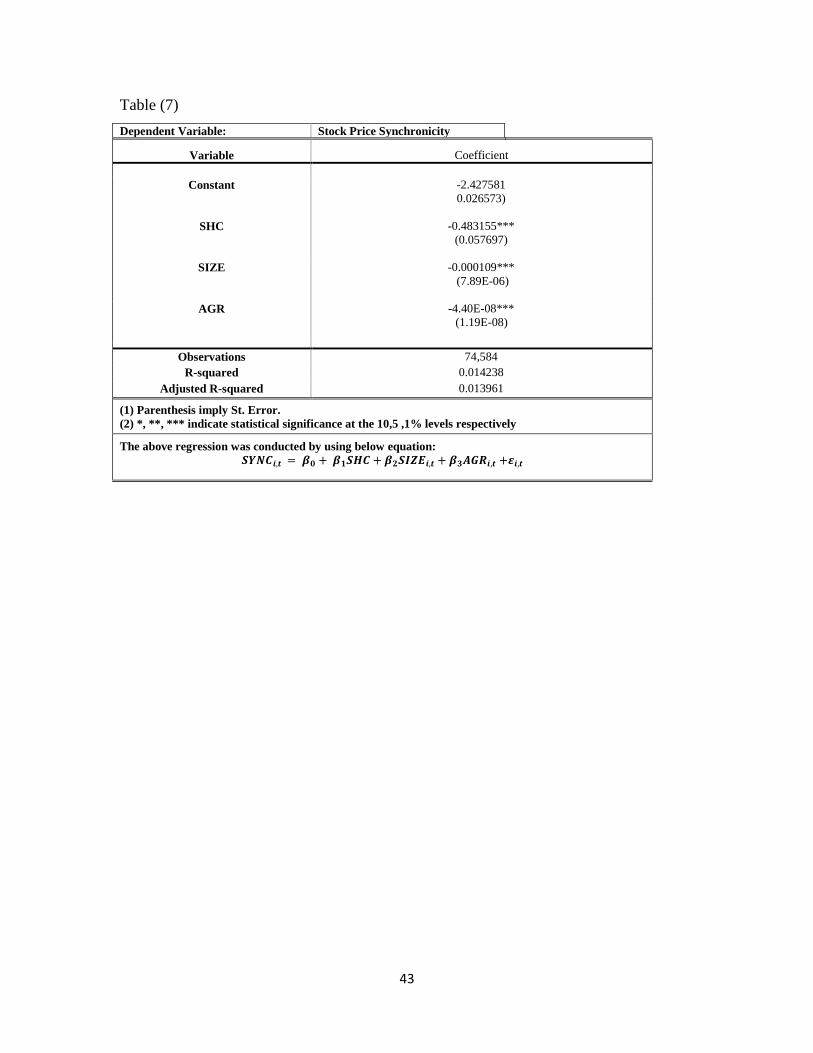
the firms’ size. We add the assets growth rate, the results in table (7) show that all
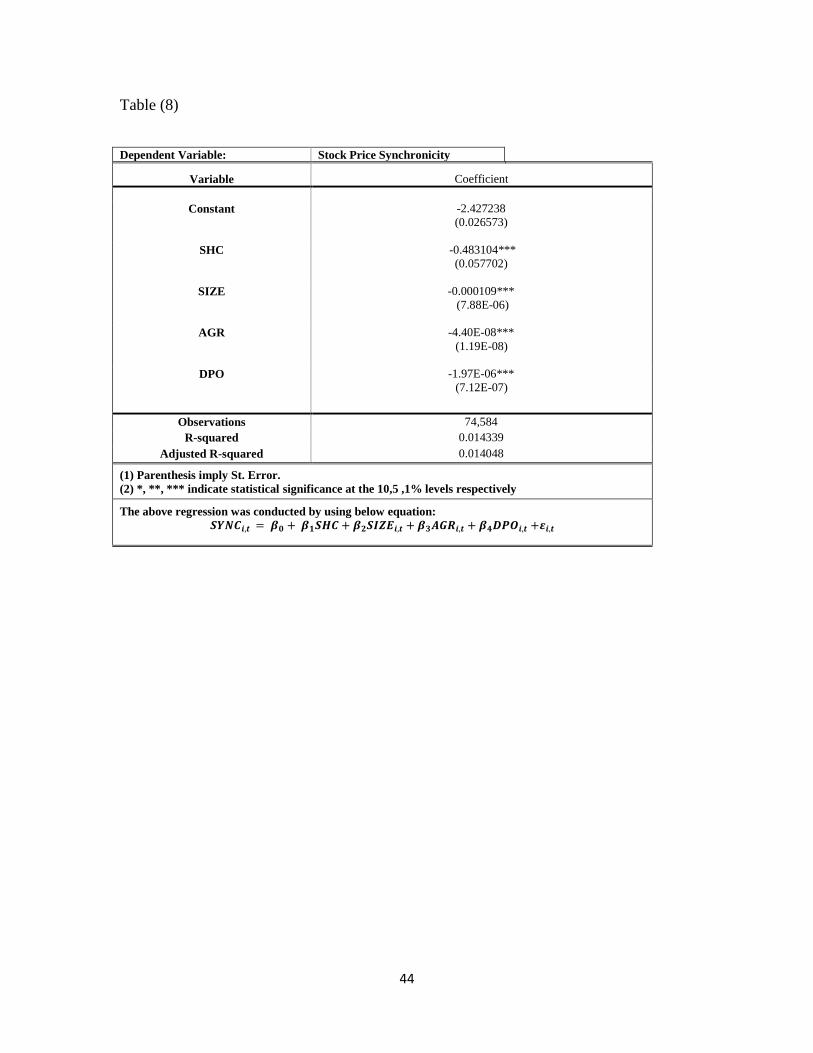
variables are significant with negative coefficients confirming the previous findings. We
added dividends payout ratio, the results in table (8) remain the same showing negative
significant impact of Shariah and other firm-specific control variables on stock price
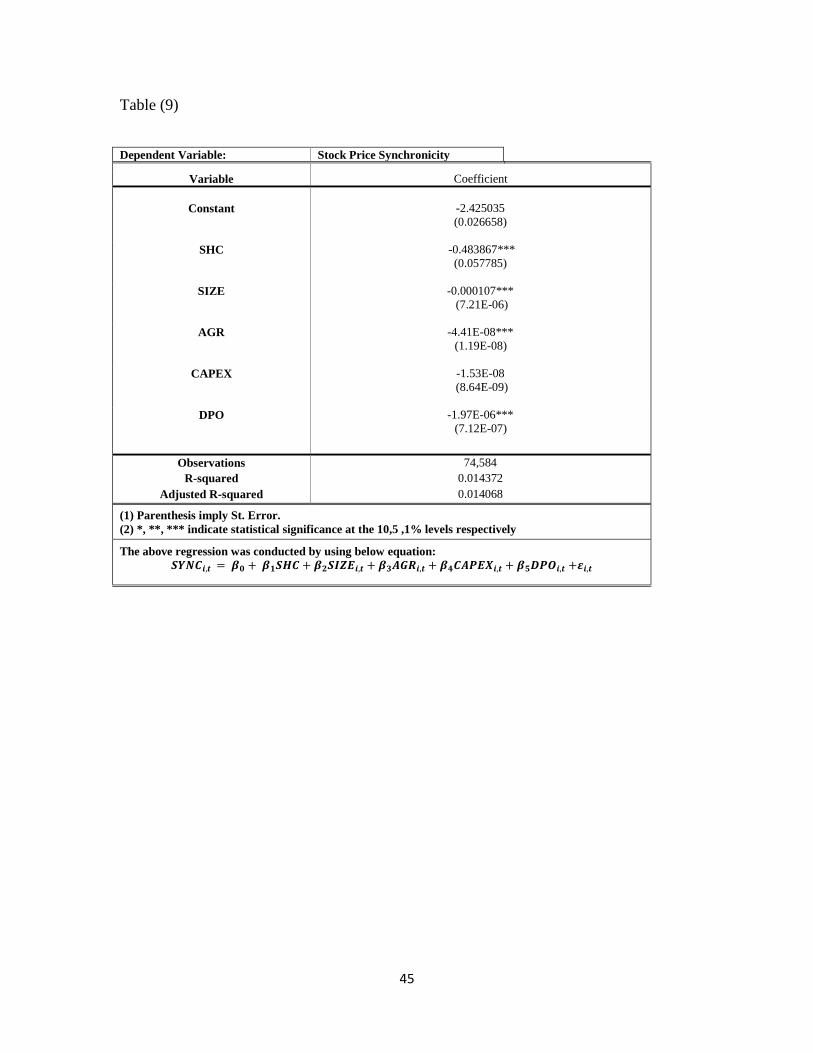
synchronicity. We add capital expenditure, the results in table (9) confirm the previous
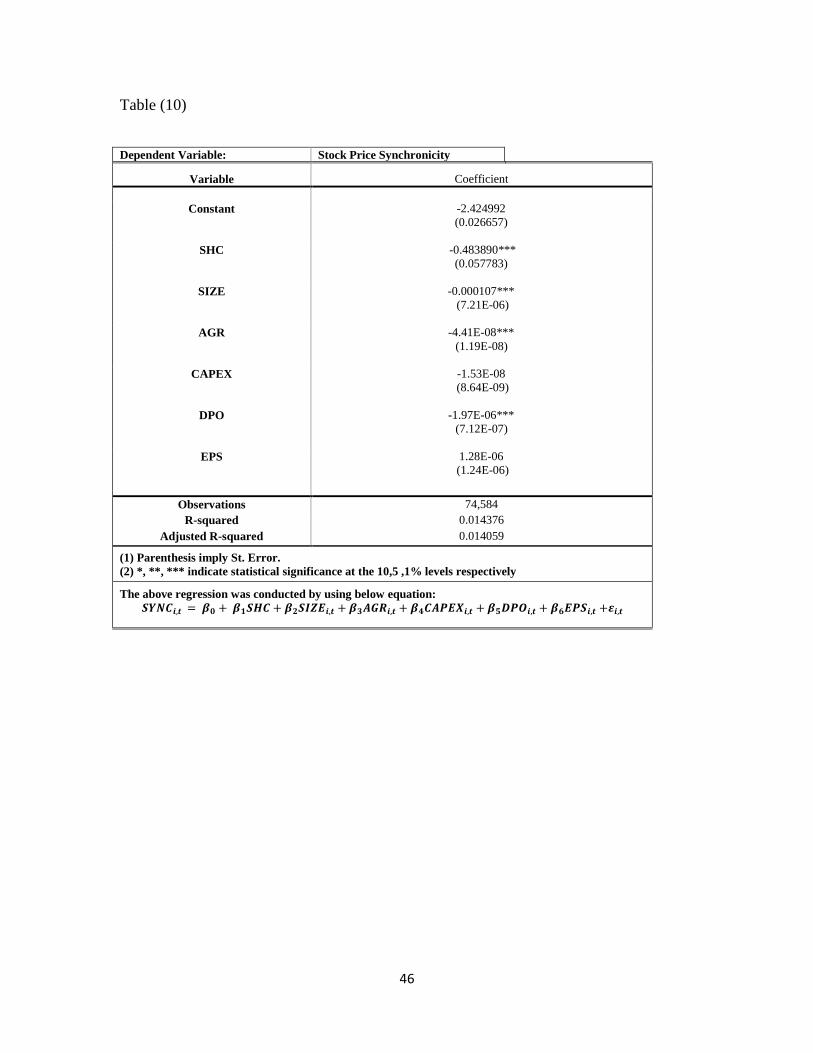
findings for all the independent variable yet, and capital expenditure is insignificant. We
add earnings per share; the results in table (10) support our findings for all control
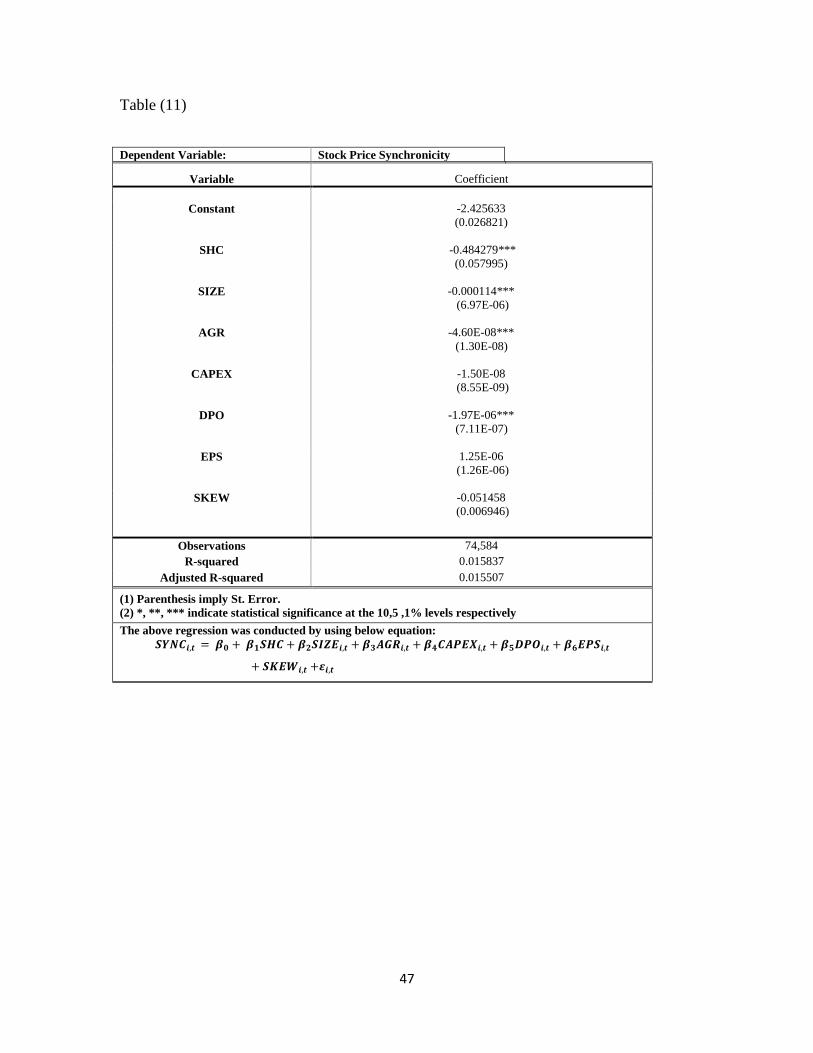
variables while earning per share is insignificant. We add skewness; the results in table
(11) show that all the independent remain the same while skewness record negative
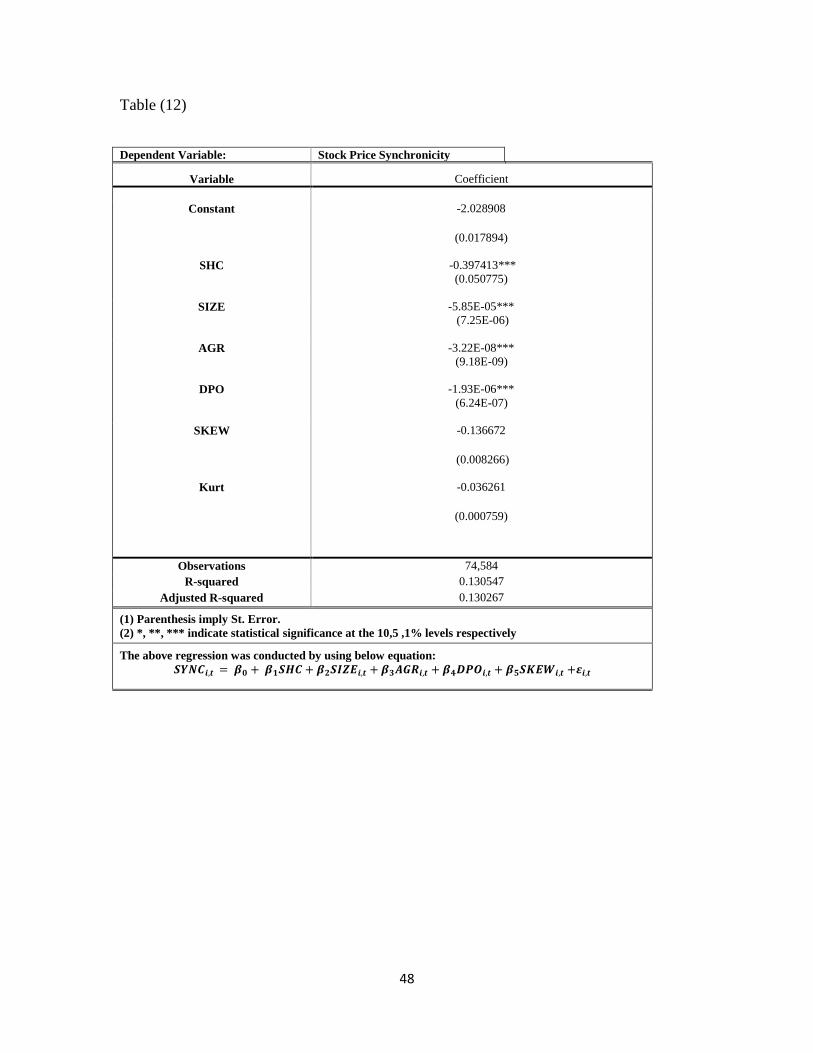
significant impact on stock price synchronicity. In addition, we run a model another
model after removing the insignificant variables in our previous results. We remove
Capital expenditure and Earnings per share. The results shown in table (12) confirm our
previous findings for all the variables included in our model. Therefore, our sensitivity
analysis confirms our previous findings that Shariah compliance has a negative impact on
stock price synchronicity.
35
Chapter V
5. Conclusion
This thesis aims to investigate the relationship between Shariah compliance on stock
price synchronicity by having a rational that Shariah standard put emphasis on compliant
firm to be more transparent in terms of releasing firm-specific information. We shed the
light on the Shariah compliant firms’ characteristics in terms of information disclosure
and financials ratios.
Following Dow Jones S&P Indices methodology for 2019, we classify our sample of
data that included 11 countries out which 9 emerged countries versus 2 developed
countries, our sample includes contains 124,031 observation out of which 56,812
observations are Shariah compliant firms while 67, 219 observations are non-Shariah
compliant firms. On the other hand, we follow previous literature for the measurement of
the stock price synchronicity by using the firms’ 𝑅2 as a measurement of firm’s co-
movement with the market following Roll (1998) and Morck et al. (2000).
We use panel least square regression analysis with period fixed effect. Our results
confirm our hypothesis that Shariah compliance has a significant negative effect on stock
price synchronicity. Our findings support the empirical evidence documented in previous
literature that culture and religion has an impact on the transparency and amount of
releasing information to public investors.
The findings of this thesis is important for those who are interested in Islamic finance
given the continuous increase in the Islamic population and the increase in the number of
investors who give due attention to Shariah compliant firms in order to assure that they

36
are investing in stocks that are associated with their religious standards. In addition, our
findings are remarkable for investors who are interested in hedging during bad
performance of the market as Shariah compliance firms are proven to be more affected by
firm-specific information rather than market information. Furthermore, our findings is
noteworthy for Shariah regulatory body in setting the classification criteria for Shariah
compliance.
Finally, future scholars may expand our research by adding some macroeconomic
factors such as gross domestic products (GDP), inflation rate, and interest rate while
investigating the impact of Shariah on stock price synchronicity in order to control for the
differences in each country’s economy.

37
References
Ahmed, N, Farooq, O., 2017. Does the degree of Shari’ah compliance affect the
volatility? Evidence from the MENA region. Research in International Business and
Finance. 45, 150–158.
Albaity, M., Ahmad, R., 2011. A comparative analysis of the firm specific determinants
of Syariah compliant versus non-Syariah compliant firms in Bursa Malaysia. Asian
Journal of Business and Accounting. 4(1), 59–84.
Ali, A., Al-Owaihan, A., 2008. Islamic work ethic: A critical review. Cross Cultural
Management: An International Journal. 15(1), 5-19.
Alsaadi, A., Ebrahim, S., and Jaafar, A., 2017. Corporate social responsibility, shariah-
compliance, and earnings quality. Journal of Financial Services Research. 51(2), 169–
194.
Ashraf, D. (2016). Does Shari’ah screening cause abnormal returns? Empirical evidence
from Islamic equity indices. Journal of Business Ethics, 134, 209-228.
Ashraf, D., Khawaja, M., 2016. Does the Shariah screening process matter? Evidence
from Shariah compliant portfolios. Journal of Economic Behavior and Organization. 132,
77–92.
Azam M, Khalid MU, and Zia SZ., 2019. Board diversity and corporate social
responsibility: the moderating role of Shariah compliance. Corporate Governance. The
International Journal of Business in Society. Ahead-of-print.
Chan, K., and Hameed, A. 2006. Stock price synchronicity and analyst coverage in
emerging markets. Journal of Financial Economics, 80, 115-147.
Chung, R., Firth, M., Kim, J.B., 2005. Earnings management, surplus free cash flow, and
external monitoring. J. Bus. Res. 58 (6), 766–776.
Eun CS, Wang L, Xiao SC., 2015. Culture and R2. Journal of Financial Economics. 115,
283-303.
Erragragui, E., Revelli, C., 2016. Is it costly to be both shariah compliant and socially
responsible? Review of Financial Economics. 31(1), 64-74.
Fama, F., 1970. Efficient capital markets: A review of theory and empirical work. The
Journal of Finance. 25(2), 383–417.
38
Farooq, O., and ElBannan, M. A., 2019. Stock price synchronicity and dividend policy:
Evidence from an emerging market. Accounting Research Journal, 32(4), 627-641.
Farooq, O., Alahkam, A., 2016. Performance of Shariah-compliant Firms and non-
shariah-compliant firms in the MENA region: which is better? J. Islamic Account. Bus.
7(4), 268–281.
Frank, M., Goyal, V., 2003. Testing the pecking order theory of capital structure. Journal
of Financial Economics. 67(2), 217–248.
Hamdi, F., Zarai, M., 2013. Perspectives of earnings management in Islamic banking
institutions. Intentional Journal of Business and Management. 2, 26–38.
Hooghiemstra, R., Hermes, N., and Emanuels, J., 2015. National Culture and Internal
Control Disclosures: A Cross-country Analysis: Internal Control Disclosures. Corporate
Governance: An International Review. 23(4). 357–377.
Hooy, C.-W., & Ali, R. (2017). Does a Muslim CEO matter in Shariah-compliant
companies? Evidence from Malaysia. Pacific-Basin Finance Journal, 42, 126-141.
Hutton, A.P., Marcus, A.J., Tehranian, H., 2009. Opaque financial reports, R2, and crash
risk. J. Financ. Econ. 94, 67–86.
IMF, 2017. Islamic Finance and the Role of IMF.
Jin, L., and Myers, S., 2006. R2 around the world: New theory and new tests. Journal of
Financial Economics. 79, 257–292.
Masih, M., Kamil, N., and Bacha, O., 2018. Issues in Islamic equities: A literature
survey. Emerging Markets Finance and Trade. 54, 1–26.
McGuire, S., Omer, T., and Sharp, N., 2012. The Impact of Religion on Financial
Reporting Irregularities. The Accounting Review. 87(2), 645–673.
Morck, R.,Yeung, B, and Yu, W., 2000. The Information Content of Stock Markets: Why
do Emerging Markets have Synchronous Stock Price Movements? Journal of Financial
Economics. 58. 215–260.
Marquardt, C.A., Wiedman, C.I., 2004. How are earnings managed? An examination of
specific accruals. Contemp. Account. Res. 21 (2), 461–491.
Naz, I., Shah, S. M. A., & Kutan, A. M. (2017). Do managers of sharia-compliant firms
have distinctive financial styles? Journal of International Financial Markets, Institutions
and Money, 46, 174-187.
Rao, L., Zhou, L., 2019. The role of stock price synchronicity on the return-sentiment
relation. North American Journal of Economics and Finance. 47, 119–131.
39
Roll, R., 1988. R-squared. Journal of Finance. 43, 541–566.
Pepis, S., de Jong, P., 2019. Effects of Shariah-compliant business practices on long-term
financial performance. Pacific-Basin Finance Journal. vol. 53, 254–267.
Qiu, B., Yu, J., and Zhang, K, 2019. Trust and stock price synchronicity: Evidence from
china. Journal of Business Ethics. 176 ,1–13.
Richardson, S.A., Sloan, R.G., Soliman, M.T., Tuna, A., 2001. Information in accruals
about the quality of earnings. Inf. Accruals About Qual. Islamic finance is seeing
spectacular growth. Times Reader 2 (5).
Said, R., Abd Samad, K., Mohd Sidek, N.Z., Ilias, N.F. and Omar, N. (2018). Corporate
social responsibility disclosure index of Malaysian Shariah–compliant companies.
International Journal of Ethics and Systems. Vol. 34, 55-69.
Sulaiman, M. 2001. Testing a model of Islamic corporate financial reports: Some
experimental evidence. International Journal of Economics, Management and
Accounting, 9(2), 115-39.
Setiawan, C., Oktariza, H., 2013. Shariah and conventional stocks performance of public
companies listed on Indonesia stock exchange. Journal of Accounting, Finance and
Economics. 3, 51–64.
Sergius, P. Savas, S., 2014. On corporate social responsibility and islamic marketing.
Journal of Islamic Marketing, Vol. 5, 33-48.
Skaife, H., Gassen, J., and LaFond, R., 2006. Does stock price synchronicity represent
firm-specific information? The international evidence. Working paper, University of
Wisconsin – Madison.
Uddin, S.J. (2003). Understanding the framework of business in Islam in an era of
globalization: a review. Business Ethics: A European Review, Vol. 12 No. 1, 23-32.
Watanabe, A., Xu, Y., Yao, T., and Yu, T. 2013. The asset growth effect: Insights from
international equity markets. Journal of Financial Economics, 108(2), 529-563.
40
Appendix
Table (4)
Variance Inflation Factor (VIF)
Variable 𝑅2 1
(1 − 𝑅2)
SHC 0,015453 0.984547
SIZE 0.002772 0.997228
AGR
0.000156 0.999844
CAPEX 0.002021 0.997979
EPS 0.000895 0.999105
DPO 0.003393 0.996607
SKEW 0.00902 0.966098
KURT 0.07712 0.962288
41
Table (5)
Dependent Variable: Stock Price Synchronicity
Variable Coefficient
Constant -2.428186
(0.026533)
SHC -0.483270***
(0.057678)
Observations 74,584
R-squared 0.014210
Adjusted R-squared 0.013958
(1) Parenthesis imply St. Error.
(2) *, **, *** indicate statistical significance at the 10,5 ,1% levels respectively
The above regression was conducted by using below equation:
𝑺𝒀𝑵𝑪𝒊,𝒕 = 𝜷𝟎 + 𝜷𝟏𝑺𝑯𝑪 +𝜺𝒊,𝒕
42
Table (6)
Dependent Variable: Stock Price Synchronicity
Variable Coefficient
Constant -2.427644
(0.026563)
SHC -0.483095***
(0.057679)
SIZE -0.000109***
(7.88E-06)
Observations 74,584
R-squared 0.014231
Adjusted R-squared 0.013967
(1) Parenthesis imply St. Error.
(2) *, **, *** indicate statistical significance at the 10,5 ,1% levels respectively
The above regression was conducted by using below equation:
𝑺𝒀𝑵𝑪𝒊,𝒕 = 𝜷𝟎 + 𝜷𝟏𝑺𝑯𝑪 + 𝜷𝟐𝑺𝑰𝒁𝑬𝒊,𝒕 +𝜺𝒊,𝒕
43
Table (7)
Dependent Variable: Stock Price Synchronicity
Variable Coefficient
Constant -2.427581
0.026573)
SHC -0.483155***
(0.057697)
SIZE -0.000109***
(7.89E-06)
AGR -4.40E-08***
(1.19E-08)
Observations 74,584
R-squared 0.014238
Adjusted R-squared 0.013961
(1) Parenthesis imply St. Error.
(2) *, **, *** indicate statistical significance at the 10,5 ,1% levels respectively
The above regression was conducted by using below equation:
𝑺𝒀𝑵𝑪𝒊,𝒕 = 𝜷𝟎 + 𝜷𝟏𝑺𝑯𝑪 + 𝜷𝟐𝑺𝑰𝒁𝑬𝒊,𝒕 + 𝜷𝟑𝑨𝑮𝑹𝒊,𝒕 +𝜺𝒊,𝒕
44
Table (8)
Dependent Variable: Stock Price Synchronicity
Variable Coefficient
Constant -2.427238
(0.026573)
SHC -0.483104***
(0.057702)
SIZE -0.000109***
(7.88E-06)
AGR -4.40E-08***
(1.19E-08)
DPO -1.97E-06***
(7.12E-07)
Observations 74,584
R-squared 0.014339
Adjusted R-squared 0.014048
(1) Parenthesis imply St. Error.
(2) *, **, *** indicate statistical significance at the 10,5 ,1% levels respectively
The above regression was conducted by using below equation:
𝑺𝒀𝑵𝑪𝒊,𝒕 = 𝜷𝟎 + 𝜷𝟏𝑺𝑯𝑪 + 𝜷𝟐𝑺𝑰𝒁𝑬𝒊,𝒕 + 𝜷𝟑𝑨𝑮𝑹𝒊,𝒕 + 𝜷𝟒𝑫𝑷𝑶𝒊,𝒕 +𝜺𝒊,𝒕
45
Table (9)
Dependent Variable: Stock Price Synchronicity
Variable Coefficient
Constant -2.425035
(0.026658)
SHC -0.483867***
(0.057785)
SIZE -0.000107***
(7.21E-06)
AGR -4.41E-08***
(1.19E-08)
CAPEX -1.53E-08
(8.64E-09)
DPO -1.97E-06***
(7.12E-07)
Observations 74,584
R-squared 0.014372
Adjusted R-squared 0.014068
(1) Parenthesis imply St. Error.
(2) *, **, *** indicate statistical significance at the 10,5 ,1% levels respectively
The above regression was conducted by using below equation:
𝑺𝒀𝑵𝑪𝒊,𝒕 = 𝜷𝟎 + 𝜷𝟏𝑺𝑯𝑪 + 𝜷𝟐𝑺𝑰𝒁𝑬𝒊,𝒕 + 𝜷𝟑𝑨𝑮𝑹𝒊,𝒕 + 𝜷𝟒𝑪𝑨𝑷𝑬𝑿𝒊,𝒕 + 𝜷𝟓𝑫𝑷𝑶𝒊,𝒕 +𝜺𝒊,𝒕
46
Table (10)
Dependent Variable: Stock Price Synchronicity
Variable Coefficient
Constant -2.424992
(0.026657)
SHC -0.483890***
(0.057783)
SIZE -0.000107***
(7.21E-06)
AGR -4.41E-08***
(1.19E-08)
CAPEX -1.53E-08
(8.64E-09)
DPO -1.97E-06***
(7.12E-07)
EPS 1.28E-06
(1.24E-06)
Observations 74,584
R-squared 0.014376
Adjusted R-squared 0.014059
(1) Parenthesis imply St. Error.
(2) *, **, *** indicate statistical significance at the 10,5 ,1% levels respectively
The above regression was conducted by using below equation:
𝑺𝒀𝑵𝑪𝒊,𝒕 = 𝜷𝟎 + 𝜷𝟏𝑺𝑯𝑪 + 𝜷𝟐𝑺𝑰𝒁𝑬𝒊,𝒕 + 𝜷𝟑𝑨𝑮𝑹𝒊,𝒕 + 𝜷𝟒𝑪𝑨𝑷𝑬𝑿𝒊,𝒕 + 𝜷𝟓𝑫𝑷𝑶𝒊,𝒕 + 𝜷𝟔𝑬𝑷𝑺𝒊,𝒕 +𝜺𝒊,𝒕
47
Table (11)
Dependent Variable: Stock Price Synchronicity
Variable Coefficient
Constant -2.425633
(0.026821)
SHC -0.484279***
(0.057995)
SIZE -0.000114***
(6.97E-06)
AGR -4.60E-08***
(1.30E-08)
CAPEX -1.50E-08
(8.55E-09)
DPO -1.97E-06***
(7.11E-07)
EPS 1.25E-06
(1.26E-06)
SKEW -0.051458
(0.006946)
Observations 74,584
R-squared 0.015837
Adjusted R-squared 0.015507
(1) Parenthesis imply St. Error.
(2) *, **, *** indicate statistical significance at the 10,5 ,1% levels respectively
The above regression was conducted by using below equation:
𝑺𝒀𝑵𝑪𝒊,𝒕 = 𝜷𝟎 + 𝜷𝟏𝑺𝑯𝑪 + 𝜷𝟐𝑺𝑰𝒁𝑬𝒊,𝒕 + 𝜷𝟑𝑨𝑮𝑹𝒊,𝒕 + 𝜷𝟒𝑪𝑨𝑷𝑬𝑿𝒊,𝒕 + 𝜷𝟓𝑫𝑷𝑶𝒊,𝒕 + 𝜷𝟔𝑬𝑷𝑺𝒊,𝒕
+ 𝑺𝑲𝑬𝑾𝒊,𝒕 +𝜺𝒊,𝒕
48
Table (12)
Dependent Variable: Stock Price Synchronicity
Variable Coefficient
Constant -2.028908
(0.017894)
SHC -0.397413***
(0.050775)
SIZE -5.85E-05***
(7.25E-06)
AGR -3.22E-08***
(9.18E-09)
DPO -1.93E-06***
(6.24E-07)
SKEW -0.136672
(0.008266)
Kurt -0.036261
(0.000759)
Observations 74,584
R-squared 0.130547
Adjusted R-squared 0.130267
(1) Parenthesis imply St. Error.
(2) *, **, *** indicate statistical significance at the 10,5 ,1% levels respectively
The above regression was conducted by using below equation:
𝑺𝒀𝑵𝑪𝒊,𝒕 = 𝜷𝟎 + 𝜷𝟏𝑺𝑯𝑪 + 𝜷𝟐𝑺𝑰𝒁𝑬𝒊,𝒕 + 𝜷𝟑𝑨𝑮𝑹𝒊,𝒕 + 𝜷𝟒𝑫𝑷𝑶𝒊,𝒕 + 𝜷𝟓𝑺𝑲𝑬𝑾𝒊,𝒕 +𝜺𝒊,𝒕
![Registrar of Joint Stock Companies and Firms [RJSC] of companies.pdfRegistrar of Joint Stock Companies and Firms [RJSC] Certificate of Incorporation 24-25 Dilkusha C/A, Dhaka 1000](https://img.pdfslide.us/doc/110x75/5a9ecf287f8b9a62178bd7d3/pdfregistrar-of-joint-stock-companies-and-firms-rjsc-of-companiespdfregistrar.jpg)