Embed Size (px)
Citation preview

The impact of fire on hydrology and The impact of fire on hydrology and suspended sediment and nutrient suspended sediment and nutrient
export in southern California chaparral export in southern California chaparral watershedswatersheds
The impact of fire on hydrology and The impact of fire on hydrology and suspended sediment and nutrient suspended sediment and nutrient
export in southern California chaparral export in southern California chaparral watershedswatersheds
Santa Barbara Coastal Santa Barbara Coastal Long Term Ecological Research Long Term Ecological Research
(SBC LTER)(SBC LTER)
Santa Barbara Coastal Santa Barbara Coastal Long Term Ecological Research Long Term Ecological Research
(SBC LTER)(SBC LTER)
Masters Research Seminar Masters Research Seminar
ByBy
J. Scott CoombsJ. Scott Coombs
Talk OutlineTalk Outline IntroductionIntroduction
MethodsMethods
HydrologyHydrology
Suspended Sediment ExportSuspended Sediment Export
Nutrient BiogeochemistryNutrient Biogeochemistry
Nutrient Export Nutrient Export
Summary of ResultsSummary of Results
AcknowledgmentsAcknowledgments
QuestionsQuestions
February 23, 2005
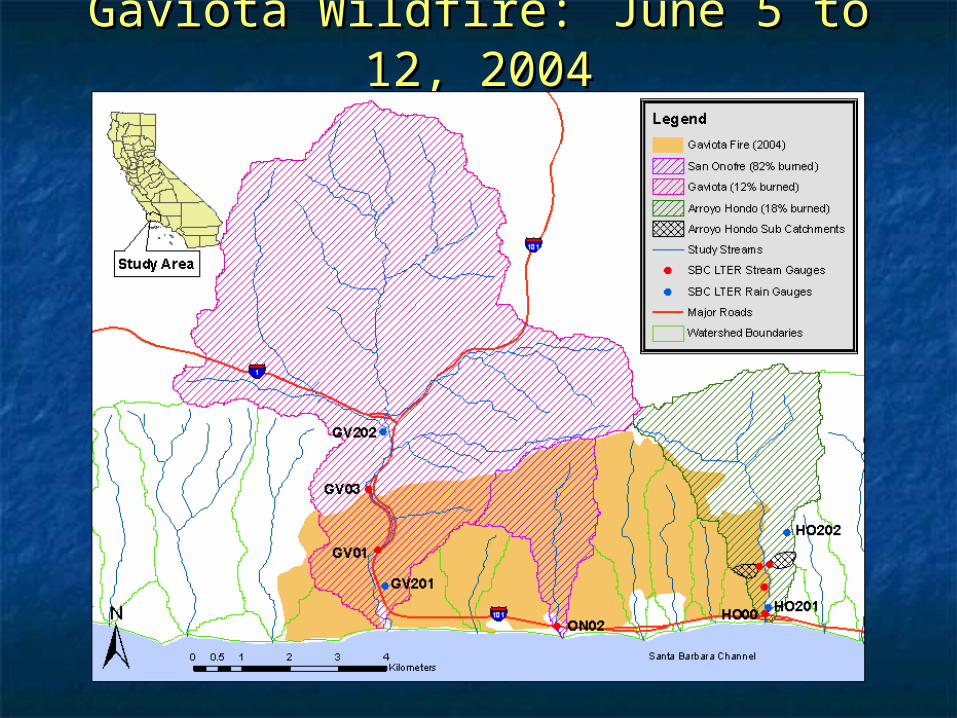
Gaviota Wildfire:Gaviota Wildfire: June 5 to 12, June 5 to 12, 20042004
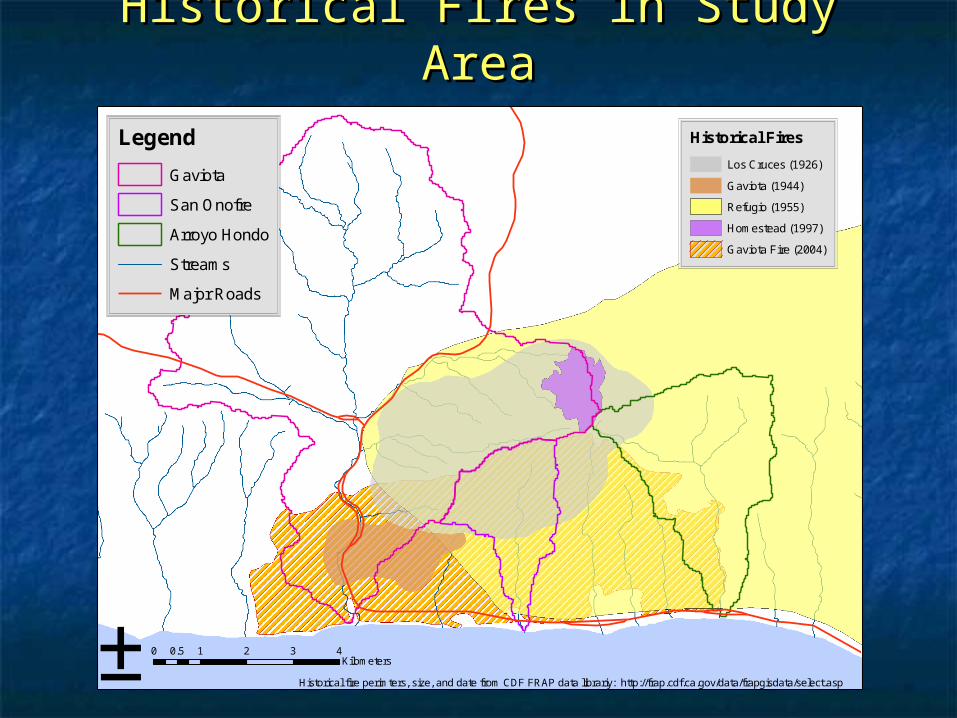
Historical Fires in Study AreaHistorical Fires in Study Area
0 1 2 3 40.5Kilometers
Historical Fires
Los Cruces (1926)
Gaviota (1944)
Refugio (1955)
Homestead (1997)
Gaviota Fire (2004)
Legend
Gaviota
San Onofre
Arroyo Hondo
Streams
Major Roads
±Historical fire perimters, size, and date from CDF FRAP data librariy: http://frap.cdf.ca.gov/data/frapgisdata/select.asp
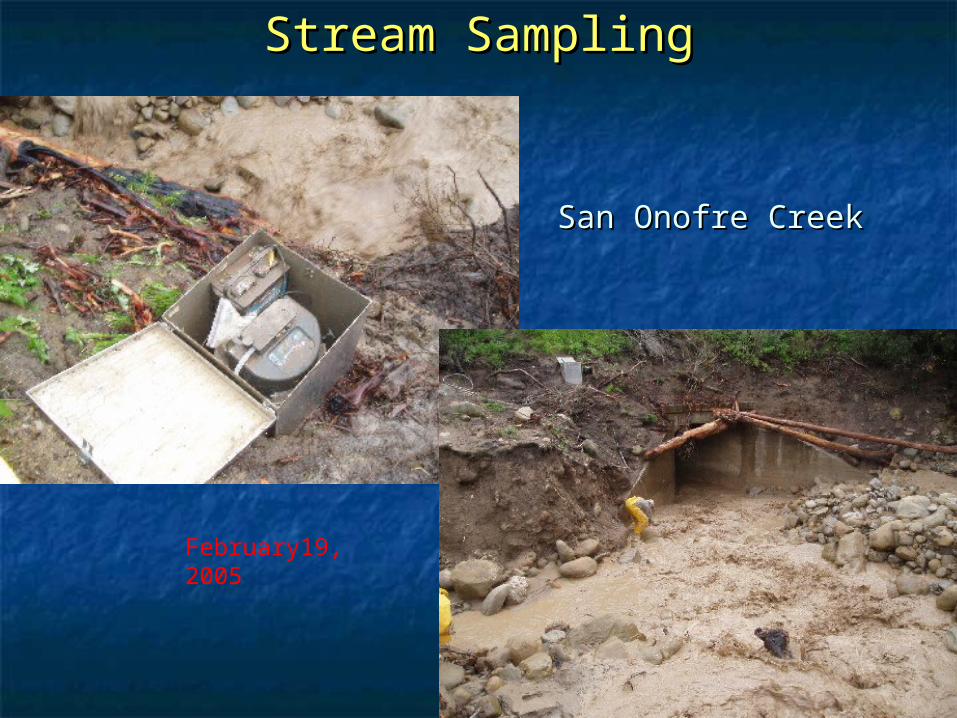
San Onofre CreekSan Onofre Creek
February19, 2005
Stream SamplingStream Sampling
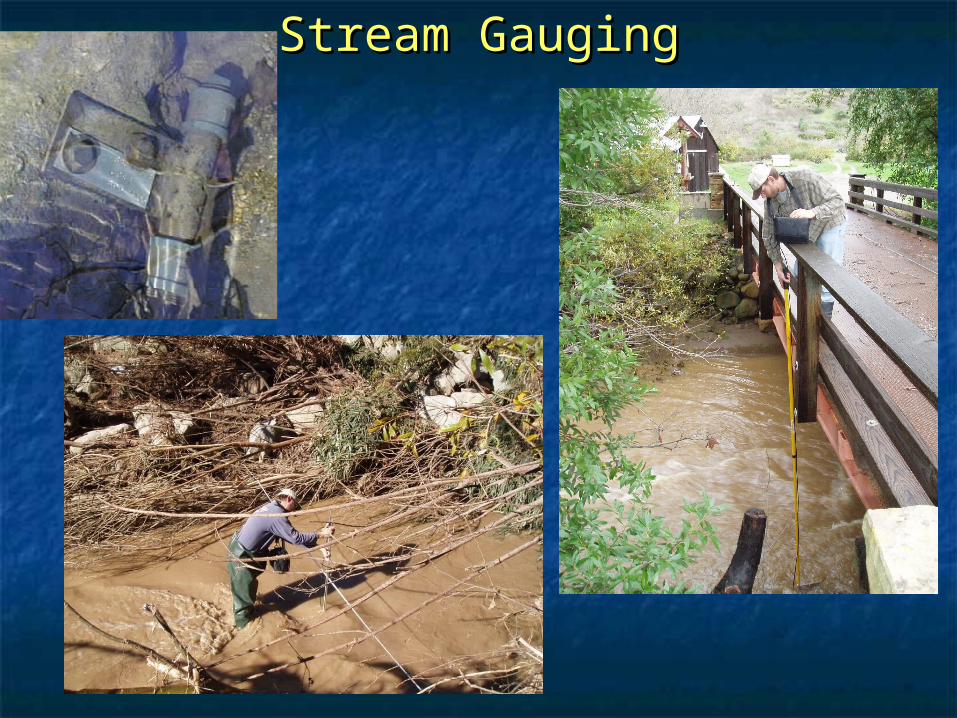
Stream GaugingStream Gauging

Gaviota Coast Precipitation
0
20
40
60
80
100
120
140
160
1966 1969 1972 1975 1978 1981 1984 1987 1990 1993 1996 1999 2002 2005
Water Year
Pre
cip
ita
tio
n (
cm
)
Nojoqui Falls Park
Tajiguas Landfill

WY2005 Storm Precipitation Totals
0
10
20
30
40
50
60
Oct Nov Dec Jan Feb Mar Apr May Jun Jul Aug Sep Oct
Pre
cip
itat
ion
(cm
) Nojoqui Falls Park
Tajiguas Landfill

Changes to Hydrologic Response:Changes to Hydrologic Response:
Infiltration decreasesInfiltration decreases
formation of hydrophobic soil layer formation of hydrophobic soil layer
compaction of soilcompaction of soil
Evapotranspiration and Interception decreaseEvapotranspiration and Interception decrease
more rainfall is available for runoffmore rainfall is available for runoff

Early Season Storm HydrographsEarly Season Storm Hydrographs
October 17 to 29, 2004
0.0
0.2
0.4
0.6
0.8
1.0
1.2
17-Oct-04 20-Oct-04 23-Oct-04 26-Oct-04 29-Oct-04
Dis
char
ge
(cm
hr-1
)
ON02
GV01
HO00
RS02

Mid-Winter Storm HydrographsMid-Winter Storm Hydrographs
February 18 to 24, 2005
0.0
0.5
1.0
1.5
2.0
2.5
18-Feb-05 20-Feb-05 22-Feb-05 24-Feb-05
Dis
ch
arg
e (
cm
hr-1
)
RS02
GV01
HO00
ON02

San Onofre CreekSan Onofre Creek
December 28, 2004
November 15, 2004
October 26, 2004October 19, 2004
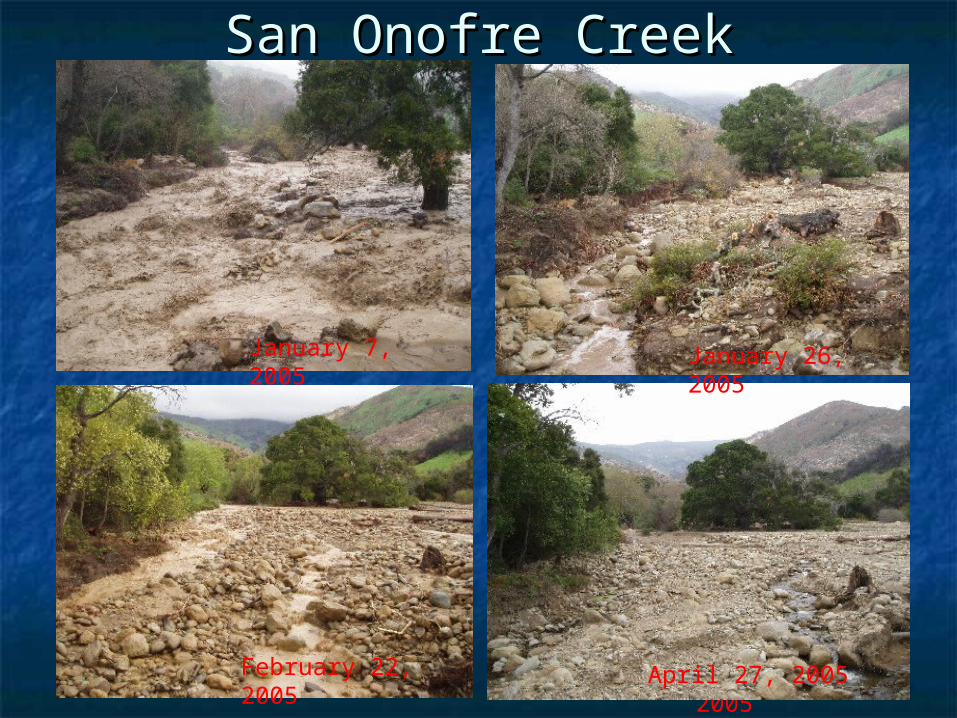
San Onofre CreekSan Onofre Creek
February19, 2005
February 22, 2005
April 27, 2005
January 7, 2005 January 26, 2005
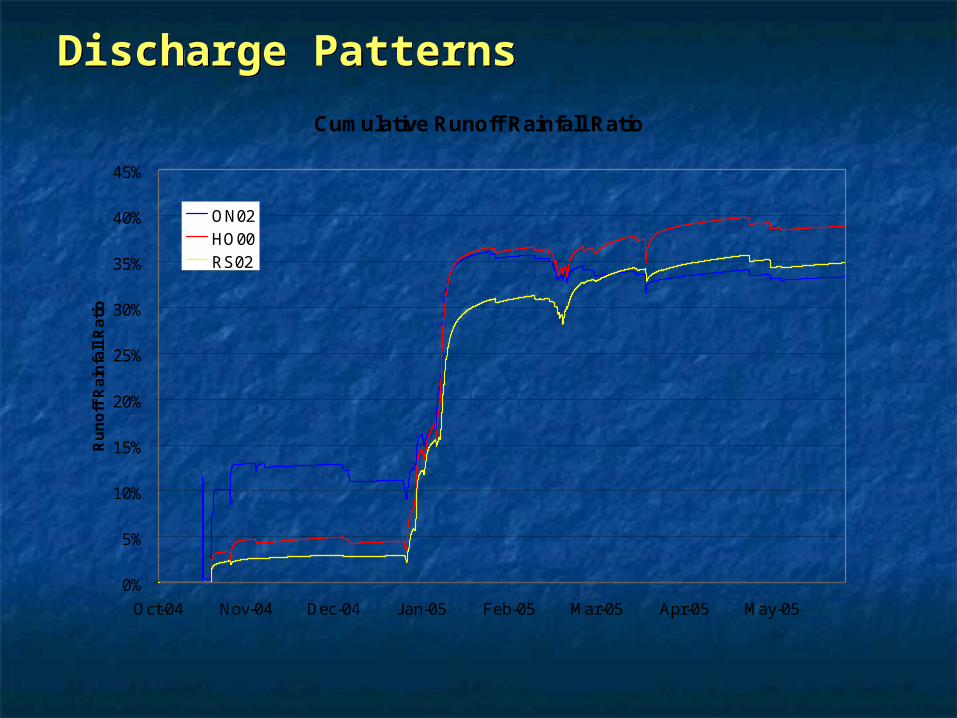
Discharge PatternsDischarge Patterns
Cumulative Runoff Rainfall Ratio
0%
5%
10%
15%
20%
25%
30%
35%
40%
45%
Oct-04 Nov-04 Dec-04 Jan-05 Feb-05 Mar-05 Apr-05 May-05
Ru
no
ff R
ain
fall
Rat
io
ON02
HO00
RS02
Runoff Rainfall Ratio = Runoff(cm) ÷ Rainfall (cm)

Changes to Sediment Export:Changes to Sediment Export:
Infiltration decreasesInfiltration decreases
Runoff and peak discharge increase Runoff and peak discharge increase
Interception decreases due to vegetation lossInterception decreases due to vegetation loss

Discharge-Suspended Sediment TrendsDischarge-Suspended Sediment Trends
GV01
0
40
80
120
160
200
0 10 20 30 40 50
Discharge (m3 s-1)
Su
sp
en
de
d S
ed
ime
nt
(g L
-1) October 16 to December 10, 2004
December 26 to 29, 2004
December 30, 2004 to May 10, 2005
Pre-Fire (WY2003)

Gaviota WatershedGaviota Watershed
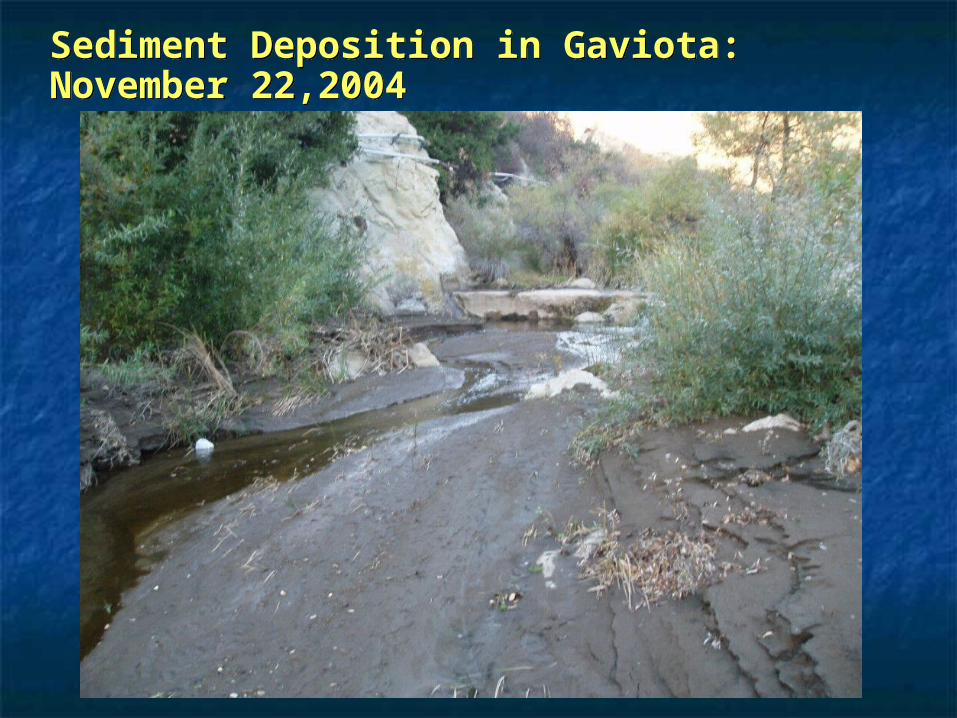
Sediment Deposition in Gaviota: November 22,2004Sediment Deposition in Gaviota: November 22,2004

Discharge-Suspended Sediment TrendsDischarge-Suspended Sediment Trends
ON02
0
50
100
150
200
250
300
0 5 10 15 20 25 30
Discharge (m3 s-1)
Su
sp
en
de
d S
ed
ime
nt
(g L
-1) October 19 to December 9, 2004
December 27 to 31,2004January 2 to May 6, 2005

Sediment movement in San Onofre:Sediment movement in San Onofre:
Photos taken May 2005
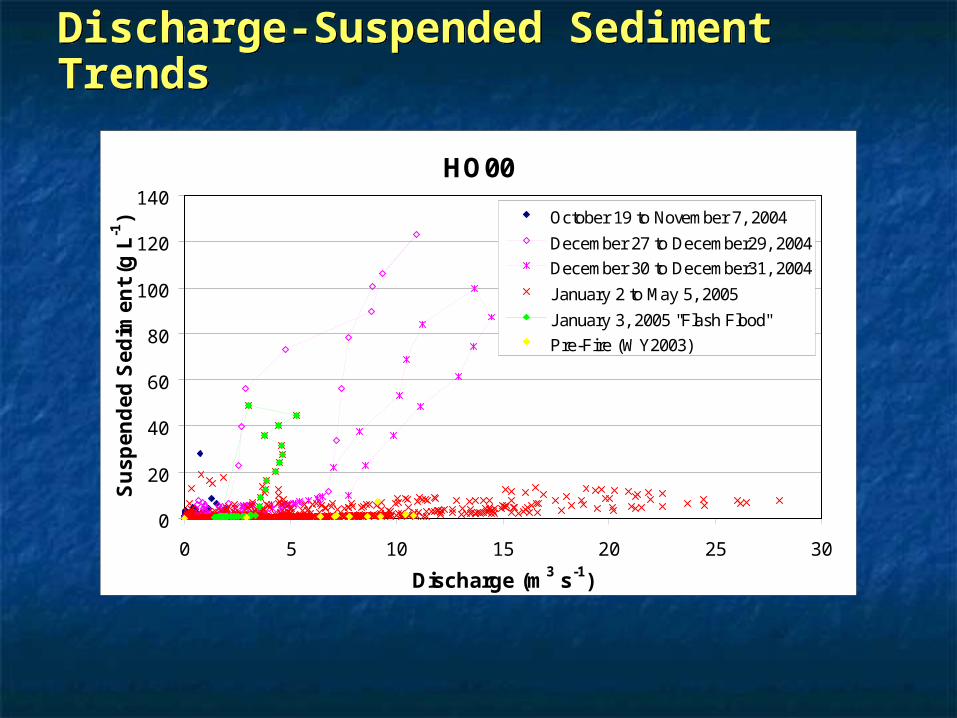
Discharge-Suspended Sediment TrendsDischarge-Suspended Sediment Trends
HO00
0
20
40
60
80
100
120
140
0 5 10 15 20 25 30
Discharge (m3 s-1)
Su
sp
en
de
d S
ed
ime
nt
(g L
-1) October 19 to November 7, 2004
December 27 to December29, 2004
December 30 to December31, 2004
January 2 to May 5, 2005
January 3, 2005 "Flash Flood"
Pre-Fire (WY2003)

Suspended Sediment Storm ExportSuspended Sediment Storm Export
Suspended Sediment Export vs Runoff (cm)
0
10
20
30
40
50
60
70
80
0 5 10 15 20 25 30 35Runoff (cm)
Su
spen
ded
Sed
imen
t E
xpo
rt (
t h
a-1)
ON02 (82% burned)
HO00 (18% burned)
GV01 (7% burned)
MC00 (55% urban)
Late Decmber, 2004 storms
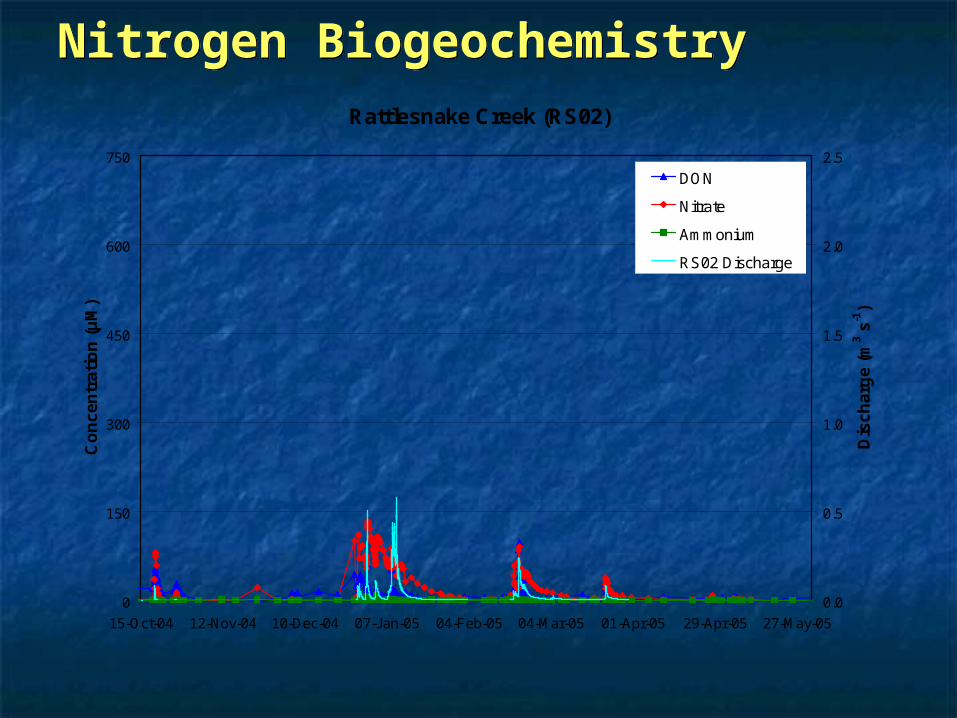
Nitrogen BiogeochemistryNitrogen BiogeochemistryRattlesnake Creek (RS02)
0
150
300
450
600
750
15-Oct-04 12-Nov-04 10-Dec-04 07-Jan-05 04-Feb-05 04-Mar-05 01-Apr-05 29-Apr-05 27-May-05
Co
nce
ntr
atio
n (
μM
)
0.0
0.5
1.0
1.5
2.0
2.5
Dis
char
ge
(m3 s
-1)
DON
Nitrate
Ammonium
RS02 Discharge

San Onofre (ON02)
0
150
300
450
600
750
15-Oct-04 12-Nov-04 10-Dec-04 07-Jan-05 04-Feb-05 04-Mar-05 01-Apr-05 29-Apr-05 27-May-05
Co
nce
ntr
atio
n (
μM
)
0.0
0.5
1.0
1.5
2.0
2.5
Dis
char
ge
(m3 s
-1)
DON
Nitrate
Ammonium
ON02 Discharge
Nitrogen BiogeochemistryNitrogen Biogeochemistry
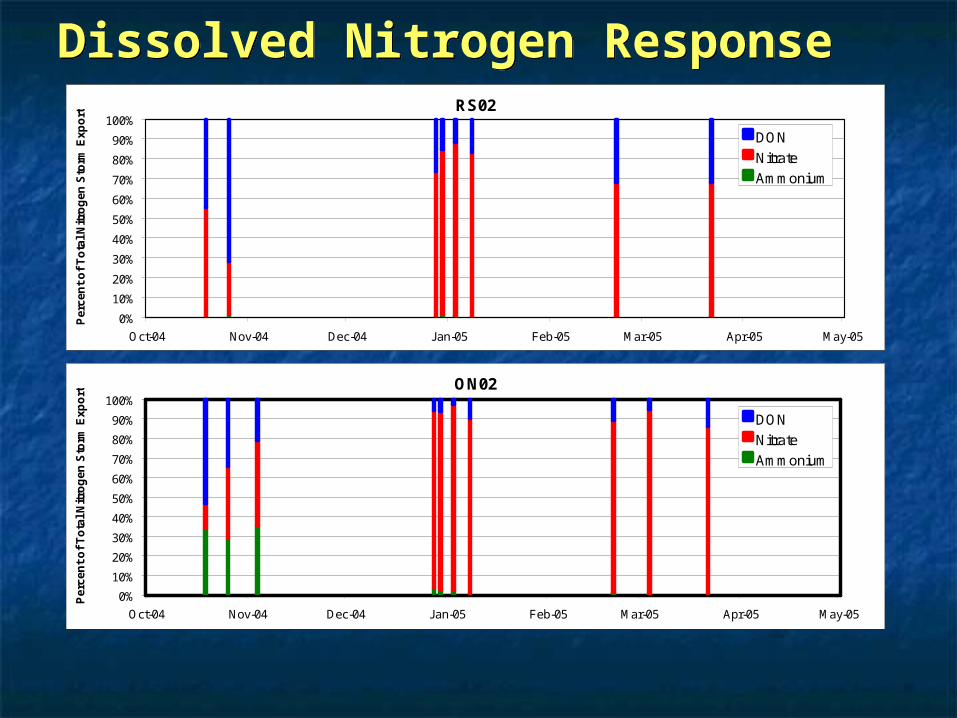
Dissolved Nitrogen ResponseDissolved Nitrogen Response
ON02
0%
10%
20%
30%
40%
50%
60%
70%
80%
90%
100%
Oct-04 Nov-04 Dec-04 Jan-05 Feb-05 Mar-05 Apr-05 May-05
Per
cen
t o
f T
ota
l N
itro
gen
Sto
rm E
xpo
rt
DON
Nitrate
Ammonium
RS02
0%
10%
20%
30%
40%
50%
60%
70%
80%
90%
100%
Oct-04 Nov-04 Dec-04 Jan-05 Feb-05 Mar-05 Apr-05 May-05
Per
cen
t o
f T
ota
l N
itro
gen
Sto
rm E
xpo
rt
DON
Nitrate
Ammonium

Nitrate Storm ExportNitrate Storm Export
Nitrate Export vs Runoff (cm)
0
100
200
300
400
500
600
700
800
900
0 5 10 15 20 25 30 35
Runoff (cm)
Nit
rate
(m
ole
s h
a-1)
ON02 (82% burned)
RS02 (unburned)
MC00 (55% urban)
BC02 (24% agriculture)

DON Storm ExportDON Storm Export
Dissolved Organic Nitrogen vs Runoff (cm)
0
10
20
30
40
50
60
70
80
90
100
0 5 10 15 20 25 30 35
Runoff (cm)
DO
N (
mo
les
ha-1
)
ON02 (82%)
RS02 (unburned)
MC00 (55% urban)
BC02 (24% agriculture)
October 19-20, 2004
October 26-27, 2004
Changes in Phosphate ExportChanges in Phosphate Export
Phosphate is rapidly mineralized and deposited on soil Phosphate is rapidly mineralized and deposited on soil surface but is not as mobile as nitratesurface but is not as mobile as nitrate
Increases in phosphate concentration in runoff roughly Increases in phosphate concentration in runoff roughly correlates with peak dischargecorrelates with peak discharge
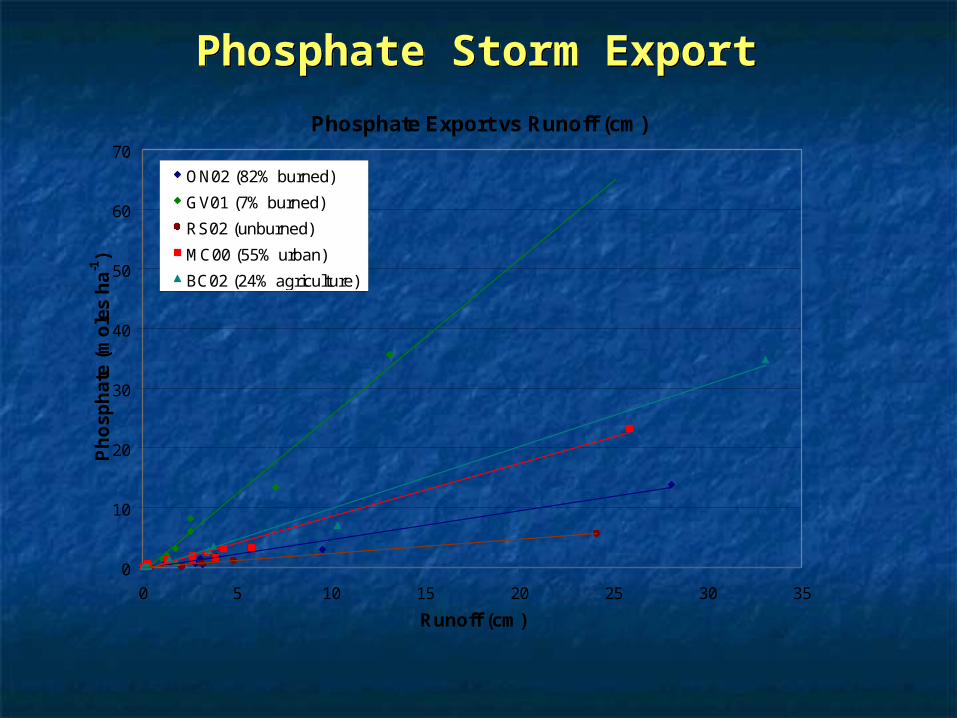
Phosphate Storm ExportPhosphate Storm Export
Phosphate Export vs Runoff (cm)
0
10
20
30
40
50
60
70
0 5 10 15 20 25 30 35
Runoff (cm)
Ph
osp
hat
e (m
ole
s h
a-1)
ON02 (82% burned)
GV01 (7% burned)
RS02 (unburned)
MC00 (55% urban)
BC02 (24% agriculture)

Summary of ResultsSummary of ResultsHydrologyHydrology Hydrologic response was typical for southern California Hydrologic response was typical for southern California
chaparral during early season storms but differences chaparral during early season storms but differences decreased as the season progressed with above decreased as the season progressed with above average rainfall.average rainfall.
Suspended SedimentSuspended Sediment 10-fold increase in suspended sediment export10-fold increase in suspended sediment export
NutrientsNutrients 30 times increase in ammonium export30 times increase in ammonium export 5.5 times increase in nitrate export5.5 times increase in nitrate export 2.8 times increase in DON export2.8 times increase in DON export 2 times increase in phosphate export2 times increase in phosphate export

AcknowledgementsAcknowledgementsSpecial thanks toSpecial thanks to My advisors: John Melack, Arturo Keller, and Jordan Clark.My advisors: John Melack, Arturo Keller, and Jordan Clark. Frank Setaro and Allen Doyle for their assistance in sample Frank Setaro and Allen Doyle for their assistance in sample
processing and analysis.processing and analysis. Tim Robinson and Al Leydecker for their advice and solace.Tim Robinson and Al Leydecker for their advice and solace. My family and friends for their support and encouragement.My family and friends for their support and encouragement.
My wife, Maria, for her love and understanding of my My wife, Maria, for her love and understanding of my absence on all those rainy nights.absence on all those rainy nights.

Questions?Questions?