Embed Size (px)
Citation preview
Policy Research Working Paper 6073
The Impact of Financial Literacy Training for Migrants
John GibsonDavid McKenzie
Bilal Zia
The World BankDevelopment Research GroupFinance and Private Sector Development TeamMay 2012
Impact Evaluation Series No. 57
WPS6073P
ublic
Dis
clos
ure
Aut
horiz
edP
ublic
Dis
clos
ure
Aut
horiz
edP
ublic
Dis
clos
ure
Aut
horiz
edP
ublic
Dis
clos
ure
Aut
horiz
edP
ublic
Dis
clos
ure
Aut
horiz
edP
ublic
Dis
clos
ure
Aut
horiz
edP
ublic
Dis
clos
ure
Aut
horiz
edP
ublic
Dis
clos
ure
Aut
horiz
ed
Produced by the Research Support Team
Abstract
The Impact Evaluation Series has been established in recognition of the importance of impact evaluation studies for World Bank operations and for development in general. The series serves as a vehicle for the dissemination of findings of those studies. Papers in this series are part of the Bank’s Policy Research Working Paper Series. The papers carry the names of the authors and should be cited accordingly. The findings, interpretations, and conclusions expressed in this paper are entirely those of the authors. They do not necessarily represent the views of the International Bank for Reconstruction and Development/World Bank and its affiliated organizations, or those of the Executive Directors of the World Bank or the governments they represent.
Policy Research Working Paper 6073
Remittances are a major source of external finance for many developing countries but the cost of sending remittances remains high for many migration corridors. International efforts to lower costs by facilitating the entry of new financial products and new cost comparison information sources rely heavily on the financial literacy of migrants. This paper presents the results of a
This paper is a product of the Finance and Private Sector Development Team, Development Research Group. It is part of a larger effort by the World Bank to provide open access to its research and make a contribution to development policy discussions around the world. Policy Research Working Papers are also posted on the Web at http://econ.worldbank.org. The authors may be contacted at [email protected] and [email protected].
randomized experiment designed to measure the impact of providing financial literacy training to migrants. Training appears to increase financial knowledge and information seeking behavior and reduce the risk of switching to costlier remittance products. But it does not change either the frequency or level of remittances.
1
The Impact of Financial Literacy Training for Migrants
John Gibson, David McKenzie, and Bilal Zia*
JEL Codes: F24, O12, C93.
Keywords: Financial literacy; Remittances; Migration.
Sector Board: Financial Sector (FSE)
* John Gibson is at the University of Waikato, and David McKenzie and Bilal Zia are both at the Finance and Private
Sector Development Unit of the World Bank Development Research Group. The authors thank the Russian Trust
Fund for Financial Literacy for financing this work; Wendy Li, Wasana Karunarathne and Halahingano Rohorua for
leading the training sessions and survey interviews; Kim Hailwood and the New Zealand Ministry of Pacific Island
Affairs for their work in helping to develop the training content with us; and all the survey participants and
community groups that participated in this study.
2
1. Introduction
International migration from a poor to a rich country is perhaps the single act most likely to
succeed in dramatically increasing the income of an individual (e.g. Clemens et al. 2009;
McKenzie et al. 2010) as well as that of family members remaining behind (e.g. Yang and
Martinez 2005; Yang, 2008; Gibson et al. 2011). The most direct channel through which
international migration can lower poverty for household members remaining in a developing
country is through remittances. However, high costs of sending remittances limit the amount
received by remaining household members from a given remittance transfer, as well as the
incentives of migrants to send remittances if such transfers are effectively taxed by these high
transactions costs. Lowering the cost of sending remittances has thus become one of the most
discussed areas for policy intervention in recent years (see World Bank, 2006 and the United
Nations Global Forums on Migration), in part because doing so is viewed as politically
uncontroversial compared to efforts to increase the opportunities for migration.
Two of the main policies to lower the costs of remittances have been regulatory reform to
allow the introduction of new financial products, and efforts to increase the disclosure of the
costs of remitting via each product, pioneered by Mexico (www.remesamex.gob.mx) and the
United Kingdom (www.sendmoneyhome.org1). However the efficacy of policies to reduce the
cost of remitting and spur competition by allowing new product entry and increasing disclosure
of costs relies heavily on the abilities of migrants to understand how to use the different methods
available for remitting and the costs implied by each method. While systematic evidence on the
financial literacy of migrants is scarce, the data available suggest migrants often lack knowledge
of the components of a remittance cost, the methods available, or how to compare methods
(Gibson et al, 2006; 2007). There therefore seems to be promising scope for financial literacy
training to change remitting behavior.
There is also growing interest from policymakers in providing financial literacy training
in this area. Much of the focus on financial literacy training for migrants and their families has
traditionally been on either integrating immigrants into the financial system in the destination
1 This website has since expanded and changed name to www.fxcompared.com. The World Bank has also launched a
remittance prices database (http://remittanceprices.worldbank.org) covering costs of remittances in 165 corridors.
3
country through content that focuses on building knowledge of banking services and covering
basic household budgeting and savings topics (LIRS, undated), or content focused on
encouraging remittance receivers to better use the money they receive, as is the focus in the
content of the Microfinance Opportunities/Freedom from Hunger Global Financial Education
Program.2 However, a number of countries have also started focusing on teaching the migrants
themselves more about the costs and details of different methods of remitting; including migrant
sending countries like the Philippines and Indonesia, and pilot programs for seasonal migrants
from the Pacific Islands working in New Zealand and Australia. However, to date there is no
rigorous evidence on the effectiveness of such programs.
This paper presents the results of a randomized experiment designed to measure the
impact of providing financial literacy training to migrants in New Zealand and Australia –
countries which had recently launched a remittance cost comparison website
(www.sendmoneypacific.org) for sending money to the Pacific Islands, and, in the case of New
Zealand, where regulatory reform had led to the introduction of new remitting methods. The
training taught migrants the different elements which make up the cost of sending remittances
and how to compare costs across methods, explained how different methods of remitting work
including alerting them to the presence of new methods, and also covered content on comparing
costs of different methods of short-term credit financing for immigrants. The experiment was
carried out on three different groups which had differing levels of existing education and
financial knowledge, and differing intensities of remitting. The first group was Pacific Island
migrants in New Zealand, who remitted relatively frequently and had relatively low education
and financial literacy at baseline. The second group was East Asian migrants in New Zealand,
who had low frequencies of remitting but relatively high education and financial literacy, and the
final group was Sri Lankan migrants in Melbourne, Australia, who remitted relatively frequently
and had relatively high education and financial literacy levels.
We find the training led to increases in financial knowledge of the Pacific Island and East
Asian migrants, but not of the Sri Lankans, which is consistent with such training being most
important for those with either low knowledge or low experience. This increased knowledge was
2 http://www.globalfinancialeducation.org/future.html#remittance.
4
coupled with changes in behavior, with Pacific Island and East Asian migrants being more likely
to use information to compare the costs of remitting across different methods, and the Pacific
Island sample being less likely to switch remitting channels to methods which were not
obviously better. However, we find no changes in the frequency of remitting, nor the amount
remitted. The Pacific Island training also contained information on the costs of different forms of
credit. This did not succeed in increasing use of credit cards from a low base, but did lead to an
increase in hire purchase loans during a period when they were a relatively good deal, and to
individuals setting up ROSCAs to avoid high interest payday loans. Unfortunately the
comparison of the Pacific Island group with the other two groups is hampered by the fact that
few of the East Asian sample regularly sent remittances, while attrition was high and unbalanced
by treatment status for the Sri Lankan sample. The results are thus cleanest for the sample the
content was developed for in the first place, the Pacific Island sample.
One implication of these results is that simply informing remitters about remittance costs,
which is a relatively cheap and uncontroversial intervention, will not necessarily lower average
costs from remitters switching to cheaper methods. Instead governments targeting reduced
average money transfer costs may need to address other barriers, which may include excessive
regulation and exclusive arrangements made by state-owned entities that deter new entry into
remittance corridors.3 Another implication is that the case for providing financial literacy
training for migrants needs to rest on other criteria than the financial savings from cheaper
remittances, such as the improvements in their capabilities from being more informed customers
and the potential savings from other aspects of financial management, such as choice of debt
levels and instruments.
The remainder of the paper is as follows: Section 2 provides the background to the
randomized experiment, in terms of the surveys and the financial literacy training that were
carried out and the context of the remittance corridors studied. In Section 3 the results of the
experiment are described, focusing on financial knowledge, information-seeking, remittance
3 For example, the New Zealand government-run bank with a mandate to serve low-income customers (KiwiBank) is
not active in providing a remittance product for migrants. One likely reason is that KiwiBank branches are all in Post
Offices, which already act as agents for an existing money transfer operator, Western Union.
5
frequency, amounts and methods, credit use, and qualitative evaluations from the study
participants. Section 4 contains the discussion and Section 5 the conclusions.
2. Background Context, the Sample, and the Financial Literacy Intervention
The cost of remitting money has fallen dramatically in a number of migration corridors over the
past 15 years due to increased competition, new product offerings, and the advent of price-
comparison websites. For example, Profeco, Mexico’s consumer protection agency, started
reporting weekly the cost of sending money from several cities in the U.S. to Mexico in 1998,
and Hernández-Coss (2005) reports that the cost of sending US$300 fell from approximately
US$32 in 1999 to US$12 by 2003, and by September 2011, one could send US$300 for $3.60
using Bank of America’s account to account or cash to cash products.4
Nevertheless, costs of sending money are still high when sending along other migration
corridors, with transfer costs between several African countries costing 15-20% on a US$200
transaction in 2011.5 This was also the context in work that we did examining remittance costs in
the Pacific in the mid-2000s, where we found the costs of sending money from New Zealand or
Australia to several Pacific Islands was in the range of 15-20% on a typical NZ$200 transaction
(Gibson et al, 2006, 2007; McKenzie 2007). This work also revealed that while costs were high
on average, there were lower cost possibilities available, such as the use of debit cards to make
ATM withdrawals, which were not being used, and that few migrants had heard of such methods.
Moreover, although a typical remittance transaction incurs both a fixed fee and an exchange rate
commission, the latter component was often opaque, leading to migrants often comparing
methods of remitting purely on the basis of the fixed fee component.
Spurred by these research findings, the New Zealand and Australian governments and
their aid agencies, along with the World Bank, worked to try and lower the costs of remitting in
the region. In New Zealand this resulted in a change in excessive anti-money laundering
regulations, thereby allowing banks to give migrants an ATM card for themselves and one for
their family back home without the bank having to verify the identity of the second card holder
in person. Westpac Bank was the first to release a new product under these revised regulations,
4 http://remittanceprices.worldbank.org/Country-Corridors/United-States/Mexico/ [accessed March 6, 2012].
5 http://remittanceprices.worldbank.org
6
with the Westpac Express pre-paid debit card targeted at migrants launched to positive reviews
(Stock, 2009). Secondly, these organizations launched a new website for both Australia and New
Zealand (www.sendmoneypacific.org), based on the successful sendmoneyhome website in the
U.K. This website provides detailed information on the cost of sending remittances from
Australia and New Zealand to the Pacific Islands by various channels, and is updated regularly.
However, despite the introduction of new products and a new information source, the
take-up of the Westpac Express product and the volume of transfers using it have not been as
high as hoped for (Pacific Islands Forum Secretariat, 2011). One plausible reason suggested for
this was lack of financial literacy. Only 12 percent of Pacific Island migrants in our sample had
heard of this card at baseline, and less than half of them had ever used any source of information
to compare the costs of sending money across different methods. Coupled with increasing policy
interest in providing financial education to migrants, we therefore decided to conduct a
randomized experiment to measure the impacts of doing so on financial knowledge and remitting
behavior of migrants.
2.1 The Sample
The Westpac Express card and sendmoneypacific were both designed for Pacific Island migrants
in New Zealand. However, to examine whether training which focuses on understanding how to
remit and to compare prices is also effective for other migrant groups, we decided to also
consider other migrant groups. Since migrants are a rare population, especially when one focuses
on migrants from specific countries, obtaining a representative sample can be prohibitively
expensive (McKenzie and Mistiaen, 2009). We therefore decided to recruit study participants
through intercept points where migrant populations are known to congregate, mimicking the
approach that would typically be used by policymakers and financial institutions trying to reach
migrant populations. This has the advantage of making our results relevant for the population
most likely to be the subject of financial literacy efforts, even if it does not allow measurement of
the impacts on migrants not found in these locations, who are typically less connected to their
home countries (and less likely to remit).
Our first group consists of Pacific Islanders living in urban areas in the upper North
Island of New Zealand. Approximately one-third of the recruitment was from attendees at a
7
Pacific cultural festival in Hamilton, which drew participants from up to 60 miles away
(including South Auckland, which has the largest concentration of Pacific immigrants). The
remainder was recruited from the main Pacific outdoor market (which operates every Saturday
morning) in South Auckland, and from churches in Auckland and Hamilton. The church-based
recruitment tended to bring in older participants whereas the cultural festival participants were
typically in their twenties. The Pacific Islanders were predominantly (three-quarters) from
Tonga, with the remainder born in Samoa, the Solomon Islands, Fiji, Australia and New Zealand.
In the Pacific Island community, even second-generation migrants send remittances due to the
on-going linkage with the extended families in the Islands (Lee, 2003) and so we did not rule out
any New Zealand- or Australian-born participants.
The second group was chosen to be the other main immigrant group in New Zealand,
East Asians. Chinese and Korean participants from Auckland (four-fifths of the total for the East
Asian group) were recruited from five different churches, located in North, West and Central
Auckland, and from a Tai Chi group and a Chinese health organization, both located in Northern
Auckland. The remaining Chinese participants were from Hamilton (60 miles south of
Auckland), where they were recruited from several churches and from pre-existing research
networks of the Chinese team leader (who was based in Hamilton). In no case did any one
church or locality contribute more than one-seventh of the sample. This sample was restricted to
first-generation migrants.
The final group in our study consists of first-generation Sri Lankan migrants in
Melbourne, Australia.6 They were recruited through snowball sampling. Initially, 20 people were
selected from various Sri Lankan organizations (both formal and informal) in Melbourne. These
organizations were selected to represent different demographic and economic groups, in terms of
length of time residing in Australia, method of migration (skilled, family reunification, and
student), education level, ethnicity (predominantly Sinhalese) and location in the greater
Melbourne urban area. Each individual from these organizations was asked to provide names and
contact details of five individuals who could be interviewed; out of the 100 potential participants
identified this way, 80 on the seed list agreed to participate in the baseline survey. In turn, when
6 We also planned a sample of Pacific Island migrants in Sydney, Australia, but the field leader in charge of this
process experienced health problems partway through the recruitment and training which led to this sample strata
being dropped from the study.
8
the interviews were conducted with these 80 people, they were asked to provide further referrals,
leading to another 129 people who were interviewed. Some of the participants who were
obtained through the second round of referrals were uncomfortable with the questions on
financial information and remittances, and refused to provide any contact addresses, which ruled
them out from being invited to the training or participating in the four follow-up surveys.
In order to ensure that the surveys and the financial literacy training were conducted in
the most effective and culturally appropriate way, we recruited individuals from these same
migrant populations to lead the field work for each of the component studies. In fact each of
these team leaders had a PhD, two in economics and one in psychology (but specializing in field
studies of migrants), and so the level of training and skill for the providers of the financial
literacy intervention is likely to be atypically high. Each of the team leaders recruited local
assistants who were individuals drawn from the same population groups that were being studied.
The questionnaires, powerpoint presentations and any written material handed out were available
in English, Mandarin and Korean for the participants in the East Asian group, and in English for
the Pacific and Sri Lankan groups (English is the language of schooling throughout the Pacific
and the Sri Lankan group are highly educated even if English was not their first language).
2.2 Baseline Survey, Randomization, and Financial Literacy Levels
Respondents were recruited in December 2010-January 2011 (Pacific Island sample), December
2010-February 2011 (East Asian sample) and January-March 2011 (Sri Lankan sample). The
resulting sample sizes were 349 Pacific Islanders, 352 East Asians, and 209 Sri Lankans. A
baseline questionnaire collected information on their use and awareness of different remittance
methods, their financial literacy, with specific emphasis on knowledge relevant to remittances
and use of financial instruments, and their background characteristics.
Within each of the three samples we formed eight strata, based on three baseline
characteristics: i) reported frequency of remitting (remitting at least every three months or not);
ii) knowledge of the saving in transactions costs from bundling two remittances of $100 into a
single remittance of $200; and iii) knowledge of which credit card user would face the highest
finance charges based on different repayment patterns. Individuals were then randomized by
9
computer into a treatment group, which was invited to financial literacy training, and a control
group, which was not.
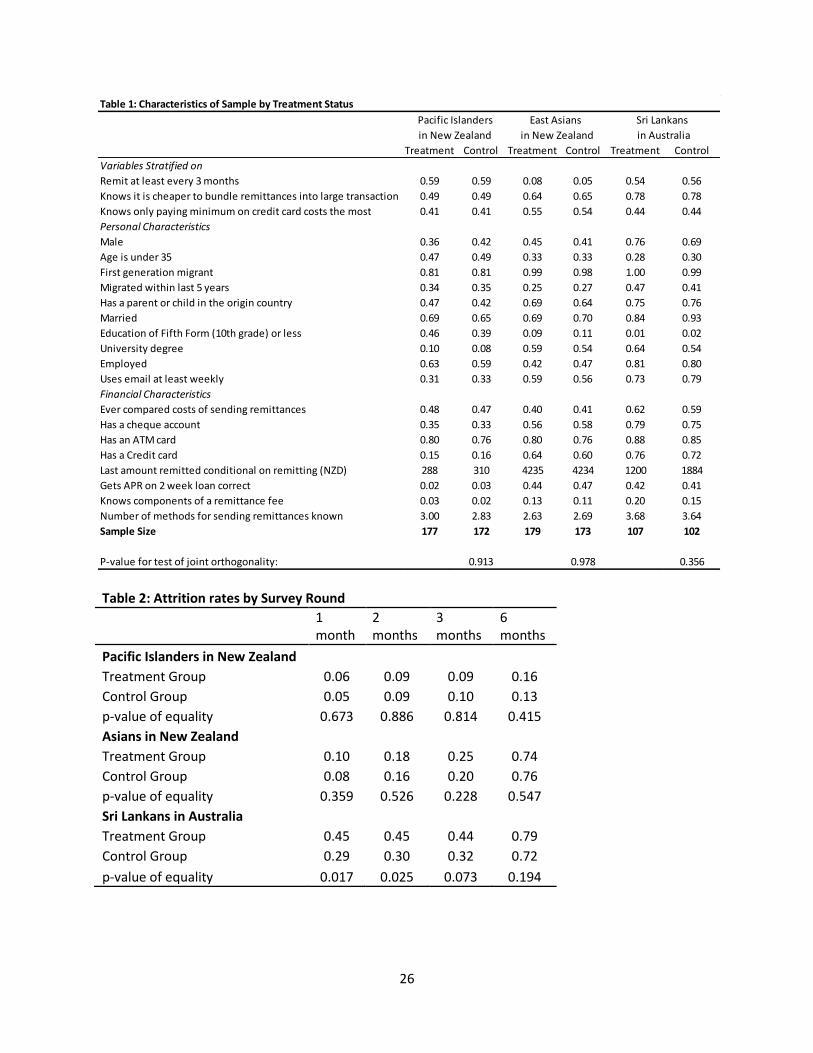
Table 1 displays the baseline characteristics of each of the three samples by treatment
status. For each sample an F-test cannot reject joint orthogonality, confirming that we did not get
an unlucky draw and that randomization succeeded in achieving balance on baseline
characteristics.
We see the three migrant groups differ from one another in a number of important ways.
The Pacific Island migrants are younger and less educated than the other groups, with almost half
aged under 35 and only 9 percent having a university degree. 39% are male, and just under half
have a parent or child in a Pacific Island home country. They are relatively frequent remitters,
with 59% remitting at least once every 3 months, with an mean remittance amount of NZ$299
(US$244) and median of NZ$200. The East Asian migrants are older, with only one-third under
35, and more settled, with only one-quarter having immigrated in the past 5 years. 43% are male
and 57% have university degrees. They are infrequent remitters, with only 6.5% remitting within
the past 3 months, despite 66% having a parent or child remaining in the home country. The few
remittances which do occur are for relatively large amounts, with a mean (median) of NZ$4235
(NZ$1000). The Sri Lankan migrants differ in being majority male (73%), and have the highest
education and employment rates, with 59% having university education. They are also relatively
frequent remitters, with 55% remitting at least every 3 months, and a mean (median) remittance
of NZ$1525 (NZ$675), with 75% having a parent or child remaining in Sri Lanka. These
differences across groups likely in part reflect the different immigration categories migrants
entered through: Pacific Islanders tend to immigrate to New Zealand through family
reunification and special concessionary migration quotas (McKenzie et al, 2010), whereas the
Asian migrants to New Zealand typically entered through points systems that reward skills and
wealth. The Sri Lankan migrants are typically individuals who entered Australia either as
students or as a result of civil conflict in Sri Lanka, qualifying under Australia’s points-based
migration system.
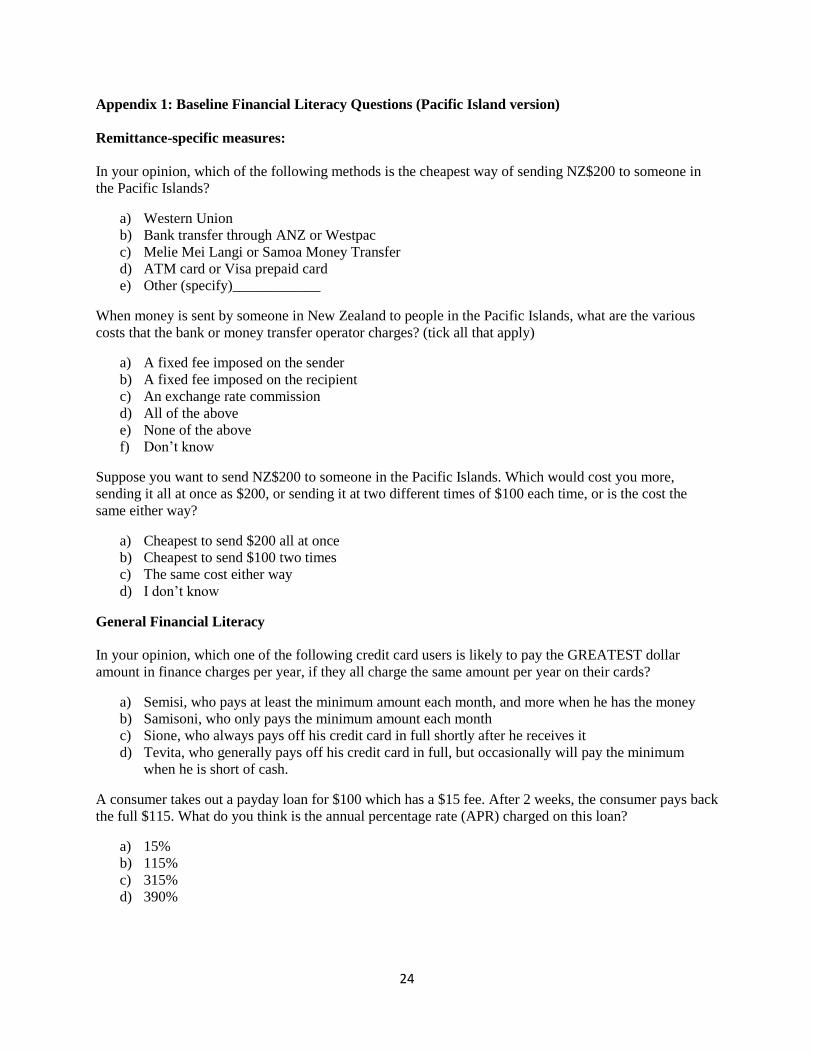
The baseline survey asked three questions to measure remittance-specific financial
literacy, as well as two questions on broader financial literacy related to credit (see Appendix 1).
10
Baseline financial literacy was lowest among the Pacific Island migrants: only 49% knew it was
cheaper to bundle remittances as a single transaction than to send separately (and pay the fixed
fee twice); only 5.7% knew that the prepaid ATM card was the cheapest method of remitting;
and only 3% knew that the remittance fee consists of an exchange rate commission and a fixed
fee. Knowledge of the available methods of remitting was also relatively low, as migrants were
asked whether they had heard of each of 10 different methods of sending money (e.g. Western
Union, Melie Mei Langi, Travellers Cheque, etc.) with the mean respondent having heard of only
three such methods. Financial literacy related to credit was also relatively low, with only 41%
knowing that someone who pays only the minimum payment would pay the most on credit card
fees, and only 3% were able to correctly calculate the APR on a two-week payday loan.
Baseline financial literacy rates were higher among the Sri Lankans and East Asians,
reflecting the much higher education levels and greater use of credit cards and cheque accounts.
65% of the East Asians and 78% of the Sri Lankans knew it was cheaper to bundle remittance
transactions and over 40% of both groups were able to correctly calculate the APR on a two-
week payday loan. However, knowledge of the components of a remittance fee was still low,
with only 12% of the East Asians and 18% of the Sri Lankans knowing the correct answer to this
question. As with the Pacific Islanders, these migrant groups only claimed to have heard of 3 or
4 possible ways of sending remittances out of a list of 10-12 methods.
2.3 Potential Savings from Greater Financial Literacy
The remittance methods available to the participants had transactions costs that ranged from
almost zero to over 15 percent for a typical transaction at the start of the intervention. The
greatest potential gains appear to be for the Pacific Island migrants in New Zealand, as a result of
substantial heterogeneity in costs and lower typical remittance amounts. For example, at
baseline, spending NZ$200 (the median transaction) to send money to Tonga (the main
destination) would attract transactions costs of 15 percent using a bank transfer, 11-12 percent
using either Western Union or MoneyGram, eight percent using the major indigenous money
transfer operator (Melie mei langi), or just five percent using the Westpac Express prepaid
remittance card. Moreover, one internet-only provider (KlickEx) had transactions costs of less
than one percent, although no participants had ever used this method. Since the most common
11
methods used were Western Union and Melie Mei Langi, bundling two transactions into one
would save the fixed fee of NZ$8-14, while switching from one of these methods to the Westpac
Express Card would save NZ$6-12 per $200 transaction.
There was less variation in costs for the East Asians in New Zealand, and with few
migrants remitting, less potential gains to be had. For money transfers to China, the transactions
costs for sending NZ$200 varied between 14 percent for both Western Union and the most
expensive indigenous money transfer operator (Global FX) and 10 percent using the cheapest
MTO (Convergence Group). Some of the Chinese money transfer operators would only transfer
a minimum of NZ$1000, for which the transactions costs were as low as 3 percent. Since the cost
of remitting falls as a percentage of the amount remitted due to the fixed fee component, and the
median amount remitted for the few East Asian migrants who were remitting was NZ$1000 at
baseline, the percentage cost of remitting ranged from 3-6 percent.
For the Sri Lankan participants in Australia, spending $200 on a remittance would attract
transactions costs of 16 percent using a bank transfer, 9 percent using Western Union, 5 percent
using MoneyGram and just 3 percent using any of the cheapest indigenous money transfer
operators (FastCash, Remittance Plus or Serandib). For their median remittance amount of
A$500 (NZ$675), the transaction costs would range from 11 percent using a bank transfer, 5-6
percent using Moneygram or Western Union, 4 percent using Kapruka, and 3 percent using
FastCash, Remittance Plus or Serandib. One money transfer operator who began after the
intervention started, Cash Express, had costs for a A$500 remittance of just 2 percent. Since the
most common methods at baseline were Kapruka and FastCash, there were relatively limited
gains to be had from switching providers for this sample.
2.4 The Financial Literacy Intervention
The financial literacy training content was originally developed by the authors in collaboration
with the Ministry of Pacific Island Affairs and piloted on a Pacific Islands population in 2009.
The material begins with a discussion of the different reasons people remit, and the different
factors that enter into the choice of method of remitting, such as cost, speed, convenience to the
sender and to the receiver, familiarity, trust, and other services also offered by the financial
provider. The main focus is then on understanding the components of remittance costs, teaching
12
strategies for reducing these costs, and highlighting sources of information for comparing costs
and learning about new remittance products. This included explaining the fixed fee and exchange
rate commission components of the cost and illustrating how much they vary across different
providers, showing how the transaction costs fall with the amount sent so that bundling smaller
transactions into one large transaction saves costs, and providing information about the
sendmoneypacific website for comparing costs and about the new Westpac direct debit card as a
new product.
The remittance material was then adapted for the East Asian and Sri Lankan populations.
Since sendmoneypacific doesn’t cover remittance transactions for these remittance corridors,
both groups were given instructions and shown how to get rates and the expected amount
received on the Western Union website, plus ANZ Bank online and fxcompared.com for the Sri
Lankans, and MoneyBookers for the East Asians in New Zealand.
Initially we had planned that the financial literacy training would focus just on
remittances, but inspection of the baseline survey data from the Pacific Island group indicated
that very few of the participants had credit cards, and a lack of awareness of this credit channel
was corroborated by qualitative discussions with participants. For the Pacific Island group only,
we therefore expanded the material covered in the financial literacy training to also include
comparisons of sources of credit, especially in terms of their annual percentage rate of interest.
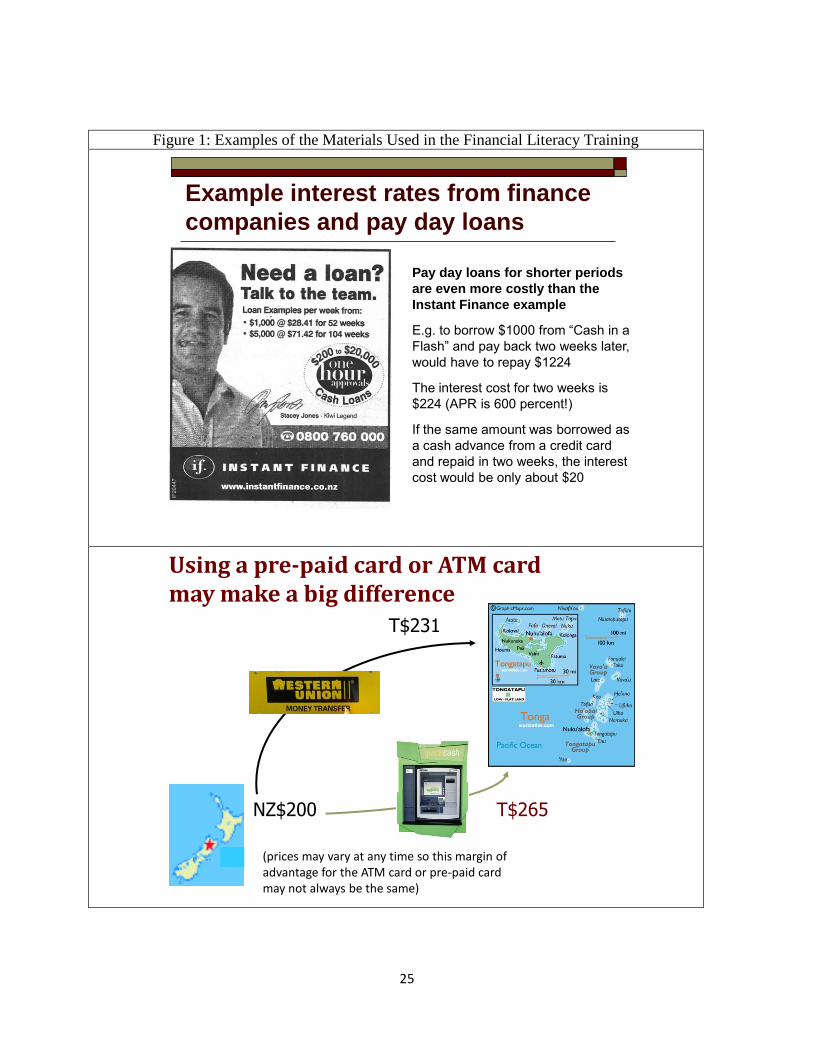
The teaching material was based on examples of advertisements for payday lenders and other
short term finance companies that used prominent sports stars to target Pacific Islanders (e.g.
Figure 1a). The participants were taught how to calculate credit interest rates so that they could
compare the annual cost of a payday or short-term loan or hire purchase with the cost of
obtaining the same funds either as a cash advance or a purchase with a credit card.
The randomly chosen survey respondents were then invited to the financial literacy
training sessions, which were held at multiple times and venues to ensure the maximum
participation from those who were invited. These were typically held at churches, community
centers, and sports clubs and were usually for groups of about 30 at a time and took about two
hours. In addition to a presentation of about 25 powerpoint slides, written material was handed
out and there was use of worked examples and continuous discussion with the community. As
13
noted above, the presenters were all members of the immigrant groups themselves, to break
down any cross-cultural communication barriers. It was emphasized that the aim of the training
was to not advocate for any one particular remittance provider but instead aimed to help the
participants become more informed consumers who could shop around for better remittance
deals (see Figure 1b as an example).
The attendance rate for the training session was 148/177 for the Pacific Island treatment
group (84%), while 3 of the control group also attended (1.7%), accompanying friends in the
treatment group. For the East Asian migrants, attendance was 112/179 (63%) in the treatment
group, with 26/173 (15%) of the control group attending, who were friends from the same
churches as treatment group participants. Among the Sri Lankans, the attendance rate was
60/107 (56%) for the treatment group, and none from the control group. All analysis will be
based on intent-to-treat effects, using the random assignment to be invited to training.
2.5 Follow-up Surveys
At the end of each of the following 3 months after the financial literacy training, all respondents
from the baseline survey were given a short follow-up survey on their remittance activity during
the past month along with questions on major financial actions taken during the previous month,
such as applying for a credit card. In addition, the one month survey also asked several financial
literacy questions in order to measure whether financial knowledge had increased with the
literacy training. Six months after training, all participants from both the treatment and control
groups were invited back to community forums. A final round follow-up survey was conducted
at the start of this forum, after which both treatment and control were given information on the
main messages of the training course and information on new products and developments in the
market that had occurred since the original intervention.
Table 2 shows the attrition rates by survey round and ethnic group sample. Attrition rates
are lowest for the Pacific Island sample, averaging 5 percent at 1 month, 9-10 percent at 2 and 3
months, and 14 percent at 6 months. In no survey round can we reject balance between treatment
and control groups. The East Asian sample has attrition rates of 9 percent at 1 month, 17 percent
at 2 months, 23 percent at 3 months, and then 75 percent at 6 months, again balanced by
treatment status. The Sri Lankan group had the highest attrition, with 45 percent of the treatment
14
group already attriting by month 1 compared to 29 percent of the control group, and 76 percent
attrition in the 6 month follow-up. The high attrition was attributed by the survey leader to
refusals to give contact details by some participants, along with discomfort discussing financial
matters by some of the sample, which the invitation to the training may have exacerbated. Sri
Lankans with lower education levels and with lower baseline financial literacy were more likely
to attrit, although this differential attrition did not vary with treatment status. Despite the use of
door prizes and gifts to their community groups, the 6 month attrition was so high in the East
Asian and Sri Lankan groups since these surveys were done in the community events, which had
very low attendance for this group.7 We therefore do not use the 6 month survey data for these
two samples. Given these attrition rates, we view the evidence as most reliable for the Pacific
Island group, and for the short-term outcomes for the East Asians.
3. Results
To estimate the impact of financial literacy training on different outcomes of interest, we
estimate the following equation:
(1)
where Treati is a dummy variable indicating assignment to treatment, and we control for the
lagged outcome variable where possible (McKenzie, 2011) and dummy variables, di,s for
randomization strata (Bruhn and McKenzie, 2009) in order to maximize power. Robust (White-
corrected) standard errors are reported in parentheses under the coefficients in the tables.
3.1 Impact on Financial Knowledge
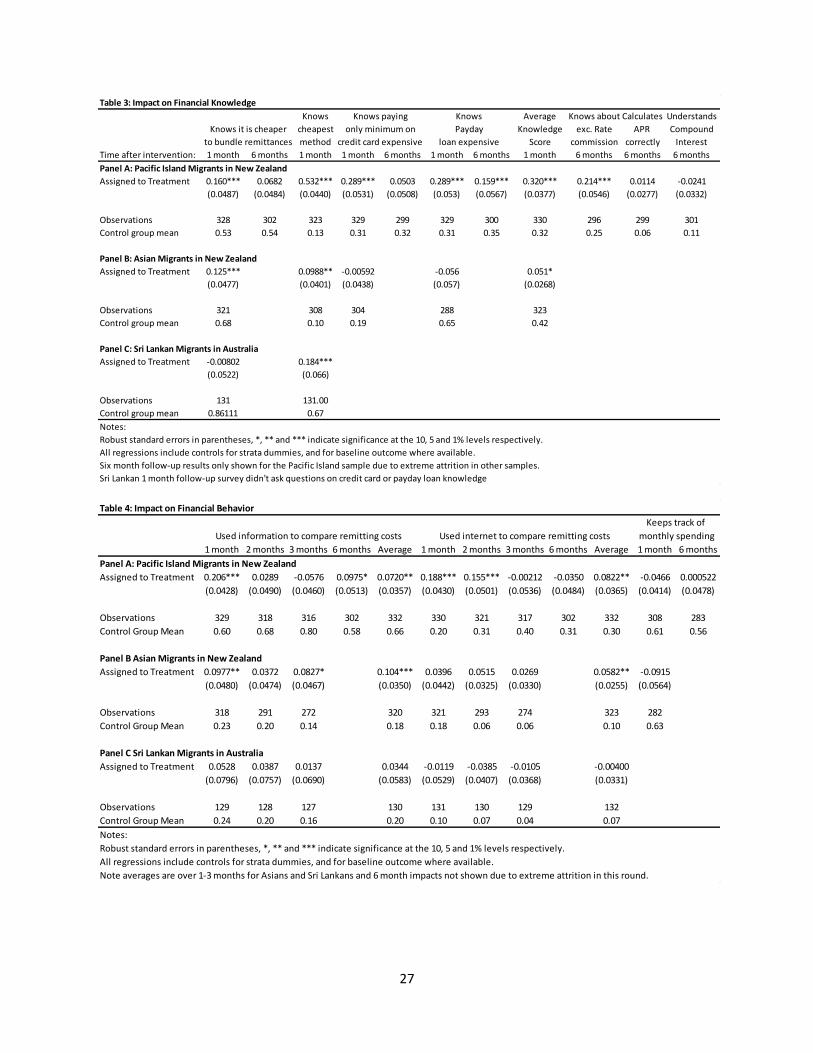
Table 3 examines whether the financial literacy training succeeds in increasing the knowledge
migrants have about the costs of remitting and of using credit. We see large short-term impacts
on financial knowledge for the Pacific Island sample – they are 16 percentage points more likely
to know it is cheaper to bundle remittances into a larger transaction, 52 percentage points more
likely to know the ATM/prepaid debit card is the cheapest method of remitting amongst the
options asked about, 29 percentage points more likely to know that only paying the minimum on
7 The average value of gifts given to individuals (or the groups they represented) as a thank you for being involved
and as incentives such as door prizes was US$40 per participant. This incentive design plus all aspects of the study
had received prior ethical approval from the Waikato Management School human ethics committee.
15
a credit card is more expensive than paying more than the minimum, and 29 percentage points
more likely to know that payday loans are more expensive than credit cards or hire purchase. All
of these impacts are significant at the 1 percent level, so as a result, the average knowledge score,
which is a mean of these four questions, also shows a positive and significant effect. There is
some suggestion of a decline in this knowledge on several questions at the 6 month follow-up
survey, but even at 6 months migrants who were assigned to training are more likely to
understand the exchange rate commission and to know that payday loans are more expensive
than credit cards or hire purchase. Consistent with other studies of financial literacy (Carpena et
al, 2011), we find no impact on computational measures of financial literacy such as the ability
to correctly calculate the APR on a payday loan or to understand compound interest (which was
not taught in the course).
We also see some increases in financial knowledge about remittances for the other two
groups: East Asian migrants are 12 percentage points more likely to know that it is cheaper to
bundle remittances into a larger transaction, and 10 percentage points more likely to know the
cheapest method for remitting. Sri Lankan migrants saw an increase in knowledge of the
cheapest method, but no increase (from a high base) in knowledge on remittance bundling. The
Sri Lankan results should be caveated by the high and differential attrition rates. Recall that
credit issues were not covered in the financial literacy training for the other two groups.
Consistent with this, we find no increase in knowledge about credit among the East Asians (and
the questions weren’t asked in the Sri Lankan sample).
3.2 Impact on Information Seeking and Budgeting
Our follow-up surveys asked each month whether respondents had used any source of
information to compare the costs of remitting across methods or products, and if so, what
information source they had used. Since our intervention focused on the use of several internet
comparison sites, we are particularly interested in whether participants use the internet more to
compare remitting costs as a result of the intervention. Finally, our surveys at 1 month and 6
months also asked whether individuals always keep track of how much they spend each month.
The financial literacy course made no mention of doing this, and we would thus not expect to see
16
effects. It therefore serves as a check on reporting bias, to ensure that individuals who attended
training are not just reporting that they do more of every perceived desirable financial behavior.
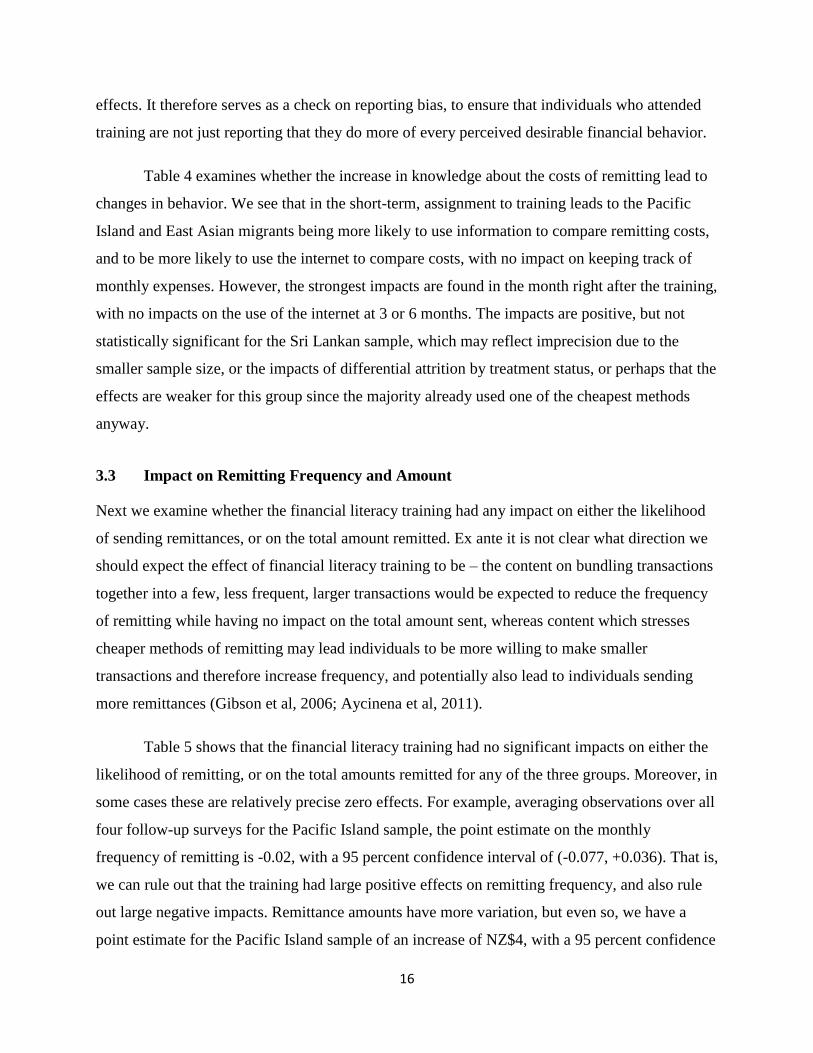
Table 4 examines whether the increase in knowledge about the costs of remitting lead to
changes in behavior. We see that in the short-term, assignment to training leads to the Pacific
Island and East Asian migrants being more likely to use information to compare remitting costs,
and to be more likely to use the internet to compare costs, with no impact on keeping track of
monthly expenses. However, the strongest impacts are found in the month right after the training,
with no impacts on the use of the internet at 3 or 6 months. The impacts are positive, but not
statistically significant for the Sri Lankan sample, which may reflect imprecision due to the
smaller sample size, or the impacts of differential attrition by treatment status, or perhaps that the
effects are weaker for this group since the majority already used one of the cheapest methods
anyway.
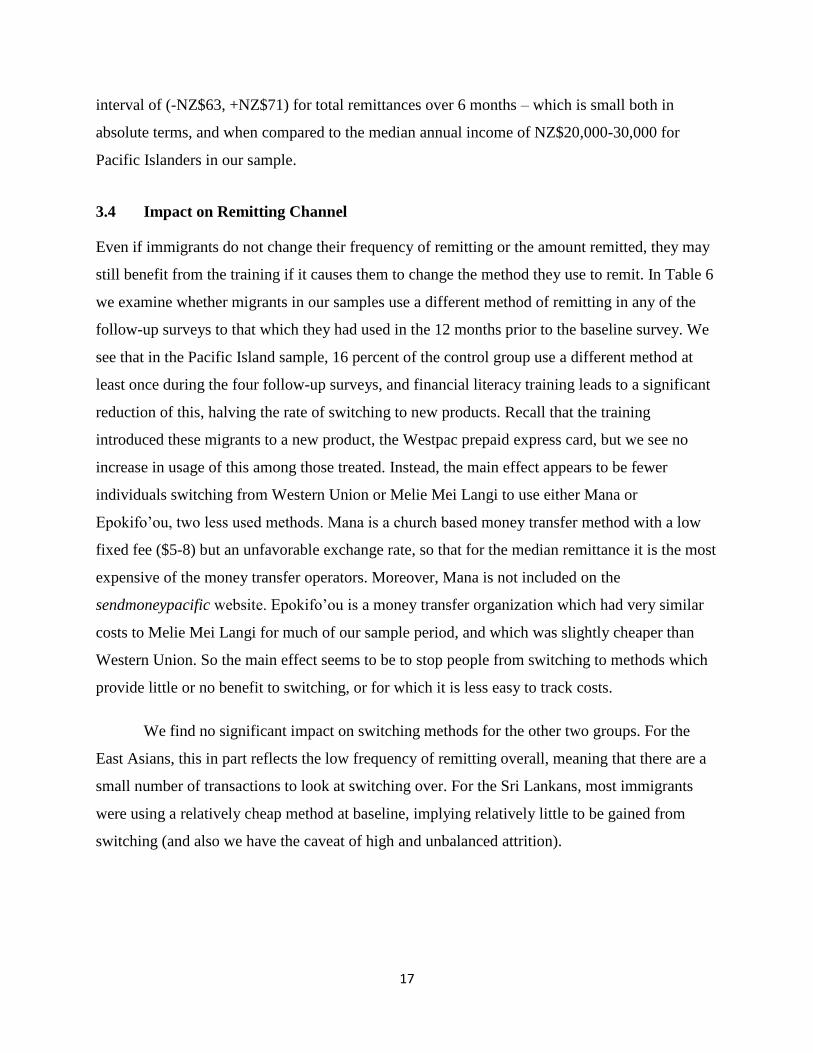
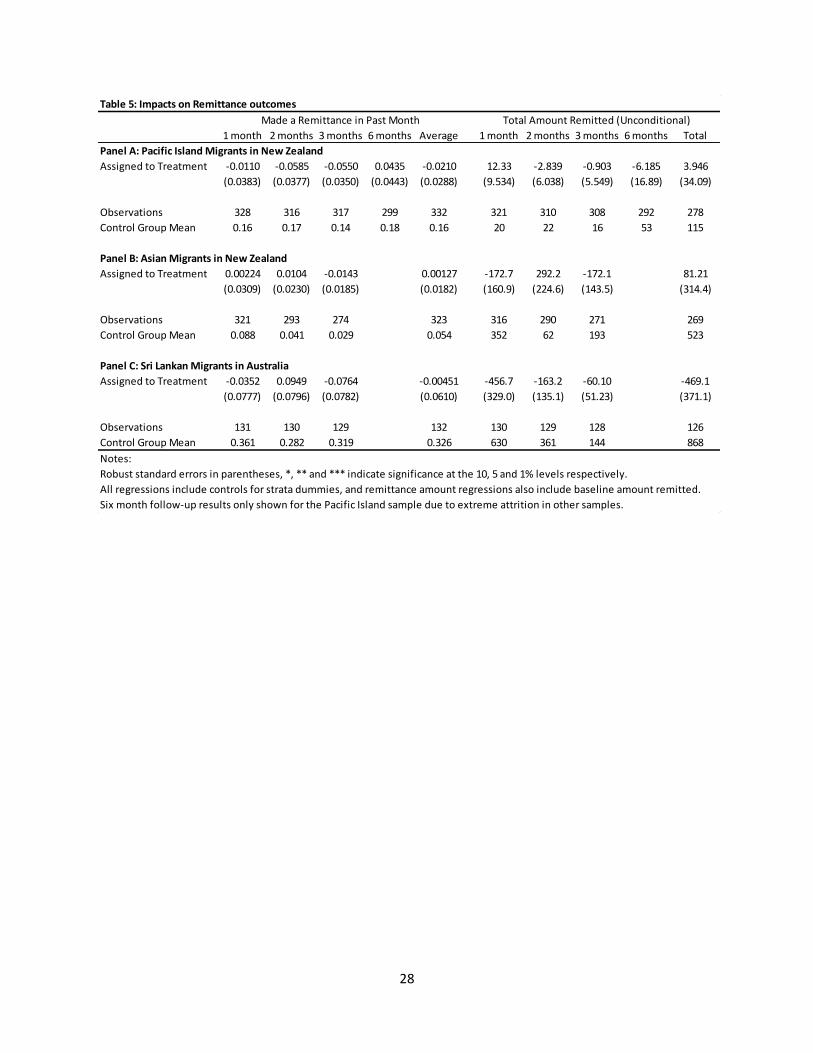
3.3 Impact on Remitting Frequency and Amount
Next we examine whether the financial literacy training had any impact on either the likelihood
of sending remittances, or on the total amount remitted. Ex ante it is not clear what direction we
should expect the effect of financial literacy training to be – the content on bundling transactions
together into a few, less frequent, larger transactions would be expected to reduce the frequency
of remitting while having no impact on the total amount sent, whereas content which stresses
cheaper methods of remitting may lead individuals to be more willing to make smaller
transactions and therefore increase frequency, and potentially also lead to individuals sending
more remittances (Gibson et al, 2006; Aycinena et al, 2011).
Table 5 shows that the financial literacy training had no significant impacts on either the
likelihood of remitting, or on the total amounts remitted for any of the three groups. Moreover, in
some cases these are relatively precise zero effects. For example, averaging observations over all
four follow-up surveys for the Pacific Island sample, the point estimate on the monthly
frequency of remitting is -0.02, with a 95 percent confidence interval of (-0.077, +0.036). That is,
we can rule out that the training had large positive effects on remitting frequency, and also rule
out large negative impacts. Remittance amounts have more variation, but even so, we have a
point estimate for the Pacific Island sample of an increase of NZ$4, with a 95 percent confidence
17
interval of (-NZ$63, +NZ$71) for total remittances over 6 months – which is small both in
absolute terms, and when compared to the median annual income of NZ$20,000-30,000 for
Pacific Islanders in our sample.
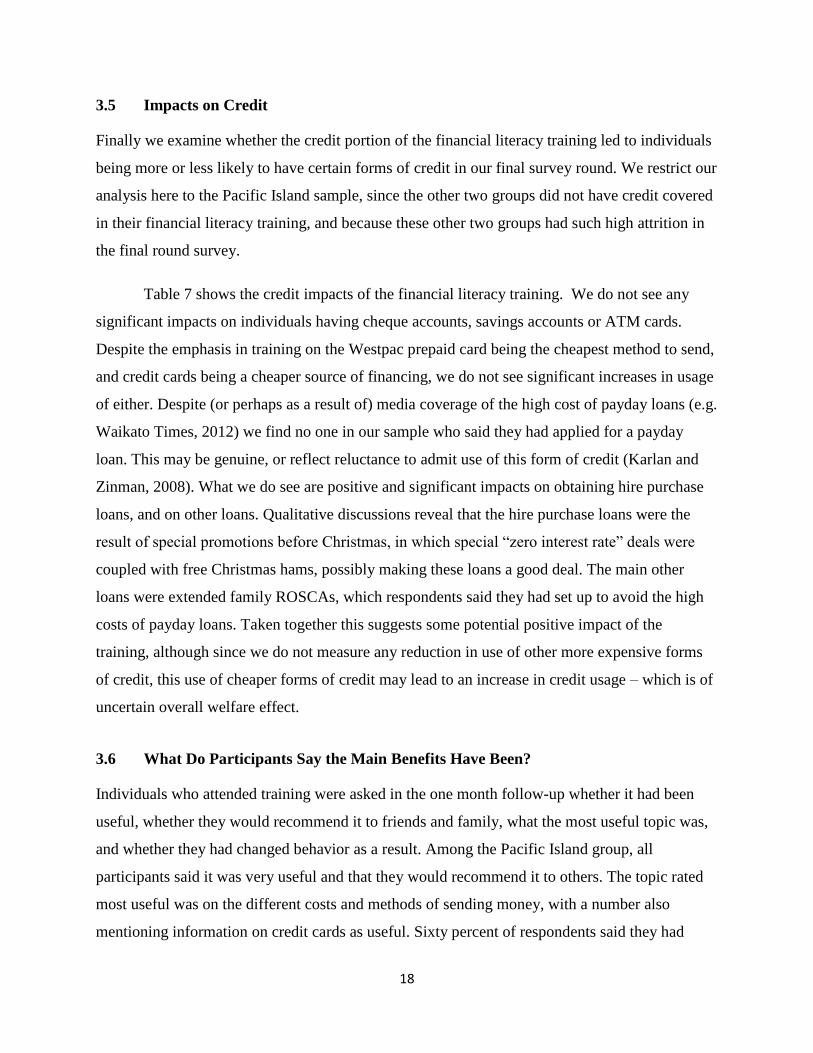
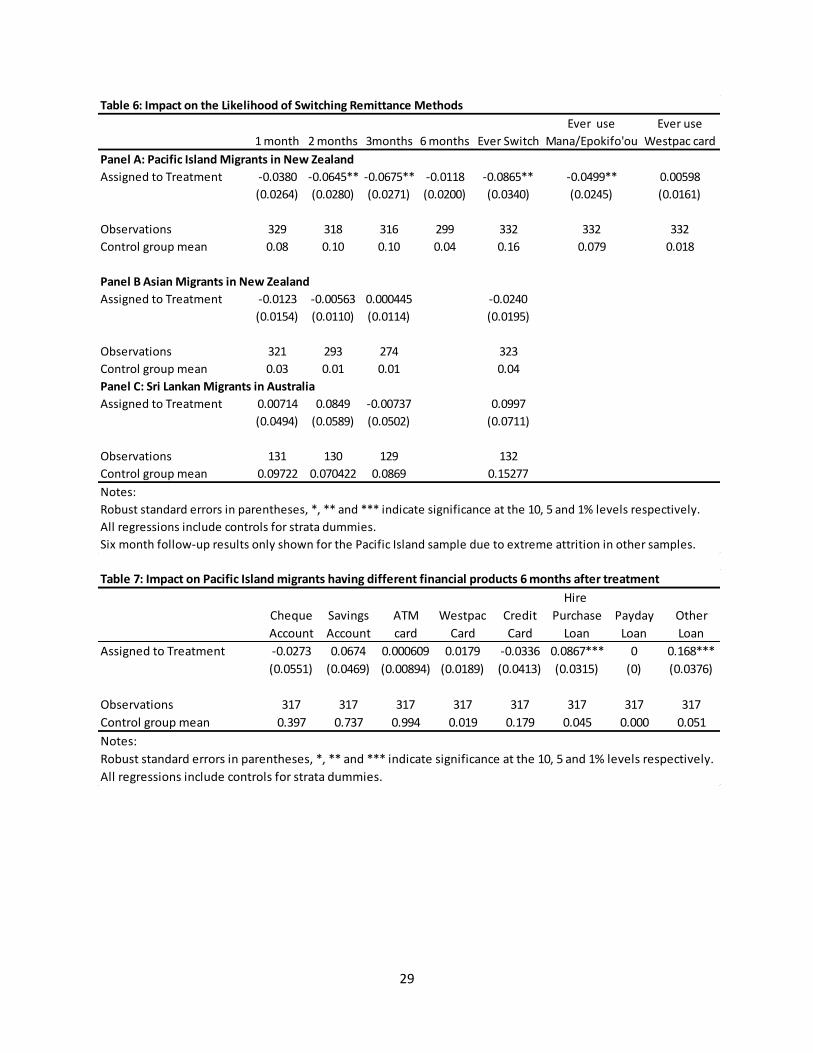
3.4 Impact on Remitting Channel
Even if immigrants do not change their frequency of remitting or the amount remitted, they may
still benefit from the training if it causes them to change the method they use to remit. In Table 6
we examine whether migrants in our samples use a different method of remitting in any of the
follow-up surveys to that which they had used in the 12 months prior to the baseline survey. We
see that in the Pacific Island sample, 16 percent of the control group use a different method at
least once during the four follow-up surveys, and financial literacy training leads to a significant
reduction of this, halving the rate of switching to new products. Recall that the training
introduced these migrants to a new product, the Westpac prepaid express card, but we see no
increase in usage of this among those treated. Instead, the main effect appears to be fewer
individuals switching from Western Union or Melie Mei Langi to use either Mana or
Epokifo’ou, two less used methods. Mana is a church based money transfer method with a low
fixed fee ($5-8) but an unfavorable exchange rate, so that for the median remittance it is the most
expensive of the money transfer operators. Moreover, Mana is not included on the
sendmoneypacific website. Epokifo’ou is a money transfer organization which had very similar
costs to Melie Mei Langi for much of our sample period, and which was slightly cheaper than
Western Union. So the main effect seems to be to stop people from switching to methods which
provide little or no benefit to switching, or for which it is less easy to track costs.
We find no significant impact on switching methods for the other two groups. For the
East Asians, this in part reflects the low frequency of remitting overall, meaning that there are a
small number of transactions to look at switching over. For the Sri Lankans, most immigrants
were using a relatively cheap method at baseline, implying relatively little to be gained from
switching (and also we have the caveat of high and unbalanced attrition).
18
3.5 Impacts on Credit
Finally we examine whether the credit portion of the financial literacy training led to individuals
being more or less likely to have certain forms of credit in our final survey round. We restrict our
analysis here to the Pacific Island sample, since the other two groups did not have credit covered
in their financial literacy training, and because these other two groups had such high attrition in
the final round survey.
Table 7 shows the credit impacts of the financial literacy training. We do not see any
significant impacts on individuals having cheque accounts, savings accounts or ATM cards.
Despite the emphasis in training on the Westpac prepaid card being the cheapest method to send,
and credit cards being a cheaper source of financing, we do not see significant increases in usage
of either. Despite (or perhaps as a result of) media coverage of the high cost of payday loans (e.g.
Waikato Times, 2012) we find no one in our sample who said they had applied for a payday
loan. This may be genuine, or reflect reluctance to admit use of this form of credit (Karlan and
Zinman, 2008). What we do see are positive and significant impacts on obtaining hire purchase
loans, and on other loans. Qualitative discussions reveal that the hire purchase loans were the
result of special promotions before Christmas, in which special “zero interest rate” deals were
coupled with free Christmas hams, possibly making these loans a good deal. The main other
loans were extended family ROSCAs, which respondents said they had set up to avoid the high
costs of payday loans. Taken together this suggests some potential positive impact of the
training, although since we do not measure any reduction in use of other more expensive forms
of credit, this use of cheaper forms of credit may lead to an increase in credit usage – which is of
uncertain overall welfare effect.
3.6 What Do Participants Say the Main Benefits Have Been?
Individuals who attended training were asked in the one month follow-up whether it had been
useful, whether they would recommend it to friends and family, what the most useful topic was,
and whether they had changed behavior as a result. Among the Pacific Island group, all
participants said it was very useful and that they would recommend it to others. The topic rated
most useful was on the different costs and methods of sending money, with a number also
mentioning information on credit cards as useful. Sixty percent of respondents said they had
19
changed behavior as a result, with the main change being the use of the website to compare
costs, and asking around for better rates. For the East Asians, 80 percent of those attending said it
was useful and 75 percent would recommend it to others, with the most useful knowledge being
about remittance fees. Only 21 percent said they had changed behavior, mostly in terms of
examining the costs of sending money. Among the Sri Lankan sample, 91 percent of those
answering the follow-up survey said the training had been useful, but only 2 people in the Sri
Lankan sample who had attended training said they had changed their behavior as a result. These
direct reports are therefore consistent with the empirical results, suggesting that there was a
knowledge increase, and some changes in information seeking behavior for the Pacific Island
group in particular, but no big changes in remitting behavior.
4. Discussion
The training did succeed in increasing financial knowledge about the components of remittance
costs, and in getting people to search for more information about the costs of sending money. It
was fairly cheap to deliver – courses were typically taught in churches or other community
spaces, and once the content was developed, the main costs were the time of the trainer, and
snacks and refreshments for those attending – for an approximate cost of NZ$20-30 per attendee.
Given these low costs, the benefits observed in knowledge and behavior may be enough to
justify providing this course.
Nonetheless, despite the emphasis on the Westpac prepaid debit card as the lowest cost of
remitting, and credit cards as a low cost of obtaining credit for the Pacific Island sample, we do
not see any impact on these outcomes. The final round survey asked people why they were not
using the cheapest method of remitting, and 41 percent replied that another method was more
convenient for them, and 55 percent that another method was more convenient for the receiver.
The latter is consistent with Gibson et al. (2007), who show the geographic spread of ATM
facilities in Tonga covers a lower share of the population than Western Union offices. Further
evidence of the lack of take-up of low cost technologies in the Pacific Islands comes from two
other methods: the internet-only money transfer operator KlickEx had the lowest costs overall but
was unused by participants throughout our study, and in October 2011, KlickEx linked with a
major mobile phone provider, Digicel, to offer remittance transfers into a mobile wallet in
20
Tonga, Samoa or Fiji which could then be withdrawn as cash, again at very low transaction
costs. To date this new method seems to have very low take-up.
One reason that convenience may win out is that the amounts saved through better
financial literacy may just be too trivial to warrant action. This is especially the case for the East
Asians (who tend not to remit that much, and when they do, remit large amounts), and the Sri
Lankans (who were using cheap methods to start with). But even for the Pacific Island sample,
the savings from switching to one of these cheapest methods might amount to NZ$6-12 per $200
transaction, which may only merit the costs of learning a new method and trying it out if people
remit very frequently. Given that the baseline survey revealed an average frequency of remitting
for the Pacific Island sample of five times per year, the annual saving from switching to the
cheapest methods is just NZ$30-60. The scope for changes in ultimate outcomes may be greater
for financial literacy transactions which focus more on savings and budgeting behavior, or those
which allow people at risk of obtaining expensive credit to avoid very expensive loans (e.g.
Bertrand and Morse, 2011).
5. Conclusions
Our results show that simple financial education training for migrants can change their
knowledge about the costs of remitting and lead them to look around more at prices. There is
also some suggestive evidence from the Pacific Island sample that coupling this with information
on different sources of credit may help migrants to avoid some of the most expensive forms of
credit. Nevertheless, we find no big changes in ultimate outcomes – migrants avoid switching to
more expensive or less transparent remittance channels, but do not change the amount or
frequency of remitting.
Thus despite simply informing remitters about remittance costs being a relatively cheap
and uncontroversial intervention, it will not necessarily lower average costs from remitters
switching to cheaper methods. Instead governments targeting reduced average money transfer
costs may need to address other barriers, which may include excessive regulation and exclusive
arrangements made by state-owned entities that deter new entry into remittance corridors, and
barriers to access of financial access on the receiving country side. It is also possible that the
mere process of providing transparent information on the costs of remitting by different methods
21
will lower costs through competition, without migrants needing to switch providers. For
example, transfer fees from New Zealand to the Pacific Islands have fallen since the launch of
sendmoneypacific, although how much can be attributable to the website rather than other market
events is an open research question.
As far as financial education itself though, a further implication of this work is that the
case for providing financial literacy training for migrants needs to rest on other criteria than the
financial savings from cheaper remittances, such as the improvements in their capabilities from
being more informed customers, and the potential savings from other aspects of financial
management, such as choice of debt levels and instruments. Experimenting further with adding
additional content on budgeting, saving, and debt management seem fruitful areas for policy
refinement in this area.
22
References
Aycinena, Diego, Claudia Martinez and Dean Yang. 2011 “The impact of remittance fees on
remittance flows: Evidence from a field experiment among Salvadorean migrants”,
Mimeo. University of Michigan.
Bertrand, Marianne and Adair Morse 2011. “Information disclosure, cognitive biases, and
payday borrowing”, Journal of Finance, 66(6): 1865-93.
Bruhn, Miriam and David McKenzie. 2009. “In Pursuit of Balance: Randomization in Practice in
Development Field Experiments”, American Economic Journal: Applied Economics,
1(4): 200-23.
Carpena, Fenella, Shawn Cole, Jeremy Shapiro and Bilal Zia. 2011. “Unpacking the causal chain
of financial literacy”, World Bank Policy Research Working Paper no. 5798.
Clemens, Michael A., Claudio E. Montenegro, and Lant Pritchett. 2009. “The Place Premium:
Wage Differences for Identical Workers Across the U.S. Border.” Center for Global
Development Working Paper 148.
Gibson, John, Geua Boe-Gibson, David J. McKenzie, and Halahingano Rohorua. 2007 “Efficient
Remittance Services for Development in the Pacific” Asia-Pacific Development Journal,
14(2):55-74.
Gibson, John, David J. McKenzie, and Halahingano Rohorua 2006. “How cost elastic are
remittances? Evidence from Tongan migrants in New Zealand” Pacific Economic
Bulletin 21(1): 112-28.
Gibson, John, David McKenzie, and Steven Stillman. 2011. “Accounting for Selectivity and
Duration-Dependent Heterogeneity When Estimating the Impact of Emigration on
Incomes and Poverty in Sending Areas.” Economic Development and Cultural Change,
forthcoming.
Hernández-Coss, Raúl 2005. “The U.S.-Mexico Remittance Corridor: Lessons on shifting from
informal to formal transfer systems”, World Bank Working Paper No. 47.
Karlan, Dean and Jonathan Zinman. 2008. “Lying about borrowing”, Journal of the European
Economic Association 6(2-3): 510-21.
Lee, Helen 2003. Tongans Overseas: Between two shores. University of Hawaii Press, Honolulu,
HI.
Lutheran Immigration and Refugee Service (LIRS) (undated) Financial Literacy for Newcomers:
weaving immigrant needs into financial education.
http://www.refugeeworks.org/downloads/rw_financial_literacy.pdf [accessed March 5,
2012]
23
McKenzie, David 2007. “Remittances in the Pacific”, pp. 99-121 in Susan Pozo (ed.) Immigrants
and their International Money Flows, W.E. Upjohn Institute for Employment Research:
Kalamazoo, MI.
McKenzie, David 2011. “Beyond baseline and follow-up: The case for more T in experiments”,
Journal of Development Economics, forthcoming
McKenzie, David, John Gibson, and Steven Stillman. 2010. “How Important is Selection?
Experimental vs Non-experimental Measures of the Income Gains from Migration.”
Journal of the European Economic Association, 8(4): 913-45.
McKenzie, David and Johan Mistiaen. 2009. “Surveying migrant households: A comparison of
Census-based, snowball, and intercept surveys”, Journal of the Royal Statistical Society,
Series A 172(2): 339-60.
Pacific Islands Forum Secretariat 2011. “Regional Remittance Issues”, Paper 4 for the Forum
Economic Minister’s Meeting in Apia, Samoa on 20-21 July,
http://www.forumsec.org/resources/uploads/attachments/documents/2011FEMM_FEMS.
06.pdf [accessed March 6, 2012].
Stock, Rob. 2009. “Remittance card shows bank’s other face”, Sunday Star Times, 9 August,
2009, p.A6.
Waikato Times 2012. “Payday loans cost kiwis big premium”, 5 March,
http://www.stuff.co.nz/waikato-times/news/6523093/Payday-loans-cost-Kiwis-big-
premium
World Bank (2006) Global Economic Prospects 2006: Economic Implications of Remittances
and Migration. World Bank: Washington, D.C.
Yang, Dean. 2008. “International Migration, Remittances, and Household Investment: Evidence
from Philippine Migrants’ Exchange Rate Shocks.” The Economic Journal, 118: 591-
630.
Yang, Dean and Claudia Martinez A., 2005. “Remittances and Poverty in Migrants’ Home
Areas: Evidence from the Philippines” in Caglar Ozden and Maurice Schiff, eds.,
International Migration, Remittances, and the Brain Drain, World Bank, Washington,
D.C.
24
Appendix 1: Baseline Financial Literacy Questions (Pacific Island version)
Remittance-specific measures:
In your opinion, which of the following methods is the cheapest way of sending NZ$200 to someone in
the Pacific Islands?
a) Western Union
b) Bank transfer through ANZ or Westpac
c) Melie Mei Langi or Samoa Money Transfer
d) ATM card or Visa prepaid card
e) Other (specify)____________
When money is sent by someone in New Zealand to people in the Pacific Islands, what are the various
costs that the bank or money transfer operator charges? (tick all that apply)
a) A fixed fee imposed on the sender
b) A fixed fee imposed on the recipient
c) An exchange rate commission
d) All of the above
e) None of the above
f) Don’t know
Suppose you want to send NZ$200 to someone in the Pacific Islands. Which would cost you more,
sending it all at once as $200, or sending it at two different times of $100 each time, or is the cost the
same either way?
a) Cheapest to send $200 all at once
b) Cheapest to send $100 two times
c) The same cost either way
d) I don’t know
General Financial Literacy
In your opinion, which one of the following credit card users is likely to pay the GREATEST dollar
amount in finance charges per year, if they all charge the same amount per year on their cards?
a) Semisi, who pays at least the minimum amount each month, and more when he has the money
b) Samisoni, who only pays the minimum amount each month
c) Sione, who always pays off his credit card in full shortly after he receives it
d) Tevita, who generally pays off his credit card in full, but occasionally will pay the minimum
when he is short of cash.
A consumer takes out a payday loan for $100 which has a $15 fee. After 2 weeks, the consumer pays back
the full $115. What do you think is the annual percentage rate (APR) charged on this loan?
a) 15%
b) 115%
c) 315%
d) 390%
25
Figure 1: Examples of the Materials Used in the Financial Literacy Training
Example interest rates from finance
companies and pay day loans
Pay day loans for shorter periods
are even more costly than the
Instant Finance example
E.g. to borrow $1000 from “Cash in a
Flash” and pay back two weeks later,
would have to repay $1224
The interest cost for two weeks is $224 (APR is 600 percent!)
If the same amount was borrowed as a cash advance from a credit card and repaid in two weeks, the interest cost would be only about $20
NZ$200 T$265
T$231
Using a pre-paid card or ATM cardmay make a big difference
(prices may vary at any time so this margin of advantage for the ATM card or pre-paid card may not always be the same)
26
Table 2: Attrition rates by Survey Round
1 month
2 months
3 months
6 months
Pacific Islanders in New Zealand
Treatment Group 0.06 0.09 0.09 0.16
Control Group 0.05 0.09 0.10 0.13
p-value of equality 0.673 0.886 0.814 0.415
Asians in New Zealand
Treatment Group 0.10 0.18 0.25 0.74
Control Group 0.08 0.16 0.20 0.76
p-value of equality 0.359 0.526 0.228 0.547
Sri Lankans in Australia
Treatment Group 0.45 0.45 0.44 0.79
Control Group 0.29 0.30 0.32 0.72
p-value of equality 0.017 0.025 0.073 0.194
Table 1: Characteristics of Sample by Treatment Status
Treatment Control Treatment Control Treatment Control
Variables Stratified on
Remit at least every 3 months 0.59 0.59 0.08 0.05 0.54 0.56
Knows it is cheaper to bundle remittances into large transaction 0.49 0.49 0.64 0.65 0.78 0.78
Knows only paying minimum on credit card costs the most 0.41 0.41 0.55 0.54 0.44 0.44
Personal Characteristics
Male 0.36 0.42 0.45 0.41 0.76 0.69
Age is under 35 0.47 0.49 0.33 0.33 0.28 0.30
First generation migrant 0.81 0.81 0.99 0.98 1.00 0.99
Migrated within last 5 years 0.34 0.35 0.25 0.27 0.47 0.41
Has a parent or child in the origin country 0.47 0.42 0.69 0.64 0.75 0.76
Married 0.69 0.65 0.69 0.70 0.84 0.93
Education of Fifth Form (10th grade) or less 0.46 0.39 0.09 0.11 0.01 0.02
University degree 0.10 0.08 0.59 0.54 0.64 0.54
Employed 0.63 0.59 0.42 0.47 0.81 0.80
Uses email at least weekly 0.31 0.33 0.59 0.56 0.73 0.79
Financial Characteristics
Ever compared costs of sending remittances 0.48 0.47 0.40 0.41 0.62 0.59
Has a cheque account 0.35 0.33 0.56 0.58 0.79 0.75
Has an ATM card 0.80 0.76 0.80 0.76 0.88 0.85
Has a Credit card 0.15 0.16 0.64 0.60 0.76 0.72
Last amount remitted conditional on remitting (NZD) 288 310 4235 4234 1200 1884
Gets APR on 2 week loan correct 0.02 0.03 0.44 0.47 0.42 0.41
Knows components of a remittance fee 0.03 0.02 0.13 0.11 0.20 0.15
Number of methods for sending remittances known 3.00 2.83 2.63 2.69 3.68 3.64
Sample Size 177 172 179 173 107 102
P-value for test of joint orthogonality: 0.913 0.978 0.356
Pacific Islanders
in New Zealand in New Zealand
East Asians Sri Lankans
in Australia
27
Table 3: Impact on Financial Knowledge
Knows Average Knows about Calculates Understands
cheapest Knowledge exc. Rate APR Compound
method Score commission correctly Interest
Time after intervention: 1 month 6 months 1 month 1 month 6 months 1 month 6 months 1 month 6 months 6 months 6 months
Panel A: Pacific Island Migrants in New Zealand
Assigned to Treatment 0.160*** 0.0682 0.532*** 0.289*** 0.0503 0.289*** 0.159*** 0.320*** 0.214*** 0.0114 -0.0241
(0.0487) (0.0484) (0.0440) (0.0531) (0.0508) (0.053) (0.0567) (0.0377) (0.0546) (0.0277) (0.0332)
Observations 328 302 323 329 299 329 300 330 296 299 301
Control group mean 0.53 0.54 0.13 0.31 0.32 0.31 0.35 0.32 0.25 0.06 0.11
Panel B: Asian Migrants in New Zealand
Assigned to Treatment 0.125*** 0.0988** -0.00592 -0.056 0.051*
(0.0477) (0.0401) (0.0438) (0.057) (0.0268)
Observations 321 308 304 288 323
Control group mean 0.68 0.10 0.19 0.65 0.42
Panel C: Sri Lankan Migrants in Australia
Assigned to Treatment -0.00802 0.184***
(0.0522) (0.066)
Observations 131 131.00
Control group mean 0.86111 0.67
Notes:
Robust standard errors in parentheses, *, ** and *** indicate significance at the 10, 5 and 1% levels respectively.
All regressions include controls for strata dummies, and for baseline outcome where available.
Six month follow-up results only shown for the Pacific Island sample due to extreme attrition in other samples.
Sri Lankan 1 month follow-up survey didn't ask questions on credit card or payday loan knowledge
Knows it is cheaper
to bundle remittances
Knows
Payday
loan expensive
Knows paying
only minimum on
credit card expensive
Table 4: Impact on Financial Behavior
1 month 2 months 3 months 6 months Average 1 month 2 months 3 months 6 months Average 1 month 6 months
Panel A: Pacific Island Migrants in New Zealand
Assigned to Treatment 0.206*** 0.0289 -0.0576 0.0975* 0.0720** 0.188*** 0.155*** -0.00212 -0.0350 0.0822** -0.0466 0.000522
(0.0428) (0.0490) (0.0460) (0.0513) (0.0357) (0.0430) (0.0501) (0.0536) (0.0484) (0.0365) (0.0414) (0.0478)
Observations 329 318 316 302 332 330 321 317 302 332 308 283
Control Group Mean 0.60 0.68 0.80 0.58 0.66 0.20 0.31 0.40 0.31 0.30 0.61 0.56
Panel B Asian Migrants in New Zealand
Assigned to Treatment 0.0977** 0.0372 0.0827* 0.104*** 0.0396 0.0515 0.0269 0.0582** -0.0915
(0.0480) (0.0474) (0.0467) (0.0350) (0.0442) (0.0325) (0.0330) (0.0255) (0.0564)
Observations 318 291 272 320 321 293 274 323 282
Control Group Mean 0.23 0.20 0.14 0.18 0.18 0.06 0.06 0.10 0.63
Panel C Sri Lankan Migrants in Australia
Assigned to Treatment 0.0528 0.0387 0.0137 0.0344 -0.0119 -0.0385 -0.0105 -0.00400
(0.0796) (0.0757) (0.0690) (0.0583) (0.0529) (0.0407) (0.0368) (0.0331)
Observations 129 128 127 130 131 130 129 132
Control Group Mean 0.24 0.20 0.16 0.20 0.10 0.07 0.04 0.07
Notes:
Robust standard errors in parentheses, *, ** and *** indicate significance at the 10, 5 and 1% levels respectively.
All regressions include controls for strata dummies, and for baseline outcome where available.
Note averages are over 1-3 months for Asians and Sri Lankans and 6 month impacts not shown due to extreme attrition in this round.
Used information to compare remitting costs Used internet to compare remitting costs
Keeps track of
monthly spending
28
Table 5: Impacts on Remittance outcomes
1 month 2 months 3 months 6 months Average 1 month 2 months 3 months 6 months Total
Panel A: Pacific Island Migrants in New Zealand
Assigned to Treatment -0.0110 -0.0585 -0.0550 0.0435 -0.0210 12.33 -2.839 -0.903 -6.185 3.946
(0.0383) (0.0377) (0.0350) (0.0443) (0.0288) (9.534) (6.038) (5.549) (16.89) (34.09)
Observations 328 316 317 299 332 321 310 308 292 278
Control Group Mean 0.16 0.17 0.14 0.18 0.16 20 22 16 53 115
Panel B: Asian Migrants in New Zealand
Assigned to Treatment 0.00224 0.0104 -0.0143 0.00127 -172.7 292.2 -172.1 81.21
(0.0309) (0.0230) (0.0185) (0.0182) (160.9) (224.6) (143.5) (314.4)
Observations 321 293 274 323 316 290 271 269
Control Group Mean 0.088 0.041 0.029 0.054 352 62 193 523
Panel C: Sri Lankan Migrants in Australia
Assigned to Treatment -0.0352 0.0949 -0.0764 -0.00451 -456.7 -163.2 -60.10 -469.1
(0.0777) (0.0796) (0.0782) (0.0610) (329.0) (135.1) (51.23) (371.1)
Observations 131 130 129 132 130 129 128 126
Control Group Mean 0.361 0.282 0.319 0.326 630 361 144 868
Notes:
Robust standard errors in parentheses, *, ** and *** indicate significance at the 10, 5 and 1% levels respectively.
All regressions include controls for strata dummies, and remittance amount regressions also include baseline amount remitted.
Six month follow-up results only shown for the Pacific Island sample due to extreme attrition in other samples.
Made a Remittance in Past Month Total Amount Remitted (Unconditional)
29
Table 6: Impact on the Likelihood of Switching Remittance Methods
Ever use Ever use
1 month 2 months 3months 6 months Ever Switch Mana/Epokifo'ou Westpac card
Panel A: Pacific Island Migrants in New Zealand
Assigned to Treatment -0.0380 -0.0645** -0.0675** -0.0118 -0.0865** -0.0499** 0.00598
(0.0264) (0.0280) (0.0271) (0.0200) (0.0340) (0.0245) (0.0161)
Observations 329 318 316 299 332 332 332
Control group mean 0.08 0.10 0.10 0.04 0.16 0.079 0.018
Panel B Asian Migrants in New Zealand
Assigned to Treatment -0.0123 -0.00563 0.000445 -0.0240
(0.0154) (0.0110) (0.0114) (0.0195)
Observations 321 293 274 323
Control group mean 0.03 0.01 0.01 0.04
Panel C: Sri Lankan Migrants in Australia
Assigned to Treatment 0.00714 0.0849 -0.00737 0.0997
(0.0494) (0.0589) (0.0502) (0.0711)
Observations 131 130 129 132
Control group mean 0.09722 0.070422 0.0869 0.15277
Notes:
Robust standard errors in parentheses, *, ** and *** indicate significance at the 10, 5 and 1% levels respectively.
All regressions include controls for strata dummies.
Six month follow-up results only shown for the Pacific Island sample due to extreme attrition in other samples.
Table 7: Impact on Pacific Island migrants having different financial products 6 months after treatment
Hire
Cheque Savings ATM Westpac Credit Purchase Payday Other
Account Account card Card Card Loan Loan Loan
Assigned to Treatment -0.0273 0.0674 0.000609 0.0179 -0.0336 0.0867*** 0 0.168***
(0.0551) (0.0469) (0.00894) (0.0189) (0.0413) (0.0315) (0) (0.0376)
Observations 317 317 317 317 317 317 317 317
Control group mean 0.397 0.737 0.994 0.019 0.179 0.045 0.000 0.051
Notes:
Robust standard errors in parentheses, *, ** and *** indicate significance at the 10, 5 and 1% levels respectively.
All regressions include controls for strata dummies.