Embed Size (px)
Citation preview

The impact of Euro introduction on the vertical price
transmission in the German food market –
Does money illusion matter?
Thomas Glauben *, Jens Peter Loy** and Jochen Meyer***
* Department of Food Economics and Consumption Studies, University of Kiel
** Department of Agricultural Economics, University of Kiel
*** Department of Agricultural Economics, University of Göttingen Contact: Jens-Peter Loy Professor of Agricultural Economics Christian-Albrechts-University Kiel, Germany Tel.: +49 4318804434 Fax: +49 4318804592 e-mail:[email protected]
Paper prepared for presentation at the XIth Congress the EAAE (European Association of Agricultural Economists),
‘The Future of Rural Europe in the Global Agri-Food System’, Copenhagen, Denmark, August 24-27, 2005
Copyright 2005, by Glauben Loy and Meyer. All rights reserved. Readers may make verbatim copies of this
document for non-commercial purposes by any means, provided that this copyright notice
appears on all such copies.

2
Abstract:
In this paper the impact of the introduction of the Euro on the vertical price transmission in
German food markets is analyzed. It is hypothesized that following the introduction of the
Euro the presence of money illusion might have lead to higher real prices, and if so it is likely
accompanied by higher margins between respective wholesale and retail prices. While other
studies have mainly focused on the behavior of average prices, here reactions at the individual
store level are investigated. For cucumber and carrots the vertical price relationships between
retail and wholesale prices are estimated by employing an error correction approach, which is
enhanced to test for structural breaks with a flexible time frame using a F-max approach. The
results indicate significant changes in the vertical price relationships for one forth of the
retailers under study. Though significant the directions of changes do not uniquely fit the
theoretical predictions for money illusion. Thus, the majority of German food retailers has not
used the introduction of the Euro to increase their mark ups.
1 Introduction
The implementation of a single European currency, taking full effect in January 2002, has
received a great attention from the public, the press, and the academic society. Much of
academic literature has discussed the question of whether Europe is an optimal currency area
and has emphasised the incremental increase in the stability of the exchange rate system when
the Euro is finally fully adopted (e.g. Bayoumi and Eichengreen, 1993; De Grauwe, 1994;
Obstfeld and Peri, 1998). Other works share the popular view that the adoption of the single
European currency is a more fundamental change. They explored the role of the Euro as an
international currency and suggest that the Euro may become a ‘vehicle currency’, which
competes with the US Dollar (e.g. Hartmann, 1996; Portes and Rey, 1998). More recently,
Devereux, Engel and Tille (1999) focussed on the issue how the Euro may alter the
responsiveness of consumer prices to exchange rate changes. Their central conjecture is that
the acceptance of the Euro will lead European prices to become more insulated from
exchange rate fluctuations, much the way U.S. consumer prices already are.
In contrast, only few studies examining the direct impact of the Euro introduction on
European consumers’ price responsiveness and retail firms’ price setting behaviour and thus
in turn on real price levels. This seems to be surprising, since, with the beginning of the new
century, there was a growing concern among consumers about possible abuses and cheating
3
on (consumer-, retail) prices during the changeover to the Euro cash (Aucremanne and
Cornille, 2001). In particular, the public as well as the press feared that the retail sector would
use the cash changeover to carry out ‘hidden’ price increases. Moreover several descriptive
statistics suggest remarkable price changes in some retail sub-sectors during the first month in
2002 compared with the same periods in 2001.
Aucremanne and Cornille (2001) simulate (real) price changes in the Belgian retail
sector resulting from recalculations of all ‘attractive’ prices and psychological pricing points,
respectively in national currency into Euro. They report slight positive effects on the
consumer price index ranging from 0.54% to 0.72%. However, the authors suggest that their
simulation results are very unrealistic, as factors such as competition on product markets, the
prevailing demand conditions, and the commitments made by organisations representing the
firm/retail sector retrain the possibility of rounding up. In addition, the authors emphasize the
problem of isolating the Euro-induced rounding effects from ‘regular’ price changes.
Similarly, Diller and Brambach (2002) empirically examine the extend of Euro attractive
price adjustments in the German retail sector around the year 2001/2002. They report that
only 30% of the sampled retail prices were converted into Euro attractive prices, whereof less
than 10 percent were rounded up. All in all, the authors did not find remarkable Euro-induced
rounding effects and thus real price adjustments in the German retail sector due to the
introduction of the Euro.
In addition to the rounding effects, Brandstetter and Kehl (2000) offer another
explanation for possible Euro-induced real price adjustments for the Austrian beverage sector.
The authors experimentally test if consumers alter their willingness to pay when prices are
displayed in Euro instead of Schilling (national currency). Results of conjoint analyses
suggest that consumer demand responses vary between Euro and Schilling prices, which in
turn may lead to real price adjustments.1
In this study we do not evaluate the potential relevance of these findings. We do,
however, argue that menu costs and particularly money illusion have been dismissed as
potential candidates for the examination of Euro-induced real price adjustments in the
German food retail sector. It is therefore hypothesized that the existence of both menu costs
and money illusion might have lead to higher real prices as a result of the Euro, and if so it
1 Brandstetter and Kehl (2000) do not explicitly evaluate the impact on real price adjustments.

4
must be accompanied with a higher margin between the respective wholesale and retail price.
Thus, we test for structural breaks in the margins. Moreover, we estimate the timing and
duration of Euro-induced price adjustments in the German food retail sector. In particular, as
retail stores might have anticipated the effects of the nominal shock and because the impact is
expected to vanish over time we use a model that allows for flexible starting and end points as
well as for smooth transition back to the real price equilibrium prior to the introduction of the
Euro.2
While other studies have mainly focused on the behavior of average prices, we study
reactions at the individual store level. A unique data set of weekly food prices for 271
individual retail stores is used. We choose two homogenous products for the analysis,
cucumber and carrots. Because of the non stationary behavior of the price series, an error
correction (ECM) approach is applied to quantify the vertical price transmission between
retail and wholesale prices. A standard error correction model is expanded to capture potential
structural break points triggered by the introduction of the Euro. As mentioned above, instead
of using the date of the introduction of the Euro as a natural break point we endogenously
determine the break points.
The paper is organized as follows. In section two we present a brief discussion of the
theory to explain the impact of the Euro introduction on the vertical price transmission. In
section three data and sampling issues are described and discussed. In section four and five
the model specification is developed and the empirical results are summarized. Finally some
conclusions are drawn.
2 Brief review of the theory
The literature so far provides four arguments for the impact of the introduction of the Euro on
the retail price transmission. A first argument, which is often mentioned, is the rounding of
Euro prices into ‘attractive’ prices. Converted to Euro, attractive prices in national currency
may not look attractive anymore, which could give rise to temptation to round prices up (or
down) to the nearest attractive price in Euro. In this paper, we do not explicitly examine this
2 It should be noted that our empirical approach does not allow to distinguishing between the impacts of menu
cost or money illusion on real retail prices. We estimate a cumulative effect of any cause that appears in the
period of the introduction of the Euro. However, the occurrence of structural breaks before January 2002
indicates the role of anticipated effects by the retailers.

5
argument since previous studies (e.g. Diller and Brambach, 2002) signal that rounding effects
can be neglected.
A second argument is based on the impact of menu costs3 that is the price adjustment
itself might cause some costs of adjustment. For example, Levy et al. (1997) and Dutta et al.
(1999) provide a quantification of menu costs in US retail markets, demonstrating that they on
average account for 27% to 35% of net profit margins. The introduction of the Euro might
have caused such menu costs which in the following might have passed on to the consumer
via retail price increases. The major part of these costs is attributable to the IT infrastructure
(e.g. currency adjustments in cash registers and PC’s), staff training and internal
communication. Retailing differs from other branches in a larger proportion of costs incurred
in modifying payment points, additional cash handling, special security measures and dual
pricing. As these costs represent only 1% to 3% of the turnover (Müller-Hagedorn and Zielke,
1998) significant price impacts are not very likely. However, assuming retail stores act as
price setter these adjustment costs lead to price increases in order to stabilize the profit
margins at least in the short term. In addition (supplementary) charges, i.e. the difference
between wholesale and retail prices, will increase ceteris paribus. However, because of the
menu costs’ share is small and food prices are adjusted regularly, we do not expect significant
effects following the Euro introduction.
Third, the presence of money illusion might be an important source of Euro-induced
retail price adjustments. Wassily Leontief (1936) defined money illusion as a violation of the
‘homogeneity postulates’, which stipulates that demand and supply functions are homogenous
of degree zero in all (nominal) prices. Thus only relative price changes matter. Shafir,
Diamond and Tversky (1997) provided questionnaire evidence for the presence of money
illusion. Their results suggest that preferences of people as well as their perceptions of
constraints are affected by nominal and not only by real values. Moreover many people do
also expect other peoples’ behaviours to be affected by money illusion. Fehr and Tyran (2001)
provided experimental evidence that money illusion affects the price adjustment process
following a monetary shock. The results indicate for a negative shock (smaller units) firms
tend to increase real prices. This is particularly true, when firms believe that nominal prices of
other firms are kept close to the pre-shock equilibrium (see also Haitwanger and Waldman,
3 Menu costs consist of printing new price labels or menus, new prices advertisements, setting new prices in the
cashier system etc.

6
1989). Similar, real price increases might be likely when consumers suffer from money
illusion. This follows from a higher marginal willingness to pay in the case of a negative
monetary shock (Brandstetter and Kehl, 2000). As in the case of menu costs, the presence of
money illusion might lead to higher real Euro food retail prices and thereby to increased retail
margins. The experiments also indicate that the effects of money illusion fade in time (Fehr
and Tyran, 2001).
Finally, the Euro introduction might have induced some strategic behaviour of
retailers. Firstly, because of a great public debate prior to the introduction of the Euro,
retailers might have tried to hide their (real) price adjustments by anticipating or delaying
their reaction. To overcome consumers’ concerns of Euro related increases in prices and
margins after the first of January 2002, retailers might have anticipated or postponed these
adjustments to some weeks or month. Although, economic theory do not provide strong
arguments for this hypothesis, it seems at least plausible that firms might have applied such
strategies. Secondly, contrary to the money illusion hypothesis some retailers might have cut
prices and margins following the Euro introduction to reinforce their low price strategy and to
overcome potential consumer ‘protests’. Moreover, retailers could have raised prices in
advance to fake a real price cut after the Euro introduction to seemingly reemphasize their
low-price strategy.
To summarize, the impact of the introduction of the Euro on the retail price
transmission might be a result of a mix of the four effects and pricing strategies mentioned
above. While, it is expected that the presence of menu costs and in particular money illusion
lead to higher retail margins, the impact of both ‘price rounding’ and the timing on price
adjustment is less clear. For example, if sellers have anticipated price adjustments, real price
decreases at the date of the Euro introduction could be observed. Therefore, we employ a
flexible time series approach to identify any potential structural change related to a certain
period prior and post the introduction of the Euro. As all the above discussed effects by an
inherent one time deflationary shock are assumed to be temporary, our approach is designed
to allow for a smooth transition back to the pre-shock equilibrium. Though the outlined
effects describe output price reactions only, we include wholesale prices to separate the
effects of coincidental costs changes.
3 Data and sample reduction
We use weekly food retail and wholesale food prices for Germany from October 2000 to
7
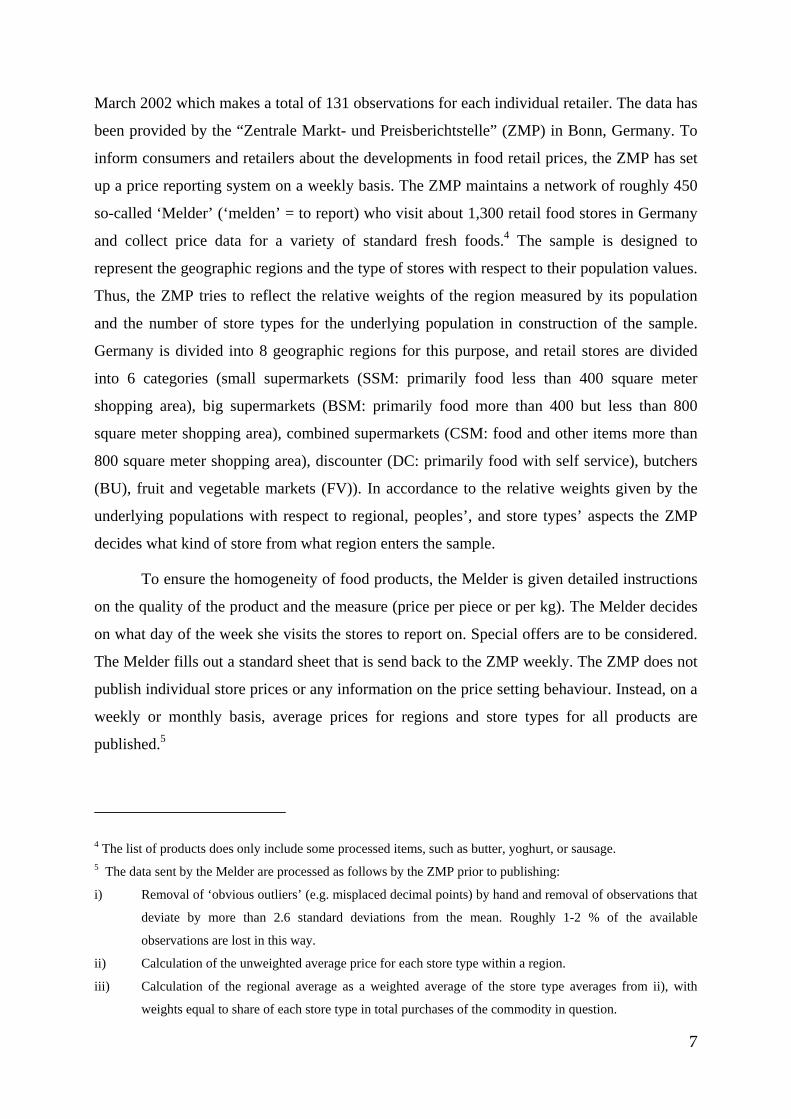
March 2002 which makes a total of 131 observations for each individual retailer. The data has
been provided by the “Zentrale Markt- und Preisberichtstelle” (ZMP) in Bonn, Germany. To
inform consumers and retailers about the developments in food retail prices, the ZMP has set
up a price reporting system on a weekly basis. The ZMP maintains a network of roughly 450
so-called ‘Melder’ (‘melden’ = to report) who visit about 1,300 retail food stores in Germany
and collect price data for a variety of standard fresh foods.4 The sample is designed to
represent the geographic regions and the type of stores with respect to their population values.
Thus, the ZMP tries to reflect the relative weights of the region measured by its population
and the number of store types for the underlying population in construction of the sample.
Germany is divided into 8 geographic regions for this purpose, and retail stores are divided
into 6 categories (small supermarkets (SSM: primarily food less than 400 square meter
shopping area), big supermarkets (BSM: primarily food more than 400 but less than 800
square meter shopping area), combined supermarkets (CSM: food and other items more than
800 square meter shopping area), discounter (DC: primarily food with self service), butchers
(BU), fruit and vegetable markets (FV)). In accordance to the relative weights given by the
underlying populations with respect to regional, peoples’, and store types’ aspects the ZMP
decides what kind of store from what region enters the sample.
To ensure the homogeneity of food products, the Melder is given detailed instructions
on the quality of the product and the measure (price per piece or per kg). The Melder decides
on what day of the week she visits the stores to report on. Special offers are to be considered.
The Melder fills out a standard sheet that is send back to the ZMP weekly. The ZMP does not
publish individual store prices or any information on the price setting behaviour. Instead, on a
weekly or monthly basis, average prices for regions and store types for all products are
published.5
4 The list of products does only include some processed items, such as butter, yoghurt, or sausage. 5 The data sent by the Melder are processed as follows by the ZMP prior to publishing:
i) Removal of ‘obvious outliers’ (e.g. misplaced decimal points) by hand and removal of observations that
deviate by more than 2.6 standard deviations from the mean. Roughly 1-2 % of the available
observations are lost in this way.
ii) Calculation of the unweighted average price for each store type within a region.
iii) Calculation of the regional average as a weighted average of the store type averages from ii), with
weights equal to share of each store type in total purchases of the commodity in question.

8
The ZMP-panel is designed to be a random sample of the above-mentioned types of
food stores in Germany. However, reporters decide on the store they visit to report prices and
neither the reporter nor the store she selects is chosen a priori randomly. As we do not have
information about the group of reporters, such as age, education, income etc. we can only
speculate towards which direction the actual sample might be biased. For instance, it is likely
that low income pensioners are over represented in the sample of reporters; thus, it might well
be that these people prefer to report on low price stores. In this case estimates of average
prices or conclusions drawn from our analysis might be biased with respect to the underlying
population. By controlling the regional number of stores and the number of the various store
types, potential biases of sample parameters due to these characteristics are limited.
For our study we selected two out of the 56 food products available. As we focus on
the price transmission behaviour during the introduction of the Euro we aim to get a full panel
data set. We first selected the food products by excluding the items that are only offered
seasonally, such as cherries, by excluding the products that are only reported on a monthly
basis, such as milk products or bread. Between the remaining we selected those that maximize
the number of observations; by this sampling we aimed to maximise the number of stores with
a continuous reporting over time. We define continuous price reporting by availability of
price observations for each product in more than 95 % of all weeks in the sample. For missing
observations we set the price of the product in the week before. This entire selection process
reduced the number of observations by about 80 percent. For the products under study we end
up with retail price data for 271 stores. Prices are reported in German cent or pennies per
kilogram in the case of carrots and in German cent or pennies per piece in the case of
cucumber. Since 2002 prices are reported in Euro cent. For the analysis prices in the pre Euro
iv) Calculation of the national average price for each store type as the weighted average of the store type
averages from ii), with regional population shares as weights.
v) Calculation of the national average over all store types as the weighted average of the regional averages
from iii), with regional population shares as weights.
vi) Average product prices are only published if at least 100 observations were available over all store types
and regions.
The resulting regional, store type and national averages for each food product are published weekly and also
provide the basis for a variety of monthly, quarterly, and annual publications produced by the ZMP (see ZMP
internet page at http://www.zmp.de). Furthermore, this data is reproduced in many other publications, such as
local farm journals and consumer affairs publications etc.

9
period are transformed by applying the official conversion rate of 1.95583 Deutschmark per
Euro.
To study the vertical price transmission we also collected wholesale prices of
cucumber and carrots. As prices at the wholesale level indicate a high level of market
integration we use average wholesale prices in Germany to reflect buying in prices for
retailers.6 These data are also available weekly and are also provided by the ZMP (2003). The
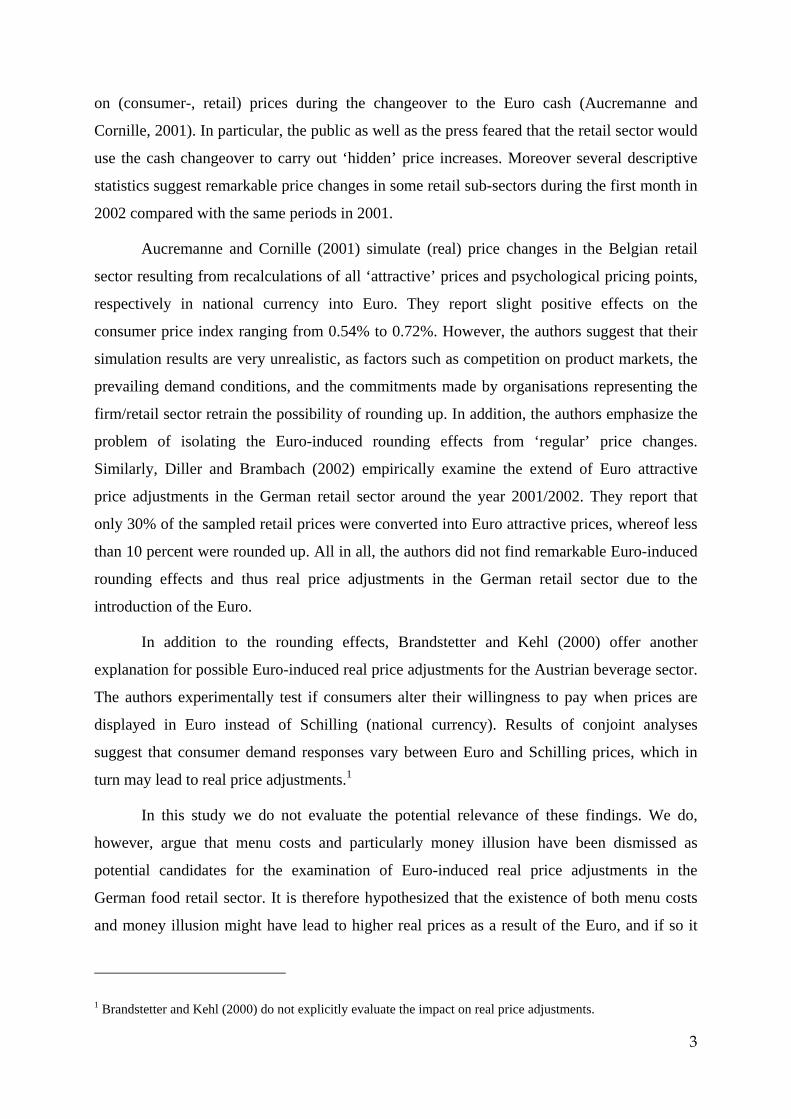
average retail prices and the corresponding wholesale prices for the period from January 2001
to April 2003 are shown in Figure 1.7
Insert Figure 1 about here
Figure 1 shows no obvious significant structural break related to the introduction of the Euro
for the aggregate series. The aggregate retail price is here the simple average over the
individual stores’ prices. For the individual stores, information on the corresponding zip code
(exact regional location), the type of the store (see above for definition), the name of the store,
and the company that owns the store are also available. The stores in our final sample belong
to type and companies shown in Table 1. Because of confidentiality reasons, the real names of
the companies have been suppressed and substituted for alphabetical letters.8
Insert Table 1 about here
6 We collected prices from various German wholesale markets. These prices are highly integrated and the
hypothesis that prices appear identical from a statistical point of view could not be rejected. Therefore, we
decided to use one representative price which is the simple average wholesale price. Nonetheless we are aware
that wholesale prices might not be the adequate input price indicator of individual retail stores. Retail chains
often negotiate prices with supplying firms on a contract basis. These prices might not be correctly be reflected
by the average wholesale price. Unfortunately those contract prices are not published; however, wholesale prices
can at the least always be interpreted as opportunity costs and thereby might still have an impact on output price
decisions even for retailers that have contracted their buy in prices. 7 To use equal numbers of observations before and after the Euro introduction, our estimation sample starts in
October 2000. 8 Because of the small number of observations in some cases we have to be cautious with some conclusions, for
instance, with respect to DC and retail chains D and F.

10
4 Modelling approach
As some of the data indicate non-stationary behaviour9, we start with an error correction
model (ECM) specification to analyse the price transmission process from wholesale (pW) to
retail prices (pR). In line with other studies, we assume that wholesale prices lead retail
prices.10 The general specification of the model we use is given in equation (1):
0 1 1 2 10 1
K LR W R W Rit i i t i it ik t k il it l it
k l
p p p p pα γ γ β δ ε− − − −= =
∆ = + + + ∆ + ∆ +∑ ∑ (1)
with t as a time index for each week and i as index for each individual retail shop. The
superscripts Ri and W indicate retail and wholesale prices, respectively. Allowing for
individual price adjustments the lag-lengths K and L are determined using the Akaike
Information Criteria (AIC). The selected lags of contemporaneous price changes vary from 1
to 5 weeks in the case of the retailers selling cucumber and from 1 to 8 weeks in the case of
those retailers that carry carrots. For both products 271 price transmission processes between
wholesale price and individual retail price are estimated. The period of observed prices lasts
from October 9th in 2000 to March 3rd in 2003.11
To test whether the introduction of the Euro had an impact on the individual price
spread between wholesale and retail prices, we add a dummy and a trend variable to the ECM
specification (see Equation 2).
0 1 2 1 1 2 10 1
K LR W R W Rit i i it i it i t i it ik t k il it l it
k l
p D TD p p p pα α α γ γ β δ ε− − − −= =
∆ = + + + + + ∆ + ∆ +∑ ∑ (2)
T is a time-trend dummy variable and itD is a conventional dummy variable with: itD = 1 if
tstart ≤ t ≤ tend and itD = 0 otherwise. T covers the numbers from 1 to tend minus tstart for those
periods and zero otherwise. By means of this dummy variable, a flexible structural adjustment
of the marketing margin between wholesale and individual retail prices is introduced into the
9 For reasons of brevity we do not present the results of the stationarity tests, but upon request we are pleased to
provide them. 10 See amongst others Kinnucan and Forker (1987), Boyd and Brorsen (1988), Pick et al. (1990), Griffith and
Piggott (1994), Powers (1995), Brooker et al. (1997) and Worth (1999). In addition, because of the high
concentration of food retailers retail prices are more likely to be endogenous than wholesale prices. 11 We choose a symmetric period around January 1st 2002 to equally weight the periods before and after the Euro
introduction.
11
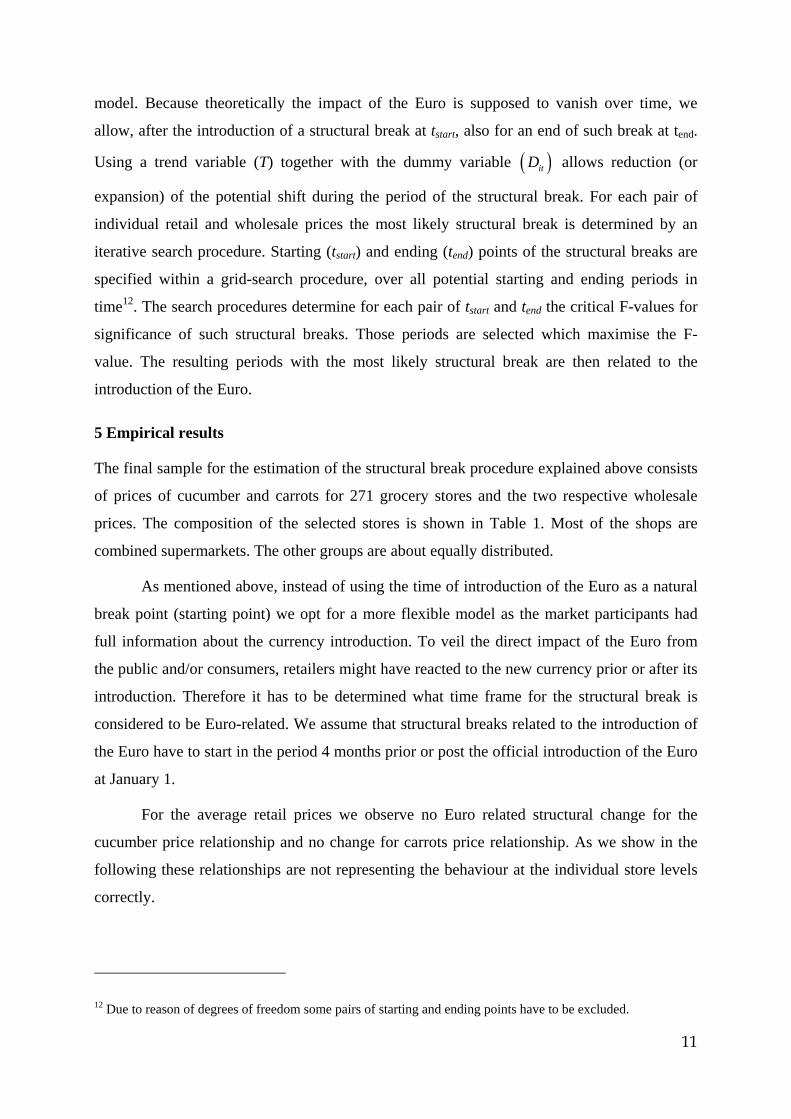
model. Because theoretically the impact of the Euro is supposed to vanish over time, we
allow, after the introduction of a structural break at tstart, also for an end of such break at tend.
Using a trend variable (T) together with the dummy variable ( )itD allows reduction (or
expansion) of the potential shift during the period of the structural break. For each pair of
individual retail and wholesale prices the most likely structural break is determined by an
iterative search procedure. Starting (tstart) and ending (tend) points of the structural breaks are
specified within a grid-search procedure, over all potential starting and ending periods in
time12. The search procedures determine for each pair of tstart and tend the critical F-values for
significance of such structural breaks. Those periods are selected which maximise the F-
value. The resulting periods with the most likely structural break are then related to the
introduction of the Euro.
5 Empirical results
The final sample for the estimation of the structural break procedure explained above consists
of prices of cucumber and carrots for 271 grocery stores and the two respective wholesale
prices. The composition of the selected stores is shown in Table 1. Most of the shops are
combined supermarkets. The other groups are about equally distributed.
As mentioned above, instead of using the time of introduction of the Euro as a natural
break point (starting point) we opt for a more flexible model as the market participants had
full information about the currency introduction. To veil the direct impact of the Euro from
the public and/or consumers, retailers might have reacted to the new currency prior or after its
introduction. Therefore it has to be determined what time frame for the structural break is
considered to be Euro-related. We assume that structural breaks related to the introduction of
the Euro have to start in the period 4 months prior or post the official introduction of the Euro
at January 1.
For the average retail prices we observe no Euro related structural change for the
cucumber price relationship and no change for carrots price relationship. As we show in the
following these relationships are not representing the behaviour at the individual store levels
correctly.
12 Due to reason of degrees of freedom some pairs of starting and ending points have to be excluded.

12
Applying the model to individual store prices, we obtain 148 Euro-related structural
breaks in the case of cucumber and 62 in the case of carrots (Table 2). Thus in the case of
cucumber, a remarkable share of about 55 percent of the retail stores indicates a structural
break related to the introduction of the Euro. As explained above, the impact of the
introduction of the Euro on the retail price transmission might be a result of a mix of the four
effects and/or pricing strategies. It is primary expected that the presence of menu costs and in
particular money illusion lead to higher retail margins, whereby this effect is supposed to fade
out in time.13 Thus, we would expect a positive dummy variable and a negative trend-dummy
to return to the equilibrium prior to the Euro introduction. On the other hand, the impact of
both price rounding and the timing on price adjustments or other marketing strategies is less
clear. For example, if sellers have anticipated changes in the consumer behaviour after the
Euro introduction or if retailers use the Euro to reinforce their low pricing strategy, real price
could also decrease at the date around the Euro introduction. Thus, also lower retail margins
could be observed.
We find that from 147 (62) Euro related structural breaks in the case of cucumber
(carrots) 75 (43) show a significant positive sign. That is, about 28 (16) percent of all retailers
indicate effects fitting money illusion and/or menu cost. Within the group of shops that
indicate a Euro related positive dummy 64 (37) also show a negative trend during the break
period for cucumber (carrots) prices.
In about further 27 (7) percent of the stores we observe a negative sign of the Euro
related structural break dummy. This might be the result of the other Euro induced pricing
(marketing) strategies as for example the reinforcement of low pricing strategies.
Some variation in the number of structural breaks between store types and retail chains
can be observed. Unfortunately, no systematic relationships between the identified structural
breaks and the store types and/or the products under considerations are easily identifiable,
which is partly caused by the small number of stores for most store types or retail chains. On
the other hand some conclusions are not supported by cross commodity comparisons.
Discounters, for example, show less structural breaks in absolute number and in percentage
terms for cucumber. The reason might be that discounters have publicly committed
themselves to not use the Euro introduction to push prices and margins. Moreover,
13 This potential fading is covered by the trend-dummy variable which in this case should show a negative sign.

13
Discounters seem to have reinforced their low price strategy looking at the cucumber market.
On the other hand, this picture does not fit the observations for the carrot prices. Discounters
have in 25 percent changed their margin because of the Euro and 47 percent of these changes
started with price increases at the starting break point. Here, money illusion would explain
this Euro induced pricing strategy. Following, no conclusive picture can be drawn from the
observed deviations. The same is to be said about the regional variations in the number of
structural breaks (Table 3)
Insert Table 2 and 3 about here
The estimated coefficients for the dummy variables range from -143 to 290 (-105 to 556)
Euro cent between shops for cucumber (carrots). Considering the average price levels in the
period of observations - average price of carrots is about 0.89 Euro per kg, the average price
of cucumber is about 0.77 Euro per piece - the structural breaks can be called significant from
an economic point of view.
Figure 2 shows an example for an individual store price series for cucumber which
indicated a Euro related structural break. It is clearly seen that this store often set significantly
above normal margins from end of December 2001 to end of March 2002 compared with
other periods. A similar picture can be drawn for a margin of an individual store for carrots
which also shows a significant increase in the margin at the time of the introduction of the
Euro (Figure 2).
Insert Figure 2 about here
Besides the magnitude (dummy) and the development of the structural break (trend dummy),
our model also results the starting and ending point of structural breaks and thereby the length
of structural breaks can be calculated. In Figure 3 the length of the structural break is drawn
against the size of the Euro dummy. Most of the structural breaks are short very lived as they
only last for 2 to ten weeks. With a few exception, in particular those structural breaks of
larger magnitude last only a few weeks.
Insert Figure 3 about here

14
Conclusions
In the decades following World War Two the German Mark has gained a remarkable image
from consumers. This trust in the national currency has been challenged in the process of the
transition from the Deutschmark to the Euro. Even though this transition was supposed to be
only a change in the nominal scale, consumers were very much concerned about its impact on
real prices. Many consumers feared the Euro would be used to enforce real price increase by
retailers and other suppliers. This fear was strongly taken up and enforced by mass media
prior to the introduction of the Euro. The economic literature provides several arguments for
potential impacts of a nominal shock such as the introduction of the Euro on the retail price
and retail-wholesale margin.
This study empirically examines the impact of the Euro introduction on the retail-
wholesale price margin in the German food retail sector. In particular, it is hypothesized that
money illusion and/or menu costs can cause real effects on prices and margins. As the retail
sector is highly concentrated in Germany, particularly money illusion and/or menu costs
might have caused an increase in retail margins following the introduction of the Euro in
Germany in January 2002. Experimental studies proof the potential significance of this effect.
On the other hand, the impact of price rounding, the timing of price adjustments and pricing
strategies is less clear. For example, if sellers have anticipated price adjustments or have used
the Euro to reinforce their pricing strategy, real price decreases at the date around the Euro
introduction could also be a reasonable reaction.
We employ a panel data set of food retail prices for 271 Germany grocery stores to
investigate the empirical impact of the nominal shock caused by the introduction of the Euro
in the retail sector. As retail stores might have anticipated the effects of the nominal shock and
because the impact is expected to fade out in time, our model accounts for flexible starting
and ending points as well as for a smooth transition back to the price equilibrium prior the
Euro introduction.
Though on average no significant impact of the Euro introduction is detected, the
individual price series show some significant changes in the price setting by retailers. In about
23-55 percent of all stores the vertical price relationship between wholesale and retail prices
did change around the date of the introduction of the Euro Germany. Most of the detected
structural breaks indicate significant increases in the retail margins at the starting break point.
The respective trend dummies mostly show negative signs, which would consistent with the

15
money illusion theory. Further, in about 7-27 percent of the stores we observe a negative sign
of the Euro related structural breaks. This might be the result of the other Euro induced
pricing strategy to reinforce a low price image of the store.

16
References
Aucremanne, L., and D. Cornille (2001). Attractive Prices and Euro-Rounding Effects on
Inflation, National Bank of Belgium, Working Paper # 17.
Bayoumi T., and B. Eichengreen (1993). Shocking Aspects of European Monetary
Unification. In: Giavazzi F. and F. Torres (eds): The Transition to Economic and
Monetary Union in Europe, Cambridge University Press.
Boyd M.S. and B.W. Brorsen (1988). Price Asymmetry in the U.S. Pork Marketing
Channel. North Central Journal of Agricultural Economics 10: 103-109.
Brandstetter G. and L. Kehl (2000). Neue Methoden zur Simulation von Preis-Absatz-
Funktionen dargestellt am Beispiel der Währungsumstellung von Schilling zum
Euro. In: Foscht T. (ed): Zukunftsperspektiven für das Handelsmanagement,
Deutscher Fachverlag, Frankfurt a. M.
Brooker J.R., D.B. Eastwood, B.T. Carver and M.D. Gray (1997). Fresh Vegetable Price
Linkage Between Grower/Shippers. Wholesalers, and Retailers. Journal of Food
Distribution Research: 54-61.
De Grauwe P. (1994). The Economics of Monetary Integration, Oxford University Press.
Devereux M. B., C. Engel and C. Tille (1999). Exchange Rate Pass-Through and the
Welfare Effects of the Euro. National Bureau of Economic Research, Cambridge,
Working Paper # 7382.
Diller H. and G. Brambach (2002). Die Entwicklung der Preise und Preisfiguren nach der
Euroeinführung im Konsumgüter-Einzelhandel. Handel im Focus - Mitteilungen des
IFH III/02, 228-38.

17
Dutta S., M. Bergen, D. Levy and R. Venable (1999). Menu Costs, Posted Prices, and
Multiproduct Retailers. Journal of Money, Credit, and Banking 31(4): 683-703.
Fehr E. and J.-R. Tyran (2001). Does Money Illusion Matter? The American Economic
Review 91(5): 1239-1262.
Griffith G.R. and N.E. Piggott (1994). Asymmetry in Beef, Lamb and Pork Farm-Retail
Price Transmission in Australia. Agricultural Economics 10: 307-316.
Haitwanger J. and M. Waldman (1989). Limited Rationality and Strategic Complements:
The Implications for Macroeconomics. Quarterly Journal of Economics 104(3): 463-
483.
Hartmann P. (1996). The Future of the Euro as an International Currency. London School
of Economics Working Paper.
Kinnucan H.W. and O.D. Forker (1987). Asymmetry in Farm-Retail Price Transmission for
major dairy Products. American Journal of Agricultural Economics 69: 285-292.
Leontief W. (1936). The Fundamental Assumption of Mr. Keynes’ Montetary Theory of
Unemployment. Quarterly Journal of Economics 5(4): 192-197.
Levy D., M. Bergen, S. Dutta and R. Venable (1997). The magnitude of menu costs: Direct
evidence from large U.S. supermarket chains. Quarterly Journal of Economics
112(3): 791-825.
Müller-Hagedorn L. and S. Zielke (1998). Das Preissetzungsverhalten von
Handelsbetrieben im Zuge der Währungsumstellung auf den Euro. Zeitschrift für
betriebswirtschaftliche Forschung 50: 946-965.
Obstfeld M. and G. Peri (1998). Regional Nonadjustment and Fiscal Policy: Lessons for
EMU. National Bureau of Economic Research, Cambridge, Working Paper # 6431.

18
Pick D.H., J.D. Karrenbrock and H.F. Carman (1990). Price Asymmetry and Marketing
Margin Behavior: An Example for California - Arizona Citrus. Agribusiness 6(1):
75-84.
Portes R. and H. Rey (1998). The Emergence of the Euro as an International Currency.
Economic Policy 26: 305-332.
Powers N.J. (1995). Sticky short-run prices and vertical pricing: evidence from the market
for iceberg lettuce. Agribusiness 11(1): 57-75.
Shafir E., P. Diamond and A. Tversky (1997). Money Illusion. Quarterly Journal of
Economics 112 (2): 341-374.
Statistisches Bundesamt (2002). Preise: Sechs Monate Euro – eine Zwischenbilanz der
amtlichen Preisstatistik. Wiesbaden.
Worth T. (1999). The F.o.b.-Retail price relationship for selected fresh vegetables. Economic
Research Service - Vegetables and Specialties.
Zentrale Markt und Preisberichtstelle (ZMP) (1995). Das ZMP-Handelspandel unter der
Lupe. Materialien zur Marktberichterstattung Band 3, Bonn.
ZMP (2003). Data from the ZMP-Consumer Panel. Bonn.

19
Figures and Tables
Tab. 1: Number store types and retailer companies in the sample for cucumber and
carrots
Cucumber Retailer chain
Total A B C D E F Other
SSM
BSM
DC
CSM
43
75
61
92
7
16
0
8
17
16
1
15
10
7
2
6
6
13
12
12
1
7
0
27
0
0
14
8
2
16
32
16
Total 271 31 49 25 43 35 22 66
Carrots Retailer chain
Total A B C D E F Other
SSM
BSM
DC
CSM
43
72
61
95
8
14
0
9
16
15
1
15
10
7
2
6
6
13
12
13
1
7
0
28
0
0
15
7
2
16
31
17
Total 271 31 47 25 44 36 22 66
Notes: SSM: Small supermarkets, BSM: Big supermarkets, DC: Discounter, CSM: Combined supermarkets. A to F: Different retailer companies, such as Edeka or Spar group.
Source: Data by ZMP, 2003.

20
Tab. 2: Number (percentage) of Euro related structural breaks by store type and chain [in brackets the number of Euro related structural breaks with a positive dummy]
Cucumber Retailer chain
Total A B C D E F Other
SSM
BSM
DC
CSM
26 (60%) [14]
39 (52%) [15]
29 (48%) [15]
54 (59%) [31]
7
8
0
4
11
10
1
9
3
3
1
3
4
7
6
8
1
4
0
21
0
0
7
3
0
7
14
6
Total 148 (55%) [75] 19 (61%) 31 (63%) 10 (40%) 25 (58%) 26 (74%) 10 (46%) 27 (41%)
Carrots Retailer chain
Total A B C D E F Other
SSM
BSM
DC
CSM
9 (21%) [8]
13 (18%) [11]
15 (25%) [7]
25 (26%) [17]
2
2
0
2
3
3
0
0
2
4
1
3
1
1
5
3
1
0
0
8
0
0
3
3
0
3
6
6
Total 62 (23%) [43] 6 (19%) 6 (13%) 9 (38%) 10 (23%) 9 (25%) 6 (27%) 15 (23%)
Notes: SSM: Small supermarkets, BSM: Big supermarkets, DC: Discounter, CSM: Combined supermarkets. A to F: Different retailer companies, such as Edeka or Spar group.
Source: Data by ZMP, 2003.
Tab. 3: Number of Euro related structural breaks by region (In bracket the number of Euro related breaks with a positive dummy)
Region
Cucumber 1 2 3 4 5 6 7 8
Number of stores 52 39 30 16 51 33 32 18
Structural breaks 21 (12) 22 (15) 12 (3) 9 (2) 30 (15) 23 (14) 21 (15) 10 (3)
In percent 40 56 40 56 59 70 66 56
Carrots 1 2 3 4 5 6 7 8
Number of stores 56 41 31 16 49 28 31 19
Structural breaks 14 (8) 10 (4) 8 (4) 3 (3) 7 (7) 7 (5) 10 (9) 3 (3)
In percent 25 24 26 19 14 25 32 16
Notes: SSM: Small supermarkets, BSM: Big supermarkets, DC: Discounter, CSM: Combined supermarkets. A to F: Different retailer companies, such as Edeka or Spar group.
Source: Data by ZMP, 2003.

21
Fig. 1: Average retail and wholesale prices for cucumber and carrots
Cucumber
0
20
40
60
80
100
120
140
160
180
09.1
0.20
00
09.1
1.20
00
09.1
2.20
00
09.0
1.20
01
09.0
2.20
0109
.03.
2001
09.0
4.20
01
09.0
5.20
01
09.0
6.20
01
09.0
7.20
01
09.0
8.20
01
09.0
9.20
01
09.1
0.20
01
09.1
1.20
01
09.1
2.20
01
09.0
1.20
02
09.0
2.20
0209
.03.
2002
09.0
4.20
02
09.0
5.20
02
09.0
6.20
02
09.0
7.20
02
09.0
8.20
02
09.0
9.20
02
09.1
0.20
02
09.1
1.20
02
09.1
2.20
02
09.0
1.20
03
09.0
2.20
0309
.03.
2003
in E
uro
cent
per
pie
ce
Retail Price
Wholesale Price
Carrots
0
20
40
60
80
100
120
140
09.1
0.20
00
09.1
1.20
00
09.1
2.20
00
09.0
1.20
01
09.0
2.20
0109
.03.
2001
09.0
4.20
01
09.0
5.20
01
09.0
6.20
01
09.0
7.20
01
09.0
8.20
01
09.0
9.20
01
09.1
0.20
01
09.1
1.20
01
09.1
2.20
01
09.0
1.20
02
09.0
2.20
0209
.03.
2002
09.0
4.20
02
09.0
5.20
02
09.0
6.20
02
09.0
7.20
02
09.0
8.20
02
09.0
9.20
02
09.1
0.20
02
09.1
1.20
02
09.1
2.20
02
09.0
1.20
03
09.0
2.20
0309
.03.
2003
in E
uro
Cen
t per
kg
Wholesale Price
Retail Price
Notes: The thick line marks the official introduction of the Euro in January 2002
Source: Data by ZMP, 2003.
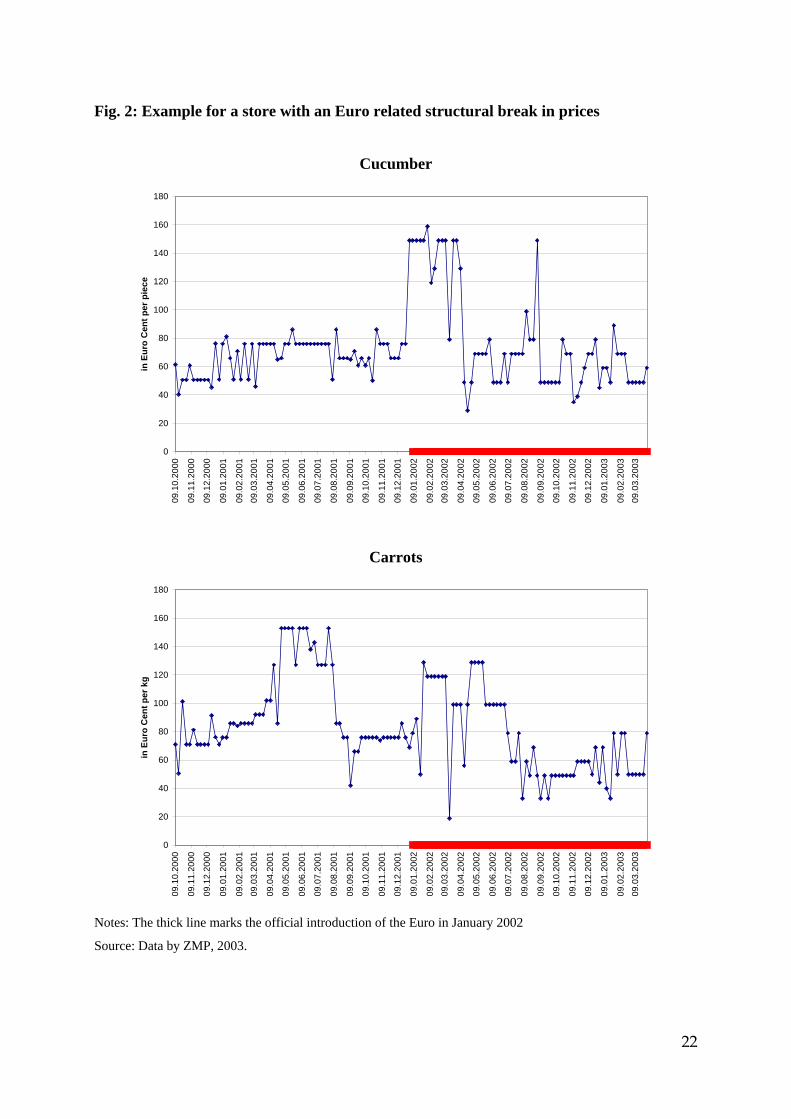
22
Fig. 2: Example for a store with an Euro related structural break in prices
Cucumber
0
20
40
60
80
100
120
140
160
180
09.1
0.20
00
09.1
1.20
00
09.1
2.20
00
09.0
1.20
01
09.0
2.20
0109
.03.
2001
09.0
4.20
01
09.0
5.20
01
09.0
6.20
01
09.0
7.20
01
09.0
8.20
01
09.0
9.20
01
09.1
0.20
01
09.1
1.20
01
09.1
2.20
01
09.0
1.20
02
09.0
2.20
0209
.03.
2002
09.0
4.20
02
09.0
5.20
02
09.0
6.20
02
09.0
7.20
02
09.0
8.20
02
09.0
9.20
02
09.1
0.20
02
09.1
1.20
02
09.1
2.20
02
09.0
1.20
03
09.0
2.20
0309
.03.
2003
in E
uro
Cen
t per
pie
ce
Carrots
0
20
40
60
80
100
120
140
160
180
09.1
0.20
00
09.1
1.20
00
09.1
2.20
00
09.0
1.20
01
09.0
2.20
0109
.03.
2001
09.0
4.20
01
09.0
5.20
01
09.0
6.20
01
09.0
7.20
01
09.0
8.20
01
09.0
9.20
01
09.1
0.20
01
09.1
1.20
01
09.1
2.20
01
09.0
1.20
02
09.0
2.20
0209
.03.
2002
09.0
4.20
02
09.0
5.20
02
09.0
6.20
02
09.0
7.20
02
09.0
8.20
02
09.0
9.20
02
09.1
0.20
02
09.1
1.20
02
09.1
2.20
02
09.0
1.20
03
09.0
2.20
0309
.03.
2003
in E
uro
Cen
t per
kg
Notes: The thick line marks the official introduction of the Euro in January 2002
Source: Data by ZMP, 2003.

23
Fig. 3: Relationship between the length of the Euro related structural break in prices and the magnitude of the estimated break dummy
Cucumber
0
10
20
30
40
50
60
70
80
-200 -150 -100 -50 0 50 100 150 200
Dummy for the Euro (Prices measured in Euro cent)
Leng
th o
f the
str
uctu
ral b
reak
Carrots
0
10
20
30
40
50
60
70
80
-200 -100 0 100 200 300 400 500 600
dummy for the Euro (Prices measured in Euro cent)
Leng
th o
f the
str
uctu
ral b
reak
Source: Data by ZMP, 2003.