Embed Size (px)
Citation preview

The Impact of Distributed Energy Resources on the Bulk Power System: A Deeper Dive
Michael Birk Dr. Richard D. Tabors
MIT Energy Initiative Tabors Caramanis Rudkevich [email protected] [email protected] [email protected] [email protected]
Abstract Distributed Energy Resources (DERs) including
solar photovoltaics (PV), electric storage and electric vehicles, demand response, combined heat and power, wind, fuel cells, and micro-turbines are typically installed on the low or medium voltage distribution network. Changes on the distribution network can have rippling effects throughout the rest of the power system. In this paper, we have calculated both traditional locational marginal prices (LMPs) and distributed locational marginal prices (DLMPs) using an optimal power flow (DC OPF). This paper provides an analysis of the energy price impacts resulting from significant additions of Distributed Energy Resources (DER), namely solar PV, electric batteries and demand response, in a distribution feeder. The impact is measured in terms of nodal approximations to DLMPs, realistic calculation of LMPs in the transmission system and overall price suppression effects that trickle down to consumers on the feeder. Policy implications are drawn concerning the potential impacts of penetration of DER on future planning, and operation of the power system as well as on energy markets and the environment. 1. Introduction
The power sector is in a period of transformation.
From the European Union to the United States, the penetration of distributed energy resources calls for a reevaluation of the electric industry structure, the provision of electricity services and regulatory paradigms. Emission and renewable energy targets, along with advances in communication and information technology, decreasing technology costs and socio-economic and regulatory pressures provide the impetus behind this change [1,2,3,21]. The grid of the future will incorporate two-way flows of electricity, both on distribution and transmission networks, where central and distributed generation
will have a function [4,5]. Demand-side resources may reduce the need for bulk power system infrastructure, but transmission investment may still expected to grow, in the US [5]. There is no denying, the interconnectedness of the grid, its operations, markets and planning are evolving in kind.
Distributed energy resources can impact the bulk transmission system concerning five main aspects: interconnection, reliability, economics, replacement and the environment [5]. Transmission constraints, such as thermal line ratings, limit the ability of low cost electricity to be transported across the high voltage cables, thus potentially more expensive generation must be dispatched to supply the demand [8]. In terms of economics, demand resources, and more broadly, DERs located near loads may reduce the cost of distant generation, transmission and losses; however, if the decreased demand happens to be near low-cost generation, this may increase the use of the transmission network and increase system losses because the power could seek further markets [5].
The combination of information and communication technologies, decreasing technology costs of distributed energy resources, greater adoption of the distribution level technologies and changes in public policies are causing ripples in the traditional paradigm of the electricity sector. The electric sector is in a period of transition due in part to ubiquity with which DERs are interconnected and the impact they have on markets, policy and regulation, operations and the environment [3,5,21,22,23,24]. New York is a prime and current example for where specific regulatory and market-based changes are happening, through the nascent Reforming the Energy Vision Proceedings [26]. 2. Objective
The objective of this paper is to investigate the impact of distributed technologies on the bulk power system through modeling both the high voltage
3034
Proceedings of the 50th Hawaii International Conference on System Sciences | 2017
URI: http://hdl.handle.net/10125/41524ISBN: 978-0-9981331-0-2CC-BY-NC-ND

transmission and low and medium voltage distribution system. This study utilizes the technique of modeling the entire New York State bulk transmission system with a detailed representation of a single distribution feeder. This research combines the two worlds of transmission and distribution, usually modeled separately, into a single direct current optimal power flow and security constrained economic dispatch and unit commitment optimization. Detailing explicitly the technology and location of the distribution level resources as well as the full scale and breadth of the transmission system in calculation of LMPs, and approximations to DLMPs, including transmission constraints, losses, revenues and environmental residuals. The focus will be on the effects of transmission and distribution network integration including generation LMPs and revenues, average zonal market prices (LMPs), and environmental externalities, such as CO2 emissions, from increasing penetration of DERs.
The research further expands upon the interaction between distribution level resources and the wholesale transmission system. This paper reports on moving the LMP calculation and valuation process deeper into the distribution system (i.e. making the prices more granular). Utilizing a state-of-the-art utility market modeling method interconnected electrically with a radial feeder, it is possible to evaluate the impacts (i.e. economic and physical) from increased penetration of solar photovoltaics (PV), electric batteries and demand response.
Analysis of bulk power system impacts from DERs is nascent and much research and studies are needed to understand the evolving relationship between the two systems. This research seeks to further the discussion on the interaction between transmission and distribution, between centralized and decentralized resources, and analyze the electricity industry of the future. The purpose of this paper strives to continue to define explicitly the impacts from DERs, in a real-world context, in a future electric system that will emit less greenhouse gases, be more reliable, dynamic and efficient.
3. New York State and Reforming the
Energy Vision
Bulk power transmission investments vary by region, and in New York alone between 1997 and 2012 investor owned utilities invested around $4.5 billion in transmission [6]. Investments in infrastructure maintain reliability as well as relieve congestion, replace antiquated equipment and support the integration of renewables [6]. New York State, in 2014, consumed approximately 160,059 GWh of
electric energy with about ¼ of the generation coming from renewables [8]. New York State has over 11,000 miles of transmission lines, where nearly 4,700 will require replacement in the next 30 years [8]. Long Island, New York City and the Lower Hudson Valley, located in the southeastern portion of the State, consume approximately 2/3rd of the electricity consumption, but contain about half of the generation installed capacity; high voltage transmission is expected to be integral in the future electric grid [8]. Reducing demand for electricity in regions of high demand, such as Long Island and New York City, through increased transmission capacity, demand response, new generation and demand-side resources could yield savings for consumers [8].
The New York Public Service Commission has made it clear that there will be a transformation of the electric sector through the Reforming the Energy Vision (REV) initiative [26]. The REV initiative will focus on 6 different policy objectives: Enhancing customer understanding and management of the electric bill, animation of the markets and customer contributions, system efficiency, fuel and resource diversity, reliability and resiliency, and reduction of carbon emissions [7,26]. The State of New York, governed by Andrew Cuomo, set in motion the Clean Energy Standard (CES) of 50% renewable generation by 2020 and according to the white paper published on the CES, the goal is towards 2,688 MW of new installed renewable capacity and over 3,594 GWh/year of renewable energy generation by 2023 [9,10]. According to the 2015 NYISO Power Trends report, through energy efficiency and distributed energy resources, New York is expected to reduce the growth of peak demand on the bulk power system by around 2,700 MW and lower annual energy usage by more than 14,000 GWh in 2025 [8]. 4. Analytic Structure This study of the impact of distributed resources on the bulk power system has been designed around the ability to utilize a state-of–the-art cloud based simulation environment implemented on the Amazon EC2 commercial cloud, pCloudAnalytics™ (pCA) that has been developed by Newton Energy Group (NEG) [19]1. pCA manages the inputs for PSO, organizes the data into scenarios, partitions the scenarios into segments, and uses virtual machines on the “cloud” to process the segments within PSO, displayed in Figure 1.
1 Newton Energy Group (NEG) is a software analytics and consulting company. www.newton-energy.com
3035
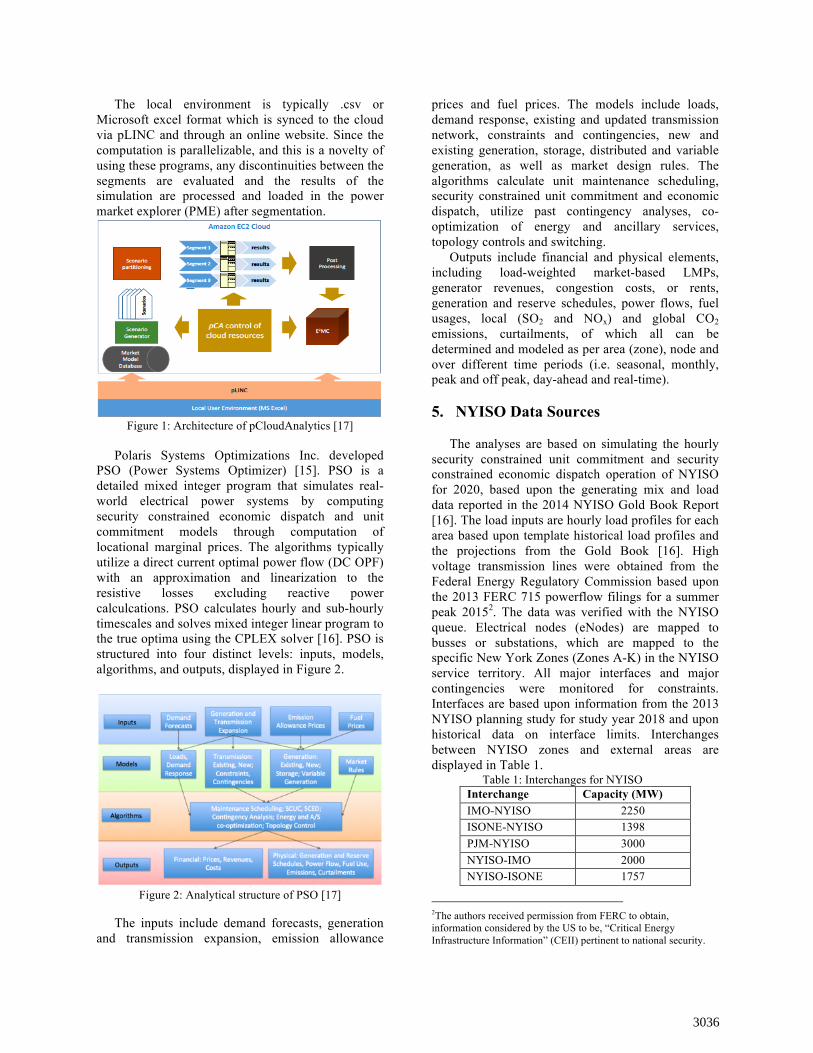
The local environment is typically .csv or Microsoft excel format which is synced to the cloud via pLINC and through an online website. Since the computation is parallelizable, and this is a novelty of using these programs, any discontinuities between the segments are evaluated and the results of the simulation are processed and loaded in the power market explorer (PME) after segmentation.
Figure 1: Architecture of pCloudAnalytics [17]
Polaris Systems Optimizations Inc. developed PSO (Power Systems Optimizer) [15]. PSO is a detailed mixed integer program that simulates real-world electrical power systems by computing security constrained economic dispatch and unit commitment models through computation of locational marginal prices. The algorithms typically utilize a direct current optimal power flow (DC OPF) with an approximation and linearization to the resistive losses excluding reactive power calculcations. PSO calculates hourly and sub-hourly timescales and solves mixed integer linear program to the true optima using the CPLEX solver [16]. PSO is structured into four distinct levels: inputs, models, algorithms, and outputs, displayed in Figure 2.
Figure 2: Analytical structure of PSO [17]
The inputs include demand forecasts, generation and transmission expansion, emission allowance
prices and fuel prices. The models include loads, demand response, existing and updated transmission network, constraints and contingencies, new and existing generation, storage, distributed and variable generation, as well as market design rules. The algorithms calculate unit maintenance scheduling, security constrained unit commitment and economic dispatch, utilize past contingency analyses, co-optimization of energy and ancillary services, topology controls and switching. Outputs include financial and physical elements, including load-weighted market-based LMPs, generator revenues, congestion costs, or rents, generation and reserve schedules, power flows, fuel usages, local (SO2 and NOx) and global CO2 emissions, curtailments, of which all can be determined and modeled as per area (zone), node and over different time periods (i.e. seasonal, monthly, peak and off peak, day-ahead and real-time). 5. NYISO Data Sources
The analyses are based on simulating the hourly security constrained unit commitment and security constrained economic dispatch operation of NYISO for 2020, based upon the generating mix and load data reported in the 2014 NYISO Gold Book Report [16]. The load inputs are hourly load profiles for each area based upon template historical load profiles and the projections from the Gold Book [16]. High voltage transmission lines were obtained from the Federal Energy Regulatory Commission based upon the 2013 FERC 715 powerflow filings for a summer peak 20152. The data was verified with the NYISO queue. Electrical nodes (eNodes) are mapped to busses or substations, which are mapped to the specific New York Zones (Zones A-K) in the NYISO service territory. All major interfaces and major contingencies were monitored for constraints. Interfaces are based upon information from the 2013 NYISO planning study for study year 2018 and upon historical data on interface limits. Interchanges between NYISO zones and external areas are displayed in Table 1.
Table 1: Interchanges for NYISO Interchange Capacity (MW) IMO-NYISO 2250 ISONE-NYISO 1398 PJM-NYISO 3000 NYISO-IMO 2000 NYISO-ISONE 1757
2The authors received permission from FERC to obtain, information considered by the US to be, “Critical Energy Infrastructure Information” (CEII) pertinent to national security.
3036

Interchange Capacity (MW) NYISO-PJM 2700 HTP DC-PJM 660 NEPT-PJM 660 LIND VFT-PJM 315 CSC-NPX 330 CEDARS-HQ 100 NYISO-HQ 1000
New generator additions and retirements were incorporated into the data set. Thermal unit characteristics were also modeled in PSO, including operation and maintenance costs, start-up costs, forced and planned outages, quick start, minimum up and down time, heat rate curves, and regulation and spinning reserve capabilities provided by the North American Electric Reliability Corporation (NERC) Generating Availability Report [20]. Heat rates and emission rates for each unit type were provided by SNL Financial Services and developed by NEG. Fossil fuel costs are based upon SNL Financial reporting of forward prices for natural, petroleum and coal and NEG forecasts and assumptions for monthly prices.
Solar PV are modeled as fixed array installations (open rack), 20o array tilt, 180o array azimuth, with 14% system losses and 96% inverter efficiency and a capacity factor of 13.8%. Battery electric storage is modeled with 92.5% efficiency. There are 3 types of ancillary reserves in the NYISO market: 30 minute spinning reserves, 10 minute spinning and 10-minute non-spinning reserves. 6. The T-D Interface Case Study
There are six investor owned utilities that own and operate the distribution wires and infrastructure throughout all of New York State. Figure 3 displays zones throughout New York State. This study focuses on the interface between the bulk power system and the distribution system; the entire New York State transmission system with the interconnection point to the distribution feeder occurring within Zone C.
Figure 3: New York State ISO Zones [11]
Utility companies own and operate a large
percentage of the energy and gas services in upstate New York. Through collaboration with a Utility company, data was collected for a distribution level feeder representing a sample set of low voltage lines and transformers. A representation of the distribution feeder is displayed in Figure 4. The large red triangle represents the transmission-distribution interface substation, large red star represents a critical customer, the thick blue line represents the distribution feeder, and the “Grid” represents the larger transmission bulk power system. For simplicity, the detail of the transmission system is not shown, but does include the entire New York State bulk power system including thousands of substations, over ten-thousand lines with rated capacities over 34.5kV and over 700 “centralized” power generation facilities.
Figure 4: A distribution feeder located in Zone C
3037
The added distribution feeder has 148 electrical nodes that were additionally modeled, at a voltage level of 12.5 kV and 2 nodes at a voltage level of 4.8 kV. The 2 nodes at 4.8 kV are the farthest distance from the transmission-distribution interface substation. The loads, both residential and non-residential, connected to the added distribution feeder have a peak demand of approximately 15 MW. The feeder is operated radially and connected to the transmission system via a single transmission substation. The data obtained for the lower voltage distribution network was integrated into the model for the New York State transmission network.
Extending the optimization modeling to include a distribution feeder enables the study to determine the impact of distributed energy resources, modeled in more granularity, on the bulk power system. DERs were “installed” on nodes at voltage levels down to 4.8 kV. The transmission substations in New York State range in voltage levels from 34.5 kV up to 500 kV. The model utilized, Power Systems Optimizer (PSO) described in Section 5, calculates security constrained economic dispatch and unit commitment, and locational marginal prices for the entire transmission network co-optimized with the effects from distributed energy resources.
In the current study, rooftop solar PV was “installed” in the amount of 1MW and 10MW, electric battery storage in amounts of 1MW and 3MW as well as demand response by varying the number of hours that this resource sheds load in amount of 20, 40, 80, 160, and 320 hours out of the entire year (8784 hours in projected year 2020). Solar PV energy generation data was obtained from the NREL PV Watts calculator, electric batteries were modeled after the Tesla Powerwall and the demand response criteria and load shedding was modeled after the behavioral demand response capability of OPower to, reduce total zonal consumption between 5-23% and, reduce 3-5% of energy usage during peak demand hours [12,13,14].
Modeling distributed solar PV and battery electric storage is through adding an injector or generation source at the specific nodes. For solar PV, the energy generation is a deterministic amount provided by outputs from PV Watts. The energy generation schedules are applied to the nodes on the feeder. Battery electric storage is modeled as a Tesla Powerwall battery-pack and is therefore a price arbitrage resource working between the day-ahead and real-time markets; the devices will charge during off-peak times and discharge during peak times using the day-ahead price signals to charge and discharge in real-time.
Demand response intuitively is the reduction in peak demand. Reducing demand can be modeled in a few ways, two specific ways include: (1) the load can physically reduce the consumption of electricity (i.e. shutting off lights, not running washing machines, turning off devices, changes temperature controls on thermostat, etc) and (2) there is a generator on the premises of the load which generates without providing export power to the grid (i.e. essentially, from the grid operator’s perspective, the load and generation on the premises net and the net load is equal to the generation subtracted from the load). The mechanism for which demand response can act in wholesale and other markets depends on the market design of the specific region, for instance in New York, demand response can be located on the “supply side” or on the “demand side” as price-responsive load [25].
Demand response in this analysis is modeled as type (2) mentioned above. The nodes on the feeder are loads, but also include an injector on the premises that “injects” power or reduces demand when the peaks occur, thereby acting as nodes with demand response capability. The demand response was a must-run resource, meaning that the resource was never curtailed. Technologies that are not modeled as must-run such as other large-scale wind or solar PV are optimized within PSO in the traditional fashion and may be curtailed at times when it is beneficial to the system.
This analysis investigates the impact of DERs on the bulk power system by reverse engineering as well as comparing different scenarios to a base-case that does not include any penetration of distributed energy resources co-optimized within the model. Although the base-case does not have any direct explicit representation of distributed energy resources, the zonal projections for loads that are used are values obtained from the NYISO Gold Book and inherently expresses the loads with continued penetration of solar PV and energy efficiency, in which the first installment was only implemented in the 2015 Gold Book approximations.
As a frame of reference for the types and penetration levels of certain resources, this study does consider goals set forth by the New York State Public Service Commission and Governor Andrew Cuomo. A practice of reverse engineering was used in this study, which provides quantitative results for certain impacts that would be caused by different projected DER technologies and penetrations. By comparing a multiplicity of scenarios of DER technology and penetrations to the base-case, the impact on the bulk power system from distribution level resources can be understood because the
3038

changes and outputs are a direct result of the distributed energy resources in the model. 7. Results
Figure 5 presents the peak summer and winter load for a week for the feeder, including the 150 distribution nodes modeled.
0"
2"
4"
6"
8"
10"
12"
14"
16"
1" 5" 9" 13"
17"
21"
25"
29"
33"
37"
41"
45"
49"
53"
57"
61"
65"
69"
73"
77"
81"
85"
89"
93"
97"
101"
105"
109"
113"
117"
121"
125"
129"
133"
137"
141"
145"
149"
153"
157"
161"
165"
Load"(M
W)"
Hours"Winter"Feeder"Load" Summer"Feeder"Load"
Figure 5: Winter and summer peak weekly load for distribution feeder
When 1 MW of solar PV is installed on the
distribution feeder in equal proportion across the nodes, the impact on the loading pattern of the network changes in kind, as shown in Figure 6 and 7, for winter and summer, respectively.
0"
2"
4"
6"
8"
10"
12"
14"
16"
1" 5" 9" 13"
17"
21"
25"
29"
33"
37"
41"
45"
49"
53"
57"
61"
65"
69"
73"
77"
81"
85"
89"
93"
97"
101"
105"
109"
113"
117"
121"
125"
129"
133"
137"
141"
145"
149"
153"
157"
161"
165"
Load"(M
W)"
Hours"Net"Consump?on" Solar"PV"Injec?on"
Figure 6: Winter peak weekly consumption pattern with 1 MW of solar PV on the distribution feeder
0"
2"
4"
6"
8"
10"
12"
14"
16"
1" 5" 9" 13"
17"
21"
25"
29"
33"
37"
41"
45"
49"
53"
57"
61"
65"
69"
73"
77"
81"
85"
89"
93"
97"
101"
105"
109"
113"
117"
121"
125"
129"
133"
137"
141"
145"
149"
153"
157"
161"
165"
Load"(M
W)"
Hours"Net"Consump?on" Solar"PV"Injec?on"
Figure 7: Summer peak weekly consumption pattern with 1 MW of solar PV on the distribution feeder
With larger penetrations of solar PV, for instance 10MW, there are even hours in the winter of low demand with high solar PV penetration that there would be net export from the distribution feeder, or impact of energy from the lower distribution network, to the bulk power system. The energy generated in the lower distribution system might impact the bulk power system by removing the need for a more expensive generator farther away to produce another increment of power, when the energy can be generated from more local sources, potentially lowering losses throughout the transmission system. Figure 8 and 9 display the impact of 10MW of solar PV on the distribution system. Hour 109 generates an extra 430 kWh that the local load does not consume; that would be energy that might be transported externally or stored by batteries.
0"
2"
4"
6"
8"
10"
12"
14"
16"
1" 5" 9" 13"
17"
21"
25"
29"
33"
37"
41"
45"
49"
53"
57"
61"
65"
69"
73"
77"
81"
85"
89"
93"
97"
101"
105"
109"
113"
117"
121"
125"
129"
133"
137"
141"
145"
149"
153"
157"
161"
165"
Load"(M
W)"
Hours"Net"Consump?on" Solar"PV"Injec?on"
Figure 8: Winter peak weekly consumption pattern with 10 MW of solar PV on the distribution feeder
0"
2"
4"
6"
8"
10"
12"
14"
16"
1" 5" 9" 13"
17"
21"
25"
29"
33"
37"
41"
45"
49"
53"
57"
61"
65"
69"
73"
77"
81"
85"
89"
93"
97"
101"
105"
109"
113"
117"
121"
125"
129"
133"
137"
141"
145"
149"
153"
157"
161"
165"
Load"(M
W)"
Hours"Net"Consump?on" Solar"PV"Injec?on"
Figure 9: Summer peak weekly consumption pattern with 10 MW of solar PV on the distribution feeder
Figure 10 displays the average market price for
the entire Zone C in NYISO and the average generator LMP that solar PV would receive from the market.
3039

36#
37#
38#
39#
40#
41#
42#
43#
44#
Base# 1# 10#
$/MWh&
Solar&PV&Penetra1on&(MW)&Average#LMP# Solar#PV#"Owner"#LMP#
Figure 10: Average market price and generator LMP for solar PV “Owner”
Figure 10 displays average prices over the course
of 8784 hours for the entire year 2020. Note, from Figure 10, that the solar “owner” price is higher than the average market price for the zone, but decreases at a more rapid pace than the average market price. Figure 11 displays the DLMP approximations for the individual nodes on the distribution network, with the first node being the transmission-distribution substation interface and the node 150 being a 4.8kV node.
35#
40#
45#
50#
55#
60#
3#6#9#
12#
15#
18#
21#
24#
27#
30#
33#
36#
39#
42#
45#
48#
51#
54#
57#
60#
63#
66#
69#
72#
75#
78#
81#
84#
87#
90#
93#
96#
99#
102#
105#
108#
111#
114#
117#
120#
123#
126#
129#
132#
135#
138#
141#
144#
147#
150#
$/M
Wh#
Distribu8on#Nodes#0# 1MWPV# 10MWPV#
Figure 11: DLMP approximations on the distribution feeder
When solar PV and batteries are placed in the same distribution feeder, the impacts on the revenues the “owners” of these resources would receive are changed dramatically, displayed in Figure 12.
37#
38#
39#
40#
41#
42#
43#
Base# PV10#&#Ba1ery1# PV10#&#Ba1ery3#
$/MWh&
Penetra-ons&and&Combina-ons&of&DER&(MW)&Average#LMP# "DER#Owner"#LMP#
Figure 12: Average market price and generator LMP for solar PV and electric battery “Owners”
The average LMP for the battery storage and solar
PV “owners” decrease slower compared to only the
solar PV “owner” prices earned in the wholesale market. The battery acts as potentially a price arbitrage resource with higher penetration levels of installed storage capacity.
Another case study analyzed the impact of 1MW solar PV installed at a commercial load site along the feeder. The location is the critical customer, displayed in Figure 4 as the red star. In the coming Figures, the term “Placed” is used to refer to the scenario where the entirety of the 1MW of solar PV is installed on the premises of only the critical customer, as opposed to the comparison cases which are the base case with no solar PV and the case where 1MW of solar PV is evenly distributed across the 150 nodes of the distribution level feeder.
Figure 13 displays the average distribution locational marginal price for node 133 and node 134. The critical customer was arbitrarily labeled as node 134. Comparing the yellow line to the orange line, it is evident that there is a larger drop in market price when the 1MW is placed on the specified node as well as the closer surrounding nodes.
54.2%
54.4%
54.6%
54.8%
55%
55.2%
55.4%
55.6%
55.8%
Base%Case% 1%Average'Distrib
u.on
'Nod
al'Pric
e'($/M
Wh)'
Solar'PV'Penetra.on'(MW)'
1MW%(133)% 1MW%(134)% 1MW%Placed%(133)% 1MW%Placed%(134)% Figure 13: Difference in nodal DLMP values for two nodes
Shown in Figure 14, is the difference in the
average DLMP values for the averages of the nodes at the specified voltage levels of 12.5kV and 4.8kV. The yellow and the grey lines represent the scenario where the solar PV is placed strictly on the critical customer node and therefore results in a larger decrease in market price compared to the evenly spread solar PV case.
48#
50#
52#
54#
56#
58#
60#
Base#Case# 1#Average'Distribu.
on'Nod
al'Price'
($/M
Wh)'
Solar'PV'Penetra.on'(MW)'12.5V# 4.8kV# 12.5kV#(Placed)# 4.8kV#(Placed)#
3040

Figure 14: DLMPs according to voltage levels and by distribution of solar PV
Figures 15 and 16 display the decrease in both
CO2 emissions and average NYISO market price with the 1MW solar PV placed strictly on the critical customer in zone C on the feeder scenario compared to the base case, respectively.
26.4%
26.405%
26.41%
26.415%
26.42%
26.425%
26.43%
Base%Case% 1MW%on%Cri5cal%Customer%
Total&CO2&Em
ission
s&&(M
M&of&M
etric
&Ton
nes)&
Solar&PV&Penetra9on&(MW)& Figure 15: CO2 emissions for the solar PV scenario on the
critical customer
37.2%
37.25%
37.3%
37.35%
37.4%
37.45%
37.5%
37.55%
Base%Case% 1MW%on%Cri4cal%Customer%
Average'Market'P
rice'($/M
Wh)'
Placed'Solar'PV'Penetra:on'(MW)' Figure 16: Average market price for the critical customer
node with 1MW solar PV penetration
Table 2 below displays the feeder average DLMP for the 1MW solar PV evenly distributed and compared to the scenario where all 1MW solar PV was placed on the critical customer node.
Table 2: Average distribution feeder DLMP
1MW 1MW$(Placed)Feeder$Price$($/MWh) 49.37 49.35
Demand response will limit the demand on the
feeder during hours of peak consumption and therefore change the loading pattern. Shown in Figure 17 is the normal loading pattern in blue and the adjusted loading pattern with demand response shown in the orange color for the winter peak week and Figure 18 displays the loading pattern in blue and loading pattern with demand response in the orange color for the peak summer week.
7"
8"
9"
10"
11"
12"
13"
14"
1" 5" 9" 13"
17"
21"
25"
29"
33"
37"
41"
45"
49"
53"
57"
61"
65"
69"
73"
77"
81"
85"
89"
93"
97"
101"
105"
109"
113"
117"
121"
125"
129"
133"
137"
141"
145"
149"
153"
157"
161"
165"
Load
%(MW)%
Peak%Winter%Week%(168%Hours)%Load" Load"with"Demand"Response"
Figure 17: Peak winter week with demand response
6"
7"
8"
9"
10"
11"
12"
13"
14"
15"
16"
1" 5" 9" 13"
17"
21"
25"
29"
33"
37"
41"
45"
49"
53"
57"
61"
65"
69"
73"
77"
81"
85"
89"
93"
97"
101"
105"
109"
113"
117"
121"
125"
129"
133"
137"
141"
145"
149"
153"
157"
161"
165"
Load
%(MW)%
Peak%Summer%Week%(168%Hours)%Load" Load"with"Demand"Response"
Figure 18: Peak summer week with demand response
Figure 17 and 18 display the demand response for the peak winter and summer week. The demand response criteria utilized was for a 3% reduction in total energy consumption therefore out of the entire 80531.375 MWh load on the feeder for the year, 2377.37 MWh were shaved; this amounts to approximately 2351 hours of demand response. Figure 19 displays the loading pattern for 8784 hours for the year 2020 with and without demand response.
6"
7"
8"
9"
10"
11"
12"
13"
14"
15"
16"
1"
87"
173"
259"
345"
431"
517"
603"
689"
775"
861"
947"
1033"
1119"
1205"
1291"
1377"
1463"
1549"
1635"
1721"
1807"
1893"
1979"
2065"
2151"
2237"
2323"
2409"
2495"
2581"
2667"
2753"
2839"
2925"
3011"
3097"
3183"
3269"
3355"
3441"
3527"
3613"
3699"
3785"
3871"
3957"
4043"
4129"
4215"
4301"
4387"
4473"
4559"
4645"
4731"
4817"
4903"
4989"
5075"
5161"
5247"
5333"
5419"
5505"
5591"
5677"
5763"
5849"
5935"
6021"
6107"
6193"
6279"
6365"
6451"
6537"
6623"
6709"
6795"
6881"
6967"
7053"
7139"
7225"
7311"
7397"
7483"
7569"
7655"
7741"
7827"
7913"
7999"
8085"
8171"
8257"
8343"
8429"
8515"
8601"
8687"
8773"
Load%(MW)%
Year%2020%(Hours)%Normal"Load" Load"with"Demand"Response"
Figure 19: 2020 hourly loading patterns with and without DR
A test of a 3% reduction in peak demand as well
as 5% peak reduction in demand was analyzed utilizing PSO. Figure 20 displays the average load zonal market price compared to the market price seen by the DR “owner.” The DR “owner” would receive a generator LMP from the market and the generator LMP multiplied by the energy generated (or in the case of DR, power not consumed) is the revenue. The average zonal market price in the entire zone C does
3041

fluctuate across the different penetrations of demand response. The demand response market prices curve is much steeper and decreases faster than the average market price, especially given the fluctuations in the average market price for the zone, note the secondary axis for the DR “owner” price.
52#
53#
54#
55#
56#
57#
58#
59#
31.72#
31.74#
31.76#
31.78#
31.8#
31.82#
31.84#
31.86#
31.88#
Base# 3# 5#
Market'P
rice'for'D
R'"O
wne
r"'($
/MWh)'
Average'Market'P
rice'($/M
Wh)'
Demand'Response'Total'Energy'ReducEon'During'Peak'(%)'Average#Market#Price#($/MWh)# Average#DR#"Owner"#Price#($/MWh)#
Figure 20: Market price for zone C and market price for DR “owner”
An interesting observation is displayed in Figure
21 and that is that the revenue per energy of demand response reduced, the DR “owner” receives going from 3% to 5% is decreasing.
52#
53#
54#
55#
56#
57#
58#
59#
Base# 3# 5#
Yearly'DR'"O
wne
r"'Revnu
e'pe
r'MWh'
Redu
ced'($/M
Wh)'
Demand'Response'Total'Energy'ReducAon'During'Peak'(%)' Figure 21: Marginal revenue for DR “owner
These are relatively small penetrations when
considering the entire demand and load for all of zone C and of New York. The demand response modeled is only on a specific feeder of 15 MW peak demand. The impact of demand response is not negligible. Shown in Figure 22 and 23 are the impacts on CO2 emissions as well as SO2 and NOx emissions, respectively. With an increase in penetration of demand response from 3% to 5% reduction in demand during peak hours, global (i.e. CO2) and local (i.e. SO2 and NOx) emissions are reduced. This is due in part to the reduction in the need for peaking units to supply the last few MWh of energy because demand response provides for it instead. The power system is large, robust and flexible and can accommodate small-scale penetrations of DERs.
26.42%
26.43%
26.44%
26.45%
26.46%
26.47%
3% 5%
!Zon
e!C!To
tal!CO2!Em
ission
s!!!!!!!!!!!!
(MM!M
etric!To
nnes)!
Demand!Response!Total!Energy!Reduc=on!During!Peak!(%)! Figure 22: Impact on CO2 emissions in zone C from
demand response
9.88$
9.89$
9.9$
9.91$
9.92$
9.93$
9.94$
9.95$
9.96$
12.08$12.1$
12.12$12.14$12.16$12.18$12.2$12.22$12.24$12.26$12.28$12.3$
3$ 5$
Zone
%C%Total%SO2%Em
ission
s%(1,000%
Metric%To
nnes)%
%Zon
e%C%To
tal%N
Ox%Em
ission
s%%%%%%%%%%%%
(1,000%M
etric%To
nnes)%
Demand%Response%Total%Energy%ReducCon%During%Peak%(%)%NOX$ SO2$
Figure 23: Impact on NOx and SO2 emissions in zone C from demand response
8. Conclusions This paper has focused on the presentation of case
analyses of the impact of the addition of three distribution level energy technologies that are anticipated to be salient factors in the changing industry structure; the trend is towards a coexistent fleet of decentralized and centralized resources that provide services and a new market-based paradigm. DLMPs were approximated using a DC OPF and co-optimized in a real-world power system with traditional transmission level LMPs. On a real-world test feeder, demand response, battery electrical storage and solar PV were installed varying by location, as well as capacity, depending on the specified case study.
A few conclusions can be drawn from this analysis, insight and research: firstly, with small penetrations of DERs, impacts can ripple through the power system, effecting the bulk transmission system, potentially disrupting conventional operations and wholesale market-based returns; secondly, location of DERs matter quite significantly, and depending upon the region, the levels of losses and congestions, the generation mix and the demand profiles, the impact from DERs will change; thirdly, the approximations to DLMPs yield insights into the current theoretical, but foreseeable future for market structures that enable penetrations of distribution level resources, and lastly economic impacts are not the only drivers for adoption of DERs, environmental
3042

impacts are critical and externalities should not be overlooked when analyzing system-wide impacts from DERs.
9. References [1] H. Rohracher, “Energy systems in transition: contributions from social sciences” Int. J. Environmental Technology and Management, Vol. 0, Nos. 2/3, 2008. [2] Overview of the Clean Power Plan: Cutting carbon Pollution From Power Plants Fact Sheet. U.S. Environmental Protection Agency, August 2015. [3] I. J. Pérez-Arriaga, The MIT Utility of the Future Prospectus 2015. Massachusetts Institute of Technology 2015. [4] G. Fitzgerald et al., “The Economics of Battery Energy Storage. How Multi-use, customer-sited batteries deliver the most services and value to customers and the grid” Rocky Mountain Institute 2015. [5] Quadrennial Energy Review: Energy Transmission, Storage, and Distribution Infrastructure. U.S. Department of Energy, April 2015. [6] A. Aniti, “Electricity transmission investments vary by region” U.S. Energy Information Administration, September, 2014. [7] A. Zibelman, “REVing Up the Energy Vision in New York” IEEE Power & Energy Magazine, May/June 2016. [8] New York Independent System Operator (2015). Power Trends 2015: Rightsizing the Grid. Htt[://www.nyiso.com/public/webdocs/media_room/press_release/2015/Child_PowerTrends_2015/ptrends2015_FINAL.pdf [9] Case 15-E-0302, Proceeding on Motion of the Commission to Implement a Large-Scale Renewable Program and a Clean Energy Standard, Notice Soliciting Comments and Providing for Technical Conference and Public Statement Hearings (issued January 15, 2016)(“Clean Energy Proceeding”) [10] Clean Energy Proceeding, Clean Energy Standard White paper – Cost Study (April 8, 2016), pp. 279, 281. [11] NYSEG, “For suppliers and partners, independent system operator (ISO) map” http://www.nyseg.com/SuppliersAndPartners/electricityescos/isomaps/ 2016 [12] NREL, “PV Watts.” http://pvwatts.nrel.gov/ 2016 [13] Tesla, “Powerwall.” https://www.teslamotors.com/powerwall 2016 [14] Opower, “Demand Response.” https://opower.com/products/demand-response/ 2016 [15] http://www.psopt.com [16] http://www-01.ibm.com/software/commerce/optimization/cplex-optimizer/ [17] R. Tabors, et al., “Rate Impact on LIPA Resident and Commercial Customers of 250MW Offshore Wind Development on Eastern Long Island.” Tabors Caramanis Rudkevich, 2014. http://www.aertc.org/docs/Rate%20Impact%20LIPA%20Cust.pdf
[18] New York Independent System Operator, “2014 Load and Capacity Data” Gold Book, April 2014. [19] A. Rudkevich, “Use of Cloud Computing in Power Market Simulations.” Presented at FERC Technical Conference on Increasing Real-Time and Day-Ahead Market Efficiency through Improved Software, Washington, DC, June 25, 2014. [20] North American Electric Reliability Corporation, Generating Availability Data System (GADS), 2014. [21] M. Birk, “Impact of Distributed Energy Resources on Locational Marginal Prices and Electricity Networks.” Massachusetts Institute of Technology, Institute for Data, Systems, and Society, Technology and Policy Masters Thesis, 2016. [22] J. Jenkins, “Economic Regulation of Electricity Distribution Utilities Under High Penetration of Distributed Energy Resources: Applying an Incentive Compatible Menu of Contracts, Reference Network Model, and Uncertainty Mechanisms.” Massachusetts Institute of Technology, Engineering Systems Division, Technology and Policy Masters Thesis, 2014. [23] R. Poudineh et al., “Distributed generation, storage, demand response and energy efficiency as alternatives to grid capacity enhancement. Energy Policy, 67, 222-231. Doi:10.1016/j.enpol.2013.11.073 [24] I. Pérez-Arriaga et al., “A Framework for Efficient Distribution Network Charges: New principles for new problems.” MIT CEEPR and Utility of Future Working Paper, 2014. [25] R. Mukerji, “Demand Response in New York: Current successes and future direction.” 2014 IEEE Power and Energy Society General Meeting, 2014. [26] Case 14-M-0101, Proceeding on Motion of the Commission in Regard to Reforming the Energy Vision, Order Adopting Regulatory Policy Framework and Implementation Plan (issued February 26, 2015).
3043