Embed Size (px)
Citation preview
Ecological Economics 70 (2010) 34–42
Contents lists available at ScienceDirect
Ecological Economics
j ourna l homepage: www.e lsev ie r.com/ locate /eco lecon
Analysis
The impact of discounting emission credits on the competitiveness of different CDMhost countries
Paula Castro ⁎, Axel MichaelowaInstitute of Political Science and Center for Comparative and International Studies, University of Zurich, Hirschengraben 56, 8001 Zurich, Switzerland
⁎ Corresponding author. Tel.: +41 44 634 5090; fax:E-mail addresses: [email protected] (P. Castro), axe
(A. Michaelowa).1 Throughout this paper, the term “emission credits”
Certified Emission Reductions (CERs).
0921-8009/$ – see front matter © 2010 Elsevier B.V. Adoi:10.1016/j.ecolecon.2010.03.022
a b s t r a c t
a r t i c l e i n f oArticle history:Received 20 May 2009Received in revised form 16 February 2010Accepted 30 March 2010Available online 16 September 2010
Keywords:Climate policyKyoto ProtocolClean Development MechanismDiscountingAbatementCostsDeveloping countries
Discounting the value of emission credits has been proposed as a possible approach for addressing some ofthe shortcomings of the Clean Development Mechanism (CDM). It could be used to compensate for non-additional CDM projects; to increase the incentive for advanced developing countries to move from the CDMto own mitigation commitments; and to improve the competitiveness of less developed countries as hostsfor CDM projects. We assess the impact of discounting on the distribution of CDM projects in host countries,with a special focus on Least Developed Countries (LDCs). CDM-specific abatement cost curves are built for 4regions: China, India, other advanced Asian countries and LDCs. Abatement costs are estimated using theinformation provided in the project documentation of 108 projects from 17 subtypes in 16 host countries.Abatement potentials are derived from the current CDM pipeline for each region. For LDCs, we additionallyinclude an optimistic potential estimation by adding to the current pipeline the potential found by a WorldBank study for LDCs in Sub-Saharan Africa. We then assess the effect of two emission credit discountingschemes on these abatement cost curves. Credit discounting is differentiated by host countries, based on anindex composed of per capita GDP and per capita emissions. In the first scheme, it only affects the mostadvanced CDM host countries; in the second one it also affects China. We find that discounting has an impacton the competitiveness of individual CDM host countries in the carbon market, as it affects their abatementcost curves. It could become an instrument for incentivising advanced developing countries to leave the CDMand engage in other farther-reaching climate-related commitments, as a result of the resulting emissioncredit cost increases. However, even with discounting, LDCs remain unimportant in terms of abatementpotential if the financial, technical and institutional barriers to CDM development in these countries are notovercome.
+41 44 634 [email protected]
is used to refer to the CDM's
ll rights reserved.
© 2010 Elsevier B.V. All rights reserved.
1. Introduction
Through the Clean Development Mechanism (CDM), greenhousegas emission reductions from projects in developing countries can beacquired by industrialised countries to comply with their KyotoProtocol emission reduction targets. By the end of 2008 (UNEP RisoeCentre, 2009), the CDM has mobilised almost 4500 projects, out ofwhich 1300 have been formally registered with the CDM ExecutiveBoard and are thus accredited for generating emission credits1. Eachtonne of CO2-equivalent emission reductions achieved by the CDMgenerates one emission credit, which is then used by industrialisedcountries (or companies in them) to offset their own emissions. Thus,each tonne reduced by a CDM project allows increasing emissions inindustrialised countries by one tonne. Theoretically, this is no problem
as long as the reduction from the CDM project is real and as long asincentives for introduction of emission reduction policies in develop-ing countries are not distorted. About 2.7 billion emission credits areexpected to be generated in total by CDM projects by 2012.
The key criterion for ensuring that emission reductions from CDMprojects are real is “additionality”. Additionality means that a CDMproject has to be outside the “business-as-usual” developmentscenario for its region or country. This is, there are financial, economic,technical or other barriers for its implementation, which only theCDM incentive manages to overcome. This is a necessary condition forCDM projects to really contribute to reducing global GHG emissions: ifa CDM project is not additional, using its emission credits to offsetemissions in industrialised countries will lead to an actual increase inemissions. There is substantial criticism that a significant amount ofCDM projects does not have a very credible additionality argumen-tation (see e.g. Castro and Michaelowa, 2008; Michaelowa andPurohit, 2007; Schneider, 2007).
The CDMwas designedwith the idea of an instrument to introducedeveloping countries to climate policy in a voluntary manner, with-out affecting their development objectives. It was conceived as a
35P. Castro, A. Michaelowa / Ecological Economics 70 (2010) 34–42
transitional step before these countries also commit to own emissionreduction targets. However, a shortcoming of the CDM is that thefinancial subsidy generated by the sale of emission credits may turninto a disincentive for advanced developing countries to take upemissions reduction commitments. Further, the CDM project portfoliois very unevenly distributed across potential host countries. China,India and Brazil account for over 71% of all projects and 76% ofexpected emission credits. Least Developed Countries (LDCs) host just41 CDM projects in the pipeline (0.9%), out of which only 10 projectsare registered. Sub-Saharan Africa (SSA) hosts 66 projects, but SouthAfrica accounts for 41% of these (UNEP Risoe Centre, 2009). TheMarrakech Accords that specify the detailed rules of the mechanismsunder the Kyoto Protocol emphasise the importance of an equitablegeographical distribution of CDM projects across countries andregions (UNFCCC, 2001); several studies have discussed the impactof this distribution on equity, efficiency and environmental con-siderations (Cosbey et al., 2005; Keller, 2008). Mitigation potential,institutional CDM capacity and general investment climate have beenused as predictors of attractiveness of CDM host countries for CDMprojects (Jung, 2005). Further, familiarity between investing countryand host country, operationalised as past bilateral trade, past bilateralaid and colonial relationship, was found by Dolšak and BowermanCrandall (2007) to be an even more important factor explaining CDMlocation decisions. More recently, Keller (2008) finds that populationsize is the most important variable influencing the location of CDMprojects across host countries, which gives a different perspective tothe discussion on the “unfairness” of CDM project distribution. Whenexcluding the four largest host countries from the sample, he alsofinds that abatement potential, institutional framework and CDMcapacities all have some explanatory power among countries ofsimilar size.
While economic efficiency considerations dictate that the emissionreductions should first take place wherever they are cheaper, equityconcerns suggest that the CDM incentive should be more proactivelydirected towards less developed countries. These concerns arepolitically founded on the second goal of the CDM, which is tocontribute to sustainable development in its host countries. Further,more autonomous climate mitigation action by advanced developingcountries (beyond just offsetting) is needed to achieve the long-termenvironmental goals of the climate convention, which would meanthat a system for gradually phasing out the CDM in these countries isneeded (Cosbey et al., 2005; Schneider, 2008).
Discounting the value of emission credits according to hostcountries has been proposed as a possible approach for addressingthese shortcomings of the CDM. As we will elaborate further below,discounting could be used to compensate for fictitious reductionsfrom non-additional CDM projects; it could be designed to increasethe incentive for advanced developing countries to move from theCDM to own mitigation commitments; and it could also be applied toimprove the competitiveness of less developed countries as hosts forCDM projects.
This paper thus seeks to assess the impact that a new policy,discounting of emission credits, could have on the geographicaldistribution of the CDM, with a special focus on Least DevelopedCountries and Sub-Saharan Africa. Section 2 briefly summarises theexisting research on discounting emission credits and its possibleimpacts on carbon markets. In Section 3 we discuss the relationshipbetween discounting of emission credits and host country compet-itiveness in the CDM. In Section 4 we provide estimates for emissioncredit costs and potentials for different project types in Africa andother CDM host regions, based on previous studies and our ownempirical research on the current CDM project portfolio. Section 5analyses the impact of two emission credit discounting schemes onthe competitive position of these CDM host regions by looking at theremaining CDM potential in these country groups. Section 6 discussesthe results and draws the conclusions from this study.
2. Discounting emission credits
Discounting CDM emission reductions means that not all reduc-tions generated by a project enter the carbon market, so that part ofthe effort is not used to offset emissions elsewhere, but provides realglobal GHG emission reductions (Schneider, 2008).
Why is such a discounting policy desirable, if the CDM is intendedtomake emission reductions cheaper? Discounting was first proposedby Greenpeace (2000) as a measure to safeguard the environmentalintegrity and the additionality of the CDM. This was a response to thewidespread critique that it is very difficult to prove that a projectproposed as CDM is not a business-as-usual situation and is thusleading to “real” emission reductions. Using discounting to safeguardadditionality is however a complex task, as it would imply knowingthe share of non-additional credits being issued despite all qualitychecks, andmodifying the discount factor over time to reflect possiblechanges in this share. This would deter investors and, moreimportantly, penalise both non-additional and truly additionalprojects. For a numerical example of how additionality-baseddiscounting could work, see Michaelowa (2008).
The early discussion on discounting also suggested that it could beused to compensate for the uncertainty related to establishingbaselines, to provide an incentive for greater domestic action incountries with reduction targets, and to penalise negative social andenvironmental effects of CDM projects (Jackson and Begg, 1999). Tenyears later, the discussion still focuses on using discounting forimproving the CDM's environmental integrity, while influencingother shortcomings of themechanism as well. Environmental Defense(2007), for example, proposed to differentiate discount rates acrosscountries in order to “discourage further use of the CDM by largeemitting developing countries and to direct the mechanism towardspoorer developing countries” (ibid, p. 2). This is in line with thepolitical objective, enshrined in the Kyoto Protocol itself, that the CDMshould assist developing countries in achieving sustainable develop-ment, and that it should do it in an equitable manner (UNFCCC, 2001).It is also in line with the now recognised fact that the current systemof emission reduction targets for industrialised countries and the CDMfor developing countries is not enough for ensuring a long-termstabilisation of the climate system (Gupta et al., 2007). More climatemitigation action by developing countries, especially the large andadvanced ones, is needed.
Chung (2007) proposed discounting as contribution of developingcountries to global emission reductions without having to resort tocountry-specific commitments. This idea could be developed into asystem where discounting provides an incentive for advanceddeveloping countries to take up emissions reduction commitments.Discounting would build such an incentive, as taking up a commit-ment means that reductions achieved through domestic reductionprojects count 100%, whereas under the discounting scheme, theywould be valued less. The incentive would increase if the discountfactor was progressively linked to the level of development of the hostcountry (Michaelowa, 2008). Discounting by countries could also beused to promote CDM project development in African and LeastDeveloped Countries by applying lower or no discount rates (or evengranting more credits than reductions actually achieved) for projectsin these countries (Schneider, 2008).
Discounting could also be varied according to project types, assuggested by Chung (2007) and elaborated by Schneider (2008).Thus, projects with beneficial characteristics could be favoured overless desired ones by assigning them a lower discount rate, no discountrate or even a multiplier above 1. For example, projects with largesustainable development benefits or using innovative technologiescould be favoured, while projects with very large windfall profits orquestionable additionality could be burdened. Despite these promis-ing features, agreeing upon such a set of different discount rates couldbecome very challenging at the UN level. Sustainable development
36 P. Castro, A. Michaelowa / Ecological Economics 70 (2010) 34–42
priorities are defined differently by each country and their valuation isstill very subjective and complex. The level of innovativeness of atechnology is subjective to contextual factors, e.g. to the host country.Additionality depends not only on project type, but also on country-specific factors. This complexity would make it difficult even fortechnical experts to set appropriate discounting factors. Therefore wedo not assess this type of discounting.
There are basically two approaches for implementing a dis-counting policy in the CDM. Supply-side discounting implies thatonly a certain fraction of the verified emission reductions leads toissuance of emission credits. This type of discounting would requirean agreement at the UN level, but would have the advantage of beingapplicable to the whole carbon market. Demand-side discountingmeans that a percentage of the issued credits is retired from themarket by the buyers, sending it for example to a cancellation account.Demand-side discounting allows for different credit buyers to setdifferent discount rates, which would complicate the linking ofdifferent emission trading schemes and could distort emission creditprices (Schneider, 2008). While demand-side discountingmakes littlesense from a pure economic point of view, as demanding countries areexpected to aim at getting as many credits as possible for the lowestprice possible, political and environmental reasons are influencingthese decisions. For example, the American Clean Energy and SecurityAct passed in the House of Representatives in June 2009 includes adiscounting provision for international offsets (which would includeCDM credits): from 2018 on, one international offset will beequivalent to 0.8 emission allowances in the US market (Pew Center,2009). The reasons for such a demand-driven discounting scheme are,on the one hand, improving the environmental integrity of thescheme, and on the other, promoting domestic green jobs byfavouring domestic reductions (or domestic offsets) over interna-tional ones. As the American market is expected to become the largestcarbon market in the world, carbon credit sellers will not be able toescape such a unilateral discounting provision.
We use Environmental Defense's and Chung's suggestions thatdiscounting could be used to improve the geographical distribution ofCDM projects as a starting point, and elaborate on Michaelowa'sproposal for a differentiation between host countries. We try toanswer the question whether such a discounting scheme withdifferentiation between host countries could really have an impacton host country competitiveness in the CDM market, with focus onLeast Developed Countries.
3. Discounting emission credits and host country competitiveness
Discounting emission credits will have an impact on the value andthe amount of emission reductions from different CDMhost countries.The higher the discount rate, the less credits are issued or traded forthe project, and thus the higher the abatement cost. At the same time,the higher the discount rate, the less emissions reductions arecredited, so the more the mitigation potential is penalised. Increasedcosts and reduced potentials are likely to lower the competitiveness ofthe CDM host countries affected by discounting.
The competitiveness or attractiveness of individual CDM hostcountries depends on several general and CDM-specific factors.Following Ellis and Kamel (2007), Michaelowa (2003) and Silayan(2005), important general considerations are:
- An enabling business environment: stable and transparent generalinstitutional framework, stable and predictable investment laws.
- The existence of relevant financial incentives, such as taxreductions for renewable energies, import tariff reductions forCDM technology, etc.
- Reduced ownership restrictions for foreigners.- Undistorted energy pricing policies.
- Local technical capacity and awareness of the CDM as a projectfinancing option.
- Availability of underlying project finance, especially through localfinancial capacity.
- Availability of large and cheap CDM project options, whose valuecan offset the transaction costs of the CDM pipeline; this is coupledto the country's emissions mitigation potential.
- Other country or project-related risks that render the performanceof the project uncertain.
- Existence of historical business or aid relationship with emissionscredit buyer (Dolšak and Bowerman Crandall, 2007).
CDM-specific criteria are:
- Existence of CDM-related institutions: Kyoto Protocol ratificationand establishment of an operational national CDM approvalauthority.
- Clear, capable and effective CDM policy framework: clear rules fornational approval, timely and simple procedures, low nationaltransaction costs, experience and continuity of national approvalstaff.
- Existence of CDM promotion offices.- CDM awareness in government, industry, consultants and financialintermediaries.
- Existence of baseline data for project design.- Existence of applicable CDMmethodologies for the desired projecttype.
- Constraints on eligibility of specific project types— for example bythe EU ETS or other major credit buyers.
- Capacity of auditing companies (validators or “designated oper-ational entities”) in the relevant region.
- Temporary credits for certain project types, which have lowervalue in the market.
Discounting will clearly have no effect on the host country'sbusiness environment, on the institutional framework or on techno-logical and methodological capacity. Some other measures have beenundertaken in several countries to overcome at least the institutionalbarriers: the Nairobi Framework is an initiative launched during theclimate negotiations in Nairobi in December 2006, aimed atenhancing the geographic distribution of CDM projects mainlythrough capacity building. It has contributed to improve some of theCDM-specific criteria, by establishing CDM authorities and approvalrules, as well as creating awareness in the public and private sectorsand initiating project portfolios in many countries. However, it wasunable to integrate the financial actors. Further, capacity building hasnot addressed more technical needs, such as generating data forbaselines or designing methodologies for project types that are morelikely in less developed countries (Okubo and Michaelowa, 2010).
Discounting could contribute to further improve project-specificand cost-related factors by shifting the financial incentives of the CDMtowards more backward countries, and could thus contribute tofostering CDMdevelopment in, for example, Sub-Saharan Africa or theLeast Developed Countries.
However, more structural factors, such as political and economicstability, mitigation potential, technical capacity, and infrastructureare more difficult to change in the short term.
As discounting will not have an impact on the institutional criteriabut rather on the value of emission reductions from differentcountries, we will focus our subsequent analysis on the host countrypotential for specific abatement technologies, and their abatementcost.
4. Estimating emission credit costs and CDM potentials
Right now, some individual CDM host countries or regions havesufficiently large CDM project portfolios to be able to empirically
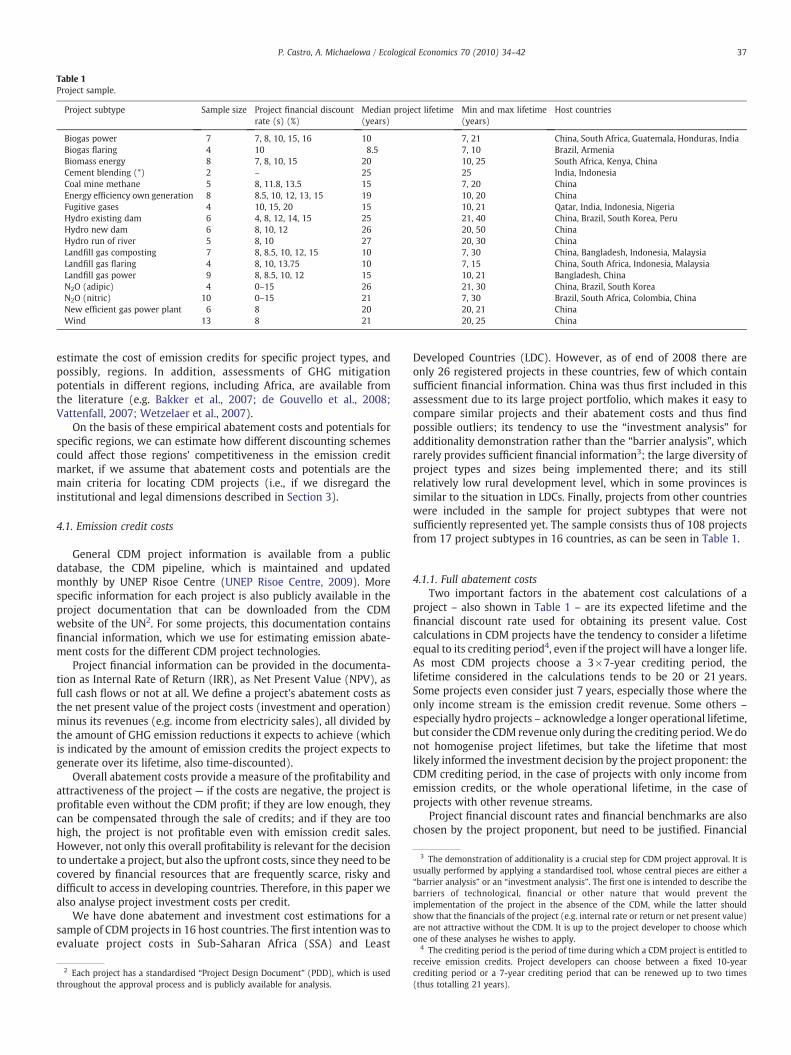
Table 1Project sample.
Project subtype Sample size Project financial discountrate (s) (%)
Median project lifetime(years)
Min and max lifetime(years)
Host countries
Biogas power 7 7, 8, 10, 15, 16 10 7, 21 China, South Africa, Guatemala, Honduras, IndiaBiogas flaring 4 10 8.5 7, 10 Brazil, ArmeniaBiomass energy 8 7, 8, 10, 15 20 10, 25 South Africa, Kenya, ChinaCement blending (*) 2 – 25 25 India, IndonesiaCoal mine methane 5 8, 11.8, 13.5 15 7, 20 ChinaEnergy efficiency own generation 8 8.5, 10, 12, 13, 15 19 10, 20 ChinaFugitive gases 4 10, 15, 20 15 10, 21 Qatar, India, Indonesia, NigeriaHydro existing dam 6 4, 8, 12, 14, 15 25 21, 40 China, Brazil, South Korea, PeruHydro new dam 6 8, 10, 12 26 20, 50 ChinaHydro run of river 5 8, 10 27 20, 30 ChinaLandfill gas composting 7 8, 8.5, 10, 12, 15 10 7, 30 China, Bangladesh, Indonesia, MalaysiaLandfill gas flaring 4 8, 10, 13.75 10 7, 15 China, South Africa, Indonesia, MalaysiaLandfill gas power 9 8, 8.5, 10, 12 15 10, 21 Bangladesh, ChinaN2O (adipic) 4 0–15 26 21, 30 China, Brazil, South KoreaN2O (nitric) 10 0–15 21 7, 30 Brazil, South Africa, Colombia, ChinaNew efficient gas power plant 6 8 20 20, 21 ChinaWind 13 8 21 20, 25 China
3 The demonstration of additionality is a crucial step for CDM project approval. It isusually performed by applying a standardised tool, whose central pieces are either a“barrier analysis” or an “investment analysis”. The first one is intended to describe thebarriers of technological, financial or other nature that would prevent theimplementation of the project in the absence of the CDM, while the latter shouldshow that the financials of the project (e.g. internal rate or return or net present value)are not attractive without the CDM. It is up to the project developer to choose whichone of these analyses he wishes to apply.
4 The crediting period is the period of time during which a CDM project is entitled to
37P. Castro, A. Michaelowa / Ecological Economics 70 (2010) 34–42
estimate the cost of emission credits for specific project types, andpossibly, regions. In addition, assessments of GHG mitigationpotentials in different regions, including Africa, are available fromthe literature (e.g. Bakker et al., 2007; de Gouvello et al., 2008;Vattenfall, 2007; Wetzelaer et al., 2007).
On the basis of these empirical abatement costs and potentials forspecific regions, we can estimate how different discounting schemescould affect those regions' competitiveness in the emission creditmarket, if we assume that abatement costs and potentials are themain criteria for locating CDM projects (i.e., if we disregard theinstitutional and legal dimensions described in Section 3).
4.1. Emission credit costs
General CDM project information is available from a publicdatabase, the CDM pipeline, which is maintained and updatedmonthly by UNEP Risoe Centre (UNEP Risoe Centre, 2009). Morespecific information for each project is also publicly available in theproject documentation that can be downloaded from the CDMwebsite of the UN2. For some projects, this documentation containsfinancial information, which we use for estimating emission abate-ment costs for the different CDM project technologies.
Project financial information can be provided in the documenta-tion as Internal Rate of Return (IRR), as Net Present Value (NPV), asfull cash flows or not at all. We define a project's abatement costs asthe net present value of the project costs (investment and operation)minus its revenues (e.g. income from electricity sales), all divided bythe amount of GHG emission reductions it expects to achieve (whichis indicated by the amount of emission credits the project expects togenerate over its lifetime, also time-discounted).
Overall abatement costs provide a measure of the profitability andattractiveness of the project — if the costs are negative, the project isprofitable even without the CDM profit; if they are low enough, theycan be compensated through the sale of credits; and if they are toohigh, the project is not profitable even with emission credit sales.However, not only this overall profitability is relevant for the decisionto undertake a project, but also the upfront costs, since they need to becovered by financial resources that are frequently scarce, risky anddifficult to access in developing countries. Therefore, in this paper wealso analyse project investment costs per credit.
We have done abatement and investment cost estimations for asample of CDM projects in 16 host countries. The first intention was toevaluate project costs in Sub-Saharan Africa (SSA) and Least
2 Each project has a standardised “Project Design Document” (PDD), which is usedthroughout the approval process and is publicly available for analysis.
Developed Countries (LDC). However, as of end of 2008 there areonly 26 registered projects in these countries, few of which containsufficient financial information. China was thus first included in thisassessment due to its large project portfolio, which makes it easy tocompare similar projects and their abatement costs and thus findpossible outliers; its tendency to use the “investment analysis” foradditionality demonstration rather than the “barrier analysis”, whichrarely provides sufficient financial information3; the large diversity ofproject types and sizes being implemented there; and its stillrelatively low rural development level, which in some provinces issimilar to the situation in LDCs. Finally, projects from other countrieswere included in the sample for project subtypes that were notsufficiently represented yet. The sample consists thus of 108 projectsfrom 17 project subtypes in 16 countries, as can be seen in Table 1.
4.1.1. Full abatement costsTwo important factors in the abatement cost calculations of a
project – also shown in Table 1 – are its expected lifetime and thefinancial discount rate used for obtaining its present value. Costcalculations in CDM projects have the tendency to consider a lifetimeequal to its crediting period4, even if the project will have a longer life.As most CDM projects choose a 3×7-year crediting period, thelifetime considered in the calculations tends to be 20 or 21 years.Some projects even consider just 7 years, especially those where theonly income stream is the emission credit revenue. Some others –
especially hydro projects – acknowledge a longer operational lifetime,but consider the CDM revenue only during the crediting period.We donot homogenise project lifetimes, but take the lifetime that mostlikely informed the investment decision by the project proponent: theCDM crediting period, in the case of projects with only income fromemission credits, or the whole operational lifetime, in the case ofprojects with other revenue streams.
Project financial discount rates and financial benchmarks are alsochosen by the project proponent, but need to be justified. Financial
receive emission credits. Project developers can choose between a fixed 10-yearcrediting period or a 7-year crediting period that can be renewed up to two times(thus totalling 21 years).
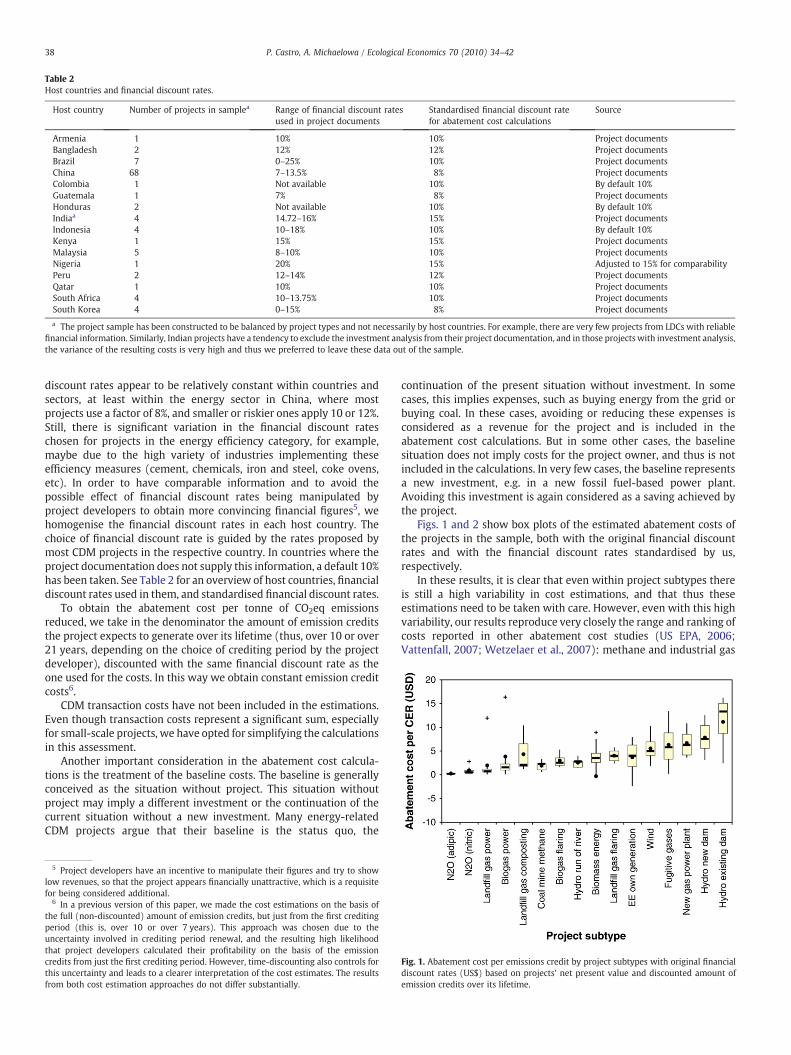
Table 2Host countries and financial discount rates.
Host country Number of projects in samplea Range of financial discount ratesused in project documents
Standardised financial discount ratefor abatement cost calculations
Source
Armenia 1 10% 10% Project documentsBangladesh 2 12% 12% Project documentsBrazil 7 0–25% 10% Project documentsChina 68 7–13.5% 8% Project documentsColombia 1 Not available 10% By default 10%Guatemala 1 7% 8% Project documentsHonduras 2 Not available 10% By default 10%Indiaa 4 14.72–16% 15% Project documentsIndonesia 4 10–18% 10% By default 10%Kenya 1 15% 15% Project documentsMalaysia 5 8–10% 10% Project documentsNigeria 1 20% 15% Adjusted to 15% for comparabilityPeru 2 12–14% 12% Project documentsQatar 1 10% 10% Project documentsSouth Africa 4 10–13.75% 10% Project documentsSouth Korea 4 0–15% 8% Project documents
a The project sample has been constructed to be balanced by project types and not necessarily by host countries. For example, there are very few projects from LDCs with reliablefinancial information. Similarly, Indian projects have a tendency to exclude the investment analysis from their project documentation, and in those projects with investment analysis,the variance of the resulting costs is very high and thus we preferred to leave these data out of the sample.
38 P. Castro, A. Michaelowa / Ecological Economics 70 (2010) 34–42
discount rates appear to be relatively constant within countries andsectors, at least within the energy sector in China, where mostprojects use a factor of 8%, and smaller or riskier ones apply 10 or 12%.Still, there is significant variation in the financial discount rateschosen for projects in the energy efficiency category, for example,maybe due to the high variety of industries implementing theseefficiency measures (cement, chemicals, iron and steel, coke ovens,etc). In order to have comparable information and to avoid thepossible effect of financial discount rates being manipulated byproject developers to obtain more convincing financial figures5, wehomogenise the financial discount rates in each host country. Thechoice of financial discount rate is guided by the rates proposed bymost CDM projects in the respective country. In countries where theproject documentation does not supply this information, a default 10%has been taken. See Table 2 for an overview of host countries, financialdiscount rates used in them, and standardised financial discount rates.
To obtain the abatement cost per tonne of CO2eq emissionsreduced, we take in the denominator the amount of emission creditsthe project expects to generate over its lifetime (thus, over 10 or over21 years, depending on the choice of crediting period by the projectdeveloper), discounted with the same financial discount rate as theone used for the costs. In this way we obtain constant emission creditcosts6.
CDM transaction costs have not been included in the estimations.Even though transaction costs represent a significant sum, especiallyfor small-scale projects, we have opted for simplifying the calculationsin this assessment.
Another important consideration in the abatement cost calcula-tions is the treatment of the baseline costs. The baseline is generallyconceived as the situation without project. This situation withoutproject may imply a different investment or the continuation of thecurrent situation without a new investment. Many energy-relatedCDM projects argue that their baseline is the status quo, the
5 Project developers have an incentive to manipulate their figures and try to showlow revenues, so that the project appears financially unattractive, which is a requisitefor being considered additional.
6 In a previous version of this paper, we made the cost estimations on the basis ofthe full (non-discounted) amount of emission credits, but just from the first creditingperiod (this is, over 10 or over 7 years). This approach was chosen due to theuncertainty involved in crediting period renewal, and the resulting high likelihoodthat project developers calculated their profitability on the basis of the emissioncredits from just the first crediting period. However, time-discounting also controls forthis uncertainty and leads to a clearer interpretation of the cost estimates. The resultsfrom both cost estimation approaches do not differ substantially.
continuation of the present situation without investment. In somecases, this implies expenses, such as buying energy from the grid orbuying coal. In these cases, avoiding or reducing these expenses isconsidered as a revenue for the project and is included in theabatement cost calculations. But in some other cases, the baselinesituation does not imply costs for the project owner, and thus is notincluded in the calculations. In very few cases, the baseline representsa new investment, e.g. in a new fossil fuel-based power plant.Avoiding this investment is again considered as a saving achieved bythe project.
Figs. 1 and 2 show box plots of the estimated abatement costs ofthe projects in the sample, both with the original financial discountrates and with the financial discount rates standardised by us,respectively.
In these results, it is clear that even within project subtypes thereis still a high variability in cost estimations, and that thus theseestimations need to be taken with care. However, even with this highvariability, our results reproduce very closely the range and ranking ofcosts reported in other abatement cost studies (US EPA, 2006;Vattenfall, 2007; Wetzelaer et al., 2007): methane and industrial gas
Fig. 1. Abatement cost per emissions credit by project subtypes with original financialdiscount rates (US$) based on projects' net present value and discounted amount ofemission credits over its lifetime.
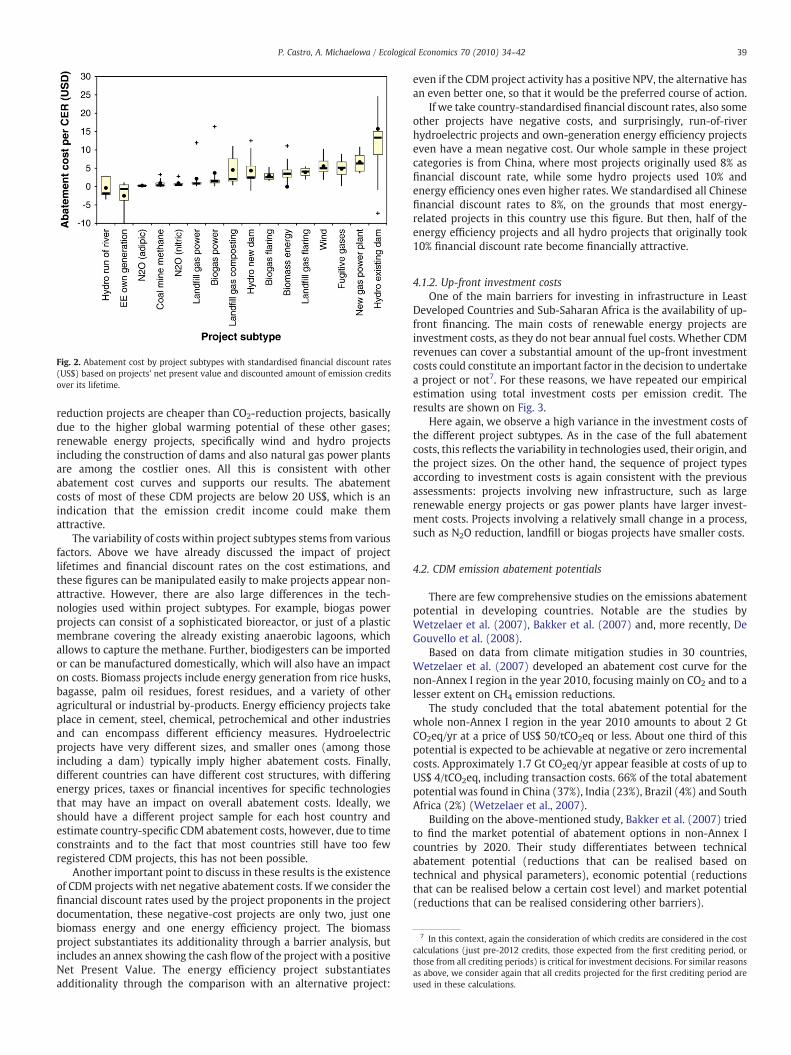
Fig. 2. Abatement cost by project subtypes with standardised financial discount rates(US$) based on projects' net present value and discounted amount of emission creditsover its lifetime.
7 In this context, again the consideration of which credits are considered in the costcalculations (just pre-2012 credits, those expected from the first crediting period, orthose from all crediting periods) is critical for investment decisions. For similar reasonsas above, we consider again that all credits projected for the first crediting period areused in these calculations.
39P. Castro, A. Michaelowa / Ecological Economics 70 (2010) 34–42
reduction projects are cheaper than CO2-reduction projects, basicallydue to the higher global warming potential of these other gases;renewable energy projects, specifically wind and hydro projectsincluding the construction of dams and also natural gas power plantsare among the costlier ones. All this is consistent with otherabatement cost curves and supports our results. The abatementcosts of most of these CDM projects are below 20 US$, which is anindication that the emission credit income could make themattractive.
The variability of costs within project subtypes stems from variousfactors. Above we have already discussed the impact of projectlifetimes and financial discount rates on the cost estimations, andthese figures can be manipulated easily to make projects appear non-attractive. However, there are also large differences in the tech-nologies used within project subtypes. For example, biogas powerprojects can consist of a sophisticated bioreactor, or just of a plasticmembrane covering the already existing anaerobic lagoons, whichallows to capture the methane. Further, biodigesters can be importedor can be manufactured domestically, which will also have an impacton costs. Biomass projects include energy generation from rice husks,bagasse, palm oil residues, forest residues, and a variety of otheragricultural or industrial by-products. Energy efficiency projects takeplace in cement, steel, chemical, petrochemical and other industriesand can encompass different efficiency measures. Hydroelectricprojects have very different sizes, and smaller ones (among thoseincluding a dam) typically imply higher abatement costs. Finally,different countries can have different cost structures, with differingenergy prices, taxes or financial incentives for specific technologiesthat may have an impact on overall abatement costs. Ideally, weshould have a different project sample for each host country andestimate country-specific CDM abatement costs, however, due to timeconstraints and to the fact that most countries still have too fewregistered CDM projects, this has not been possible.
Another important point to discuss in these results is the existenceof CDM projects with net negative abatement costs. If we consider thefinancial discount rates used by the project proponents in the projectdocumentation, these negative-cost projects are only two, just onebiomass energy and one energy efficiency project. The biomassproject substantiates its additionality through a barrier analysis, butincludes an annex showing the cash flow of the project with a positiveNet Present Value. The energy efficiency project substantiatesadditionality through the comparison with an alternative project:
even if the CDM project activity has a positive NPV, the alternative hasan even better one, so that it would be the preferred course of action.
If we take country-standardised financial discount rates, also someother projects have negative costs, and surprisingly, run-of-riverhydroelectric projects and own-generation energy efficiency projectseven have a mean negative cost. Our whole sample in these projectcategories is from China, where most projects originally used 8% asfinancial discount rate, while some hydro projects used 10% andenergy efficiency ones even higher rates. We standardised all Chinesefinancial discount rates to 8%, on the grounds that most energy-related projects in this country use this figure. But then, half of theenergy efficiency projects and all hydro projects that originally took10% financial discount rate become financially attractive.
4.1.2. Up-front investment costsOne of the main barriers for investing in infrastructure in Least
Developed Countries and Sub-Saharan Africa is the availability of up-front financing. The main costs of renewable energy projects areinvestment costs, as they do not bear annual fuel costs. Whether CDMrevenues can cover a substantial amount of the up-front investmentcosts could constitute an important factor in the decision to undertakea project or not7. For these reasons, we have repeated our empiricalestimation using total investment costs per emission credit. Theresults are shown on Fig. 3.
Here again, we observe a high variance in the investment costs ofthe different project subtypes. As in the case of the full abatementcosts, this reflects the variability in technologies used, their origin, andthe project sizes. On the other hand, the sequence of project typesaccording to investment costs is again consistent with the previousassessments: projects involving new infrastructure, such as largerenewable energy projects or gas power plants have larger invest-ment costs. Projects involving a relatively small change in a process,such as N2O reduction, landfill or biogas projects have smaller costs.
4.2. CDM emission abatement potentials
There are few comprehensive studies on the emissions abatementpotential in developing countries. Notable are the studies byWetzelaer et al. (2007), Bakker et al. (2007) and, more recently, DeGouvello et al. (2008).
Based on data from climate mitigation studies in 30 countries,Wetzelaer et al. (2007) developed an abatement cost curve for thenon-Annex I region in the year 2010, focusing mainly on CO2 and to alesser extent on CH4 emission reductions.
The study concluded that the total abatement potential for thewhole non-Annex I region in the year 2010 amounts to about 2 GtCO2eq/yr at a price of US$ 50/tCO2eq or less. About one third of thispotential is expected to be achievable at negative or zero incrementalcosts. Approximately 1.7 Gt CO2eq/yr appear feasible at costs of up toUS$ 4/tCO2eq, including transaction costs. 66% of the total abatementpotential was found in China (37%), India (23%), Brazil (4%) and SouthAfrica (2%) (Wetzelaer et al., 2007).
Building on the above-mentioned study, Bakker et al. (2007) triedto find the market potential of abatement options in non-Annex Icountries by 2020. Their study differentiates between technicalabatement potential (reductions that can be realised based ontechnical and physical parameters), economic potential (reductionsthat can be realised below a certain cost level) and market potential(reductions that can be realised considering other barriers).
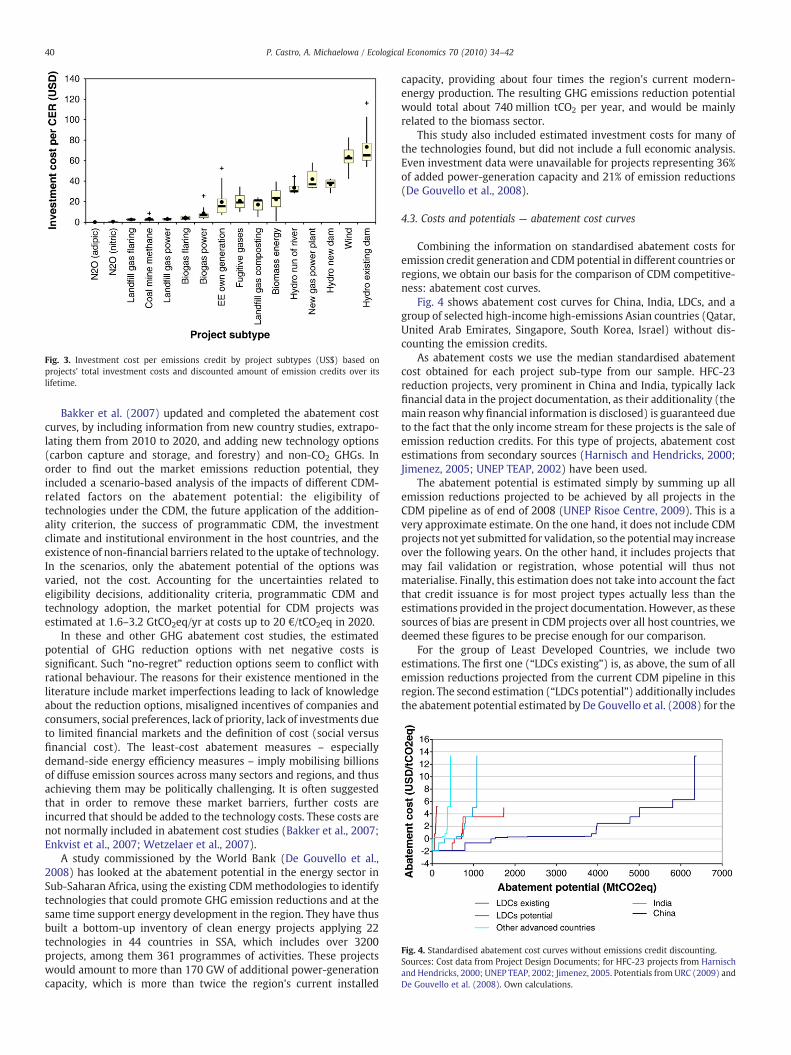
Fig. 4. Standardised abatement cost curves without emissions credit discounting.Sources: Cost data from Project Design Documents; for HFC-23 projects from Harnischand Hendricks, 2000; UNEP TEAP, 2002; Jimenez, 2005. Potentials from URC (2009) andDe Gouvello et al. (2008). Own calculations.
Fig. 3. Investment cost per emissions credit by project subtypes (US$) based onprojects' total investment costs and discounted amount of emission credits over itslifetime.
40 P. Castro, A. Michaelowa / Ecological Economics 70 (2010) 34–42
Bakker et al. (2007) updated and completed the abatement costcurves, by including information from new country studies, extrapo-lating them from 2010 to 2020, and adding new technology options(carbon capture and storage, and forestry) and non-CO2 GHGs. Inorder to find out the market emissions reduction potential, theyincluded a scenario-based analysis of the impacts of different CDM-related factors on the abatement potential: the eligibility oftechnologies under the CDM, the future application of the addition-ality criterion, the success of programmatic CDM, the investmentclimate and institutional environment in the host countries, and theexistence of non-financial barriers related to the uptake of technology.In the scenarios, only the abatement potential of the options wasvaried, not the cost. Accounting for the uncertainties related toeligibility decisions, additionality criteria, programmatic CDM andtechnology adoption, the market potential for CDM projects wasestimated at 1.6–3.2 GtCO2eq/yr at costs up to 20 €/tCO2eq in 2020.
In these and other GHG abatement cost studies, the estimatedpotential of GHG reduction options with net negative costs issignificant. Such “no-regret” reduction options seem to conflict withrational behaviour. The reasons for their existence mentioned in theliterature include market imperfections leading to lack of knowledgeabout the reduction options, misaligned incentives of companies andconsumers, social preferences, lack of priority, lack of investments dueto limited financial markets and the definition of cost (social versusfinancial cost). The least-cost abatement measures – especiallydemand-side energy efficiency measures – imply mobilising billionsof diffuse emission sources across many sectors and regions, and thusachieving them may be politically challenging. It is often suggestedthat in order to remove these market barriers, further costs areincurred that should be added to the technology costs. These costs arenot normally included in abatement cost studies (Bakker et al., 2007;Enkvist et al., 2007; Wetzelaer et al., 2007).
A study commissioned by the World Bank (De Gouvello et al.,2008) has looked at the abatement potential in the energy sector inSub-Saharan Africa, using the existing CDMmethodologies to identifytechnologies that could promote GHG emission reductions and at thesame time support energy development in the region. They have thusbuilt a bottom-up inventory of clean energy projects applying 22technologies in 44 countries in SSA, which includes over 3200projects, among them 361 programmes of activities. These projectswould amount to more than 170 GW of additional power-generationcapacity, which is more than twice the region's current installed
capacity, providing about four times the region's current modern-energy production. The resulting GHG emissions reduction potentialwould total about 740 million tCO2 per year, and would be mainlyrelated to the biomass sector.
This study also included estimated investment costs for many ofthe technologies found, but did not include a full economic analysis.Even investment data were unavailable for projects representing 36%of added power-generation capacity and 21% of emission reductions(De Gouvello et al., 2008).
4.3. Costs and potentials — abatement cost curves
Combining the information on standardised abatement costs foremission credit generation and CDMpotential in different countries orregions, we obtain our basis for the comparison of CDM competitive-ness: abatement cost curves.
Fig. 4 shows abatement cost curves for China, India, LDCs, and agroup of selected high-income high-emissions Asian countries (Qatar,United Arab Emirates, Singapore, South Korea, Israel) without dis-counting the emission credits.
As abatement costs we use the median standardised abatementcost obtained for each project sub-type from our sample. HFC-23reduction projects, very prominent in China and India, typically lackfinancial data in the project documentation, as their additionality (themain reasonwhy financial information is disclosed) is guaranteed dueto the fact that the only income stream for these projects is the sale ofemission reduction credits. For this type of projects, abatement costestimations from secondary sources (Harnisch and Hendricks, 2000;Jimenez, 2005; UNEP TEAP, 2002) have been used.
The abatement potential is estimated simply by summing up allemission reductions projected to be achieved by all projects in theCDM pipeline as of end of 2008 (UNEP Risoe Centre, 2009). This is avery approximate estimate. On the one hand, it does not include CDMprojects not yet submitted for validation, so the potentialmay increaseover the following years. On the other hand, it includes projects thatmay fail validation or registration, whose potential will thus notmaterialise. Finally, this estimation does not take into account the factthat credit issuance is for most project types actually less than theestimations provided in the project documentation. However, as thesesources of bias are present in CDM projects over all host countries, wedeemed these figures to be precise enough for our comparison.
For the group of Least Developed Countries, we include twoestimations. The first one (“LDCs existing”) is, as above, the sum of allemission reductions projected from the current CDM pipeline in thisregion. The second estimation (“LDCs potential”) additionally includesthe abatement potential estimated by De Gouvello et al. (2008) for the
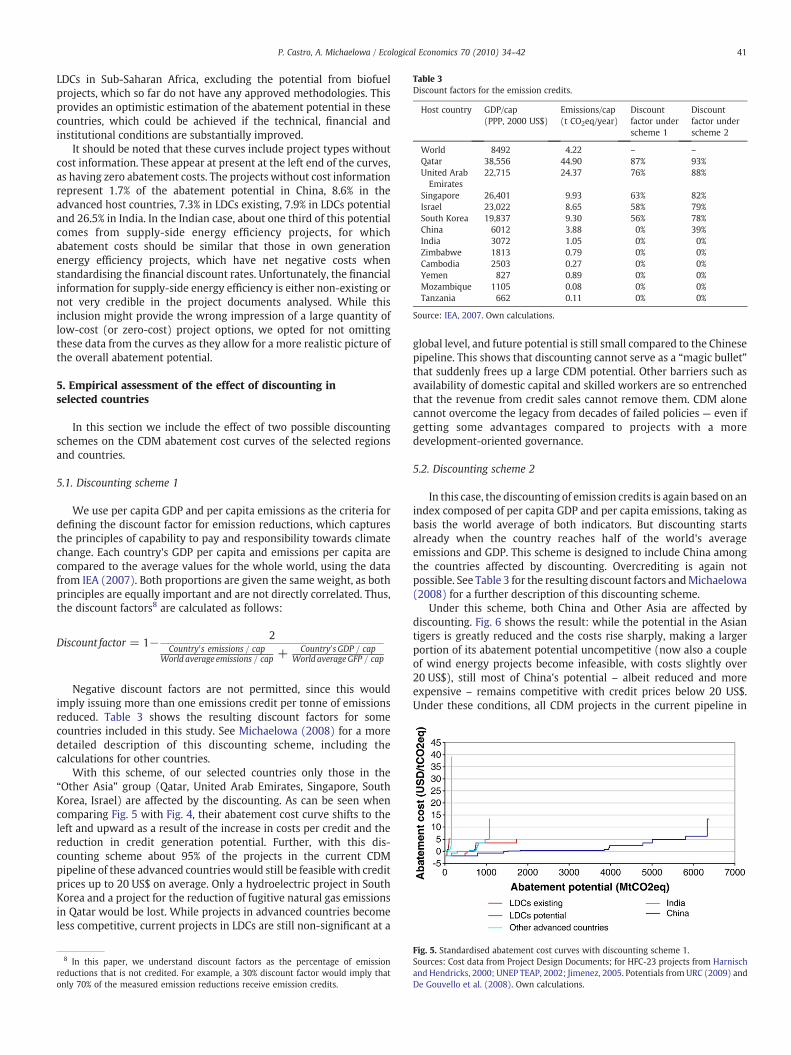
Table 3Discount factors for the emission credits.
Host country GDP/cap(PPP, 2000 US$)
Emissions/cap(t CO2eq/year)
Discountfactor underscheme 1
Discountfactor underscheme 2
World 8492 4.22 – –
Qatar 38,556 44.90 87% 93%United ArabEmirates
22,715 24.37 76% 88%
Singapore 26,401 9.93 63% 82%Israel 23,022 8.65 58% 79%South Korea 19,837 9.30 56% 78%China 6012 3.88 0% 39%India 3072 1.05 0% 0%Zimbabwe 1813 0.79 0% 0%Cambodia 2503 0.27 0% 0%Yemen 827 0.89 0% 0%Mozambique 1105 0.08 0% 0%Tanzania 662 0.11 0% 0%
Source: IEA, 2007. Own calculations.
41P. Castro, A. Michaelowa / Ecological Economics 70 (2010) 34–42
LDCs in Sub-Saharan Africa, excluding the potential from biofuelprojects, which so far do not have any approved methodologies. Thisprovides an optimistic estimation of the abatement potential in thesecountries, which could be achieved if the technical, financial andinstitutional conditions are substantially improved.
It should be noted that these curves include project types withoutcost information. These appear at present at the left end of the curves,as having zero abatement costs. The projects without cost informationrepresent 1.7% of the abatement potential in China, 8.6% in theadvanced host countries, 7.3% in LDCs existing, 7.9% in LDCs potentialand 26.5% in India. In the Indian case, about one third of this potentialcomes from supply-side energy efficiency projects, for whichabatement costs should be similar that those in own generationenergy efficiency projects, which have net negative costs whenstandardising the financial discount rates. Unfortunately, the financialinformation for supply-side energy efficiency is either non-existing ornot very credible in the project documents analysed. While thisinclusion might provide the wrong impression of a large quantity oflow-cost (or zero-cost) project options, we opted for not omittingthese data from the curves as they allow for a more realistic picture ofthe overall abatement potential.
5. Empirical assessment of the effect of discounting inselected countries
In this section we include the effect of two possible discountingschemes on the CDM abatement cost curves of the selected regionsand countries.
5.1. Discounting scheme 1
We use per capita GDP and per capita emissions as the criteria fordefining the discount factor for emission reductions, which capturesthe principles of capability to pay and responsibility towards climatechange. Each country's GDP per capita and emissions per capita arecompared to the average values for the whole world, using the datafrom IEA (2007). Both proportions are given the same weight, as bothprinciples are equally important and are not directly correlated. Thus,the discount factors8 are calculated as follows:
Discount factor = 1− 2Country0s emissions = cap
World average emissions = cap +Country0s GDP = cap
World averageGFP = cap
Negative discount factors are not permitted, since this wouldimply issuing more than one emissions credit per tonne of emissionsreduced. Table 3 shows the resulting discount factors for somecountries included in this study. See Michaelowa (2008) for a moredetailed description of this discounting scheme, including thecalculations for other countries.
With this scheme, of our selected countries only those in the“Other Asia” group (Qatar, United Arab Emirates, Singapore, SouthKorea, Israel) are affected by the discounting. As can be seen whencomparing Fig. 5 with Fig. 4, their abatement cost curve shifts to theleft and upward as a result of the increase in costs per credit and thereduction in credit generation potential. Further, with this dis-counting scheme about 95% of the projects in the current CDMpipeline of these advanced countries would still be feasible with creditprices up to 20 US$ on average. Only a hydroelectric project in SouthKorea and a project for the reduction of fugitive natural gas emissionsin Qatar would be lost. While projects in advanced countries becomeless competitive, current projects in LDCs are still non-significant at a
8 In this paper, we understand discount factors as the percentage of emissionreductions that is not credited. For example, a 30% discount factor would imply thatonly 70% of the measured emission reductions receive emission credits.
global level, and future potential is still small compared to the Chinesepipeline. This shows that discounting cannot serve as a “magic bullet”that suddenly frees up a large CDM potential. Other barriers such asavailability of domestic capital and skilled workers are so entrenchedthat the revenue from credit sales cannot remove them. CDM alonecannot overcome the legacy from decades of failed policies — even ifgetting some advantages compared to projects with a moredevelopment-oriented governance.
5.2. Discounting scheme 2
In this case, the discounting of emission credits is again based on anindex composed of per capita GDP and per capita emissions, taking asbasis the world average of both indicators. But discounting startsalready when the country reaches half of the world's averageemissions and GDP. This scheme is designed to include China amongthe countries affected by discounting. Overcrediting is again notpossible. See Table 3 for the resulting discount factors andMichaelowa(2008) for a further description of this discounting scheme.
Under this scheme, both China and Other Asia are affected bydiscounting. Fig. 6 shows the result: while the potential in the Asiantigers is greatly reduced and the costs rise sharply, making a largerportion of its abatement potential uncompetitive (now also a coupleof wind energy projects become infeasible, with costs slightly over20 US$), still most of China's potential – albeit reduced and moreexpensive – remains competitive with credit prices below 20 US$.Under these conditions, all CDM projects in the current pipeline in
Fig. 5. Standardised abatement cost curves with discounting scheme 1.Sources: Cost data from Project Design Documents; for HFC-23 projects from Harnischand Hendricks, 2000; UNEP TEAP, 2002; Jimenez, 2005. Potentials from URC (2009) andDe Gouvello et al. (2008). Own calculations.
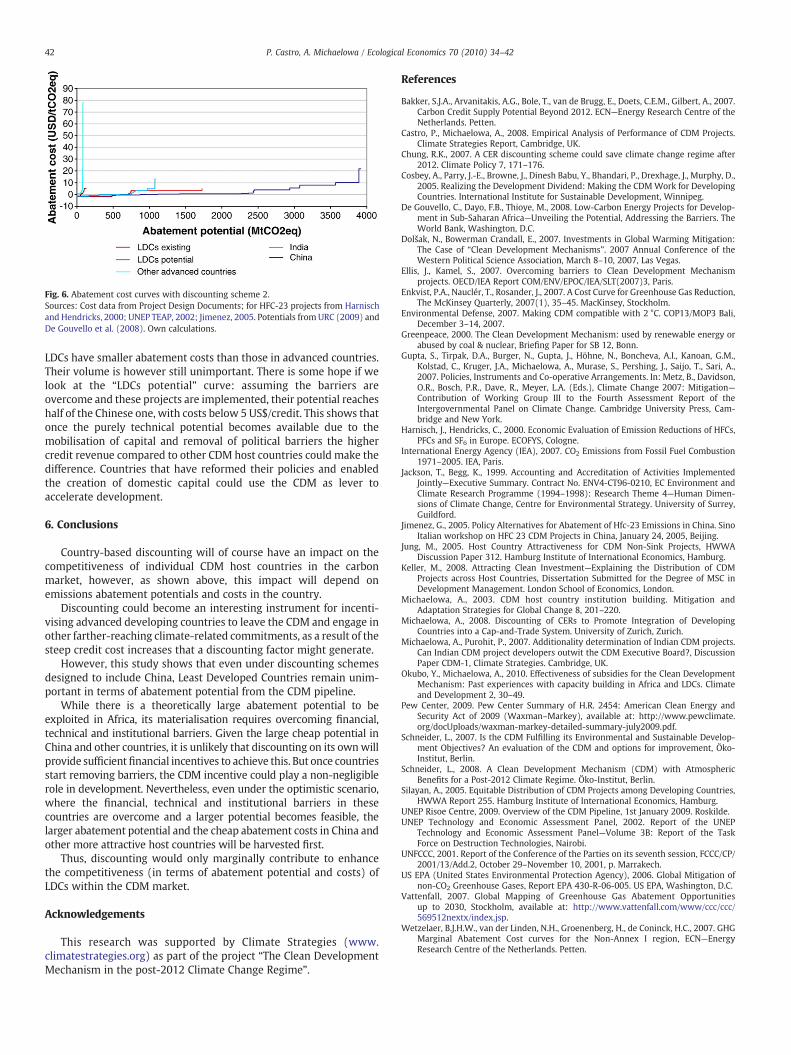
Fig. 6. Abatement cost curves with discounting scheme 2.Sources: Cost data from Project Design Documents; for HFC-23 projects from Harnischand Hendricks, 2000; UNEP TEAP, 2002; Jimenez, 2005. Potentials from URC (2009) andDe Gouvello et al. (2008). Own calculations.
42 P. Castro, A. Michaelowa / Ecological Economics 70 (2010) 34–42
LDCs have smaller abatement costs than those in advanced countries.Their volume is however still unimportant. There is some hope if welook at the “LDCs potential” curve: assuming the barriers areovercome and these projects are implemented, their potential reacheshalf of the Chinese one, with costs below 5 US$/credit. This shows thatonce the purely technical potential becomes available due to themobilisation of capital and removal of political barriers the highercredit revenue compared to other CDM host countries could make thedifference. Countries that have reformed their policies and enabledthe creation of domestic capital could use the CDM as lever toaccelerate development.
6. Conclusions
Country-based discounting will of course have an impact on thecompetitiveness of individual CDM host countries in the carbonmarket, however, as shown above, this impact will depend onemissions abatement potentials and costs in the country.
Discounting could become an interesting instrument for incenti-vising advanced developing countries to leave the CDM and engage inother farther-reaching climate-related commitments, as a result of thesteep credit cost increases that a discounting factor might generate.
However, this study shows that even under discounting schemesdesigned to include China, Least Developed Countries remain unim-portant in terms of abatement potential from the CDM pipeline.
While there is a theoretically large abatement potential to beexploited in Africa, its materialisation requires overcoming financial,technical and institutional barriers. Given the large cheap potential inChina and other countries, it is unlikely that discounting on its ownwillprovide sufficientfinancial incentives to achieve this. But once countriesstart removing barriers, the CDM incentive could play a non-negligiblerole in development. Nevertheless, even under the optimistic scenario,where the financial, technical and institutional barriers in thesecountries are overcome and a larger potential becomes feasible, thelarger abatement potential and the cheap abatement costs in China andother more attractive host countries will be harvested first.
Thus, discounting would only marginally contribute to enhancethe competitiveness (in terms of abatement potential and costs) ofLDCs within the CDM market.
Acknowledgements
This research was supported by Climate Strategies (www.climatestrategies.org) as part of the project “The Clean DevelopmentMechanism in the post-2012 Climate Change Regime”.
References
Bakker, S.J.A., Arvanitakis, A.G., Bole, T., van de Brugg, E., Doets, C.E.M., Gilbert, A., 2007.Carbon Credit Supply Potential Beyond 2012. ECN—Energy Research Centre of theNetherlands. Petten.
Castro, P., Michaelowa, A., 2008. Empirical Analysis of Performance of CDM Projects.Climate Strategies Report, Cambridge, UK.
Chung, R.K., 2007. A CER discounting scheme could save climate change regime after2012. Climate Policy 7, 171–176.
Cosbey, A., Parry, J.-E., Browne, J., Dinesh Babu, Y., Bhandari, P., Drexhage, J., Murphy, D.,2005. Realizing the Development Dividend: Making the CDM Work for DevelopingCountries. International Institute for Sustainable Development, Winnipeg.
De Gouvello, C., Dayo, F.B., Thioye, M., 2008. Low-Carbon Energy Projects for Develop-ment in Sub-Saharan Africa—Unveiling the Potential, Addressing the Barriers. TheWorld Bank, Washington, D.C.
Dolšak, N., Bowerman Crandall, E., 2007. Investments in Global Warming Mitigation:The Case of “Clean Development Mechanisms”. 2007 Annual Conference of theWestern Political Science Association, March 8–10, 2007, Las Vegas.
Ellis, J., Kamel, S., 2007. Overcoming barriers to Clean Development Mechanismprojects. OECD/IEA Report COM/ENV/EPOC/IEA/SLT(2007)3, Paris.
Enkvist, P.A., Nauclér, T., Rosander, J., 2007. A Cost Curve for Greenhouse Gas Reduction,The McKinsey Quarterly, 2007(1), 35–45. MacKinsey, Stockholm.
Environmental Defense, 2007. Making CDM compatible with 2 °C. COP13/MOP3 Bali,December 3–14, 2007.
Greenpeace, 2000. The Clean Development Mechanism: used by renewable energy orabused by coal & nuclear, Briefing Paper for SB 12, Bonn.
Gupta, S., Tirpak, D.A., Burger, N., Gupta, J., Höhne, N., Boncheva, A.I., Kanoan, G.M.,Kolstad, C., Kruger, J.A., Michaelowa, A., Murase, S., Pershing, J., Saijo, T., Sari, A.,2007. Policies, Instruments and Co-operative Arrangements. In: Metz, B., Davidson,O.R., Bosch, P.R., Dave, R., Meyer, L.A. (Eds.), Climate Change 2007: Mitigation—Contribution of Working Group III to the Fourth Assessment Report of theIntergovernmental Panel on Climate Change. Cambridge University Press, Cam-bridge and New York.
Harnisch, J., Hendricks, C., 2000. Economic Evaluation of Emission Reductions of HFCs,PFCs and SF6 in Europe. ECOFYS, Cologne.
International Energy Agency (IEA), 2007. CO2 Emissions from Fossil Fuel Combustion1971–2005. IEA, Paris.
Jackson, T., Begg, K., 1999. Accounting and Accreditation of Activities ImplementedJointly—Executive Summary. Contract No. ENV4-CT96-0210, EC Environment andClimate Research Programme (1994–1998): Research Theme 4—Human Dimen-sions of Climate Change, Centre for Environmental Strategy. University of Surrey,Guildford.
Jimenez, G., 2005. Policy Alternatives for Abatement of Hfc-23 Emissions in China. SinoItalian workshop on HFC 23 CDM Projects in China, January 24, 2005, Beijing.
Jung, M., 2005. Host Country Attractiveness for CDM Non-Sink Projects, HWWADiscussion Paper 312. Hamburg Institute of International Economics, Hamburg.
Keller, M., 2008. Attracting Clean Investment—Explaining the Distribution of CDMProjects across Host Countries, Dissertation Submitted for the Degree of MSC inDevelopment Management. London School of Economics, London.
Michaelowa, A., 2003. CDM host country institution building. Mitigation andAdaptation Strategies for Global Change 8, 201–220.
Michaelowa, A., 2008. Discounting of CERs to Promote Integration of DevelopingCountries into a Cap-and-Trade System. University of Zurich, Zurich.
Michaelowa, A., Purohit, P., 2007. Additionality determination of Indian CDM projects.Can Indian CDM project developers outwit the CDM Executive Board?, DiscussionPaper CDM-1, Climate Strategies. Cambridge, UK.
Okubo, Y., Michaelowa, A., 2010. Effectiveness of subsidies for the Clean DevelopmentMechanism: Past experiences with capacity building in Africa and LDCs. Climateand Development 2, 30–49.
Pew Center, 2009. Pew Center Summary of H.R. 2454: American Clean Energy andSecurity Act of 2009 (Waxman–Markey), available at: http://www.pewclimate.org/docUploads/waxman-markey-detailed-summary-july2009.pdf.
Schneider, L., 2007. Is the CDM Fulfilling its Environmental and Sustainable Develop-ment Objectives? An evaluation of the CDM and options for improvement, Öko-Institut, Berlin.
Schneider, L., 2008. A Clean Development Mechanism (CDM) with AtmosphericBenefits for a Post-2012 Climate Regime. Öko-Institut, Berlin.
Silayan, A., 2005. Equitable Distribution of CDM Projects among Developing Countries,HWWA Report 255. Hamburg Institute of International Economics, Hamburg.
UNEP Risoe Centre, 2009. Overview of the CDM Pipeline, 1st January 2009. Roskilde.UNEP Technology and Economic Assessment Panel, 2002. Report of the UNEP
Technology and Economic Assessment Panel—Volume 3B: Report of the TaskForce on Destruction Technologies, Nairobi.
UNFCCC, 2001. Report of the Conference of the Parties on its seventh session, FCCC/CP/2001/13/Add.2, October 29–November 10, 2001, p. Marrakech.
US EPA (United States Environmental Protection Agency), 2006. Global Mitigation ofnon-CO2 Greenhouse Gases, Report EPA 430-R-06-005. US EPA, Washington, D.C.
Vattenfall, 2007. Global Mapping of Greenhouse Gas Abatement Opportunitiesup to 2030, Stockholm, available at: http://www.vattenfall.com/www/ccc/ccc/569512nextx/index.jsp.
Wetzelaer, B.J.H.W., van der Linden, N.H., Groenenberg, H., de Coninck, H.C., 2007. GHGMarginal Abatement Cost curves for the Non-Annex I region, ECN—EnergyResearch Centre of the Netherlands. Petten.