Embed Size (px)
Citation preview
The Impact of Differences in Gross Anatomy Instruction on Performance on the USMLE
Monica M. Cuddy1, Richard L. Drake2, Wojciech Pawlina3 and David B. Swanson1
_________________________________________________ 1National Board of Medical Examiners
2Cleveland Clinic Lerner College of Medicine 3College of Medicine, Mayo Clinic
1. Decrease in the number of course hours devoted to gross anatomy
2. Shortened time devoted to cadaver dissection
3. Shift toward integrated curricula
Recent Changes in Anatomy Instruction
• To examine the impact of variation in gross anatomy 1) course hours, 2) laboratory experience, and 3) curriculum type on
– Step 1 Total Test Scores
– Step 1 Gross Anatomy Sub-scores
– Step 2 CK Total Test Scores
Research Objectives
• Step 1 – Assesses an examinee’s understanding and
application of basic science concepts • Step 2 CK
– Assesses an examinee’s application of medical knowledge, skills and understanding of clinical science essential for the provision of safe and effective care under supervision
USMLE Step 1 and Step 2 CK
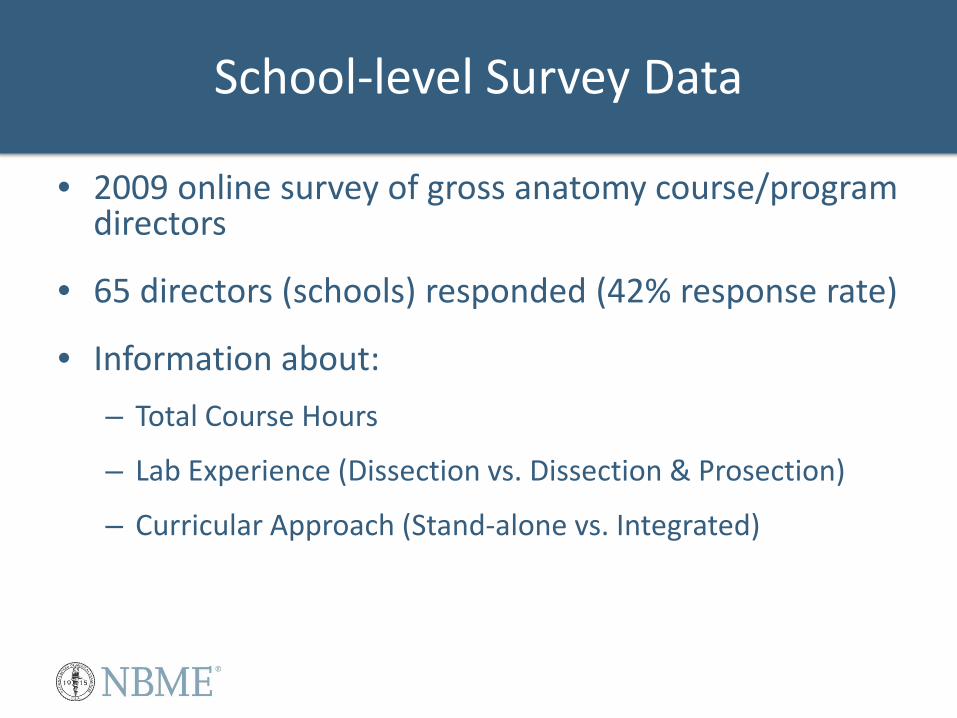
• 2009 online survey of gross anatomy course/program directors
• 65 directors (schools) responded (42% response rate)
• Information about: – Total Course Hours
– Lab Experience (Dissection vs. Dissection & Prosection)
– Curricular Approach (Stand-alone vs. Integrated)
School-level Survey Data
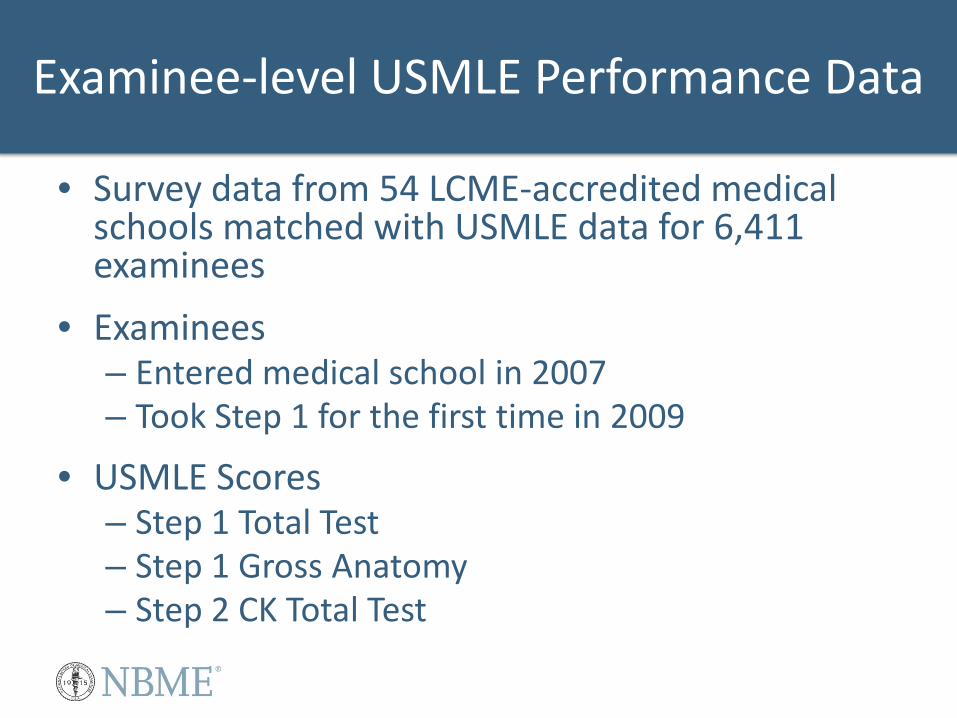
• Survey data from 54 LCME-accredited medical schools matched with USMLE data for 6,411 examinees
• Examinees – Entered medical school in 2007 – Took Step 1 for the first time in 2009
• USMLE Scores – Step 1 Total Test – Step 1 Gross Anatomy – Step 2 CK Total Test
Examinee-level USMLE Performance Data
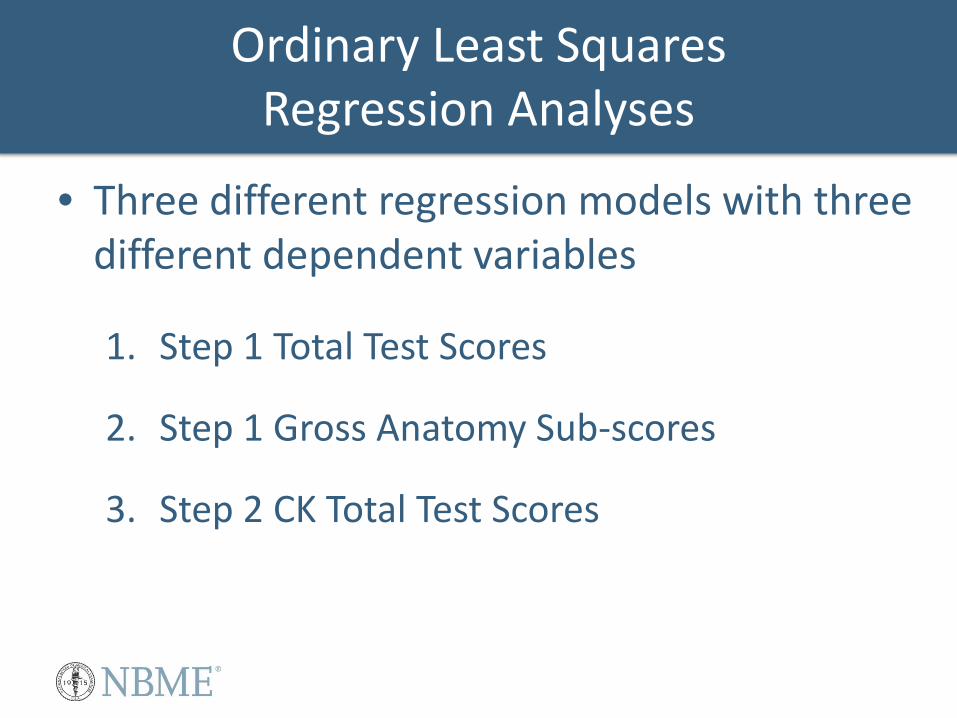
• Three different regression models with three different dependent variables
1. Step 1 Total Test Scores
2. Step 1 Gross Anatomy Sub-scores
3. Step 2 CK Total Test Scores
Ordinary Least Squares Regression Analyses
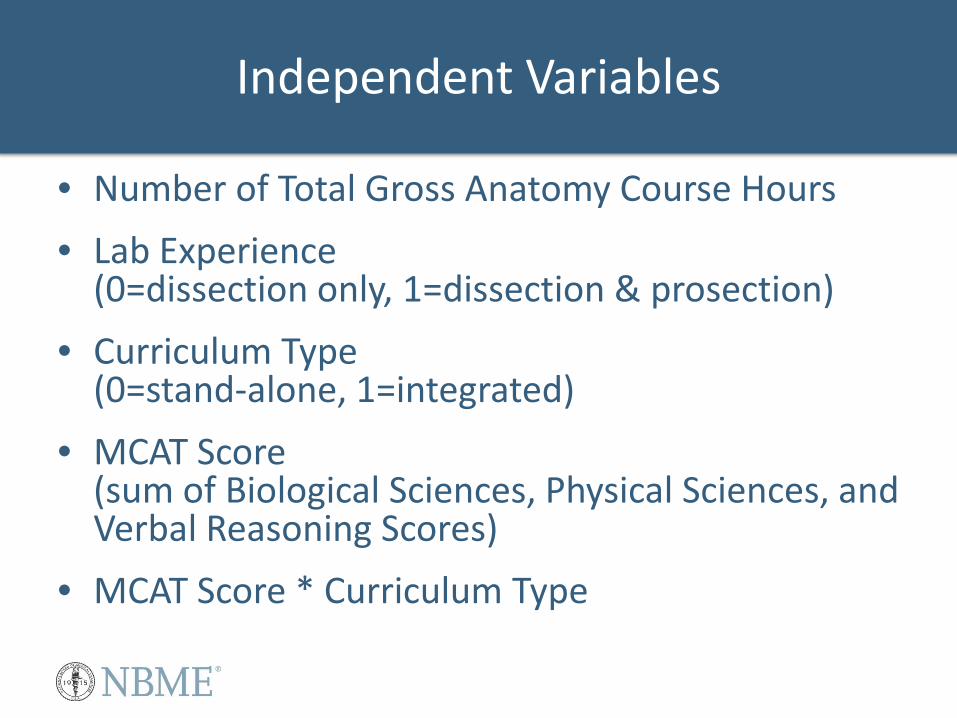
• Number of Total Gross Anatomy Course Hours • Lab Experience
(0=dissection only, 1=dissection & prosection) • Curriculum Type
(0=stand-alone, 1=integrated) • MCAT Score
(sum of Biological Sciences, Physical Sciences, and Verbal Reasoning Scores)
• MCAT Score * Curriculum Type
Independent Variables
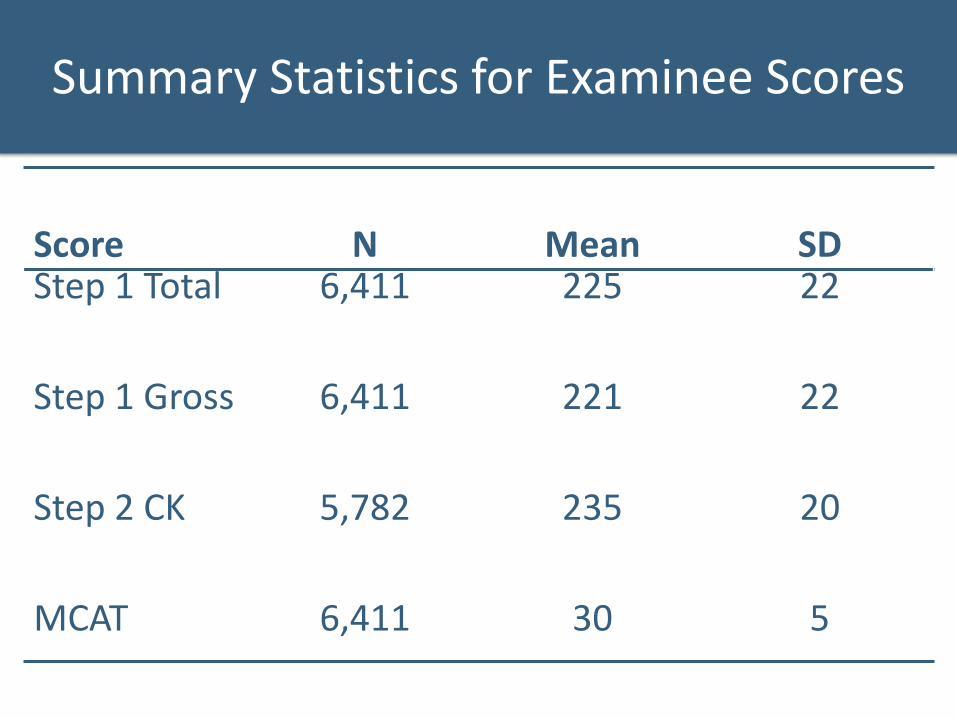
Score
N
Mean
SD
Step 1 Total 6,411 225 22
Step 1 Gross 6,411 221 22
Step 2 CK 5,782 235 20
MCAT 6,411 30 5
Summary Statistics for Examinee Scores
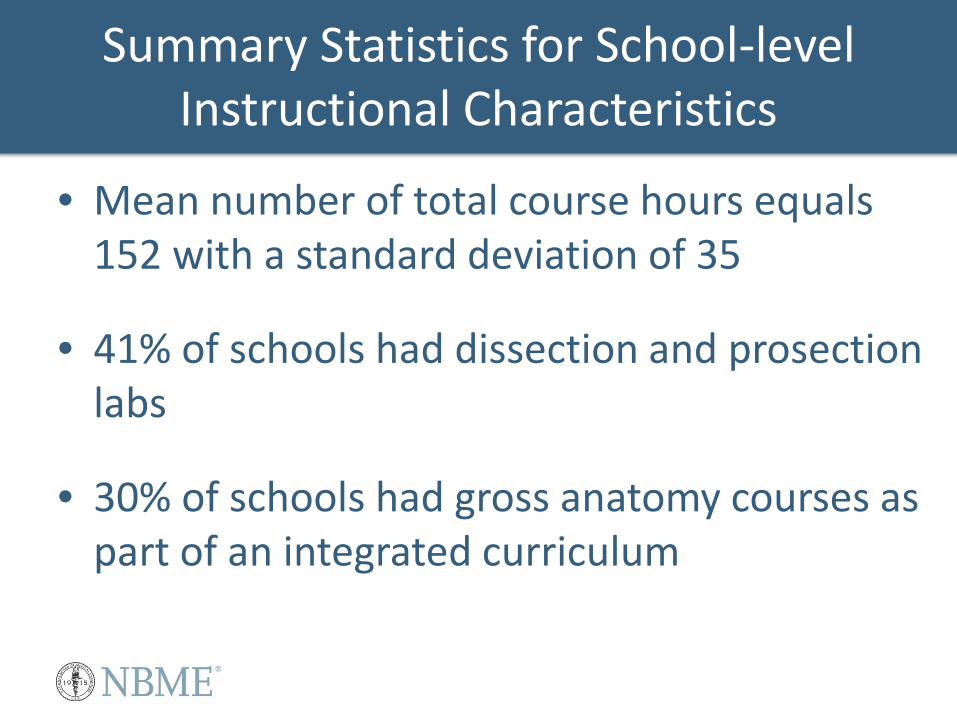
• Mean number of total course hours equals 152 with a standard deviation of 35
• 41% of schools had dissection and prosection labs
• 30% of schools had gross anatomy courses as part of an integrated curriculum
Summary Statistics for School-level Instructional Characteristics
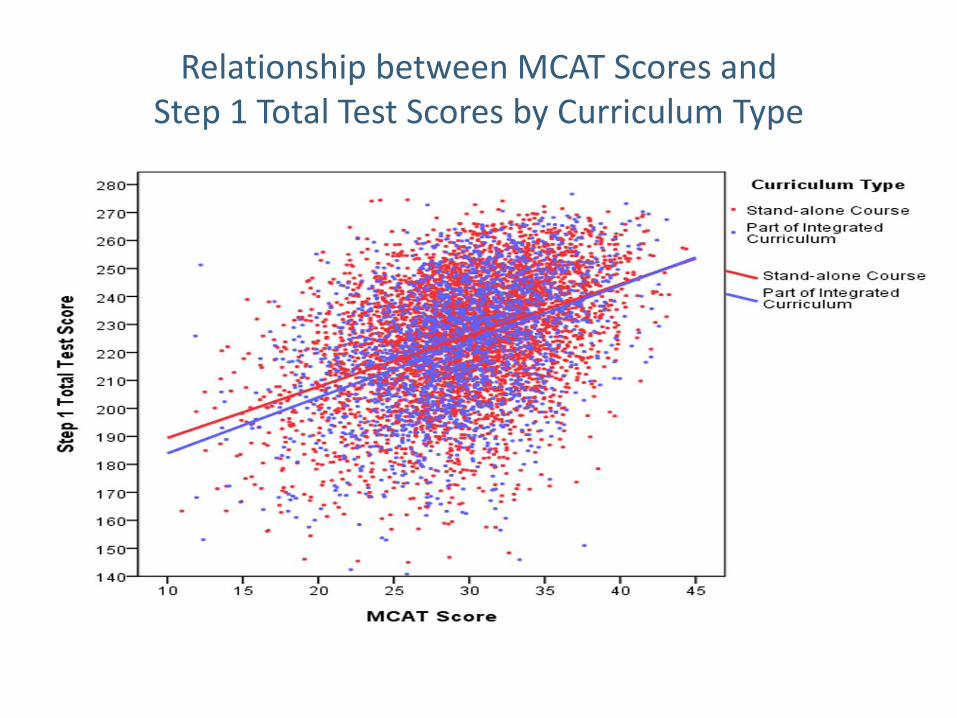
Relationship between MCAT Scores and Step 1 Total Test Scores by Curriculum Type
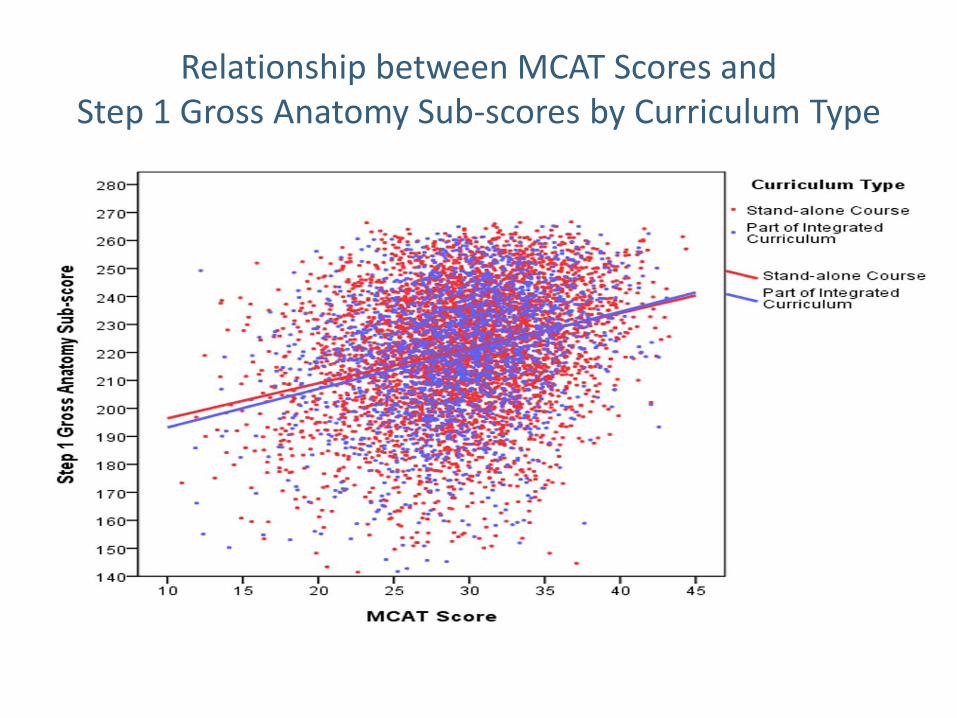
Relationship between MCAT Scores and Step 1 Gross Anatomy Sub-scores by Curriculum Type
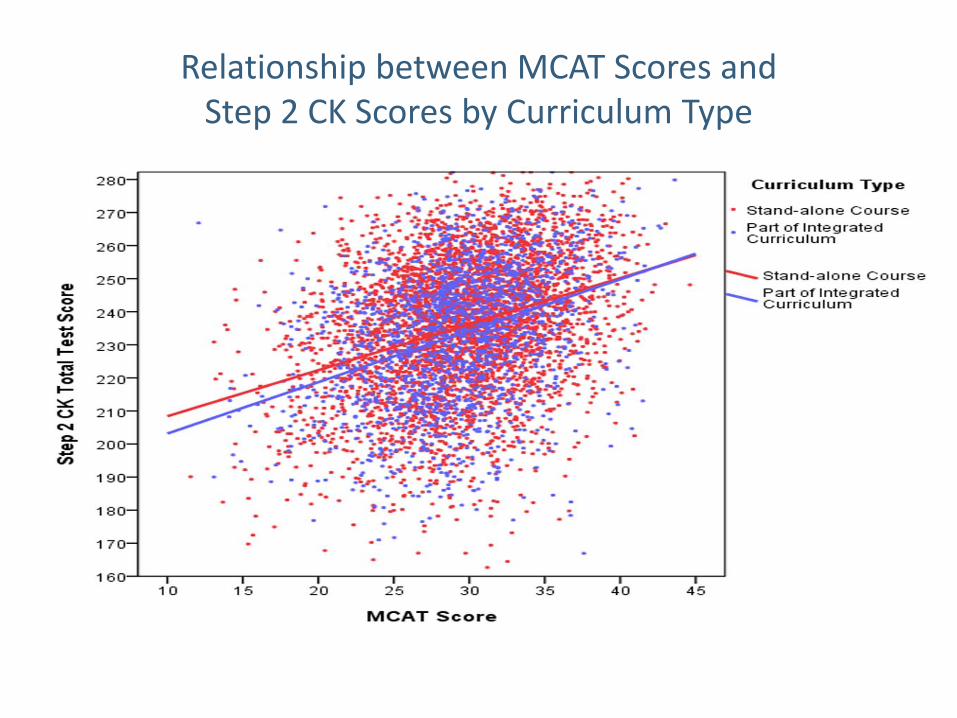
Relationship between MCAT Scores and Step 2 CK Scores by Curriculum Type
Coeff (SE)
Interpretation
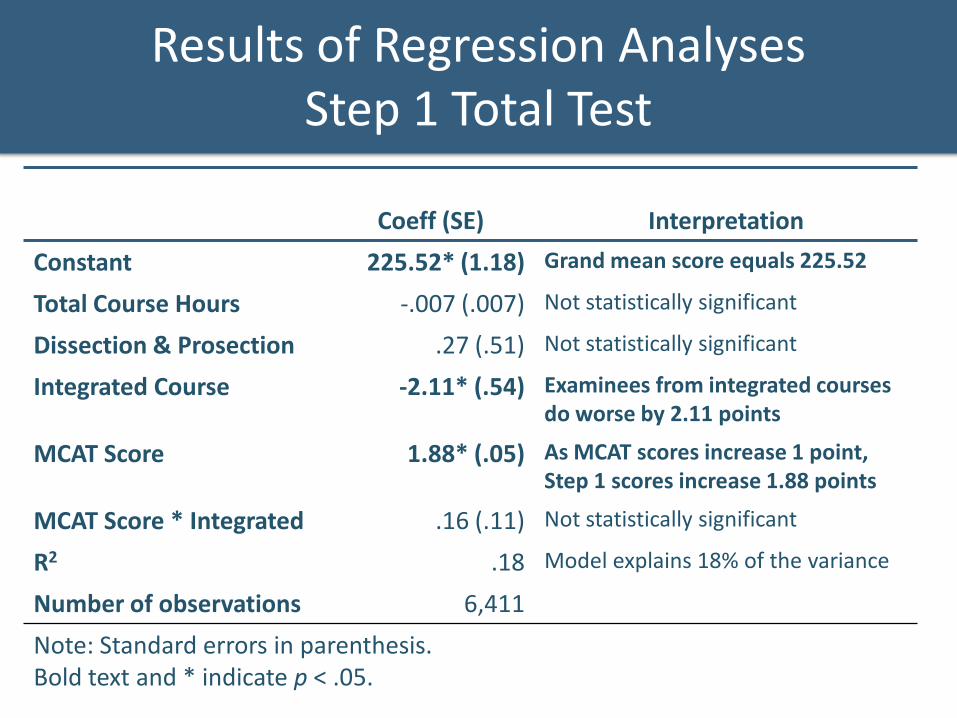
Constant 225.52* (1.18) Grand mean score equals 225.52
Total Course Hours -.007 (.007) Not statistically significant
Dissection & Prosection .27 (.51) Not statistically significant
Integrated Course -2.11* (.54) Examinees from integrated courses do worse by 2.11 points
MCAT Score 1.88* (.05) As MCAT scores increase 1 point, Step 1 scores increase 1.88 points
MCAT Score * Integrated .16 (.11) Not statistically significant
R2 .18 Model explains 18% of the variance
Number of observations 6,411 Note: Standard errors in parenthesis. Bold text and * indicate p < .05.
Results of Regression Analyses Step 1 Total Test
Coeff (SE)
Interpretation
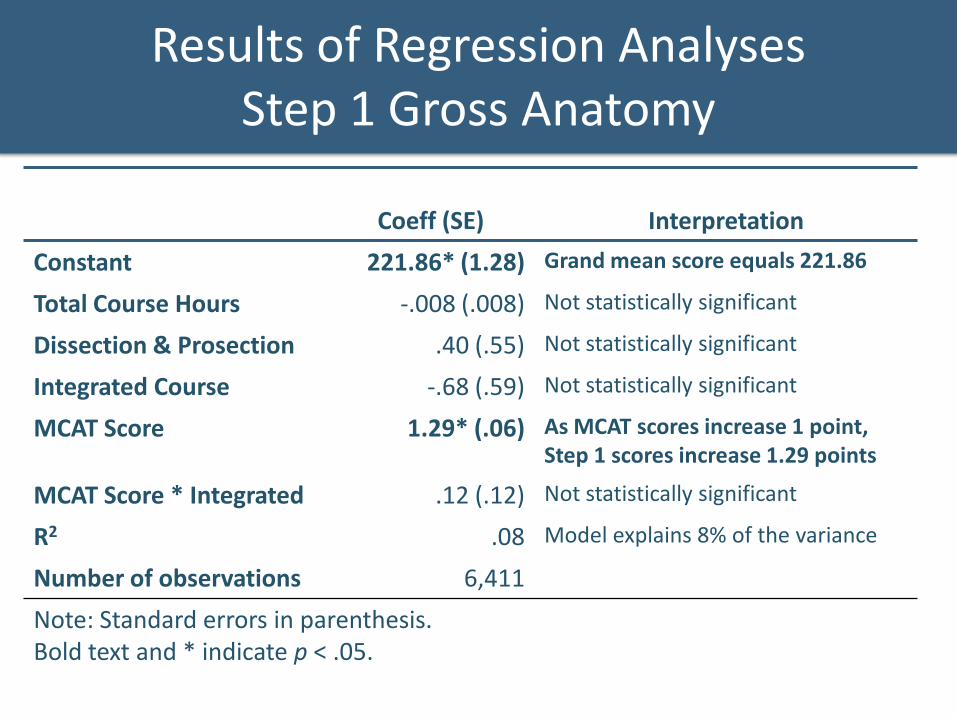
Constant 221.86* (1.28) Grand mean score equals 221.86
Total Course Hours -.008 (.008) Not statistically significant
Dissection & Prosection .40 (.55) Not statistically significant
Integrated Course -.68 (.59) Not statistically significant
MCAT Score 1.29* (.06) As MCAT scores increase 1 point, Step 1 scores increase 1.29 points
MCAT Score * Integrated .12 (.12) Not statistically significant
R2 .08 Model explains 8% of the variance
Number of observations 6,411 Note: Standard errors in parenthesis. Bold text and * indicate p < .05.
Results of Regression Analyses Step 1 Gross Anatomy
Coeff (SE)
Interpretation
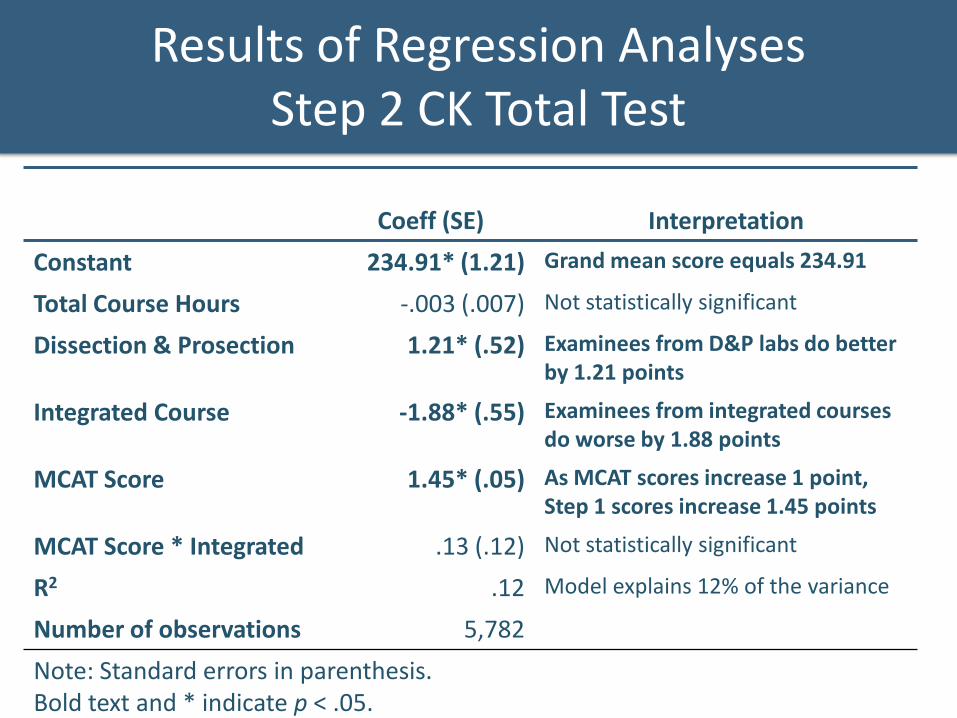
Constant 234.91* (1.21) Grand mean score equals 234.91
Total Course Hours -.003 (.007) Not statistically significant
Dissection & Prosection 1.21* (.52) Examinees from D&P labs do better by 1.21 points
Integrated Course -1.88* (.55) Examinees from integrated courses do worse by 1.88 points
MCAT Score 1.45* (.05) As MCAT scores increase 1 point, Step 1 scores increase 1.45 points
MCAT Score * Integrated .13 (.12) Not statistically significant
R2 .12 Model explains 12% of the variance
Number of observations 5,782 Note: Standard errors in parenthesis. Bold text and * indicate p < .05.
Results of Regression Analyses Step 2 CK Total Test
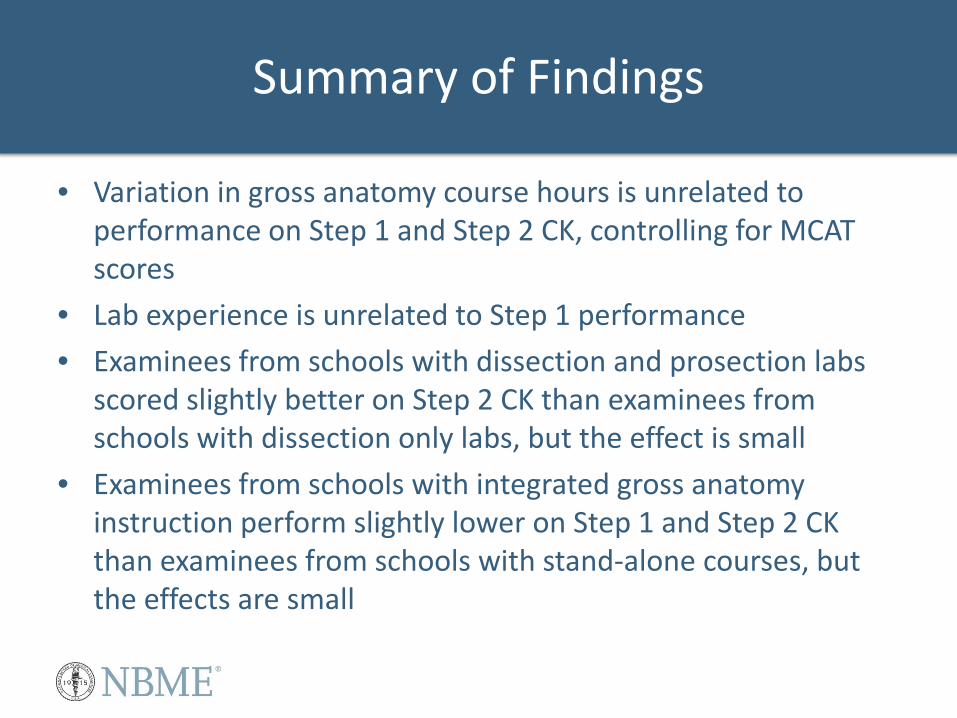
• Variation in gross anatomy course hours is unrelated to performance on Step 1 and Step 2 CK, controlling for MCAT scores
• Lab experience is unrelated to Step 1 performance • Examinees from schools with dissection and prosection labs
scored slightly better on Step 2 CK than examinees from schools with dissection only labs, but the effect is small
• Examinees from schools with integrated gross anatomy instruction perform slightly lower on Step 1 and Step 2 CK than examinees from schools with stand-alone courses, but the effects are small
Summary of Findings
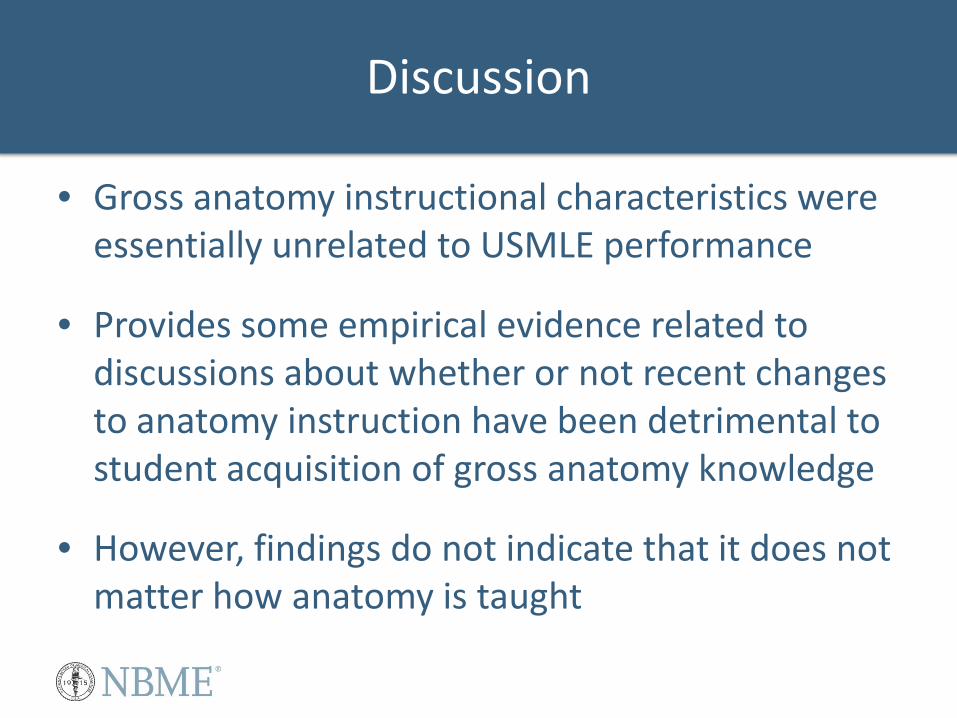
• Gross anatomy instructional characteristics were essentially unrelated to USMLE performance
• Provides some empirical evidence related to discussions about whether or not recent changes to anatomy instruction have been detrimental to student acquisition of gross anatomy knowledge
• However, findings do not indicate that it does not matter how anatomy is taught
Discussion

• Missing schools and other cohorts might yield different results
• Did not investigate school-to-school variation in the studied relationships • Multilevel models
• Relationships may be masked (and attenuated) due to independent study
Limitations and Future Research