Embed Size (px)
Citation preview

The impact of demand for labour and economic structure on Dutch
unmarried women’s labour force participation, 1812-1929*
By Corinne Boter and Pieter Woltjer
Wageningen University and Research, the Netherlands
Department of Rural and Environmental History
Abstract
Extensive research has demonstrated that female labour force participation (FLFP) in
Western Europe decreased during the second half of the nineteenth century. During
this period, in the Netherlands, FLFP was even lower than in surrounding countries
such as England and Belgium. Until now, most scholars have argued that social norms
were driving this development. This study argues that social norms were merely one
side of the coin and it combines factors of supply as well as demand in a logistic
regression based on nearly 2 million marriage records from the period 1812-1929. Our
results show that sectoral shifts in the Dutch economy explain almost half of the
decline of FLFP over the entire period. We exploit regional variation to demonstrate
the importance of considering local labour markets when investigating FLFP.
Furthermore, we support our results from the logistic regression with qualitative
information from nineteenth-century labour surveys. As such, this research is a
combination of qualitative and quantitative research methods.
1. Introduction
Historical studies on female labour force participation (FLFP) have been given much more
attention to factors of supply than factors of labour market demand in both theoretical1 and
empirical studies.2 Recently, Jane Humphries and Carmen Sarasúa have criticized the many
methodological and theoretical flaws in the historiography on women’s work, among which
the excessive focus on supply-side factors. Instead, they argue that “[d]emand was dominant
1* A previous version of this research has been published as a (single-authored) working paper: http://www.cgeh.nl/sites/default/files/WorkingPapers/cgehwp56_boter.pdf. Becker, 'A theory'.2 van Poppel, van Dalen, and Walhout, 'Diffusion'; Minoletti, 'The importance of ideology'; de Vries, The industrious revolution.
1

in shaping their [i.e. women’s] place in European labour markets; women who were offered
jobs by and large took them [...].”3 The present study follows this line of reasoning with the
primary aim to quantify as well as qualify the impact that shifts in the structure of the Dutch
economy had on the development of FLFP.
Previous studies on the effects of labour demand on FLFP in industrializing western
Europe have demonstrated that, because new machinery did not require ample physical
strength and skills, women and children were ideal, cheap labourers for industrial work. Joyce
Burnette has argued that in British regions where large textile factories were built, demand for
female labour intensified whereas demand declined in other regions because hand-spinning,
work that had provided many women with an income in pre-industrial times, disappeared.
“Women’s work opportunities, then, depended on the state of the local economy.”4 Claudia
Goldin found a U-shaped curve of FLFP in the United States with a decline during the
nineteenth century followed by a rise halfway through the twentieth century.5 During the
initial stages of industrialization, women’s opportunities in the labour market declined. While
industrialization progressed, the service sector, most importantly white-collar work, became
more important. Because in the meantime women’s educational attainments had improved
relative to men’s, women were able to fulfil these jobs and to re-engage in paid employment.
This ‘U-shaped curve’ of FLFP is characteristic for most developed economies, albeit the
pace and timing depend on other factors as well.6 Demand for labour also affected other facets
of society. For the case of England, Paul Atkinson demonstrated that the extent of local
demand for female labour determined fertility rates. The higher the demand for female labour,
the longer women would postpone their marriage and the lower fertility would be.7
Despite the growing attention for demand-side factors, the literature remains
dominated by a range of supply-side explanations for long-term developments in FLFP. First,
the specific stage of a woman’s life-cycle presumably influenced her decision to work. The
presence of many young, dependent children drove women from the labour market whereas
3 Humphries and Sarasua, 'Off the record', p. 53.4 Burnette, Gender, work and wages, p.44. Burnette further argues that men’s fear for competition of cheap, female labourers would lead to women’s exclusion from well-paid jobs through legislation (see also: Horrell and Humphries, 'The origins', p. 50). Indeed, women workers, most notably in the textile industry, kept male wages low and that is why trade unions started to exclude female members. According to Burnette, men succeeded in driving women out of the labour market by using gender ideology (Burnette, Gender, work and wages, p. 15).5 Goldin, 'The u-shaped'.6 Goldin, 'The u-shaped'; Goldin, 'The quiet revolution'.7 Atkinson, 'Isn't it time'.
2

they returned when their children had become older.8 Second, Jan de Vries and Joel Mokyr
have argued that during the nineteenth century, households increasingly desired to consume
goods such as cleanliness and good nutrition. These goods could not be purchased on the
market and had to be produced by a stay-at-home wife. Consequently, married women
retreated from the labour market.9 This changing consumptive behaviour was influenced by
increasing knowledge of, among others, the spread of diseases through germs and the
importance of good nutrition.10 Moreover, men’s nominal and real wages increased during
industrialization, enabling households to relinquish the wife’s income.11 Finally, middle-class
social norms became more pronounced among the nineteenth-century working class.
Domesticity was the core of a proper bourgeois lifestyle and could only be achieved with the
presence of a good housewife. Therefore, women who worked outside their homes could not
provide their family with the proper home environment.12
The Netherlands forms a particularly interesting case to explore the impact of
changing demand structures for labour. Evidence from occupational censuses suggests that
during the nineteenth and early twentieth centuries, Dutch FLFP was remarkably low relative
to surrounding countries (Table 1).13 Up to now, this has mainly been explained by the above
mentioned supply-side factors, most notably the influence of changing social norms regarding
domesticity.14 However, these social norms already prevailed during the early modern period
and the acceptance of these norms did not change substantially during the nineteenth
century.15 Therefore, we need to look for other factors of change to explain the low Dutch
FLFP rates in Table 1.
8 Garrett, 'Was women's work'.9 de Vries, The industrious revolution. 10 Mokyr, 'Why "more work for mother"?'11 Goldin, 'The u-shaped'.12 Minoletti, 'The importance of ideology'; van Poppel, van Dalen, and Walhout, 'Diffusion'. 13 Pott-Buter, Facts and fairy tales; Janssens, 'The rise and decline'. Recent research on women’s work in the nineteenth-century Netherlands shows that women who withdrew from the registered labour market often took up other types of work, such as home industrial labour and subsistence farming, that could be combined with homemaking tasks: Boter, 'Ideal versus reality?'. 14 de Vries, The industrious revolution; Walhout and van Poppel, 'De vermelding des beroeps'; van Poppel, van Dalen, and Walhout, 'Diffusion'.15 de Vries and van der Woude, The first modern economy, p. 605; Schmidt, 'Labour ideologies', p. 46. Some scholars have nuanced this view: Everard, 'Verandering en continuïteit'; Schuurman, 'Is huiselijkheid'.
3

Table 1. FLFP in Western Europe (percentage of women with a listed occupation)Year Belgium Germany United Kingdom The Netherlands1850 38 30 241860 36 28 181870 36 281880 34 24 251890 29 25 27 151900 29 25 171910 25 30 26 181920 21 35 26 181930 24 34 27 19
Source: Pott-Buter, Facts and fairy tales, p. 21.NB: the years shown in the table are not always the exact years in which the census was conducted. (Belgium: 1850=1846; 1860=1856; 1870=1866. Germany: 1880=1882; 18901895; 1910=1907; 1920=1925; 1930=1933. U.K.: 1850=1851; 1860=1861; 1870=1871; 1880=1881; 1890=1891; 1900=1901; 1910=1911; 1920=1921; 1930=1931. The Netherlands: 1850=1849; 1860=1859; 1890=1889; 1900=1899; 1910=1909).
An underexplored factor is the specific Dutch economic structure. Compared to
neighbouring countries, the share of Dutch employment in industry was low throughout the
latter half of the nineteenth and in the early-twentieth century.16 In addition, its share of
employment in services was particularly high due to the growth of commercial services (i.e.
transport, wholesale, retail). The present research will show that the sectors that came to
dominate the Dutch economy presented only limited employment opportunities for women.
The comparatively slow rate of industrialization is thus a likely cause of the relatively low
FLFP in the Netherlands.
This study has three main objectives. First, it moves beyond the literature that has
emphasized the influence of social norms on the changing levels of FLFP. Although we
acknowledge the importance of these studies, we argue that they are incomplete. By exploring
the influence of demand for labour in local economies, we combine factors of demand and
supply in one analytical framework. This also implies a change of perspective: whereas most
scholars have tried to answer the question why women withdrew from the Dutch labour
market during the nineteenth century, we examine the reasons why a substantial share of the
women did not. The results will show that the share of economic sectors with a large demand
for female labour decreased during the long nineteenth century.
Second, this research is based on regional source material. Nowadays, it is widely
acknowledged that censuses systematically underreported women’s work and that other types
of disaggregate sources are needed to understand developments of FLFP in pre-industrial and
16 Griffiths, Industrial retardation; Horlings and Smits, 'A comparison', p. 89; de Jonge, De industrialisatie; Jansen, De industriële ontwikkeling; Mokyr, Industrialization in the low countries; Mokyr, 'The industrial revolution'.
4

industrial economies.17 In the past decade, many historians have started to take up the
challenge to “rescue the history of women’s work from its marginal, ‘off the record’ status
[...]”18 by using alternative, disaggregate source material.19 Likewise, this article moves
beyond the census by exploring an alternative source: the Dutch marriage records for the
period 1812-1929. The employed database contains information on nearly 2 million
marriages, covering seven out of the eleven Dutch provinces. Based on whether or not the
bride stated an occupation in her marriage record, we determine the extent of FLFP.20
The detailed marriage records allow us to run a logistic regression and to estimate,
among others, how the occupational status of the groom, the age of the bride, and the
characteristics of the local labour market affected the development of FLFP. The wide
coverage of the data source, across both time and space, permits an analysis of FLFP on a
municipal level.21 We can thus observe and account for local variations in the demand for and
supply of female labour: a crucial piece of the puzzle that cannot be observed when using a
nationwide approach based on aggregate data. The results allow to quantify what was driving
the marked decline in FLFP in the Netherlands over the long nineteenth century. For this we
utilize a novel decomposition framework that attributes the change in FLFP to the change in
the various factors included in the analysis. This decomposition shows that, even though
‘social norms’ turned out to be an important driver, shifts in the economic structure of the
Dutch economy were the most important driver behind the decline in FLFP.
Third, in addition to the regression analysis, we provide qualitative support for our
main findings based on the labour surveys of 1890 that contain interviews with hundreds of
people from various social classes. These accounts provide insight into how individuals
responded to changes in different labour markets. We selected the textile and peat industries
as case studies because by the end of the nineteenth century, the former industry flourished in
certain parts of the country while the latter was rapidly shrinking due to the growing
competition of coal as fuel.
17 Higgs, 'Women, occupations and work'; Hill, 'Women, work and the census'; Humphries and Sarasua, 'Off the record'; Muñoz Abeledo, 'Women in the rural'; Schmidt and van Nederveen Meerkerk, 'Reconsidering'.18 Humphries and Sarasua, 'Off the record', p. 40.19 See for instance: Atkinson, 'Isn't it time'; Burnette, Gender, work and wages; Grantham, 'Occupational'; Muñoz Abeledo, 'Women in the rural'. 20 In the context of the entire population, labour force participation is ‘the percentage of the total population performing market work’ (Pott-Buter, Facts and fairy tales, p. 7). In this article, the term FLFP refers to the percentage of brides with a listed occupation in their marriage record. 21 Nowadays, the importance of regional research for women’s labour history is widely recognized. See for instance: Verdon, 'The rural labour market'; Humphries, 'The lure of aggregates'.
5

This paper proceeds as follows. Section 2 considers the historiography on the
influence of social norms on Dutch FLFP and presents the reasons why we question the
completeness of this literature. Section 3 explains the nature of the sources and research
methods in more detail. Section 4 discusses the results from the logistic regression, showing
that certain sectors, such as the textile industry and private services, had a significantly
positive effect on the chance that a bride would state an occupation upon marriage. Section 5
quantifies the contribution of the shifts in the economic structure of the Dutch economy to the
ever declining share of brides reporting an occupation by decomposing the change in FLFP
between 1812 and 1929. Section 6 provides qualitative support for the regression results.
Section 7 concludes.
2. The importance of regional research
The origins and expansion of the ‘male breadwinner society’ in Europe, where men were the
household’s sole wage earners, have been heavily debated. Although it is clear that FLFP
indeed decreased in western Europe during the nineteenth century, the exact timing of the
realization of the male breadwinner society remains obscured.22 Most studies on this topic do
conclude that by the end of the nineteenth century, the breadwinner-homemaker model had
become the preferred type of household labour allocation in most western European
countries.23
Frans van Poppel, Hendrik van Dalen, and Evelien Walhout have argued that social
norms were driving the emergence of the Dutch male breadwinner society.24 They have shown
that throughout the nineteenth century, women increasingly entered marriage without an
occupation. Inspired by theories developed by Jan de Vries and Joel Mokyr25, Van Poppel et
al. acknowledge the influence of the increasing value attached to household products such as
cleanliness and gezelligheid (cosiness). They further expound on why choices in household
labour allocation were made following these shifting consumer aspirations. They reason that
because from the 1850s onwards, women increasingly quit their jobs before they got married,
thus before they were expected to ‘produce’ these goods for their own household, social
norms must have been the main impetus for women to enter marriage as a housewife. They
22 Creighton, 'The rise'; Janssens, 'The rise and decline'; van Nederveen Meerkerk, 'The first'.23 Bourke, 'Housewifery', pp. 172-173; van Poppel, van Dalen, and Walhout, 'Diffusion'.24 van Poppel, van Dalen, and Walhout, 'Diffusion'.25 Mokyr, 'Why "more work for mother"?'; de Vries, 'The industrial revolution'; de Vries, The industrious revolution.
6

further argue that many brides chose not to state an occupation although they did have one,
only to live up to society’s expectations and that therefore, “[t]o keep up appearances, they
substituted registered work for unregistered work (for example, in cottage industries, or
working in the family firm or on the farm).”26
Although the social norms thesis is appealing, it fails to capture all of the dynamics in
the change of FLFP for three reasons. First, social norms regarding domesticity already
prevailed during the early modern period.27 Therefore, attitudes towards female labour did not
substantially change during the nineteenth century. Although some scholars have argued that
Dutch women already withdrew from the labour market in the seventeenth century, recent
research has shown that most women in the early modern Dutch Republic were in fact
working and that the birth of the male breadwinner ideal did thus not match the actual
practice.28 Moreover, Jan de Vries’ concept of an ‘industrious revolution’ contradicts the idea
of an early modern male breadwinner society. He argues that during the early modern period,
a period of growing industriousness leading up to the industrial revolution, households desired
to purchase more market produced goods. To satisfy their needs, all members of the
household were mobilized to perform wage labour.29 Furthermore, in line with De Vries’
conclusions, Ariadne Schmidt demonstrated that the early-modern view was that “[w]omen
from those social layers that lacked income from capital should provide for their own
subsistence through work.”30 In other words, the apparent contradicting ideologies of
domesticity and industriousness coexisted in reality. If the domesticity ideal already existed
during the early modern period, what then drove the changes in Dutch FLFP? Second,
although social norms certainly differed between regions, they cannot sufficiently explain the
large regional variations in FLFP. Third, Van Poppel et al. inadequately considered alternative
explanations, prime amongst which is the shifting structure of the Dutch economy and its
impact on the demand for female labour.
The present research applies a regional approach to explore other factors of change,
besides social norms, that have determined FLFP rates through time. Many studies on
women’s labour rely heavily on aggregate sources, most notably occupational censuses, that
26 van Poppel, van Dalen, and Walhout, 'Diffusion', p. 124.27 Schmidt, 'Labour ideologies', p. 46; de Vries and van der Woude, The first modern economy, p. 605.28 van den Heuvel, Women and entrepreneurship; van Nederveen Meerkerk, De draad in eigen handen; Schmidt, 'Women and guilds'; Schmidt and van Nederveen Meerkerk, 'Reconsidering'. 29 de Vries, The industrious revolution.30 Schmidt, 'Labour ideologies', p. 67. See also: Everard, 'Verandering en continuïteit'.
7

neglect regional variation.31 Sara Horrell and Jane Humphries have stated that: “[g]rand
theorizations of the rise of the male breadwinner family provide falsely homogenizing
accounts which are obsessed with monocausality, outcomes and finished worlds.”32 Van
Poppel et al. have successfully used an alternative source – marriage records – on a regional
level for their research on the emergence of the Dutch housewife. However, although they
analysed their data on a provincial level and distinguished between rural and urban regions,
they did not systematically explore regional variation. By including regional economic
structures in the analysis, we account for both factors of supply and demand.
We analyse the Dutch marriage records on a municipal level and show that the
decreasing FLFP was not a linear process and that regional variation was considerable. Figure
1 below illustrates this point and shows the percentages of brides who stated an occupation in
their marriage records in three municipalities and on the national level in the period 1812-
1929. The three municipalities each represent a labour market with one dominant type of
industry. In Enschede, this was textile, in Maastricht pottery and glass, and in Odoorn peat
production.
31 See for studies that question the accuracy of censuses among others: van Nederveen Meerkerk and Paping, 'Beyond the census'; van Nederveen Meerkerk, 'The first'; Higgs, 'Women, occupations and work'; Hill, 'Women, work and the census'. Others have argued that the extent of underreporting was not so problematic and that some occupations, such as domestic servants, may have even been over reported: Hatton and Bailey, 'Women's work'.32 Horrell and Humphries, 'The origins', p. 64. See also: Creighton, 'The rise'; Humphries, 'The lure of aggregates'.
8

Figure 1. Percentage of brides with a stated occupation 1812-1929
Source: Marriage records 1812-1929
In Enschede, Maastricht, and Odoorn, the marriage records suggest that FLFP indeed
slightly decreased from the 1830s onwards, but drastically increased again during the last
decades of the nineteenth century. Especially between 1880 and 1920, these regional trends
diverged considerably from the national average. If social norms indeed were driving the
decreasing Dutch FLFP, then how do we explain the sudden revival of working women in
these specific regions? And why did regional FLFP show such a large variation?
We do not reject the influence of social norms. In fact, from ample other qualitative
research it has become apparent that by the end of the nineteenth-century in the Netherlands,
domesticity was actively pursued by the middle as well as by the working class.33
Furthermore, a study by Koen Matthijs on the decreasing age at marriage of both men and
women in Flanders during the nineteenth century has shown that factors of supply and
demand reinforced each other. Economic change pushed women into the private domain and
“[i]n response to this relative deprivation, they developed their own ‘female’ status scale that
was centred almost exclusively on romantic marriage, the closed home, and the caring
mother.”34 The present research likewise emphasizes the reciprocal relation between supply
and demand and nuances the social norms thesis rather than rejecting it.
33 Boter, 'Ideal versus reality?'.34 Matthijs, 'Mimetic appetite', p. 122.
9
1812-
1819
1820-
1829
1830-
1839
1840-
1849
1850-
1859
1860-
1869
1870-
1879
1880-
1889
1890-
1899
1900-
1909
1910-
1919
1920-
1929
0%
10%
20%
30%
40%
50%
60%
70%
80%
90%
NationalEnschedeMaastrichtOdoorn

3. Data and methodology
In 1811, the Code Napoleon – the French civil code established by Napoleon I – was
implemented in the Netherlands. It ordered that all municipalities had to register births,
marriages, and deaths in the exact same way. In 1838, when the French had been long gone,
the Code Napoleon was replaced by the Dutch Civil Code. However, virtually nothing
changed in the ways in which birth, marriage, and death certificates were organized.35 Thus,
marriage records in the entire country were supposed to record the same information on the
marrying couple and their parents, and, most importantly, on the occupation the bride held
just before she got married. Despite the long timespan covered by the marriage records, the
nature of and information provided by this source remained stable, and changes over time are
therefore unlikely to be caused by a temporal source bias. Furthermore, the clerk who was in
charge of the registration received clear instructions. For instance, the marriage record had to
list “[...] the occupation of the woman when entering a marriage, or the job from which she
resigned at the time of marriage or some time before in view of her prospective marriage.”36
Both the groom and the bride reported their occupational titles themselves. In sum, marriage
records are an invaluable source for a longitudinal analysis of unmarried women’s labour as
they are available on a local level, are comparable throughout the entire country, and cover an
extensive period of time.
Marriage records have been used to research various aspects of family history such as
changing family relations, the development of socially mixed marriages, social mobility, and
demography.37 Still, there are some source biases that need to be discussed. First, the records
do not state whether the bride continued her work during her married life and they therefore
only inform us about unmarried women’s LFP. Therefore, the conclusions of this research
cannot directly be applied to married women’s labour market experience. Second, the source
provides a lower-bound estimate of working women, as brides could choose not to state an
occupation if they knew beforehand they would quit after they had married. Third, the records
do not capture the occupations of women who did not marry at all. We know that the
proportion of single women was relatively large in the Netherlands and that the age at first
35 van Sonsbeek, Van de schaduw, p. 14-15.36 Quoted in: van Poppel, van Dalen, and Walhout, 'Diffusion', p. 107.37 Bras, 'Intensification of family relations?'; Bras and Kok, 'They live in indifference together'; van Poppel and Nelissen, 'The proper age'; van Leeuwen and Zijdeman, 'Digital humanities'; van Leeuwen and Maas, 'Economische specialisering'; van Bavel and Kok, 'Social control'.
10

marriage decreased during the nineteenth century. Young women are thus overrepresented in
the database.
To quantify the effects that structural economic shifts had on FLFP in the Netherlands,
we run a logistic regression to estimate the probability that a woman stated an occupation
upon marriage. We assume that this probability depended on the social status of the groom,
the age of the bride, the period in which the marriage took place, the province where the
marriage was recorded, and whether the bride and groom lived in an urban or rural location.
Crucially, measures of the economic structure of the municipality where the marriage was
registered are included (i.e. the share of employment in the main economic sectors). This
allows us to determine whether women residing in municipalities that were primarily oriented
towards, say, agriculture were more likely to state an occupation than women living in
industrialized areas. In addition, we incorporate national figures for Gross Domestic Product
(GDP) per capita in the regression to capture the effect of rising income levels on FLFP over
time.
For all brides we reclassified the occupational titles listed in the marriage records into
a binary variable, i.e. ‘0’ when the bride did not state an occupation and ‘1’ if she did. The
grooms’ occupational titles were recoded into 7 distinct social classes for men (see Table 2a)
based on the Historical International Standard Classification of Occupations (HISCO).38
Next, we grouped the year of marriage by decades and the age of the bride by 5-year intervals.
Based on the municipality in which the marriage was registered the province and urban/rural
variables were defined. We used the 1899 census to classify the municipalities in either the
urban or the rural group.39 Municipalities with fewer than 5,000 inhabitants were not counted
separately for this census. Therefore, we consider all these smaller municipalities to be rural,
while the municipalities reporting over 5,000 inhabitants are classified as urban.
To determine the share of employment in the major economic sectors for each of the
254 municipalities in the sample, we again turn to the 1899 occupational census. For the
larger municipalities this census reported the number of men, women, and children working in
33 separate industries. These industries are aggregated into 12 distinct sectors corresponding
with the basic Standard Industrial Classification (SIC).40 The sectoral shares are based solely
on the employment figures for men, as they were less concentrated in certain industrial
38 van Leeuwen, Maas, and Miles, 'Creating'; van Leeuwen and Maas, HISCLASS. See for the website of this project: https://collab.iisg.nl/web/hisco/. 39 www.volkstellingen.nl. For more information on the history of the Dutch census: Boonstra et al., Twee eeuwen.40 For an overview of the SIC, see Ruggles et al., Integrated (variable ‘IND1950’).
11

branches and employment rates were higher. Therefore, the male labour force is more
representative for a determination of the size of industry in each municipality. Furthermore,
using the female labour force for this purpose could introduce a fair amount of circularity in
the model, where the extent of FLFP in a municipality is explained by itself.
For the municipalities smaller than 5,000 inhabitants we rely on the marriage records
for the years between 1889 and 1909. We assign the occupations as reported by the grooms,
the fathers of the grooms, and the fathers of the brides to each of the 12 sectors on the basis of
a correspondence table between the HISCO and SIC, provided by the Integrated Public Use
Microdata Series (IPUMS).41 To capture changes in the sectoral composition over time the
marriage records for years prior to and following the census are utilized. Appendix B provides
a complete overview of the method behind the construction of the sectoral shares.
Lastly, GDP per capita is taken from the Historical Statistics by Angus Maddison.42
The real GDP figures were converted to constant 1913 Dutch Guilders and Maddison’s series
was extrapolated between 1812 and 1819 using Smits et al.43 In the regression the natural log
of the annual GDP per capita series is used.
Our dataset and interpretation differ in two important ways from the earlier work of
Van Poppel et al. First, while they based their conclusions on just over one million marriages,
we have access to nearly double that number: 1,820,527 records. The added records are
principally those from the province of Noord Holland which until recently had only been
partly digitized. Noord Holland was the most urbanized and densely populated province of the
Netherlands. Consequently, the balance between rural and urban regions altered in favour of
the latter. Second, while Van Poppel et al. predicted the probability that brides did not state an
occupation, we predict the probability that they did.
41 See Ruggles et al., Integrated (variables ‘OCCHISCO’ and ‘IND1950’).42 Maddison, Statistics.43 Smits and Horlings, Dutch GNP.
12
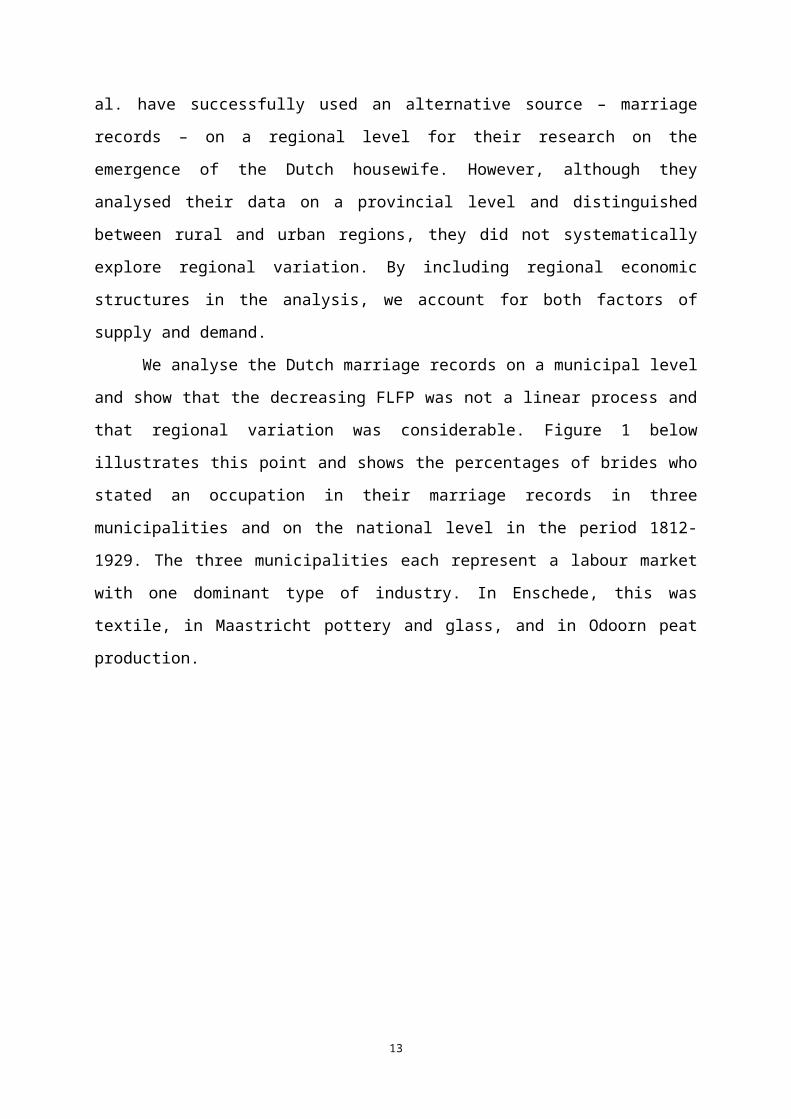
Figure 2. Dominant sector by municipality, 1900-1929
Primary sector
Secondary sector
Tertiary sector
No data
Capital city
Provincial capital
Major city
Note: map indicates the greatest share of male employment in respectively the primary, secondary, and tertiary sectors for the years between 1900 and 1929.Sources: Centraal Bureau voor de Statistiek, 'Census 1899'; marriage records 1910-1929.
Overall, our dataset covers seven of the eleven Dutch provinces and includes both
agricultural as well as industrialized and urbanized areas (see Figure 2). The dataset ranges
from 1812 to 1929. Tables 2a and 2b provide an outline of the main variables in the model.
Table 2a summarizes the categorical variables: the rightmost column shows the share of
brides that reported an occupation for that specific variable/category, while the middle column
reports the share that each of the listed categories represents out of the total sample. Table 2b
summarizes the continuous variables in the sample: the share of employment in each of the 12
major economic sectors at the municipal level and GDP per capita. The final column in Table
2b sums up the relationship between these variables and FLFP. Here the correlation between
13

the average sectoral share for each combination of decade and municipality and the average
percentage of brides stating an occupation is listed.
Table 2a. Summary statistics categorical variables
% of sample
% brides
with occ.% of
sample
% brides
with occ. Occupational status of groom ProvinceUpper class 3.2 14.3 Drenthe 5.8 41.2White-collar middle class 14.6 16.5 Gelderland 18.3 33.2Skilled workers 18.3 28.2 Groningen 11.9 35.4Farmers 14.3 27.6 Limburg 10.9 38.0Lower-skilled (farm) workers 15.5 32.9 Noord-Holland 32.1 20.0Unskilled workers 16.3 40.9 Overijssel 12.3 36.8Unskilled farm workers 18.0 52.2 Zeeland 8.7 61.2
Period of marriage Rural or urban municipality1812-1819 3.8 52.1 Rural 39.4 38.61820-1829 5.5 54.6 Urban 60.6 29.51830-1839 5.8 54.71840-1849 6.3 52.0 Age bride at marriage1850-1859 7.3 48.9 14-19 5.1 23.71860-1869 8.0 43.4 20-24 32.1 28.21870-1879 8.7 37.9 25-29 24.5 33.21880-1889 8.6 32.8 30-34 10.4 38.11890-1899 9.8 24.6 35-39 4.8 41.01900-1909 11.4 18.7 40-44 2.6 42.31910-1919 12.9 16.6 45-90 2.9 38.01920-1929 11.9 15.3 Not available 17.7 37.4Source: see text.
Table 2b. Summary statistics continuous variables
Mean Stdev. Min. Max.
Correlation to% brides with
occ. Sectoral share (%)Agriculture 32.5 22.6 2.9 91.9 0.04Mining and peat extraction 0.6 4.5 0.0 57.6 -0.32Construction 9.2 3.8 0.0 24.5 -0.39Food, tobacco and beverages mnf. 4.6 2.5 0.0 23.4 -0.28Textile and apparel mnf. 7.2 5.1 0.1 62.6 0.48Metal and machinery mnf. 3.5 2.1 0.0 15.1 -0.21Paper and chemical mnf. 0.9 1.1 0.0 20.7 -0.22Glass, pottery, misc. mnf. 3.8 3.3 0.0 27.7 -0.11Transportation and public utilities 8.3 6.2 0.0 50.2 -0.39Wholesale and retail trade 10.3 6.3 0.0 50.0 -0.35Finance, insurance and real estate 1.7 1.6 0.0 6.4 -0.34Private services 17.3 6.7 1.3 49.5 0.47
Gross Domestic Product p. capita (log) 5.67 0.29 5.02 6.31 -0.44Source: see text.
14

We predict the likelihood that bride i reports an occupation in the marriage records.
This probability should be bounded by 0 and 1, continuous and nonlinear; conditions which
are all met by a logit model:
Pr { y i=1|x i }= ex i' β
1+ex i' β (1)
The right-hand side of equation (1) is a distribution function with mean 0 and standard
deviation 1. The coefficients (β) are estimated using maximum likelihood, which is the
optimal parametric estimator in this context.
4. Regression results
A cursory look at Tables 2a and 2b reveals a number of correlations between the covariates.
First, there is a clear negative relation between FLFP and the occupational status of the
groom: only 14% of the women with the future husband holding an upper-class position
reported an occupation, versus 52% of the women marrying unskilled farm workers. Second,
younger brides were less likely to report an occupation. Third, there were large differences in
FLFP between the provinces, which could be driven by the fact that fourth, women in
urbanized municipalities were less likely to report work than those in rural areas.
The variable that should capture shifts in social norms is the period of marriage. Table
2a shows that, for the entire sample, approximately 50% of the women reported an occupation
prior to 1850 while less than 20% did so after 1900. This could represent changing attitudes
towards female labour. From at least 1850 onwards, there was a decline in either the actual
FLFP or the willingness of unmarried women to report their occupation. This decline could,
however, be driven by factors other than changing social norms such as demographic factors –
rates of urbanization, migration, or fertility – or increases in the average household income
(proxied by the status of the groom and GDP). Such developments are therefore likewise
captured by the variable period of marriage and could cause social norms to become more
constraining.
The main variables of interest are the sectoral employment shares summarized in
Table 2b. The positive correlations in the last column of this table reveal that a greater than
average share of employment in the ‘Textile and apparel manufacturing’ and the ‘Private
services’ sectors generally coincided with a high rate of FLFP in any given municipality. For
15
most of the other sectors, however, there was an opposite relation. Municipalities with a
sizable share of employment in ‘Construction’ or ‘Transportation and public utilities’, for
example, generally reported a FLFP rate below average. The share of employment in
‘Agriculture’ does not reveal a clear relation to the share of brides stating an occupation. The
varying impact of different sectors on FLFP provides support for my hypothesis that local
economic structures indeed affected opportunities for women on the labour market. Still, the
real test of this hypothesis is whether these differences remain when all variables are included
into a single model, and whether changes in the structure of the Dutch economy over time can
actually explain a significant portion of the decline in FLFP throughout the nineteenth and
early twentieth century.
Table 3 reports the results from the logistic regression. The odds ratios are presented
here, as these provide a readily interpretable estimate of the expected increase/decrease in the
likelihood that a woman held a job at specified times, places, or given the occupation of her
future husband. For each of the independent categorical variables we first list the reference
category between brackets and then return the odds ratios for the alternative categories. Note
that three separate regressions are presented. Model (3) includes all variables discussed in the
previous section but excludes all the observations from the province of Groningen because for
this province, information about the brides’ and grooms’ age was not available. The first two
models include all observations but both leave out the age at marriage variable.44 Model (1)
excludes the sectoral-share variables and serves as our baseline estimate. Comparing the
second and third models to this baseline enables us to estimate the sensitivity of the variables
included when actually controlling for the structure of the local economy.
44 Note that all three models include a full set of provincial dummies which we have omitted from Table 3 for the sake of brevity. The full regression table, including the odds ratios for the age dummies in model (3) is given in Appendix A.
16

Table 3. Odds ratios for brides stating an occupation (‘no occupation’ = 0)(1) (2) (3)
Odds ratio SE
Odds ratio SE
Odds ratio SE
Occupational status of groom (unskilled farm workers = 1.00)Upper class 0.17*** (0.002) 0.16*** (0.002) 0.18*** (0.003)White-collar middle class 0.25*** (0.002) 0.26*** (0.002) 0.28*** (0.002)Skilled workers 0.48*** (0.003) 0.48*** (0.003) 0.51*** (0.004)Farmers 0.36*** (0.002) 0.36*** (0.002) 0.41*** (0.003)Lower-skilled workers and farm workers 0.63*** (0.004) 0.61*** (0.004) 0.67*** (0.005)Unskilled workers 0.79*** (0.005) 0.82*** (0.005) 0.88*** (0.006) Period of marriage (1920-1929 = 1.00)1812-1819 4.47*** (0.183) 1.51*** (0.064) 1.66*** (0.078)1820-1829 5.17*** (0.183) 1.76*** (0.065) 1.96*** (0.080)1830-1839 5.27*** (0.168) 1.99*** (0.066) 2.21*** (0.081)1840-1849 4.81*** (0.144) 1.82*** (0.057) 1.99*** (0.069)1850-1859 4.30*** (0.118) 1.86*** (0.053) 1.89*** (0.060)1860-1869 3.46*** (0.089) 1.49*** (0.040) 1.46*** (0.043)1870-1879 2.88*** (0.063) 1.56*** (0.036) 1.54*** (0.039)1880-1889 2.48*** (0.042) 1.34*** (0.024) 1.32*** (0.026)1890-1899 1.61*** (0.027) 1.26*** (0.022) 1.22*** (0.023)1900-1909 1.17*** (0.017) 0.92*** (0.014) 0.89*** (0.015)1910-1919 1.08*** (0.013) 1.09*** (0.014) 1.06*** (0.014) Rural or urban municipality (Urban = 1.00)Rural 0.88*** (0.003) 0.84*** (0.004) 0.76*** (0.004) Sectoral shares (Agriculture = 1.000)
Mining and peat extraction 1.003*** (0.000) 1.005*** (0.000)Construction 0.985*** (0.001) 0.997*** (0.001)Food, tobacco and beverages mnf. 0.948*** (0.001) 0.951*** (0.001)Textile and apparel mnf. 1.050*** (0.000) 1.048*** (0.000)Metal and machinery mnf. 1.001 (0.002) 0.974*** (0.002)Paper and chemical mnf. 1.005** (0.002) 1.007*** (0.002)Glass, pottery, misc. mnf. 1.025*** (0.001) 1.038*** (0.001)Transportation and public utilities 0.969*** (0.000) 0.967*** (0.001)Wholesale and retail trade 0.980*** (0.001) 0.974*** (0.001)Finance, insurance and real estate 0.967*** (0.003) 1.007* (0.004)Private services 1.052*** (0.000) 1.052*** (0.000)
Gross domestic product p. capita 0.70*** (0.026) 0.63*** (0.024) 0.68*** (0.028)Provincial dummies YES YES YESAge bride dummies NO NO YES
N 1,820,531 1,820,531 1,498,180Pseudo R2 0.160 0.183 0.196Notes: *** p<0.01, ** p<0.05, * p<0.1; Standard errors in parentheses; Pseudo R2 reports McFadden’s adjusted R2.
17

Table 3 confirms that, while controlling for the other variables, the occupational status
of the groom has a significant and negative impact in all three models on the likelihood of the
bride stating an occupation. The odds for white-collar employees are almost four times lower
than for the reference category (unskilled farm workers). Similarly, the province and age at
marriage variables show the same variation/trend as reported in Table 2a (see Appendix A).
The results for the rural dummy are contrary to those reported in the summary statistics,
however. All three regressions reveal that when the effects of the other variables are taken
into account, women in urban areas are actually significantly more likely to state an
occupation, not less likely as suggested in Table 2a.45
When the sectoral shares are introduced to model (2) three important observations
stand out. First, nearly all sectors have a significant and substantive impact on FLFP. Second,
the odds ratios are mostly in line with what could be expected on the basis of the correlations
in Table 2b.46 Third, the introduction of the sectoral shares in the last two models greatly
reduces the odds ratios for the decade dummies.
In both model (2) and (3), the odds ratios for the ‘Textile and apparel manufacturing’
and the ‘Private services’ are highest; a difference of just 1% in the share of employment for
any of these sectors explains a 5% increase in the odds. The odds for women living in the
municipality reporting the maximum share of employment in textiles (62.6%) would thus be
approximately 20 times greater than for a, otherwise identical, municipality with a zero per
cent share in textiles. The food, transport, and the wholesale and retail sectors show the lowest
odds in both model (2) and (3). A relatively high share of employment in these sectors would
mean a significantly lower FLFP. Contrary to the simple correlations in Table 2b, the odds
ratio for ‘Glass, pottery and miscellaneous manufacturing’ reveals that this sector had a
positive and significant effect on the likelihood of brides reporting an occupation.
45 This conclusion does not necessarily mean that FLFP rates were higher in urban regions. After all, the sectors that had a significantly negative effect on FLFP (such as ‘Transportation and public utilities’) were mostly concentrated in the cities. It does mean, however, that when accounting for all the variables, women in urban regions were more likely to list an occupation than we initially thought based on the summary statistics. The differences between urban and rural regions can be explained by the different types of local markets. Furthermore, the method I chose to identify urban and rural regions i.e. all municipalities with more than 5,000 are classified as urban and the rest as rural may have skewed the findings. Future research will have to provide more insight into the exact difference between the cities and the countryside.46 Note that the interpretation of the odds ratio listed for the sectoral shares differs slightly from those of the binary, categorical variables. The ratio listed represents the change in the odds that a bride will report an occupation given a 1% increase in the share of the respective sector. As before, a value greater than 1 indicates an increased likelihood; a value below 1 demonstrates a reduced likelihood. A 10% increase in the share of a given sector would thus transform the listed odds by a power of 10 (i.e. 1.0 510≈ 1.63).
18

The introduction of the sectoral shares in model (2) substantially lowers the odds
ratios for the decade dummies. Whereas in model (1) there is a large gap between the odds
reported for the earlier and the later decades, this difference more than halved in model (2) to
the point where the odds were only twice as high during the first four decades in our sample
than during the 1920s. Although there is still a significant decline in FLFP over time that
cannot be explained by any of the other variables in the regression, it is markedly less than
suggested by Van Poppel et al. 47, demonstrating the importance of economic structure.48
5. A decomposition of changing FLFP
The results from the regression have shown that both the structure of the (local) economy and
changing social norms affected FLFP. This does not answer the question, however, of what
was ultimately driving the sizable and prolonged decline of FLFP in the Netherlands. Below
this issue is tackled by decomposing FLFP in, among others, the contribution of the shifts in
the economic structure of the Dutch economy.
To illustrate this decomposition, consider the hypothetical two-period, two-sector
example in Table 4 below. At time 0, there are eight municipalities entirely devoted to the
production of agricultural goods, while in two municipalities all workers are engaged in
services.49 As the agricultural sector offers more opportunities for women’s work, FLFP in the
agricultural municipalities is higher than in the service-oriented municipalities. Total FLFP,
the average of the 10 municipalities’ FLFP in period 0, is 38%.
In the next period, 3 municipalities move away from agriculture and specialize in
services instead. At the same time, average FLFP in both sectors declines by 10%, for
instance as a result of women retreating from the labour force as a reaction to changing
attitudes towards female labour. In period 1, the overall FLFP is now 31.5: a reduction of a
little over 17% compared to the average of period 0.
Two forces are driving the decline in FLFP in the stylized example below. First, the
structural shift towards the services sector, offering fewer opportunities for women to work.
Second, the change in ‘social norms’, lowering FLFP equally in both agriculture and services.
To decompose these effects, we can calculate the counterfactual FLFP, reflecting a scenario in
47 van Poppel, van Dalen, and Walhout, 'Diffusion', p. 115.48 Keith Snell has reached similar conclusions in his research on women’s agricultural work in England in 1690-1860: Snell, 'Agricultural seasonal unemployment'.49 Note that the number of women residing in each hypothetical municipality is identical and doesn’t change over time.
19

which the structure of the economy remains unchanged over time. If we take period 0’s
sectoral shares and multiply by period 1’s FLFP, the total FLFP would have been 34.2%. The
difference with the observed FLFP in period 1, 2.7 percentage points, can be attributed to the
first factor, changes in sectoral shares. The residual change, 3.8 percentage points, reflects the
second factor, changing social norms.
Table 4. Stylized example of decomposition FLFPPeriod 0 Period 1
Muni. FLFP Muni. FLFPAgriculture 8 40.0 5 36.0Services 2 30.0 5 27.0
FLFP at sector shares of: Period 0 Period 1Period 0 38.0 34.2Period 1 31.5
Contribution from change in: ChangeSectoral shares -2.7Residual -3.8Total -6.5
This decomposition can also be applied to the evolution of FLFP in the Netherlands
during the period 1812-1929. To fully break down the decline in FLFP in its underlying
constituents, we need to take the change in all variables included in our model into account.
Partial indices, that include only a subset of the characteristics driving FLFP, can be
constructed for all variables in Table 3, with the exception of the period of marriage which is
captured by the residual. For example, the partial index for the shift in the share of
employment in the various economic sectors (i.e. sectoral shares), F s, is given below.
F ts0=ln
∑i
N t
Pr { y¿=1|s¿ , x¿ }
∑i
N t
Pr { y¿=1|s0 , x¿ }(2)
Equation (2), uses the coefficients from model (3) in Table 3 above to predict the
likelihood of women stating an occupation at time t under two scenarios. The numerator
represents the benchmark case, in which the sectoral shares (st) as well as all the other
independent variables (x t) are as observed in the marriage records for this period. The
denominator represents the counterfactual case, where the sectoral shares are set to the
20

average of the base period 0 (s0), while the other independent variables still reflect the
observed values at time t. By taking the log of the ratio of the benchmark and this
counterfactual case for all N brides in our sample at time t, the contribution of the shift in
sectoral shares to the change in FLFP between period 0 and t is obtained.
A notable drawback of the decomposition in equation (2), which closely resembles a
Paasche index, is that it is sensitive to the choice of base year. Generally, reliance on the
average sectoral shares from the earlier decades will undervalue the contribution of the
sectoral shifts to FLFP while choosing a later base will overvalue its impact. To contain this
potential bias, we adopt a chaining procedure, estimating the contribution for pairs of adjacent
decades based on the average sectoral shares for both the respective decades. Next, we sum
the contributions for all the pairs running from the first period to period t to obtain the change
in FLFP which is base invariant. Note that equation (3) is the equivalent of a chained Fisher
index.
F ts=∑
τ=1
t (ln ∑i
Nτ
Pr { y iτ=1|siτ , x iτ }
∑i
Nτ
Pr { yiτ=1|sτ−1 , x¿ }+ ln
∑i
Nτ−1
Pr { y iτ−1=1¿ sτ , x iτ−1 }
∑i
N τ −1
Pr { y iτ−1=1|s iτ−1 , x iτ−1 })/2 (3)
Table 5 below presents the results of the decomposition. The left column lists the
change in FLFP between 1812 and 1929 that can be contributed to the variables in the model.
For ease of interpretation, the right-most column shows the percentage share of the decline in
FLFP attributable to each respective independent variable.
Table 5. Contribution to the change in FLFP, 1812-1929
VariableContribution to growth (log %)
Percentage share
Sectoral shares -57 46Occupational status of groom -8 7Province 5 -4Rural/urban 1 -1Age bride -1 1GDP p. capita -24 20Residual -39 32Total -123 100NB: figures may not sum to total due to rounding.
21

The decomposition reveals that sectoral shifts in the Netherlands explain 46% of the
decline in FLFP over the entire period. The two other economic variables, the occupational
status of the groom and GDP per capita, represent another 27% of the change in FLFP. The
growth in household income – either directly, through an elevation of the husband’s
occupational status, or indirectly through the growth of the average GDP per capita – created
the circumstances that allowed women to relinquish their income and focus on the domestic
chores instead. Shifts in the share of brides living in cities – captured by the rural/urban
variable – as well as changes in their average age appear to have had a negligible effect on the
aggregate participation rates. The contribution of the changing distribution of marriages
across provinces is positive. This contribution could represent a shift in the overall population
towards provinces that offer more opportunities for work, or a potential bias over time in our
data source. In either case, the contribution of the provincial variable to the change in FLFP
was rather small (5 percentage points). The residual, or unexplained variation in FLFP over
time, encompasses a little over 30% of the decline in participation rates. This residual could
capture any relevant factor that is driving the shifts in demand for as well as the supply of
female labour that is not specifically included in the regression model. Still, arguably the most
important factor encompassed by the residual is the change in social norms.
The results in Table 5 suggest that the changing structure of the Dutch economy is the
most important driving force behind the decline of FLFP between 1812 and 1929. This is
corroborated by Figure 3 which provides a summary of the shifts in the structure of the
economy for the seven provinces in our sample. Here, the original 12 sectors are grouped into
three categories: those sectors that provided employment opportunities for women and thus
contributed positively to FLFP, those that did not provide employment opportunities and
contributed negatively to FLFP, and a reference category which did not affect FLFP.50 Over
the entire period, but particularly from 1860 onwards, the sectors that affected FLFP
negatively gained an ever greater share of employment in the municipalities in our sample,
particularly metal manufacturing and the transportation and trade services expanded their
share in the Dutch economy. At the same time, the sectors that did provide ample
opportunities for female labour were unable to retain their relative share. Both the textile
manufacturing and the private services, the sectors that could contribute most to FLFP,
declined in relation to the other sectors of the economy.
50 The categorisation is based on the odds ratios for the 12 sectors in model (3), as listed in Table 3. Sectors with an odds ratio significantly greater than 1 are assigned to the positive category. Sectors with odds significantly smaller than 1 are designated as negative. Agriculture, is assigned to the reference category by default.
22

Figure 3. Shifts in sectoral shares, 1812-1929
1820 1840 1860 1880 1900 192020
25
30
35
40
45
50
year
empl
oym
ent s
hare
(%)
referencepositivenegative
Notes: employment shares are based on 10-year moving averages. The reference category covers ‘Agriculture’; positive covers ‘Mining and peat extraction’, ’Textile and apparel mnf.’, ‘Paper and chemical mnf.’, ‘Glass, pottery, misc. mnf.’, ‘Finance, insurance and real estate’ and ’Private services’; negative covers ‘Construction’, ‘Food, tobacco and beverages mnf.’, ‘Metal and machinery mnf.’, ‘Transportation and public utilities’ and ‘Wholesale and retail trade’. The categorisation is based on the odds ratios for the 12 sectors in model (3).
6. Qualitative evidence from the 1890 labour surveys
This section provides qualitative support for our claim that local labour markets significantly
affected FLFP, and it briefly considers the relationship between the Dutch textile and peat
industries and FLFP. We choose to zoom in on these two industries because for a long period,
they offered ample employment opportunities for women. However, from the last decades of
the nineteenth century onwards, the peat industry started to shrink due to the increasing
competition of coal as fuel, while in the region of Twente (in the eastern provinces), the
textile industry continued to flourish. The labour surveys from 1890 form the main source for
this section. These surveys were carried out to investigate whether the labour law of 1889 was
23

lived up to.51 To this end, hundreds of people from all social classes and from all regions of
the country were interviewed about, among others, their work and incomes.52
The textile industry
Dutch industrialization took off in the textile industry in the eastern region of Twente from the
1830s onwards. By the end of the nineteenth century, the major part of the population in
Enschede, one of the largest textile cities in Twente, worked for one of the cotton enterprises.
To illustrate this: the number of labourers in the ‘Heek & co.’ cotton enterprise grew from 140
in 1860, to 1400 in 1896, and to over 2600 in 1909.53
The cotton industry relied heavily on the labour power of women and children. Since
most machines did not require much physical strength, their operation was highly suitable for
this relatively cheap labour force.54 Although new legislation from the 1870s onwards
increasingly restricted women’s and children’s (factory) labour, they remained ubiquitous in
the cotton factories throughout the nineteenth and early twentieth centuries.55 In the Oldenzaal
enterprise ‘Gelderman & zonen’, 30% of the total labour force consisted of adult women
during the first decades of the twentieth century.56
Most female factory labourers were unmarried. The share of married women’s factory
labour decreased during the nineteenth century, although they never completely disappeared
from the factories. Furthermore, textile producers outsourced several parts of the production
process, such as sewing sacks and bundling yarn, to home workers.57 This gave married
women the opportunity to work (part time) from their own homes while concurrently
fulfilling their homemaking tasks. Women’s earnings often were a substantial addition to the
household income. In Enschede, women could earn approximately f2,50-4 per week in the
home industry while a full-time employed male factory labourer earned approximately f10 per
week.58 Although the importance of the home industry decreased as industralization
51 This law limited women’s and children’s working days to eleven hours and prohibited their night- and Sunday labour. Furthermore, women were not allowed to work within four weeks after giving birth. 52 See Boter, 'Ideal versus reality?' for a more in-depth analysis of the nature of this source. 53 van Schelven, Ondernemingen en familisme, pp. 218-219.54 This was not necessarily true for every type of machinery and that occupational gender segregation was for an important part determined by British customs.55 The most important laws were the Child Labour Act (Kinderwetje van Van Houten) of 1874 and the Labour Law from 1889. See for instance: Schenkeveld, Het kinderwetje; van Drongelen, De ontwikkeling.56 Fischer, van Gerwen, and Winkelman, Bestemming semarang, p. 337.57 Arbeidsinspectie, Twente, p. 241.
24

expanded, it fulfilled part of the high demand for labour in these textile regions until at least
the first decades of the twentieth century.59
From the labour surveys it seems that attitudes towards this female presence in the
factories were mostly negative. Young women would not be able to learn how to clean and
cook in a factory and this would negatively affect their ability to manage their own future
households. Married women’s factory work was considered to be even worse, since their
children would be neglected, the house would be in chaos and this would, according to most
contemporary observers, inevitably drive their husbands into the nearest pub. Or, to use the
words of a cotton producer: “[w]hen a girl is raised properly, she will be better able to guide
her husband, to withhold him from extravagances like drinking, and to make sure he will be
home in time. [...]”.60 However, the fact that for many households the wife’s income was
indispensable, proved to be sufficient reason for many survey respondents to at least accept
the existence of female factory labour.
Due to the high number of female textile workers, average wages in the textile
industry remained low relative to other sectors until at least 1913.61 Women’s factory wages
were, as could be expected, lower compared to those of their male colleagues. In Enschede in
1890, male weavers earned about f10 weekly working on four weaving-looms while women
who operated the same number of looms earned about f6,50.62 In 1876, in the Nederlandse
Katoenspinnerij (Dutch Cotton Mill), male labourers earned between f6 and f13 and female
labourers between f5 and f8 per week. These differences can partially be explained by the fact
that labourers were paid piece-wages: in general women could not operate the same number
of machines as fast and effectively as their male coworkers could. However, for an important
part these differences were caused by gender wage discrimination.63
Although the gap between men’s and women’s wages was significant, financially
factory work was an attractive option for women. They could make more money in the
factories than they would working as a domestic servant.64 It has been argued that factory
girls’ relatively high wages empowered them in the relationship with their parents: when
58 Arbeidsinspectie, Verslag van de tweede afdeling; Arbeidsinspectie, Twente. NB: ‘f’ is the sign for guilders (the former Dutch currency).59 In my as of yet unpublished dissertation, I discuss the significance of women’s home industrial work for the total household income: Boter, Dutch divergence? (Unpublished thesis, Wageningen Univeristy, 2017).60 Arbeidsinspectie, Twente, p. 206.61 Vermaas, 'Real industrial wages', p. 144; Burnette, Gender, work and wages, p. 3.62 Arbeidsinspectie, Verslag van de tweede afdeling, pp. 6-14.63 de Groot, Fabricage van verschillen, p. 378.64 Janssens, Labouring lives, p. 91.
25

wages were high, they could save enough money in a short time period in order to marry at a
young age, enabling them to ‘break away’ from their parents to start their own household.65
Thus, ample employment opportunities with relatively high returns must have been an
important incentive for young women to choose factory work over life as a domestic servant
or life in unemployment.
The peat industry
The peat industry was another sector that offered employment opportunities to women. Peat is
decayed vegetation which has accumulated for over thousands of years. It is extracted from
the soil and dried, after which it can no longer absorb fluids making it useful as fuel or as
building material.66 In the northern provinces of Groningen, Drenthe, Friesland, and
Overijssel, people had been working on the peat lands since the seventeenth century. The peat
industry was especially important during the nineteenth century when the extraction rapidly
intensified.67 During the twentieth century, as mentioned before, production decreased due to
the growing competition of coal as fuel.
Annually, April to July were the most labour intensive months when apart from the
permanent labourers living on the peat soils, casual labourers from surrounding regions were
drawn there by the beneficial (seasonal) employment opportunities. The families that
permanently lived in the peat regions were hired as one unit, meaning that every household
member– with sufficient physical strength – was working. This was lucrative for the peat
producers as they normally provided fuel and shelter for their employees: providing this for
people who did not work was considered wasteful.
65 Janssens, Labouring lives, p. 248.66 Gerding, Vier eeuwen turfwinning, p. 23.67 Gerding, Vier eeuwen turfwinning, pp. 274-275.
26

Picture 1. Women stacking dried peat on barrows, circa 1910
Source: http://www.inenomassen.nl/drententewater.html.
There was a clear gender segregation in the peat industry. Men cut the peat from the
soil while women were in charge of the drying process.68 Women were also involved in
transporting the dried peat to the ships that distributed the product across the country (Picture
1). Thus, women formed, just like in the textile industry, a considerable part of the labour
force. In the 1890-survey a peat producer mentioned that: “[w]omen working along is the rule
rather than the exception. [...] Perhaps this is a questionable matter as her housekeeping will
not improve. However, if she is tough and swift, she will manage to hold everything
together.”69 Based on this source we can safely conclude that, if there was enough work,
women were active in the labour market.
In fact, in most households wives needed to work along in order to make ends meet.
Poverty in the peat regions was widespread and, as peat could not be reproduced, eventually
entire regions would become completely depleted. This development, together with the
increasing competition of coal as fuel, negatively affected FLFP. As a doctor from a peat
region where unemployment was a serious problem, mentioned in 1890: “[t]here is little work
and much unemployment. Consequently, women remain at home.”70 Furthermore, as
mentioned above, peat production was seasonal, which means that labourers needed to find
68 Gerding, Vier eeuwen turfwinning, p. 35.69 Arbeidsinspectie, Veenderijen, p. 18.70 Arbeidsinspectie, Veenderijen, p. 82.
27

other employment during the rest of the year. Some of them were lucky enough to find a
farmer to work for, but others lived in dire poverty entirely relying on poor relief.
Evidently, in the textile and peat regions, the ideal of a male breadwinner family was
not strong enough to truly alter social practice. People rather adapted to the economic
circumstances in their environment. Women in the textile regions responded to the demand
for cheap labour while the deteriorating working conditions in the peat regions caused
unemployment among women.
7. Conclusion
This article has argued that factors of demand have been crucial in determining the course of
women’s labour history. Existing studies on FLFP have primarily focused on the influence of
supply-side factors, most notably social norms. By including both factors of demand and
supply into one analytical framework, this research has provided a more comprehensive
understanding of Dutch unmarried women’s LFP during the long nineteenth century.
On the basis of nearly 2 million marriage records we ran a logistic regression,
accounting for the occupational status of the groom, the decade and province where the
marriage took place, the age of the bride, GDP per capita, and the characteristics of the local
labour market (proxied by sectoral shares). The results have shown that local economic
structures indeed influenced FLFP to a significant degree. Especially ‘textile and apparel
manufacturing’ and ‘private services’ had a positive effect on FLFP. Throughout the long
nineteenth century, a greater than average employment share for these sectors in a given
municipality coincided with an above average FLFP. A substantial part of the decreasing
FLFP that was previously explained by the decade dummy that captured (among others)
changing social norms, is actually the result of shifting sectoral shares. To further explore the
importance of local labour markets, FLFP has been decomposed based on the variables used
in the regression. The results have shown that sectoral shifts in the Dutch economy in the
period 1812 to 1929 can explain 46% of the decline in FLFP during this period. The residual
category, capturing the impact of changing social norms, explains 32% of this decline.
Sectoral shifts have explained a considerable part of the developments of FLFP within
the Netherlands, but may additionally explain the low Dutch FLFP rates relative to other
countries (Table 1). We have shown that the rapid expansion of the professional service sector
and the relatively small textiles, large agricultural, and well-developed transport, wholesale
28

and retail sectors are the most likely source of the decreasing FLFP during the long nineteenth
century. Countries with larger shares in sectors with ample demand for female labour most
probably had higher overall FLFP rates. In more general terms, this could mean that the slow
rate of Dutch industrialization, especially compared to England and Belgium, was driving the
diverging FLFP rates within western Europe during the long nineteenth century.
29

Appendices
The impact of economic structure and demand for labour on Dutch unmarried women’s labour force
participation during the long nineteenth century
Appendix A. Odds ratios for brides stating an occupation
Appendix B. Construction of the sectoral shares
Appendix C. Note on decomposition
30

Appendix A. odds ratios for brides stating an occupation (‘no occupation’ = 0)
(1) (2) (3)
Occupational status of groom (unskilled farm workers = 1.000)Upper class 0.166*** 0.156*** 0.183***
(0.00221) (0.00213) (0.00277)White-collar middle class 0.253*** 0.259*** 0.282***
(0.00175) (0.00188) (0.00235)Skilled workers 0.478*** 0.476*** 0.511***
(0.00278) (0.00291) (0.00359)Farmers 0.355*** 0.364*** 0.414***
(0.00217) (0.00227) (0.00290)Lower-skilled workers and farm workers 0.630*** 0.612*** 0.669***
(0.00379) (0.00391) (0.00486)Unskilled workers 0.786*** 0.822*** 0.884***
(0.00454) (0.00509) (0.00626) Period of marriage (1920-1929 = 1.000)1812-1819 4.467*** 1.510*** 1.662***
(0.183) (0.0637) (0.0776)1820-1829 5.165*** 1.759*** 1.961***
(0.183) (0.0645) (0.0796)1830-1839 5.268*** 1.992*** 2.207***
(0.168) (0.0658) (0.0808)1840-1849 4.807*** 1.821*** 1.994***
(0.144) (0.0568) (0.0687)1850-1859 4.297*** 1.861*** 1.892***
(0.118) (0.0531) (0.0597)1860-1869 3.456*** 1.491*** 1.458***
(0.0890) (0.0399) (0.0431)1870-1879 2.882*** 1.562*** 1.544***
(0.0633) (0.0356) (0.0389)1880-1889 2.484*** 1.336*** 1.317***
(0.0416) (0.0236) (0.0258)1890-1899 1.608*** 1.258*** 1.222***
(0.0269) (0.0217) (0.0232)1900-1909 1.168*** 0.919*** 0.890***
(0.0170) (0.0138) (0.0147)1910-1919 1.077*** 1.088*** 1.058***
(0.0132) (0.0135) (0.0144)
31

Rural municipality (Urban = 1.000) 0.877*** 0.835*** 0.764***
(0.00344) (0.00385) (0.00404) Sectoral shares (Agriculture = 1.000)
Mining and peat extraction 1.003*** 1.005***
(0.000460) (0.000467)
Construction 0.985*** 0.997***
(0.000813) (0.000891)
Food, tobacco and beverages mnf. 0.948*** 0.951***
(0.00104) (0.00109)
Textile and apparel mnf. 1.050*** 1.048***
(0.000440) (0.000451)
…continued
(1) (2) (3)
Sectoral shares continued…
Metal and machinery mnf. 1.001 0.974***
(0.00155) (0.00167)
Paper and chemical mnf. 1.005** 1.007***
(0.00218) (0.00226)
Glass, pottery, misc. mnf. 1.025*** 1.038***
(0.000863) (0.000956)
Transportation and public utilities 0.969*** 0.967***
(0.000441) (0.000525)
Wholesale and retail trade 0.980*** 0.974***
(0.000754) (0.000850)
Finance, insurance and real estate 0.967*** 1.007*
(0.00319) (0.00401)
Private services 1.052*** 1.052***
(0.000375) (0.000477) Province (Noord-Holland = 1.000)Drenthe 3.290*** 1.859*** 2.220***
(0.0258) (0.0186) (0.0245)Gelderland 1.783*** 0.935*** 0.990
(0.00958) (0.00745) (0.00901)
Groningen 2.245*** 1.607***
(0.0137) (0.0123)Limburg 2.814*** 1.147*** 1.245***
(0.0177) (0.0114) (0.0139)
32

Overijssel 2.611*** 1.693*** 1.907***
(0.0156) (0.0139) (0.0173)Zeeland 6.714*** 4.376*** 5.339***
(0.0466) (0.0391) (0.0530) Age of the bride (14-19 = 1.000)
20-24 1.309***
(0.0121)
25-29 1.589***
(0.0150)
30-34 1.817***
(0.0187)
35-39 2.009***
(0.0236)
40-44 2.124***
(0.0291)
45+ 1.844***
(0.0248) Gross domestic product p. capita 0.701*** 0.628*** 0.675***
(0.0263) (0.0239) (0.0283) Constant 1.453 4.287*** 1.587*
(0.335) (1.004) (0.410)
N 1,820,531 1,820,531 1,498,180Pseudo R2 0.160 0.183 0.196
*** p<0.01, ** p<0.05, * p<0.1; Standard errors in parentheses; Pseudo R2 reports McFadden’s
adjusted R2.
Appendix B. Construction of the sectoral shares
The construction of the employment shares for the 12 economic sectors in each of the 254
municipalities proceeds in three distinct steps. First, we determine the share of male
employment in 1899 for larger municipalities on the basis of the occupational census for that
year. Second, we estimate the sectoral shares for the remaining, smaller municipalities on the
basis of the occupational returns for men in the marriage records. Third, for each municipality
we estimate the change in the sectoral shares for years before and after 1899, again based on
the returns from the marriage records. Note that we estimate the average sectoral shares for 6
separate periods, each covering approximately 20 years. We do this in order to guarantee that
33

our estimates are supported by a sufficient number of observations for each municipality at
any given time.
The 1899 occupational census reports the number of men, women, and children
working in 33 separate industries for municipalities exceeding 5,000 inhabitants. This census
provides the basis for our estimation of the sectoral shares for the years 1890 to 1909. First,
we combine the male employment for all 33 industries into the 12 distinct sectors, correspond
to the major sectors of the Standard Industrial Classification (see Table 2b).71 Second, we
calculate the relative shares of employment for these 12 major sectors. As noted in the main
text, we base the sectoral shares solely on the employment figures for men, as they are less
concentrated in certain industrial branches and employment rates are higher. Therefore, we
feel the male labour force is more representative for a determination of the size of industry in
each municipality.
The municipalities that have less than 5,000 inhabitants are grouped together by
province in the 1899 census. To get individual estimates of the sectoral shares for these
smaller municipalities we turn to the marriage records instead. For each municipality, we
assign the occupations as reported between 1890 and 1909 by the grooms, the fathers of the
grooms and the fathers of the brides to each of our 12 sectors on the basis of a correspondence
table between the HISCO and SIC.72 We thus implicitly assume that not just the groom, but
also the father of the bride as well as the father of the groom reside within the municipality
where the marriage was recorded. A robustness check using only the occupation of the groom
reveals that the estimates for the sectoral shares are by-and-large insensitive to this
assumption. The inclusion of the fathers’ occupations in the estimation does increase the
observation count per municipality, however, which is particularly helpful for the smallest
municipalities that witnessed fewer marriages. We then compare the resulting average
sectoral shares for the groups of smaller municipalities per province to the shares derived
listed in the 1899 census. Although the differences are small, we normalize the shares
obtained from the marriage records to make them fully compatible with the estimates in the
census.
As a final step we look at the change in sectoral composition over time. For each
municipality, both large and small, we first estimate the average sectoral shares for all six
periods, solely on the basis of the marriage records, using the procedure described above. We
then determine the change in shares for each period with respect to the base period 1890-
71 For an overview of the SIC, see Ruggles et al., Integrated, variable ‘IND1950’.72 See Ruggles et al., Integrated, variables ‘OCCHISCO’ and ‘IND1950’.
34

1909. We extrapolate the shares we obtained from the occupational census for the base period
– either directly, as for the large municipalities, or indirectly for the smaller ones – on the
basis of these changes. Generally, the resulting shares will not sum to one for each
municipality in all the different periods. We solve this by again normalizing the shares.
Appendix C. Note on decomposition
To fully decompose the decline in FLFP in its underlying constituents, we need to take the
change in all variables included in our model into account. Partial indices, that include only a
subset of the characteristics driving FLFP, can be constructed for all variables in our
regression. This note will discuss first the basic notation behind this decomposition, second
the derivation of the decomposition itself and lastly the chaining procedure.
Basic notation
As noted in the main text, the decomposition builds on the results from our logistic regression.
In the regression we predict the probability that bride i, given her characteristics X i, will
report an occupation.
Pr {y i=1∨X i} (C.1)
The variable X comprises all independent variables in our regression model, so occupational
status of the groom (o), period of marriage (d), province (p), rural/urban (r), age at marriage
(a), sectoral shares (s) and GDP p. capita (g).
Pr {y i=1∨oi , d i , pi ,r i , ai , s i , gi } (C.2)
Note that equation (C.1) and (C.2) are identical, however (C.1) is generally easier to interpret.
When we fix one of the variables in the decomposition, however, we need a way to show this
explicitly. If, for instance, we want to estimate what would be the probability that bride i
states an occupation if we fix her age to the average age in our sample (a), we would use the
following notation:
Pr {y i=1∨a , x i } (C.3)
Note that the lower case x is used to denote the remaining independent variables in our model,
to distinguish it from the upper case notation (X ) used previously, which does include age.
Also note that all variables that include the subscript i are based on actually observed values
and are unique for each individual bride, while the variables that don’t include the subscript i
35

(i.e. age a in the example above) are based on fixed values which don’t change between
brides.
The equations above only estimate the probability for one bride. To obtain this
probability for all brides in the marriage records we take an average over all 1.8 million
brides. We use the variable N to denote the number of brides in our sample.
FLFP=∑
i
N
Pr {y i=1∨X i }
N(C.4)
The decomposition looks at the change in FLFP over time, so we include a time component
(t).
FLF Pt=∑
i
N t
Pr {y¿=1∨X ¿}
N t
(C.5)
As previously noted, in the decomposition we want to fix some of the variables to see how
this impacts FLFP. Equation (C.6) provides an example which estimates FLFP for decade t
when we the sectoral shares are fixed to the average for the base period 0 (i.e. s0).
FLF Pts0=
∑i
N t
Pr {y¿=1∨s0 , x¿}
N t
(C.6)
Two things to note here: first, we added a superscript s0 to FLFP to denote we fixed the
sectoral shares; second, we used the lowercase x again to show it excludes one of the
independent variables (s, which is shown separately).
Decomposition
To look at the effect of changes in the sectoral shares (s) we can, for instance, calculate how
FLFP would change between period 0 and 1 if we keep the sectoral shares fixed to the
average for period 0 (s0). The ratio between FLFP in period 1 and 0 is then given by:
F LF P1s0
FLF P0s0=∑
i
N 1
Pr { yi 1=1|s0 , x i 1 }/ N1
∑i
N0
Pr {y i 0=1|s0 , x i 0 }/ N0
(C.7)
Note that the denominator predicts the average probability that brides in decade 0 state
an occupation given that we fix the sectoral shares to the average for that same decade 0. It is
not unreasonable to assume that this prediction will be identical (or very close to) the FLFP
actually observed for decade 0. So instead of using the average sectoral shares for period 0
36

(i.e. s0) we use the actually observed sectoral shares for each bride instead (i.e. si 0). Analysis
of our data confirms that the results will indeed be nearly identical, regardless whether the
average for that period is used or the actually observed values. So we assume that:
∑i
N t
Pr { y¿=1|st , x¿ }/ N t=∑i
N t
Pr { y¿=1|s¿ , x¿}/ N t ∀ t (C.8)
If we substitute the right-hand part of (C.8) in (C.7) we obtain:
FLF P1s0
FLF P0=∑
i
N1
Pr { yi 1=1|s0 , xi 1 }/ N1
∑i
N 0
Pr { y i 0=1|si 0 , x i0 } /N0
(C.9)
To get the change or growth in FLFP (denoted by f), we take logs (ln).
f 1s0=ln
FLF P1s0
FLF P0= ln
∑i
N1
Pr { y i1=1|s0 , x i 1 }/ N 1
∑i
N0
Pr {y i 0=1|si 0 , x i 0 }/ N 0
(C.10)
Equation (C.10) gives us the expected growth of FLFP between period 1 and 0 if the sectoral
shares do not change. To get the effect of the change in the sectoral shares on FLFP we
should thus compare the growth in FLFP if we allow the sectoral shares to change ( f 1) to the
growth in FLFP if we do not allow them to change ( f 1s0). The difference between these growth
rates (i.e. F1s0) will give us the contribution of the (change in) sectoral shares.
F1s0=f 1−f 1
S0=ln( FLF P1
FLF P0 )−ln( FLF P1s0
FLF P0)=ln
∑i
N 1
Pr { yi 1=1|s i 1 , x i1 }
∑i
N1
Pr { yi 1=1|s0 , x i1 }(C.11)
Note that N drops out of the equation as it occurs simultaneously in both the numerator
and the denominator. Equation (C.11) gives us the contribution of the sectoral shares to the
growth in FLFP between period 1 and 0, where we fix the sectoral shares to the average
observed in period 0. A more general notation of the contribution to the growth between
period t and 0 is given below. Note that equation (C.12) is identical to equation (2) in the
main text.
37

F ts0=ln
∑i
N t
Pr { y¿=1|s¿ , x¿ }
∑i
N t
Pr { y¿=1|s0, x¿ }(C.12)
Base-years and chaining
As noted in the main text, the decomposition in (C.12) is sensitive to the choice of the base
year. Going back to the specific case of the decomposition of the growth of FLFP between
period 1 and 0, we opted to use the average sectoral shares for period 0. An equally valid
choice would be to use the average sectoral shares for period 1 in the decomposition.
f 1s1=ln
FLF P1
FLF P0s1=ln
∑i
N1
Pr { y i 1=1|si 1 , x i 1 }/ N1
∑i
N 0
Pr { y i 0=1|s1 , x i 0 }/ N0
(C.13)
The contribution of the sectoral shares to growth (F1s1) based on period 1’s average
shares is:
F1s1=ln
∑i
N0
Pr { y i 0=1|s1, x i 0 }
∑i
N0
Pr {y i 0=1|si 0, x i 0 }(C.14)
Or it’s general form:
F tst=ln
∑i
N0
Pr { y i0=1|st , x i 0 }
∑i
N0
Pr { yi 0=1|s i 0 , x i 0 }(C.15)
As noted in the main text, equations (C.12) represent a Paasche index, whereas (C.15)
represents a Laspeyres index. Unfortunately, the Paasche and the Laspeyres indices will often
yield a different answer. There is no theoretical rationale to prefer one over the other,
however. The general solution is to use the average of both the Paasche and Laspeyres index,
which yields a so-called Fisher index:
F ts0t=
F ts0+F t
st
2=( ln
∑i
N t
Pr { y¿=1|s¿ , x¿ }
∑i
N t
Pr { y¿=1|s0 , x¿ }+ ln
∑i
N0
Pr { y i 0=1|st , x i 0 }
∑i
N0
Pr { yi 0=1|s i 0 , x i 0 })/2 (C.16)
38

Equation (C.16) still fully relies on the sectoral shares of decades 0 and t, while
ignoring the shares of the intervening decades. A solution to this would be to construct a
chained index. Chaining links the estimates of the contribution for the change in sectoral
shares for all the pairs of adjacent decades based on the average sectoral shares for both the
respective decades. In other words, we separately estimate (C.16) for the growth of FLFP
between decades 0 and 1, 1 and 2, 2 and 3, all the way up to decade t, after which we sum
these contributions. This procedure ensures that all the average sectoral shares are used and
each is weighted equally. In effect it is no longer necessary to choose a base year at all, and
we are left with a single estimate of the contribution of the change in sectoral shares to the
growth in FLFP.
F ts=F t
s01+Fts12+F t
s23 …F tst −1 t (C.17)
Written in full, equation (C.17) gives us equation (3) from the main text.
F ts=∑
τ=1
t (ln ∑i
Nτ
Pr { y iτ=1|s iτ , x iτ }
∑i
Nτ
Pr { yiτ=1|sτ−1 , x¿ }+ ln
∑i
Nτ −1
Pr { y iτ−1=1¿ sτ , x iτ−1 }
∑i
N τ−1
Pr { y iτ−1=1|s iτ−1 , x iτ−1 })/2 (C.18)
References
Unpublished primary sources
International Institute of Social History
Dutch marriage records 1812-1929; database composed for the Historical Sample of
the Netherlands (HSN).
Primary sources
Arbeidsinspectie, Enquête, Gehouden door de Staatscommissie Benoemd Krachtens de Wet
van 10 Januari 1890 (Staatsblad No. 1) (Tweede Afdeeling). Twente. [Survey by the
Commission of the State, Appointed by Virtue of the Law of 10 January 1890 (Sheet 1)
(Second Department). Twente] (The Hague, 1890).
39

———, Enquête, Gehouden door de Staatscommissie Benoemd Krachtens de Wet van 10
Januari 1890 (Staatsblad No. 1) (Tweede Afdeeling). Veenderijen. [Survey by the
Commission of the State, Appointed by Virtue of the Law of 10 January 1890 (Sheet 1)
(Second Department). Veenderijen] (The Hague, 1890).
———, Verslag van de Tweede Afdeling der Staatscommissie van Arbeidsenquête [Report by
the Second Department of the State Commission of the Labour Survey] (The Hague,
1890).
Secondary literature
Atkinson, P., 'Isn't It Time You Were Finishing? Women's Labor Force Participation and
Childbearing in England, 1860-1920', Feminist Economics, 18 (2012), pp. 145-164.
van Bavel, J. and Kok, J., 'Social Control and the Intergenerational Transmission of Age at
Marriage in Rural Holland, 1850-1940', Population, 64 (2009), pp. 343-360.
Becker, G.S., 'A Theory of the Allocation of Time', The Economic Journal, 75 (1965), pp.
493-517.
Boonstra, O., Doorn, P.K., van Horik, M.P.M., van Maarseveen, J.G.S.J., and Oudhof, J.,
Twee Eeuwen Nederland Geteld: Onderzoek met de Digitale Volks-, Beroeps- en
Woningtellingen, 1795-2001 [Counting Two Centuries of the Netherlands: Research
with Digital Population-, Occupation-, and Housing Censuses 1795-2001] (Den Haag,
2007).
Boter, C., 'Ideal Versus Reality? The Domesticity Ideal and Household Labour Relations in
Dutch Industrializing Regions, Circa 1890', History of the Family, 22 (2016), pp. 82-
102.
Boter, C. Dutch Divergence? Women's Work, Structural Change, and Household Living
Standards in the Netherlands, 1830-1914 (Unpublished thesis, Wageningen
Univeristy, 2017).
Bourke, J., 'Housewifery in Working-Class England 1860-1914', Past & present, 143 (1994),
pp. 167-197.
Bras, H., 'Intensification of Family Relations?: Changes in the Choice of Marriage Witnesses
in the Netherlands, 1830-1950', Tijdschrift voor Sociale en Economische
Geschiedenis, 8 (2011), pp. 102-135.
40

Bras, H. and Kok, J., '“They Live in Indifference Together”: Marriage Mobility in Zeeland,
the Netherlands, 1796–1922', International Review of Social History, 50 (2005), pp.
247-274.
Burnette, J., Gender, Work and Wages in Industrial Revolution Britain (Cambridge, 2008).
Creighton, C., 'The Rise of the Male Breadwinner Family: A Reappraisal', Comparative
Studies in Society and History, 38 (1996), pp. 310-337.
van Drongelen, J., De Ontwikkeling van de Arbeidsinspectie in een Veranderende Wetgeving
[the Development of the Labour Inspection and Changing Legislation] (Zoetermeer,
1991).
Everard, M., 'Verandering en Continuïteit in de Arbeid van Vrouwen. Keetvrouwen en
Molendraaisters en het Huiselijkheidsideaal, 1750-1900 [Changes and Continuity in
Women's Labour. Women in the Salt Works and the Diamond Industry and the Cult of
Domesticity, 1750-1900]', Tijdschrift voor Sociale en Economische Geschiedenis, 2
(2005), pp. 81-102.
Fischer, E.J., van Gerwen, J.L.J.M., and Winkelman, H.J.M., Bestemming Semarang:
Geschiedenis van de Textielfabrikanten Gelderman in Oldenzaal 1817-1970
[Destination Semarang: The History of Textile Producers Gelderman in Oldenzaal
1817-1970] (Amsterdam, 1991).
Garrett, E.M., 'Was Women's Work Bad for Babies? A View from the 1911 Census of
England and Wales', Continuity and Change, 13 (1998), pp. 281-316.
Gerding, M.A.W., Vier Eeuwen Turfwinning: de Verveningen in Groningen, Friesland,
Drenthe en Overijssel tussen 1550 en 1950 [Four Centuries of Peat Extraction: The
Peat Extraction in Groningen, Friesland, Drenthe and Overijssel between 1550 and
1950] (Wageningen, 1995).
Goldin, C.D., The U-Shaped Female Labor Force Function in Economic Development and
Economic History, National Bureau of Economic Research Working Paper Series
4707 (Cambridge, Massachussetts, 1995).
———, 'The Quiet Revolution That Transformed Women's Employment, Education, and
Family', American Economic Review, 96 (2006), pp. 1-21.
Grantham, G., 'Occupational, Marital, and Life-Cycle Determinants of Women's Labor Force
Participation in Mid Nineteenth-Century Rural France', Feminist Economics, 18
(2012), pp. 97-119.
Griffiths, R., Industrial Retardation in the Netherlands 1830-1850 (The Hague, 1979).
41
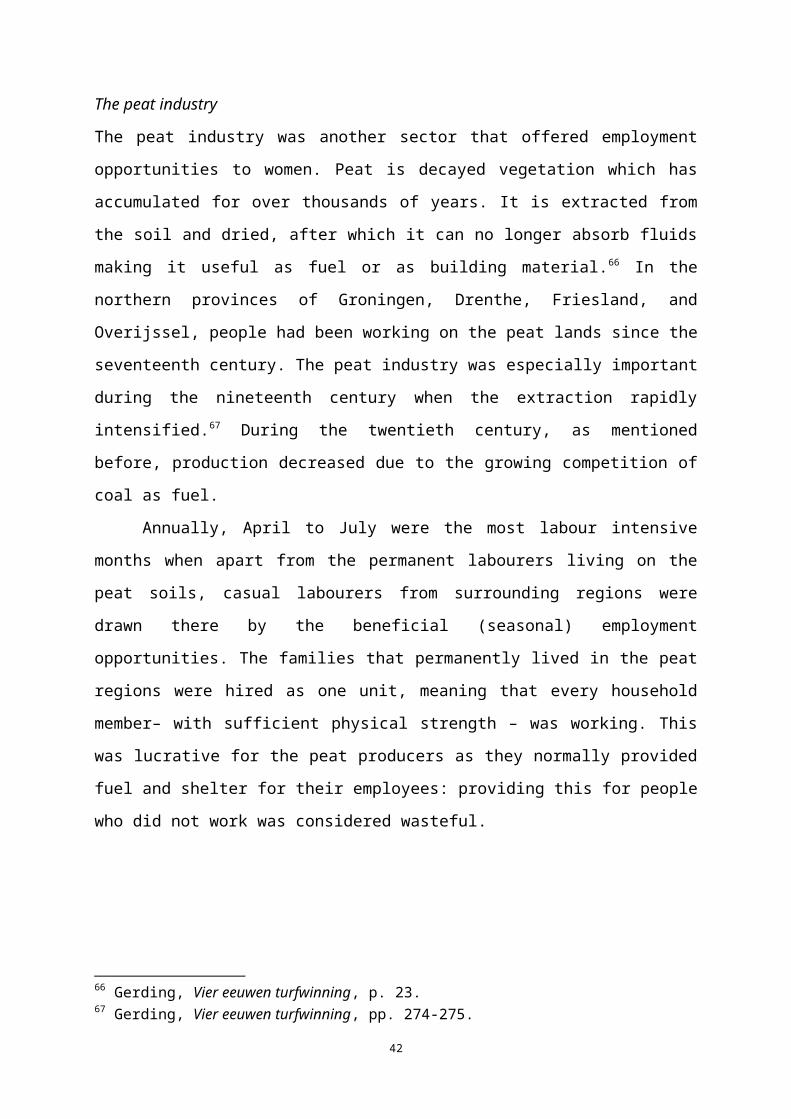
de Groot, G., Fabricage van Verschillen: Mannenwerk, Vrouwenwerk in de Nederlandse
Industrie (1850-1940) [Construction of Differences: Men's Work, Women's Work in
the Dutch Industrial Sector (1850-1940] (Amsterdam, 2001).
Hatton, T.J. and Bailey, R.E., 'Women's Work in Census and Surveys, 1911-1931', Economic
History Review, 54 (1999), pp. 87-107.
van den Heuvel, D., Women and Entrepreneurship: Female Traders in the Northern
Netherlands, C. 1580-1815 (Amsterdam, 2007).
Higgs, E., 'Women, Occupations and Work in the Nineteenth Century Censuses', History
Workshop, 23 (1987), pp. 59-80.
Hill, B., 'Women, Work and the Census: A Problem for Historians of Women', History
Workshop, 35 (1993), pp. 78-94.
Horlings, E. and Smits, J.-P., 'A Comparison of the Pattern of Growth and Structural Change
in the Netherlands and Belgium, 1800-1913', Economic History Yearbook, 38 (1997),
pp. 83-91.
Horrell, S. and Humphries, J., 'The Origins and Expansion of the Male Breadwinner Family:
The Case of Nineteenth-Century Britain', International Review of Social History, 42
(1997), pp. 25-64.
Humphries, J., 'The Lure of Aggregates and the Pitfalls of the Patriarchal Perspective: A
Critique of the High Wage Economy Interpretation of the British Industrial
Revolution', Economic History Review, 66 (2013), pp. 693-714.
Humphries, J. and Sarasua, C., 'Off the Record: Reconstructing Women's Labor Force
Participation in the European Past', Feminist Economics, 18 (2012), pp. 39-67.
Jansen, M., De Industriële Ontwikkeling in Nederland 1800-1850 [the Industrial Development
in the Netherlands 1800-1850] (Amsterdam, 1999).
Janssens, A., 'The Rise and Decline of the Male Breadwinner Family?: An Overview of the
Debate', International Review of Social History, 42 (1997), pp. 1-25.
———, Labouring Lives: Women, Work and the Demographic Transition in the Netherlands,
1880-1960 (Bern, 2014).
de Jonge, J., De Industrialisatie in Nederland tussen 1850 en 1914 [Industrialization in the
Netherlands between 1850 and 1914] (Nijmegen, 1976).
van Leeuwen, M. and Maas, I., 'Economische Specialisering en Veranderende Sociale
Verhoudingen in de 19e en 20e Eeuw: Een Studie op Basis van de Nederlandse
Volkstellingen en Huwelijksakten [Economic Specialization and Changing Social
Relations in the 19th and 20th Centuries: A Study Based on Dutch Population
42

Censuses and Marriage Records]', in O. Boonstra, P. K. Doorn, M. P. M. van Horik, J.
G. S. J. van Maarseveen and J. Oudhof eds., Twee Eeuwen Nederland Geteld.
Onderzoek met de Digitale Volks-, Beroeps- en Woningtellingen 1795-2011 (The
Hague, 2007), pp. 181-205.
———, HISCLASS. A Historical International Social Class Scheme (Leuven, 2011).
van Leeuwen, M., Maas, I., and Miles, A., 'Creating a Historical International Standard
Classification of Occupations an Exercise in Multinational Interdisciplinary
Cooperation', Historical Methods: A Journal of Quantitative and Interdisciplinary
History, 37 (2004), pp. 186-197.
van Leeuwen, M. and Zijdeman, R., 'Digital Humanities and the History of Working Women:
A Cascade', History of the Family, 19 (2014), pp. 411-425.
Matthijs, K., 'Mimetic Appetite for Marriage in Nineteenth-Century Flanders: Gender
Disadvantage as an Incentive for Social Change', Journal of Family History, 27
(2002), pp. 101-127.
Minoletti, P., 'The Importance of Ideology: The Shift to Factory Production and Its Effect on
Women's Employment Opportunities in the English Textile Industries, 1760-1850',
Continuity and Change, 28 (2013), pp. 121-146.
Mokyr, J., Industrialization in the Low Countries, 1795-1850 (New Haven, 1976).
———, 'The Industrial Revolution and the Netherlands: Why Did It Not Happen?', De
Economist, 148 (2000), pp. 503-520.
———, 'Why "More Work for Mother?" Knowledge and Household Behavior, 1870-1945',
Journal of Economic History, 60 (2000), pp. 1-41.
Muñoz Abeledo, L., 'Women in the Rural and Industrial Labor Force in Nineteenth-Century
Spain', Feminist Economics, 18 (2012), pp. 121-144.
van Nederveen Meerkerk, E., De Draad in Eigen Handen. Vrouwen en Loonarbeid in de
Nederlandse Textielnijverheid, 1581-1810 [Holding the Thread in Her Hands. Women
and Wage Labour in the Dutch Textile Industry, 1581-1810] (Amsterdam, 2007).
———, 'The First "Male Breadwinner Economy"? Dutch Married Women's and Children's
Paid and Unpaid Work in Western European Perspective, C. 1600-1900', in L.
Lucassen and M. v. d. Linden eds., Working on Labor. Essays in Honor of Jan
Lucassen (Leiden, 2012), pp. 323-352.
van Nederveen Meerkerk, E. and Paping, R., 'Beyond the Census. Reconstructing Dutch
Women's Labour Market Participation in Agriculture in the Netherlands, Ca. 1830-
1910', History of the Family, 19 (2014), pp. 447-468.
43

van Poppel, F., van Dalen, H.P., and Walhout, E., 'Diffusion of a Social Norm: Tracing the
Emergence of the Housewife in the Netherlands, 1812-1922', Economic History
Review, 62 (2009), pp. 99-127.
van Poppel, F. and Nelissen, J., 'The Proper Age to Marry: Social Norms and Behavior in
Nineteenth-Century Netherlands', History of the Family, 4 (1999), pp. 51-75.
Pott-Buter, H., Facts and Fairy Tales About Female Labor, Family, and Fertility: A Seven-
Country Comparison, 1850-1990 (Amsterdam, 1993).
Ruggles, G., Genadek, K., Goeken, R., Grover, J., and Sobek, M., Integrated Public Use
Microdata Series: Version 6.0 (Minneapolis, 2015).
van Schelven, A.L., Onderneming en Familisme: Opkomst, Bloei en Neergang van de
Textielonderneming Van Heek & Co te Enschede [Enterprise and Familialism: The
Rise, Prosperity and Downfall of the Textile Enterprise Van Heek & Co in Enschede]
(Leiden, 1984).
Schenkeveld, W., Het Kinderwetje van Van Houten [the Child Labour Act of Van Houten]
(Hilversum, 2003).
Schmidt, A., 'Women and Guilds: Corporations and Female Labour Market Participation in
Early Modern Holland', Gender & History, 21 (2009), pp. 170-189.
———, 'Labour Ideologies and Women in the Northern Netherlands, C. 1500-1800',
International Review of Social History, 56 (2011), pp. 45-67.
Schmidt, A. and van Nederveen Meerkerk, E., 'Reconsidering the “First Male-Breadwinner
Economy”: Women’s Labor Force Participation in the Netherlands, 1600-1900',
Feminist Economics, 18 (2012), pp. 69-96.
Schuurman, A., 'Is Huiselijkheid Typisch Nederlands? Over Huiselijkheid en Modernisering
[Is Domesticity Typically Dutch? About Domesticity and Modernization]', BMGN,
107 (1992), pp. 745-759.
Smits, J.P. and Horlings, E., Dutch GNP and Its Components, 1800-1913 (Groningen, 1999).
Snell, K.D.M., 'Agricultural Seasonal Unemployment, the Standard of Living, and Women's
Work in the South and East, 1690-1860', Economic History Review, 34 (1981), pp.
407-437.
van Sonsbeek, J.L.A., Van de Schaduw des Doods tot een Licht ten Leven: de Historie van de
Methodiek van de Doodsoorzakenstatistiek in Nederland, 1865-2005 [from the
Shadow of Death to the Light of Life: The History of the Registration of Causes of
Death in the Netherlands, 1865-2005] (Voorburg, 2005).
44

Verdon, N., 'The Rural Labour Market in the Early Nineteenth Century: Womens's and
Children's Employment, Family Income and the 1834 Poor Law Report', Economic
History Review, 55 (2002), pp. 219-248.
Vermaas, A., 'Real Industrial Wages in the Netherlands, 1850-1913', in P. Scholliers and V.
Zamagni eds., Labour's Reward: Real Wages and Economic Change in 19th- and
20th-Century Europe (Aldershot, 1995).
de Vries, J., 'The Industrial Revolution and the Industrious Revolution', Journal of Economic
History, 54 (1994), pp. 249-270.
———, The Industrious Revolution: Consumer Behavior and the Household Economy, 1650
to the Present (Cambridge, 2008).
de Vries, J. and van der Woude, A., The First Modern Economy: Success, Failure, and
Perseverance of the Dutch Economy, 1500-1815 (Cambridge, 1997).
Walhout, E. and van Poppel, F.W.A., ''De Vermelding des Beroeps: Eene Ijdele Formaliteit?'
Twee Eeuwen Vrouwelijke Beroepen in Nederlandse Huwelijksakten ['Reporting an
Occupation: A Presumptuous Formality?' Two Centuries of Female Professions in the
Dutch Marriage Records]', Tijdschrift voor Sociale Geschiedenis, 29 (2003), pp. 301-
332.
Online sources
Centraal Bureau voor de Statistiek. Census 1899. In,
http://volkstellingen.nl/nl/volkstelling/jaarview/1899/index.html. (accessed December,
2016).
Maddison, A. 2010. Statistics on World Population, GDP and Per Capita GDP, 1-2008 Ad. In
Historical Statistics of the World Economy: 1-2008 AD,
https://knoema.com/HSWE/historical-statistics-of-the-world-economy-1-2008-ad.
(accessed September 2015.
45