Embed Size (px)
Citation preview
UNIVERSITY OF LJUBLJANA
FACULTY OF ECONOMICS
FRANCI PORENTA
THE IMPACT OF CORPORATE POWER ON CONSUMPTION, DEBT
AND INEQUALITY
DOCTORAL DISSERTATION
Ljubljana, 2018

AUTHORSHIP STATEMENT
The undersigned Franci Porenta, a student at the University of Ljubljana, Faculty of Economics (hereafter: FELU),
author of this doctoral dissertation with the title The impact of corporate power on consumption, debt and inequality,
prepared under supervision of prof. dr. Tjaša Redek
DECLARE
1. this doctoral dissertation to be based on the results of my own research;
2. the printed form of this doctoral dissertation to be identical to its electronic form;
3. the text of this doctoral dissertation to be language-edited and technically in adherence with the FELU’s
Technical Guidelines for Written Works, which means that I cited and / or quoted works and opinions of other
authors in this doctoral dissertation in accordance with the FELU’s Technical Guidelines for Written Works;
4. to be aware of the fact that plagiarism (in written or graphical form) is a criminal offence and can be prosecuted
in accordance with the Criminal Code of the Republic of Slovenia;
5. to be aware of the consequences a proven plagiarism charge based on this doctoral dissertation could have for
my status at the FELU in accordance with the relevant FELU Rules;
6. to have obtained all the necessary permissions to use the data and works of other authors which are (in written
or graphical form) referred to in this doctoral dissertation and to have clearly marked them;
7. to have acted in accordance with ethical principles during the preparation of this doctoral dissertation and to
have, where necessary, obtained permission of the Ethics Committee;
8. my consent to use the electronic form of this doctoral dissertation for the detection of content similarity with
other written works, using similarity detection software that is connected with the FELU Study Information
System;
9. to transfer to the University of Ljubljana free of charge, non-exclusively, geographically and time-wise
unlimited the right of saving this doctoral dissertation in the electronic form, the right of its reproduction, as
well as the right of making this doctoral dissertation publicly available on the World Wide Web via the
Repository of the University of Ljubljana;
10. to have acquired from publishers, to whom I have previously exclusively transferred material copyrights for
articles, all the necessary permissions for the inclusion of articles in the printed and electronic forms of this
dissertation. These permissions enable the University of Ljubljana to save this doctoral dissertation in the
electronic form, to reproduce it, as well as to make it publicly available on the World Wide Web via the
Repository of the University of Ljubljana free of charge, non-exclusively, geographically and time-wise
unlimited;
11. my consent to publication of my personal data that are included in this doctoral dissertation and in this
declaration, when this doctoral dissertation is published.
Ljubljana, 30.11.2018 Author’s signature:

VPLIV KORPORATIVNE MOČI NA POTROŠNJO, DOLG IN NEENAKOST
POVZETEK
Namen te disertacije je empirično ovrednotiti vpliv korporativne moči na potrošnjo, dolg in
neenakost, na povprečju držav OECD in podatkov za ZDA. CCC model oziroma model
kumulativne in krožne vzročnosti, opisuje družbeno-gospodarsko dinamiko z vrsto
medsebojno povezanih vzročnosti, ki tvorijo neravnotežno spiralo. Model proučuje razmerja
med štirimi sistemskimi komponentami, v naslednjem zaporedju: korporativna moč,
potrošnja, dolg in neenakost. Korporativne družbe, ki se opirajo na svojo korporativno moč,
so spodbudile naraščajoče potrošništvo, kar je povečalo zasebno potrošnjo in dolg. Po drugi
strani je povečevanje dolga okrepilo proces naraščajoče dohodkovne neenakosti zaradi
pomanjkanja sredstev za naložbe v izobraževanje ali ustvarjanje prihrankov. Naraščajoča
neenakost je nadalje povečala pogajalsko moč kapitala in zaprla CCC model.
Cilj raziskave je izdelati nov empirični model, ki preučuje odnose med korporativno močjo,
potrošnjo, dolgom in neenakostjo. Disertacija je zasnovana kot zbirka štirih člankov; tesno
in logično povezanih raziskovalnih dokumentov. Prinaša več izvirnih prispevkov na
področju znanosti; gradi celovit model, ki pojasnjuje vpliv korporativne moči na
gospodarsko učinkovitost, empirično proučuje veljavnost CCC modela na podatkih OECD
in ZDA ter ponuja nekatere implikacije politik.
Prvi članek določa teoretični okvir z analizo dohodkovne neenakosti, potrošnje, dolga in
korporacij ter njihove korporativne moči. Predstavlja politično-ekonomski model, ki ga je
naredil Porenta (2014). Pri analizi zapletene dinamike gospodarstev, politično-ekonomski
model uporablja celovit pristop z opisno analizo in vzročno zvezo, ki z ekonomsko analizo
združuje darvinistična evolucijska načela, antropologijo, psihologijo in sociologijo. Pokaže,
da korporacije želijo izkoristiti enega najmočnejših človeških instinktov, to je reprodukcije,
in izkazovanja družbenega statusa. S predstavitvijo politično-ekonomskega modela, ki
temelji na logičnem opazovanju, vzrokih in posledicah, pa tudi empiričnih podatkih, lahko
opazimo, da obstaja jasen vidik kumulativne in krožne vzročnosti glavnih ugotovljenih
spremenljivk. Rastoča korporativna moč vodi v potrošnjo, temelječi na bahavi potrošnji in
potrošništvu, naraščajočem dolgu in dohodkovni neenakosti.
Drugi članek postavlja empirični teoretični okvir. Gradi nov empirični model za empirično
preizkušanje politično-ekonomskega modela in povezav med CCC spremenljivkami.
Analizi obstoječih delnih enačb glavnih spremenljivk sistema, sledi gradnja novih modelnih
delnih enačb, skupaj z novo spremenljivko korporativne moči. Temu sledi sinteza modelnih
delnih enačb v nov ekonomski model, ki ga lahko ekonometrično testiramo. Ker obstoji
kumulativna in krožna vzročnost glavnih sistemskih spremenljivk, to pomeni, da so odvisne
spremenljivke v naslednji enačbi v nizu, tudi neodvisne spremenljivke. Ta ekonomski CCC
model ima štiri glavne sistemske spremenljivke in zato tvori sistem simultanih enačb, kar
ustvari nerekurzivni model.

Tretji članek empirično ocenjuje veljavnost predlaganega CCC modela, na povprečju OECD
držav. Pokaže, da se je v OECD gospodarstvih povečala korporativna moč in da je finančna
liberalizacija spodbudila ta proces. Povečana korporativna moč pozitivno vpliva na osebno
porabo, kar je v skladu z naraščajočimi prikazi bahave potrošnje, temelječi na korporativni
moči (trženje in ustvarjanje želja). Poleg tega dokazuje, da se je zadolževanje povečevalo,
kar je znova podprlo naraščajočo moč korporacij in kapitala. Povečuje se neenakost, kar
dodatno zmanjšuje pogajalsko moč delavcev, to je potrošnikov. Spirala se nadaljuje v korist
kapitala. Na splošno je v OECD, v obdobju raziskave, krog CCC potrjen.
Četrti članek empirično ocenjuje veljavnost predlaganega CCC modela, na ZDA podatkih.
Opazimo lahko, da vse glavne sistemske spremenljivke naraščajo v analiziranem obdobju.
Naraščajoča korporativna moč vodi v povečano potrošnjo, kar povzroča naraščajoči dolg
gospodinjstev, slednje pa vodi v povečevanje neenakosti. Prav tako lahko opazimo, da je
dinamika v ZDA vodila v močno koncentracijo virov dohodka v rokah najvišjih odstotkov
porazdelitve dohodka in k spremembam v distribuciji dohodka, ki zgolj povečujejo
naraščajočo korporativno moč. Korporacije v ZDA vlagajo ogromne vire v oglaševanje, zato
spodbujajo potrošniško družbo in na dolgu temelječo potrošnjo.
Poglavje razprava, obravnava glavne ugotovitve dveh CCC modelov. Rezultati v obeh
modelih podpirajo vidik kumulativne in krožne vzročnosti glavnih modelskih spremenljivk.
Pri primerjavi obeh modelov lahko opazimo, da je dinamika gibanja glavnih spremenljivk v
ZDA bolj intenzivna kot v OECD. Vse glavne ZDA spremenljivke so nad povprečjem držav
OECD. Rast korporativne moči v ZDA je presegla rast korporativne moči v OECD modelu.
Delež potrošnje v BDP je v ZDA precej nad povprečjem držav OECD. Enako je dolg
gospodinjstev v ZDA in dohodkovna neenakost v ZDA. Te empirične ugotovitve so v skladu
s procesom kumulativne in krožne vzročnosti, to je CCC modela. V CCC modelu za ZDA
je povečanje korporativne moči večje od tistega v OECD modelu, s čimer je povzročena
večja rast vseh glavnih sistemskih spremenljivk.
Nazadnje, sklep povzame glavne ugotovitve disertacije, prispevke k literaturi, pa tudi
nekatere implikacije politik.
Ključne besede: korporativna moč, potrošnja, dolg, kumulativna in krožna vzročnost,
neenakost.
THE IMPACT OF CORPORATE POWER ON CONSUMPTION, DEBT AND
INEQUALITY
SUMMARY
The purpose of this dissertation is to empirically evaluate the impact of corporate power on
consumption, debt and inequality using OECD and US data. The CCC model, i.e. the model
of cumulative and circular causation, describes the socio-economic dynamics with a series
of interrelated causations that form a non-equilibrium spiral. The model studies the
relationships between the four system components or building blocks in the following
sequence: corporate power, consumption, debt, and inequality. Relying on their corporate
power, corporations have stimulated a rise in consumerism, which has increased both private
consumption and debt. On the other hand, increasing debt has intensified the process of
rising inequality due to the lack of funding to invest in education or create savings. Rising
inequality has further increased the bargaining power of capital and closed the CCC model.
The goal of the research is to build a new empirical model examining the relationships
between corporate power, consumption, debt and inequality. The dissertation is designed as
a collection of four articles. It makes several original contributions to the field of knowledge:
it builds a comprehensive model that explains the impact of corporate power on
consumption, debt and inequality; it empirically examines the validity of the CCC model
when applied to OECD and US data; and it provides some policy implications.
The first article establishes the theoretical framework with the analysis of income inequality,
consumption, debt, and corporations and their corporate power. It presents the political-
economic model done by Porenta (2014). When analysing the complex dynamics of
economies, the political-economic model uses a holistic approach with descriptive analysis
and causal inference, combining Darwinian evolutionary principles, anthropology,
psychology and sociology with an economic analysis. It shows that corporations are keen to
exploit one of the most powerful human instincts—the reproduction and the display of social
status. We can observe that there is a clear notion of a cumulative and circular causation of
the main identified variables. Growing corporate power is leading to consumption, driven
by conspicuous consumption and consumerism, to rising debt and income inequality.
The second article establishes the empirical theoretical framework. It builds a new empirical
model to empirically test the political-economic model and the relationships between the
CCC variables. The analysis of the main system variables, i.e. corporate power,
consumption, debt and inequality, is followed with the construction of the new model partial
equations, along with the new variable of corporate power. This is followed with a synthesis
of model partial equations into a new economic model, which can be econometrically tested.
Since there is a cumulative and circular causation of the main system variables, that means
that dependent variables are also independent variables in the next equation in the sequence.
This economic model of CCC has four main system variables and therefore forms a system
of simultaneous equations, which results in a non-recursive model.
The third article empirically evaluates the validity of the proposed CCC model when applied
to the average of OECD countries. It shows that in the OECD economies, corporate power
has increased and financial liberalization has stimulated this process. Increased corporate
power is positively influencing personal consumption, which is in line with the increasing
claims of conspicuous consumption, driven by corporate power (marketing and creation of
wants). Furthermore, it provides evidence that the indebtedness has been increasing, again
supporting the growing power of corporations and capital. Inequality is shown to have
increase, which has further diminished the bargaining power of workers, i.e. consumers. The
spiral continues in favour of capital. Overall, in the OECD in the period under investigation,
the CCC circle is confirmed.
The fourth article empirically evaluates the validity of the proposed CCC model when
applied to US data. We can observe that all main system variables have risen in the analysed
period. Rising corporate power has led to increased consumption, which has resulted in
growing household debt, and the latter has further led to increasing inequality. We can also
observe that the dynamics in the US have led to the immense concentration of income
sources in the hands of the top per cents of the income distribution and towards income
distribution changes that only reinforce the increasing corporate power. Corporations in the
US are investing vast resources into advertising, therefore fostering a consumerist society
and debt driven consumption.
The next chapter, the discussion, discusses the main findings of two CCC models. The results
in both models support the notion of CCC of the main identified variables. When comparing
both models, we can observe that the dynamic of the movement of the main variables is more
intense in the US than in the OECD countries. All main US variables are above the average
of the OECD ones. The rise of US corporate power outpaced the rise of corporate power in
the OECD model. The consumption share in GDP in the US is well above the average of the
OECD. The same is true for the US household debt and US income inequality. These
empirical findings are consistent with the process of cumulative and circular causation, i.e.
the CCC model. In the US CCC model the corporate power increase seems to be larger than
the one in the OECD model, therefore generating larger increase in all main system variables.
Finally, the conclusion summarizes the main findings of the dissertation, contribution to the
literature, as well as some policy implications.
Keywords: corporate power, consumption, debt, cumulative circular causation, inequality.
i
TABLE OF CONTENTS
INTRODUCTION ............................................................................................................... 1
1 POLITICAL-ECONOMIC MODEL OF CUMULATIVE AND CIRCULAR
CAUSATION ................................................................................................................. 7
1.1 Introduction ........................................................................................................... 8
1.2 Political-economic model of CCC ...................................................................... 10
1.2.1 Elements of the process of circular causation (CC) ...................................... 10
1.2.1.1 Corporate power ..................................................................................... 11
1.2.1.2 Consumption .......................................................................................... 17
1.2.1.3 Debt ........................................................................................................ 20
1.2.1.4 Inequality ................................................................................................ 21
1.2.2 The process of cumulative and circular causation ......................................... 24
1.3 Conclusion ........................................................................................................... 26
2 THEORETICAL SETUP OF EMPIRICAL MODEL OF CUMULATIVE AND
CIRCULAR CAUSATION ......................................................................................... 29
2.1 Introduction ......................................................................................................... 30
2.2 Theoretical setup of empirical model ................................................................ 30
2.2.1 Analysis of the existing models for corporate power .................................... 31
2.2.2 Estimation model for corporate power .......................................................... 36
2.2.3 Analysis of the existing models for consumption ......................................... 37
2.2.4 Estimation model for consumption................................................................ 45
2.2.5 Analysis of the existing models for household debt ...................................... 46
2.2.6 Estimation model for household debt ............................................................ 52
2.2.7 Analysis of the existing models for inequality .............................................. 53
2.2.8 Estimation model for inequality .................................................................... 60
2.3 Economic model of CCC .................................................................................... 61
2.3.1 Discussion ...................................................................................................... 62
ii
2.4 Conclusion ........................................................................................................... 63
3 EMPIRICS OF CUMULATIVE AND CIRCULAR CAUSATION MODEL:
OECD ........................................................................................................................... 65
3.1 Introduction ........................................................................................................ 66
3.2 Theoretical background: the OECD CCC model ............................................ 67
3.2.1 Corporate power ............................................................................................ 67
3.2.2 Consumption ................................................................................................. 70
3.2.3 Debt ............................................................................................................... 72
3.2.4 Inequality ....................................................................................................... 74
3.3 Data and methodology........................................................................................ 76
3.3.1 Econometric technique .................................................................................. 76
3.3.2 Data ............................................................................................................... 78
3.4 Results .................................................................................................................. 80
3.4.1 Descriptive statistics ...................................................................................... 80
3.4.2 Regression results .......................................................................................... 83
3.5 Discussion and conclusion .................................................................................. 85
4 EMPIRICS OF CUMULATIVE AND CIRCULAR CAUSATION MODEL:
US ........................................................................................................................... 91
4.1 Introduction ........................................................................................................ 92
4.2 Theoretical background: the US CCC model .................................................. 92
4.2.1 Corporate power ............................................................................................ 93
4.2.2 Consumption ................................................................................................. 96
4.2.3 Debt ............................................................................................................. 100
4.2.4 Inequality ..................................................................................................... 102
4.3 Data and methodology...................................................................................... 106
4.3.1 Data ............................................................................................................. 106
4.3.2 Methodology ............................................................................................... 107
iii
4.4 Results ................................................................................................................ 109
4.4.1 Descriptive statistics .................................................................................... 109
4.4.2 Regression results ........................................................................................ 111
4.5 Discussion and conclusion ................................................................................ 114
5 DISCUSSION ............................................................................................................. 119
5.1 Comparative analysis of CCC models and research questions .................... 119
5.2 Policy implications and research limitations .................................................. 128
5.3 Contribution to the literature .......................................................................... 132
CONCLUSION ................................................................................................................ 135
REFERENCES ................................................................................................................ 138
APPENDIX ...................................................................................................................... 150
LIST OF TABLES
Table 1: The main model variables in OECD (1990-2013) ................................................ 79
Table 2: Descriptive statistics for the variables in OECD (1990-2013) .............................. 81
Table 3: Estimation results for the variables in OECD (1990-2013) .................................. 83
Table 4: The main model variables in the US (1973-2005) .............................................. 106
Table 5: Descriptive statistics for the variables in the US (1973-2005) ............................ 110
Table 6: Estimation results for the variables in the US (1973-2005) ................................ 112
iv
LIST OF FIGURES
Figure 1: The process of cumulative and circular causation (CCC) ................................... 24
Figure 2: Descriptive statistics for the main model variables in OECD (1990-2013) ........ 82
Figure 3: Descriptive statistics for the main model variables in the US (1973-2005) ...... 111
Figure 4: Household final consumption expenditure and net household saving,
percentage of households’ net disposable income in the US (1973-2005) ....... 115
Figure 5: Growth of Median Household Income and GDP in the US (1973–2005) ......... 116
Figure 6: Income share in the US (1973–2005) ................................................................ 117
Figure 7: Household final consumption expenditure as percentage of GDP in the US
and OECD (1973-2012) .................................................................................... 121
Figure 8: Bottom 90 per cent of income share in the US and OECD (1973-2012) .......... 123
Figure 9: Household debt in the US and OECD (1980-2010) .......................................... 123
Figure 10: Inequality in the US and OECD (1985-2012) ................................................. 125
Figure 11: Trade Union density in the US and OECD (1973-2012) ................................. 126
Figure 12: Growth of corporate indicators in the US and OECD (1990-2005) ................ 127
1
INTRODUCTION
Corporate power of corporations, along with the social restructuring of labour markets, has
been rising since the mid-1970s. This has resulted in a steady increase of income inequality
in the US and OECD. Social restructuring of labour markets is a consequence of the surge
in bargaining power of corporations that has resulted in income distribution changes.
Workers’ bargaining power, on the other hand, has diminished, and in US, the union density
is below the OECD average. Rising corporate power is further investing vast resources into
advertising and the stimulation of consumption. This process is not just a response to
consumers’ needs, but rather a creation of wants that are not organic. This inevitably results
in the oversupply of private goods that are not really needed and the underproviding of public
goods, such as education, infrastructure and health care. Due to the decreasing bottom 90
per cent of income share, such imposed consumption, i.e. social norm ‘keeping up with the
Joneses’, results in indebted households and debt driven demand. With a historically high
70 per cent of consumption share in the US GDP, the system dynamics endangers the
sustainability and prosperity of the economy.
Do the global corporations in the interest of capital really cause global impoverishment of
people? According to Piketty (2014), over a long period the profit rate was higher than the
economic growth rate. This implies that increasing inequality is a direct result of this process,
causing the capital owners to further increase their wealth, influence and bargaining power
in the distribution of income. This results in an upward spiral, which further increases their
dominance. The increasing dominance of capital leads to several other undesirable
consequences in addition to increasing inequality. First, capital stimulates consumerist
behaviour to secure increasing demand. Increased personal consumption skews the income
distribution between consumption and savings (and investment into education, etc.), and
causes increasing indebtedness. The latter is again supported by capital through the interest
of the financial services’ sector. The government itself could reverse this process, but it is
itself a victim of the process of increasing indebtedness and rising corporate power.
Therefore, it has a limited ability to influence the direction of capitalist development. The
increase in corporate power alongside limited household and state power hence leads to a
cumulative and circular causation (CCC), where rising inequality and limited state power
are only enhanced.
Is growing corporate power leading to consumption driven by conspicuous consumption and
consumerism, rising public and household debt, and income inequality? There are several
empirical facts about the increase in income inequality in the past 40 years (OECD, 2011,
2015), rising public and household debt (Cecchetti, Mohanty, & Zampolli, 2011; OECD,
2015), increased consumption (OECD, 2015) and surging corporate power (UNCTAD,
2007), but only a few studies examine the causations between those variables. Empirical
2
studies have shown that there has been a long period of flat or stagnant wages (Mishel &
Shierholz, 2013), which only reinforces income inequality. Inequality is further increasing
due to a decrease in taxes (Fieldhouse, 2013) and there has been a strong correlation between
the cuts in top tax rates and the increases in top 1 per cent income shares since 1975 in 18
OECD countries, but the top income share increases have not been translated into a higher
economic growth (Piketty, Saez, & Stantcheva, 2011). There has been an additional sharp
division in the wealth and assets owned, where the bottom half of the global population owns
less than 1 per cent of the total wealth. On the other hand, the richest 10 per cent holds 86
per cent of the world’s wealth, and the top 1 per cent alone accounts for 46 per cent of global
assets (CSRI, 2013). Piketty and Saez (2003) have also shown that, in the US, the share of
total pre-tax income accruing to the top 1 per cent has more than doubled since the 1970s.
Some of the consequences of increased inequality are also slow economic growth (Ostry,
Berg, & Tsangarides, 2014), political instability (Ortiz & Cummins, 2011), and higher
unemployment (James K. Galbraith, 2012).
The purpose of this dissertation is to empirically evaluate the impact of corporate power on
consumption, debt and inequality. The reason for that is the need to understand how those
CCC relationships work because of their immense impact on economy and society. A better
understanding of these complex relationships can in turn lead to some policy
recommendations and improving of the system. Our purpose determines our research goal.
The goal of the research is, therefore, to build a new empirical model examining the
relationships between corporate power, consumption, debt and inequality. The cumulative
and circular causation, i.e. the CCC model, describes socio-economic dynamics with a
series of interrelated causations that form a non-equilibrium spiral. The model studies the
relationships between the four system components or building blocks in the following
sequence: corporate power, consumption, household debt, and inequality. Relying on their
corporate power, corporations have stimulated the rise in consumerism, which has increased
both private consumption and debt. On the other hand, increasing debt has enhanced the
process of rising inequality due to the lack of funding to invest in education or create savings.
Rising inequality has further increased the bargaining power of capital and closed the CCC
model.
The objective of the research is to empirically evaluate the CCC model when applied to the
average of OECD countries and to US data. The reason for the former is that the OECD is
the biggest economic (member) organization of most advanced economies and likewise the
most influential one. A further reason is that corporate power is concentrated in the hands of
the biggest corporations, which are global transnational corporations (TNCs)1. In 2004, 85
1 In this research we are using the typology of UNCTAD (2007) for a description of TNCs due to the fact that
they are the only institution with adequate historical record of TNCs ranking and its methodical study.
3
per cent of the top 100 TNCs were headquartered in the Triad (EU, US and Japan), with
TNCs headquartered in the US dominating the list with 25 entries. Five countries, the US,
the UK, Japan, France and Germany, accounted for 73 per cent of the top 100 firms. Top100
TNCs are therefore predominantly coming from the Triad, whose share has changed from
100 per cent back in 1990 to around 85 per cent in 2013. This dissertation empirically
evaluates the CCC relationships between corporate power, consumption, debt and
inequality; therefore, the average of OECD countries was used. An additional reason for the
latter is also the availability of the data, which are not available for all single OECD
countries, thus forming a panel data or clustering is not possible.
The OECD CCC model can be also used as a benchmark for the US model, to evaluate the
dynamics of US variables and the whole US model, compared to the average of OECD
countries. The reason for analysing the US data is that the US is the biggest single economy
and the most influential one. By focusing on a single and the most significant economy in
today’s world, we can prolong the time series, on the one hand, and deepen our knowledge
of the trends of rising corporate power and consumerism, on the other hand. The sheer size
and impact of the US economy makes its macroeconomic implications of primary
importance for the entire world. Furthermore, from an analysis of the US we can further
achieve greater understanding of potential problems or benefits for the other developed
countries.
The main research question is:
- Is growing corporate power leading to increased consumption, rising debt and
income inequality?
Related to the main research question, the additional research questions are answered:
- Is corporate power increasing?
- Is increased corporate power causing increased consumption?
- Is increased consumption causing higher debt?
- Is higher debt causing higher income inequality?
Transnationality refers to the geographic spread of firms and implies the existence of a home country and one
or more host countries. Indicators of the significance of the activities of TNCs include sales (turnover) and/or
output, employment, value added, exports and imports of goods and services, and the number of enterprises
under their control. Although these variables constitute a basic set that can provide answers to the activities of
TNCs, they are not necessary readily available, and additional measures of foreign affiliates activities may
prove useful in addressing specific issues. Those quantitative measures are indicators of both the growing
economic importance of TNCs and their potential in global activities. In this sense global transnational
corporations equal the term of global corporations or transnational corporations but mostly the abbreviation of
TNCs is used in this research.
4
Is higher income inequality influencing increased corporate power?
The relevance of the research questions is to explain the relationship between the main
variables, its causes and consequences, and to test the model and hypotheses. By doing so,
this thesis, based on existing (partial) and new explanations, builds a comprehensive model
that shows the impact of corporate power on consumption, debt and inequality.
The research methodology is twofold: (1) the theoretical part is descriptive and analytical,
based on logical reasoning and the observed causalities and consequences. There is also a
quantitative observation of relevant empirical data to test the model. For all main system
variables, an analysis of partial equations is carried out, which is followed by a synthesis
into a system of equations. (2) In the empirical part, we rely econometrically on three-stage
least squares (3SLS) estimation of system of simultaneous equations. The estimation refers
to a system of structural equations, where some equations contain endogenous variables
among the explanatory variables. Additionally, the endogenous variables are correlated with
the disturbances. This problem can be addressed with instrumental variables to produce
consistent estimates (the first two stages of 3SLS) and with generalized least square
estimation (the third stage of 3SLS) to account for the correlation structure in the
disturbances across the system of equations.
The dissertation makes several original contributions to the field of knowledge: (1) it builds
a comprehensive model that explains the impact of corporate power on consumption, debt
and inequality, and it is the first empirical investigation of the CCC relationship. It is
extending the knowledge about the trends of rising corporate power and consumerism at the
macro level. The economic model in this dissertation is a novelty in the research field and it
will contribute to a better understanding of the above-described research questions. (2) It
identifies and constructs a new variable of corporate power. (3) It empirically examines the
validity of the CCC model when applied to OECD and US data. It thereby also provides the
first empirical assessment of the relationships between the variables or components of the
CCC model. It examines the new relationships between corporate power, consumption, debt
and inequality. (4) It provides policy implications. The main system variables are
accumulating in time, which is not economically and socially sustainable. Some of the
consequences could be slower economic growth, social and health problems, fewer
educational opportunities, lower human capital and lower social mobility, political
instability and higher unemployment.
This dissertation is designed as a collection of four articles, which are closely integrated and
logically connected research papers. The first article (chapter) establishes the theoretical
framework with the analysis of income inequality, consumption, debt, and corporations and
their corporate power. It presents the political-economic model done by Porenta (2014).
When analysing the complex dynamics of economies, the political-economic model uses a
5
holistic approach with descriptive analysis and causal inference, combining Darwinian
evolutionary principles, anthropology, psychology and sociology with an economic analysis.
It shows that corporations are keen to exploit one of the most powerful human instincts—
the reproduction and the display of social status. By presenting the political-economic model
based on logical observation, causes and consequences, as well as empirical data, we can
observe that there is a clear notion of a cumulative and circular causation of the main
identified variables. Growing corporate power leads to consumption, driven by conspicuous
consumption and consumerism, to rising debt, and to income inequality.
The second article (chapter) sets the empirical theoretical framework. It builds a new
empirical model to empirically test the political-economic model and the relationships
between the CCC variables. The analysis of the main system variables, i.e. corporate power,
consumption, debt and inequality, will be followed by the construction of the new model
partial equations, along with the new variable of corporate power. This will be followed by
a synthesis of model partial equations into a new economic model, which can be
econometrically tested. Since there is a cumulative and circular causation of the main system
variables, that means that dependent variables are also independent variables in the next
equation in sequence. This economic model of CCC has four main system variables and
therefore forms a system of simultaneous equations, which produces a non-recursive model.
The third article (chapter) empirically evaluates the validity of the proposed CCC
mechanism (CCC model) when applied to average of OECD countries. It will analyse if the
corporate power has been increasing and if the financial liberalization has stimulated this
process. Increased corporate power could be positively influencing personal consumption,
which is in line with the increasing claims of conspicuous consumption, driven by corporate
power (marketing and the creation of wants). Furthermore, it could provide evidence that
indebtedness has been increasing, again supporting the growing power of corporations and
capital. Inequality could be also increasing, which can further diminish the bargaining power
of workers, i.e. consumers. Such spiral can continue in favour of corporate power.
The fourth article (chapter) empirically evaluates the validity of the proposed CCC
mechanism (CCC model) when applied to US data. It will be tested if the main system
variables have been risen in the period analysed. Rising corporate power could lead to
increased consumption, which can result in growing household debt, and the latter can
further lead to increasing inequality. We could also observe the dynamics in the US that have
resulted in the immense concentration of income sources in the hands of the top per cents of
the income distribution and towards income distribution changes that only reinforce the rise
in corporate power. Corporations in the US are investing vast resources into advertising,
thereby fostering a consumerist society and debt driven consumption.
6
The next chapter, the discussion, discusses the main findings of the two CCC models and
their policy implications, answers the research questions and underlines the contribution to
the literature. The OECD model can be used as a benchmark for the US model, to evaluate
the dynamics of US variables and the whole US model. In both models, we used the non-
recursive structural modelling and three-stage least squares regression of systems of
simultaneous structural equations. The results in both models support the notion of CCC of
the main identified variables. When comparing both models, we can observe that the
dynamic of main variables movement is more intense in the US than in the OECD countries.
All main US variables are above the average of OECD countries. The rise of US corporate
power outpaced the rise of corporate power in the OECD model. In the US, the consumption
share in GDP is well above the average of OECD countries. The same is true of the US
household debt and US income inequality. These empirical findings are consistent with the
process of cumulative and circular causation, i.e. the CCC model. In the US CCC model the
increase in corporate power seems to be larger than the one in the OECD model, thus
generating a larger increase in all the main system variables.
Finally, the conclusion summarizes the main findings of the dissertation, the contribution to
the literature, as well as some policy implications.
7
1 POLITICAL-ECONOMIC MODEL OF CUMULATIVE AND
CIRCULAR CAUSATION2
ABSTRACT: The literature is abundant with studies about income inequality, consumption,
public and household debt but scarce with studies about corporations and their corporate
power. This paper shows that corporate power influences increased consumption in order
to secure its investments and provide sufficient demand. Secondly, rising consumerism leads
to growing household and public debt with multiple transmission mechanisms that work
simultaneously and reinforce each other. Thirdly, growing household and public debt
increase inequality, thereby hindering the government from investing in education, health
care, infrastructure or social transfers, and preventing the people from investing in their
education or increasing their savings and, consequently, their wealth and financial
independence. Finally, the inequality causes an increase in corporate power. People who
are impoverished and thus unequal in comparison with the production owners and
capitalists are also weaker in the bargaining process. They cannot improve their position,
so corporate power increases, completing the cumulative and circular causation.
Keywords: corporate power, consumerism, debt, cumulative circular causation, inequality
JEL Classification: B52, E02, P10
2 This chapter is based on the article published by Porenta (2017).
8
1.1 Introduction
Is growing corporate power leading to consumption driven by conspicuous consumption and
consumerism, to rising public and household debt, and to income inequality? There are
several empirical facts about the increased income inequality in the past 40 years (OECD,
2011, 2015), rising public and household debt (Cecchetti et al., 2011; OECD, 2015),
increased consumption (OECD, 2015) and surging corporate power (UNCTAD, 2007), but
only a few studies examine the causations between those variables.
Empirical studies have shown that there has been a long period of flat or stagnant wages
(Mishel & Shierholz, 2013), which only reinforces income inequality. Inequality has further
increased due to a decrease in taxes (Fieldhouse, 2013) and there has been a strong
correlation between the cuts in top tax rates and the increases in top 1 per cent income shares
since 1975 in 18 OECD countries, but the top income share increases have not been
translated into a higher economic growth (Piketty et al., 2011). An additional sharp division
is evident in the wealth and assets owned, where the bottom half of the global population
owns less than 1 per cent of the total wealth. On the other hand, the richest 10 per cent holds
86 per cent of the world’s wealth, and the top 1 per cent alone accounts for 46 per cent of
global assets (CSRI, 2013). Piketty and Saez (2003) have also shown that, in the US, the
share of total pre-tax income accruing to the top 1 per cent has more than doubled since the
1970s. Some of the consequences of increased inequality are also slow economic growth
(Ostry et al., 2014), political instability (Ortiz & Cummins, 2011), and higher unemployment
(James K. Galbraith, 2012).
The literature is abundant with studies about income inequality, consumption, public and
household debt, but scarce with studies and analyses about capital and corporations and their
corporate power. This chapter examines corporate power, as well as the causes and
consequences of other variables and other multifold factors, using a holistic approach.
Such a multi causal approach starts with the economic analysis of two authors, Thorstein B.
Veblen and John K. Galbraith. Their work was driven by an evolutionary and institutionalist
approach. Veblen (1899) created the term conspicuous consumption, which is based on
evolutionary principles that are driven by the human instincts, mainly by emulation and
predation, where people are trying to impress others, gain advantage and signal their status.
The concept of conspicuous consumption was also used by Galbraith when explaining the
dependence effect. His next comprehensive insight was the effect called revised sequence,
where the consumers are not actually controlling the producers but vice versa (John K.
Galbraith, 1967). Galbraith furthermore reasons that corporations become so strong that they
eventually take control over the competitors, workers and the market. Consequently, they
spread their control and influence into politics, government, and public opinion. The worker
who is at the same time a consumer becomes indoctrinated by privately owned media and
9
corporate marketing, buying many things that he or she does not really need. The result is a
huge production of unnecessary and unproductive private goods, whereas, on the other hand,
there is a lack of public goods. As Porenta (2014) argues, consumerist consumption becomes
the foundation of economic growth. However, the problem is that real wages are stagnant
and in a sharp contrast with the rising productivity and profits, so the workers, who are at
the same time also the consumers, need to borrow money to maintain the standard and social
status demanded by society, the media and marketing.
An additional aspect to consider, as Porenta (2014) reasons, is the effect of stagnation of
mature economies, where corporations are forced to seek new markets to invest their
surpluses, and where even the new technologies markets are insufficient. Thus, financial
liberalization and globalization have been imposed, and the financial sector has strongly
overgrown the real sector, which results in many problems for the economy and society. The
financial sector also gladly credits the consumerist consumption to maintain demand and
economic growth. Due to stagnant wages, this consumption is largely driven by borrowing.
The debt is mostly consumptive and therefore not self-liquidating. It is not an investment
expecting some future cash inflow and liquidating itself with future revenues. Governments
also decrease taxes for top incomes and corporate revenues and consequently worsen their
balance of payments. Because of rising inequality and macroeconomic instability, public and
household debts also rise to maintain the consumption growth. This leads to boom-bust
credit cycles and eventually to a chronic weakness of economic demand. The consequences
of rising public debt, which also rises due to socializing private bubble busts, are less
effective countercyclical policies. Expansionary fiscal policy, by spending more on
infrastructure, education, human capital and health care, is constrained because of rising
public debt. In the case of tight monetary policy with higher interest rates, the rich benefit
because they can lend their money at higher rates and make a profit while protecting their
real wealth against inflation. The lower and the middle class are mainly borrowers, so they
are faced with an additional cost of borrowing due to higher interest rates. In this situation
with strong countercyclical policies, the strongest part always profits, which only increases
inequality in the society. Growing income inequality also leads to workers’ inability to adapt
to technological changes, including skill biased and capital biased changes that result in
additional unemployment and entrapment in a vicious circle of impoverishment.
This chapter extends the existing literature with an analysis of corporate power and its
influence on consumption. Using descriptive analysis together with causal inference and
combining Darwinian evolutionary principles, anthropology, psychology and sociology with
an economic analysis, we show that corporations are keen to exploit one of the most powerful
human instincts—the reproduction and the display of the social status.
Using a holistic approach, we build a political-economic model based on logical observation,
causes and consequences, as well as empirical data. There is a clear notion of a cumulative
10
and circular causation (hereinafter: CCC) of the main identified variables. Growing
corporate power is leading to consumption, driven by conspicuous consumption and
consumerism, to rising public and household debt, and to income inequality.
The chapter begins by building a political-economic model by constructing its elements of
the process of causation. It proceeds with circular causation and the definition of the main
system variables, and concludes with the process of cumulative and circular causation. In
the end, it discusses the main findings.
1.2 Political-economic model of CCC
The political-economic model of CCC has three stages or processes: first, variables are
interrelated in a sequence of causations. Second, the end of the sequence also influences the
starting point of the sequence, thus making a circular causation. Third, variables magnify
and increase from one circle to another, causing a cumulative and circular causation (Figure
1). This leads to a non-equilibrium process. The consequence is a CCC of variables which
form a system that is strengthened over time. Variables rise in time and economic
implications behind this process show that such development cannot be economically and
socially sustainable (Porenta, 2014).
1.2.1 Elements of the process of circular causation (CC)
‘Society, state and market3’ is a nexus of the entire system and is a starting and crossing
point which determines all other factors and variables in terms of how they are developing,
forming the social and legal frame, and institutions. Each society forms its own original
background and starting point through its own history and evolution. The evolution and
change take a different path in each of these diverse societies, thus forming different
institutions. When reaching the most recent stage of the evolution, capitalism, there are
clearly some different outcomes. There is no single capitalist system in the world, or more
precisely, there are many different capitalist systems. What distinguishes them are the
institutions4. As Porenta (2014) further illustrates, the society determines what kind of a state
form suits it best in terms of its needs and development stage. Accordingly, the economic
system is formed. In some countries, the state is more interlinked with the economy and its
3 Market is referred as Marshallian, which combined demand and supply as tools of price determination (Mas-
Colell, Whinston, & Green, 1995). 4 Different capitalist systems, like the continental European, Scandinavian type, Anglo-Saxon or Asian type of
capitalism have institutional differences and different outcomes, e.g. in Scandinavian countries trade union
densities remain almost unchanged in the last few decades, indicating that the bargaining power of the workers
is not diminishing (OECD, 2017). Some future research could address these institutional differences between
countries (see chapter 5.2 for more details about research focus and limitations, and future research
suggestions).
11
market than in others. The variety goes from state capitalism, where the state interference in
the economy is very strong, to the so-called ‘laissez-faire’ market, with minimum state
interference in the economy. All these characteristics determine how the participants in the
economy will evolve. Capitalism with its contradictions and society with its institutions set
the market conditions in which the participants can work and compete between themselves.
The interests of all participants are different and sometimes even oppose one another.
However, since the participants are mainly in pursuit of their own private interests5, the state
must regulate and monitor the entire market and economy to provide a legal framework and
working economy such that the goal of society’s well-being is pursued.
The connection of all important factors or variables into a sequence is elaborated in the
following chapters. Variables can be described as blocks of the sequence, forming a process
of the circular causation. Each variable influences the next one. We will elaborate on each
of them.
1.2.1.1 Corporate power
Corporations increase their economies of scale and scope, their international mobility, assets
owned and political power. They succeed in lowering taxes, lessening the regulations,
increasing subsidies and grants from governments, and consequently become too big to fail.
Thus, as Porenta (2014) reasons, relying on society to bail them out when necessary,
corporations set the norm of privatizing the profit and socializing the loss.
Big corporations gain advantages over the smaller ones because of better organization and
management, higher efficiency and productivity, technological edge, and economies of scale
and scope. Nevertheless, with the rise of the firms and their power, the market shifts
increasingly towards imperfect competition. When imperfect competition exists, the
marginal productivity theory of distribution fails to hold up and labour is exploited by
powerful firms (Robinson, 1954). We do not have competitive markets with a large number
of firms with sovereign consumers, but rather non-competitive markets with large firms that
control the markets (John K. Galbraith, 1952, 1967). However, as Pressman (2007) argues,
firms cannot take the chance that after undertaking expensive investment there will be no
demand for their goods. They are eliminating the uncertainty of market forces by controlling
it through vertical integration, developing diverse products, dealing with consumer taste
changes and long-term contracts between producers and suppliers. On the other hand, and
5 More accurate than Adam Smith's theory of the invisible hand, which says that competition channels self-
interest for the common good, is Charles Darwin's understanding of competition’s insight that individual and
group interests often diverge, as Frank (2011) argues. Such economic competition often leads to ‘arms races’
or ‘keeping up with Joneses’ norm, which encourage behaviors that not only cause enormous harm to the group
but also provide no lasting advantages for individuals, since any gains tend to be only relative and mutually
offsetting (see more in Chapter 1.2.1.3).
12
probably the most important, by spending money on advertising, firms can effectively
control consumer tastes.
The following indicator of corporate power is its influence on governments through political
donations and direct lobbying. As shown by CRP (2014), the US federal lobbying expenses
in 2010 were about $3.55 billion, up 46 per cent from five years earlier and up 126 per cent
since 2000. With about 13,000 registered lobbyists, this means that there are more than 24
lobbyists for every member of the Congress. The economic and political power of the
world’s top 200 corporations was examined by Anderson and Cavanagh (2000), who argue
that the widespread trade and investment liberalization have contributed to the climate in
which dominant corporations enjoy increasing levels of economic and political clout that are
out of balance with the tangible benefits they provide for the society. Such growing private
power has enormous economic consequences, but the greatest impact may be political, as
corporations transform economic power into political power.
The world’s biggest firms are transnational corporations (hereinafter: TNC). Internalization
is the main determinant for the TNCs along with their pursuit of optimal allocation of
resources. Costs are minimized with their search for the countries with low labour costs,
whereas the profits are maximized in countries with low taxes, tax evasions, tax avoidances
and subsidies. Governments are actually competing for TNC’s investments by changing their
laws regarding the minimum wage, subsidies and taxes. Incentives for new jobs make
governments even more compliant with the TNCs’ demands. Additionally, they influence
the international trade agreements according to their interests. All these factors make TNCs
very powerful. Nevertheless, the development of big corporations is also positive due to their
vast investments and improvements of technologies and other innovations.
TNCs are actually interlinked in a very complex way, as a result of which it is hard to see
the whole picture. Consequently, there is a lack of transparency or some informal agreements
or illegal cartels. In reality, TNCs are even more connected due to various business
agreements, owning of each other’s shares, contracted associations, etc. The study of
complex systems conducted by Vitali, Glattfelder, and Battiston (2011) has shown a core of
1,318 companies with interlocking ownerships, where each of them has on average 20
connections to other companies. With 20 per cent of global operating revenues, they own
most of the world's large blue chip and manufacturing firms through their shares, thus further
adding 60 per cent of global revenues. There is also a super-entity of 147 even more tightly
knit companies, where all their ownership is held by other members of the super-entity,
which controls 40 per cent of the total wealth in the network. Less than 1 per cent of the
companies can control 40 per cent of the entire network. This super-core consists mostly of
big financial corporations.
13
Although no common or standard measurement of corporate power exists, there are some
available metrics as elaborated by Roach (2007), such as corporate economic statistics,
industry concentration ratios, labour union densities and corporate ability to reduce the taxes
or acquire government subsidies. The former, elaborated by UNCTAD, seems to be the most
viable measurement choice of rising global corporate power.
Corporate power is actually evolving from the properties of capitalism and its contradictions,
namely, monopolies or oligopolies. The capitalist system has the tendency to concentration
and centralization of capital, as it was observed by Marx (1867). The former happens as
individual capitalists accumulate more and more capital, whereas the latter is a process of
relocation of already existing capital in the hands of fewer and fewer capitalists. Such
consolidation and globalization of capital is therefore inseparable from increasing
monopolization, that is, the concentration and centralization of capital on a world scale—
which necessarily produces bigger contradictions and crises (Foster, 2002). This is
particularly typical of the 20th century, with the prevalence of the major international
corporations in the global economy. The consequence is an exclusion of effective price
competition. Monopolies change the prices only in one direction, upward (Baran & Sweezy,
1966; Foster & Magdoff, 2009). Price competition is replaced by informal agreements and
price tracking of the specific industry leader. As a result of such exclusion of price
competition in the economies, one of the fundamental premises of capitalist economies was
demolished. Competition resumes in line with the productivity increase and the production
costs decrease. This is also done at the expense of a stall or stagnation of real wages.
Consequently, a large and growing investment surplus emerges and encounters reduced
investment markets. As Porenta (2014) further argues, the investment markets are reduced
partly due to the maturity of the economies and partly because of the increase in income
inequality, which in turn has a negative impact on consumption.
Corporate power, financial and monopoly capital for investment of their surpluses invent
new financial instruments, financialization, liberalization, globalization and other leverages
of influence. Indoctrination of the consumer using very sophisticated marketing techniques
is one of the main business activities of corporations. Additional leverage is also the
influence on public opinion, exercised by ‘opinion leaders’ and ‘neutral’ experts who
advocate corporate interests in a very sophisticated way. The next leverage, as Porenta
(2014) reasons, is on politics. This becomes appropriate in times of financial and economic
crises, when private firms and banks call for help and bailouts from the governments, thereby
dismissing the firms’ previously propagated mantra of ‘laissez-faire’. Their actual premise
is the privatization of profits and socialization of losses. Therefore, the moral hazard is
rewarded. When the capital investments become insufficient, they put pressure on
governments for further liberalization or the increase in the leverage ratio of the credit
economy, allowing workers’ and consumers’ higher indebtedness. All this is done for further
14
expansion of capital. With such a debt leverage drive, the economy can maintain the
aggregate demand for a while, but it will inevitably come to a burst of a bubble economy.
Such an economy is clearly not sustainable.
After corporations acquire economic power, along with political power and its influence in
the society, their bargaining power towards workers only increases. Workers’ collective
bargaining power has been getting weaker over time, where the trade unions density has
been decreasing in the last 40 years. In the US, the trade union density level was lower than
in the OECD countries in the period from 1970 to 2012.
In the long term, a worker must accept a lower wage or be satisfied with the existing one,
without expecting a rise in line with the firm’s productivity rise or profit. The growth of the
median household income (hereinafter: mhi) is actually lower than the growth of GDP
(hereinafter: g) in the US in the last 40 years. The growth of GDP is then in turn lower than
the rate of return on capital (hereinafter: r). We can observe a widening gap in the period
from 1970 to 2012. Median household income stalled in that period, whereas GDP grew
significantly. There are immense implications of the fact that mhi < g. It means that people’s
wealth is stagnating. Their income growth does not match the pace of the GDP growth,
which causes the deterioration of their living standard and forces them into borrowing
(Piketty, 2014; Porenta, 2014). This fundamental inequality mhi < g < r also means that
workers’ bargaining power towards employers diminishes.
Alternatively, the worker can leave the current job, but the job market is volatile. On the one
hand, there are fewer firms because of the process of concentration and centralization. On
the other hand, the fact that there are many unemployed workers inflicts additional pressure
on those still employed. The higher the unemployment rate is, the bigger the pressure on the
employed workers is and the lower the amount of remuneration for which they are prepared
to work is. Firms are always keen to take advantage of that fact. They always exploit
unemployment as leverage in the bargaining process as long as they can compensate lost
demand from unemployed consumers with the possibility of incurring debt for the
consumption. As a result, they have subordinate and loyal workers who are afraid of losing
their jobs. Further, large and powerful firms generally control other smaller and weaker
competitors. Because of their market power, these large firms set the market prices of goods
and services and become the price leaders in their sector or market. Such price leadership
can leave the competition with little choice but to follow the leader and match the price if
they want to keep their market share. The competition may also opt to lower their prices in
order to gain some additional market share. Market leaders usually use the uncompromising
strategy of lowering their prices in the short-term due to their operating efficiency. This
forces smaller competitors to lower their prices, too, in order to retain market share (Baran
& Sweezy, 1966; Foster & Magdoff, 2009; Porenta, 2014). As these smaller competitors
usually do not have the same economies of scale and scope as the price leaders, their effort
15
to equal the leaders’ prices may inevitably account for losses, forcing them to close the
business.
The control over workers and other firms also leads to the control of the market. Markets
become less competitive with a smaller number of firms and there is a shift from perfect
competition markets towards monopoly or oligopoly markets with only a few bigger firms
which usually even collaborate by making mutually beneficiary agreements or forming
informal cartels. Since these powerful firms acquire enormous economic power, they
broaden their influence into politics and government, directing future policy and law
decision in their favour, as Porenta (2014) further reasons. This also explains why several
state regulators do not act or act with a considerable time lapse against such cartels. These
large firms or corporations aim to control the market in order to maintain and reinforce their
influence and economic power, and widen their influence even further into public opinion,
society, government and politics.
When corporations acquire the control over workers, other firms and the market, they expand
their influence and control into politics, government, public opinion and consumers.
Corporations first try to obtain control inside the company, then in the nearest environment
and after that in the wider environment. The process of control goes from micro to macro
environment. The revenues of TNCs are big and they have vast resources at their disposal.
Their influence on all aspects of society is immense. In the US, for example, the link between
the private and the public sector is so strong that the country has almost shifted from
parliamentary democracy towards corporate democracy. For example, the recent decision of
the US Supreme Court that individuals are free to sponsor politicians only leads to further
interdependence between rich individuals or capital and politicians. A democratic system in
which the politicians are mostly elected due to the amount of invested or raised capital cannot
be truly effective with regard to the common good and social well-being. Such a system
favours capital. And capital means corporations and rich individuals who influence and
control the legislation, politicians and government according to their vested interests. As
(John K. Galbraith, 1952, 1958, 1967; Porenta, 2014) then further show, the next in the line
of control is the public opinion. Public opinion is created by various factors, including both
the private and public media. Private media are already in the control and ownership of
corporations, whereas public media are normally controlled by some independent bodies that
are elected by parliaments or delegated by governments. Members of a parliament or
government are politicians who are elected with the help of capital. The circle of private
influence is thus closed. Corporations and private capital can influence both the private and
public media through various techniques, from supposedly independent experts explaining
their views through the media, to influential opinion makers. This all forms public opinion
in favour of the vested interests of corporations and private capital.
16
Such domination by the interests of influential groups over major social and political
decisions clearly poses a question regarding the meaning and the power of democracy in
today’s society (Laperche, Galbraith, & Uzunidis, 2006). Nevertheless, despite the evolving
conflict between shareholders and managers, on the one hand, and globalized
technostructures and potentially corrupt corporations, on the other hand, corporate behaviour
remains very rational. With the use of transparent corporate communication, which also
represents an important element of the dynamic competitive process and a powerful tool for
the improvement of firms’ performance (Lah, Sušjan, & Redek, 2016), corporations succeed
in their goal: control over government, public opinion and consumers.
The control over consumers is the most important and one of the biggest expenses for
corporations. In 2005, corporations spent 230 billion dollars on advertising their products in
the US media, which is approximately 1,000 dollars per citizen. The US advertising industry
accounts for 2.2 per cent of GDP, absorbs approximately 20 per cent of firms’ budgets for
new investments, and uses 13 per cent of their corporate profits (Molinari & Turino, 2013).
As shown in the empirical work by Benhabib and Bisin (2002, 2011), advertising directly
affects consumers’ preferences. Corporations exploit their power through advertising in
order to create new and unnecessary consumers’ needs. Individuals’ preferences, which are
in part a social phenomenon, are influenced by advertising. Such advertising has a relevant
impact on aggregate consumption and through consumption on other macroeconomic
aggregates (Molinari & Turino, 2013). The effectiveness of corporate advertising in
enhancing demand is also supported in a comprehensive empirical survey by Bagwell (2005)
and by Vakratsas and Ambler (1999). How influential and persuasive the marketing is and
how this can lead towards unsustainable consumption, is also shown by Mont and Power
(2013). In addition to the increasing pressure and the sheer volume of the advertising
industry, there are constant changes in advertising messages and in the way they are
transmitted to the changing target audience.
To control and influence consumers, corporations use their economic power, the media,
government and public opinion. Their internal marketing departments use complex
strategies, including all usable fields of science, from mathematics to sociology and
psychology. The most important fact is that the consequence of increasing corporate power
is the shift of power from consumers to producers. Corporations are those who control the
consumers’ decisions through very complex spectre of influences and indoctrination. They
impose the taste, fashion, social wants and other factors of consumer decision making. The
corporate machinery has the entire spectre of elements in order to persuade the consumers
that their choices are reasonable, ranging from the media, experts and opinion makers
(Hodgson, 2012; Porenta, 2014). The most important influencing factors include the so-
called dependence effect and revised sequence, which are explained in more detail in the
next chapter.
17
1.2.1.2 Consumption
In the original sequence, the economy is composed of competitive markets ruled by the
decisions of sovereign consumers, and the consumers control the producers and the
production process with their demand. Contrary to the original sequence, the revised
sequence actually recognizes that this control is in reality reversed and producers have power
over consumers (John K. Galbraith, 1967). This power is particularly exercised with the help
of marketing and advertising.
This revised sequence would not have such an effect without the presence of another effect,
the so-called dependence effect. John K. Galbraith (1958) defines the dependence effect as
a concept that includes passive and active aspects. The passive aspect is the process of
emulation whereby social norms and localized cultural comparisons induce consumption
patterns, i.e. the social pressure to ‘keep up with the Joneses’. The active aspect refers to the
contriving of specific social wants and, equally important, the creation and reproduction of
a consumer culture. According to Galbraith, the American demand for goods and services is
not organic; it is not internally created by a consumer. Apart from the basic demand, such as
food, clothes, and shelter, a new demand has been created by advertisers and the ‘machinery
for consumer-demand creation,’ which benefits from increased consumer spending. This
exuberance in private production and consumption pushes out public spending and
investment. Galbraith ties consumers’ debt directly to the process of want creation.
Galbraith builds his dependence effect upon Veblen’s concept of conspicuous consumption.
Conspicuous consumption is understood as spending money and purchasing goods and
services to display one’s own status. By doing that, people maintain or attain their social
status and, in some cases, even provoke envy. Conspicuous consumption was first introduced
by Veblen (1899), who describes the behavioural characteristics of the nouveau riche, i. e.
the social class that emerged as a result of the accumulation of capital wealth during the
Second Industrial Revolution. Human instincts of emulation and predation play an important
role. People attempt to impress others and seek to gain advantage through conspicuous
consumption and the ability to engage in conspicuous leisure.
Nowadays, conspicuous consumption is more a socio-economic behaviour which is
particularly common in poor social classes. They display luxury goods or services to
psychologically combat the impression of relative poverty. As Charles, Hurst, and
Roussanov (2007) have shown, conspicuous consumption and visible luxury do not serve to
signal the owner’s status as affluent, but to avoid the negative perception that the owner is
poor. The truth is that no one wants to be perceived as poor. All psychological mechanics of
conspicuous consumption in a consumer society show that conspicuous consumption is a
psychological trap, in which a person seeks a superior social status or the possibility to at
18
least maintain the existing one and eliminate the stigma of being poor or the deterioration of
one’s social status.
As Zehavi and Zahavi (1999) presented, evolutionary psychology explains conspicuous
consumption as a costly signal or a handicap principle, demonstrating a person’s good socio-
economic quality and his or her intention to attract economic coalition partners or sexual
mates, with the aim to improve one’s own status and obtain the chance of reproduction.
Iredale and van Vugt (2012) also argue that altruism may have evolved because it signals
underlying qualities about the individual that are important to others and may hence increase
their fitness through prestige and mating opportunities.
Miller (2009) uses Darwinism to illustrate how marketing has exploited our inherited
instincts to display social status for reproductive advantage. In our modern marketing
dominated culture, ‘coolness’ at the conscious level and the consumption choices it drives is
actually an aberration of the genetic legacy of two million years of living in small groups, in
which social status has been a critical force in reproduction. Miller argues that advertising
and marketing persuade people, particularly the young ones, that the most effective way to
display their status is through consumption choices, rather than conveying such traits as
intelligence and personality through more natural means of communication, such as
conversation.
Such status-seeking behaviour can also be risky. Rubin and Capra (2011) argue that an
evolutionary approach may also explain the differences between groups, for example,
between males and females, with the former being less risk-averse than the latter since males
have more variable reproductive success than females. Males may potentially increase their
reproductive success much more than females. It is their status-seeking internal drive that
pushes them into risky behaviour, such as risky business investments or some purchases.
However, the motivation that is driven by the human instincts is not always rational. Status-
seeking can be risk-seeking behaviour that does not pay off.
Further analysis leads from instincts towards habits. Veblen imposes the imperative to
explain the causality. Using Darwin’s notion that people are not as much the ‘creatures of
reason’ as the ‘creatures of habit’, Veblen sets habits as the central concept in his institutional
analysis based on instinct-habit psychology. As elaborated by Hodgson (2012), activity and
habit formation precede rational deliberation, instinct is prior to a habit, habit is prior to
belief and belief is prior to reason. That is the order in which they have evolved in our human
ancestry over millions of years. These lower elements are necessary but not sufficient for
higher elements. Habits are the constitutive material of institutions and each building or
changing of an institution involves the formation or adjustment of shared habits of thought.
19
This incorporation of psychology into economics is very important, because individuals are
not entirely rational in optimizing their behaviour, thus maximizing their utilities of given
preferences. Rather, their rationality is bounded by limitations. It is also procedural, where
decision makers follow some procedures and decisions that are subject of their preferences
or technology and reverse. Human behaviour, its sociological determination, individual
tastes or preferences cannot be explained in an over simplistic way, neither can they be
mathematically modelled with some simplistic assumptions without really considering
instinct-habit psychology. Analysing human motivations and human desire is crucial. It is
more sensible to assume that an explanation based on a biological evolutionary concept is
more accurate and closer to reality than the homo economicus assumption based on rational
individuals. Since everything around us is also in constant motion and dynamics, it is also
rational to assume that there are no static or steady states, but rather some constant dynamic
movements. Hence, as Porenta (2014) concludes, people and institutions, habits and beliefs,
are likewise changing and evolving.
Revised sequence and dependence effect have shown to be the most powerful corporate tools
in today’s economy. Corporations control workers, competitors, markets, governments,
public opinion and consumers. They succeed in reversing the classical view of consumer-
production relationship, namely that the consumer is the one who controls the producer.
Such a revised sequence cannot be attained without the dependence effect. It is this
dependence effect with its passive and active aspects that drive the revised sequence and the
success of corporate advertising. The roots of the dependence effect are both in conspicuous
consumption and the handicap principle. The latter drives conspicuous consumption, the
dependence effect and corporate power. As Miller (2009) and Porenta (2014) further reason,
corporations are keen to exploit one of the most powerful human instincts—the reproduction
and display of social status, thus fostering consumerism as a marketing-dominated culture.
Consumers who are at the same time also workers with stagnant real wages because of
increasing corporate power and increasing income inequality are eager to maintain or obtain
their social status. In many cases, they do not even strive to improve their social status, but
merely maintain the existing standard or hide their impoverishment. For this and other wants
creations, they are even willing to borrow the money. Of course, such a debt is mostly
unproductive and irrational. Most often, it does not pay off. Such a debt is a consumptive
debt and therefore non-self-liquidating. It is not an investment that may bring some future
cash inflow and liquidates itself with future revenues. It is a debt taken due to human instincts
and therefore not an example of homo economicus. As the latest research from the field of
evolutionary psychology and behavioural economy shows, humans are still evolving and
developing, and it would be sensible for marketers to substitute their paradigm regarding
selling products for displaying status with products or services that imply some deeper
mental traits, such as creativity, intelligence and compassion.
20
1.2.1.3 Debt
In the US, personal consumption expenditure grew sharply in the period from 1970 to 2012.
In the same period, personal consumption expenditure outpaced personal disposable income,
causing a drop in personal savings as a percentage of disposable income. The reasons for the
decline in the personal savings rate are more personal consumption and higher mandatory
transfers, such as income taxes and security programs.
In contrast, household income stagnated or stalled. In the period from 1970 to 2012, the
household income stagnated for the entire bottom 50 per cent of the household income
distribution. Even 70 percentiles showed only a modest increase from $64,600 in 1970 to
$82,100 in 2012, a period of 42 years. The top 10 and top 5 per cent, on the other hand,
showed a sharp increase in household income (USCB, 2015).
Increased consumption and stagnated or stalled income lead to borrowing. The household
debt exhibited a steady upward trend in the period from 1980 to 2010, both in the US and
the OECD countries. Because of people’s indebtedness, more people need social help. Rising
social transfers lead to a further rise in public debt, which is already increasing due to the
consequences of financial liberalization and the bailouts of private capital in the time of
recessions. As several researchers (Cecchetti et al., 2011; OECD, 2015; Porenta, 2014)
further elaborate, the transmission mechanism or a process of causation of how increasing
corporate power causes rising household and public debt is the following: first, the
increasing corporate power leads to increasing financial liberalization and globalization,
increasing marketing and growing consumerism and consumption. Second, these increases
lead to decreasing or stagnant real wages, lower taxes, lower budget income and bigger social
transfers. This causes a deficit in the government balance of payment and a fall in aggregate
demand. Public debt and household debt rise. Lastly, the income and wealth inequalities rise,
too.
In order to maintain the standard when wages are stagnant, people borrow money. At least
two aspects need to be considered here. The first is that stagnant wages themselves present
a problem because of the problematic distribution of income. This causes income inequality,
with almost the entire surplus of economic growth and capital gains going to the upper class.
The middle and lower classes get the income that is, after adjusting for inflation, stagnant.
The second aspect refers to the standard itself. What is a proper standard is also defined and
shaped with the ‘help’ of the corporations. Corporate power is the one that influences public
opinion through the media and popular culture, pushing the ideology of consumerism to the
front. By means of a sophisticated influence on public opinion, they shape the environment,
where the social norm ‘keep up with the Joneses’ eventually pushes the ladder higher and
higher. Thus, it is the environment formed with the help of corporations and consumerism
that defines the standard. People are obliged to follow such a consumerist standard, because
21
they do not want to be perceived as outliers or stigmatized as poor (John K. Galbraith, 1958;
Hodgson, 2012; Porenta, 2014). To prevent this, they have to ‘keep up with the Joneses’.
Nevertheless, such debt-driven consumption is not sustainable and leads to unsustainable
private demand and boom-bust credit cycles. Since the aggregate demand, particularly in the
US, is driven mainly by the wrong type of debt-driven consumption, meaning non-self-
liquidating debt, the economy inevitably becomes unsustainable. Indebtedness only
increases. The next factor is that overconsumption causes a fall in savings and consequently
a fall in investments. Along with an increase in the income of the top and the income
inequality gap, the fall in the aggregate demand causes an increase in borrowing of both the
government and households. As has been argued (Dunn & Pressman, 2005; Porenta, 2014),
the consequence of a rising public debt―this also rises because of socializing private bubble
busts and the bailouts of private banks―are less effective countercyclical policies. On the
one hand, the expansionary fiscal policy, with spending more on infrastructure, education,
human capital and health care, is limited due to the rising public debt. In the case of tight
monetary policy with higher interest rates, the rich benefit because they can lend their money
at higher rates and make a profit while protecting their real wealth against inflation. The
lower and the middle class are mainly borrowers, so they are faced with an additional cost
of borrowing due to higher interest rates. In this situation with strong countercyclical
policies, the strongest part always profits, which only increases inequality in the society.
1.2.1.4 Inequality
Decreased union densities and workers’ bargaining power, along with indebted households,
can be seen in income distribution. For the bottom 90 per cent of income distribution in the
US, the income share decreased by 16.6 per cent in the period from 1970 to 2012, whereas
for the top 5 per cent, top 1 per cent and top 0.1 per cent, income share grew by 16.6, 15.4
and 11.54, respectively. Such an average income and income share distribution clearly show
that income inequality is increasing. The Gini coefficient, from OECD (2015), shows that
income inequality has increased by 30.1 per cent in the US and by 27.4 per cent in the OECD
countries, in the period from 1975 to 2013.
A study, led by Azzimonti, De Francisco, and Quadrini (2014) shows that rising public debt,
financial liberalization and increased income inequality are highly correlated. Trade
liberalization and economic globalization increase economic inequality (Bergh & Nilsson,
2010). The index of financial liberalization, constructed by Abiad, Detragiache, and Tressel
(2010a), further shows that the world’s financial markets have become less regulated starting
in the early 1980s. This can be regarded as the first bigger step of corporations towards the
increase in their power. Such financial liberalization and innovation have also facilitated the
borrowers’ access to credit that was previously denied as well as relaxed financing
constraints on the first-time homebuyers. According to an OECD (2006) report, the
22
household debt rose to historical levels in a number of countries. It has been driven by a
combination of favourable financial conditions and buoyant housing markets. There have
also been many supply-side innovations in credit markets that have eased the access to credit
for lower-income borrowers and reduced financial constraints for first-time homebuyers. As
OECD (2013) reports, households remain highly indebted in a large number of OECD
economies.
Inequality actually increases due to a decrease in taxes (Fieldhouse, 2013) and there has been
a strong correlation between cuts in top tax rates and increases in top 1 per cent income
shares (Piketty et al., 2011). In this respect, it is interesting how democracy is related to
redistribution and inequality. The usual model of democracy presumes that median voters
employ their voting rights in a democratic system to reallocate funds from the wealthier
towards themselves. If the difference between the wealthier and the median voters become
bigger, the redistribution should be bigger, or more precisely, when the median voters are
poorer, they will be keener to reallocate from the wealthier towards themselves. However,
Acemoglu, Naidu, Restrepo, and Robinson (2013) have shown that there is a limited effect
of democracy on inequality, and they thus do not confirm this standard model. Inequality
tends to increase after democratization. The reason for that may be that democracy can be
captured or constrained. Although democracy changes, the distribution of ‘de jure’ power in
society, policy outcomes and inequality also depend on the ‘de facto’ distribution of power.
Powerful elites who see their de jure power eroded by democratization may increase their
investments in de facto power, implemented by controlling the local or state law
enforcement, lobbying, or influencing the party system and politicians.
When the economy grows, some sections of the population enjoy a more than proportionate
rise in income, as shown by Datta (2014). This leads to an increased allocation of resources
towards the production of luxury goods, which often requires more resources than the
production of necessary goods. That may not only reduce the production of necessary goods
but also the total production. Consumption of luxury products could be the ‘bandwagon’
type of luxury consumption, mediated by the level of a consumer's status-seeking
predispositions, susceptibility to normative influence and the need for uniqueness
(Kastanakis & Balabanis, 2012). In addition, teen attitudes towards luxury fashion brands
from a social identity perspective and their need for uniqueness and susceptibility to
influence (Gentina, Shrum, & Lowrey, 2016), and older consumers who relate luxury goods
purchasing mainly to status reasons tend to feel younger than those who consider luxury
goods purchasing primarily as a means to express their individual style (Amatulli, Guido, &
Nataraajan, 2015). Furthermore, there is a downward extension that fuels the continuous
growth of the luxury sector and a continuum from the ‘happy few’ to the many less privileged
(Kapferer & Laurent, 2016). Such a problem of balancing consumption between the rich and

23
the poor is, nevertheless, translating into increasing consumption of luxury goods, which
could indirectly confirm rising inequality.
Excessive consumerism is also the cause of overprovided private goods and underprovided
public goods, which reinforces inequality and impoverishment. As stated by John K.
Galbraith (1958), the effect of increasing production of private goods and decreasing public
goods is actually a state of private wealth and public impoverishment. Dunn and Pressman
(2005) further elaborate that Galbraith follows Veblen and Myrdal, who view poverty as a
cumulative and a self-driving circular causation. The poor are living in a deprived
community without proper education, health care and other public services. They are unable
to acquire proper managerial skills and jobs or some positions in the government structure.
Consequently, they cannot improve their economic and political positions or their social
mobility, and they thus stay trapped in this vicious circle of poverty for generations.
Impoverishment and the vicious circle of poverty, along with increased income inequality,
also lead to workers’ inability to adapt to technological changes, including skill biased and
capital biased changes that results in additional unemployment. This further leads to social
inequality and the accompanying deterioration of their health and mental condition, not to
mention stress and a poor quality of life. The study of Wilkinson and Pickett (2011) has
shown that there are pernicious effects of inequality on societies: eroding trust, increasing
anxiety and illness, and excessive consumption. The societies which do the best for their
citizens are those with the smallest income inequality, whereas the most unequal societies,
such as the US, the UK and Portugal, do the worst. Therefore, the status and income
differences have social and health consequences.
Growing corporate power thus accounts for rising income and wealth inequality. Because of
the influence of corporate power on workers, markets, politics, government and society, and
their increasing bargaining power towards the workers, corporations have effectively
achieved such distribution and redistribution of income that favours them and rich
individuals. Next, the increased corporate power results in financial liberalization and
reduced taxes, which brings about increased capital gains and thus an increased income gap.
Additional consequences are reduced taxes that cause some budget deficits as well as
increased social transfers, fewer investments in education and human capital, reduced social
mobility and, consequently, a vicious circle of poverty entrapment. Rising corporate power
leads to increased consumerism and consumption, which, in turn, results in increased
consumptive debt and increased household debt due to stagnant real wages and the increased
consumer debt. Thus, as some researchers (Dunn & Pressman, 2005; John K. Galbraith,
1958; Porenta, 2014) further reason, these increasing inequalities have an immense impact
on individuals, people and society. People’s lives become worse, their indebtedness is on the
rise, the possibilities of better education are fewer, and their social mobility declines.
Unemployment is rising or stalling, but never really disappears. Environmental problems
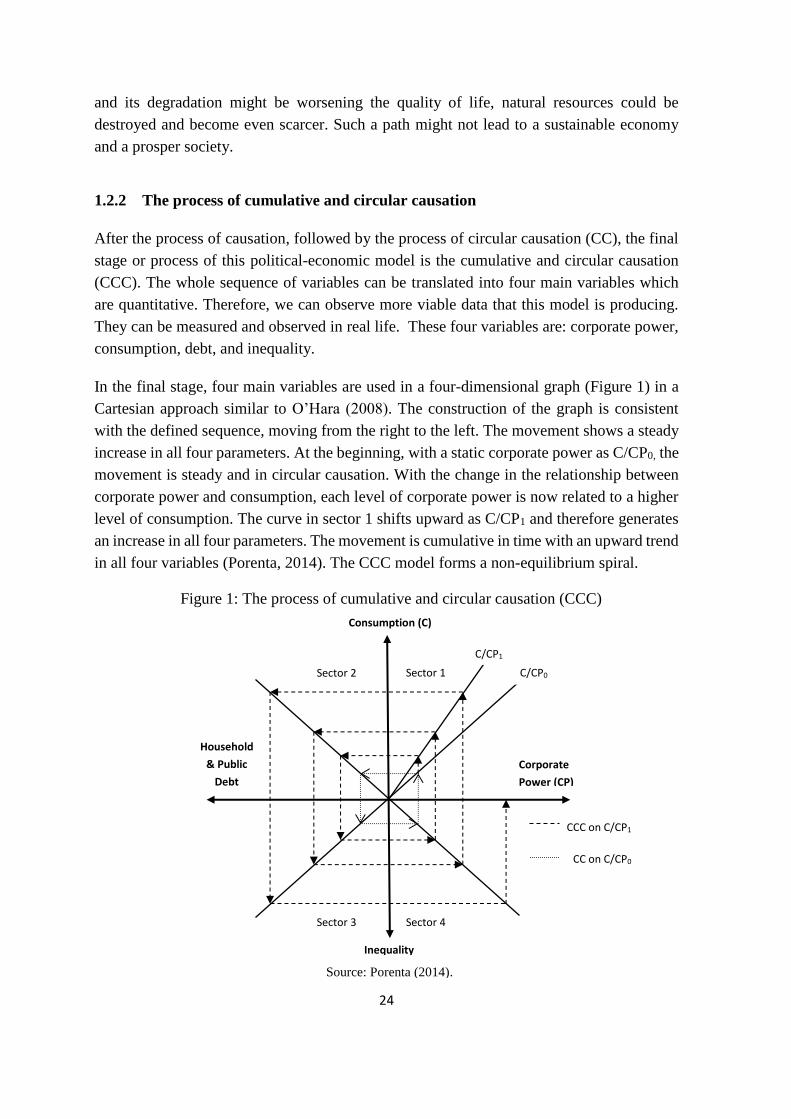
24
and its degradation might be worsening the quality of life, natural resources could be
destroyed and become even scarcer. Such a path might not lead to a sustainable economy
and a prosper society.
1.2.2 The process of cumulative and circular causation
After the process of causation, followed by the process of circular causation (CC), the final
stage or process of this political-economic model is the cumulative and circular causation
(CCC). The whole sequence of variables can be translated into four main variables which
are quantitative. Therefore, we can observe more viable data that this model is producing.
They can be measured and observed in real life. These four variables are: corporate power,
consumption, debt, and inequality.
In the final stage, four main variables are used in a four-dimensional graph (Figure 1) in a
Cartesian approach similar to O’Hara (2008). The construction of the graph is consistent
with the defined sequence, moving from the right to the left. The movement shows a steady
increase in all four parameters. At the beginning, with a static corporate power as C/CP0, the
movement is steady and in circular causation. With the change in the relationship between
corporate power and consumption, each level of corporate power is now related to a higher
level of consumption. The curve in sector 1 shifts upward as C/CP1 and therefore generates
an increase in all four parameters. The movement is cumulative in time with an upward trend
in all four variables (Porenta, 2014). The CCC model forms a non-equilibrium spiral.
Sector 2
CC on C/CP0
CCC on C/CP1
Sector 1
Sector 3 Sector 4
Inequality
Corporate
Power (CP)
Household
& Public
Debt
Consumption (C)
C/CP0
C/CP1
Source: Porenta (2014).
Figure 1: The process of cumulative and circular causation (CCC)
25
In the first sector, corporate power influences consumption (Figure 1). On the one hand,
corporations become more efficient in affecting consumers’ behaviour with vast investments
in sophisticated advertising; on the other hand, they succeeded in providing more financial
support for consumption and incurring consumptive debt for the consumers, i.e. workers,
with mostly stagnating wages (see WID (2017) for decreasing bottom 90 per cent income
share in OECD and US in the last decades). Corporations use marketing, the dependence
effect, consumer indoctrination, public opinion, private and public media, and influence on
politics and government to reduce regulations and to stimulate consumption. They provide
finance to incur consumer debt and impose revised sequence. As Pressman (2007) and
Porenta (2014) reason, all these combined and complex approaches ensure that corporations
can secure their investment and provide sufficient demand for their products and services.
Such a sufficient demand for corporate products and services is attained through
consumption.
In the second sector, consumption influences household debt and public debt. There are
multiple transmission mechanisms working here. The first is that corporate power, due to its
bargaining power towards workers on the one hand and its influencing the government to
dismantle the unions and workers’ bargaining power on the other hand, leads to a decline in
real wages. This is particularly noticeable when compared to a rise in productivity and
profits. Stagnant wages and growing consumerism and consumption increase the gap
between expenditures and incomes, forcing consumers into borrowing, which all leads to
higher household private debt. The second transmission mechanism is that, due to corporate
bargaining power towards workers and influence on the government, a distribution of
income and taxation of wealth and incomes have arisen that are in favour of the rich and
impoverishes workers. Because of a rise in consumption, and because of stagnant real wages,
the workers’ indebtedness grows. The consequence is that more people need social help.
Rising social transfers lead to a further rise in the public debt. On the other hand, there is an
inflow in the budget due to taxes on consumption, but this is only a fraction (around 20 per
cent) of the final price that consumers pay and it is expenditure for them. There is also an
additional transmission mechanism which works due to the imposition of financial
liberalization and supply-side economics by corporate power (John K. Galbraith, 1958;
Porenta, 2014). One of the consequences is a decrease in income taxes, wealth taxes and
corporate taxes. This leads to a drop in budgets’ incomes, and to a further rise in public debt.
The third sector is represented by household and public debt, and it influences the inequality.
Higher public debt hinders the government from investing in education, health and other
infrastructure, or at least from maintaining a satisfactory level. Such austerities mostly affect
the lower income population because they cannot afford to buy better education or health
services as the rich can. Higher household debt has as a result that people cannot invest in
their education or increase their savings and consequently their wealth and financial
26
independence. They are unable to improve their skills, economic and political positions or
their social mobility, and they thus stay trapped in vicious circle of poverty for generations.
Both effects are accountable for a drop in social mobility and a decrease in human capital;
they worsen people’s standards of living and increase the gap between the rich and the poor.
An additional transmission mechanism also works here. After the financial liberalization and
supply-side economics imposed by corporate power, income, wealth and corporate taxes
have decreased, which leads to an increase in top incomes and a decrease in stagnant incomes
at the bottom of the societal ladder (Dunn & Pressman, 2005; John K. Galbraith, 1958;
Porenta, 2014). Hence, the income and wealth inequality have increased.
In the fourth sector, inequality influences corporate power. People who are impoverished
and less equal compared to the production owners and rich capitalists represent a weaker
part in the economic bargaining process. Their collective bargaining power is dismantled, so
they cannot improve their position. They enter a bargaining process with their employers as
individuals, with a weak union or without one. Growing income inequality also leads to
workers’ inability to adapt to technological changes and prevents their investments in
education, thus disabling them to step out of a vicious circle of impoverishment. In the long
term, a worker must accept a lower wage or be satisfied with the existing one, without
expecting a rise in line with the firm’s productivity rise or profit. Alternatively, the worker
can leave the current job, but the job market is volatile. On the one hand, there are fewer
firms because of the process of concentration and centralization. On the other hand, the fact
that there are many unemployed workers inflicts additional pressure on those still employed
(OECD, 2017; Porenta, 2014). Corporations are always keen to take advantage of those facts.
Under such circumstances, income inequality causes a rise in corporate power.
1.3 Conclusion
In short, this chapter extends the existing literature with an analysis of corporate power and
its influence on consumption. I find that corporate power causes increased consumption by
using combined and complex approaches of advertising techniques in order to secure the
companies’ investment and provide sufficient demand for their products and services. The
advertising exploits some powerful human instincts, thus fostering consumerism and a
marketing-dominated culture. Next, rising consumerist consumption influences increasing
household and public debt with multiple transmission mechanisms that work simultaneously
and reinforce each other.
Growing household debt and public debt further increase inequality by hindering the
government from investing in education, health care and other infrastructure, and by
decreasing social transfers. A higher household debt also has as a result that people cannot
invest in their education or increase their savings and, consequently, their wealth and
27
financial independence. Finally, inequality leads to an increase in corporate power. People
who are impoverished and unequal in comparison to the production owners and rich
capitalist are also weaker in the bargaining process. They cannot improve their position, so
corporate power only rises. With rising corporate power, a new circle of causation begins.
The main system variables are accumulating in time, which causes slower economic growth,
political instability, and higher unemployment. It also causes social and health problems,
fewer educational opportunities, lower human capital and lower social mobility. Economic
implications behind this process show that such development cannot be economically and
socially sustainable.
To conclude, the theoretical work in this chapter provides some ideas regarding corporate
power and its influence on consumption, household and public debt, and inequality, but
clearly more work has to be done. In future research, this theoretical work could be
empirically tested, especially in terms of measuring corporate power and the empirical
testing of the relationships between those variables of the CCC model.

28
29
2 THEORETICAL SETUP OF EMPIRICAL MODEL OF
CUMULATIVE AND CIRCULAR CAUSATION
ABSTRACT: The aim of this chapter is the construction of a new economic model of
cumulative and circular causation (CCC). The main relationship of the economic model is
the impact of corporate power on consumption, debt and inequality. The analysis of the main
system variables, i.e. corporate power, consumption, debt and inequality, is followed by the
construction of the new model partial equations, along with the new variable of corporate
power. This is followed by a synthesis of model partial equations into a new economic model,
which can be econometrically tested. Since there is a cumulative and circular causation of
the main system variables, that means that dependent variables are also independent
variables in the next equation in the sequence. This economic model of CCC has four main
system variables and therefore forms a system of simultaneous equations.
Keywords: corporate power, cumulative circular causation, inequality, simultaneous
equations
JEL Classification: B52, E02, P10
30
2.1 Introduction
Corporate power stimulates increased consumption by using complex methods of
advertising and broader influence to secure the corporations’ investment and provide
sufficient demand for their services and products. Corporate advertising exploits powerful
human instincts, thereby fostering consumerism and a marketing-dominated culture.
Growing consumption, along with the induced social norm of ‘keeping up with Joneses’,
then leads to rising household debt, which in turn increases income inequality. Increased
inequality results in a further increase in corporate power, thus closing the loop of cumulative
and circular causation (CCC). Porenta (2017) elaborated these CCC relationships and built
a political-economic model of CCC.
This chapter goes one step further and builds a new economic and empirical model upon the
political-economic model of CCC. The economic model of CCC has four main system
variables and it can be econometrically tested. The main relationship of the economic model
is the impact of corporate power on consumption, debt and inequality. Those main system
variables are in a relationship of cumulative and circular causation, which means they are
connected in a loop. This produces a non-recursive model.
This chapter makes several original contributions to the literature. First, it is the first
empirical investigation of the CCC relationship, corporate power and its influence on
consumption, household debt and inequality. It builds a new comprehensive economic and
empirical model of the CCC relationships. Second, it extends our understanding of the trends
of rising corporate power and consumerism at the macro level, and of the former’s
transmission mechanisms.
The structure of the chapter is the following: first, a theoretical setup of the empirical model
will be formed by analysis of the main system variables, i.e. corporate power, consumption,
debt and inequality. This will be followed by the construction of the new model partial
equations. Finally, the new model partial equations will be merged into a new economic
model of CCC based on a system of simultaneous equations.
2.2 Theoretical setup of empirical model
In this chapter, the first step for the empirical testing of the political-economic model of CCC
will be performed. First, an analysis of the existing empirical literature review of partial
equations will be performed for all the variables. Existing partial models will be evaluated,
which will be followed by a construction of the new model partial equations. At the end, the
analysis of partial equations will be followed by a synthesis of partial equations into a new
economic (empirical) model. The new model will show the impact of corporate power on
31
consumption, debt and inequality. Henceforward, each of the four main system variables,
e.g. corporate power, consumption, debt and inequality, will be evaluated on the level of
function and as a partial equation of the model.
2.2.1 Analysis of the existing models for corporate power
The first main system variable in the model described here is corporate power. The literature
is scarce with regards to empirical studies and analyses of corporate power. There is no
common or standard measurement of corporate power, but there are some available metrics.
Grant (1997) proposed the following measures: (1) industry concentration ratios, (2)
aggregate concentration ratios, (3) ratio of the corporate interlocks/interlocking directorates
to the number of corporations, (4) ratio of the after-tax corporate profits to the personal or
national income, (5) ratio of the marginal product of labour to the real wage, (6) ratio of the
total government revenue derived from corporate profit taxes to the total tax revenue, and
(7) percentage of the unionized labour force. The shortcomings of the industry/aggregate
concentration ratios are: absence of information about the non-manufacturing sector,
especially in banking and finance industry, which outgrew the manufacturing sector
substantially; failing to account for the foreign competition, i.e. changes in foreign market
shares; incomplete time series; and failing to account for the changes in cross-industry
conglomerates, which is almost the standard for the big transnational corporations.
The third ratio is the ratio of the corporate interlocks/interlocking directorates to the number
of corporations. According to J. Scott (1985), the interlock is the ‘social’ relation between
two enterprises when one person is a member of the Board of Directors in both enterprises.
As Grant (1997) further argued, the shortcomings of the ratio of the corporate
interlocks/interlocking directorates to the number of corporations are the following: the
change in the number of interlocks could also be the consequence of the higher number of
new corporations, which increases the overall competition, and not from an increase in the
corporate power concentration, i.e. a growth in the aggregate ratio of the interlocks in an
economy does not indicate a general growth in corporate power; the importance of interlocks
differs due to the differences in power relationships within interlocking relations. The
shortcomings of the ratio of the after-tax corporate profits to the personal or national income
are: not all changes in after-tax corporate profits are due to the changes in corporate income
tax rates, e.g. changes in write-off depreciation pace, i.e. changes in tax laws; changes in
corporate policy, like sacrificing the short-term profits to gain and consolidate power;
foreign competition, which also offers corporations a leverage to stall or decrease wages.
The ratio of the marginal product of labour to the real wage measures the gap between labor
productivity and real wages. In the neoclassical theory, the marginal product of labor should
equal the real wage. If there is a gap, the reason is either imperfect competition or corporate
power (Grant, 1997). The shortcomings of this ratio are: the lack of a consistent measure of
32
the marginal product of labor that is measured directly; the need to account for interaction
with other corporations and the government, not only between labor and corporations.
The ratio of the total government revenue derived from corporate profit taxes to the total tax
government revenue seems to be a consistent and reasonable measure of the ‘political’
efforts of corporations, i.e. consistent indicator of the influence of corporations on the
government. The reasoning is the following; if corporate power is growing, the consequence
would be a decrease in the corporate income tax share of the total tax revenue over some
time. Such is the case for the U.S., where the corporate income tax share decreased from
18.3 per cent to 7. 1 per cent, from 1957 to 1991, respectively. On the other hand, the
corporate share of total GDP stayed relatively the same over the same period (Grant, 1997).
This leads to the inference that government policy was influenced by corporate power over
the same time. Potential shortcomings for this measure would be: the extent of tax avoidance
and tax evasion; the impact and extent of tax havens; and the passivity of the regulators and
government. But one can argue that these factors as well could only serve to increase
corporate power, like being its consequences.
Another assumption or reasoning would be regarding the historical struggle between
workers, i.e. unions, and corporations: if corporate power grows, the consequence would be
a decline of the labor unions. Potential shortcoming for this measure would be the extent to
which forces other than the rise of corporate power might cause the decline of the labor
unions, e.g. changes in conventional, unionized manufacturing jobs due to technological
changes. Nevertheless, new technology jobs and their workers or employees can also be
unionized, especially due to the increase in new information and social connectivity. In each
case, the decline in the organized labor unions increases corporate power. Thus, according
to Grant (1997), of these measures, (1) the ratio of the total government revenue derived
from corporate profit taxes to the total government tax revenue and (2) the percentage of the
unionized labour force seem to be the proper measures of corporate power. Availability of
the data for empirical testing and time series analysis would also favour these two measures
over other potential measures.
A comprehensive study of corporate power was also done by Roach (2007). Regarding the
measurement of corporate power, he considers the following measures: (1) industry
concentration ratios, (2) corporate economic statistics, (3) labour unions, and (4) corporate
tax and subsidy data. The corporate statistics, like revenues, profits, employment and
corporate assets, can be consistent and reasonable measures of the concentration of economic
power of the largest global corporations. An additional measure could be the effective
corporate tax rate, e.g. in the U.S. the nominal federal corporate tax rate on profit is 35 per
cent, but the real tax rates paid by corporations is much lower, going from 37.3 per cent in
1970 to 14.3 per cent in 2009 and 19.7 per cent in 2015. The effective corporate tax rate is
the actual tax rate paid after deducting all the subsidies, credits, rebates, tax breaks and other
33
benefits from the local or federal government. Of these four measures, the corporate
economic statistics seem to be the proper measures of corporate power due to the
straightforwardness and clarity of the data. These corporate data are a clear indicator of
corporate power. On the other hand, the power of the labour unions, i.e. labour union
densities and the corporate tax data, similar to the two measures proposed by (Grant, 1997),
would be better predictors of corporate power due to its potential shortcomings.
Corporate power, increased by transnational production and liberalization, results in an
enhanced bargaining position with respect to the labor force. As Cowling and Tomlinson
(2005) argued, this was obtained through increased corporate influence on governments in
order to change employment legislation, combined with proper corporate strategy. This
strategy included countervailing the increased power of the labor unions, attained during the
Golden Age, the three prosperous decades after the WWII. In the 1970s, corporations
increased the fragmentation of production through multi-plant operations, franchising and
subcontracting. To economize the costs, the production was moved away from organized
labor, i.e. unions. First, within countries, then regionally, and finally, globally. A good
example is the U.S., where production moved from the north-east to the south, then with the
North American Free Trade Area (NAFTA) agreement, further south to Mexico, then to
Latin America, and then globally, to Asia. The corporations are using the so called ‘divide
and rule’ strategy to reduce the labor costs (Cowling & Sugden, 1994): they threaten to
relocate the productions plant when unions are too aggressive. Since they already have multi-
plant operations, closing a ‘problematic’ plant works as an efficient threat towards workers
and their unions. A further empirical study from Scherer, Beckenstein, Kaufer, Murphy, and
Bougeon-Maassen (1975) has shown that firms with only one-plant operation were punished
by diminished bargaining power towards unions, whereas corporations with multi-plant
operations enjoyed increasing power. That this ‘divide and rule’ strategy is not an empty
threat was proved by Addison, Heywood, and Xiangdong (2003). They found a strong and
positive association between two measures of unionism, union recognition for collective
bargaining purposes and union coverage, and plant closings. Where the existence of trade
unions was strong and active the plants were more likely to be closed. On the other hand,
the trade union activity had no effect on the closing of the plants in the one-plant operation
corporations. Similarly, Peoples and Sugden (2000) observed that the ‘divide and rule’
strategy is a significant factor in corporations’ decision to manufacture in more than one
country, while Coffey and Tomlinson (2003) concluded that Japanese corporations first used
domestic subcontracting and later global outsourcing to divide and rule the workers. The
consequences of such a corporate strategy are decreased or stagnant labor costs, i.e. wages.
Corporate influence on governments varies from changing employment legislation to curtail
the bargaining power of the workers, to regulatory legislation. As Mercer (1995) illustrates,
the competition policies have been formed by the strategies of powerful business interests.
34
The corporations have interests in the design and implementation of regulatory policy, and
as Cowling and Tomlinson (2005) further state, such ‘regulatory capture’ suggests that the
performance of the regulators will mainly reflect the benefits of the regulated. The next
example of corporate influence on government are the growing transnational corporations
who influence their corporate power over the states in the context of globalization (e.g. multi-
plant transnational operations, franchising and subcontracting). They employ ‘divide and
rule’ strategy towards governments, threatening to invest in other countries as a bargaining
leverage (Cowling & Sugden, 1994; Dicken, 2015). They demand infrastructural support,
investment subsidies, favorable tax regimes and employment legislation, etc., to maximize
their profits and corporate influence, i.e. corporate power. Through such a strategy,
transnational corporations have managed to create an ‘incentive’ competition between
countries for transnational investments. Some of the consequences of the transnational
nature of the corporations are: (1) stagnant wages, (2) weaker unions, (3) increased corporate
power, (4) international transfer pricing, and (5) decreased global corporate tax liabilities.
Decreased corporate tax liabilities were also studied by Farnsworth and Fooks (2015). They
argue that globalization has increased corporate tax competition amongst states and enabled
widespread corporate tax avoidance. Some of the biggest corporations pay little or no tax
and in some cases with the active support of governments. This is the consequence of
successful lobbying form transnational corporations in the past 30 years. They have lobbied
for decreases in corporate taxes and increases in tax benefits. Additionally, transnational
corporations are regularly involved in tax avoidance arrangements that result in actual tax
rates which are considerably lower than the nominal rates. On the one hand, there is a
successful lobbying and corporate influence on governments; on the other hand, there is a
professional infrastructure of tax planning and avoidance, which aligns with the corporate
demand for reduced tax liabilities. According to Swank (2002), the corporate tax rates have
been falling steadily since the 1960s across most OECD countries. In the UK, the corporation
tax dropped from 52 per cent in 1980 to 22 per cent in 2013. The reasons for such a
development are a mixture of effective corporate lobbying and “structural pressures on
successive governments eager to induce businesses to invest within their jurisdictions.
Structural pressure arises from the fact that overall tax revenues, including taxes on general
incomes and consumption, are ultimately raised on such investment and has its origins in the
relaxation of capital and exchange controls” (Farnsworth & Fooks, 2015), p.3). The
consequence of such capital mobility is that companies can simply move their tax liabilities
to countries with more favorable taxes, without relocating their production.
Overesch and Rincke (2011) conducted an analysis of the tax competition, as well as of
economic and financial openness, using data for 32 European countries from 1983 to 2006.
The results show strong evidence for competition over statutory tax rates (STR), weaker
evidence for competition over effective average tax rates (EATR) and no evidence for
35
competition over effective marginal tax rates (EMTR). The reasoning is that countries would
rather compete for paper profits and profitable firms, than for marginal investments. Such
international tax rivalry appears to be the main force behind the striking decrease in corporate
tax rates in Europe in the previous decades. Each of the three tax rates fell more than 20 per
cent from 1983 to 2006. The mean statutory corporate tax rate decreased from 49.2 per cent
in 1983 to 27.2 per cent in 2008, for example. The study shows that without the tax
competition imposed by transnational corporations, the mean statutory rate would be 40.0
per cent in 2006, compared to the actual level of 27.5 per cent. They found no evidence that
countries that have become more economically and financially open have reduced their tax
rates more. Consequently, the downward trend in corporate tax rates appears to be primarily
a result of tax competition among governments.
The next factor that significantly contributed to the change in corporate power is financial
deregulation, i.e. financial liberalization. Abiad et al. (2010a) constructed the financial
liberalization index. It was derived from a database of financial reforms covering 91
economies from 1973 to 2005, where seven different dimensions of financial sector policy
were considered. These seven dimensions of financial liberalization were aggregated in a
single liberalization index for each individual economy and for each consecutive year. The
results show that financial reforms progressed significantly in all countries over the period
and that countries with higher income remained more liberalized than lower income
countries. Similarly, Kaminsky and Schmukler (2003) presented new measures of financial
liberalization, using a database on financial liberalization for 28 countries, from January
1973 to June 1999. They captured numerous aspects of global financial liberalization, such
as the deregulation of the capital account, the stock market and the financial sector. The
measures show that financial markets are on average less regulated and that the pace of
financial liberalization is uninterrupted. Likewise, Schindler (2009) measured financial
integration by constructing a panel data set of measures of de jure restrictions on cross-
border financial transactions for 91 countries from 1995 to 2005. The overall average trends
of the main indices show that there is a broad trend toward increased de jure liberalization
of financial flows over the period.
After analyzing the existing models for corporate power, the final evaluation and
construction of the new model partial equation of corporate power comes next. Inference is
based on logical reasoning, observed causalities and consequences, and relevance. Some
factors are more relevant and are to be assumed to have better explanatory power on the
dependant variable than some other factors. Nevertheless, all presented factors help to better
understand the dynamics of the analysed dependent variable.
The final evaluation shows that corporate influence on governments varies from changing
employment legislation to changing the regulatory legislation. Financial deregulation and
financial liberalization led to financial globalization, which increased the corporate power
36
of the transnational corporations. Additionally, one of the consequences of financial
deregulation is also higher household debt (Green, Harper, & Smirl, 2009; Kim, Lee, Son,
& Son, 2014; RBA, 2003), the result of decreased restrictions on borrowing and increased
relative consumption (Alvarez-Cuadrado & Van Long, 2011; Brown, Gray, & Roberts,
2015; Palley, 2010). This is accompanied by stagnant real wages and income distribution
changes, i.e. income inequality, which has resulted in the increased bargaining power of the
corporations and their owners (Barba & Pivetti, 2009; Cynamon & Fazzari, 2013; Darity,
2008; Fieldhouse, 2013; Harris & Sammartino, 2011; Hungerford, 2013; Iacoviello, 2008;
Kumhof, Rancière, & Winant, 2015; Mishel, Bivens, Gould, & Shierholz, 2012; Mishel &
Shierholz, 2013; Montgomerie, 2006; Piketty & Saez, 2003; Rajan, 2010; Reich, 2013).
Therefore, the financial liberalization index and income inequality would be good predictors
of changes in corporate power.
Furthermore, as corporate power obtains a higher bargaining position with regards to the
labor force, due to increased transnational production, liberalization, corporate influence on
governments, and proper corporate strategy, such as ‘divide and rule’ (Addison et al., 2003;
Coffey & Tomlinson, 2003; Cowling & Sugden, 1994; Cowling & Tomlinson, 2005; Peoples
& Sugden, 2000; Scherer et al., 1975), the trade union density would be a good explanatory
variable of corporate power. In the context of growing transnational production and
globalization corporations also employ the ‘divide and rule’ strategy on states, which results
in reduced global corporate tax liabilities (Cowling & Sugden, 1994; Cowling & Tomlinson,
2005; Dicken, 2015; Farnsworth & Fooks, 2015; Mercer, 1995; Overesch & Rincke, 2011;
Swank, 2002). Consequently, the measure of the effective corporate tax would be a good
predictor of the changes in corporate power.
2.2.2 Estimation model for corporate power
In our model, we consider factors from relevant theories which were elaborated in the
previous section. The variable of corporate power is a variable construct composed of
corporate indicators of total assets (TA), total sales (TS) and employment (TE), from 100
largest non-financial transnational corporations. Three corporate indicators are used by
UNCTAD (1993-2015) for illustrating corporate performance and ranking for the top 100
largest non-financial transnational corporations. Financial firms are not included because of
the different economic functions of assets of financial and non-financial firms. The corporate
power variable is derived from factor analysis, which is a statistical method of data reduction
among observed and correlated variables. Common variance between observed variables is
in turn reflected in the unobserved, latent score. Such a linear combination of many observed
variables results in one factor, a new variable construct.
37
The mathematical form of the corporate power variable derived from the factor analysis is:
𝐶𝑃𝑡 = 𝑙1𝑇𝐴𝑡 + 𝑙2𝑇𝑆𝑡 + 𝑙3𝑇𝐸𝑡 (1)
The mathematical form of the corporate power function is:
𝐶𝑃𝑡 = 𝑓(𝐼𝑁𝐸𝑡, 𝐹𝐿𝐼𝑡 , 𝑇𝑈𝐷𝑡, 𝐸𝐶𝑇𝑡 ) (2)
where 𝐶𝑃𝑡 is corporate power and is a function of the following variables: 𝐼𝑁𝐸𝑡 is income
inequality, 𝐹𝐿𝐼𝑡 is financial liberalization index, 𝑇𝑈𝐷𝑡 is trade union density and 𝐸𝐶𝑇𝑡 is
effective corporate tax. The variable of income inequality explains the effect of income
inequality on corporate power, the variable of financial liberalization index captures the
consequences of financial deregulation and financial liberalization, whereas the variable of
trade union density considers the changes in the trade union density. The variable of effective
corporate tax explains the changes in corporate power coming from the deviations in
effective corporate taxes. It is expected for 𝐼𝑁𝐸𝑡 and 𝐹𝐿𝐼𝑡 to have positive signs and for
𝑇𝑈𝐷𝑡 and 𝐸𝐶𝑇𝑡 to have negative signs of coefficients.
In the linear regression form the corporate power function is written as:
𝐶𝑃𝑡 = 𝛽0 + 𝛽1𝐼𝑁𝐸𝑡 + 𝛽2𝐹𝐿𝐼𝑡 + 𝛽3𝑇𝑈𝐷𝑡 + 𝛽4𝐸𝐶𝑇𝑡 + 𝑢𝑡 (3)
where 𝛽0 is the intercept, 𝛽1 to 𝛽4 are the parameters, i.e. the coefficients of the X variables
(in matrix form) and 𝑢𝑡 is the error term. The variables 𝐼𝑁𝐸𝑡, 𝐹𝐿𝐼𝑡, 𝑇𝑈𝐷𝑡 and 𝐸𝐶𝑇𝑡 are
observed and we assume that we have a random sample of size n with independent
observations. The variable 𝐶𝑃𝑡 is a dependent and explained variable (the y variable),
whereas 𝐼𝑁𝐸𝑡, 𝐹𝐿𝐼𝑡, 𝑇𝑈𝐷𝑡 and 𝐸𝐶𝑇𝑡 are independent and explanatory variables. These are
systematic components of a regression model. The error term 𝑢𝑡 is unobserved.
2.2.3 Analysis of the existing models for consumption
The second main system variable in the model described here is consumption. The main
existing theories analyse the relationship between consumption and income, which is
modelled with the consumption function. The simple consumption function is a
mathematical formula representing the relationship between consumer spending (C) and real
disposable income (Yd), that is income after taxes and transfer payments. The simple
mathematical form is:
𝐶 = 𝑓(𝑌𝑑) (4)
38
It was introduced by Keynes (1936) and is also known as the absolute income hypothesis
(AIH):
𝐶𝑡 = 𝑐𝑌𝑡 (5)
where Ct is consumption at time t, c is marginal propensity to consume and Yt is real
disposable income at time t. Marginal propensity to consume is the slope of equation (6) and
it measures induced consumption, i.e. the amount of increased consumption coming from
additional disposable income. The proportion can have a value of 0< c <1, where a value
above 1 is possible only with some borrowing. Its linear form used in simple Keynesian
models is:
𝐶𝑡 = 𝑎 + 𝑐𝑌𝑡 (6)
where 𝑎 is the autonomous consumption, i.e. consumption independent of disposable
income. Marginal propensity to consume is smaller than the average propensity to consume,
which is the consumption divided by the disposable income. This is because autonomous
consumption does not change with disposable income. Such a simple model has some
success in the short term but fails in the long term, e.g. marginal propensity to consume is
not constant. This has led to the development of some other theories where additional factors
are considered. There are three mainstream theories based on the income dependent
consumption function developed by Keynes: (1) relative income hypothesis (RIH)
developed by Duesenberry (1949), (2) life-cycle theory developed by Modigliani and
Brumberg (1954) and (3) permanent income hypothesis (PIH) developed by Friedman
(1957b).
Keynes’ model was based on the hypothesis that with increasing income, individuals
consume a decreasing percentage of their income and save an increasing percentage of their
income. This was shown in cross-sectional consumption data where the rich in the
population saved a higher share of their income than the poor did. Nevertheless, this model
has a contradiction, namely, the aggregate saving rate does not increase over time as
aggregate income increases. Duesenberry reasoned that the relative income hypothesis could
explain both the cross-sectional and time series evidence and further argued that an
individual’s desire to increase his consumption expenditure is subject to the ratio of the
individual’s consumption to a weighted average of the consumption of the others. He made
two conclusions: (1) aggregate saving rate is independent of aggregate income, which is
consistent with the time series evidence; and (2) the propensity to save of an individual is an
increasing function of the individual’s percentile position in the income distribution, which
is consistent with the cross-sectional evidence. The relative income hypothesis argues that
the utility an individual arises from a given consumption level depends on its relative
39
magnitude in the society, i.e. relative to the average consumption, rather than its absolute
level. This has been derived from the long recognised notion of psychologists and
sociologists that individuals actually care about their status (Darity, 2008).
The relative income hypothesis theory reasons that consumption decisions are motivated by
‘relative’ consumption concerns, or, more precisely, an individual's inclination to
consumption is directed more by his income in relation to others than by an abstract standard
of living – i.e. keeping up with the Joneses may be a more powerful inducement. There are
strong tendencies in society for people to emulate their neighbours and to strive toward a
higher standard of living. Consumption reached in previous periods also influences the
present consumption, not only present levels of absolute and relative income, and it is hard
to decrease a level of consumption once achieved. So in the relative income hypothesis the
consumption is a function of current income relative to the peak income previously achieved
(Duesenberry, 1949). That means that there is some path dependency and consumption
desires depend on habits which are slow to change.
The following is an example of a contemporary basic relative income hypothesis model used
by Brown et al. (2015), regarding the relation between relative income and an individual's
utility:
𝑈𝑖𝑡 = 𝛼 + 𝛽𝑦𝑖𝑡 + 𝛾𝑦𝑖𝑡𝑟 + ∑ 𝜃𝑘𝑥𝑘,𝑖𝑡
𝑘
+ 휀𝑖𝑡 (7)
where i subscripts the individual and t, time. U is a proxy for utility, such as self-reported
happiness or life satisfaction. y is own income, yr is relative income (income of the reference
group), x is a set of k conditioning variables and ε is the error term. The study showed that
the relative income effect is sensitive to the definition of the reference group and to the utility
proxy and estimation method, as well as that the relative income hypothesis has found
inconsistent effects. While there are many studies of relative income, with own income
generally found to have a positive effect on utility, there is no consensus as to the sign on
relative income. Clark, Westergård-Nielsen, and Kristensen (2009) found a positive relative
income effect, Senik (2008) found a positive relative income effect for the eastern and Baltic
countries and a negative relative income effect for the western countries, whereas Luttmer
(2005) found a negative relative income effect. The rational for the latter is that the negative
effect of increases in neighbours’ earnings on one’s own well-being is most likely caused by
interpersonal preferences, that is, people having utility functions that depend on relative
consumption in addition to absolute consumption.
One of the first to consider the consumption smoothing over people’s lifecycle was the life-
cycle theory developed by Modigliani and Brumberg (1954), which assumes that household
members choose their current expenditures optimally, taking account of their spending
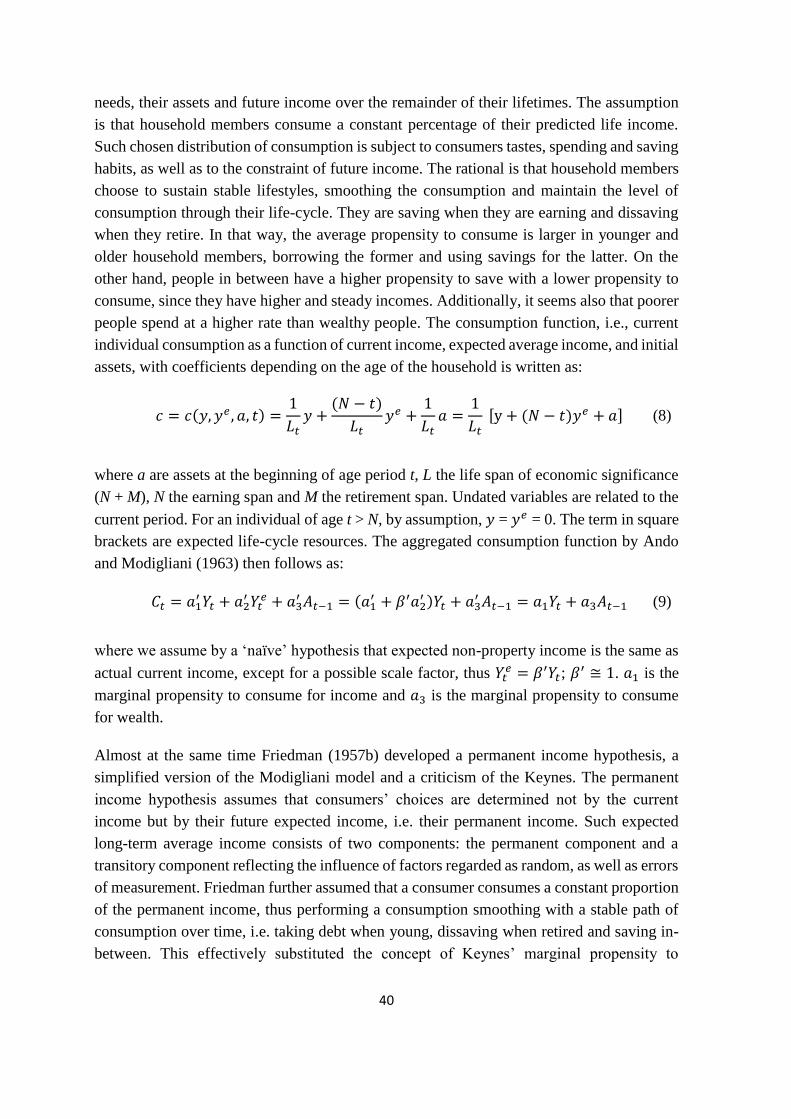
40
needs, their assets and future income over the remainder of their lifetimes. The assumption
is that household members consume a constant percentage of their predicted life income.
Such chosen distribution of consumption is subject to consumers tastes, spending and saving
habits, as well as to the constraint of future income. The rational is that household members
choose to sustain stable lifestyles, smoothing the consumption and maintain the level of
consumption through their life-cycle. They are saving when they are earning and dissaving
when they retire. In that way, the average propensity to consume is larger in younger and
older household members, borrowing the former and using savings for the latter. On the
other hand, people in between have a higher propensity to save with a lower propensity to
consume, since they have higher and steady incomes. Additionally, it seems also that poorer
people spend at a higher rate than wealthy people. The consumption function, i.e., current
individual consumption as a function of current income, expected average income, and initial
assets, with coefficients depending on the age of the household is written as:
𝑐 = 𝑐(𝑦, 𝑦𝑒 , 𝑎, 𝑡) =
1
𝐿𝑡𝑦 +
(𝑁 − 𝑡)
𝐿𝑡𝑦𝑒 +
1
𝐿𝑡𝑎 =
1
𝐿𝑡 [y + (𝑁 − 𝑡)𝑦𝑒 + 𝑎] (8)
where a are assets at the beginning of age period t, L the life span of economic significance
(N + M), N the earning span and M the retirement span. Undated variables are related to the
current period. For an individual of age t > N, by assumption, 𝑦 = 𝑦𝑒 = 0. The term in square
brackets are expected life-cycle resources. The aggregated consumption function by Ando
and Modigliani (1963) then follows as:
𝐶𝑡 = 𝑎1′ 𝑌𝑡 + 𝑎2
′ 𝑌𝑡𝑒 + 𝑎3
′ 𝐴𝑡−1 = (𝑎1′ + 𝛽′𝑎2
′ )𝑌𝑡 + 𝑎3′ 𝐴𝑡−1 = 𝑎1𝑌𝑡 + 𝑎3𝐴𝑡−1 (9)
where we assume by a ‘naïve’ hypothesis that expected non-property income is the same as
actual current income, except for a possible scale factor, thus 𝑌𝑡𝑒 = 𝛽′𝑌𝑡; 𝛽′ ≅ 1. 𝑎1 is the
marginal propensity to consume for income and 𝑎3 is the marginal propensity to consume
for wealth.
Almost at the same time Friedman (1957b) developed a permanent income hypothesis, a
simplified version of the Modigliani model and a criticism of the Keynes. The permanent
income hypothesis assumes that consumers’ choices are determined not by the current
income but by their future expected income, i.e. their permanent income. Such expected
long-term average income consists of two components: the permanent component and a
transitory component reflecting the influence of factors regarded as random, as well as errors
of measurement. Friedman further assumed that a consumer consumes a constant proportion
of the permanent income, thus performing a consumption smoothing with a stable path of
consumption over time, i.e. taking debt when young, dissaving when retired and saving in-
between. This effectively substituted the concept of Keynes’ marginal propensity to
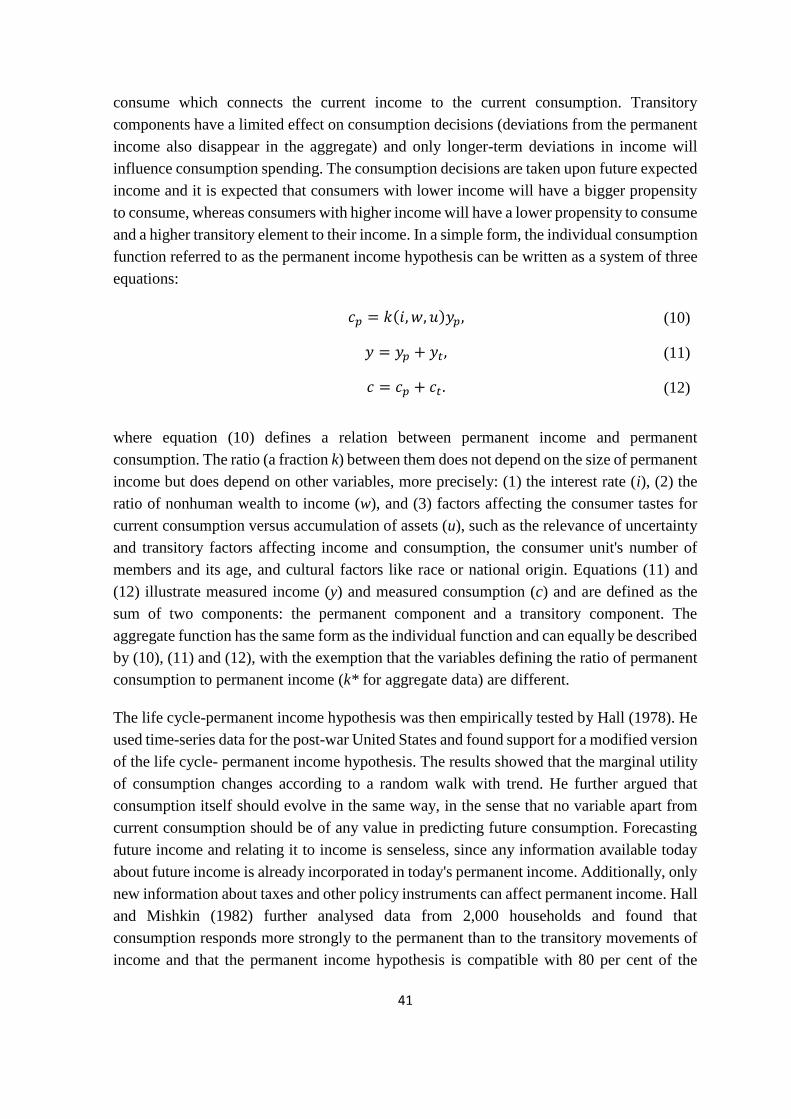
41
consume which connects the current income to the current consumption. Transitory
components have a limited effect on consumption decisions (deviations from the permanent
income also disappear in the aggregate) and only longer-term deviations in income will
influence consumption spending. The consumption decisions are taken upon future expected
income and it is expected that consumers with lower income will have a bigger propensity
to consume, whereas consumers with higher income will have a lower propensity to consume
and a higher transitory element to their income. In a simple form, the individual consumption
function referred to as the permanent income hypothesis can be written as a system of three
equations:
𝑐𝑝 = 𝑘(𝑖, 𝑤, 𝑢)𝑦𝑝, (10)
𝑦 = 𝑦𝑝 + 𝑦𝑡, (11)
𝑐 = 𝑐𝑝 + 𝑐𝑡. (12)
where equation (10) defines a relation between permanent income and permanent
consumption. The ratio (a fraction k) between them does not depend on the size of permanent
income but does depend on other variables, more precisely: (1) the interest rate (i), (2) the
ratio of nonhuman wealth to income (w), and (3) factors affecting the consumer tastes for
current consumption versus accumulation of assets (u), such as the relevance of uncertainty
and transitory factors affecting income and consumption, the consumer unit's number of
members and its age, and cultural factors like race or national origin. Equations (11) and
(12) illustrate measured income (y) and measured consumption (c) and are defined as the
sum of two components: the permanent component and a transitory component. The
aggregate function has the same form as the individual function and can equally be described
by (10), (11) and (12), with the exemption that the variables defining the ratio of permanent
consumption to permanent income (k* for aggregate data) are different.
The life cycle-permanent income hypothesis was then empirically tested by Hall (1978). He
used time-series data for the post-war United States and found support for a modified version
of the life cycle- permanent income hypothesis. The results showed that the marginal utility
of consumption changes according to a random walk with trend. He further argued that
consumption itself should evolve in the same way, in the sense that no variable apart from
current consumption should be of any value in predicting future consumption. Forecasting
future income and relating it to income is senseless, since any information available today
about future income is already incorporated in today's permanent income. Additionally, only
new information about taxes and other policy instruments can affect permanent income. Hall
and Mishkin (1982) further analysed data from 2,000 households and found that
consumption responds more strongly to the permanent than to the transitory movements of
income and that the permanent income hypothesis is compatible with 80 per cent of the
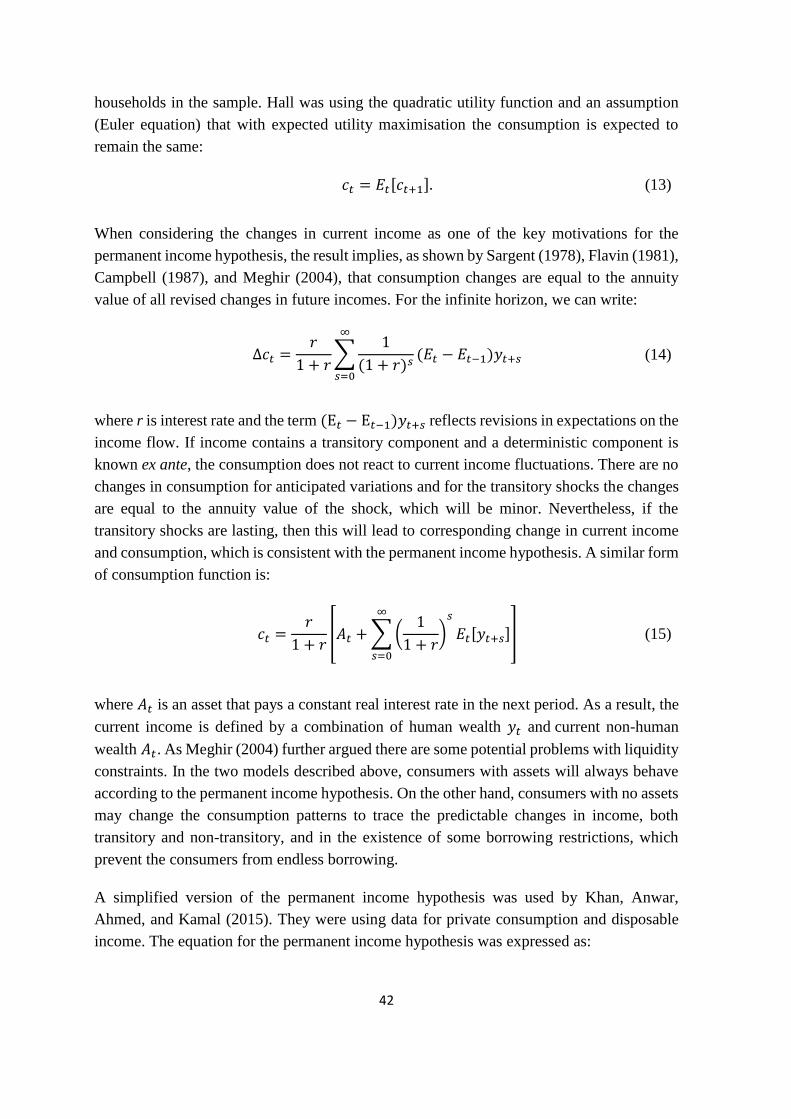
42
households in the sample. Hall was using the quadratic utility function and an assumption
(Euler equation) that with expected utility maximisation the consumption is expected to
remain the same:
𝑐𝑡 = 𝐸𝑡[𝑐𝑡+1]. (13)
When considering the changes in current income as one of the key motivations for the
permanent income hypothesis, the result implies, as shown by Sargent (1978), Flavin (1981),
Campbell (1987), and Meghir (2004), that consumption changes are equal to the annuity
value of all revised changes in future incomes. For the infinite horizon, we can write:
∆𝑐𝑡 =
𝑟
1 + 𝑟∑
1
(1 + 𝑟)𝑠
∞
𝑠=0
(𝐸𝑡 − 𝐸𝑡−1)𝑦𝑡+𝑠 (14)
where r is interest rate and the term (E𝑡 − E𝑡−1)𝑦𝑡+𝑠 reflects revisions in expectations on the
income flow. If income contains a transitory component and a deterministic component is
known ex ante, the consumption does not react to current income fluctuations. There are no
changes in consumption for anticipated variations and for the transitory shocks the changes
are equal to the annuity value of the shock, which will be minor. Nevertheless, if the
transitory shocks are lasting, then this will lead to corresponding change in current income
and consumption, which is consistent with the permanent income hypothesis. A similar form
of consumption function is:
𝑐𝑡 =𝑟
1 + 𝑟[𝐴𝑡 + ∑ (
1
1 + 𝑟)
𝑠∞
𝑠=0
𝐸𝑡[𝑦𝑡+𝑠]] (15)
where 𝐴𝑡 is an asset that pays a constant real interest rate in the next period. As a result, the
current income is defined by a combination of human wealth 𝑦𝑡 and current non-human
wealth 𝐴𝑡. As Meghir (2004) further argued there are some potential problems with liquidity
constraints. In the two models described above, consumers with assets will always behave
according to the permanent income hypothesis. On the other hand, consumers with no assets
may change the consumption patterns to trace the predictable changes in income, both
transitory and non-transitory, and in the existence of some borrowing restrictions, which
prevent the consumers from endless borrowing.
A simplified version of the permanent income hypothesis was used by Khan, Anwar,
Ahmed, and Kamal (2015). They were using data for private consumption and disposable
income. The equation for the permanent income hypothesis was expressed as:
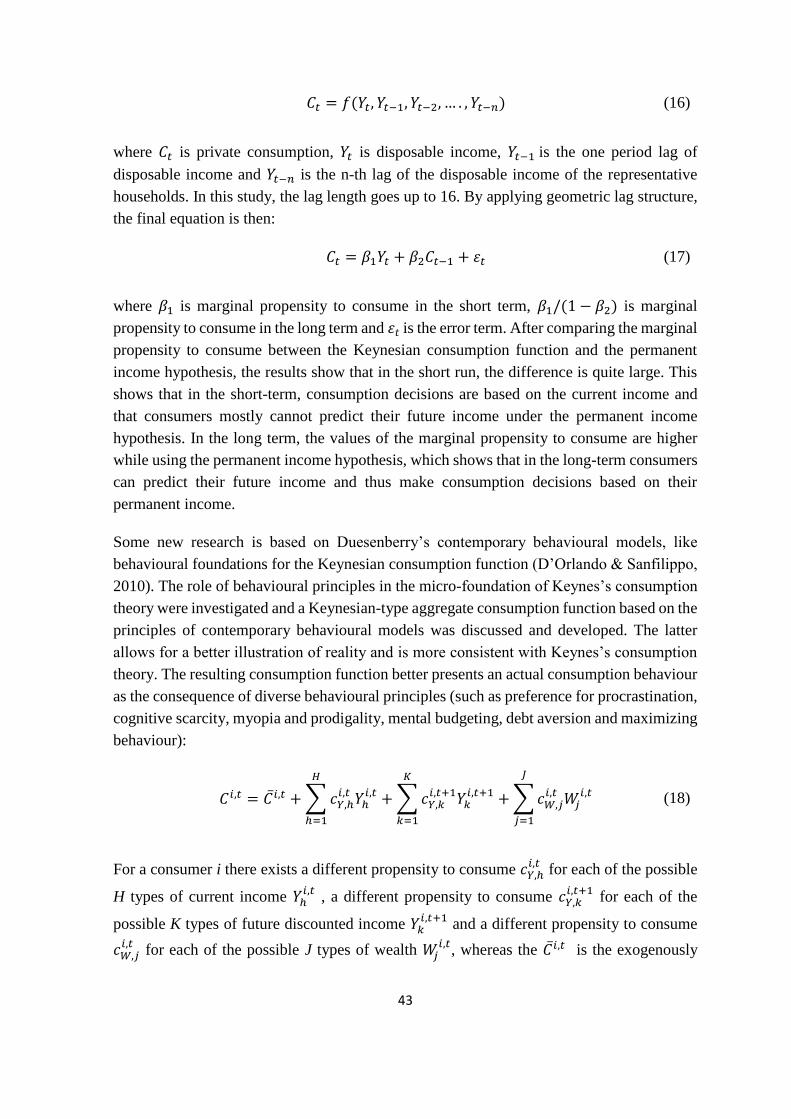
43
𝐶𝑡 = 𝑓(𝑌𝑡, 𝑌𝑡−1, 𝑌𝑡−2, … . , 𝑌𝑡−𝑛) (16)
where 𝐶𝑡 is private consumption, 𝑌𝑡 is disposable income, 𝑌𝑡−1 is the one period lag of
disposable income and 𝑌𝑡−𝑛 is the n-th lag of the disposable income of the representative
households. In this study, the lag length goes up to 16. By applying geometric lag structure,
the final equation is then:
𝐶𝑡 = 𝛽1𝑌𝑡 + 𝛽2𝐶𝑡−1 + 휀𝑡 (17)
where 𝛽1 is marginal propensity to consume in the short term, 𝛽1/(1 − 𝛽2) is marginal
propensity to consume in the long term and 휀𝑡 is the error term. After comparing the marginal
propensity to consume between the Keynesian consumption function and the permanent
income hypothesis, the results show that in the short run, the difference is quite large. This
shows that in the short-term, consumption decisions are based on the current income and
that consumers mostly cannot predict their future income under the permanent income
hypothesis. In the long term, the values of the marginal propensity to consume are higher
while using the permanent income hypothesis, which shows that in the long-term consumers
can predict their future income and thus make consumption decisions based on their
permanent income.
Some new research is based on Duesenberry’s contemporary behavioural models, like
behavioural foundations for the Keynesian consumption function (D’Orlando & Sanfilippo,
2010). The role of behavioural principles in the micro-foundation of Keynes’s consumption
theory were investigated and a Keynesian-type aggregate consumption function based on the
principles of contemporary behavioural models was discussed and developed. The latter
allows for a better illustration of reality and is more consistent with Keynes’s consumption
theory. The resulting consumption function better presents an actual consumption behaviour
as the consequence of diverse behavioural principles (such as preference for procrastination,
cognitive scarcity, myopia and prodigality, mental budgeting, debt aversion and maximizing
behaviour):
𝐶𝑖,𝑡 = 𝐶̅𝑖,𝑡 + ∑ 𝑐𝑌,ℎ𝑖,𝑡 𝑌ℎ
𝑖,𝑡
𝐻
ℎ=1
+ ∑ 𝑐𝑌,𝑘𝑖,𝑡+1𝑌𝑘
𝑖,𝑡+1
𝐾
𝑘=1
+ ∑ 𝑐𝑊,𝑗𝑖,𝑡 𝑊𝑗
𝑖,𝑡
𝐽
𝑗=1
(18)
For a consumer i there exists a different propensity to consume 𝑐𝑌,ℎ𝑖,𝑡
for each of the possible
H types of current income 𝑌ℎ𝑖,𝑡
, a different propensity to consume 𝑐𝑌,𝑘𝑖,𝑡+1
for each of the
possible K types of future discounted income 𝑌𝑘𝑖,𝑡+1
and a different propensity to consume
𝑐𝑊,𝑗𝑖,𝑡
for each of the possible J types of wealth 𝑊𝑗𝑖,𝑡
, whereas the 𝐶̅𝑖,𝑡 is the exogenously
44
given quantity of consumption that is not included in the list of causes and is not a stochastic
error term.
Regardless of empirical proofs and common sense intuition, the relative income hypothesis
was supplanted by the permanent income hypothesis. Alvarez-Cuadrado and Van Long
(2011) found out that regardless of theoretical dominance of the permanent income
hypothesis, the empirical case in favor of the permanent income hypothesis is weak.
Contrary to one of its basic implications, the evidence suggests that rich households save a
higher proportion of their permanent income than poor households. The model proposed is
an overlapping-generations economy with heterogeneous wealth levels, where households
ascend their utility from relative consumption, inheritance and leisure. Thus, an individual’s
consumption is motivated by the comparison of his lifetime income and of his reference
group. This can be referenced as a permanent income version of Duesenberry’s relative
income hypothesis. Further, the savings rate increases with income across households while
aggregate savings are independent of the income distribution.
An additional attempt to synthesize the advantages of different models is a synthetic
Keynes–Duesenberry–Friedman model as shown by Palley (2010). This model, named as
the ‘relative permanent income’ theory of consumption, produces patterns of consumption
spending consistent with both empirical results from cross-section data showing high-
income households have a higher propensity to save and long-run time series data for
aggregate consumption. The novelty is that it makes household consumption decisions
depend on relative permanent income. Individual household consumption spending is:
𝐶𝑖,𝑡 = 𝑐(𝑌𝑖,𝑡/𝑌𝑡)𝑌𝑖,𝑡 (19)
where 𝐶𝑖,𝑡 is consumption of household i in period t, c is marginal propensity to consume,
𝑌𝑖,𝑡 is disposable permanent income of household i in period t, and 𝑌𝑡 average disposable
permanent income in period t. The model suggests that consumption decisions are motivated
by ‘relative’ consumption concerns or ‘keeping up with the Joneses’, therefore a potential
redistribution of income to lower income households is likely to have a net positive effect
on aggregate demand. Policy that constrains emulation behaviour can consequently improve
social welfare. Consumption patterns are also subject to habit and are slow to fall in the face
of income reductions. In effect, households are partially engaged in a form of consumption
‘arms race’. The rich try to increase relative consumption, while lower income households
try to keep up with the Joneses.
One of the shortcomings of the permanent income hypothesis are liquidity constraints. The
consumers cannot access the loan market so easily in order to borrow money and that access
could even be denied in many cases. On the other hand, they also cannot sell their assets
45
quickly and at a good price, in order to get additional income for potential consumption.
Those considerations have led to some improved and extended models. As presented above,
some of new models are also grounded on behavioural economics and Duesenberry's relative
income hypothesis, and include many relevant behavioural principles. These three
mainstream theories from Duesenberry, Modigliani and Brumberg, and Friedman, who were
all developed upon Keynes’ income dependent consumption function, in fact contributed to
a better understanding of consumption. Nevertheless, none of them developed a definitive
consumption function.
After analyzing the existing models for consumption, the final evaluation and construction
of the new model partial equation of consumption follow. Inference is based on logical
reasoning, observed causalities and consequences, and relevance. Some factors are more
relevant and are to be assumed to have better explanatory power on the dependant variable
than some other factors. Nevertheless, all presented factors help to better understand the
dynamics of the analysed dependent variable. The final evaluation shows that consumption
decisions driven by ‘relative’ consumption concerns, i.e. an individual's inclination to
consumption motivated more by his income in relation to others than by an abstract standard
of living or, in other words, keeping up with the Joneses (Alvarez-Cuadrado & Van Long,
2011; D’Orlando & Sanfilippo, 2010; Duesenberry, 1949; Palley, 2010), lead to the
conclusion that the variable of corporate power would be a good predictor of the
consumption function. Additional factors that can explain consumption decisions are also
their initial assets, i.e. wealth and the interest rate (Ando & Modigliani, 1963; Campbell,
1987; Flavin, 1981; Friedman, 1957b; Meghir, 2004; Modigliani & Brumberg, 1954;
Sargent, 1978), thus including wealth and the interest rate as explanatory variables of the
consumption function would be reasonable.
2.2.4 Estimation model for consumption
In our model, we consider factors from relevant theories, based on an income dependent
consumption function. The mathematical form of the consumption function is:
𝐶𝑡 = 𝑓(𝐶𝑃𝑡, 𝑌𝑡 , 𝑖𝑡, 𝑊𝑡) (20)
where 𝐶𝑡 is household consumption expenditure and is a function of the following variables:
𝐶𝑃𝑡 is a variable of corporate power, 𝑌𝑡 is real disposable income, 𝑖𝑡 is interest rate and 𝑊𝑡
is wealth, i.e. net assets. The variable of corporate power, as a construct of corporate
indicators, considers the behavioural principles which are stemming from the relative
comparison of the consumers, i.e. ‘keeping up with the Joneses’ and their consumer wants
created on instinct-based psychology. The variable of real disposable income is current
income assumed to be the same as the expected long-term average income, i.e. permanent
46
income. Variables of interest rate and wealth additionally explain the effect of saving and
assets, like bequest or disinvesting, on the household consumption expenditure. It is expected
for 𝐶𝑃𝑡 and 𝑌𝑡 to have positive signs and for 𝑖𝑡 and 𝑊𝑡 to have negative signs of coefficients.
In the linear regression form the consumption function is:
𝐶𝑡 = 𝛽0 + 𝛽1𝐶𝑃𝑡 + 𝛽2𝑌𝑡 + 𝛽3𝑖𝑡 + 𝛽4𝑊𝑡 + 𝑢𝑡 (21)
where 𝛽0 is the intercept, 𝛽1 to 𝛽4 are the parameters, i.e. the coefficients of the X variables
(in matrix form) and 𝑢𝑡 is the error term. The variables 𝐶𝑡, 𝐶𝑃𝑡, 𝑌𝑡, 𝑖𝑡 and 𝑊𝑡 are observed
and we assume that we have a random sample of size n with independent observations.
Variable 𝐶𝑡 is the dependent and explained variable, whereas 𝐶𝑃𝑡, 𝑌𝑡, 𝑖𝑡 and 𝑊𝑡 are
independent and explanatory variables. These are systematic components of a regression
model. The error term 𝑢𝑡 is unobserved.
2.2.5 Analysis of the existing models for household debt
The third main system variable in the model described here is household debt. Bloxham and
Kent (2009) address some of the factors that drove the increase in household debt over the
past decades, concentrating on the differences across countries upon emerging global crisis.
The factors that likely drove the household debt increase, based on the work of Kent,
Ossolinski, and Willard (2007), are the following: (1) financial sector deregulation,
competition and innovation, (2) declining inflation, (3) declining costs (real interest rates),
(4) reduction in macroeconomic volatility, (5) lower unemployment rates, (6) changes in
taxes and subsidies and (7) ageing of the population. The relative importance of each factor
is not being addressed, i.e. the degree of significance of each factor is difficult to ascribe due
to estimation difficulties. Nevertheless, they found out that household indebtedness for
advanced economies tended to be larger for those economies that had greater declines in
inflation, macroeconomic volatility and unemployment, as well in those with more
competitive and innovative mortgage markets. Some of the increase in household debt seems
to have echoed an overly optimistic view from lenders and borrowers which led to a
significant decline in lending standards. This could be especially observed in the United
States, where the mortgages to lower-income households were allowed before the financial
crisis, which consequently led to mortgage defaults, declines in housing prices and
significant financial losses.
The increase in US household debt was also studied by Dynan and Kohn (2007), where it
was shown that demographic shifts, house price increases and financial innovation appear to
have contributed to the household debt rise. The various factors contributing to the
household debt increase are the following: (1) impatience, (2) precautionary saving, (3)
47
interest rates and expected income, (4) demographics, (5) house prices and (6) financial
innovation. The study suggests that households did not become more impatient and that they
are motivated to convey some future consumption forward. They also did not find any strong
evidence of reduced risk aversion as a motive for borrowing and spending more now instead
of saving. Demographic shifts have probably contributed to greater indebtedness, as well as
decreases in longer-term interest rates and surges in expected incomes. Though the data
show that the real median incomes have been almost stalling in recent years, and survey
responses show that households are not very optimistic about their future earnings.
According to the authors, the most significant factors that drove the increase in household
debt and the related decrease in saving have probably been the combination of increasing
house prices and financial innovation.
Different view from life-cycle interpretations, that the household debt increase is explained
as a rational response of forward looking agents and as a momentary deviation of current
income flows from their long-term movement, is shown by Barba and Pivetti (2009). They
argue that the growing household debt is a consequence of changes in (1) income
distribution, i.e. stagnant real wages and (2) rising income inequalities. Debt has, therefore,
become a substitute for stagnant wages, where increasing borrowing finances consumption.
Increasing household debt is actually a complement of the conspicuous redistribution of
income. With the case when households face almost no credit constrained, on the on hand,
and with the imperative of endlessly improving the households’ living standard and
maintaining the imposed social norm of ‘keeping up with the Joneses’, on the other hand,
the result inevitably leads to a growing household indebtedness. Additionally, the household
savings rate significantly decreases in aggregate, where the savings of the upper 10 per cent
of the income distribution are outpaced by the dissaving of the lower 90 per cent of the
income distribution. The household debt distribution shows that households with higher
incomes have the greatest share of the stock of the debt, but as shown by Debelle (2004b),
the debt relative to income and the debt relative to the value of assets are the highest at the
low and middle of the income distribution, whereas the debt relative to the service of
indebted households is highest for the lower income distribution. The increased sensitivity
of indebted households will significantly depend on the household debt distribution. For
example, if the rise in aggregate indebtedness will also resonance the rise of indebtedness
by those households who can also stand the risk of changes in interest rates or the risk of
unemployment. The study, as well as Debelle (2004a) and RBA (2003), considers that the
majority of the household debt increase is due to the following three factors: (1) easing of
constraints on households borrowing, i.e. easing of liquidity constraints (Debelle, 2004a)
and financial deregulation (RBA, 2003), (2) lower inflation and (3) lower borrowing interest
rates. Altogether, low wages and stagnant wages appear to coexist if not drive the high levels
of aggregate demand, and high and growing consumption levels, which challenges the long-
term sustainability of this replacement of debt for wages.
48
Regression analysis that includes many macroeconomic factors, not only discussed in
descriptive statistical analysis, was done by Turinetti and Zhuang (2011). The model utilized
to explore influential factors of household debt is:
𝐷𝑆𝑅𝑡 = 𝛽0 + 𝛽1𝑈𝑡 + 𝛽2𝐹𝐹𝑡 + 𝛽3𝐻𝑃𝐼𝑡 + 𝛽4𝐶𝑆𝐼𝑡 + 𝛽5𝐷𝑃𝐼𝑡 + 𝛽6𝑊𝑜𝑟𝑘𝑖𝑛𝑔𝑡
+ 𝛽7𝑅𝑒𝑡𝑖𝑟𝑒𝑡 + 𝛽8𝐻𝑖𝑔ℎ𝑡 + 𝛽9𝐶𝑜𝑙𝑙𝑒𝑔𝑒𝑡 + 휀𝑡 (22)
where 𝐷𝑆𝑅𝑡 is the household debt service ratio (the ratio of debt payments to disposable
personal income), 𝑈𝑡 is unemployment rate, 𝐹𝐹𝑡 is federal funds rate, 𝐻𝑃𝐼𝑡 is housing price
index, 𝐶𝑆𝐼𝑡 is consumer sentiment index, 𝐷𝑃𝐼𝑡 is disposable personal income per capita,
𝑊𝑜𝑟𝑘𝑖𝑛𝑔𝑡 is percent of working age population in the population, 𝑅𝑒𝑡𝑖𝑟𝑒𝑡 is percent of
retiring age population in the population, 𝐻𝑖𝑔ℎ𝑡 is percent of population aged 25 and over
who completed four years of high school and over, 𝐶𝑜𝑙𝑙𝑒𝑔𝑒𝑡 is percent of population aged
25 and over who completed four years of college and over, and 휀𝑡 is random error term. The
estimated results, on US quarterly data over the period of 1980-2010, show that the federal
funds rate, i.e. interest rate, unemployment rate, per capita disposable personal income, share
of retiring population, and educational attainment are negatively related to the household
borrowing, whereas the consumer confidence, housing prices, and the share of working-age
population are positively associated to the household debt.
Further regression analysis conducted by Kim et al. (2014) showed that household debt
increase in Korea has been significantly related to house price rises, banks’ loose attitudes
toward household lending, and financial deregulation, i.e. financial institutions’ auspicious
funding conditions. The debt dynamics equation analysis demonstrates that the fast increase
in the ratio of household debt to disposable income is caused not only by the increase in
household asset purchases but also by the diminished disposable income and the decreased
savings rate. Household debt can be influenced by many factors such as changes in
demographic structure, financial deregulation and innovation, macroeconomic environment,
housing prices and monetary policy regime. The model for determinants of household debt
growth is:
ℎ𝑡 = 𝛽0 + ∑ 𝛽𝑚𝑋𝑚,𝑡
𝑀
𝑚=1
+ 휀𝑡 (23)
where ℎ𝑡 is household debt growth, 𝑋𝑚,𝑡 is a matrix of explanatory variables and 휀𝑡 is random
error term. The explanatory variables are the following: (1) rise in stock prices, (2) increase
in housing prices, (3) GDP growth, (4) inflation, (5) changes in lending rates, (6) changes in
49
leverage, (7) growth in financial institutions’ deposits, (8) non-performing loan ratio and (9)
changes in call rate. The results of analysis about the reasons for the quick increase in
household debt in Korea show that the underlying factors are similar to those factors in
advanced countries, like financial deregulation, asset price hikes, robust macroeconomic
environment and demographic changes. In addition, the debt distribution has also
deteriorated since the global financial crisis.
The notion of highly indebted U.S. households and record low savings rates was also
presented by R. H. Scott and Pressman (2015). They claim that highly leveraged
consumption boosted economic growth before the Great Recession. After the Great
Recession, many households have tried to deleverage, but that deleveraging has been
insufficient and it is mainly due to low interest rates. Therefore, household debt continues to
be high by historical standards. An additional problem is that consumption now represents
around 70 per cent of the U.S. GDP, the highest historical level. In combination with
increased income inequality since the 1980s, that opposite of expectation did not reduce
demand growth but were boosted by a historic increase in borrowing by the bottom 95 per
cent of the income distribution (Cynamon & Fazzari, 2013), and stagnant wages (Mishel &
Shierholz, 2013; R. H. Scott & Pressman, 2015), the inevitable result is indebted households.
Possible drivers of generating more spending than income are some social and psychological
forces, like ‘conspicuous consumption’ and ‘pecuniary emulation’, coined by Veblen
(1899).
The impact of materialism and anti-consumption lifestyles on personal debt was investigated
by Nepomuceno and Laroche (2015). Hierarchical regression analysis predicting personal
debt and probing the interaction between anti-consumption lifestyles and materialism
dimensions (conducted on a representative sample of customers of a Brazilian financial
institution), includes the following variables: (1) voluntary simplicity (scale of a lifestyle),
(2) happiness, (3) success, (4) centrality and (5) tightwadism. They found that the happiness
dimension of materialism correlates positively with personal debt, whereas the success
dimension of materialism and voluntary simplicity correlates negatively with the personal
debt. Other correlations with the personal debt are not significant. Additional research also
found a positive correlation between account balances and (6) frugality (scale of being
careful in spending money) and a negative correlation between account balances and the
happiness dimension of materialism. These results illustrate that decreasing consumption
helps people live financially stable lives, which improves people’s well-being. The authors
consequently argue that the reduction of consumption should be encouraged by
policymakers by promoting voluntary simplicity and frugality of the consumers.
50
The determinants of Australian household debt on a macro level were studied by Meng,
Hoang, and Siriwardana (2013). The model includes the following variables that affect the
household debt:
𝑋 = (𝐷𝐸𝐵𝑇, 𝐺𝐷𝑃, 𝑁𝐷𝑊𝐸𝐿𝐿, 𝐻𝑃𝐼, 𝑅, 𝑈, 𝐶𝑃𝐼, 𝑃𝑂𝑃) (24)
where DEBT is accumulated household debt, GDP is gross domestic product, NDWELL is
the number of new dwellings approved (all types of housing), HPI is housing price index, R
is interest rate, U is unemployment rate, CPI is consumer price index and POP is population.
The Cointegrated Vector Autoregression (CVAR) model was employed. The study shows
that GDP, the population and housing prices have a positive effect on household debt. On
the other hand, the unemployment rate, interest rates, inflation and the number of new
dwellings have a negative effect on household borrowing. The interest rates are found to be
the most significant of these factors.
An interesting discussion on what are the real drivers of the household debt bubble,
borrowers or lenders, was written by Keen (2009). He argued that the aggregate ratio
demonstrates that the definitive responsibility for debt bubbles is not with the irrational
enthusiasm of borrowers, but with the credit creation practises of lenders. It is the debt
financed demand which represents 23 per cent of aggregate demand at its highest in the U.S.,
and 20 per cent in Australia. In that sense, the deleveraging of the household debt could
hinder government efforts to stimulate the economy. Nevertheless, private debt seems to be
largely ignored by conventional macroeconomics. On the other hand, it is a central point in
the unconventional ‘Minskian’ approach to economics, which discards the standard ‘veil
over barter’ attitude towards money (Minsky, 1982) and supports the ‘money matters’. It
was this Minskian emphasis upon debt that resulted in the fact that Keen was one of only a
few who successfully predicted a global financial crisis.
A further argument that financial deregulation was the main factor for increasing household
indebtedness, was presented by Green et al. (2009). They reasoned that household debt grew
sharply on a range of measures since financial deregulation and that households gained as
they were unconstrained from artificial credit rationing to better smooth their consumption
over time. An alternative approach for assessing possible factors that contributed to
increasing household debt was done by Montgomerie (2006). The analysis show that the
main drive was the dual processes of (1) financial regulatory change and (2) a process of
labour markets social restructuring. The former results in a bigger supply of credit in a
liberalised financial market, whereas the latter results in income distribution changes and a
downward pressure on wages, which forces households into borrowing in order to maintain
the level of consumption. Incurring debt to consume can be partially explained with the
51
effect of conspicuous consumption. The study conducted by Berlemann and Salland (2016)
confirmed that conspicuous consumption seems to be partially financed by debt and that
choice to incur debt is related to average income in own residential area (based on
Duesenberry’s (1949) relative income hypothesis). The fact that the neighbourhood effect is
a very significant factor in debt market behaviour seems to confirm the imposed social norm
‘keeping up with the Joneses’.
The regression analysis of macroeconomic determinants contributing to the increased
household debt in South Africa was done by Meniago, Mukuddem-Petersen, Petersen, and
Mongale (2013). Vector Error Correction Model (VECM) was used for a model based on
life cycle hypothesis, complemented by the permanent income hypothesis. The regression
equation of household debt is:
𝐿𝑅𝐻𝐷𝑖 = 𝛽0 + 𝛽1𝐿𝑅𝐻𝑃𝐼𝑖 + 𝛽2𝐿𝐶𝑃𝐼𝑖 + 𝛽3𝐿𝑅𝐼𝑁𝑖 + 𝛽4𝐿𝑅𝑃𝑅𝑖 + 𝛽5𝐿𝑅𝐺𝐷𝑃𝑖
+ 𝛽6𝐿𝑅𝐶𝑂𝑁𝑖 + 𝛽7𝐿𝑅𝑆𝐴𝑉𝑖 + 𝑢𝑖 (25)
where LRHD is natural log of real household debt, LRHPI is natural log of real house price
index, LCPI is natural log of consumer price index, LRIN is natural log of real income, LRPR
is natural log of real prime rate, LRGDP is natural log of real GDP, LRCON is natural log of
real household consumption expenditures and LRSAV is natural log of real household
savings. The period ranges from 1985 Q1 to 2012 Q1. The findings confirmed the existence
of a long run cointegrating relationship between household debt and other macroeconomic
factors. Growing household debt was statistically significantly influenced and positively
correlated with household consumption, GDP and consumer price index. On the other hand,
income was statistically significant and negatively correlated to a growth in household debt.
Household saving and house prices were positively correlated to a growth in household debt,
whereas prime rate was negatively correlated to a growth in household debt, but all were
statistically insignificant.
Jacobsen and Naug (2004) analysed the factors underlying the strong growth in household
debt in a flexible dynamic empirical model for Norwegian households. The model included:
(1) housing prices, (2) housing stock, (3) turnover (number of house sales), (4) interest rate
(banks’ average lending rate), (5) unemployment rate, (6) income (total wage income), (7)
number of defaulted loans and (8) students share. They also included a stochastic trend to
capture effects of changed preferences among mature age groups instead of a linear
deterministic trend. Barnes and Young (2003) adapted a conventional rational expectations
life-cycle model of household consumption behaviour with standard constant relative risk
aversion (CRRA) preferences in a calibrated partial equilibrium overlapping generations
(OLG) model. The rise in aggregate household indebtedness can be explained by changes in
52
(1) demographic, (2) real interest rate, (3) income growth and growth expectations. The
model, however does not capture some other factors such as lifting of borrowing constraints
and financial market liberalisation in the 1980s. In the study of Tudela and Young (2005) a
simple overlapping generations (OLG) model where aggregate outcomes are the sum of
individual maximised decisions (like saving and consumption) were used. The model
showed that the household debt can be explained by determining factors such as: (1) interest
rates, (2) house prices and (3) incomes.
After analyzing the existing models for household debt, the final evaluation and construction
of the new model partial equation of household debt follow. Inference is based on logical
reasoning, observed causalities and consequences, and relevance. Some factors are more
relevant and are to be assumed to have better explanatory power on dependant variable than
some other factors. Nevertheless, all presented factors help to better understand the dynamics
of the analysed dependent variable.
Final evaluation shows that the demand financed by debt emerged from the credit creation
practises of lenders and financial deregulation. Household debt is rising due to consumption
partially financed by debt and driven by the imposed social norm ‘keeping up with the
Joneses’ or the so-called neighbourhood effect (Bloxham & Kent, 2009; Debelle, 2004a;
Dynan & Kohn, 2007; Keen, 2009; Kent et al., 2007; Meniago et al., 2013; Montgomerie,
2006; Nepomuceno & Laroche, 2015; RBA, 2003). Hence, the variable of consumption
would be a good explanatory variable of household debt. On the other hand, household debt
also rises due to a process of labour markets social restructuring or in other words due to
income distribution changes and stagnant real wages (Barba & Pivetti, 2009; Debelle, 2004b;
Montgomerie, 2006). In this sense, the variable that capture changes in the bottom 90 per
cent of income share would be a good regressor of household debt function. Additional
factors that can explain the changes in household debt are savings (Barba & Pivetti, 2009;
Dynan & Kohn, 2007; Meniago et al., 2013; R. H. Scott & Pressman, 2015) and GDP (Kim
et al., 2014; Meng et al., 2013; Meniago et al., 2013).
2.2.6 Estimation model for household debt
In our model, we consider factors from relevant theories which were elaborated in the
previous section. The mathematical form of the household debt function is:
𝐻𝐷𝑡 = 𝑓(𝐶𝑡, 𝐺𝐷𝑃𝑡 , 𝑆𝑡, 90𝑖𝑡) (26)
where 𝐻𝐷𝑡 is household debt and is a function of the following variables: 𝐶𝑡 is household
consumption expenditure, 𝐺𝐷𝑃𝑡 is gross domestic product, 𝑆𝑡 is net household saving and
53
90𝑖𝑡 is bottom 90 per cent income share. Variable 𝐶𝑡 captures high levels of consumption in
GDP, in some developed countries even at historical peak, while at the same time the bottom
90 per cent of income distribution increased the borrowing. The variable 𝐺𝐷𝑃𝑡 captures the
overall country’s economic condition. The variable 𝑆𝑡 explains the effect of historically low
savings rates and excess consumption, whereas the variable 90𝑖𝑡 considers the effect of very
important income distribution changes. Financial deregulation is also implicitly represented
through the variable 𝐶𝑡 and subsequently through the variable 𝐶𝑃𝑡 and its predictor variable
of financial liberalization index. This holds as well for the interest rate and income. It is
expected for 𝐶𝑡 to have a positive sign and for 𝐺𝐷𝑃𝑡, 𝑆𝑡 and 90𝑖𝑡 to have negative signs of
coefficients.
In the linear regression form the household debt function is:
𝐻𝐷𝑡 = 𝛽0 + 𝛽1𝐶𝑡 + 𝛽2𝐺𝐷𝑃𝑡 + 𝛽3𝑆𝑡 + 𝛽490𝑖𝑡 + 𝑢𝑡 (27)
where 𝛽0 is the intercept, 𝛽1 to 𝛽4 are the parameters, i.e. the coefficients of the X variables
(in matrix form) and 𝑢𝑡 is the error term. The variables 𝐶𝑡, 𝐺𝐷𝑃𝑡, 𝑆𝑡 and 90𝑖𝑡 are observed
and we assume that we have a random sample of size n with independent observations.
Variable 𝐻𝐷𝑡 is dependent and explained variable, whereas 𝐶𝑡, 𝐺𝐷𝑃𝑡 , 𝑆𝑡 and 90𝑖𝑡 are
independent and explanatory variables. These are systematic components of a regression
model. The error term 𝑢𝑡 is unobserved.
2.2.7 Analysis of the existing models for inequality
The fourth main system variable in the model described here is inequality. Kumhof et al.
(2015) argue that both crises, the Great Depression and the Great Recession, were the
consequence of the changes in the (1) income distribution and (2) indebted households. They
show, empirically, that both periods from 1920 to 1929 and from 1983 to 2008 displayed a
large surge in the income share of the top 5 per cent of the income distribution, and a large
surge in debt leverage of the bottom 95 per cent of the income distribution. This household
debt emerges because of the surge in the income share of the top 5 per cent of the income
distribution of the households and a consequent decline in the income share of the bottom
95 per cent of the income distribution of the households. The top 5 per cent of the income
distribution also loan part of their income back to the bottom 95 per cent of the income
distribution households, which additionally increases the loan supply, thus allowing the
bottom 95 per cent of the income distribution households to maintain the growing
consumption levels. Similarly, Iacoviello (2008) argues that income inequality is the leading
cause of the increase in the household debt over income ratio. Therefore, changes in the
income distribution lead to income inequality and indebted households.
54
Rather significant is the 90/50 differential. This differential has grown since the 1980s,
which means that the incomes of the 90th percentile of the wage distribution in the U.S. have
increased much faster than the incomes of the 50th percentile of the wage distribution (the
median). As Rajan (2010) further argues, the everyday reality for the middle class are
stagnant wages, as well as increasing job insecurity. Due to this rising income inequality,
politicians ‘felt’ their voters’ pain, which has led to the political pressure for easy credit.
Hence, the political reply to rising inequality was the deregulation and expansion of lending
to households, particularly to the low-income households. The benefits, like increasing
consumption and higher employment, were instant, while the consequences, like defaults
and financial crisis, were only postponed. This development prior to the recent Great
Recession is similar to the development prior to the Great Depression, where politicians were
unable to address the deeper anxieties of the middle class. Back then, in the early years of
the twentieth century in the U.S., the deregulation and rapid expansion of banking followed.
This was a political reply to the Populist movement, supported by small and medium-sized
farmers who demanded easier credit. Excessive rural credit was then, in turn, one of the
substantial reasons of bank defaults during the Great Depression. Such political replies to
unsustainable income distribution and rising inequality only lead to inevitable economic and
social crisis. Reich (2013) reasons similarly that an increasing concentration of wealth and
income at the top rather than being spread across the American middle class was the reason
for the Great Recession. Thus, the real (political) challenge is not to save more and borrow
less but to rebalance the economy so the welfares are shared more broadly and the purchasing
power of the middle class is reinstated, as the only viable way to sustainable growth.
Possible causes of the growing after-tax income inequality were analysed by Hungerford
(2013) and Harris and Sammartino (2011). There are three factors that contribute to the
changes income inequality: (1) labour income, like salaries and wages, (2) capital income,
like dividends, capital gains, business income and interest income, and (3) taxes. Those
income sources are part of the Gini index, which measures the income inequality. The Gini
index for total income can be decomposed into contributions from each income source:
𝐺(𝑌) = ∑�̅�𝑗
�̅�
𝐽
𝑗=1
× �̅�(𝑦𝑗) (28)
where 𝑦𝑗 is the income from each source and j the index for each income source, from 1 to
J, �̅�𝑗 is the average amount of income from each source, �̅� is the average amount of total
income, �̅�𝑗 �̅�⁄ is the share of total income accounted for by each income source, and �̅�(𝑦𝑗)
is the concentration index for each income source, also called the pseudo-Gini. There are
55
two developments when observing for the changes; (1) all major income sources became
highly concentrated in favour of top per cent of the income distribution of the household,
and (2) a change in the composition of income. The latter contributed to the decline of wages
and other labour income in the share of total income and a rise of capital gains and other
capital income in the share of total income. This reinforces the income inequality since the
capital incomes are more focussed amongst the top per cent of the income distribution of the
household than is labour income. The largest contributor to the changes in income that led
to the increase in income inequality were: (1) capital gains, and (2) dividends.
Such ‘rent seeking’ behaviour by top earners, like executives and managers, can be attributed
to the decrease in top marginal income tax rates since 1960s to bargain a higher share of total
income, at the expense of other workers’ wages (Fieldhouse, 2013). As Piketty et al. (2011)
further show, there is a strong negative correlation between top tax rates and top 1% income
shares; nevertheless, top income share growths have not translated into bigger economic
growth. Similarly, Hungerford (2012) argues that decreases in top marginal tax rates in the
U.S. are related to the growing concentration of income at the top of the income distribution,
increasing from 4.2 per cent in 1945 to 12.3 per cent by 2007, for the top 0.1 per cent of the
income distribution. On the one hand, the shift from labour income to capital income is
attributed to one third of the rise in the total share of income to the top 1 per cent of
households, which rose from 9.6 per cent in 1979 to 20 per cent in 2007, and on the other
hand, a decline in share for the lower 40 per cent of households from 37.2 per cent in 1979
to 28.3 per cent in 2007 (Mishel et al., 2012; Piketty & Saez, 2003). The wage for the median
worker grew only 5.0 per cent between 1979 and 2012, for the 20th percentile worker wage
dropped by 0.4 per cent, regardless of a productivity increase of 74.5 per cent. For the 80th
percentile worker the wage grew by 17.5 per cent in the same period (Mishel & Shierholz,
2013).
Redistribution of income can reduce income inequality. Nevertheless, as Harris and
Sammartino (2011) showed, the federal tax and transfer system decreased the Gini index
only by 17.1 per cent in 2007, compared to a 23.4 per cent decrease in 1979. Similarly, pre-
tax inequality rose 23.2 per cent between 1979 and 2007, while post-tax, post-transfer
inequality rose 33.2 per cent, respectively. The federal tax and transfer system’s ability to
reduce inequality is thus not working. Obviously, the factor that contributes to the rising
income inequality is also the so-called (1) tax inequality or (2) redistribution inequality.
Additionally, OECD (2016a) presented that higher-income households in OECD countries
profited more from the weak recovery than the other households. Unemployment and slow
wage growth prevented the recovery of labour incomes within lower-income households,
whereas redistribution has been diminishing throughout the recovery in most of the OECD
countries.
56
Other determinants of inequality were studied by Berisha and Meszaros (2017). Using OLS
regression for analysing the relationship between income inequality, household debt and
economic growth in the U.S., the model specification is:
∆𝐼𝑛𝑒𝑞𝑢𝑎𝑙𝑖𝑡𝑦𝑖,𝑡+ℎ = 𝛽1∆1
𝐻𝐻𝐷𝑖𝑡−1
𝑌𝑖𝑡−1+ 𝛽2∆1𝑋𝑖𝑡−1 + ∆휀𝑖𝑡+ℎ (29)
where ∆ is percentage change, 𝐼𝑛𝑒𝑞𝑢𝑎𝑙𝑖𝑡𝑦𝑖𝑡 is income inequality measure for a state i and a
year t, 𝐻𝐻𝐷𝑖𝑡 is household debt of a state, 𝑌𝑖𝑡 is the GDP of a state (𝐻𝐻𝐷𝑖𝑡−1 𝑌𝑖𝑡−1⁄ as
household debt-to-GDP ratio), 𝑋𝑖𝑡 are additional control variables, like changes in GDP,
unemployment and the Great Recession period (presenting the general state of the economy),
and h = 1,2,… is the forecast horizon. The results reject the basic forecast of growing
household debt leading to increases in income inequality, but rather indicate the opposite,
that an increase in household debt over a one-year period predicts a decrease in income
inequality. A possible reason for this is that because household debt caused slower economic
growth, the returns of top earners in income distribution diminished, which in turn caused a
decrease in income inequality.
Deunionization is also related to an increase in income inequality. Union density is in steady
decline in OECD countries (OECD, 2016b; Visser, 2016). Union decline from mid 1790s
can be contributed to the following factors: lower inflation, higher unemployment, novices
in the labour force, workplaces less covered by unions, lowered strike activity, dismantled
indexation clauses, decreased replacement rates and declined public employment (Checchi
& Visser, 2005). As Acemoglu, Aghion, and Violante (2001) argue, the reasons for
deunionization are skill-biased technical changes where the pressure of outside skilled
workers rises, which weakens the alliance between skilled and unskilled worker who support
the unions. Skill-biased technical changes have been an important factor in deunionization,
which was the cause for increasing income inequality. Of course, better skills and better
education are more affordable to those with higher incomes and those who profit most from
the changes in income distribution and income redistribution. This cycle is only reinforcing
the top earners. This can also be observed in the wealth concentration. Saez and Zucman
(2016) shown that the top 0.1 per cent wealth share has increased from 7 per cent in 1978 to
22 per cent in 2012. Wealth concentration was high in 1929, decreased until 1978, and then
rose again until 2012 to the levels similar in 1929. People who hold the most wealth today
are younger and earn a higher share of labor income than back in the 1960s. On the other
hand, people who hold the bottom 90% of the wealth share first increased their wealth share
until the 1980s, which then gradually decreased. The reason for such an increase in wealth
inequality in the past years is because of the increases of top incomes and an increasing
57
saving rate inequality, where savings are increasing for top earners and declining for the
others.
In broader terms, it is interesting to observe whether the liberalization, i.e. economic freedom
and globalization, are related to increasing income inequality within countries (Bergh &
Nilsson, 2010). The measures for (1) the globalization was KOF Index of Globalization and
for (2) the economic freedom the Economic Freedom Index of the Fraser institute. Three
further independent variables were added as control variables: (3) GDP per capita, (4) human
capital (share of population above 25 years old with higher education - correcting for human
capital effects), and (5) dependency ratio (share of population younger than 15 years and
older than 64 years - the primary effect of demographic change). The model is:
𝑦𝑖𝑡 = 𝛼 + 𝑙𝑖𝑏𝑖𝑡′ 𝛽 + 𝑥𝑖𝑡
′ 𝛾 + 𝛿𝑖 + 𝜌𝑡 + 휀𝑖𝑡 (30)
where 𝑦𝑖𝑡 is the dependent variable of income inequality, 𝑙𝑖𝑏𝑖𝑡 is a vector of liberalization
indices, and 𝑥𝑖𝑡 includes the control variables, 𝛿𝑖 relates to a country fixed effect for
capturing stable differences in economic inequality between countries, 𝜌𝑡 is a period fixed
effect that captures the influence of shocks affecting economic inequality in multiple
countries at the same time, and 휀𝑖𝑡 is error term. The endogeneity problem was addressed
with the system GMM estimator. The results show that trade liberalization and economic
globalization increase income inequality. Freedom to trade internationally is robustly related
to inequality; social globalization and deregulation are also linked to inequality. Economic
freedom increases inequality mainly in developed countries, whereas social globalization is
more relevant in less developed countries. Political globalization, and legal and monetary
reforms, do not increase inequality.
Further analysis links income inequality to economic complexity and institutions. Hartmann,
Guevara, Jara-Figueroa, Aristarán, and Hidalgo (2017) have shown that countries exporting
complex products have lower income inequality than countries exporting more simple
products. They use multivariate pooled regression with dependent variable of Gini
coefficient and the following independent variables: (1) economic complexity index (ECI),
(2) GDP, (3) schooling, (4) population, (5) rule of law, (6) corruption control, (7) government
effectiveness, (8) political stability, (9) regulatory quality, and (10) voice and accountability.
The results show that economic complexity is a negative and significant predictor of income
inequality. This relationship is also robust when controlling for aggregate measures like
GDP, human capital or institutions. These findings do not confirm the Kuznets’ curve in
inequality, namely, that when the economy develops, market forces first increase and then
decrease income inequality (an inverted U-shape curve). The empirical facts rather seem to
suggest the opposite. First, there is a technological catch-up in emerging economies that
58
provides new jobs and learning opportunities for workers and additional bargaining power
for workers and their unions. This contributes to the rise of a new middle class. On the other
hand, there is an effect of the maturity of economies in developed countries, which results
in de-unionization and de-industrialization, and additional pressure on low and middle-class
wages and wage inequality. In conjunction with increased global competition this has led to
higher income inequality in developed countries. Results suggest that a country’s income
inequality may be conditioned by its productive structure, but that does not mean that its
productive structure exclusively defines a country’s income inequality (e.g. trade data do not
capture all activities or factors). It is more likely that a productive structure represents several
factors, like institutions and education, that co-evolve with a country’s exported products
and with the inclusiveness of its economy. The more the institutions co-evolve the more
complex products a country can produce and export, and the more inclusive its economy can
be. But how the income is distributed or redistributed also matters for income inequality.
An analysis of the effect of budget consolidation on income inequality, while controlling for
political and ideological differences, was performed by Schaltegger and Weder (2014) in 17
OECD countries from 1978 to 2009. They used a fixed effects model for the estimation of
the following model:
𝑔𝑖,𝑡 = 𝛼𝑖 + 𝜇𝑡 + 𝛽1𝑋𝑖,𝑡−1′ + 𝛽2𝑓𝑖,𝑡−1 + 휀𝑖,𝑡 (31)
where 𝑔𝑖,𝑡 is the Gini coefficient, for a state i and year t, 𝛼𝑖 is coefficient that express country
specific effect, 𝜇𝑡 is coefficient that express time specific effect, 𝑋𝑖,𝑡−1′ is a matrix containing
a set of explanatory variables to account for political, economic and social
differences, 𝑓𝑖,𝑡−1 captures different indicators of budget consolidation, and 휀𝑖,𝑡 is error term.
The explanatory variables are the following: (1) GDP, (2) education, (3) trade openness, (4)
social expenditure, (5) participation rate, (6) banking crisis, (7) fiscal adjustment, and (8)
type of government. The results show that, although fiscal austerity generally increases
income inequality, austerity measures by coalition governments significantly decrease
income inequality when compared with single party and minority governments. Although
coalition governments are inferior in decreasing structural budget deficits, they achieve
much better results in addressing distributional problems. Consequently, it seems that the
trade-off between austerity and inequality is determined by the associated political regime,
among the others.
The question of welfare state redistribution was analysed by Bergh and Bjørnskov (2014).
More precisely the correlation between social trust and income equality. When larger welfare
states steer to a rise in income equality, trust may influence equality through an increase of
the welfare state. Additionally, if the correlation between equality and trust shows that
59
equality causally increases trust, positive feed-back dynamics may take place, such that also
trust enables the employment of welfare state redistribution, thus additionally strengthening
the equality. Using a structural equation model, the equation for the income equality is:
𝐼 = 𝛼2 + 𝛽2𝑋 + 𝛽𝛾2𝑍 + 𝜆2𝑇𝑅 + 휀2 (32)
where 𝐼 is income equality, 𝑋 is a matrix of the following variables: (1) dummy for post-
communist countries that are both less trusting and more equal, and (2) dummy for Nordic
countries, that have large welfare states, and are substantially more trusting, 𝑍 is a matrix of
the following variables: (3) standard Kuznets curve (GDP per capita and its squared term),
(4) political Kuznets curve (the degree of democracy and its squared term), (5) a set of
dummy variables capturing variations in religious affiliation, (6) a control for common law
countries (i.e., countries with some form of British heritage), and (7) IQ scores as proxies
for educational quality to control for inequality arising from skills-based technological
progress, (8) 𝑇𝑅 is trust, and 휀2is error term. The results show that trust has a positive effect
on market and net income equality. Larger welfare states steer to higher net equality;
nevertheless, neither welfare state size nor net income equality looks to have a causal effect
on trust. Although trust enables welfare state policies, i.e. redistribution to decrease net
inequality, this reduction in inequality does not increase trust.
After analyzing the existing models for inequality, the final evaluation and construction of
the new model partial equation of inequality follow. Inference is based on logical reasoning,
observed causalities and consequences, and relevance. Some factors are more relevant and
are to be assumed to have better explanatory power on dependant variable than some other
factors. Nevertheless, all presented factors help to better understand the dynamics of the
analysed dependent variable. The final evaluation shows that both the Great Depression and
the Great Recession were the consequence of income distribution changes and indebted
households (Iacoviello, 2008; Kumhof et al., 2015; Rajan, 2010; Reich, 2013). In these
income distribution changes, which lead toward income inequality, the 90/50 differential (or
90/40) is rather significant (Mishel et al., 2012; Mishel & Shierholz, 2013; Rajan, 2010;
Reich, 2013; Saez & Zucman, 2016), thus making this variable viable as a predictor for
inequality. In addition, all major income sources became immensely concentrated in the
hands of the top 1 per cent of the income distribution (Harris & Sammartino, 2011;
Hungerford, 2012, 2013; Piketty et al., 2011; Saez & Zucman, 2016). The top 1 per cent of
the income distribution is further even correlated to the top tax rates (Fieldhouse, 2013;
Hungerford, 2012; Piketty et al., 2011), which additionally emphasise the overall
significance of the top 1 per cent of the income distribution and their impact on the economy.
Hence, the top 1 per cent of the income distribution would be a good explanatory variable
for inequality. Household indebtedness also influences the changes in income inequality
(Berisha & Meszaros, 2017; Iacoviello, 2008; Kumhof et al., 2015); therefore, it would be a
60
good predictor. Further, the influence of taxes and in particular, the role of a federal tax and
transfer system in reducing inequality (Harris & Sammartino, 2011; Hungerford, 2013),
makes the difference between pre-tax inequality and post-tax inequality also a feasible
explanatory variable of overall income inequality.
2.2.8 Estimation model for inequality
In our model, we consider factors from relevant theories which were elaborated in the
previous section. The mathematical form of the inequality function is:
𝐼𝑁𝐸𝑡 = 𝑓(𝐻𝐷𝑡, 𝑌𝑅𝑡 , 1𝑌𝑆𝑡, 𝑇𝐼𝑡 ) (33)
where 𝐼𝑁𝐸𝑡 is income inequality and is a function of the following variables: 𝐻𝐷𝑡 is
household debt, 𝑌𝑅𝑡 is a 90/50 differential from the income distribution, 1𝑌𝑆𝑡 is the top 1
per cent of income share in income distribution and 𝑇𝐼𝑡 is the tax redistribution inequality.
The variable 𝐻𝐷𝑡 explains the household debt levels, the variables 𝑌𝑅𝑡 or 𝑃𝑅𝑡 (90/40
differential-palma ratio) are differentials that capture the relative changes in the income
distribution, whereas variable 1𝑌𝑆𝑡 considers the effect of the most significant factor in the
income distribution changes, and likewise the most influential one. The variable 𝑇𝐼𝑡 captures
the federal tax and transfer system role in reducing inequality, measuring the effect between
pre-tax and pots-tax income inequality. It is expected for 𝐻𝐷𝑡, 𝑌𝑅𝑡, 1𝑌𝑆𝑡 and 𝑇𝐼𝑡 to have
positive signs of coefficients.
In the linear regression form the inequality function is:
𝐼𝑁𝐸𝑡 = 𝛽0 + 𝛽1𝐻𝐷𝑡 + 𝛽2𝑌𝑅𝑡 + 𝛽31𝑌𝑆𝑡 + 𝛽3𝑇𝐼𝑡 + 𝑢𝑡 (34)
where 𝛽0 is the intercept, 𝛽1 to 𝛽3 are the parameters, i.e. the coefficients of the X variables
(in matrix form) and 𝑢𝑡 is the error term. The variables 𝐻𝐷𝑡, 𝑌𝑅𝑡, 𝑇𝐼𝑡 and 1𝑌𝑆𝑡 are observed
and we assume that we have a random sample of size n with independent observations. The
variable 𝐼𝑁𝐸𝑡 is a dependent and explained variable, whereas 𝐻𝐷𝑡, 𝑌𝑅𝑡 , 𝑇𝐼𝑡 and 1𝑌𝑆𝑡 are
independent and explanatory variables. These are systematic components of a regression
model. The error term 𝑢𝑡 is unobserved.
61
2.3 Economic model of CCC
After the analysis of partial equations performed for all CCC system variables, a synthesis
into a new economic model will be made. Partial equations of CCC system variables will be
merged by a synthesis into a system of equations.
The first equation (35) is an identity that specifies a variable corporate power, as a construct
composed of corporate indicators of total assets, total sales and employment. It is implicitly
endogenous as a construct of a factor analysis that contains other endogenous variables (total
assets, total sales and total employment).
𝐶𝑃𝑡 = 𝑙1𝑇𝐴𝑡 + 𝑙2𝑇𝑆𝑡 + 𝑙3𝑇𝐸𝑡 (35)
This is followed by a system of equations:
𝑇𝐴𝑡 = 𝛽0 + 𝛽1𝐼𝑁𝐸𝑡 + 𝛽2𝐹𝐿𝐼𝑡 + 𝛽3𝑇𝑈𝐷𝑡 + 𝛽4𝐸𝐶𝑇𝑡 + 𝑢1𝑡 (36)
𝑇𝑆𝑡 = 𝛽5 + 𝛽6𝐼𝑁𝐸𝑡 + 𝛽7𝐹𝐿𝐼𝑡 + 𝛽8𝑇𝑈𝐷𝑡 + 𝛽9𝐸𝐶𝑇𝑡 + 𝑢2𝑡 (37)
𝑇𝐸𝑡 = 𝛽10 + 𝛽11𝐼𝑁𝐸𝑡 + 𝛽12𝐹𝐿𝐼𝑡 + 𝛽13𝑇𝑈𝐷𝑡 + 𝛽14𝐸𝐶𝑇𝑡 + 𝑢3𝑡 (38)
𝐶𝑡 = 𝛽15 + 𝛽16𝐶𝑃𝑡 + 𝛽17𝑌𝑡 + 𝛽18𝑖𝑡 + 𝛽19𝑊𝑡 + 𝑢4𝑡 (39)
𝐻𝐷𝑡 = 𝛽20 + 𝛽21𝐶𝑡 + 𝛽22𝐺𝐷𝑃𝑡 + 𝛽23𝑆𝑡 + 𝛽2490𝑖𝑡 + 𝑢5𝑡 (40)
𝐼𝑁𝐸𝑡 = 𝛽25 + 𝛽26𝐻𝐷𝑡 + 𝛽27𝑌𝑅𝑡 + 𝛽281𝑌𝑆𝑡 + 𝛽29𝑇𝐼𝑡 + 𝑢6𝑡 (41)
Equations in a system of equations are behavioural and contain explicit disturbances.
Equations from (36) to (38) are indicators of a variable corporate power, which are evaluated
separately because of their endogenous positions, thus capturing their indirect effects and
allowing for their full mediation. In contrast, evaluating the construct of corporate power
directly could lead to biased parameter estimates, erroneous total effects, and questionable
conclusions (Temme, Diamantopoulos, & Pfegfeidel, 2014). All dependent variables in a
system of equations also appear as explanatory variables and as endogenous in other
equations, thus producing a non-recursive model and a system of simultaneous equations.
62
2.3.1 Discussion
In the regression model, the β0, β5, β10, β15, β20 and β25 are the intercepts, whereas all the
other β’s are the parameters, i.e. the coefficients of the X variables (in matrix form). ϵt is
the error term. Regarding the estimation of the CCC model, the X variables are observed and
we assume that we have a random sample of size n with independent observations. Left-side
variables are dependent and explained variable (the y variables), whereas X variables are
independent and explanatory variables. These are a systematic component of a regression
model. The error terms ϵt are unobserved. We have an assumption that E(u) = 0 and of a
relationship between x and u: E(u|x) = E(u). Those two assumptions combined lead to E(u|x)
= 0 which is a key for unbiasedness. The parameters β are non-random and unknown. We
wish to estimate their values. The goal of the regression analysis is to investigate and to
understand the effect of X on y.
The method of least squares is the most important in econometrics. It uses the Euclidean
distance as a measure of distance for least squares approximation (ordinary least squares or
OLS). The solution β̂ = (X'X)-1X'y is the unique solution to the least squares minimization
problem. The task is to get unbiased β, i.e. E(β̃) = β and small variance, Var(β̃) = σ2(X'X)-1.
In the classical linear regression model, we have the following assumptions: the regressors
are fixed, i.e. non-stochastic, the regressor matrix X has full column rank k, and for the error
vector u, we assume finite second moments with E(u) = 0 and Var(u) = E(u′u) =
∑ = σ2ITuu , i.e. the errors are mutually uncorrelated and we have homoscedasticity. We also
assume that there is no prior information available, with respect to the parameters. With the
Gauss-Markov theorem we can show that β̂ is the best linear unbiased estimator or BLUE
for β. With a less restrictive assumption about errors we can allow for heteroscedasticity and
correlation between the errors. This is called a generalized least square (GLS) linear
regression model. We have an assumption that Var(u) = σ2Ω. BLUE for β is then β̃GLS =
(X'Ω-1X)-1X' Ω-1y and the VCV is ∑ = σ2(X′Ω−1X)−1β̃GLSβ̃GLS
.
Because the dependent variables are also the explanatory variables in other equations, we
have the error terms correlated among the equations. Furthermore, the endogenous variables
are correlated with the disturbances, which violates the OLS assumption. One of the
econometric techniques that can address this problem are the instrumental variables, which
can produce consistent estimates and GLS estimation to account for the correlation structure
in the disturbances across the system of equations. The relationships between the variables
can be econometrically tested with the three-stage estimation of systems of simultaneous
equations. The estimation refers to a system of structural equations, where some equations
contain endogenous variables among the explanatory variables. Estimation is via three-stage
least squares (3SLS) and arises out of the two-stage least squares (2SLS) estimates. In the
first stage, the instrumented values for all endogenous variables are developed as the
63
predicted values, resulting from a regression of each endogenous variable on all exogenous
variables in the system. In the second stage, a consistent estimate for the covariance matrix
of the equation disturbances is computed, based on the residuals from a 2SLS estimation of
each structural equation. In the last stage, GLS estimator is obtained using the covariance
matrix estimated in the second stage and with the instrumented values in place of the right-
hand-side endogenous variables. 3SLS method gives more efficient results than the
alternative 2SLS method, which is also using the instrumental variables. Both produce
consistent estimates, whereas the OLS method gives us biased estimates of the parameters
(Davidson & MacKinnon, 1993; Greene, 2012; Stata, 2016; Zellner & Theil, 1962).
2.4 Conclusion
The main contribution of this chapter is the construction of a new economic model of CCC.
The theoretical setup of an empirical model of cumulative and circular causation is built
upon a political-economic model of CCC (Porenta, 2017). After comprehensive analysis of
existing empirical literature review of partial equations of the main system variables, the
construction of the new model partial equations was done. The analysis also identifies and
constructs a variable of corporate power and examines the new relationships between
corporate power, consumption, debt and inequality. This was followed by a synthesis of
model partial equations into a new economic model, which can be econometrically tested.
Since there is a cumulative and circular causation of the main system variables, that means
that dependent variables are also independent variables in the next equation in the sequence.
This economic model of CCC has four main system variables and therefore forms a system
of simultaneous equations.
There is clear notion of cumulative and circular causation of the main system variables.
Corporations and their corporate power are encouraging the rise in consumerism in order to
secure the corporations’ investment and provide sufficient demand for their services and
products. They are encouraging consumerism by exploiting one of the most powerful human
instincts—the reproduction and display of social status— and fostering the social norm of
‘keeping up with the Joneses’. At the same time, real wages are stagnating, which leads to
increased borrowing and debt-driven consumption. Increasing household debt has the result
that income inequality is rising. Inequality, along with decreased union density and workers’
bargaining power, and income distribution in favor of the top per cent of income distribution,
further strengthens corporate power. Consequently, the cumulative and circular causation is
formed.

64
65
3 EMPIRICS OF CUMULATIVE AND CIRCULAR CAUSATION
MODEL: OECD6
ABSTRACT: This paper provides an empirical investigation into the empirics of the
cumulative and circular causation (CCC) model. Relying on their corporate power,
corporations have stimulated the rise in consumerism, which has increased both private
consumption and debt. On the other hand, increasing debt has enhanced the process of rising
inequality due to the lack of funding to invest in education or create savings. Rising
inequality has further increased the bargaining power of capital and closed the CCC model.
This paper tests the proposed theoretical model on a sample of OECD countries in the period
between 1990 and 2013. We show that growing corporate power causes increased
consumption, growing household and public debt, as well as higher inequality. The paper
makes several original contributions to the existing literature. First, it is the first empirical
investigation of the CCC relationship. Second, it extends the knowledge about the trends of
rising corporate power and consumerism at the macro level.
Keywords: corporate power, consumption, debt, non-recursive, cumulative circular
causation, inequality.
JEL Classification: B52, E02, P10
6 This chapter is based on the article published by Porenta (2018).
66
3.1 Introduction
Do “evil global corporations” in the interest of capital really cause the global
impoverishment of people? According to Piketty (2014), over the long run the profit rate
was higher than the economic growth rate. This implies that increasing inequality is a direct
result of this process, causing the capital owners to further increase their wealth, influence
and bargaining power in the distribution of income. This results in an upward spiral, which
further increases their dominance. The increasing dominance of capital leads to several other
undesirable consequences in addition to increasing inequality. First, capital stimulates
consumerist behaviour to secure increasing demand. Increased personal consumption skews
the income distribution between consumption and savings (and investment into education,
etc.), and causes increasing indebtedness. The latter is again supported by capital through
the interest of the financial services’ sector. According to Piketty (2014) and Porenta (2017),
the government itself could reverse this process, but it is itself a victim of the process of
increasing indebtedness and rising corporate power. As a consequence, it has a limited ability
to influence the direction of capitalist development. As Porenta (2017) shows in his
theoretical discussion, increasing corporate power in the situation of limited household and
state power leads to a cumulative and circular causality (CCC), where rising inequality and
limited state power are only enhanced.
The purpose of this chapter is to empirically evaluate the validity of the proposed mechanism
on a sample of OECD countries between 1990 and 2013. To do so, first a theoretical
foundation is set, based on a presentation of seven core equations, each explaining a specific
part of the circle, which together comprise the CCC. The chapter extends the existing
literature by providing empirical evidence to the growing body of literature in the Pikketyian
tradition, and tests an extended model as suggested by Porenta (2017). Furthermore, it shows
how system dynamics endangers social cohesion as well as the results of the welfare state
achievements.
We will show that (1) in the OECD economies, corporate power has increased and financial
liberalization has stimulated this process. The study will also reveal that (2) increased
corporate power positively influences personal consumption, which is in line with the
increasing claims of conspicuous consumption, driven by corporate power (marketing and
creation of wants). Furthermore, we will provide evidence that (3) indebtedness has been
increasing, again supporting the growing power of corporations and capital. (4) Inequality is
shown to increase, which further diminished the bargaining power of workers, i.e.
consumers. Finally, we show that (5) the spiral continues in favour of capital. Overall, in the
OECD in the period under investigation, the CCC circle is confirmed.
67
3.2 Theoretical background: the OECD CCC model
The cumulative and circular causation (CCC model) describes the socio-economic dynamics
with a series of interrelated causations that form a non-equilibrium spiral. The model studies
the relationships between the four system components or building blocks in the following
sequence: corporate power, consumption, household and public debt, and inequality.
Moving from the right to the left, consistent with the defined sequence, the movement shows
a steady increase in all four parameters (Figure 1). With a static corporate power as C/CP0,
the movement is steady and in circular causation. With the change in the relationship
between corporate power and consumption, each level of corporate power is now related to
a higher level of consumption. The curve in sector 1 shifts upward as C/CP1 and therefore
generates an increase in all four parameters. There is a clear notion of a cumulative and
circular causation of the main identified variables. Growing corporate power leads to
consumption, driven by conspicuous consumption and consumerism, rising public and
household debt, and income inequality (Porenta, 2017). The CCC model suggests that
capitalism allowed corporations to increase their power so that they could influence both
consumers and the state, causing the power of capital to increase, aggravating inequality and
further stimulating the loop.
So far, an encompassing investigation of the data on the problems described has not been
done yet. However, several partial analyses that confirm the proposed linkages within the
main variables in the system do exist. The model has four key components, which can be
empirically evaluated and tested. Hereafter, each of them is briefly discussed.
3.2.1 Corporate power
The first component is the (increasing) corporate power. Although no common or standard
measurement of corporate power exists, there are some available metrics. Grant (1997)
proposed the following: industry concentration ratios, aggregate concentration ratios,
corporate interlocks/interlocking directorates, after-tax corporate profits as a percentage of
personal or national income, the ratio of the marginal product of labour to the real wage,
percentage of total government revenue derived from corporate profits taxes and percentage
of the labour force unionized. According to Grant (1997), of those measures, the percentage
of total government revenue derived from taxes on corporate profits and the percentage of
the labour force unionized appear to hold the most promise, particularly if one is interested
in empirically testing the hypothesis using time series analysis. Roach (2007) elaborated the
following measures: corporate economic statistics, industry concentration ratios, labour
union densities and corporate ability to reduce the taxes or acquire government subsidies. In
our study, the corporate economic statistics and labour union densities are used.
68
Relevant corporate economic statistics are derived from transnational corporations (TNCs)
since the TNCs are the world’s biggest firms. Globalization or internationalization is the
main determinant for the TNCs along with the pursuit of the optimal allocation of resources.
Costs are minimized by their seeking out of the countries with low labour costs, whereas the
profits are maximized in countries with low taxes, tax evasions, tax avoidances and
subsidies. Governments are competing for TNCs’ investments by changing their laws
regarding the minimum wage, subsidies and taxes. Incentives for new jobs make
governments even more compliant with TNCs’ demands. Additionally, they influence the
international trade agreements according to their interests. All these factors make TNCs very
powerful (Porenta, 2017). Nevertheless, the development of big corporations is also positive
due to their vast investments and improvements of technologies and other innovations.
UNCTAD (2007) has done an analysis of the evolution of the composition of the world’s
top 100 largest non-financial TNCs. By using quantitative measures, they showed the
indicators of both the growing economic importance of TNCs and their potential in global
activities. They found out that between 1990 and 2003, the values of assets of foreign
affiliates of the world’s TNCs had increased by a factor of five, and sales and employment
had multiplied respectively by three and two. At the same time, the world GDP in current
prices increased by 160 per cent. The report further argues that even those figures probably
understate the role of TNCs in the global economy both because of measurement difficulties
and because firms carry out their transnational activities through a variety of non-equity
arrangements, subcontracting, franchising, licensing, strategic alliances etc. These forms of
international expansion also occur with little or no FDI and are therefore only partially
captured by FDI data or firm-level data defined by equity participation. In 2004, the top 100
TNCs accounted for 11 per cent, 16 per cent and 12 per cent of the estimated foreign assets,
sales and employment, respectively, of all TNCs operating in the world, therefore playing a
major role in international production and trade.
The role of TNCs in the global economy is probably understated since TNCs are interlinked
in a very complex way. There is also a lack of transparency, informal agreements are not
revealed, and in reality, TNCs are even more connected due to various business agreements,
owning of each other’s shares or contracted associations. Vitali et al. (2011) have shown in
a study of complex systems that there is a core of 1,318 companies with interlocking
ownerships, where each of them has on average 20 connections to other companies.
Possessing 20 per cent of global operating revenues, they own the majority of the world's
large blue chip and manufacturing firms through their shares, adding thus further 60 per cent
of global revenues. They also found a super-core of 147 even more tightly knit companies,
where all of their ownership is held by other members of the super-entity, which controls 40
per cent of the total wealth in the network. In fact, less than 1 per cent of the companies are
able to control 40 per cent of the entire network.
69
Such concentration and centralization of capital and corporate power is actually evolving
from the properties of capitalism and its contradictions, namely, monopolies or oligopolies.
The capitalist system has the tendency to lead to the concentration and centralization of
capital, which is particularly typical of the 20th century, with the prevalence of the TNCs in
the global economy. The consequence is an exclusion of the effective price competition,
which resumes in line with the productivity increase and the decrease in production costs.
This is also done at the expense of the stagnation of real wages. Consequently, a large and
growing investment surplus emerges and encounters reduced investment markets (Baran &
Sweezy, 1966; Foster & Magdoff, 2009). Investment markets are reduced partly due to the
maturity of the economies and partly because of the increase in income inequality, which in
turn has a negative impact on consumption. For the investment of their surpluses, corporate
power has also invented new financial instruments, liberalization, globalization and other
leverages of influence. Indoctrination of the consumer, with very sophisticated marketing
techniques, is one of the main business activities of corporations. Advertising encourages
the emulation and conspicuous consumption by consumers, thus reinforcing excessive
consumerism with the social norm ‘keeping up with the Joneses’ (Porenta, 2017). Additional
leverage is also the influence on public opinion, exercised by ‘opinion leaders’ and ‘neutral’
experts who advocate corporate interests in a very sophisticated way. On the other hand, the
power of corporations is also enhanced by the weakening of the state. The bargaining power
of the state and its reform priorities have been shown to be influenced by capital, either
‘officially’ through lobbying or in less developed countries where claims of corruption are
common (e.g. Luo (2001) studies the impact of TNCs on host-countries’ governments).
Along with these contradictions of the properties of capitalism, big corporations also gain
advantages over the competition because of better organization and management, higher
efficiency and productivity, technological edge, and economies of scale and scope.
Nevertheless, with the rise in big corporations and their power, the market shifts more and
more towards imperfect competition. As a consequence, we do not have competitive markets
with a large number of firms with sovereign consumers, but rather non-competitive markets
with large firms that control the markets (John K. Galbraith, 1952, 1967). However, as
Pressman (2007) argues, firms cannot take the chance that after undertaking expensive
investment there will be no demand for their goods. They are eliminating the uncertainty of
market forces by controlling it through vertical integration, developing diverse products,
dealing with consumer taste changes and through long-term contracts between producers
and suppliers; probably most importantly, by spending money on advertising, firms can
actually control consumer tastes.
Hereafter, the following hypothesis will be tested; H1: In the OECD economies, corporate
power has been increasing.
70
3.2.2 Consumption
The second component relates to consumption. The most common is the relationship
between consumption and income, and modelled with the consumption function. There are
three main existing theories, based on the income dependent consumption expenditure
function pointed by Keynes: (1) Duesenberry (1949) relative income theory (RIH), where
consumption decisions are motivated by ‘relative’ consumption concerns or ‘keeping up
with the Joneses, (2) Modigliani and Brumberg (1954) life-cycle theory, which assumes that
household members choose their current expenditures optimally, taking account of their
spending needs and future income over the remainder of their lifetimes, and (3) Friedman
(1957a) permanent income hypothesis (PIH), a simplified version of the Modigliani model
and a criticism of the Keynes. PIH supposes that a person's consumption at a point in time
is determined not just by their current income but also by their expected income in future
years, their permanent income. It states that, rather than changes in temporary income,
changes in permanent income are those that drive the changes in a consumer's consumption
patterns (Meghir, 2004). It predicts consumption smoothing as a stable path of consumption
and, if needed, of savings and borrowing. PIH was then further tested by Hall (1978); Hall
and Mishkin (1982) and others.
Some recent research is based on Duesenberry’s contemporary behavioural models, like
behavioural foundations for the Keynesian consumption function (D’Orlando & Sanfilippo,
2010), an overlapping-generations economy with heterogeneous wealth levels (Alvarez-
Cuadrado & Van Long, 2011) and RIH as a synthetic Keynes–Duesenberry–Friedman model
(Palley, 2010). The latter suggests that consumption decisions are motivated by ‘relative’
consumption concerns or ‘keeping up with the Joneses.’ A second claim is that consumption
patterns are subject to habit and are slow to fall in the face of income reductions.
Redistributing income to lower income households is likely to have a net positive effect on
aggregate demand owing to ‘keeping up with the Joneses’ behaviour. The model suggests
that policy that constrains emulation behaviour can improve social welfare. In effect,
households are partially engaged in a form of consumption ‘arms race’. The rich try to
increase relative consumption, while lower income households try to keep up with the
Joneses.
In our model, household final consumption expenditure rose by 2.59 per cent on average in
the period from 1990 to 2013 (OECD countries), moderately outpacing the GDP growth of
2.17 per cent in the same period. Given the fact that in the same period, the median household
income growth was lower than the GDP growth, the consequence is growing household
indebtedness. The literature suggests that corporate power leads to consumption driven by
conspicuous consumption and evolving consumerism. The multicausal approach can be
dated back to Veblen (1899) and John K. Galbraith (1967). Veblen (1899) constructed the
term conspicuous consumption, which is based on evolutionary principles that are driven by
71
human instincts, mainly by emulation and predation, where people are trying to impress
others, gain advantage and signal their status. John K. Galbraith (1967) used conspicuous
consumption when explaining the dependence effect. He argues that corporations become
so strong that they eventually take control over competitors, workers and the market. They
spread control and influence into politics, government, and public opinion. The worker who
is at the same time a consumer becomes indoctrinated by privately owned media and
corporate marketing, buying many things that he or she does not really need. The result is a
huge production of unnecessary and unproductive private goods; on the other hand, there is
a lack of public goods. Consumerist consumption becomes the foundation of economic
growth. However, the problem is that real wages are stagnant and in a sharp contrast with
the rising productivity and profits (Kochan, 2013; Mishel & Shierholz, 2013; R. H. Scott &
Pressman, 2015), so the workers, who are at the same time the consumers, need to borrow
money in order to maintain the standard and social status demanded by society, the media
and marketing.
Nowadays, conspicuous consumption is more a socio-economic behaviour, which is also
common in poor social classes, where a person seeks a superior social status or the possibility
to at least maintain the existing one and eliminate the stigma of being poor or the
deterioration of one’s social status (Charles et al., 2007). Additionally, evolutionary
psychology also explains conspicuous consumption as a costly signal or a handicap
principle, demonstrating a person’s good socio-economic quality and his or her intention to
attract economic coalition partners or sexual mates, with the aim to improve one’s own status
and obtain the chance of reproduction (Iredale & van Vugt, 2012; Miller, 2009; Zehavi &
Zahavi, 1999), thus illustrating how marketing has exploited our inherited instincts to display
social status for reproductive advantage.
Empirical work by Benhabib and Bisin (2002, 2011) shows that advertising directly affects
the consumer’s preferences. Corporations exploit their power through advertising in order
to create new consumer needs. These needs are false. Individuals’ preferences, which are in
part a social phenomenon, are influenced by advertising. The effectiveness of corporate
advertising in enhancing the demand is also supported by Bagwell (2005) and Vakratsas and
Ambler (1999). In turn, advertising has a relevant impact on aggregate consumption
(Molinari & Turino, 2013) and thus on other macroeconomic aggregates.
Dependence effect and revised sequence have shown to be the most powerful corporate tools
in today’s economy, as Porenta (2017) suggests. Corporations control workers, competitors,
markets, governments, public opinion and consumers. They succeed in reversing the
classical view of the consumer-production relationship, namely that the consumer is the one
who controls the producer. Such a revised sequence cannot be attained without the
dependence effect. It is this dependence effect with its passive and active aspects that drive
the revised sequence and the success of corporate advertising. The roots of the dependence
72
effect are both in conspicuous consumption and the handicap principle. The latter actually
drives conspicuous consumption, the dependence effect and corporate power. Corporations
are keen to exploit one of the most powerful human instincts—the reproduction and display
of the social status—, thus fostering consumerism as a marketing-dominated culture.
Consumers who are at the same time also workers with stagnant real wages as a result of
increasing corporate power and increasing income inequality are eager to maintain or obtain
their social status. In many cases, they do not even strive to improve their social status, but
merely maintain the existing standard or hide their impoverishment.
Hereafter, the following hypothesis will be tested; H2: The increased corporate power
caused increased consumption.
3.2.3 Debt
The third component of the model relates to household and public debt. An important factor
to consider is the consequence of stagnation of mature economies, where corporations are
forced to seek new markets to invest their surpluses, and where even the new technologies
markets are insufficient. As a result, Porenta (2017) argues, the financial liberalization and
globalization have been imposed, and the financial sector has strongly overgrown the real
sector, which results in many problems for economy and society. Financial sector also gladly
credits the consumerist consumption to maintain demand and economic growth. Due to
stagnant wages, this consumption is largely driven by borrowing. The debt is mostly
consumptive and therefore not self-liquidating. It is not an investment expecting some future
cash inflow and liquidating itself with future revenues. Governments also decrease taxes for
top incomes and corporate revenues and consequently worsen their balance of payments
(Farnsworth & Fooks, 2015; Fieldhouse, 2013; Hungerford, 2012; Piketty et al., 2011;
Swank, 2002). Because of rising inequality and macroeconomic instability, public and
household debts also rise to maintain the consumption growth. This leads to boom-bust
credit cycles and eventually to a chronic weakness of economic demand. The consequences
of rising public debt, which also rises due to socializing private bubble busts, are less
effective countercyclical policies. Expansionary fiscal policy is constrained because of the
rising public debt, so it cannot spend more on infrastructure, education, human capital and
health care. In the case of tight monetary policy with higher interest rates, the rich benefit
because they can lend their money at higher rates and make profit while protecting their real
wealth against inflation. The lower and the middle class are mainly borrowers, so they are
faced with an additional cost of borrowing due to higher interest rates. In this situation with
strong countercyclical policies, the strongest part always profits, which makes the inequality
in the society only higher.
73
Growing income inequality also leads to workers’ inability to adapt to technological
changes, including skill biased and capital biased changes that result in additional
unemployment. Higher household debt causes that people cannot invest in their education
or increase their savings and, consequently, their wealth and financial independence. On the
other hand, higher public debt constrains the government to invest in education, health care,
social transfers and another infrastructure. Excessive consumerism accounts for
overprovided private goods and underprovided public goods, which reinforces inequality
and impoverishment. The effect is a state of private wealth and public impoverishment,
where the poverty is a cumulative and a self-driving circular causation. The poor are living
in a deprived community without proper education, health care and other public services.
They are unable to improve their skills, economic and political positions or their social
mobility, thus they stay trapped in vicious circle of poverty for generations (Dunn &
Pressman, 2005; John K. Galbraith, 1958).
As it can be observed from the data in our model, increased household consumption
expenditure outpaced disposable income, causing a drop-in household savings as a
percentage of household disposable income. The reasons for the decline in the personal
savings rate are increased personal consumption and higher mandatory transfers, such as
income taxes and security programmes. On the other hand, bottom 90 per cent income share
declined from around 70 per cent to 53 per cent in the period from 1975 to 2014, whereas
top 1 per cent income share grew from around 7 per cent to 13 per cent. Increased
consumption and stagnated or stalled income lead into borrowing. As a consequence of
people’s indebtedness, more people need social help. Rising social transfers lead to a further
rise in already increasing public debt due to the consequences of financial liberalization and
the bailouts of private capital (Azzimonti et al., 2014; Lora & Olivera, 2007). As elaborated
by Oh and Reis (2012), government expenditures increased rapidly across the OECD
countries from 2007 to 2009, where the median share of transfers accounts for 64 per cent
of the increase in spending. In the US, transfers account for 75 per cent of the fiscal
expenditure increase, or 3.4 per cent of GDP, whereas social transfers account for 2.72 per
cent of GDP. Social transfers have four categories: (1) retirement and disabilities, (2)
medical, (3) unemployment insurance and (4) income assistance and others. There has been
a large compositional shift away from US government purchases and towards transfers,
which more than tripled as a ratio of GDP over the past 50 years, and by 2007 accounted for
39 per cent of the total budget.
Empirical evidence has shown that the increasing household debt is significantly affected by
positive changes in consumer price index, gross domestic product and household
consumption (Meniago et al., 2013). Prior to the Great Recession, US households had record
high debt levels and record low savings rates. Highly leveraged consumption boosted
economic growth. However, large debt burdens have led many families to deleverage, but
74
deleveraging has been insufficient. Debt levels, especially for home mortgages, remain high
by historical standards (R. H. Scott & Pressman, 2015). Next, the debt dynamics equation
analysis shows that the rapid rise in the ratio of household debt to disposable income is
attributable not only to the increase in household asset purchases but also to the dampened
growth in disposable income and the reduced savings rate (Kim et al., 2014). The decision
to raise debt related to average income in the own residential area indicates that conspicuous
consumption is partly financed by debt (Berlemann & Salland, 2016), which leads to the
study by Nepomuceno and Laroche (2015). They argue that the happiness dimension of
materialism correlates positively with personal debt and negatively with account balances.
Hereafter, the following hypothesis will be tested; H3: Increased consumption caused higher
household and public debt.
3.2.4 Inequality
The fourth component of the model relates to inequality. The study by Azzimonti et al.
(2014) shows that rising public debt, financial liberalization and increased income inequality
are highly correlated. It also reveals that trade liberalization and economic globalization
increase economic inequality (Bergh & Nilsson, 2010). The index of financial liberalization,
constructed by Abiad, Detragiache, and Tressel (2010b), confirms that the world’s financial
markets have become less regulated since the early 1980s. Financial liberalization and
innovation have also facilitated the borrowers’ access to credit that was previously denied,
as well as relaxed financing constraints on the first-time homebuyers. According to OECD
(2006) report, the household debt rose to historical levels in a number of countries. It has
been driven by a combination of favourable financial conditions and buoyant housing
markets. There have also been a number of supply-side innovations in credit markets that
have eased the access to credit for lower-income borrowers and reduced financial constraints
for the first-time homebuyers. As OECD (2013) reports, households remain highly indebted
in a large number of OECD economies.
Decreased union density and workers’ bargaining power, along with indebted households,
can be seen in income distribution. The latter clearly indicates that income inequality is
increasing. Due to the high economic power of corporations or capital, their bargaining
power in the division of the pie increased, which undermines the position of the workers in
the society and increases inequality between capital owners and workers. Hence, a more
equal distribution of income is needed (Arestis & Gonzalez-Martinez, 2016; Crespo,
Moreira, & Simoes, 2015). Empirical studies have shown that there is a long period of flat
or stagnant wages (Mishel & Shierholz, 2013), which only reinforces economic inequality.
Inequality is further increasing due to a decrease in taxes (Fieldhouse, 2013) and there has
been a strong correlation between the cuts in top tax rates and the increases in top 1 per cent
75
income shares since 1975 in 18 OECD countries; however, the top income share increases
have not been translated into a higher economic growth (Piketty et al., 2011). Another sharp
distinction is the wealth and assets owned, with the bottom half of the global population
owning less than 1 per cent of the total wealth. On the other hand, the richest 10 per cent
hold 86 per cent of the world’s wealth, and the top 1 per cent alone account for 46 per cent
of global assets (CSRI, 2013). As the study by Davies, Sandstrom, Shorrocks, and Wolff
(2008) has shown, wealth is globally even more concentrated than income both on an
individual and national basis.
Piketty and Saez (2003) have also shown that, in the US, the share of total pre-tax income
accruing to the top 1 per cent has more than doubled since the 1970s. Similarly, OECD
(2016b) also shows increasing inequality, as well as increasing private and public
indebtedness. While the latter is a normal consequence of the developing financial system,
a side-effect is also an increased dependency of debtors on the financial system (again
capital). Since empirical studies also show that high inequality slows down economic growth
(Ostry et al., 2014) and increases political instability (Ortiz & Cummins, 2011) and
unemployment (James K. Galbraith, 2012), this circular motion endangers the long-term
sustainability of the existing socio-economic model.
The recent crisis raised the criticism and demanded a change. In this aspect, it is interesting
how democracy is related to redistribution and inequality. The usual model of democracy
presumes that median voters employ their voting rights in a democratic system to reallocate
funds from the wealthier towards themselves. However, Acemoglu et al. (2013) and
Josifidis, Dragutinović Mitrović, Supić, and Glavaški (2016) have shown that there is a
limited effect of democracy on inequality, thus not confirming this standard model.
Inequality tends to increase after the democratization. The reason for that can be that
democracy may be captured or constrained. Although democracy changes, the distribution
of ‘de jure’ power in society, policy outcomes and inequality also depend on the ‘de facto’
distribution of power. Powerful elites who see their de jure power eroded by democratization
may increase their investments in de facto power, implemented in controlling the local or
state law enforcement, lobbying, or influencing the party system and politicians.
Increased income inequality, along with the vicious circle of impoverishment, also leads
towards social inequality and the accompanying deterioration of their health and mental
condition, not to mention the stress and bad quality of life (Porenta, 2017). The study by
Wilkinson and Pickett (2011) has shown that there are pernicious effects of inequality on
societies: eroding trust, increasing anxiety and illness, and excessive consumption. The
societies which do best for their citizens are those with the smallest income inequality,
whereas the most unequal societies, such as the US, the UK and Portugal, do worst. Thus,
the status and income differences have social and health consequences. Bergh and Bjørnskov
(2014) studied the correlation between social trust and income equality, where trust may
76
influence equality through an increase in the welfare state. The results show that although
trust enables welfare state policies, i.e. redistribution to decrease net inequality, this
reduction in inequality does not increase trust.
The consequences of rising corporate power are increasing income and wealth inequality.
Corporate power influences workers, markets, politics, government and society, and is
imposing such distribution and redistribution of income that favours companies and rich
individuals. Increased corporate power causes financial liberalization and reduced taxes,
budget deficits as well as increased social transfers, fewer investments in education and
human capital, less social mobility and, consequently, a vicious circle of poverty entrapment.
The rising corporate power leads to increased consumerism and consumption, which, in turn,
results in increased household debt due to the stagnant real wages. These increasing
inequalities have an immense impact on individuals, people and society. People’s life
becomes worse, their indebtedness is on the rise, the possibilities of better education are
fewer, and their social mobility declines. Unemployment is rising or stalling, but never really
disappearing. The environmental problems and its degradation worsen the quality of life;
natural resources are destroyed. Such a path is clearly not sustainable and it cannot bring
about the prosperity, as Porenta (2017) has shown.
Hereafter, the following hypotheses will be tested; H4: Higher household and public debt
caused higher income inequality; H5: Higher income inequality has influenced the increased
corporate power.
3.3 Data and methodology
3.3.1 Econometric technique
Partial analysis of the main system variables is followed by a synthesis of partial equations
into a system of simultaneous equations. The CCC model has five main system variables,
which also appear as explanatory variables in other equations.
The following equations of the model are tested (the variables' labels are described in Table
2):
𝑇𝐴𝑡 = 𝛽0 + 𝛽1𝐼𝑁𝐸𝑡 + 𝛽2𝐹𝐿𝐼𝑡 + 𝛽3𝑇𝑈𝐷𝑡 + 𝜖1𝑡 (42)
𝑇𝑆𝑡 = 𝛽4 + 𝛽5𝐼𝑁𝐸𝑡 + 𝛽6𝐹𝐿𝐼𝑡 + 𝛽7𝑇𝑈𝐷𝑡 + 𝜖2𝑡 (43)
𝑇𝐸𝑡 = 𝛽8 + 𝛽9𝐼𝑁𝐸𝑡 + 𝛽10𝐹𝐿𝐼𝑡 + 𝛽11𝑇𝑈𝐷𝑡 + 𝜖3𝑡 (44)
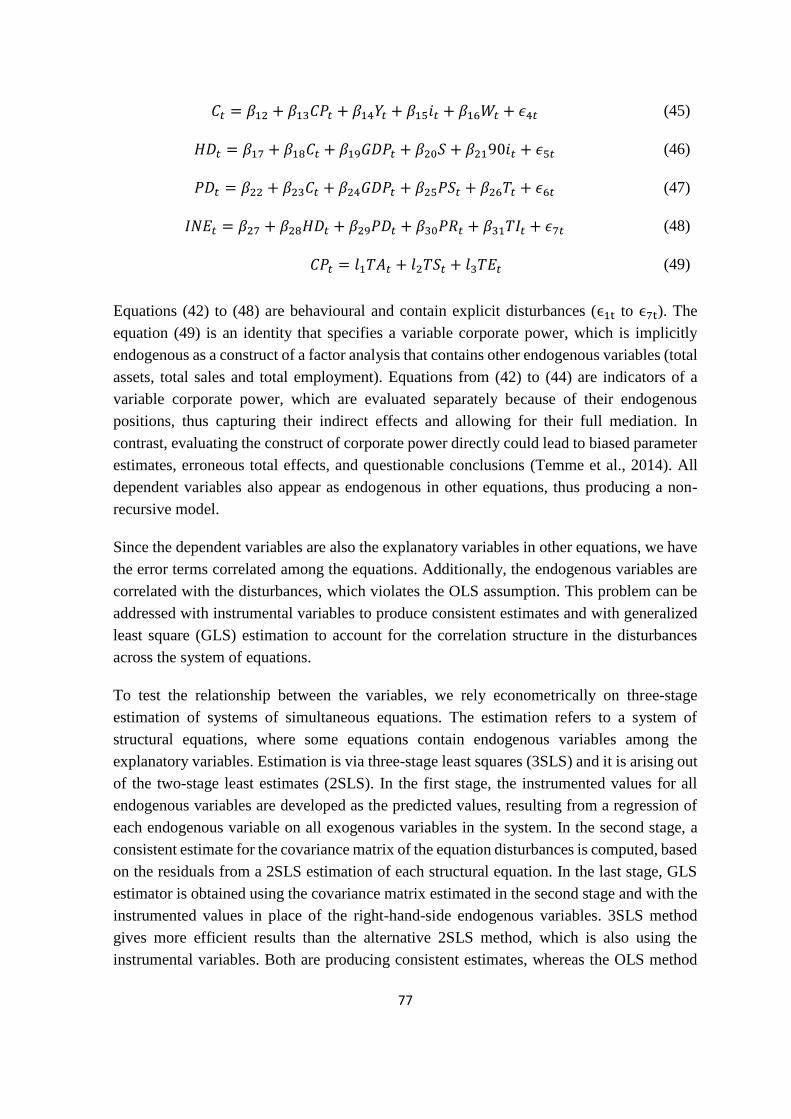
77
𝐶𝑡 = 𝛽12 + 𝛽13𝐶𝑃𝑡 + 𝛽14𝑌𝑡 + 𝛽15𝑖𝑡 + 𝛽16𝑊𝑡 + 𝜖4𝑡 (45)
𝐻𝐷𝑡 = 𝛽17 + 𝛽18𝐶𝑡 + 𝛽19𝐺𝐷𝑃𝑡 + 𝛽20𝑆 + 𝛽2190𝑖𝑡 + 𝜖5𝑡 (46)
𝑃𝐷𝑡 = 𝛽22 + 𝛽23𝐶𝑡 + 𝛽24𝐺𝐷𝑃𝑡 + 𝛽25𝑃𝑆𝑡 + 𝛽26𝑇𝑡 + 𝜖6𝑡 (47)
𝐼𝑁𝐸𝑡 = 𝛽27 + 𝛽28𝐻𝐷𝑡 + 𝛽29𝑃𝐷𝑡 + 𝛽30𝑃𝑅𝑡 + 𝛽31𝑇𝐼𝑡 + 𝜖7𝑡 (48)
𝐶𝑃𝑡 = 𝑙1𝑇𝐴𝑡 + 𝑙2𝑇𝑆𝑡 + 𝑙3𝑇𝐸𝑡 (49)
Equations (42) to (48) are behavioural and contain explicit disturbances (ϵ1t to ϵ7t). The
equation (49) is an identity that specifies a variable corporate power, which is implicitly
endogenous as a construct of a factor analysis that contains other endogenous variables (total
assets, total sales and total employment). Equations from (42) to (44) are indicators of a
variable corporate power, which are evaluated separately because of their endogenous
positions, thus capturing their indirect effects and allowing for their full mediation. In
contrast, evaluating the construct of corporate power directly could lead to biased parameter
estimates, erroneous total effects, and questionable conclusions (Temme et al., 2014). All
dependent variables also appear as endogenous in other equations, thus producing a non-
recursive model.
Since the dependent variables are also the explanatory variables in other equations, we have
the error terms correlated among the equations. Additionally, the endogenous variables are
correlated with the disturbances, which violates the OLS assumption. This problem can be
addressed with instrumental variables to produce consistent estimates and with generalized
least square (GLS) estimation to account for the correlation structure in the disturbances
across the system of equations.
To test the relationship between the variables, we rely econometrically on three-stage
estimation of systems of simultaneous equations. The estimation refers to a system of
structural equations, where some equations contain endogenous variables among the
explanatory variables. Estimation is via three-stage least squares (3SLS) and it is arising out
of the two-stage least estimates (2SLS). In the first stage, the instrumented values for all
endogenous variables are developed as the predicted values, resulting from a regression of
each endogenous variable on all exogenous variables in the system. In the second stage, a
consistent estimate for the covariance matrix of the equation disturbances is computed, based
on the residuals from a 2SLS estimation of each structural equation. In the last stage, GLS
estimator is obtained using the covariance matrix estimated in the second stage and with the
instrumented values in place of the right-hand-side endogenous variables. 3SLS method
gives more efficient results than the alternative 2SLS method, which is also using the
instrumental variables. Both are producing consistent estimates, whereas the OLS method
78
gives us biased estimates of the parameters (Davidson & MacKinnon, 1993; Greene, 2012;
Stata, 2016; Zellner & Theil, 1962).
For preliminary test of unit-roots and stationarity we used Augmented Dicky-Fuller (ADF)
test (Dickey & Fuller, 1979) and Dicky-Fuller Generalized Least Square (DF GLS) test. The
later can overcome the problems of ADF tests with reliability of small sample data due to
their size and power properties (DeJong, Nankervis, Savin, & Whiteman, 1992a, 1992b).
The ADF test can over reject the null hypothesis when it is true (Type I error) and fail to
reject it when it is false (Type II error). DF GLS unit-root test performs a modified Dickey-
Fuller t-test for a unit root in which the series has been transformed by a generalized least
squares regression, and where the power can be improved when an unknown mean or trend
is present (Elliott, Rothenberg, & Stock, 1996; Schwert, 1989). The results of these tests are
presented in Table 2.
3.3.2 Data
Henceforward, this chapter focuses on the sample of OECD economies between 1990 and
2013. Though, there are some substantial institutional differences between OECD
economies, the common denominator are TNCs. OECD economies were used because 85
per cent of the top 100 TNCs were headquartered in the Triad (EU, US and Japan), with
TNCs headquartered in the US dominating the list with 25 entries. Five countries, the US,
the UK, Japan, France and Germany, accounted for 73 per cent of the top 100 firms, while
the EU alone represented 53 per cent of all entries in 2004. Top100 TNCs are therefore
predominantly coming from Triad, changing its share from 100 per cent back in 1990 to
around 85 per cent in 2013. Some possible limitations of the analysis could be due to the
short time series. Prolonging the time series could deliver more efficient results.
Nevertheless, the time horizon of 24 years was chosen upon the data availability and it is
capturing the period of interests. The main variables of the model, its description and data
source are presented in Table 1.
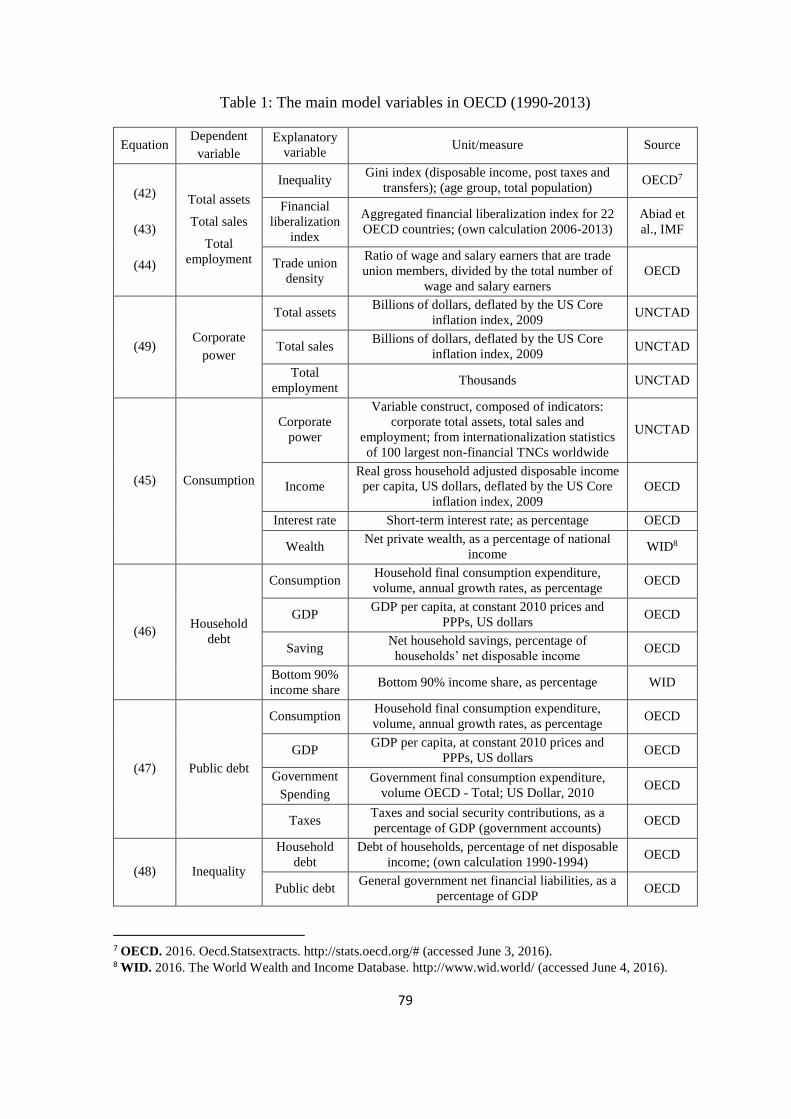
79
Table 1: The main model variables in OECD (1990-2013)
Equation Dependent
variable
Explanatory
variable Unit/measure Source
(42)
(43)
(44)
Total assets
Total sales
Total
employment
Inequality Gini index (disposable income, post taxes and
transfers); (age group, total population) OECD7
Financial
liberalization
index
Aggregated financial liberalization index for 22
OECD countries; (own calculation 2006-2013)
Abiad et
al., IMF
Trade union
density
Ratio of wage and salary earners that are trade
union members, divided by the total number of
wage and salary earners
OECD
(49) Corporate
power
Total assets Billions of dollars, deflated by the US Core
inflation index, 2009 UNCTAD
Total sales Billions of dollars, deflated by the US Core
inflation index, 2009 UNCTAD
Total
employment Thousands UNCTAD
(45) Consumption
Corporate
power
Variable construct, composed of indicators:
corporate total assets, total sales and
employment; from internationalization statistics
of 100 largest non-financial TNCs worldwide
UNCTAD
Income
Real gross household adjusted disposable income
per capita, US dollars, deflated by the US Core
inflation index, 2009
OECD
Interest rate Short-term interest rate; as percentage OECD
Wealth Net private wealth, as a percentage of national
income WID8
(46) Household
debt
Consumption Household final consumption expenditure,
volume, annual growth rates, as percentage OECD
GDP GDP per capita, at constant 2010 prices and
PPPs, US dollars OECD
Saving Net household savings, percentage of
households’ net disposable income OECD
Bottom 90%
income share Bottom 90% income share, as percentage WID
(47) Public debt
Consumption Household final consumption expenditure,
volume, annual growth rates, as percentage OECD
GDP GDP per capita, at constant 2010 prices and
PPPs, US dollars OECD
Government
Spending
Government final consumption expenditure,
volume OECD - Total; US Dollar, 2010 OECD
Taxes Taxes and social security contributions, as a
percentage of GDP (government accounts) OECD
(48) Inequality
Household
debt
Debt of households, percentage of net disposable
income; (own calculation 1990-1994) OECD
Public debt General government net financial liabilities, as a
percentage of GDP OECD
7 OECD. 2016. Oecd.Statsextracts. http://stats.oecd.org/# (accessed June 3, 2016). 8 WID. 2016. The World Wealth and Income Database. http://www.wid.world/ (accessed June 4, 2016).
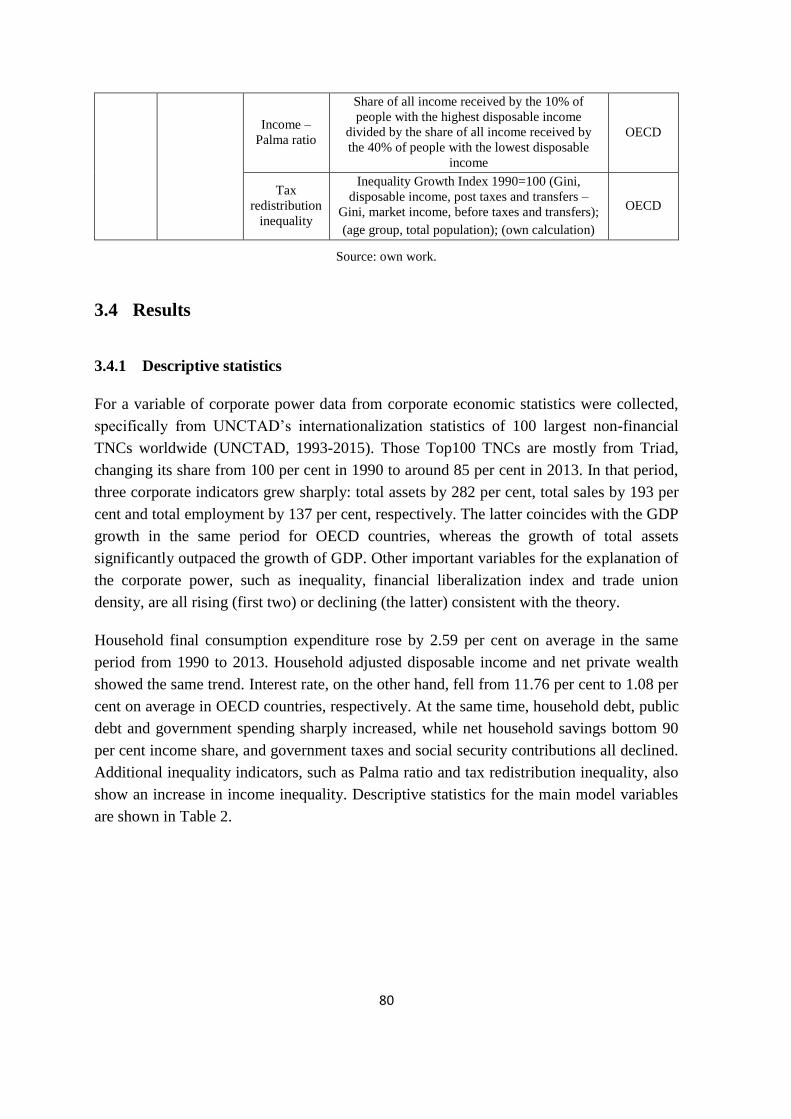
80
Income –
Palma ratio
Share of all income received by the 10% of
people with the highest disposable income
divided by the share of all income received by
the 40% of people with the lowest disposable
income
OECD
Tax
redistribution
inequality
Inequality Growth Index 1990=100 (Gini,
disposable income, post taxes and transfers –
Gini, market income, before taxes and transfers);
(age group, total population); (own calculation)
OECD
Source: own work.
3.4 Results
3.4.1 Descriptive statistics
For a variable of corporate power data from corporate economic statistics were collected,
specifically from UNCTAD’s internationalization statistics of 100 largest non-financial
TNCs worldwide (UNCTAD, 1993-2015). Those Top100 TNCs are mostly from Triad,
changing its share from 100 per cent in 1990 to around 85 per cent in 2013. In that period,
three corporate indicators grew sharply: total assets by 282 per cent, total sales by 193 per
cent and total employment by 137 per cent, respectively. The latter coincides with the GDP
growth in the same period for OECD countries, whereas the growth of total assets
significantly outpaced the growth of GDP. Other important variables for the explanation of
the corporate power, such as inequality, financial liberalization index and trade union
density, are all rising (first two) or declining (the latter) consistent with the theory.
Household final consumption expenditure rose by 2.59 per cent on average in the same
period from 1990 to 2013. Household adjusted disposable income and net private wealth
showed the same trend. Interest rate, on the other hand, fell from 11.76 per cent to 1.08 per
cent on average in OECD countries, respectively. At the same time, household debt, public
debt and government spending sharply increased, while net household savings bottom 90
per cent income share, and government taxes and social security contributions all declined.
Additional inequality indicators, such as Palma ratio and tax redistribution inequality, also
show an increase in income inequality. Descriptive statistics for the main model variables
are shown in Table 2.
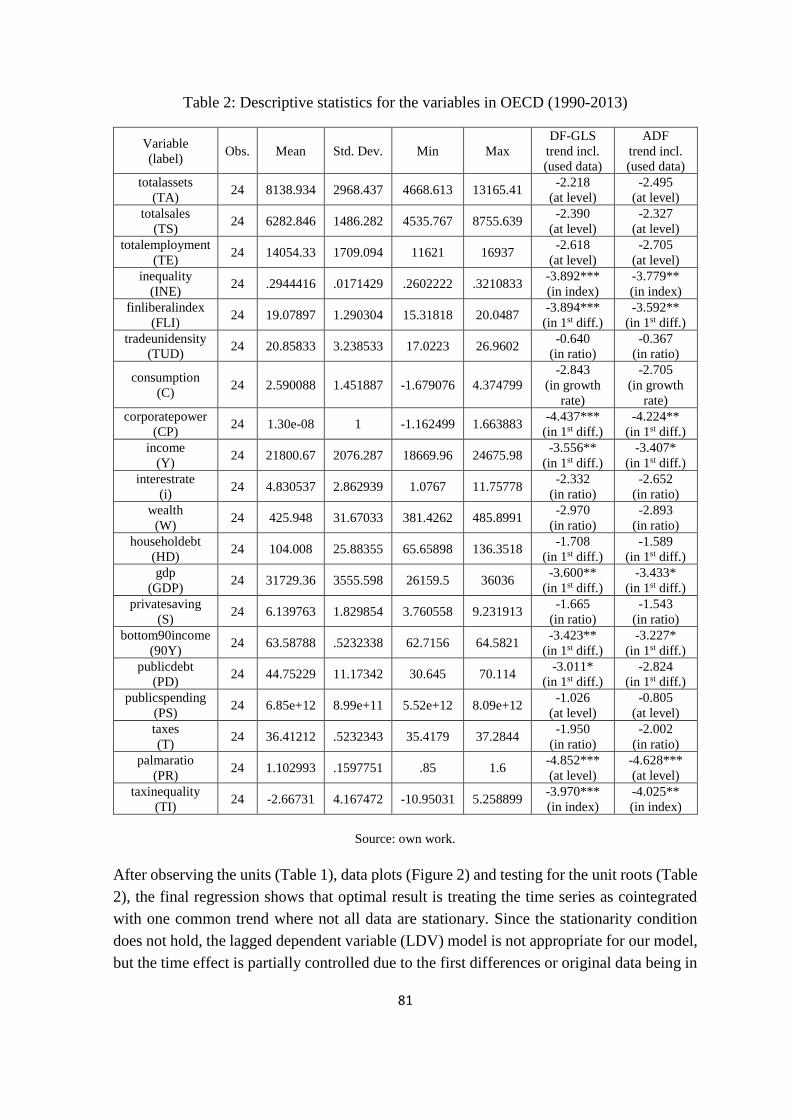
81
Table 2: Descriptive statistics for the variables in OECD (1990-2013)
Variable
(label) Obs. Mean Std. Dev. Min Max
DF-GLS
trend incl.
(used data)
ADF
trend incl.
(used data)
totalassets
(TA) 24 8138.934 2968.437 4668.613 13165.41
-2.218
(at level)
-2.495
(at level)
totalsales
(TS) 24 6282.846 1486.282 4535.767 8755.639
-2.390
(at level)
-2.327
(at level)
totalemployment
(TE) 24 14054.33 1709.094 11621 16937
-2.618
(at level)
-2.705
(at level)
inequality
(INE) 24 .2944416 .0171429 .2602222 .3210833
-3.892***
(in index)
-3.779**
(in index)
finliberalindex
(FLI) 24 19.07897 1.290304 15.31818 20.0487
-3.894***
(in 1st diff.)
-3.592**
(in 1st diff.)
tradeunidensity
(TUD) 24 20.85833 3.238533 17.0223 26.9602
-0.640
(in ratio)
-0.367
(in ratio)
consumption
(C) 24 2.590088 1.451887 -1.679076 4.374799
-2.843
(in growth
rate)
-2.705
(in growth
rate)
corporatepower
(CP) 24 1.30e-08 1 -1.162499 1.663883
-4.437***
(in 1st diff.)
-4.224**
(in 1st diff.)
income
(Y) 24 21800.67 2076.287 18669.96 24675.98
-3.556**
(in 1st diff.)
-3.407*
(in 1st diff.)
interestrate
(i) 24 4.830537 2.862939 1.0767 11.75778
-2.332
(in ratio)
-2.652
(in ratio)
wealth
(W) 24 425.948 31.67033 381.4262 485.8991
-2.970
(in ratio)
-2.893
(in ratio)
householdebt
(HD) 24 104.008 25.88355 65.65898 136.3518
-1.708
(in 1st diff.)
-1.589
(in 1st diff.)
gdp
(GDP) 24 31729.36 3555.598 26159.5 36036
-3.600**
(in 1st diff.)
-3.433*
(in 1st diff.)
privatesaving
(S) 24 6.139763 1.829854 3.760558 9.231913
-1.665
(in ratio)
-1.543
(in ratio)
bottom90income
(90Y) 24 63.58788 .5232338 62.7156 64.5821
-3.423**
(in 1st diff.)
-3.227*
(in 1st diff.)
publicdebt
(PD) 24 44.75229 11.17342 30.645 70.114
-3.011*
(in 1st diff.)
-2.824
(in 1st diff.)
publicspending
(PS) 24 6.85e+12 8.99e+11 5.52e+12 8.09e+12
-1.026
(at level)
-0.805
(at level)
taxes
(T) 24 36.41212 .5232343 35.4179 37.2844
-1.950
(in ratio)
-2.002
(in ratio)
palmaratio
(PR) 24 1.102993 .1597751 .85 1.6
-4.852***
(at level)
-4.628***
(at level)
taxinequality
(TI) 24 -2.66731 4.167472 -10.95031 5.258899
-3.970***
(in index)
-4.025**
(in index)
Source: own work.
After observing the units (Table 1), data plots (Figure 2) and testing for the unit roots (Table
2), the final regression shows that optimal result is treating the time series as cointegrated
with one common trend where not all data are stationary. Since the stationarity condition
does not hold, the lagged dependent variable (LDV) model is not appropriate for our model,
but the time effect is partially controlled due to the first differences or original data being in
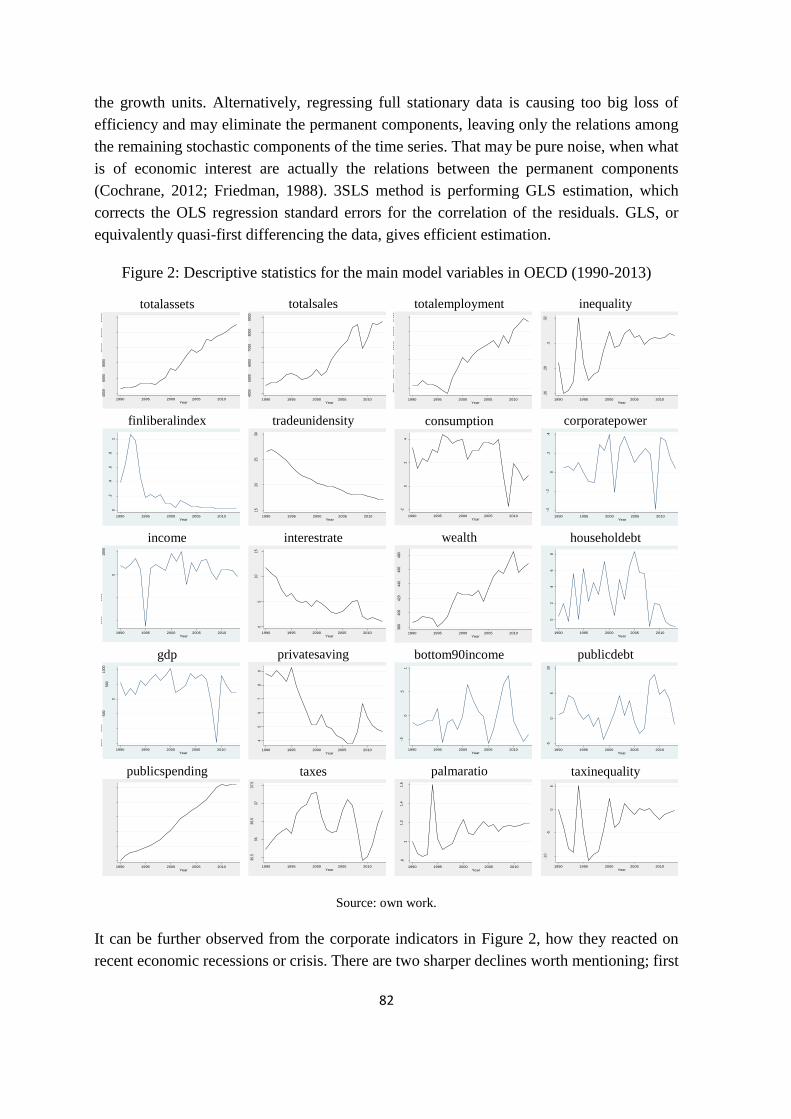
82
the growth units. Alternatively, regressing full stationary data is causing too big loss of
efficiency and may eliminate the permanent components, leaving only the relations among
the remaining stochastic components of the time series. That may be pure noise, when what
is of economic interest are actually the relations between the permanent components
(Cochrane, 2012; Friedman, 1988). 3SLS method is performing GLS estimation, which
corrects the OLS regression standard errors for the correlation of the residuals. GLS, or
equivalently quasi-first differencing the data, gives efficient estimation.
Figure 2: Descriptive statistics for the main model variables in OECD (1990-2013)
Source: own work.
It can be further observed from the corporate indicators in Figure 2, how they reacted on
recent economic recessions or crisis. There are two sharper declines worth mentioning; first
totalassets
totalsales
totalemployment
inequality
finliberalindex
tradeunidensity
consumption
corporatepower
income
interestrate
wealth
householdebt
gdp
privatesaving
bottom90income
publicdebt
publicspending
taxes
palmaratio
taxinequality
400
06
00
08
00
01
00
00
120
00
140
00
tota
lass
ets
1990 1995 2000 2005 2010 2015Year
400
05
00
06
00
07
00
08
00
09
00
0
tota
lsale
s
1990 1995 2000 2005 2010 2015Year
120
00
130
00
140
00
150
00
160
00
170
00
tota
lem
plo
ymen
t
1990 1995 2000 2005 2010 2015Year
.26
.28
.3.3
2
ine
qu
alit
y
1990 1995 2000 2005 2010 2015Year
0.2
.4.6
.81
finlib
era
linde
x_d
1
1990 1995 2000 2005 2010 2015Year
15
20
25
30
trad
eu
nid
ensi
ty
1990 1995 2000 2005 2010 2015Year
-20
24
consu
mptio
n2
1990 1995 2000 2005 2010 2015Year
-.4
-.2
0.2
.4
FA
C1
_1
_d
1
1990 1995 2000 2005 2010 2015Year
-200
0-1
00
0
0
100
0
inco
me3
_d
1
1990 1995 2000 2005 2010 2015Year
05
10
15
inte
rest
rate
1990 1995 2000 2005 2010 2015Year
380
400
420
440
460
480
wea
lth
1990 1995 2000 2005 2010 2015Year
02
46
8
priva
tede
bt_
d1
1990 1995 2000 2005 2010 2015Year
-150
0-1
00
0-5
00
0
500
100
0
gdp
_d
1
1990 1995 2000 2005 2010 2015Year
45
67
89
priva
tesa
ving
1990 1995 2000 2005 2010 2015Year
-.5
0.5
1
botto
m90
inco
me
_d
1
1990 1995 2000 2005 2010 2015Year
-50
51
0
pub
licde
bt2
_d1
1990 1995 2000 2005 2010 2015Year
5.5
e+
12
6.0
e+
12
6.5
e+
12
7.0
e+
12
7.5
e+
12
8.0
e+
12
pub
licsp
end
ing
1990 1995 2000 2005 2010 2015Year
35.5
36
36.5
37
37.5
taxe
s
1990 1995 2000 2005 2010 2015Year
.81
1.2
1.4
1.6
palm
ara
tio
1990 1995 2000 2005 2010 2015Year
-10
-50
5
taxi
ne
qu
alit
y
1990 1995 2000 2005 2010 2015Year
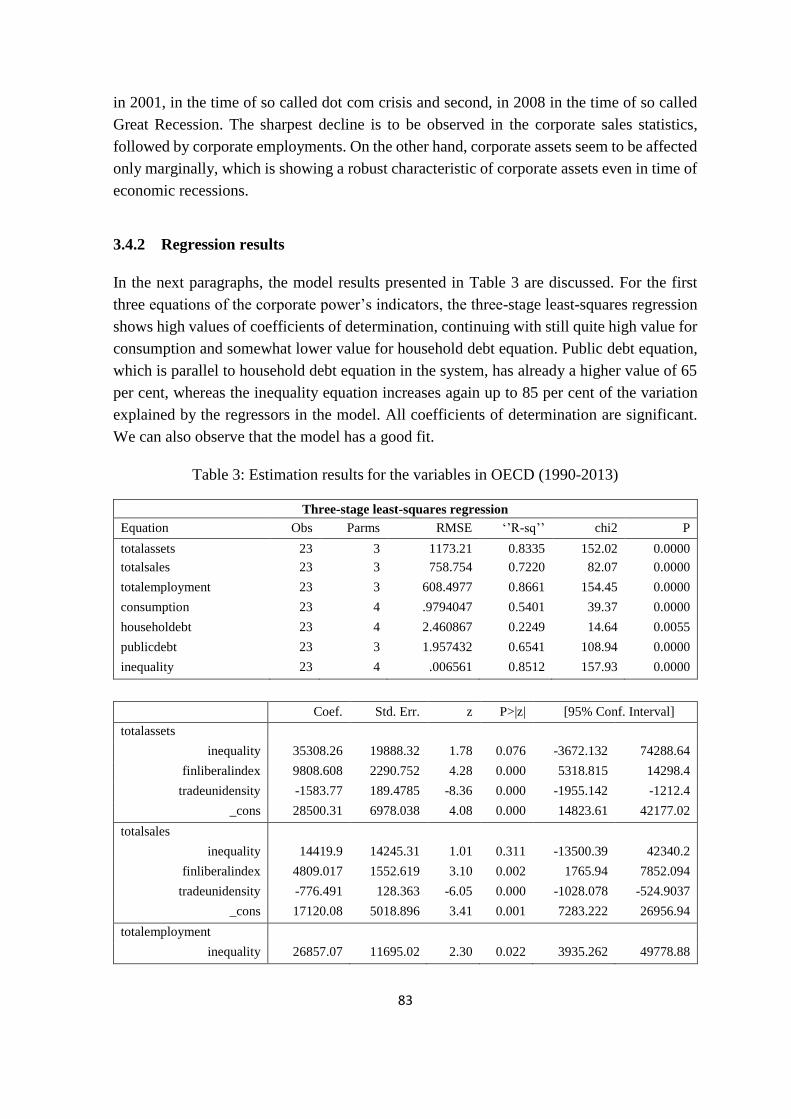
83
in 2001, in the time of so called dot com crisis and second, in 2008 in the time of so called
Great Recession. The sharpest decline is to be observed in the corporate sales statistics,
followed by corporate employments. On the other hand, corporate assets seem to be affected
only marginally, which is showing a robust characteristic of corporate assets even in time of
economic recessions.
3.4.2 Regression results
In the next paragraphs, the model results presented in Table 3 are discussed. For the first
three equations of the corporate power’s indicators, the three-stage least-squares regression
shows high values of coefficients of determination, continuing with still quite high value for
consumption and somewhat lower value for household debt equation. Public debt equation,
which is parallel to household debt equation in the system, has already a higher value of 65
per cent, whereas the inequality equation increases again up to 85 per cent of the variation
explained by the regressors in the model. All coefficients of determination are significant.
We can also observe that the model has a good fit.
Table 3: Estimation results for the variables in OECD (1990-2013)
Three-stage least-squares regression
Equation Obs Parms RMSE ‘’R-sq’’ chi2 P
totalassets 23 3 1173.21 0.8335 152.02 0.0000
totalsales 23 3 758.754 0.7220 82.07 0.0000
totalemployment 23 3 608.4977 0.8661 154.45 0.0000
consumption 23 4 .9794047 0.5401 39.37 0.0000
householdebt 23 4 2.460867 0.2249 14.64 0.0055
publicdebt 23 3 1.957432 0.6541 108.94 0.0000
inequality 23 4 .006561 0.8512 157.93 0.0000
Coef. Std. Err. z P>|z| [95% Conf. Interval]
totalassets
inequality 35308.26 19888.32 1.78 0.076 -3672.132 74288.64
finliberalindex 9808.608 2290.752 4.28 0.000 5318.815 14298.4
tradeunidensity -1583.77 189.4785 -8.36 0.000 -1955.142 -1212.4
_cons 28500.31 6978.038 4.08 0.000 14823.61 42177.02
totalsales
inequality 14419.9 14245.31 1.01 0.311 -13500.39 42340.2
finliberalindex 4809.017 1552.619 3.10 0.002 1765.94 7852.094
tradeunidensity -776.491 128.363 -6.05 0.000 -1028.078 -524.9037
_cons 17120.08 5018.896 3.41 0.001 7283.222 26956.94
totalemployment
inequality 26857.07 11695.02 2.30 0.022 3935.262 49778.88
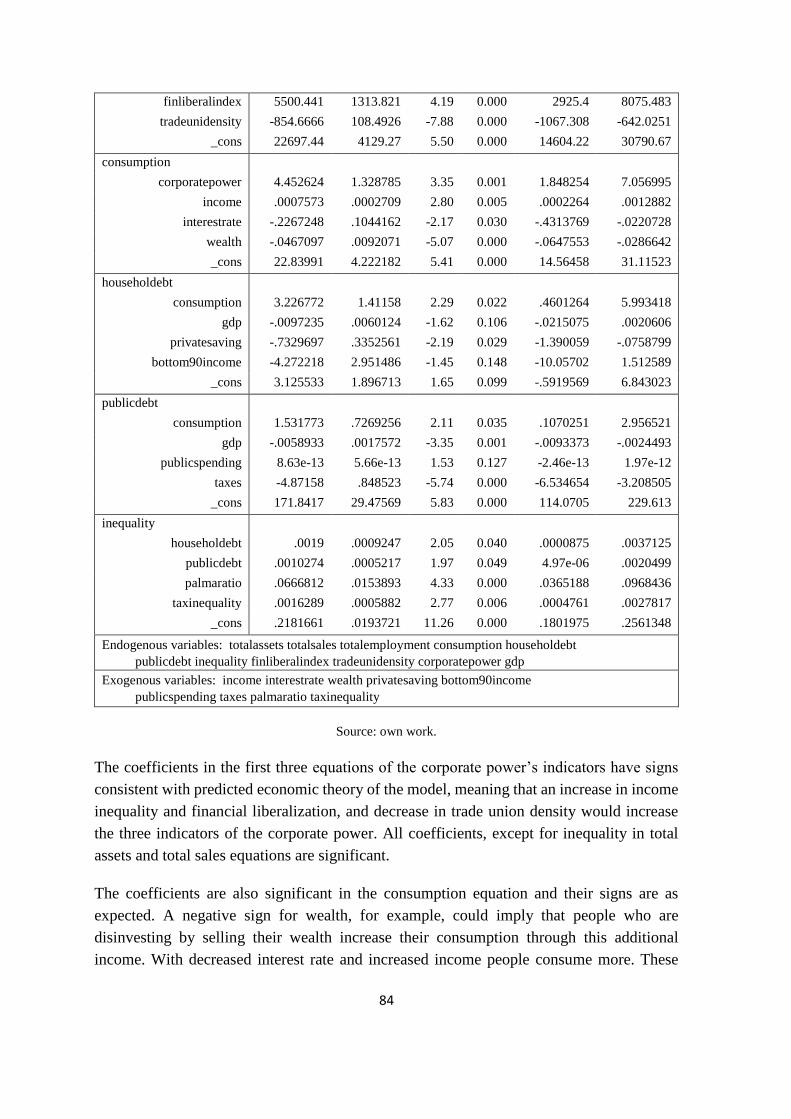
84
finliberalindex 5500.441 1313.821 4.19 0.000 2925.4 8075.483
tradeunidensity -854.6666 108.4926 -7.88 0.000 -1067.308 -642.0251
_cons 22697.44 4129.27 5.50 0.000 14604.22 30790.67
consumption
corporatepower 4.452624 1.328785 3.35 0.001 1.848254 7.056995
income .0007573 .0002709 2.80 0.005 .0002264 .0012882
interestrate -.2267248 .1044162 -2.17 0.030 -.4313769 -.0220728
wealth -.0467097 .0092071 -5.07 0.000 -.0647553 -.0286642
_cons 22.83991 4.222182 5.41 0.000 14.56458 31.11523
householdebt
consumption 3.226772 1.41158 2.29 0.022 .4601264 5.993418
gdp -.0097235 .0060124 -1.62 0.106 -.0215075 .0020606
privatesaving -.7329697 .3352561 -2.19 0.029 -1.390059 -.0758799
bottom90income -4.272218 2.951486 -1.45 0.148 -10.05702 1.512589
_cons 3.125533 1.896713 1.65 0.099 -.5919569 6.843023
publicdebt
consumption 1.531773 .7269256 2.11 0.035 .1070251 2.956521
gdp -.0058933 .0017572 -3.35 0.001 -.0093373 -.0024493
publicspending 8.63e-13 5.66e-13 1.53 0.127 -2.46e-13 1.97e-12
taxes -4.87158 .848523 -5.74 0.000 -6.534654 -3.208505
_cons 171.8417 29.47569 5.83 0.000 114.0705 229.613
inequality
householdebt .0019 .0009247 2.05 0.040 .0000875 .0037125
publicdebt .0010274 .0005217 1.97 0.049 4.97e-06 .0020499
palmaratio .0666812 .0153893 4.33 0.000 .0365188 .0968436
taxinequality .0016289 .0005882 2.77 0.006 .0004761 .0027817
_cons .2181661 .0193721 11.26 0.000 .1801975 .2561348
Endogenous variables: totalassets totalsales totalemployment consumption householdebt
publicdebt inequality finliberalindex tradeunidensity corporatepower gdp
Exogenous variables: income interestrate wealth privatesaving bottom90income
publicspending taxes palmaratio taxinequality
Source: own work.
The coefficients in the first three equations of the corporate power’s indicators have signs
consistent with predicted economic theory of the model, meaning that an increase in income
inequality and financial liberalization, and decrease in trade union density would increase
the three indicators of the corporate power. All coefficients, except for inequality in total
assets and total sales equations are significant.
The coefficients are also significant in the consumption equation and their signs are as
expected. A negative sign for wealth, for example, could imply that people who are
disinvesting by selling their wealth increase their consumption through this additional
income. With decreased interest rate and increased income people consume more. These
85
results are in accordance with the main existing theories based on income dependent
consumption function.
Increased consumption is leading towards increased household and public debt, which can
be observed in the fifth and sixth equations. Both coefficients are significant. Other
coefficients are also consistent with predicted economic theory and only three coefficients
are slightly above the threshold of 5 per cent of significance, two of them in the household
debt equation. With declined GDP, both household and public debt are increasing. When
private saving and the bottom 90 per cent income share are decreasing, the household debt
is rising, and when government expenditure is rising and government taxes are declining,
the public debt is rising.
All coefficients in the last equation of inequality are significant and have positive signs of
coefficients, which is again in the accordance with the predicted model. It can also be
observed that all the coefficients in the system are well within the 95 per cent confidence
intervals for the parameters. Rising household and public debt are causing increased income
inequality, and so are the rising tax redistribution inequality and the income palma-ratio.
Given the regression results, we can confirm the first hypothesis about the increasing
corporate power in the OECD economies in the period from 1990 to 2013. All three
corporate power’s indicators, total assets, total sales and total employment, have been rising
in that period. We can also confirm the next three hypotheses: increased corporate power
caused increased consumption, increased consumption caused higher household and public
debt, higher household and public debt caused higher income inequality. Finally, the fifth
hypothesis can be confirmed as well, higher income inequality has influenced the increased
corporate power or more precisely, the three corporate power’s indicators, total assets, total
sales and total employment.
3.5 Discussion and conclusion
In this chapter we will discuss the results in both terms, the cumulative and the circular
causation. The former aspect was described in the chapter of descriptive statistics and the
latter in the chapter of regression results. By combining both we can elaborate the
relationships between main variables and the dynamics of CCC model.
In the first sector (Figure 1), we can observe from our regression results that corporate
power positively influences consumption, meaning when corporate power rises consumption
rises. Descriptive statistics further shows that consumption and all three corporate indicators,
as well as corporate power variable construct, rose in the investigated period from 1990 to
2013. The additional explanatory variable of income positively affects consumption,
whereas interest rate and wealth negatively affect consumption, according to the regression
86
results. These results are consistent with predicted theory. Cumulative and the circular
causation aspects in the first sector of CCC model are confirmed.
As elaborated in the second chapter of the dissertation, the estimation model for consumption
was based on income dependent consumption function. The variable of corporate power, as
a construct of corporate indicators, considers the behavioural principles which are stemming
from the relative comparison of the consumers, i.e. ‘keeping up with the Joneses’ and their
consumer wants created on instinct-based psychology. The variable of real disposable
income is current income assumed to be the same as the expected long-term average income,
i.e. permanent income. Variables of interest rate and wealth additionally explain the effect
of saving and assets, like bequest or disinvesting, on the household consumption
expenditure.
Related literature confirms that the variable of corporate power is a good predictor of
consumption function. Consumption decisions are driven by ‘relative’ consumption
concerns, i.e. an individual's inclination to consumption motivated more by his income in
relation to others than by an abstract standard of living, or in other words, ‘keeping up with
the Joneses’ (Alvarez-Cuadrado & Van Long, 2011; D’Orlando & Sanfilippo, 2010;
Duesenberry, 1949; Palley, 2010). Additional factors that can explain the consumption
decisions are also their initial assets, i.e. wealth and the interest rate (Ando & Modigliani,
1963; Friedman, 1957b; Meghir, 2004; Modigliani & Brumberg, 1954). Thus, including
wealth and interest rate as explanatory variables of consumption function is reasonable.
In the second sector (Figure 1), we can observe from our regression results that consumption
positively influences the debt, both the household debt and the public debt. Descriptive
statistics shows that consumption, household debt and public debt, all increased in the
investigated period from 1990 to 2013. Additional explanatory variables of GDP, private
saving and bottom 90 per cent of income share, all negatively affect the household debt. In
the public debt equation, the additional explanatory variables of GDP and taxes negatively
affect the public debt, whereas public spending positively affects the public debt, according
to the regression results. These results are consistent with predicted theory, and cumulative
and the circular causation aspects in the second sector of CCC model are thus confirmed.
As presented in the second chapter of the dissertation, the estimation model for the household
debt was based on the following household debt function and variables. Variable
consumption captures high levels of consumption in GDP, in some developed countries even
at historical peak, while at the same time the people at the bottom 90 per cent of the income
distribution increased their borrowing. Variable GDP captures the overall country’s
economic condition. Variable private saving explains the effect of historically low savings
rates and excess consumption, whereas variable bottom 90 per cent of income share
considers the effect of very important income distribution changes. Financial deregulation is
87
also implicitly represented through variable consumption and subsequently through variable
corporate power and its predictor variable of financial liberalization index. This holds as
well for the interest rate and income.
The OECD CCC model is extended with the variable of public debt. Due to the fact that the
CCC transmission mechanisms are rather complex, incorporating the additional main system
variable can enable us a better understanding of how household debt is created, as well a
better understanding about the dynamics of the whole CCC model. The estimation model for
the public debt was based on the following public debt function and variables. First, variable
consumption captures elevated levels of consumption in GDP, while at the same time the
people from bottom 90 per cent of income distribution increased the borrowing, as well as
the public social transfers. Next, variable GDP captures the overall country’s economic
condition. Variable public spending considers among others the increased social transfers,
while the variable taxes captures the changes in government taxes revenues, like relevant
corporate and income taxations changes. Related literature confirm that the variable taxes
could be a relevant predictor for public debt changes. Governments are decreasing taxes for
top incomes and corporate revenues and consequently negatively impacting their balance of
payments (Farnsworth & Fooks, 2015; Fieldhouse, 2013; Hungerford, 2012; Piketty et al.,
2011; Swank, 2002). As further elaborated by Oh and Reis (2012), government expenditures
and especially social transfers increased rapidly across the OECD countries, therefore
making a variable of public spending a good predictor in public debt changes.
Related literature also confirms that the variable of consumption is a good predictor of the
household debt function. The demand financed by debt emerged from the credit creation
practises of lenders and financial deregulation. Household debt is rising due to consumption
partially financed by debt and driven by the imposed social norm ‘keeping up with the
Joneses’ or the so-called neighbourhood effect (Berlemann & Salland, 2016; Dynan & Kohn,
2007; Keen, 2009; Montgomerie, 2006; Nepomuceno & Laroche, 2015; RBA, 2003). Hence,
the variable of consumption is a good explanatory variable of household debt, along with
the GDP and saving (Meniago et al., 2013). On the other hand, household debt is also rising
due to a process of labour markets social restructuring, or, in other words, due to income
distribution changes and stagnant real wages (Barba & Pivetti, 2009; Debelle, 2004b;
Montgomerie, 2006). In this sense, the variable that captures changes in the bottom 90 per
cent of the income share is a good regressor of the household debt function.
In the third sector (Figure 1), we can observe from our regression results that household
debt and public debt are positively influencing inequality. Descriptive statistics show that
household debt, public debt and inequality all increased in the investigated period from 1990
to 2013. Additional explanatory variables of palma ratio and tax redistribution inequality,
both positively affect inequality, according to the regression results. These results are
88
consistent with predicted theory, cumulative and the circular causation aspects in the third
sector of CCC model are confirmed.
As elaborated in the second chapter of the dissertation, the estimation model for inequality
was based on the following inequality function and variables. Variable household debt
explains the household debt levels, whereas the palma ratio (90/40 differential) captures the
relative changes in the income distribution. In the OECD CCC model, the variable top 1 per
cent of income share is substituted, partly due to the data unavailability, with more relevant
explanatory variable of public debt, which captures the changes in the public debt. Variable
tax redistribution inequality captures the tax and transfer system role in reducing inequality,
measuring the effect between pre-tax and pots-tax income inequality.
Related literature confirms that the variable of household debt is a good predictor of the
inequality function. The Great Depression and the Great Recession were both the
consequence of income distribution changes and indebted households (Iacoviello, 2008;
Kumhof et al., 2015; Rajan, 2010; Reich, 2013). In these income distribution changes, which
lead towards income inequality, the 90/40 differential is a rather significant indicator (Mishel
et al., 2012; Mishel & Shierholz, 2013; Rajan, 2010; Reich, 2013; Saez & Zucman, 2016).
Household indebtedness also influences the changes of income inequality (Berisha &
Meszaros, 2017; Iacoviello, 2008; Kumhof et al., 2015), therefore the household debt is a
good predictor, as well as is the public debt due to constrained expansionary fiscal policy.
Further, the influence of taxes, particularly a tax and transfer system role in reducing
inequality (Harris & Sammartino, 2011; Hungerford, 2013), also makes the difference
between pre-tax inequality and post-tax inequality a feasible explanatory variable of overall
income inequality.
In the fourth sector (Figure 1), we can observe from our regression results that inequality
positively influences corporate power. Descriptive statistics shows that inequality and
corporate power indicators rose in the investigated period from 1990 to 2013. Additional
explanatory variable of financial liberalization index positively affects the corporate power
indicators, whereas variable of trade union density negatively affects the corporate power
indicators, according to the regression results. These results are again consistent with
predicted theory; therefore, the cumulative and the circular causation aspects in the fourth
sector of CCC model are confirmed.
As shown in the second chapter of the dissertation, the estimation model for the corporate
power was based on the following corporate power function and variables. Variable of
income inequality explains the effect of income inequality on corporate power, variable of
financial liberalization index captures the consequences of financial deregulation and
financial liberalization, whereas variable of trade union density considers the changes in the
trade union density.
89
We can further observe that related literature confirms that the inequality variable is a good
predictor of the corporate power function. Corporate influence on governments varies from
changing employment legislation to changing the regulatory legislation. Financial
deregulation and financial liberalization, along with financial globalization, increased the
corporate power of the transnational corporations. Additionally, one of the consequences of
financial deregulation is also higher household debt (Green et al., 2009; Kim et al., 2014;
RBA, 2003), induced by decreased restrictions on borrowing and increased relative
consumption (Alvarez-Cuadrado & Van Long, 2011; Brown et al., 2015; Palley, 2010). This
is accompanied by stagnant real wages and income distribution changes, i.e. income
inequality, which has resulted in increased bargaining power of the corporations and its
owners (Darity, 2008; Fieldhouse, 2013; Kumhof et al., 2015; Mishel et al., 2012;
Montgomerie, 2006; Piketty & Saez, 2003). Therefore, the financial liberalization index and
income inequality, as well as the trade union density, are good predictors of changes in
corporate power.
The aim of this research is to provide an empirical investigation of the cumulative and
circular causation (CCC) model. It examines the corporate power and its influence on
consumption, household and public debt, and inequality. As the existing literature shows,
relying on their corporate power, corporations have stimulated the rising consumerism and
reverse the classical view of consumer-production relationship. Such a revised sequence and
dependence effect, which has roots both in conspicuous consumption and handicap principle,
have shown to be the most powerful corporate tools in today’s economy. Corporations are
keen to exploit one of the most powerful human instincts of the reproduction and display of
the social status, thus fostering the consumerism. At the same time, literature shows that
consumers’ real wages stall or stagnate, which leads to increased borrowing and debt-driven
consumption, while retaining the same level of consumption and social norm ‘keeping up
with the Joneses’.
Such household debt is mostly consumptive and therefore not self-liquidating. In addition,
more people need social help. Rising social transfers lead to a further rise in public debt,
which is already increasing due to the consequences of financial liberalization and the
bailouts of private capital in the time of recessions. Rising public debt, financial
liberalization and increased income inequality are highly correlated and further studies show
that trade liberalization and economic globalization increase income inequality. Decreased
union density and workers’ bargaining power, along with indebted households, can be
noticed in income distribution. This clearly shows that income inequality is increasing and
that wealth is globally even more concentrated than income both on an individual and
national basis. All this further lead towards more social inequality and is only strengthening
corporate power.
90
We assessed the non-recursive structural model using the data for the OECD between 1990
and 2013, and three-stage least squares regression of a system of simultaneous structural
equations. Descriptive statistics show that all main system variables are rising in the
investigated period. The regression further shows significant and high values of coefficients
of determination. Most coefficients of regressors are significant and all coefficients have
signs consistent with predicted economic theory of the model. By combining both, the
descriptive statistics and regression results, we can elaborate the relationships between the
main variables and the dynamics of CCC model. The results support the notion of CCC of
the main identified variables. Growing corporate power causes increased consumption; this
results in surging household and public debt, which in turn causes rising inequality. Higher
inequality is further strongly and positively correlated with the corporate power’s indicators,
leading to an increase in corporate power. The main system variables are accumulating in
time, which is not economically and socially sustainable. Some of the consequences could
be: slower economic growth, social and health problems, fewer education opportunities,
lower human capital and lower social mobility, political instability and higher
unemployment.
This chapter makes several original contributions to the literature. First, it is the first
empirical investigation of the CCC relationship, corporate power and its influence on
consumption, household and public debt, and inequality. Second, it extends the knowledge
about the trends of rising corporate power and consumerism at macro level, and its
transmission mechanisms. It shows how system dynamics endangers social cohesion as well
as the results of the welfare state achievements.
91
4 EMPIRICS OF CUMULATIVE AND CIRCULAR CAUSATION
MODEL: US
ABSTRACT: This chapter tests the cumulative and circular causation (CCC) model on the
US data between 1973 and 2005. We can observe that all main system variables rose in the
analysed period. Rising corporate power leads towards increased consumption, which
causes growing household debt, and the latter leads further towards increasing inequality.
We can also observe that the dynamics in the US lead towards immense concentration of
income sources in the hands of the top per cents of the income distribution and towards
income distribution changes that only reinforce the rising corporate power. Corporations in
the US are investing vast resources into advertising, therefore fostering a consumerist
society and debt-driven consumption. Combining these facts with a historically high
consumption share in the US GDP, we can conclude that such system dynamics clearly
endanger social cohesion.
Keywords: corporate power, consumption, debt, non-recursive, cumulative circular
causation, inequality.
JEL Classification: B52, E02, P10
92
4.1 Introduction
Inequality has been steadily increasing in the US since the mid-1970s. This has been as a
direct result of the rising power of corporations and the social restructuring of labour
markets. The latter is a consequence of surging bargaining power of corporations that
resulted in income distribution changes. Workers’ bargaining power, on the other side, was
diminished, and in the US, the union density is below the OECD average. Rising corporate
power is further investing vast resources into advertising and the stimulation of consumption.
This process is not just a response to consumers’ needs, but rather a creation of wants that
are not organic. This inevitably results in overprovided private goods that are not really
needed and underprovided public goods, such as education, infrastructure or health. Due to
decreasing bottom 90 per cent of income share, such imposed consumption, i.e. social norm
‘keeping up with the Joneses’, results in indebted households and debt-driven demand. With
a historically high 70 per cent of consumption share in the US GDP, the system dynamics
endanger the sustainability and prosperity of the economy.
The purpose of this chapter is to empirically evaluate the validity of the proposed mechanism
of the cumulative and circular causation (CCC) model on a sample of US data from 1973 to
2005. We will show that (1) in the US, the corporate power has increased and financial
liberalization has stimulated this process. Next, the study will show that (2) rising corporate
power is stimulating household consumption, which is in line with the growing claims of
conspicuous consumption, driven by corporate power (marketing and wants creation).
Moreover, we will show that the (3) household indebtedness has been increasing, once more
supporting the increasing power of corporations and capital. We will provide evidence that
(4) inequality is growing, which has further reduced the bargaining power of workers, i.e.
consumers. Lastly, we show that (5) the circle continues in favour of capital. Overall, in the
US in the period under investigation, the CCC circle is confirmed.
The chapter extends the existing literature by providing empirical evidence to the growing
body of literature, and tests an extended model as suggested by Porenta (2017). Additionally,
it shows how system dynamics endangers social cohesion as well as the results of the welfare
state achievements. The structure of the chapter is the following. First, a theoretical
foundation is set, based on a presentation of four key components, which together comprise
the CCC model. Next, the data and methodology are presented, with the model build-up.
This is followed with regression results and discussion.
4.2 Theoretical background: the US CCC model
This chapter builds upon the empirical investigations of CCC model of OECD countries in
the period between 1990 and 2013, done by Porenta (2018). The CCC model describes the
93
socio-economic dynamics with a series of interrelated causations that form a non-
equilibrium spiral. The model analyses the relationships between the four system
components in the following sequence: corporate power, consumption, household debt, and
inequality. The CCC model suggests that capitalism allowed corporations to increase their
power so that they could influence both consumers and the state, causing the power of capital
to increase, aggravating inequality and further stimulating the loop. When moving from the
right to the left, consistent with the defined sequence, the movement shows a steady increase
in all four parameters (Figure 1). With a static corporate power as C/CP0, the movement is
steady and in circular causation. With the change in the relationship between corporate
power and consumption, each level of corporate power is now related to a higher level of
consumption. The curve in sector 1 shifts upward as C/CP1 and therefore generates an
increase in all four parameters. There is a clear notion of a cumulative and circular causation
of the main identified variables. As further shown by (Porenta, 2017), growing corporate
power leads to consumption, driven by conspicuous consumption and consumerism, rising
household debt and income inequality.
The analysis in this chapter focuses on the most important and dominant single economy in
the OECD and the world, namely the US. By focusing on a single and most significant world
economy, and prolonging the time series, we will deepen our knowledge of the trends of
rising corporate power and consumerism. The sheer size of the US economy makes its
macroeconomic implications of primary importance, as well as for the macroeconomic
performance of the world at large. Furthermore, from an analysis of the US we can acquire
some understanding of potential problems or benefits also for the other developed countries.
The model has four key components, which will be empirically evaluated and tested.
Hereafter, each of them is discussed.
4.2.1 Corporate power
The literature is rather scarce with empirical studies and analyses about corporate power.
There is no common or standard measurement of corporate power, but there are some
available metrics. Grant (1997) suggested the subsequent measures; industry concentration
ratios, aggregate concentration ratios, corporate interlocks/interlocking directorates, after-
tax corporate profits as a percentage of personal or national income, the ratio of the marginal
product of labour to the real wage, percentage of total government revenue derived from
corporate profits taxes and percentage of the labour force unionized. Of those measures, the
percentage of total government revenue derived from taxes on corporate profits and the
percentage of the labour force unionized appear to hold the most promise, according to
Grant, particularly if one is interested in empirically testing the hypothesis using time series
analysis. Roach (2007) elaborated the following measures: corporate economic statistics,
industry concentration ratios, labour union densities and corporate ability to reduce taxes or
94
acquire government subsidies. We will follow the measures used by Porenta (2018), namely
the corporate economic statistics and labour union densities, and as an additional measure
the effective corporate tax rate.
Corporate economic statistics in this chapter are derived from 100 largest non-financial US
corporations. These are in their majority transnational corporations (TNCs) and predominate
on the global TNCs list. Globalization or internationalization is the main determinant for the
TNCs along with their pursuit of an optimal allocation of resources. The role of TNCs in the
global economy is probably understated since TNCs are interlinked in a very complex way.
There is also a lack of transparency, informal agreements are not revealed, and in reality,
TNCs are even more connected due to various business agreements, the owning of each
other’s shares or contracted associations. Vitali et al. (2011) have shown in a study of
complex systems that there is a core of 1,318 companies with interlocking ownerships. They
possess 20 per cent of global operating revenues and own most the world's large blue chip
and manufacturing firms through their shares, adding a further 60 per cent of global
revenues. They also found a super-core of 147 even more tightly knit companies, where all
their ownership is held by other members of the super-entity, which controls 40 per cent of
the total wealth in the network. In fact, less than 1 per cent of the companies can control 40
per cent of the entire network. All these factors make TNCs very powerful. Nevertheless,
the development of big corporations is also positive due to their vast investments and
improvements of technologies and other innovations (Porenta, 2017).
The term corporate power is used in the broader context, not only for the increasing market
concentration of the corporations, but also for their influence on workers, consumers and
governments. Corporate influence on consumers and their decisions to consume (and wants
creation) is elaborated with empirical findings in the next chapter of consumption. Corporate
influence on workers and governments is explained and elaborated with empirical findings
in the next paragraphs.
Corporate power, amplified by transnational production and liberalization, results in an
enhanced bargaining position towards the labor force. As Cowling and Tomlinson (2005)
reasoned, this was obtained through increased corporate influence on governments in order
to change employment legislation. This strategy includes countervailing the increased power
of the labor unions, attained during the Golden Age. In the 1970s, corporations increased the
fragmentation of production through multi-plant operations, franchising and subcontracting.
To economize the costs, the production was moved away from the organized labor, i.e.
unions. First, within countries, then regionally, and finally, globally. In the U.S., the
production moved from the north-east to the south, then with the North American Free Trade
Area (NAFTA) agreement, further south to Mexico, then to Latin America, and then
globally, to Asia. The corporations use the so called ‘divide and rule’ strategy to reduce the
labor costs (Cowling & Sugden, 1994): they threaten to relocate the plant when unions are
95
too aggressive. Since they already have multi-plant operations, closing a ‘problematic’ plant
works as an efficient threat towards workers and their unions. A further empirical study from
Scherer et al. (1975) has shown that firms with only one-plant operation were punished by
diminished bargaining power towards unions, whereas corporations with multi-plant
operations enjoyed increasing power. That this ‘divide and rule’ strategy is not an empty
threat was proved by Addison et al. (2003). Where the trade union existence was strong and
active the plants were more likely to be closed. On the other hand, the trade union activity
had no effect on the closing of the plants in the one-plant operation corporations. Similarly
Peoples and Sugden (2000) observed that the ‘divide and rule’ strategy is a significant factor
in corporations’ decision to manufacture in more than one country.
Next, corporate power tries to curtail the regulatory legislation. As Mercer (1995) illustrates,
the competition policies have been formed by the strategies of powerful business interests.
The corporations have interests in the design and implementation of regulatory policy, and
as Cowling and Tomlinson (2005) further state, such ‘regulatory capture’ suggests that the
performance of the regulators will mainly reflect the benefits of the regulated. The next
example of corporate influence on government are the growing transnational corporations
who apply their corporate power over the states in the context of globalization (e.g. multi-
plant transnational operations, franchising and subcontracting). They employ a ‘divide and
rule’ strategy on governments, threatening to invest in other countries as a bargaining
leverage (Cowling & Sugden, 1994; Dicken, 2015). They demand infrastructural support,
investment subsidies, favorable tax regimes and employment legislation, etc., to maximize
their profits and corporate influence, i.e. corporate power. With such a strategy, transnational
corporations have managed to create an ‘incentive’ competition between countries for
transnational investments. Some of the consequences of the transnational nature of the
corporations are: (1) stagnant wages, (2) weaker unions, (3) increased corporate power, (4)
international transfer pricing, and (5) decreased global corporate tax liabilities.
The latter, namely the decreased corporate tax liabilities, were also studied by Farnsworth
and Fooks (2015). They argue that globalization has increased corporate tax competition
amongst states and enabled widespread corporate tax avoidance. Some of the biggest
corporations pay little or no tax and in some cases with the active support of governments.
This is the consequence of successful lobbying from transnational corporations in the past
30 years. They have lobbied for decreases in corporate taxes and increases in tax benefits.
Additionally, transnational corporations regularly are involved in tax avoidance
arrangements that result in actual tax rates considerably lower than the nominal rates. On the
one hand, there is a successful lobbying and corporate influence on governments, on the
other hand, there is a professional infrastructure of tax planning and avoidance, which aligns
with the corporate demand for reduced tax liabilities. According to Swank (2002), the
corporate tax rates have been falling steadily since the 1960s across most OECD countries.
96
In the US, the nominal federal corporate tax rate on profit is 35 per cent, but the real tax rates
paid by corporations is much lower, going from 37.3 per cent in 1970 to 14.3 per cent in
2009 and 19.7 per cent in 2015. The effective corporate tax rate is the actual tax rate paid
after deducting for all the subsidies, credits, rebates, tax breaks and other benefits from the
local or federal government.
Additional factors to consider are also the properties or the contradictions of capitalism,
namely, monopolies or oligopolies. The capitalist system tends toward the concentration and
centralization of capital, which is particularly typical of the 20th century, with the prevalence
of the TNCs in global economy. One consequence is an exclusion of effective price
competition, but production resumes in line with the productivity increase and the production
costs decrease, i.e. stagnation of real wages. Consequently, a large and growing investment
surplus emerges but encounters reduced investment markets. These are reduced partly due
to the maturity of the economies (Baran & Sweezy, 1966; Foster & Magdoff, 2009) and
partly because of the increase in income inequality, which in turn has a negative impact on
consumption. For the investment of their surpluses, corporate power invented new financial
instruments, liberalization, globalization and other leverages of influence. Indoctrination of
the consumer with very sophisticated marketing techniques is one of the main business
activities of corporations. Advertising induces emulation and conspicuous consumption by
consumers, thus reinforcing excessive consumerism with the social norm ‘keeping up with
the Joneses’. Additional leverage is also the influence on public opinion, exercised by
‘opinion leaders’ and ‘neutral’ experts who advocate corporate interests in a very
sophisticated way (Porenta, 2017).
Nevertheless, as Pressman (2007) argues, firms cannot take the chance that after undertaking
expensive investment there will be no demand for their goods. They eliminate the
uncertainty of market forces by controlling it through vertical integration, developing diverse
products, dealing with the consumer taste changes and long-term contracts between
producers and suppliers; probably most importantly, by spending money on advertising,
firms can control consumer tastes.
Hereafter, the following hypothesis will be tested; H1: In the US, the corporate power has
been increasing.
4.2.2 Consumption
All relevant empirical theories about consumption are based on the income dependent
consumption function, derived from Keynes. There are three main existing theories: (1)
Duesenberry (1949) relative income theory (RIH), where consumption decisions are
motivated by ‘relative’ consumption concerns or ‘keeping up with the Joneses, (2)
97
Modigliani and Brumberg (1954) life-cycle theory, which assumes that household members
choose their current expenditures optimally, taking account of their spending needs and
future income over the remainder of their lifetimes, and (3) Friedman (1957a) permanent
income hypothesis (PIH), a simplified version of the Modigliani model and a criticism of
the Keynes. PIH supposes that a person's consumption at a point in time is determined not
just by their current income but also by their expected income in future years, their
permanent income. It states that, rather than changes in temporary income, changes in
permanent income are those that drive the changes in a consumer's consumption patterns. It
predicts a consumption smoothing as a stable path of consumption and, if needed, savings
and borrowing (Hall, 1978; Hall & Mishkin, 1982; Meghir, 2004; Porenta, 2018).
The permanent income hypothesis has also some shortcomings, like the liquidity constraints.
The consumers can have the borrowing constraints, on one side or disinvesting constraints,
on the other side. These shortcomings have led to some improved and extended models.
Some of new researches are based on contemporary behavioural models and Duesenberry's
relative income hypothesis. D’Orlando and Sanfilippo (2010) investigated the role of
behavioural principles in the micro-foundation of Keynes’s consumption theory and
grounded a Keynesian-type aggregate consumption function based on the principles of
contemporary behavioural models. This allows for a better illustration of reality and is more
consistent with Keynes’s consumption theory. Alvarez-Cuadrado and Van Long (2011)
proposed an overlapping-generations economy with heterogeneous wealth levels, where
households ascend their utility from relative consumption, inheritance and leisure.
Therefore, an individual’s consumption is motivated by the comparison of his lifetime
income and of his reference group. This can be referenced as a permanent income version of
Duesenberry’s relative income hypothesis.
Palley (2010) attempted to synthesize the advantages of different models into a synthetic
Keynes–Duesenberry–Friedman model, named as the ‘relative permanent income’ theory of
consumption. This model produces patterns of consumption spending consistent with both
empirical results from cross-section data showing high-income households have a higher
propensity to save and long-run time series data for aggregate consumption. The novelty is
making household consumption decisions depend on relative permanent income. It suggests
that consumption decisions are motivated by ‘relative’ consumption concerns or ‘keeping
up with the Joneses.’ Further, it suggests that consumption patterns are subject to habit and
are slow to fall in face of income reductions. Redistributing income to lower income
households is likely to have a net positive effect on aggregate demand owing to ‘keeping up
with the Joneses’ behaviour. The model suggests that policy that constrains emulation
behaviour can improve social welfare. In effect, households are partially engaged in a form
of consumption ‘arms race’. The rich try to increase relative consumption, while lower
income households try to keep up with the Joneses.
98
Studies about relative consumption can be traced back to Veblen (1899) and John K.
Galbraith (1967). Veblen (1899) constructed the term conspicuous consumption, which is
based on evolutionary principles that are driven by the human instincts, mainly by emulation
and predation, where people are trying to impress others, gain advantage and signal their
status. John K. Galbraith (1967) used the conspicuous consumption when explaining the
dependence effect. The worker who is at the same time a consumer becomes indoctrinated
by privately owned media and corporate marketing, buying many things that he or she does
not really need. The result is a huge production of unnecessary and unproductive private
goods, whereas, on the other hand, there is a lack of public goods. Consumerist consumption
becomes the foundation of economic growth (Porenta, 2018). However, the problem is that
real wages are stagnant and in a sharp contrast with the rising productivity and profits
(Kochan, 2013; Mishel & Shierholz, 2013; R. H. Scott & Pressman, 2015), so the workers,
who are at the same time the consumers, need to borrow money in order to maintain the
standard and social status demanded by the society, the media and marketing.
Conspicuous consumption is today more a socio-economic behaviour, which is also common
in poor social classes, where a person seeks a superior social status or the possibility to at
least maintain the existing one and eliminate the stigma of being poor or the deterioration of
one’s social status (Charles et al., 2007). Furthermore, evolutionary psychology also
explains conspicuous consumption as a costly signal or a handicap principle, demonstrating
a person’s good socio-economic quality and his or her intention to attract economic coalition
partners or sexual mates, with the aim to improve one’s own status and obtain the chance of
reproduction (Iredale & van Vugt, 2012; Miller, 2009; Zehavi & Zahavi, 1999), thus
illustrating how marketing has exploited our inherited instincts to display social status for
reproductive advantage.
Benhabib and Bisin (2002, 2011) show in their empirical work that advertising directly
affects the consumer’s preferences. Individual’s preferences, which are in part a social
phenomenon, are influenced by advertising. Corporations exploit their power through
advertising to create new consumers’ needs, often for conspicuous consumption. These
needs are false. The concepts like manipulation of preferences, commodification of culture
and consumerism, have become the central core of Postmodernist Critique of the
organization of society. The consequence of creation of such new needs is that consumer
spending rises, and so does their supply of labor. They enter a work and spend cycle, where
they reduce the time for leisure, which in turn reduces consumers’ welfare.
Advertising accounts for 2.27 per cent of the GDP in the U.S., whereas it accounts only for
1.54 per cent of the GDP in the U.K., 1.49 per cent in Germany, 1.16 per cent in Japan, in
the period from 1984 to 2005, and 0.69 per cent in France, in the period from 1996 to 2005
(Molinari & Turino, 2009). The advertising shares were constant across the countries in the
long run. As can be observed from the data, the US advertising share in GDP outperformed
99
the other countries. The study found that the presence of advertising results in a higher level
of hours worked, output consumption. It predicts that advertising can be potentially
important in explaining the observed differences in hours worked between the US and
European countries. Lastly, the welfare analysis shows that consumers are always worse off
with advertising. This is true even if the resulting equilibrium is characterized by a higher
level of consumption and hours worked. In this case, welfare losses are driven by the
overworking effect induced by advertising.
The effectiveness of corporate advertising in enhancing demand is also supported by
Bagwell (2005) and Vakratsas and Ambler (1999). In turn, advertising has a relevant impact
on aggregate consumption and thus on other macroeconomic aggregates. In 2005, firms
spent 230 billion dollars to advertise their products in the US media, which was
approximately 1000 dollars per citizen. The US advertising industry accounts for 2.2 per
cent of GDP, absorbs approximately 20 per cent of firms’ budgets for new investments, and
uses 13 per cent of their corporate profits. The rationale for firms’ spending on advertising
has been identified as the positive effect of advertisements on sales. Firms realize that the
demand they face is not an exogenous product of consumers’ preferences, but, rather, it can
be tilted toward their own products through advertisements (Molinari & Turino, 2013).
Corporations control workers, competitors, markets, governments, public opinion and
consumers. They succeed in reversing the classical view of consumer-production
relationship, namely that the consumer is the one who controls the producer. Such a revised
sequence cannot be attained without the dependence effect. It is this dependence effect with
its passive and active aspects that drives the revised sequence and the success of corporate
advertising. The roots of the dependence effect are both in conspicuous consumption and
handicap principle. The latter actually drives conspicuous consumption, the dependence
effect and corporate power, as Porenta (2017) further argues. Corporations are keen to
exploit one of the most powerful human instincts of the reproduction and display of the
social status, thus fostering consumerism as a marketing-dominated culture. Consumers who
are at the same time also workers with stagnant real wages because of increasing corporate
power and increasing income inequality are eager to maintain or obtain their social status.
In many cases, they do not even strive to improve their social status, but merely maintain the
existing standard or hide their impoverishment. Therefore, dependence effect and revised
sequence have proven to be the most powerful corporate tools in today’s economy.
Hereafter, the following hypothesis will be tested; H2: The increased corporate power
caused increased consumption in the US.
100
4.2.3 Debt
The third component of the model relates to household debt. Increased consumption and
stagnating income lead to borrowing. Because of people’s indebtedness, more people need
social help. Rising social transfers lead to a further rise in already increasing public debt due
to the consequences of financial liberalization and the bailouts of private capital (Azzimonti
et al., 2014; Lora & Olivera, 2007). As elaborated by Oh and Reis (2012), government
expenditures increased rapidly across the OECD countries from 2007 to 2009, where the
median share of transfers accounts for 64 per cent of the increase in spending. In the US,
transfers account for 75 per cent of the fiscal expenditure increase, or 3.4 per cent of GDP,
whereas social transfers account for 2.72 per cent of GDP. There has been a large
compositional shift away from US government purchases and towards transfers, which have
more than tripled as a ratio of GDP over the past 50 years, and by 2007 accounted for 39 per
cent of the total budget. The consequences of rising public debt, which also rises due to
socializing private bubble busts, are less effective countercyclical policies. Expansionary
fiscal policy is constrained because of the rising public debt, so it cannot spend more on
infrastructure, education, human capital and health care. In the case of tight monetary policy
with higher interest rates, the rich benefit because they can lend their money at higher rates
and make a profit while protecting their real wealth against inflation. The lower and the
middle class are mainly borrowers, so they are faced with an additional cost of borrowing
due to higher interest rates. In this situation with strong countercyclical policies, the strongest
part always profits, which only makes inequality in the society more severe (Porenta, 2017).
An additional factor to consider are the consequences of stagnation of mature economies.
Corporations were forced to seek new markets, including ones with new technologies, but
these markets were insufficient. Thus, financial liberalization and globalization have been
imposed, and the financial sector has strongly overgrown the real sector. The financial sector
also gladly credits the consumerist consumption to maintain demand and economic growth.
Nonetheless, due to stagnant wages, this consumption is largely driven by borrowing. Such
debt is mostly consumptive and therefore not self-liquidating. It is not an investment
expecting some future cash inflow and liquidating itself with future revenues, as Porenta
(2017) further argues. This leads to boom-bust credit cycles and eventually to a chronic
weakness of economic demand. Growing income inequality also leads to workers’ inability
to adapt to technological changes, including skill biased and capital biased changes that
result in additional unemployment. Higher household debt results in the inability of people
to invest in their education or increase their savings and, consequently, their wealth and
financial independence. On the other hand, higher public debt prevents the government from
investing in education, health care, social transfers and infrastructure. Excessive
consumerism accounts for overprovided private goods and underprovided public goods,
which reinforces inequality and impoverishment. The effect is a state of private wealth and
101
public impoverishment, where the poverty is a cumulative and a self-driving circular
causation. The poor are living in a deprived community without proper education, health
care and other public services. They are unable to improve their skills, economic and political
positions or their social mobility, thus they stay trapped in vicious circle of poverty for
generations (Dunn & Pressman, 2005; John K. Galbraith, 1958).
Bloxham and Kent (2009) argued that the rise in household indebtedness from 1982 to 2009
was greater in countries that had larger declines in inflation, macroeconomic volatility,
unemployment, and more competitive and innovative markets, along with deregulation.
Some of the increase in household debt seems to have echoed an overly optimistic view from
lenders and borrowers which led to a significant decline in lending standards. This could be
especially observed in the US, where mortgages to lower-income households were allowed
before the financial crisis, which consequently led to mortgage defaults, declines in house
prices and significant financial losses. The increase in US household debt was also studied
by Dynan and Kohn (2007), where it was shown that demographic shifts, house price
increases and financial innovation appear to have contributed to the household debt rise. The
study in the period from 1983 to 2004 has shown that this substantial increase in households’
debt relative to income mainly reflects the efforts of households to smooth consumption over
time in response to shifting perceptions about future income, wealth and interest rates, along
with the effects of financial innovation that has reduced constraints on the ability of
households to realize desired consumption patterns.
An alternative explanation to life-cycle interpretations, that the household debt increase is
explained as a rational response of forward looking agents and as a momentary deviation of
current income flows from their long-term movement, were given by Barba and Pivetti
(2009). They used US data from 1980 to 2005 and argued their focus on US with the fact
that the mere size of the US economy makes the macroeconomic implications of its rising
household debt of primary importance, for the macroeconomic performance of the world at
large as well. Additionally, from an analysis of the US experience one may gain useful
insights into the problems of a rising household debt in the other developed countries. They
argued that the growing household debt is a consequence of changes in income distribution,
i.e. stagnant real wages and rising income inequalities. Debt has, therefore, become a
substitute for stagnant wages, where increasing borrowing finance consumption. Increasing
household debt is a complement of the conspicuous redistribution of income. With the case
when households face almost no credit constrained, on the one hand, and with the imperative
of endlessly improving the households’ living standard and maintaining the imposed social
norm of ‘keeping up with the Joneses’, on the other hand, the result inevitably leads to a
growing household indebtedness. Additionally, the household savings rate significantly
decreases in aggregate, where the savings of the upper 10 per cent of the income distribution
are outpaced by the dissaving of the lower 90 per cent of the income distribution.
102
Further empirical evidence has shown that the increasing household debt is significantly
influenced and positively correlated with household consumption, GDP and consumer price
index (Meniago et al., 2013). US households had record high debt levels and record low
savings rates, before the Great Recession. Highly leveraged consumption boosted economic
growth. Nevertheless, large debt burdens have led many families to deleverage, but
deleveraging has been insufficient. Debt levels, especially for home mortgages, remain high
by historical standards (R. H. Scott & Pressman, 2015). An additional problem is that
consumption now represents around 70 per cent of the US GDP, the highest historical level.
In combination with increased income inequality since 1980s, that opposite of expectation
did not reduce demand growth but were boosted by a historic increase in borrowing by the
bottom 95 per cent of the income distribution (Cynamon & Fazzari, 2013), and stagnant
wages (Mishel & Shierholz, 2013; R. H. Scott & Pressman, 2015), the inevitable result is
indebted households. Possible drivers of generating more spending than income are some
social and psychological forces, like ‘conspicuous consumption’ and ‘pecuniary emulation’,
coined by Veblen (1899). The decision to raise debt related to average income in the own
residential area indicates that conspicuous consumption is partly financed by debt
(Berlemann & Salland, 2016), which leads to the study by Nepomuceno and Laroche (2015).
They argue that the happiness dimension of materialism correlates positively with personal
debt, whereas the success dimension of materialism and voluntary simplicity correlates
negatively with personal debt. The results illustrate that decreasing consumption helps
people live financially stable lives, which improves people’s well-being.
Hereafter, the following hypothesis will be tested; H3: Increased consumption caused higher
household debt in the US.
4.2.4 Inequality
The fourth component of the model relates to inequality. The study by Kumhof et al. (2015)
argues that both crises, the Great Depression and the Great Recession, were the consequence
of the changes in the income distribution and indebted households. They show, on US data
from 1983 to 2007, that both periods from 1920 to 1929 and from 1983 to 2008 displayed a
large increase in the income share of the top 5 per cent of the income distribution, and a large
increase in debt leverage of the bottom 95 per cent of the income distribution. The US top 5
per cent of the income distribution also loan part of their income back to the bottom 95 per
cent of the income distribution households, which additionally increases the loan supply,
thus allowing the bottom 95 per cent of the income distribution households maintain the
growing consumption levels.
Relatively important is the 90/50 differential, which has been increasing since the 1980s in
the US. This means that the incomes of the 90th percentile of the wage distribution have
103
increased much faster than the incomes of the 50th percentile of the wage distribution, the
median incomes. As Rajan (2010) further argues, the everyday reality for the middle class
are stagnant wages, as well as increasing job insecurity. Due to this rising income inequality,
politicians ‘felt’ their voters’ pain, which has led to the political pressure for easy credit, and
consequently to the deregulation and expansion of lending to households, particularly to the
low-income households. The benefits, such as increasing consumption and higher
employment, were instant, while the consequences, such as defaults and the financial crisis,
were only postponed. This development prior to the recent Great Recession is like the
development prior to the Great Depression, where politicians were unable to address the
deeper anxieties of the middle class. Back then, in the early years of the twentieth century in
the US, the deregulation and rapid expansion of banking followed, as a political reply to the
Populist movement, supported by small and medium-sized farmers who demanded easier
credit. Excessive rural credit was then, in turn, one of the substantial reasons for bank
defaults during the Great Depression. Reich (2013) reasons similarly that an increasing
concentration of wealth and income at the top, rather than being spread across the American
middle class, was the reason for the Great Recession. Thus, the real (political) challenge is
not to save more and borrow less but to rebalance the economy so the benefits are shared
more broadly and the purchasing power of the middle class is reinstated, as the only viable
way to sustainable growth.
Further analysis by Hungerford (2013) and Harris and Sammartino (2011) have shown that
of three possible factors that contribute to the changes of income inequality in US, namely,
labour income, capital income, and taxes, the largest contributor to the changes in income
that led to the increase in income inequality were capital gains and dividends. There are two
developments when observing for the changes: (1) all major income sources became highly
concentrated in favour of the top per cent of the income distribution of the household, and
(2) a change in the composition of income. The latter contributed to the decline of wages
and other labour income in the share of total income and a rise of capital gains and other
capital income in the share of total income. This reinforced the income inequality since the
capital incomes are more focussed amongst the top per cent of the income distribution of the
household than is labour income. Such ‘rent seeking’ behaviour by top earners, like
executives and managers, can be attributed to the decrease in top marginal income tax rates
since 1960s to bargain a higher share of total income, at the expense of other workers’ wages
(Fieldhouse, 2013).
As Piketty et al. (2011) further shows, there is a strong negative correlation between top tax
rates and top 1 per cent income shares; nevertheless, top income share growths have not
translated into bigger economic growth. Similar, Hungerford (2012) argues that decreases in
top marginal tax rates in the US are connected to the growing concentration of income at the
top of the income distribution, increasing from 4.2 per cent in 1945 to 12.3 per cent by 2007,
104
for the top 0.1 per cent of the income distribution. On one hand, the shift from labour income
to capital income is attributed to one third of the rise in the total share of income to the top
1 per cent of households, which rose from 9.6 per cent in 1979 to 20 per cent in 2007, and
on the other hand, a decline in share for the lower 40 per cent of households from 37.2 per
cent in 1979 to 28.3 per cent in 2007 (Mishel et al., 2012; Piketty & Saez, 2003). The wage
for the median worker grew by only 5.0 per cent between 1979 and 2012 in US, for the 20th
percentile worker wage dropped by 0.4 per cent, regardless of productivity increase of 74.5
per cent. For the 80th percentile worker the wage grew by 17.5 per cent in the same period
(Mishel & Shierholz, 2013). Piketty and Saez (2003) have also shown that, in the US, the
share of total pre-tax income accruing to the top 1 per cent has more than doubled since the
1970s.
Since empirical studies also show that high inequality slows down economic growth (Ostry
et al., 2014) and increases political instability (Ortiz & Cummins, 2011) and unemployment
(James K. Galbraith, 2012), this circular motion endangers the long-term sustainability of
the existing socio-economic model. The recent economic crisis has increased the criticism
and demanded a change. In this sense, it is interesting how democracy is related to
redistribution and inequality. The standard model of democracy assumes that median voters
employ their voting rights in a democratic system to reallocate funds from the wealthier
towards themselves. However, Acemoglu et al. (2013) and Josifidis et al. (2016) have shown
that there is a limited effect of democracy on inequality, thus not confirming this standard
model. Inequality tends to increase after the democratization. The reason for that can be that
democracy may be captured or constrained. Although democracy changes the distribution of
‘de jure’ power in society, policy outcomes and inequality also depend on the ‘de facto’
distribution of power. Powerful elites who see their de jure power diminished by
democratization may increase their investments in de facto power, implemented in
controlling the law enforcement, lobbying, or influencing the politicians.
Additional determinants of inequality were studied by Berisha and Meszaros (2017). They
analysed the relationships between income inequality, household debt and economic growth
in the US. The results reject the basic forecast of growing household debt leading to increases
in income inequality, but rather point to the opposite, that an increase in household debt over
a one-year period predicts a decrease in income inequality. A possible reason for this
provided by the authors is that because household debt caused slower economic growth, the
returns of top earners in income distribution diminished, which in turn caused a decrease in
income inequality.
Redistribution of income could reduce income inequality. Nonetheless, as Harris and
Sammartino (2011) have shown, the US federal tax and transfer system decreased the Gini
index only by 17.1 per cent in 2007, compared to a 23.4 per cent decrease in 1979. Similar,
pre-tax inequality rose 23.2 per cent between 1979 and 2007, while post-tax, post-transfer
105
inequality rose 33.2 per cent, respectively. The federal tax and transfer system role in
reducing inequality is thus failing. This cycle is only reinforcing the top earners and that can
be observed subsequently in the wealth concentration. Saez and Zucman (2016) have shown
that the US top 0.1 per cent wealth share has increased from 7 per cent in 1978 to 22 per cent
in 2012. Wealth concentration in the US was high in 1929, decreased until 1978, and then
rose again until 2012 to the levels similar in 1929. People who hold the most wealth today
are younger and earn a higher share of labor income than back in the 1960s. On the other
hand, people who hold the bottom 90 per cent of the wealth share first increased their wealth
share until 1980s, which then gradually decreased. The reason for such an increase in wealth
inequality in the past years is because of the increases of top incomes and rising saving rate
inequality, where savings are increasing for top earners and declining for the others.
Rising household indebtedness, along with income distribution changes and increases of top
incomes, influences income inequality. Corporate power influences workers, markets,
politics, government and society, and is imposing such distribution and redistribution of
income that favours companies and rich individuals. Increased corporate power causes
financial liberalization and reduced taxes, budget deficits as well as increased social
transfers, fewer investments in education and human capital, less social mobility and,
consequently, a vicious circle of poverty entrapment. Rising corporate power leads to
increased consumerism and consumption, which, in turn, results in increased household debt
due to stagnant real wages. These increasing inequalities have an immense impact on
individuals, people and society. People’s lives become worse, their indebtedness is on the
rise, the possibilities of better education are fewer, and their social mobility declines.
Unemployment is rising or stalling, but never really disappearing. Such a path is clearly not
sustainable and it cannot bring about prosperity, as Porenta (2017) has shown. Consumers,
who are at the same time also workers, are as well facing deunionization, where the union
density is in steady decline in the US. Skill-biased technical changes have been an important
factor in deunionization. However, better skills and education are more affordable to those
with higher incomes and those who profit most from the changes in income distribution and
income redistribution. Consequently, the workers are losing their bargaining power towards
corporations, which only reinforces corporate power.
Hereafter, the following hypotheses will be tested; H4: Higher household debt caused higher
income inequality in the US; H5: Higher income inequality has influenced the increased
corporate power in the US.
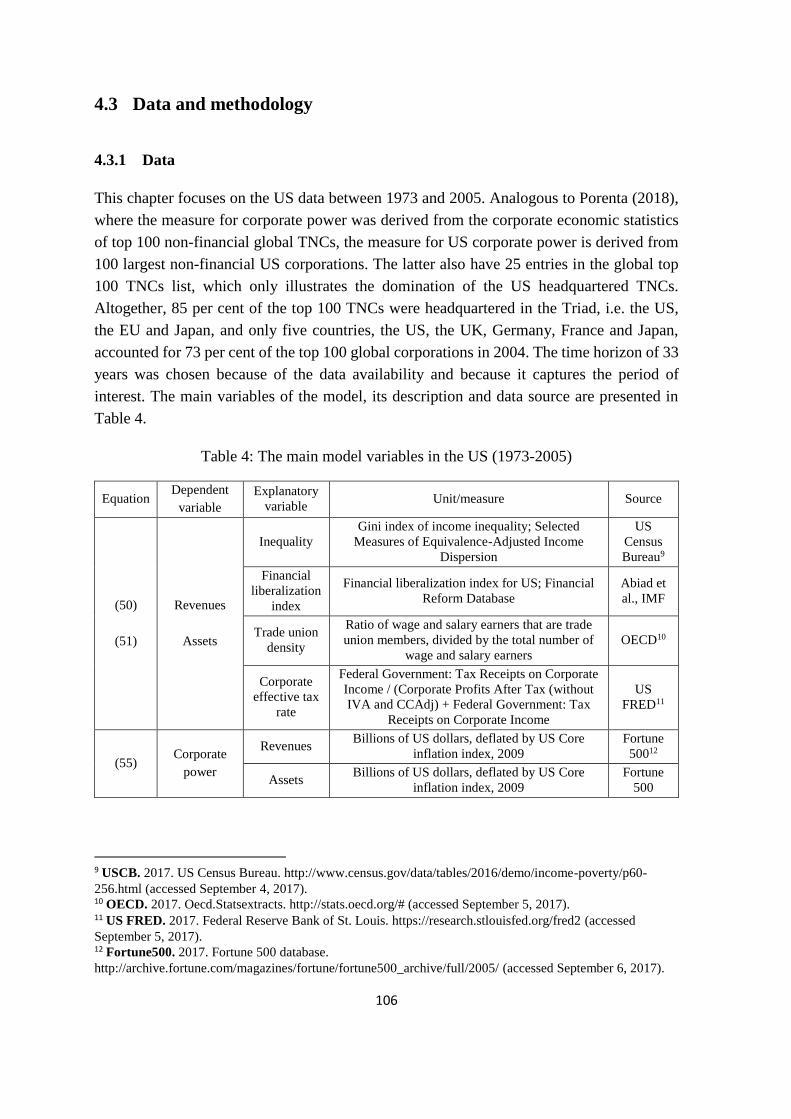
106
4.3 Data and methodology
4.3.1 Data
This chapter focuses on the US data between 1973 and 2005. Analogous to Porenta (2018),
where the measure for corporate power was derived from the corporate economic statistics
of top 100 non-financial global TNCs, the measure for US corporate power is derived from
100 largest non-financial US corporations. The latter also have 25 entries in the global top
100 TNCs list, which only illustrates the domination of the US headquartered TNCs.
Altogether, 85 per cent of the top 100 TNCs were headquartered in the Triad, i.e. the US,
the EU and Japan, and only five countries, the US, the UK, Germany, France and Japan,
accounted for 73 per cent of the top 100 global corporations in 2004. The time horizon of 33
years was chosen because of the data availability and because it captures the period of
interest. The main variables of the model, its description and data source are presented in
Table 4.
Table 4: The main model variables in the US (1973-2005)
Equation Dependent
variable
Explanatory
variable Unit/measure Source
(50)
(51)
Revenues
Assets
Inequality
Gini index of income inequality; Selected
Measures of Equivalence-Adjusted Income
Dispersion
US
Census
Bureau9
Financial
liberalization
index
Financial liberalization index for US; Financial
Reform Database
Abiad et
al., IMF
Trade union
density
Ratio of wage and salary earners that are trade
union members, divided by the total number of
wage and salary earners
OECD10
Corporate
effective tax
rate
Federal Government: Tax Receipts on Corporate
Income / (Corporate Profits After Tax (without
IVA and CCAdj) + Federal Government: Tax
Receipts on Corporate Income
US
FRED11
(55) Corporate
power
Revenues Billions of US dollars, deflated by US Core
inflation index, 2009
Fortune
50012
Assets Billions of US dollars, deflated by US Core
inflation index, 2009
Fortune
500
9 USCB. 2017. US Census Bureau. http://www.census.gov/data/tables/2016/demo/income-poverty/p60-
256.html (accessed September 4, 2017). 10 OECD. 2017. Oecd.Statsextracts. http://stats.oecd.org/# (accessed September 5, 2017). 11 US FRED. 2017. Federal Reserve Bank of St. Louis. https://research.stlouisfed.org/fred2 (accessed
September 5, 2017). 12 Fortune500. 2017. Fortune 500 database.
http://archive.fortune.com/magazines/fortune/fortune500_archive/full/2005/ (accessed September 6, 2017).
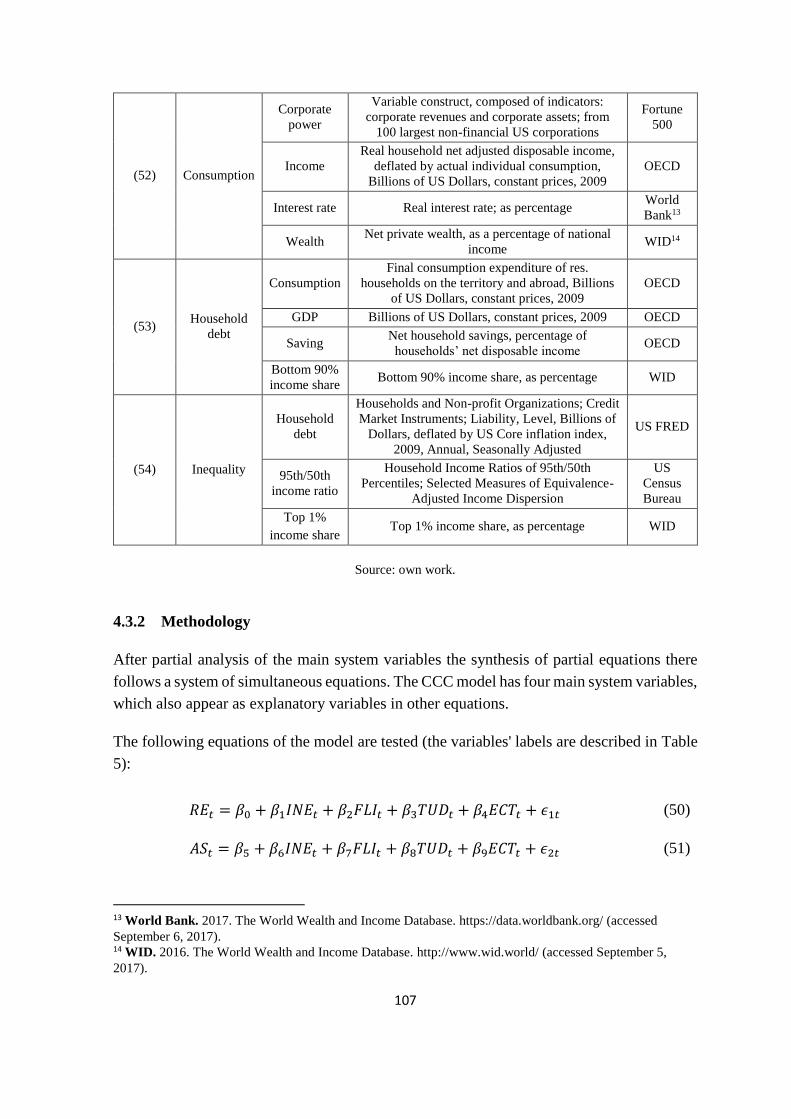
107
(52) Consumption
Corporate
power
Variable construct, composed of indicators:
corporate revenues and corporate assets; from
100 largest non-financial US corporations
Fortune
500
Income
Real household net adjusted disposable income,
deflated by actual individual consumption,
Billions of US Dollars, constant prices, 2009
OECD
Interest rate Real interest rate; as percentage World
Bank13
Wealth Net private wealth, as a percentage of national
income WID14
(53) Household
debt
Consumption
Final consumption expenditure of res.
households on the territory and abroad, Billions
of US Dollars, constant prices, 2009
OECD
GDP Billions of US Dollars, constant prices, 2009 OECD
Saving Net household savings, percentage of
households’ net disposable income OECD
Bottom 90%
income share Bottom 90% income share, as percentage WID
(54) Inequality
Household
debt
Households and Non-profit Organizations; Credit
Market Instruments; Liability, Level, Billions of
Dollars, deflated by US Core inflation index,
2009, Annual, Seasonally Adjusted
US FRED
95th/50th
income ratio
Household Income Ratios of 95th/50th
Percentiles; Selected Measures of Equivalence-
Adjusted Income Dispersion
US
Census
Bureau
Top 1%
income share Top 1% income share, as percentage WID
Source: own work.
4.3.2 Methodology
After partial analysis of the main system variables the synthesis of partial equations there
follows a system of simultaneous equations. The CCC model has four main system variables,
which also appear as explanatory variables in other equations.
The following equations of the model are tested (the variables' labels are described in Table
5):
𝑅𝐸𝑡 = 𝛽0 + 𝛽1𝐼𝑁𝐸𝑡 + 𝛽2𝐹𝐿𝐼𝑡 + 𝛽3𝑇𝑈𝐷𝑡 + 𝛽4𝐸𝐶𝑇𝑡 + 𝜖1𝑡 (50)
𝐴𝑆𝑡 = 𝛽5 + 𝛽6𝐼𝑁𝐸𝑡 + 𝛽7𝐹𝐿𝐼𝑡 + 𝛽8𝑇𝑈𝐷𝑡 + 𝛽9𝐸𝐶𝑇𝑡 + 𝜖2𝑡 (51)
13 World Bank. 2017. The World Wealth and Income Database. https://data.worldbank.org/ (accessed
September 6, 2017). 14 WID. 2016. The World Wealth and Income Database. http://www.wid.world/ (accessed September 5,
2017).
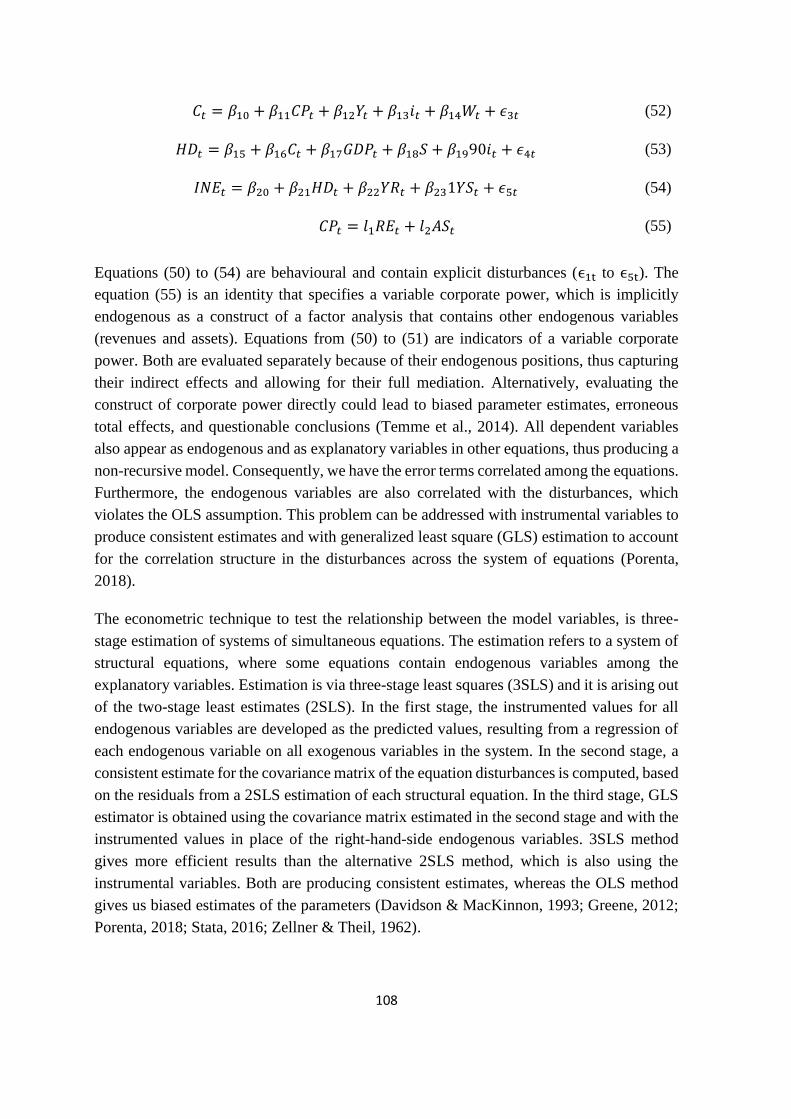
108
𝐶𝑡 = 𝛽10 + 𝛽11𝐶𝑃𝑡 + 𝛽12𝑌𝑡 + 𝛽13𝑖𝑡 + 𝛽14𝑊𝑡 + 𝜖3𝑡 (52)
𝐻𝐷𝑡 = 𝛽15 + 𝛽16𝐶𝑡 + 𝛽17𝐺𝐷𝑃𝑡 + 𝛽18𝑆 + 𝛽1990𝑖𝑡 + 𝜖4𝑡 (53)
𝐼𝑁𝐸𝑡 = 𝛽20 + 𝛽21𝐻𝐷𝑡 + 𝛽22𝑌𝑅𝑡 + 𝛽231𝑌𝑆𝑡 + 𝜖5𝑡 (54)
𝐶𝑃𝑡 = 𝑙1𝑅𝐸𝑡 + 𝑙2𝐴𝑆𝑡 (55)
Equations (50) to (54) are behavioural and contain explicit disturbances (ϵ1t to ϵ5t). The
equation (55) is an identity that specifies a variable corporate power, which is implicitly
endogenous as a construct of a factor analysis that contains other endogenous variables
(revenues and assets). Equations from (50) to (51) are indicators of a variable corporate
power. Both are evaluated separately because of their endogenous positions, thus capturing
their indirect effects and allowing for their full mediation. Alternatively, evaluating the
construct of corporate power directly could lead to biased parameter estimates, erroneous
total effects, and questionable conclusions (Temme et al., 2014). All dependent variables
also appear as endogenous and as explanatory variables in other equations, thus producing a
non-recursive model. Consequently, we have the error terms correlated among the equations.
Furthermore, the endogenous variables are also correlated with the disturbances, which
violates the OLS assumption. This problem can be addressed with instrumental variables to
produce consistent estimates and with generalized least square (GLS) estimation to account
for the correlation structure in the disturbances across the system of equations (Porenta,
2018).
The econometric technique to test the relationship between the model variables, is three-
stage estimation of systems of simultaneous equations. The estimation refers to a system of
structural equations, where some equations contain endogenous variables among the
explanatory variables. Estimation is via three-stage least squares (3SLS) and it is arising out
of the two-stage least estimates (2SLS). In the first stage, the instrumented values for all
endogenous variables are developed as the predicted values, resulting from a regression of
each endogenous variable on all exogenous variables in the system. In the second stage, a
consistent estimate for the covariance matrix of the equation disturbances is computed, based
on the residuals from a 2SLS estimation of each structural equation. In the third stage, GLS
estimator is obtained using the covariance matrix estimated in the second stage and with the
instrumented values in place of the right-hand-side endogenous variables. 3SLS method
gives more efficient results than the alternative 2SLS method, which is also using the
instrumental variables. Both are producing consistent estimates, whereas the OLS method
gives us biased estimates of the parameters (Davidson & MacKinnon, 1993; Greene, 2012;
Porenta, 2018; Stata, 2016; Zellner & Theil, 1962).
109
The econometric analysis starts with preliminary testing of unit-roots and stationarity with
Augmented Dicky-Fuller (ADF) tests (Dickey & Fuller, 1979) and Dicky-Fuller Generalized
Least Square (DF GLS) tests. DF GLS tests can overcome the problems of ADF tests with
reliability of small sample data due to their size and power properties (DeJong et al., 1992a,
1992b). The ADF test can over reject the null hypothesis when it is true (Type I error) and
fail to reject it when it is false (Type II error). DF GLS unit-root test performs a modified
Dickey-Fuller t-test for a unit root in which the series has been transformed by a generalized
least squares regression, and where the power can be improved when an unknown mean or
trend is present (Elliott et al., 1996; Porenta, 2018; Schwert, 1989). The results of these tests
are presented in Table 5.
4.4 Results
4.4.1 Descriptive statistics
The data for a variable of corporate power were collected from corporate economic statistics,
specifically from Fortune 500 database of 100 largest non-financial US corporations. In the
period from 1973 to 2005, two corporate indicators grew sharply: revenues by 254 per cent
and assets by 383 per cent. Both corporate indicators significantly outpaced the growth of
GDP, which was a moderate 162 per cent in the same period. Other relevant explanatory
variables of corporate power, such as inequality and the financial liberalization index grew,
whereas the corporate effective tax rate and trade union density declined in the same period,
consistent with the theory.
Household final consumption expenditure increased by 176 per cent, while the household
adjusted disposable income grew by 149 per cent. Thus, consumption expenditure growth
outpaced the disposable income growth in the same period from 1973 to 2005. Net private
wealth rose by 51 per cent. The interest rate tended to increase in the first period till 1981
and decreased one after that. At the same time, household debt sharply increased, while net
household savings, as a percentage of households’ net disposable income, declined from 13
per cent to 2 per cent in the period from 1973 to 2005. Additional inequality predictors, such
as 95th/50th income ratio and the top 1 per cent income share, also showed an increase in
income inequality. The latter revealed an increase from 8 per cent to an astonishing 18 per
cent. Descriptive statistics for the main model variables are shown in Table 5.
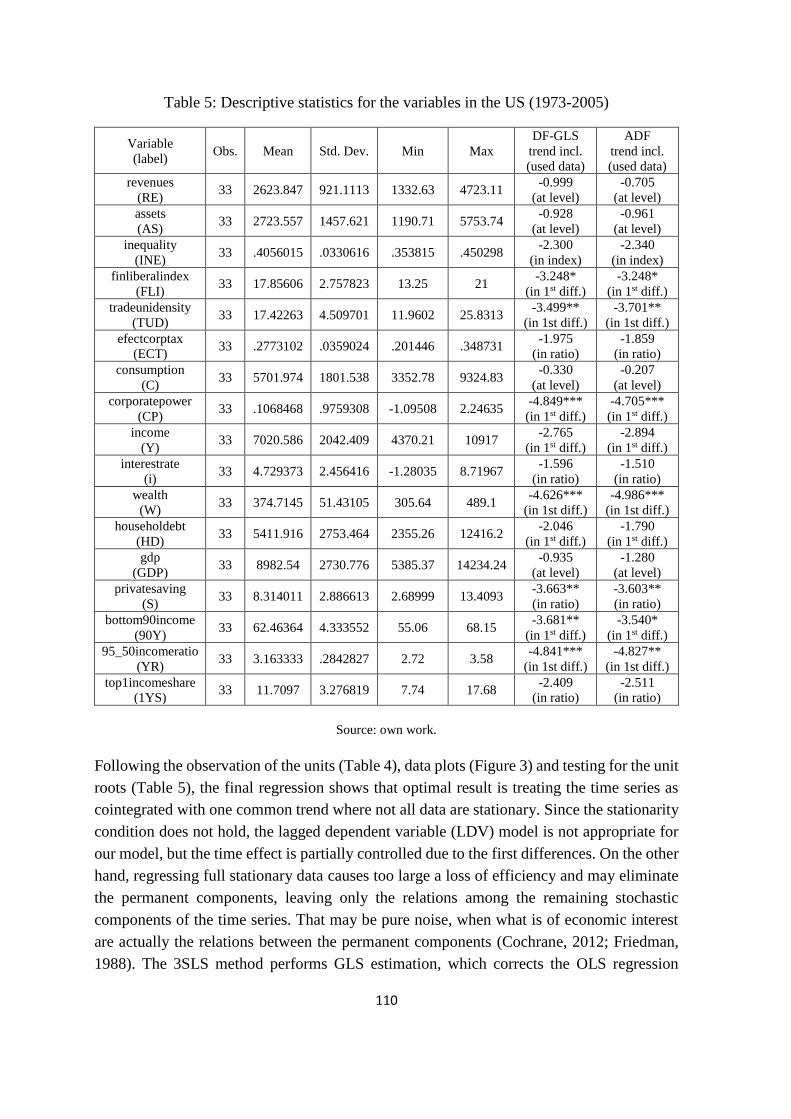
110
Table 5: Descriptive statistics for the variables in the US (1973-2005)
Variable
(label) Obs. Mean Std. Dev. Min Max
DF-GLS
trend incl.
(used data)
ADF
trend incl.
(used data)
revenues
(RE) 33 2623.847 921.1113 1332.63 4723.11
-0.999
(at level)
-0.705
(at level)
assets
(AS) 33 2723.557 1457.621 1190.71 5753.74
-0.928
(at level)
-0.961
(at level)
inequality
(INE) 33 .4056015 .0330616 .353815 .450298
-2.300
(in index)
-2.340
(in index)
finliberalindex
(FLI) 33 17.85606 2.757823 13.25 21
-3.248*
(in 1st diff.)
-3.248*
(in 1st diff.)
tradeunidensity
(TUD) 33 17.42263 4.509701 11.9602 25.8313
-3.499**
(in 1st diff.)
-3.701**
(in 1st diff.)
efectcorptax
(ECT) 33 .2773102 .0359024 .201446 .348731
-1.975
(in ratio)
-1.859
(in ratio)
consumption
(C) 33 5701.974 1801.538 3352.78 9324.83
-0.330
(at level)
-0.207
(at level)
corporatepower
(CP) 33 .1068468 .9759308 -1.09508 2.24635
-4.849***
(in 1st diff.)
-4.705***
(in 1st diff.)
income
(Y) 33 7020.586 2042.409 4370.21 10917
-2.765
(in 1st diff.)
-2.894
(in 1st diff.)
interestrate
(i) 33 4.729373 2.456416 -1.28035 8.71967
-1.596
(in ratio)
-1.510
(in ratio)
wealth
(W) 33 374.7145 51.43105 305.64 489.1
-4.626***
(in 1st diff.)
-4.986***
(in 1st diff.)
householdebt
(HD) 33 5411.916 2753.464 2355.26 12416.2
-2.046
(in 1st diff.)
-1.790
(in 1st diff.)
gdp
(GDP) 33 8982.54 2730.776 5385.37 14234.24
-0.935
(at level)
-1.280
(at level)
privatesaving
(S) 33 8.314011 2.886613 2.68999 13.4093
-3.663**
(in ratio)
-3.603**
(in ratio)
bottom90income
(90Y) 33 62.46364 4.333552 55.06 68.15
-3.681**
(in 1st diff.)
-3.540*
(in 1st diff.)
95_50incomeratio
(YR) 33 3.163333 .2842827 2.72 3.58
-4.841***
(in 1st diff.)
-4.827**
(in 1st diff.)
top1incomeshare
(1YS) 33 11.7097 3.276819 7.74 17.68
-2.409
(in ratio)
-2.511
(in ratio)
Source: own work.
Following the observation of the units (Table 4), data plots (Figure 3) and testing for the unit
roots (Table 5), the final regression shows that optimal result is treating the time series as
cointegrated with one common trend where not all data are stationary. Since the stationarity
condition does not hold, the lagged dependent variable (LDV) model is not appropriate for
our model, but the time effect is partially controlled due to the first differences. On the other
hand, regressing full stationary data causes too large a loss of efficiency and may eliminate
the permanent components, leaving only the relations among the remaining stochastic
components of the time series. That may be pure noise, when what is of economic interest
are actually the relations between the permanent components (Cochrane, 2012; Friedman,
1988). The 3SLS method performs GLS estimation, which corrects the OLS regression
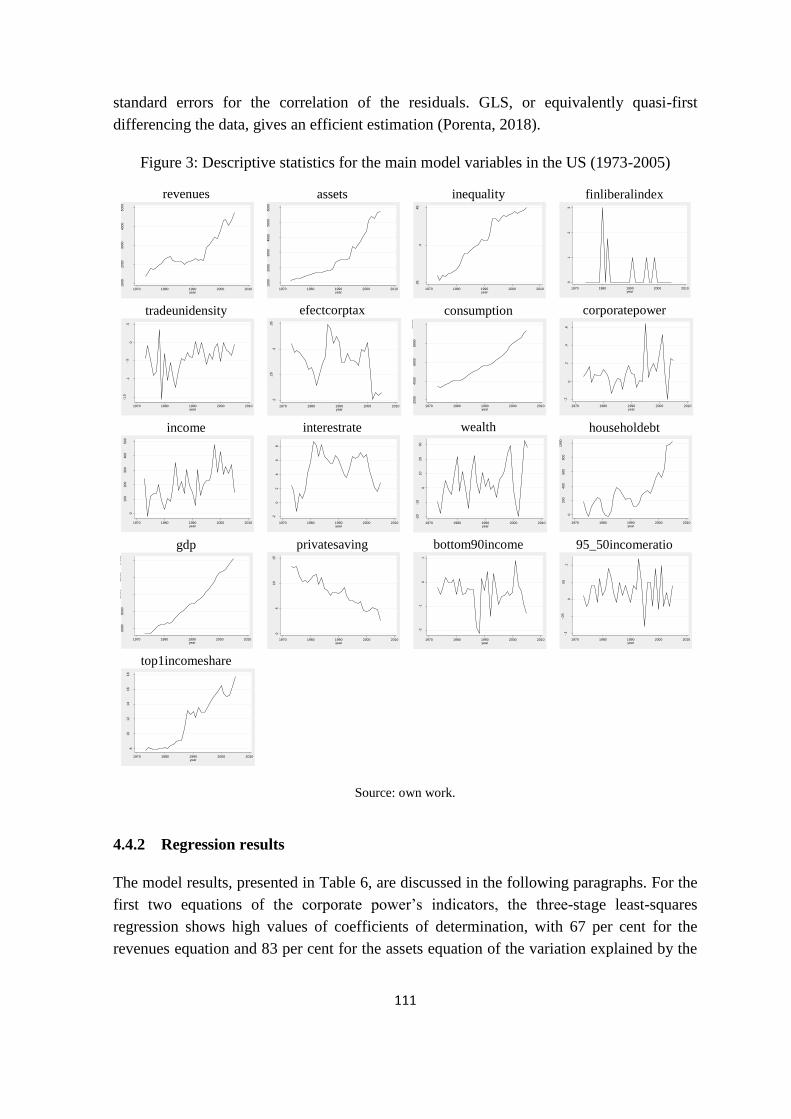
111
standard errors for the correlation of the residuals. GLS, or equivalently quasi-first
differencing the data, gives an efficient estimation (Porenta, 2018).
Figure 3: Descriptive statistics for the main model variables in the US (1973-2005)
Source: own work.
4.4.2 Regression results
The model results, presented in Table 6, are discussed in the following paragraphs. For the
first two equations of the corporate power’s indicators, the three-stage least-squares
regression shows high values of coefficients of determination, with 67 per cent for the
revenues equation and 83 per cent for the assets equation of the variation explained by the
revenues
assets
inequality
finliberalindex
tradeunidensity
efectcorptax
consumption
corporatepower
income
interestrate
wealth
householdebt
gdp
privatesaving
bottom90income
95_50incomeratio
top1incomeshare
10
00
20
00
30
00
40
00
50
00
reve
nu
es
1970 1980 1990 2000 2010year
10
00
20
00
30
00
40
00
50
00
60
00
asse
ts
1970 1980 1990 2000 2010year
.35
.4.4
5
ineq
ua
lity
1970 1980 1990 2000 2010year
01
23
finlib
inde
x_d
1
1970 1980 1990 2000 2010year
-1.5
-1-.
50
.5
tra
de
un
iden
sity_d
1
1970 1980 1990 2000 2010year
.2.2
5.3
.35
efe
ctc
orp
tax
1970 1980 1990 2000 2010year
20
00
40
00
60
00
80
00
10
00
0
con
sum
ption
2
1970 1980 1990 2000 2010year
-.2
0.2
.4.6
corp
ora
tepo
we
r_f_
d1
1970 1980 1990 2000 2010year
0
10
020
030
040
050
0
incom
e3_
d1
1970 1980 1990 2000 2010year
-20
24
68
inte
restr
ate
2
1970 1980 1990 2000 2010year
-20
-10
010
20
30
we
alth
_d
1
1970 1980 1990 2000 2010year
0
20
040
060
080
010
00
ho
use
ho
ldeb
t_d1
1970 1980 1990 2000 2010year
60
00
80
00
10
00
012
00
014
00
0gd
p3
1970 1980 1990 2000 2010year
05
10
15
pri
vate
sa
vin
g
1970 1980 1990 2000 2010year
-2-1
01
bo
ttom
90in
co
me_
d1
1970 1980 1990 2000 2010year
-.1
-.0
5
0
.05
.1
_5
0in
co
mera
tio_
d1
1970 1980 1990 2000 2010year
810
12
14
16
18
top1
incom
esha
re
1970 1980 1990 2000 2010year
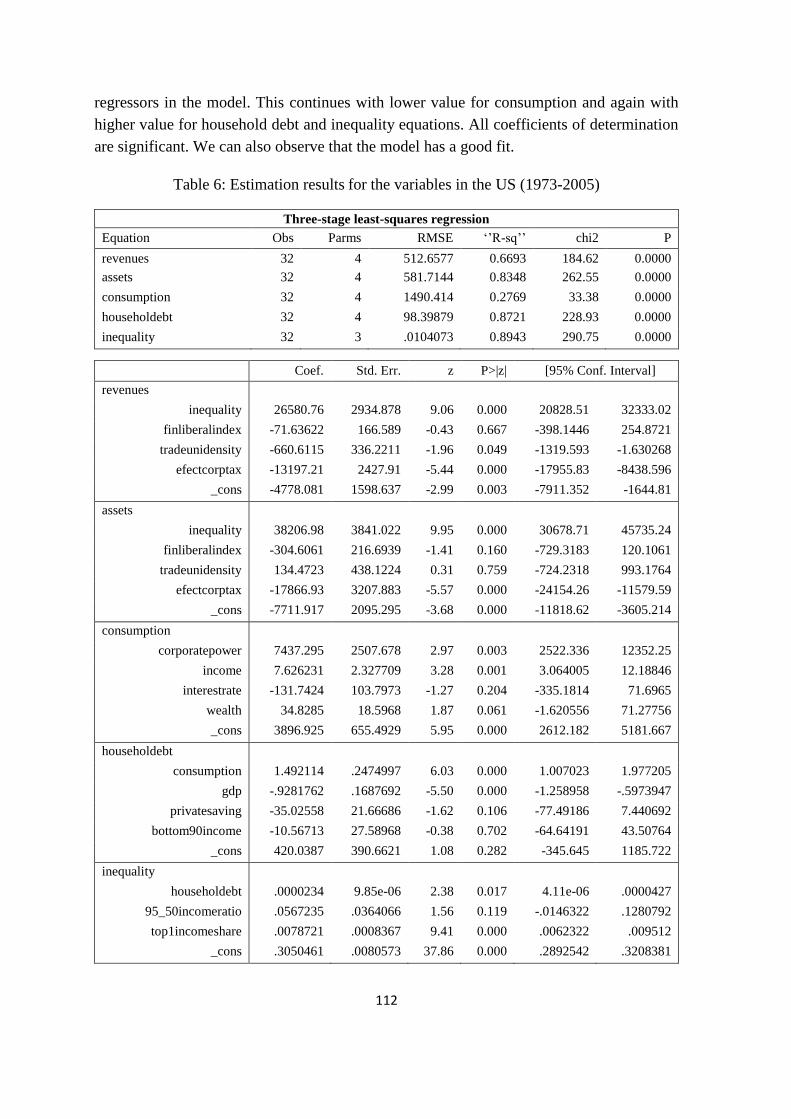
112
regressors in the model. This continues with lower value for consumption and again with
higher value for household debt and inequality equations. All coefficients of determination
are significant. We can also observe that the model has a good fit.
Table 6: Estimation results for the variables in the US (1973-2005)
Three-stage least-squares regression
Equation Obs Parms RMSE ‘’R-sq’’ chi2 P
revenues 32 4 512.6577 0.6693 184.62 0.0000
assets 32 4 581.7144 0.8348 262.55 0.0000
consumption 32 4 1490.414 0.2769 33.38 0.0000
householdebt 32 4 98.39879 0.8721 228.93 0.0000
inequality 32 3 .0104073 0.8943 290.75 0.0000
Coef. Std. Err. z P>|z| [95% Conf. Interval]
revenues
inequality 26580.76 2934.878 9.06 0.000 20828.51 32333.02
finliberalindex -71.63622 166.589 -0.43 0.667 -398.1446 254.8721
tradeunidensity -660.6115 336.2211 -1.96 0.049 -1319.593 -1.630268
efectcorptax -13197.21 2427.91 -5.44 0.000 -17955.83 -8438.596
_cons -4778.081 1598.637 -2.99 0.003 -7911.352 -1644.81
assets
inequality 38206.98 3841.022 9.95 0.000 30678.71 45735.24
finliberalindex -304.6061 216.6939 -1.41 0.160 -729.3183 120.1061
tradeunidensity 134.4723 438.1224 0.31 0.759 -724.2318 993.1764
efectcorptax -17866.93 3207.883 -5.57 0.000 -24154.26 -11579.59
_cons -7711.917 2095.295 -3.68 0.000 -11818.62 -3605.214
consumption
corporatepower 7437.295 2507.678 2.97 0.003 2522.336 12352.25
income 7.626231 2.327709 3.28 0.001 3.064005 12.18846
interestrate -131.7424 103.7973 -1.27 0.204 -335.1814 71.6965
wealth 34.8285 18.5968 1.87 0.061 -1.620556 71.27756
_cons 3896.925 655.4929 5.95 0.000 2612.182 5181.667
householdebt
consumption 1.492114 .2474997 6.03 0.000 1.007023 1.977205
gdp -.9281762 .1687692 -5.50 0.000 -1.258958 -.5973947
privatesaving -35.02558 21.66686 -1.62 0.106 -77.49186 7.440692
bottom90income -10.56713 27.58968 -0.38 0.702 -64.64191 43.50764
_cons 420.0387 390.6621 1.08 0.282 -345.645 1185.722
inequality
householdebt .0000234 9.85e-06 2.38 0.017 4.11e-06 .0000427
95_50incomeratio .0567235 .0364066 1.56 0.119 -.0146322 .1280792
top1incomeshare .0078721 .0008367 9.41 0.000 .0062322 .009512
_cons .3050461 .0080573 37.86 0.000 .2892542 .3208381
113
Endogenous variables: revenues assets consumption householdebt inequality finliberalindex
tradeunidensity efectcorptax corporatepower
Exogenous variables: income interestrate wealth gdp privatesaving bottom90income 95_50incomeratio
top1incomeshare
Source: own work.
The coefficients in the first two equations of the corporate power’s indicators have expected
impact consistent with predicted economic theory of the model, except for the financial
liberalization index and trade union density in the second equation. The positive sign for
income inequality means that an increase in income inequality would increase the indicators
of corporate power, whereas the negative sign for corporate effective tax rate means that the
decreasing corporate effective tax rate causes a surge in the indicators of the corporate
power. All coefficients, except for financial liberalization index and trade union density in
the second equation are significant.
In the consumption equation, the expected impact is as anticipated, except for the wealth,
which is slightly above the threshold of 5 per cent of significance. All other coefficients are
significant, except for the interest rate. The positive signs for corporate power and income,
and negative sign for interest rate would lead to an increase in the consumption. These results
are in accordance with the main existing theories based on income dependent consumption
function and relative income theory.
Rising consumption leads towards increased household debt, which can be observed in the
next equation. All coefficients are significant, except for private saving and bottom 90 per
cent income share, and all coefficients are consistent with predicted economic theory.
Besides the positive sign for the consumption, the coefficients of GDP, private saving and
bottom 90 per cent income share are negative, which all leads towards growing household
debt.
In the last equation of inequality, all coefficients have positive signs, which is again in
accordance with the predicted model and only 95th/50th income ratio is above the threshold
of 5 per cent of significance. Growing household debt, along with rising 95th/50th income
ratio and surging top1 income share result in an increase in income inequality. It can also be
observed that all the coefficients in the system are well within the 95 per cent confidence
intervals for the parameters.
Given the regression results, we can confirm the first hypothesis about the increasing
corporate power in the US in the period from 1973 to 2005. Both of corporate power’s
indicators, revenues and assets, rose in that period. We can also confirm the next three
hypotheses: increased corporate power caused increased consumption, increased
consumption caused higher household debt and higher household debt caused higher income
114
inequality. Finally, the fifth hypothesis can be confirmed as well: higher income inequality
has influenced the increased corporate power.
4.5 Discussion and conclusion
We assess the non-recursive structural model using the US data between 1973 and 2005, and
three-stage least squares regression of a system of simultaneous structural equations. The
analysis in this chapter emphasizes the most important and dominant single economy in the
world, namely the US. By focusing on the most significant and influential world economy,
we deepen our knowledge of the trends of rising corporate power and consumerism. By
focusing on a single economy, we could also prolong the time series due to better availability
of data, comparing to OECD data and OECD model. The sheer size of the US economy
makes its macroeconomic implications of primary importance, as well as for the
macroeconomic performance of the world at large. Furthermore, from an analysis of the US
we can attain some understanding of potential problems or benefits also for the other
developed countries.
We will discuss the results in both terms, the cumulative and the circular causation. The
cumulative aspect was described in the chapter of descriptive statistics and the circular
causation aspect was described in the chapter of regression results. By combining both we
can elaborate the relationships between main variables and the dynamics of the CCC model.
When analysing the effect of first system variable of corporate power on consumption,
we can observe from descriptive statistics that both main system variables are growing in
time, so there is a clear positive accumulative effect. Next, the regression analysis is showing
that corporate power is positively affecting consumption, meaning when corporate power is
increasing the consumption is increasing. An additional explanatory variable of income
positively affects consumption, whereas the interest rate negatively affects consumption,
according to the regression results. Positive sign for the wealth could be interpreted as having
more direct effect on consumption, whereas on the other hand in the OECD CCC model, the
negative sign of the wealth has more indirect effect and could imply that people who are
disinvesting by selling their wealth increase their consumption through this additional
income. In this first sector of US CCC model, we can confirm both the cumulative and the
circular causation aspects of the main system variables.
For the effect of the second system variable of consumption on household debt, we can
first observe from descriptive statistics that both main system variables are growing in time,
so there is a clear positive accumulative effect. Further, the regression analysis shows that
consumption positively affects the household debt, meaning when consumption is increasing
the household debt is increasing. Additional explanatory variables of GDP, private saving
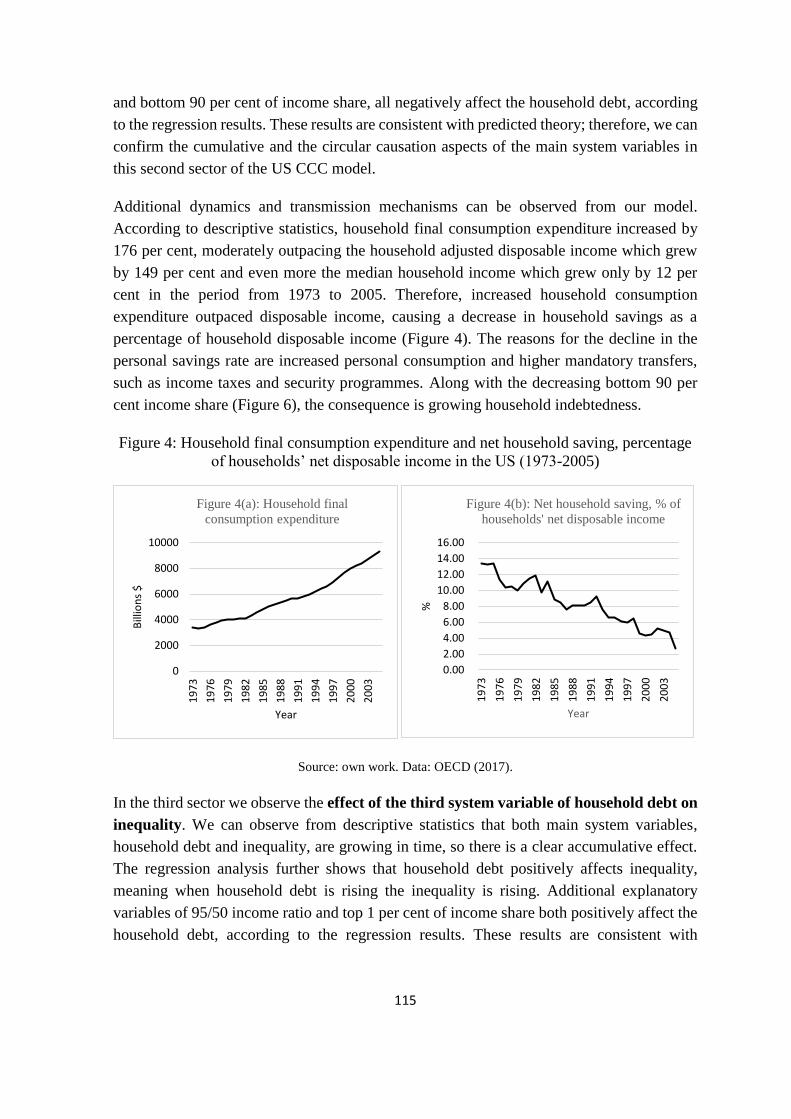
115
and bottom 90 per cent of income share, all negatively affect the household debt, according
to the regression results. These results are consistent with predicted theory; therefore, we can
confirm the cumulative and the circular causation aspects of the main system variables in
this second sector of the US CCC model.
Additional dynamics and transmission mechanisms can be observed from our model.
According to descriptive statistics, household final consumption expenditure increased by
176 per cent, moderately outpacing the household adjusted disposable income which grew
by 149 per cent and even more the median household income which grew only by 12 per
cent in the period from 1973 to 2005. Therefore, increased household consumption
expenditure outpaced disposable income, causing a decrease in household savings as a
percentage of household disposable income (Figure 4). The reasons for the decline in the
personal savings rate are increased personal consumption and higher mandatory transfers,
such as income taxes and security programmes. Along with the decreasing bottom 90 per
cent income share (Figure 6), the consequence is growing household indebtedness.
Figure 4: Household final consumption expenditure and net household saving, percentage
of households’ net disposable income in the US (1973-2005)
Source: own work. Data: OECD (2017).
In the third sector we observe the effect of the third system variable of household debt on
inequality. We can observe from descriptive statistics that both main system variables,
household debt and inequality, are growing in time, so there is a clear accumulative effect.
The regression analysis further shows that household debt positively affects inequality,
meaning when household debt is rising the inequality is rising. Additional explanatory
variables of 95/50 income ratio and top 1 per cent of income share both positively affect the
household debt, according to the regression results. These results are consistent with
0
2000
4000
6000
8000
10000
19
73
19
76
19
79
19
82
19
85
19
88
19
91
19
94
19
97
20
00
20
03
Bill
ion
s $
Year
Figure 4(a): Household final
consumption expenditure
0.00
2.00
4.00
6.00
8.00
10.00
12.00
14.00
16.00
19
73
19
76
19
79
19
82
19
85
19
88
19
91
19
94
19
97
20
00
20
03
%
Year
Figure 4(b): Net household saving, % of
households' net disposable income
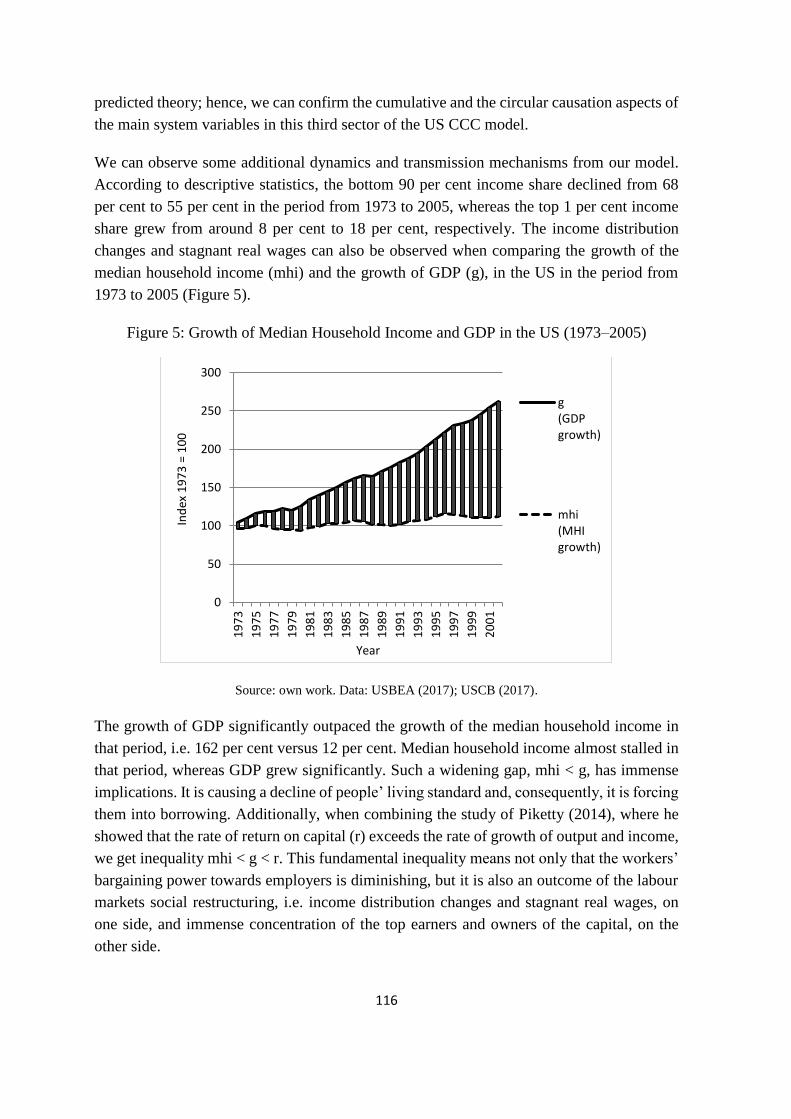
116
predicted theory; hence, we can confirm the cumulative and the circular causation aspects of
the main system variables in this third sector of the US CCC model.
We can observe some additional dynamics and transmission mechanisms from our model.
According to descriptive statistics, the bottom 90 per cent income share declined from 68
per cent to 55 per cent in the period from 1973 to 2005, whereas the top 1 per cent income
share grew from around 8 per cent to 18 per cent, respectively. The income distribution
changes and stagnant real wages can also be observed when comparing the growth of the
median household income (mhi) and the growth of GDP (g), in the US in the period from
1973 to 2005 (Figure 5).
Figure 5: Growth of Median Household Income and GDP in the US (1973–2005)
Source: own work. Data: USBEA (2017); USCB (2017).
The growth of GDP significantly outpaced the growth of the median household income in
that period, i.e. 162 per cent versus 12 per cent. Median household income almost stalled in
that period, whereas GDP grew significantly. Such a widening gap, mhi < g, has immense
implications. It is causing a decline of people’ living standard and, consequently, it is forcing
them into borrowing. Additionally, when combining the study of Piketty (2014), where he
showed that the rate of return on capital (r) exceeds the rate of growth of output and income,
we get inequality mhi < g < r. This fundamental inequality means not only that the workers’
bargaining power towards employers is diminishing, but it is also an outcome of the labour
markets social restructuring, i.e. income distribution changes and stagnant real wages, on
one side, and immense concentration of the top earners and owners of the capital, on the
other side.
0
50
100
150
200
250
300
19
73
19
75
19
77
19
79
19
81
19
83
19
85
19
87
19
89
19
91
19
93
19
95
19
97
19
99
20
01
Ind
ex 1
97
3 =
10
0
Year
g(GDPgrowth)
mhi(MHIgrowth)
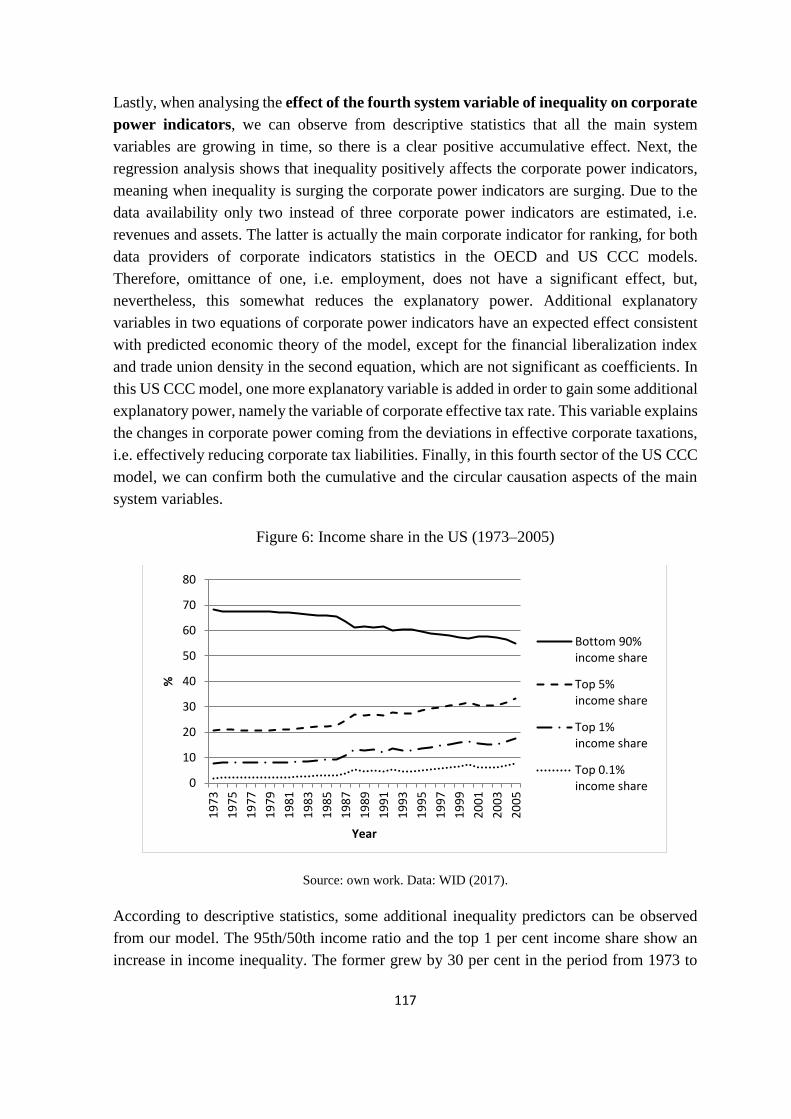
117
Lastly, when analysing the effect of the fourth system variable of inequality on corporate
power indicators, we can observe from descriptive statistics that all the main system
variables are growing in time, so there is a clear positive accumulative effect. Next, the
regression analysis shows that inequality positively affects the corporate power indicators,
meaning when inequality is surging the corporate power indicators are surging. Due to the
data availability only two instead of three corporate power indicators are estimated, i.e.
revenues and assets. The latter is actually the main corporate indicator for ranking, for both
data providers of corporate indicators statistics in the OECD and US CCC models.
Therefore, omittance of one, i.e. employment, does not have a significant effect, but,
nevertheless, this somewhat reduces the explanatory power. Additional explanatory
variables in two equations of corporate power indicators have an expected effect consistent
with predicted economic theory of the model, except for the financial liberalization index
and trade union density in the second equation, which are not significant as coefficients. In
this US CCC model, one more explanatory variable is added in order to gain some additional
explanatory power, namely the variable of corporate effective tax rate. This variable explains
the changes in corporate power coming from the deviations in effective corporate taxations,
i.e. effectively reducing corporate tax liabilities. Finally, in this fourth sector of the US CCC
model, we can confirm both the cumulative and the circular causation aspects of the main
system variables.
Figure 6: Income share in the US (1973–2005)
Source: own work. Data: WID (2017).
According to descriptive statistics, some additional inequality predictors can be observed
from our model. The 95th/50th income ratio and the top 1 per cent income share show an
increase in income inequality. The former grew by 30 per cent in the period from 1973 to
0
10
20
30
40
50
60
70
80
19
73
19
75
19
77
19
79
19
81
19
83
19
85
19
87
19
89
19
91
19
93
19
95
19
97
19
99
20
01
20
03
20
05
%
Year
Bottom 90%income share
Top 5%income share
Top 1%income share
Top 0.1%income share
118
2005 in the US. It means that the incomes of the 95th percentile of the wage distribution
have increased much faster than the incomes of the 50th percentile of the wage distribution,
i.e. the median incomes. The top 1 per cent income share showed an increase from 8 per cent
to an astonishing 18 per cent, as it can be observed in Figure 6. An even higher increase was
in the top 0.1 per cent income share, rising by a factor of 4, from 2 per cent to 8 per cent of
the entire income share. This clearly confirms the income distribution changes and immense
concentration of income sources in the hands of the top per cents of the income distribution,
which, along with the decreased bargaining power of the workers and decreased effective
corporate taxation, only increases corporate power.
Altogether, we can observe in the US CCC model that all main system variables rose in the
analysed period. The model regression shows significant and high values of coefficients of
determination. Most coefficients of regressors are significant and have signs consistent with
predicted economic theory of the model. The results support the notion of CCC of the main
identified variables. Rising corporate power causes increased consumption, which in turn
causes increasing household debt. Rising household debt results in growing inequality. The
latter is further strongly and positively correlated with the corporate power’s indicators,
which leads to rising corporate power.
We can also observe that the dynamics in the US lead towards an immense concentration of
income sources in the hands of the top per cents of the income distribution and income
distribution changes that only reinforce the rising corporate power. Corporations in the US
are further investing vast resources into advertising, thus fostering a consumerist society and
debt-driven consumption. Combining these facts with an historically high consumption
share in the US GDP, we can conclude that such system dynamics clearly endanger social
cohesion as well as the results of the welfare state achievements.
This chapter makes several original contributions to the literature. First, it is the first
empirical investigation of the CCC relationship, corporate power and its influence on
consumption, household debt, and inequality in the US. Second, it extends our knowledge
of the trends of rising corporate power and consumerism at the macro level, and its
transmission mechanisms in the US, which is the most significant and dominant single
economy. Some possible limitations of the analysis could be due to the short time series.
Prolonging the time series could deliver more efficient results.
119
5 DISCUSSION
5.1 Comparative analysis of CCC models and research questions
In this chapter, we discuss the main findings and answer the research questions regarding
both the OECD CCC model and the US CCC model. The comparative analysis of both
models has some limitations nevertheless. The first limitation is a small cross-section period
from 1990 to 2005. The second limitation is the fact that not all variables in both models are
the same, some are omitted due to the data availability and some are added in order to get
better explanatory power. Nevertheless, the core CCC relationships remain the same in both
models and are therefore comparable in both aspects, cumulative and in circular causation.
This dissertation empirically evaluates the validity of the proposed CCC mechanism impact
of corporate power on consumption, debt and inequality, on average of OECD countries and
on US data. The reason for the former is that the OECD is the biggest economic (member)
organization of most advanced economies and likewise the most influential one. A further
reason is that corporate power is concentrated in the hands of the biggest corporations, which
are global transnational corporations (TNCs). In 2004, 85 per cent of the top 100 TNCs were
headquartered in the Triad (EU, US and Japan), with TNCs headquartered in the US
dominating the list with 25 entries. Five countries, the US, the UK, Japan, France and
Germany, accounted for 73 per cent of the top 100 firms. Top100 TNCs are therefore
predominantly coming from Triad, changing its share from 100 per cent back in 1990 to
around 85 per cent in 2013 (UNCTAD, 2007). This dissertation empirically evaluates the
CCC relationships between corporate power, consumption, debt and inequality; therefore,
the average of OECD countries was used. An additional reason for the latter is also the
availability of the data, which are not available for all single OECD countries, thus forming
a panel data or clustering is not possible.
The OECD CCC model can be also used as a benchmark for the US model, to evaluate the
dynamics of US variables and the whole US model, comparing to the average of OECD
countries. The reason for analysing the US data is that the US is the biggest single economy
and the most influential one. By focusing on a single and the most significant world
economy, we can prolong the time series, on the one hand, and deepen our understanding of
the trends of rising corporate power and consumerism, on the other hand. The sheer size and
impact of the US economy makes its macroeconomic implications of primary importance
for the entire world. Furthermore, from an analysis of the US we can acquire an
understanding of potential problems or benefits also for the other developed countries.
In further discussion, I will answer first the additional research questions due to its logical
sequence construction of CCC. Furthermore, each of the four-main system variables will be
120
briefly analysed as a model variable, as well as in comparison between both models, i.e.
comparing the US model with the benchmark of the OECD model. Lastly, I will answer the
main research question.
Is increased corporate power causing increased consumption?
We can observe from our regression results, that in the first sector (Figure 1), corporate
power is positively influencing consumption. In both CCC models, the coefficients of
corporate power variables are significant and have positive signs. That means when
corporate power is rising the consumption is rising. This is a part of circular causation effect
of CCC. Descriptive statistics further shows that all corporate indicators and consumption,
as well as corporate power variable constructs, are rising in the investigated periods of both
models, e.g. in the cross-section period from 1990 to 2005, the US corporate revenues
increased by 113 per cent and the US corporate assets increased by 131 per cent, whereas in
the OECD model, corporate sales increased by 58 per cent and corporate assets increased by
101 per cent. Household final consumption expenditure growth rates were 3.44 per cent and
3.18 per cent on average in the same period, in the US and OECD model, respectively. This
is a part of cumulative effect of CCC, which is strengthening over time. Additional
explanatory variables are mostly consistent with predicted theory in both models.
Cumulative and the circular causation aspects in the first sector of both CCC models are
confirmed.
Overall, in the consumption function, the variable of corporate power, as a construct of
corporate indicators, considers the behavioural principles which are stemming from the
relative comparison of the consumers, i.e. ‘keeping up with the Joneses’ and their consumer
wants created on instinct-based psychology. The variable of real disposable income is
current income assumed to be the expected long-term average income, i.e. permanent
income. Variables of interest rate and wealth additionally explain the effect of saving and
assets, like bequest or disinvesting, on the household consumption expenditure.
After comparing both models, we can observe that the US consumption share in GDP is
higher than the OECD average consumption share in GDP (Figure 7). Further, after
comparing the advertising investments, as the main corporate tool of influence on
consumers, we can observe that the advertising accounts for 2.27 per cent of GDP in the US,
whereas it accounts for only 1.54 per cent of GDP in the UK, 1.49 per cent in Germany, 1.16
per cent in Japan, in the period from 1984 to 2005, and 0.69 per cent in France, in the period
from 1996 to 2005 (Molinari & Turino, 2009). The advertising shares were constant across
the countries in the long run. As it can be observed from the data, the US advertising share
in GDP outperformed the other countries. According to UNCTAD (2007), these five
countries accounted for 73 per cent of the top 100 TNCs in 2004.
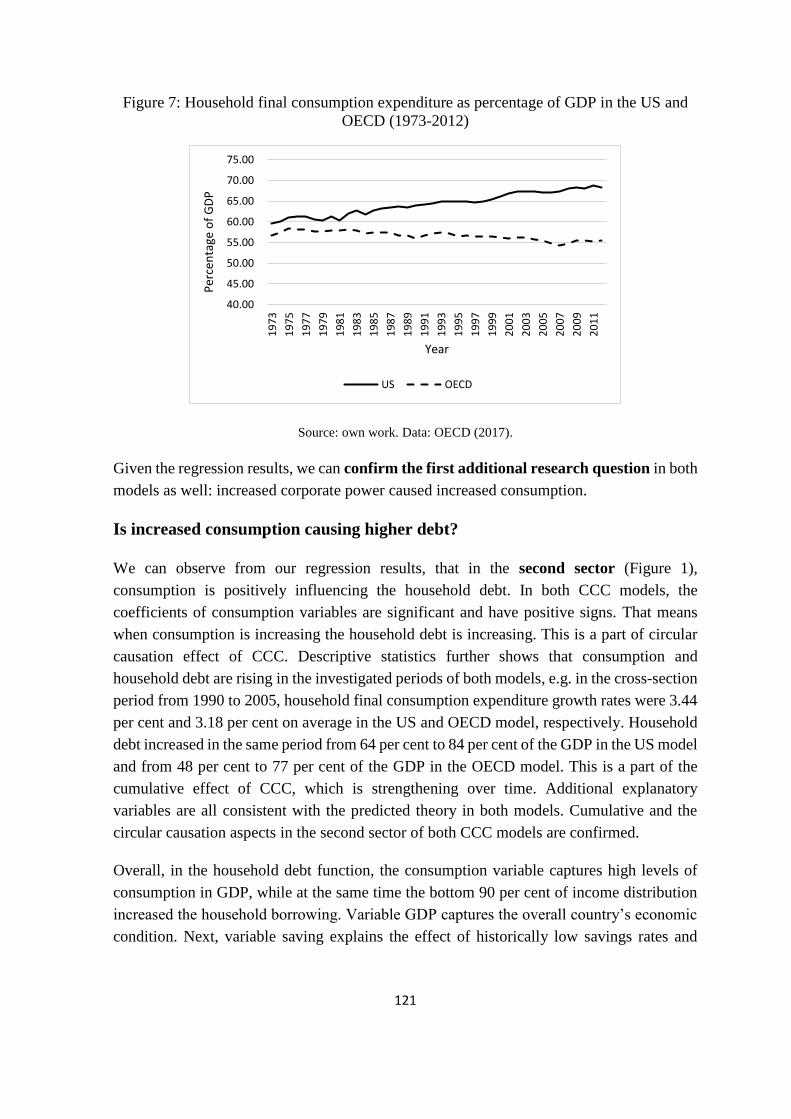
121
Figure 7: Household final consumption expenditure as percentage of GDP in the US and
OECD (1973-2012)
Source: own work. Data: OECD (2017).
Given the regression results, we can confirm the first additional research question in both
models as well: increased corporate power caused increased consumption.
Is increased consumption causing higher debt?
We can observe from our regression results, that in the second sector (Figure 1),
consumption is positively influencing the household debt. In both CCC models, the
coefficients of consumption variables are significant and have positive signs. That means
when consumption is increasing the household debt is increasing. This is a part of circular
causation effect of CCC. Descriptive statistics further shows that consumption and
household debt are rising in the investigated periods of both models, e.g. in the cross-section
period from 1990 to 2005, household final consumption expenditure growth rates were 3.44
per cent and 3.18 per cent on average in the US and OECD model, respectively. Household
debt increased in the same period from 64 per cent to 84 per cent of the GDP in the US model
and from 48 per cent to 77 per cent of the GDP in the OECD model. This is a part of the
cumulative effect of CCC, which is strengthening over time. Additional explanatory
variables are all consistent with the predicted theory in both models. Cumulative and the
circular causation aspects in the second sector of both CCC models are confirmed.
Overall, in the household debt function, the consumption variable captures high levels of
consumption in GDP, while at the same time the bottom 90 per cent of income distribution
increased the household borrowing. Variable GDP captures the overall country’s economic
condition. Next, variable saving explains the effect of historically low savings rates and
40.00
45.00
50.00
55.00
60.00
65.00
70.00
75.00
19
73
19
75
19
77
19
79
19
81
19
83
19
85
19
87
19
89
19
91
19
93
19
95
19
97
19
99
20
01
20
03
20
05
20
07
20
09
20
11
Per
cen
tage
of
GD
P
Year
US OECD
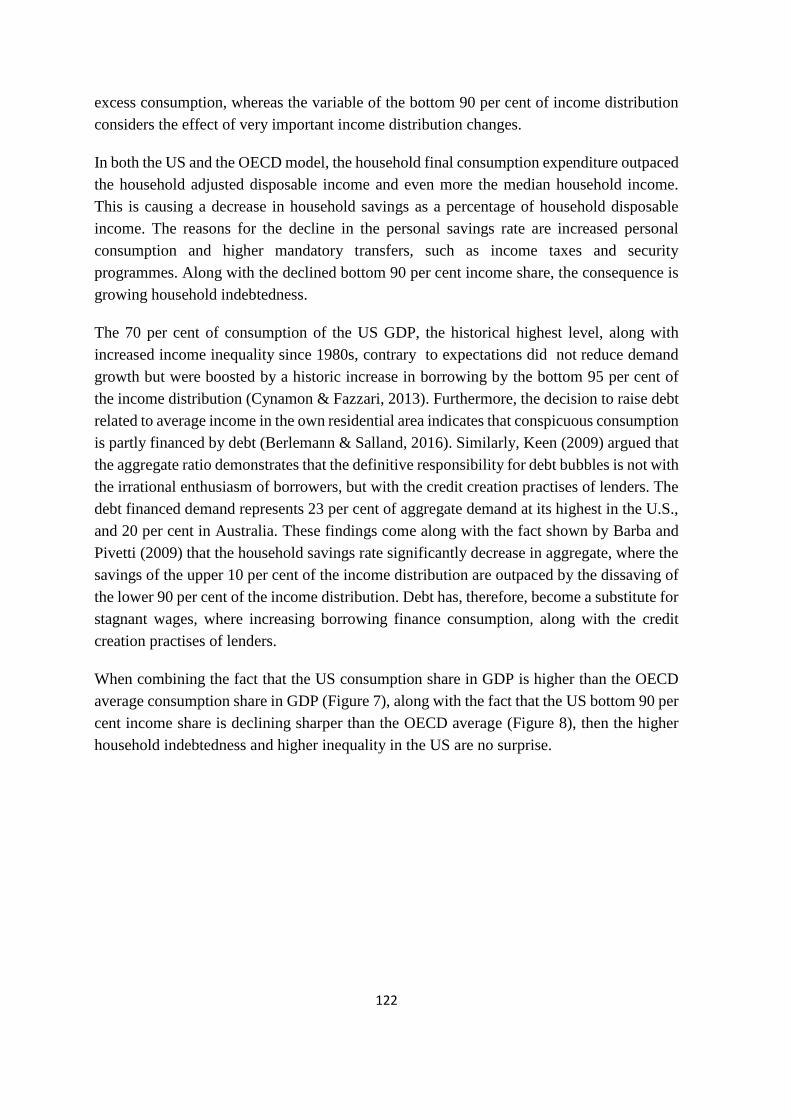
122
excess consumption, whereas the variable of the bottom 90 per cent of income distribution
considers the effect of very important income distribution changes.
In both the US and the OECD model, the household final consumption expenditure outpaced
the household adjusted disposable income and even more the median household income.
This is causing a decrease in household savings as a percentage of household disposable
income. The reasons for the decline in the personal savings rate are increased personal
consumption and higher mandatory transfers, such as income taxes and security
programmes. Along with the declined bottom 90 per cent income share, the consequence is
growing household indebtedness.
The 70 per cent of consumption of the US GDP, the historical highest level, along with
increased income inequality since 1980s, contrary to expectations did not reduce demand
growth but were boosted by a historic increase in borrowing by the bottom 95 per cent of
the income distribution (Cynamon & Fazzari, 2013). Furthermore, the decision to raise debt
related to average income in the own residential area indicates that conspicuous consumption
is partly financed by debt (Berlemann & Salland, 2016). Similarly, Keen (2009) argued that
the aggregate ratio demonstrates that the definitive responsibility for debt bubbles is not with
the irrational enthusiasm of borrowers, but with the credit creation practises of lenders. The
debt financed demand represents 23 per cent of aggregate demand at its highest in the U.S.,
and 20 per cent in Australia. These findings come along with the fact shown by Barba and
Pivetti (2009) that the household savings rate significantly decrease in aggregate, where the
savings of the upper 10 per cent of the income distribution are outpaced by the dissaving of
the lower 90 per cent of the income distribution. Debt has, therefore, become a substitute for
stagnant wages, where increasing borrowing finance consumption, along with the credit
creation practises of lenders.
When combining the fact that the US consumption share in GDP is higher than the OECD
average consumption share in GDP (Figure 7), along with the fact that the US bottom 90 per
cent income share is declining sharper than the OECD average (Figure 8), then the higher
household indebtedness and higher inequality in the US are no surprise.
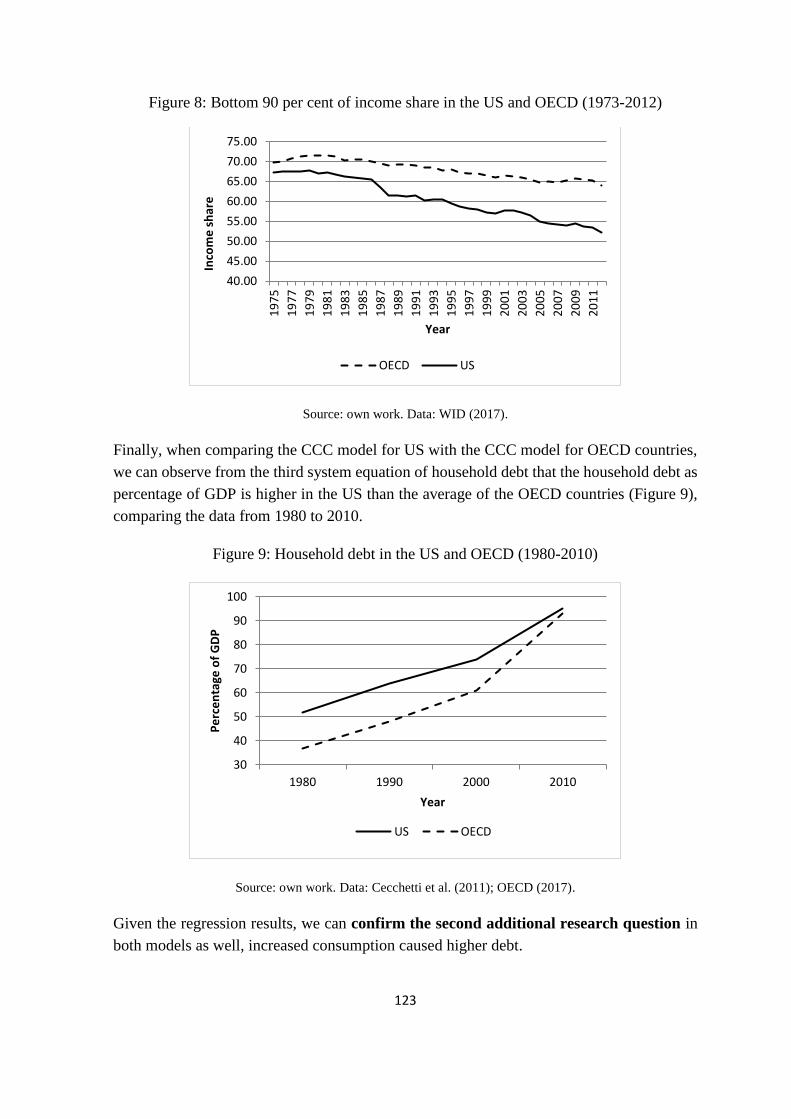
123
Figure 8: Bottom 90 per cent of income share in the US and OECD (1973-2012)
Source: own work. Data: WID (2017).
Finally, when comparing the CCC model for US with the CCC model for OECD countries,
we can observe from the third system equation of household debt that the household debt as
percentage of GDP is higher in the US than the average of the OECD countries (Figure 9),
comparing the data from 1980 to 2010.
Figure 9: Household debt in the US and OECD (1980-2010)
Source: own work. Data: Cecchetti et al. (2011); OECD (2017).
Given the regression results, we can confirm the second additional research question in
both models as well, increased consumption caused higher debt.
40.00
45.00
50.00
55.00
60.00
65.00
70.00
75.00
19
75
19
77
19
79
19
81
19
83
19
85
19
87
19
89
19
91
19
93
19
95
19
97
19
99
20
01
20
03
20
05
20
07
20
09
20
11
Inco
me
sh
are
Year
OECD US
30
40
50
60
70
80
90
100
1980 1990 2000 2010
Pe
rce
nta
ge o
f G
DP
Year
US OECD
124
Is higher debt causing higher income inequality?
We can observe from our regression results that in the third sector (Figure 1), household
debt positively influences inequality. In both CCC models, the coefficients of household
debt variables are significant and have positive signs. That means when household debt is
rising the inequality is rising. This is a part of circular causation effect of CCC. Descriptive
statistics further shows that household debt and inequality are rising in the investigated
periods of both models, e.g. in the cross-section period from 1990 to 2005, household debt
increased from 64 per cent to 84 per cent of the GDP in the US model and from 48 per cent
to 77 per cent of the GDP in the OECD model. Inequality, measured by the Gini coefficient,
surged in the same period from 0.349 to 0.380 in the US model and from 0.284 to 0.305 in
the OECD model. This is a part of cumulative effect of CCC, which is strengthening over
time. Additional explanatory variables are all consistent with predicted theory in both
models. Cumulative and the circular causation aspects in the third sector of both CCC models
are confirmed.
Overall, in the inequality function, the variable household debt explains the household debt
levels, variables 95/50 or 90/40 are differentials that capture the relative changes in the
income distribution, whereas the variable top 1 per cent of income distribution considers the
effect of the most significant factor in the income distribution changes, and likewise the most
influential one. Variable tax inequality is capturing the federal tax and transfer system role
in reducing inequality, measuring the effect between pre-tax and pots-tax income inequality.
Once comparing the CCC model for the US with the CCC model for the OECD countries,
we can observe from the third system equation of inequality that the inequality, measured
by Gini coefficient, is higher in US than the average of the OECD countries (Figure 10),
comparing the data from 1985 to 2012.
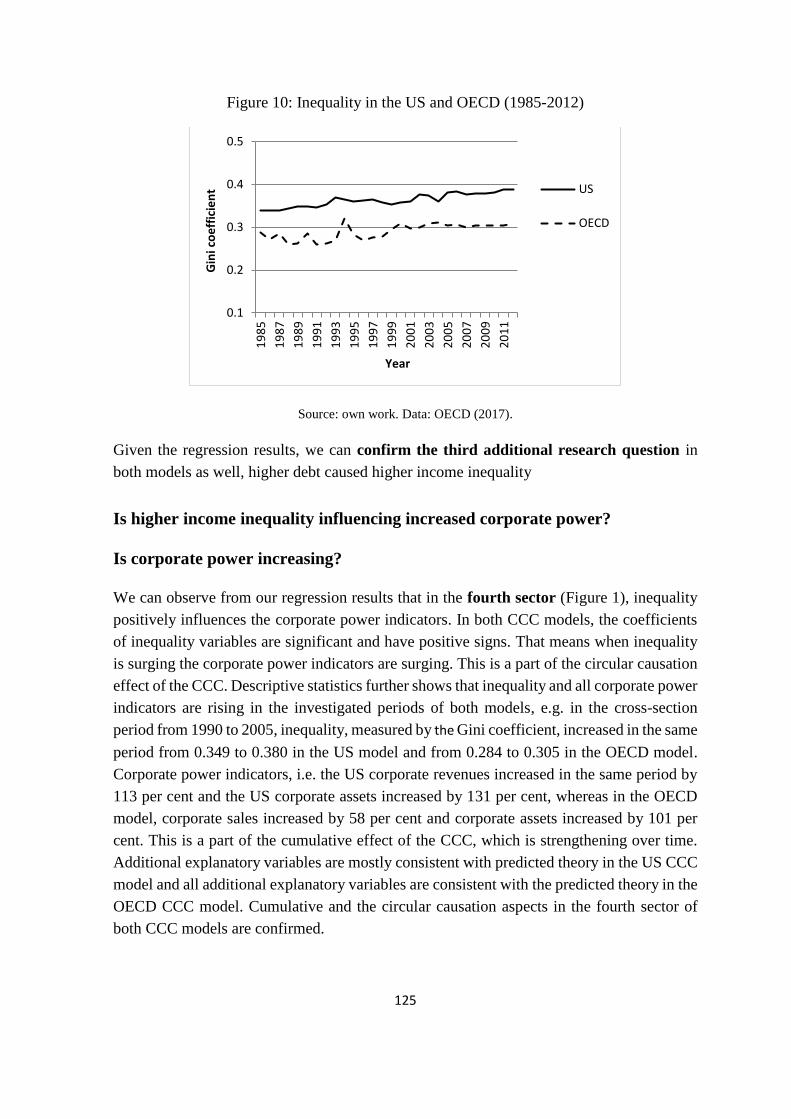
125
Figure 10: Inequality in the US and OECD (1985-2012)
Source: own work. Data: OECD (2017).
Given the regression results, we can confirm the third additional research question in
both models as well, higher debt caused higher income inequality
Is higher income inequality influencing increased corporate power?
Is corporate power increasing?
We can observe from our regression results that in the fourth sector (Figure 1), inequality
positively influences the corporate power indicators. In both CCC models, the coefficients
of inequality variables are significant and have positive signs. That means when inequality
is surging the corporate power indicators are surging. This is a part of the circular causation
effect of the CCC. Descriptive statistics further shows that inequality and all corporate power
indicators are rising in the investigated periods of both models, e.g. in the cross-section
period from 1990 to 2005, inequality, measured by the Gini coefficient, increased in the same
period from 0.349 to 0.380 in the US model and from 0.284 to 0.305 in the OECD model.
Corporate power indicators, i.e. the US corporate revenues increased in the same period by
113 per cent and the US corporate assets increased by 131 per cent, whereas in the OECD
model, corporate sales increased by 58 per cent and corporate assets increased by 101 per
cent. This is a part of the cumulative effect of the CCC, which is strengthening over time.
Additional explanatory variables are mostly consistent with predicted theory in the US CCC
model and all additional explanatory variables are consistent with the predicted theory in the
OECD CCC model. Cumulative and the circular causation aspects in the fourth sector of
both CCC models are confirmed.
0.1
0.2
0.3
0.4
0.5
19
85
19
87
19
89
19
91
19
93
19
95
19
97
19
99
20
01
20
03
20
05
20
07
20
09
20
11
Gin
i co
eff
icie
nt
Year
US
OECD
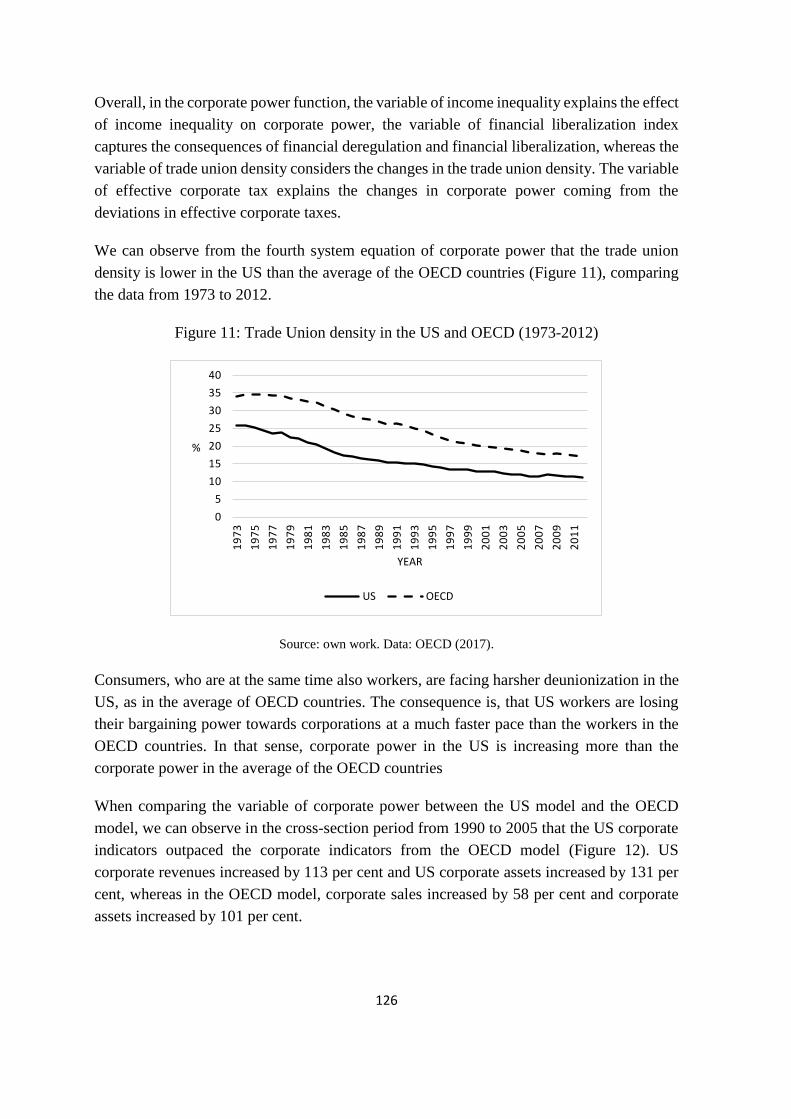
126
Overall, in the corporate power function, the variable of income inequality explains the effect
of income inequality on corporate power, the variable of financial liberalization index
captures the consequences of financial deregulation and financial liberalization, whereas the
variable of trade union density considers the changes in the trade union density. The variable
of effective corporate tax explains the changes in corporate power coming from the
deviations in effective corporate taxes.
We can observe from the fourth system equation of corporate power that the trade union
density is lower in the US than the average of the OECD countries (Figure 11), comparing
the data from 1973 to 2012.
Figure 11: Trade Union density in the US and OECD (1973-2012)
Source: own work. Data: OECD (2017).
Consumers, who are at the same time also workers, are facing harsher deunionization in the
US, as in the average of OECD countries. The consequence is, that US workers are losing
their bargaining power towards corporations at a much faster pace than the workers in the
OECD countries. In that sense, corporate power in the US is increasing more than the
corporate power in the average of the OECD countries
When comparing the variable of corporate power between the US model and the OECD
model, we can observe in the cross-section period from 1990 to 2005 that the US corporate
indicators outpaced the corporate indicators from the OECD model (Figure 12). US
corporate revenues increased by 113 per cent and US corporate assets increased by 131 per
cent, whereas in the OECD model, corporate sales increased by 58 per cent and corporate
assets increased by 101 per cent.
0
5
10
15
20
25
30
35
40
19
73
19
75
19
77
19
79
19
81
19
83
19
85
19
87
19
89
19
91
19
93
19
95
19
97
19
99
20
01
20
03
20
05
20
07
20
09
20
11
%
YEAR
US OECD
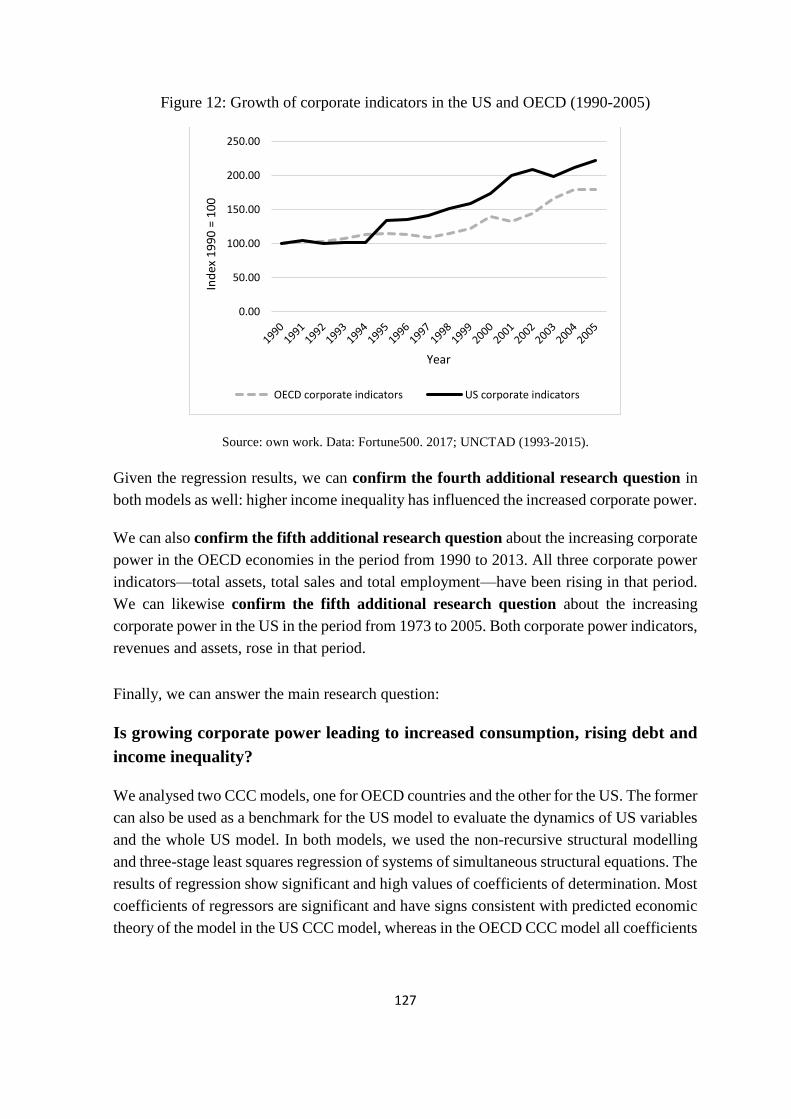
127
Figure 12: Growth of corporate indicators in the US and OECD (1990-2005)
Source: own work. Data: Fortune500. 2017; UNCTAD (1993-2015).
Given the regression results, we can confirm the fourth additional research question in
both models as well: higher income inequality has influenced the increased corporate power.
We can also confirm the fifth additional research question about the increasing corporate
power in the OECD economies in the period from 1990 to 2013. All three corporate power
indicators—total assets, total sales and total employment—have been rising in that period.
We can likewise confirm the fifth additional research question about the increasing
corporate power in the US in the period from 1973 to 2005. Both corporate power indicators,
revenues and assets, rose in that period.
Finally, we can answer the main research question:
Is growing corporate power leading to increased consumption, rising debt and
income inequality?
We analysed two CCC models, one for OECD countries and the other for the US. The former
can also be used as a benchmark for the US model to evaluate the dynamics of US variables
and the whole US model. In both models, we used the non-recursive structural modelling
and three-stage least squares regression of systems of simultaneous structural equations. The
results of regression show significant and high values of coefficients of determination. Most
coefficients of regressors are significant and have signs consistent with predicted economic
theory of the model in the US CCC model, whereas in the OECD CCC model all coefficients
0.00
50.00
100.00
150.00
200.00
250.00
Ind
ex 1
99
0 =
10
0
Year
OECD corporate indicators US corporate indicators
128
of regressors have signs consistent with predicted economic theory of the model. In that
sense circular causality seems to be stronger in the OECD CCC model.
Altogether, we can further observe in both CCC models that all main system variables are
accumulating in the analysed period. The results in both models therefore support the notion
of CCC of the main identified variables, thus confirming the main research question.
Rising corporate power causes increased consumption, which in turn causes increasing
household debt. Growing household debt results in increasing inequality. The latter is further
strongly and positively correlated with the corporate power indicators, which leads to rising
corporate power. The consequence is that the main system variables are accumulating in
time, which is not economically and socially sustainable.
When further comparing the CCC model for US and OECD data, we can observe that the
dynamics of the main variables movement is more intense in the US than in the OECD
countries. All main US variables are above the average of OECD countries. The rise of US
corporate power outpaced the rise of corporate power in the OECD model. The consumption
share in GDP is in the US well above the average of OECD countries. The same is true for
the US household debt and US income inequality. That means that the cumulative effect of
CCC is bigger in the US than the average of OECD.
These empirical findings are consistent with the process of cumulative and circular
causation, i.e. the CCC model shown in Figure 1. With the increase in the corporate power
relative to consumption or more precise, relating each level of corporate power to a higher
level of consumption, the curve in sector 1 shifts upward and therefore generates an increase
in all four parameters. In the US CCC model the corporate power increase seems to be larger
than the one in OECD model, therefore generating a larger increase in all four parameters.
Such system dynamics clearly endangers long-term growth sustainability and deteriorates
social cohesion as well as the results of the welfare state achievements.
5.2 Policy implications and research limitations
The focus of this research is on answering the research questions, i.e. testing the CCC model
and its relationships. Through the development of the CCC model, I analysed the impact of
corporate power on consumption, debt and inequality. Nevertheless, we can also observe
some broader impacts on economy and society. In this chapter we discuss some possible
policy implications.
Both models show that the main system variables are accumulating in time, which is not
economically and socially sustainable. Some of the consequences are slower economic
growth (Ostry et al., 2014), political instability (Ortiz & Cummins, 2011), higher
129
unemployment (James K. Galbraith, 2012), social and health problems (Wilkinson &
Pickett, 2011). It also causes fewer educational opportunities, lower human capital and lower
social mobility (Dunn & Pressman, 2005). As R. H. Scott and Pressman (2015) have shown,
highly leveraged consumption boosted economic growth in the US before the Great
Recession. After the Great Recession, many households try to deleverage, but that
deleveraging has been insufficient. An additional problem is that consumption now
represents around 70 per cent of the US GDP, the highest historical level. In combination
with increased income inequality since 1980s, that opposite of expectation did not reduce
demand growth but were boosted by a historic increase in borrowing by bottom 95 per cent
of the income distribution (Cynamon & Fazzari, 2013), and stagnant wages (Mishel &
Shierholz, 2013; R. H. Scott & Pressman, 2015), the inevitable result are indebted
households. Economic implications behind this process show that such development cannot
be economically and socially sustainable. Therefore, if the question is should the state
countervail corporate power, the answer is affirmative.
Some of the measures could be in both redistributive and distributive aspects, like minimum
wage legislation, empowering labour unions or the workers’ bargaining side, supporting
small businesses, improving human capital and social mobility, and fostering benefit
corporations. Changing corporate and income taxation can also reduce the income inequality
gap. Some future challenges could likewise be in resolving the dilemma; should we allow
the corporations (and financial firms) to remain to be too big to fail?
The redistributive aspect was addressed with in-depth research of different consumption
models by Palley (2010). Using a synthetic Keynes–Duesenberry–Friedman model, i.e.
relative permanent income theory of consumption, the study showed that consumption
decisions are motivated by ‘relative’ consumption concerns or ‘keeping up with the Joneses’;
therefore, a potential redistribution of income to lower income households is likely to have
a net positive effect on aggregate demand. Policy that constrains emulation behaviour can
consequently improve social welfare. Consumption patterns are also subject to habit and are
slow to fall in face of income reductions. In effect, households are partially engaged in a
form of consumption ‘arms race’. The rich try to increase relative consumption, while lower
income households try to keep up with the Joneses. Therefore, as Fieldhouse (2013) and
Piketty et al. (2011) argue, changing corporate and income taxation can reduce the income
inequality gap, which can in turn have a positive effect on aggregate demand. Furthermore,
these can also lead to a decreasing of wealth inequality, according to Saez and Zucman
(2016). They argue that an immense increase in wealth inequality is due to the increases of
top incomes and rising saving rate inequality, where savings are increasing for top earners
and declining for the others.
On the other hand, Barba and Pivetti (2009) addressed the distributive aspect. They argue
that the growing household debt is a consequence of changes in income distribution, i.e.
130
stagnant real wages and rising income inequalities. Debt has, therefore, become a substitute
for stagnant wages, where increasing borrowing finances consumption. Growing household
debt is actually a complement of the conspicuous redistribution of income. With the case
when households face almost no credit constrained, on the one hand, and with the imperative
of endlessly improving the households’ living standard and maintaining the imposed social
norm of ‘keeping up with the Joneses’, on the other hand, the result inevitably leads to a
growing household indebtedness. Additionally, the household savings rate significantly
decreases in aggregate, where the savings of the upper 10 per cent of the income distribution
are outpaced by the dissaving of the lower 90 per cent of the income distribution. In this
sense, measures like increasing the minimum wages along with the empowering of labour
unions or the workers’ bargaining side can effectively address the changes in income
distribution and rising income inequalities. This can consequently countervail increasing
corporate power and decrease income inequality.
The next question is how much debt driven demand can one economy really afford. Of
course, such a debt is mostly unproductive and irrational. Most often, it does not pay off.
Such a debt is a consumptive debt and therefore non-self-liquidating. It is not an investment
that may bring some future cash inflow and liquidates itself with future revenues. It is a debt
taken due to human instincts and therefore not an example of homo economicus (Dunn &
Pressman, 2005; John K. Galbraith, 1958; Hodgson, 2012; Pressman, 2007). As the latest
research from the field of evolutionary psychology and behavioural economy shows (Miller,
2009), humans are still evolving and developing, and it would be sensible for marketers to
substitute their paradigm regarding selling products for displaying status with products or
services that imply some deeper mental traits, such as kindness, intelligence and creativity.
Despite some clear empirical evidence which are in favour of redistributive and distributive
measures, governments can face some obstacles, nevertheless. One is political and shows
how democracy is related to redistribution and inequality. The usual model of democracy
presumes that median voters employ their voting rights in a democratic system to reallocate
funds from the wealthier towards themselves. However, Acemoglu et al. (2013) and Josifidis
et al. (2016) have shown that there is a limited effect of democracy on inequality, and they
thus do not confirm this standard model. Inequality tends to increase after democratization.
The reason for that might be that democracy may be captured or constrained. Although
democracy changes, the distribution of ‘de jure’ power in society, policy outcomes and
inequality also depend on the ‘de facto’ distribution of power. Powerful elites who see their
de jure power eroded by democratization may increase their investments in de facto power,
implemented in controlling the local or state law enforcement, lobbying, or influencing the
party system and politicians. Furthermore, Bergh and Bjørnskov (2014) studied the
correlation between social trust and income equality, where trust may influence equality
through an increase in the welfare state. The results show that although trust enables welfare
131
state policies, i.e. redistribution to decrease net inequality, this reduction in inequality does
not increase trust.
One possible solution or aspect that governments can address is the so called distributed
economy. Instead of favouring the centralized type of economies with prevailing big
companies or not so efficient decentralized type of economies, governments can foster a
distributed type of economy. Entities within the network are more self-sufficient; they do
not rely so much on the centre anymore and they can work more with regional and local
resources. This makes the entire economy more stable, flexible, innovative, environmental,
sustainable and self-sufficient. This concept, developed by Johansson, Kisch, and Mirata
(2005), calls for a transformation in the industrial system towards a distributed economy,
departing from the socio-economically and environmentally unsustainable dynamics.
Nevertheless, instead of eliminating the large-scale production, the best solution would be a
renewed balance between large- and small-scale and between resource flows that take place
within and across regional boundaries. Such balance is needed because not all industries are
appropriate for a distributed economy; some are economically feasible and efficient only on
a large scale. On the other hand, as Mirata, Nilsson, and Kuisma (2005) argue, the bio-energy
sector and consumer products would be suitable for a distributed economy.
Another aspect of a distributed economy is the emergence of the blockchain innovations in
the information technology (hereinafter: IT) industry and beyond. Blockchain technology
enables that the digital information is distributing and not copying itself anymore. This is
the basis for a new higher level of internet and digital economy but could be also the needed
tool and accelerator for a distributed economy. A further aspect to consider is the impact of
new IT technologies on democracies and the distribution of political power in the sense of
more horizontal democracies and direct participations of the voters. Such a development
would clearly have a decreasing impact on the centralized type of economies and on surging
corporate power.
Lastly, fostering a distributed economy would have the consequence of empowering the so
called ‘Main Street’ over the ‘Wall Street’. Financial sector vastly outgrew the real sector in
the past decades and fostered the so called ‘Casino’ capitalism with mostly self-driven
financial speculations (Foster & Magdoff, 2009). A stronger distributed economy along with
the new IT technologies and more horizontal and direct democracies could have a positive
impact on a more sustainable economy with less inequality, reduced corporate power, fewer
consumerist consumption and smaller debt, i.e. decreasing the perpetuity of the CCC model
dynamic. It could counter the outcome of overprovided private goods and underprovided
public goods. Furthermore, it could foster (local and regional) social mobility and human
capital, and improve social cohesion and economy.
132
Policy implications and recommendations have some limitations nonetheless. Different
capitalist systems, like the continental European, Scandinavian type, Anglo-Saxon or Asian
type of capitalism have institutional differences. Therefore, redistribution (or distribution)
for example, is different between those economic systems and different policy
recommendations wold apply for them or for a specific country. Some future research could
address also these institutional differences between countries and its policy implications.
Some possible limitations of the research could be due to the short time series. On the one
hand, prolonging the time series could deliver more efficient results; on the other hand, it
could deliver a bigger intersection between the both models. Nonetheless, the time horizon
captures the period of interests (since the start of the liberalization period in the mid-1970s
onwards). Adding some variables could also increase the explanatory power and efficiency.
Further limitations concern the comparative analysis between both models. The first
limitation is a small cross-section period from 1990 to 2005. The second limitation is the
fact that not all variables in both models are the same: some are omitted due to the data
availability and some are added in order to get better explanatory power. Still, the core CCC
relationships remain the same in both models and are therefore comparable.
Some future research suggestions could consider the institutional differences between
countries, i.e. diverse types of capitalism, like the continental European, the Scandinavian
type, the Anglo-Saxon or Asian type of capitalism. This research concentrates on an
empirical evaluation of the validity of the global CCC model, which is tested on the OECD
data, since the biggest corporations are global transnational corporations and are
predominantly coming from the Triad (EU, US and Japan). Hence, in this research, the
clustering is neither sensible, nor possible due to the data limitations. Nonetheless, the
OECD model can be used as a benchmark for the US model. Similarly, future research could
evaluate the impact of corporate power in some other countries or group of countries and
study the differences between them or compare them to the benchmark model. An additional
future challenge might be to form an unbalanced panel to see the results – variation across
countries, which may bring additional insights, and/or increase the reliability of the results
as more observations would be available.
5.3 Contribution to the literature
In summary, this dissertation makes several original contributions to the literature: (1) it
builds a comprehensive model that explains the impact of corporate power on consumption,
debt and inequality, and it is the first empirical investigation of the CCC relationship,
corporate power and its influence on consumption, debt and inequality. (2) It extends the
knowledge of the trends in rising corporate power and consumerism at the macro level, and
133
its transmission mechanisms. The economic model in this dissertation is the novelty in the
research field and it will contribute to a better understanding of the above-described research
questions. (3) It identifies and constructs a new variable of corporate power. (4) It
empirically examines the validity of the CCC model on OECD and US data. It thereby also
provides the first empirical assessment of the relationships between the variables or
components of the CCC model. It examines the new relationships between corporate power,
consumption, debt and inequality. (5) It provides policy implications. The main system
variables accumulate in time, which is not economically and socially sustainable.
Furthermore, it shows how system dynamics worsen social cohesion.
The first main contribution to the literature is a construction of the empirical theoretical
framework. I built a new empirical model to empirically test the political-economic model
and the relationships between the CCC variables. The analysis of existing partial equations
of the main system variables, i.e. corporate power, consumption, debt and inequality, is
followed by the construction of the new model partial equations, along with the new variable
of corporate power. This is followed by a synthesis of model partial equations into a new
economic model, which can be econometrically tested. Since there is a cumulative and
circular causation of the main system variables, that means that dependent variables are also
independent variables in the next equation in the sequence. This economic model of CCC
has four main system variables and therefore forms a system of simultaneous equations,
which produces a non-recursive model. Therefore, the first main contribution is a
construction of a comprehensive new empirical model that explains the impact of corporate
power on economic performance consumption, debt and inequality. It lays the ground for an
empirical investigation of the CCC relationships and extends the knowledge of the trends of
rising corporate power and consumerism at the macro level.
The second main contribution is an empirical examination of the validity of the CCC model
on OECD and US data. Thus, the third and fourth articles provide the first empirical
assessment of the relationships between the variables or components of the CCC model. The
articles examine the new relationships between corporate power, consumption, debt and
inequality. Therefore, after building a new empirical model, I have empirically tested the
relationships between the CCC variables, i.e. the CCC model. I tested the first model on
OECD data and the second on US data. The OECD model can also be used as a benchmark
for the US model, to evaluate the dynamics of US variables and the whole US model. In both
models, I used the non-recursive structural modelling and three-stage least squares
regression of systems of simultaneous structural equations. The results in both models
support the notion of CCC of the main identified variables. When comparing both models,
we can observe that the dynamic of main variables movement is more intense in the US than
in the OECD countries. All main US variables are above the average of OECD countries.
The rise of US corporate power outpaced the rise of corporate power in the OECD model.

134
The consumption share in GDP in the US is well above the average of the OECD countries.
The same is true of US household debt and US income inequality. These empirical findings
are consistent with the process of cumulative and circular causation, i.e. the CCC model. In
the US CCC model the corporate power increase seems to be larger than the one in the OECD
model, thereby generating larger increase in all main system variables.
135
CONCLUSION
This dissertation validates the importance of using a holistic approach when analysing the
complex dynamics of economies. The analysis of income inequality, consumption, debt, and
corporations and their corporate power, starts with theoretical framework, using descriptive
analysis together with the causal inference and combining Darwinian evolutionary
principles, anthropology, psychology and sociology with an economic analysis. It shows that
corporations are keen to exploit one of the most powerful human instincts—the reproduction
and the display of social status. By presenting the political-economic model based on logical
observation, causes and consequences, as well as empirical data, we can observe that there
is a clear notion of a cumulative and circular causation (CCC) of the main identified
variables. Growing corporate power leads to consumption, driven by conspicuous
consumption and consumerism, rising debt and income inequality.
The main purpose of this dissertation is to empirically test the political-economic model and
the relationships between the CCC variables. The goal of the research is to build new
empirical model examining the relationships between corporate power, consumption, debt
and inequality. Existing partial models are critically evaluated, which is followed by a
synthesis into a new economic (empirical) model. The validity of propositions is tested on
OECD and US data. The reason for the former is that OECD is the biggest economic
(member) organization of most advanced economies and likewise the most influential one.
It can be also used as a benchmark for the US model, to evaluate the dynamics of US
variables and the whole US model. The reason for analysing the US data is that the US is
the biggest single economy and the most influential one. By focusing on a single and the
most significant world economy, we can prolong the time series, on the one hand, and deepen
the knowledge about the trends of rising corporate power and consumerism, on the other
hand. The sheer size and impact of the US economy makes its macroeconomic implications
of primary importance for the entire world. Furthermore, from an analysis of the US we can
acquire an understanding of potential problems or benefits also for the other developed
countries.
Overall, we can observe in both CCC models that all main system variables rose in the
analysed period. Rising corporate power led towards increased consumption, which resulted
in rising debt, which then further led to surging inequality. Increasing inequality in turn
caused rising corporate power. These results confirm the additional research questions, as
well as the main research question: is growing corporate power leading to increased
consumption, rising debt and income inequality?
136
When comparing the CCC model for the US and OECD data, we can observe that the
dynamic of main variables movement is more intense in the US than in the OECD countries.
All main US variables are above the average of OECD countries. The rise of US corporate
power outpaced the rise of corporate power in the OECD model. The consumption share in
GDP is in US well above the average of OECD countries. The same is true for the US
household debt and US income inequality. These empirical findings are consistent with the
process of cumulative and circular causation, i.e. the CCC model. Rising corporate power
generates an increase in all main system variables. In the US CCC model the corporate power
increase seems to be larger than the one in OECD model, therefore generating larger increase
in all main system variables, i.e. consumption, debt and inequality.
We find that corporate power causes increased consumption by using combined and complex
approaches of advertising techniques to secure the companies’ investment and provide
sufficient demand for their products and services. The advertising exploits some powerful
human instincts, thus fostering the consumerism and a marketing dominated culture. Next,
rising consumerist consumption influences increasing household and public debt with
multiple transmission mechanisms that work simultaneously and reinforce each other.
Growing household debt and public debt further increase the inequality by preventing the
government from investing in education, health care and other infrastructure, and by
decreasing social transfers. A higher household debt also has the effect that people cannot
invest in their education or increase their savings and, consequently, their wealth and
financial independence. Finally, inequality causes an increase in corporate power. People
who are impoverished and unequal in comparison to the production owners are also weaker
in the bargaining process. They cannot improve their position, so corporate power only rises.
With rising corporate power, a new circle of causation begins.
The main system variables are accumulating in time, which causes slower economic growth,
political instability and higher unemployment. It also causes social and health problems,
fewer educational opportunities, lower human capital and lower social mobility. Economic
implications behind this process show that such development cannot be economically and
socially sustainable. Therefore, if the question is should the state countervail the corporate
power, the answer is affirmative. Some of the measures could be in both redistributive and
distributive aspects, like minimum wage legislation, empowering labour unions or the
workers’ bargaining side, supporting small businesses, improving human capital and social
mobility. Changing corporate and income taxation can also reduce the income inequality
gap. Some future challenges could likewise be in resolving the dilemma. Should we allow
the corporations (and financial firms) to remain to be too big to fail?
One possible solution or aspect that governments can address is the so called distributed
economy. Instead of favouring the centralized type of economies with prevailing big
companies or the not-so-efficient decentralized type of economies, governments can foster
137
a distributed type of economy. A stronger distributed economy along with the new IT
technologies and more horizontal and direct democracies could have a positive impact on a
more sustainable economy with less inequality, reduced corporate power, fewer consumerist
consumption and smaller debt, i.e. decreasing the perpetuity of the CCC model dynamic. It
can counter the outcome of overprovided private goods and underprovided public goods.
Furthermore, it can foster (local and regional) social mobility and human capital, and
improve social cohesion and economy.
How much debt driven demand can one economy afford is already the next question. Of
course, such a debt is mostly unproductive and irrational. Most often, it does not pay off.
Such a debt is a consumptive debt and therefore non-self-liquidating. It is not an investment
that may bring some future cash inflow and liquidates itself with future revenues. It is a debt
taken due to human instincts and therefore not an example of homo economicus. As the latest
research from the field of evolutionary psychology and behavioural economy shows, humans
are still evolving and developing, and it would be sensible for marketers to substitute their
paradigm regarding selling products for displaying status with products or services that
imply some deeper mental traits, such as kindness, intelligence and creativity.
Some possible limitations of the research could be due to the short time series. On the one
hand, prolonging the time series could deliver more efficient results; on the other hand, it
could deliver a bigger intersection between the both models. Nevertheless, the time horizon
captures the period of interests (since the start of liberalization period in the mid-1970s
onwards). Some future research suggestions could consider the institutional differences
between countries, i.e. diverse types of capitalism, like the continental European, the
Scandinavian type, the Anglo-Saxon or Asian type of capitalism. This research concentrates
on an empirically evaluation of the validity of the global CCC model, which is tested on the
OECD data, since the biggest corporations are global transnational corporations and are
predominantly coming from the Triad (EU, US and Japan). The OECD model is then used
as a benchmark for the US model. Similarly, future research could evaluate the impact of
corporate power in some other countries or group of countries and study the differences
between them or compare it to a benchmark model.
To conclude, this dissertation makes several original contributions to the literature. First, it
is the first empirical investigation of the CCC relationship, corporate power and its influence
on consumption, debt and inequality. Second, it extends our knowledge of the trends of rising
corporate power and consumerism at the macro level, and its transmission mechanisms.
Further, it shows how system dynamics endanger long-term growth sustainability and impair
social cohesion as well as the results of the welfare state achievements.
138
REFERENCES
Abiad, A., Detragiache, E., & Tressel, T. (2010a). A New Database of Financial Reforms.
IMF Econ Rev, 57(2), 281-302. doi: http://dx.doi.org/10.1057/imfsp.2009.23
Abiad, A., Detragiache, E., & Tressel, T. (2010b). A New Database of Financial Reforms.
IMF Staff Papers, 57(2), 281-302. doi: http://www.palgrave-
journals.com/imfsp/archive/index.html
Acemoglu, D., Aghion, P., & Violante, G. L. (2001). Deunionization, technical change and
inequality. Carnegie-Rochester Conference Series on Public Policy, 55(1), 229-264.
doi: http://dx.doi.org/10.1016/S0167-2231(01)00058-6
Acemoglu, D., Naidu, S., Restrepo, P., & Robinson, J. A. (2013). Democracy, redistribution
and inequality: National Bureau of Economic Research.
Addison, J. T., Heywood, J. S., & Xiangdong, W. (2003). New Evidence on Unions and
Plant Closings: Britain in the 1990s. Southern Economic Journal, 69(4), 822.
Alvarez-Cuadrado, F., & Van Long, N. (2011). The relative income hypothesis. Journal of
Economic Dynamics & Control, 35(9), 1489-1501. doi:
http://dx.doi.org/10.1016/j.jedc.2011.03.012
Amatulli, C., Guido, G., & Nataraajan, R. (2015). Luxury purchasing among older
consumers: exploring inferences about cognitive Age, status, and style motivations.
Journal of Business Research, 68(9), 1945-1952. doi:
http://dx.doi.org/10.1016/j.jbusres.2015.01.004
Anderson, S., & Cavanagh, J. (2000). The rise of corporate global power. Institute for Policy
Studies.
Ando, A., & Modigliani, F. (1963). The "Life Cycle" Hypothesis of Saving: Aggregate
Implications and Tests. The American Economic Review, 53(1), 55-84.
Arestis, P., & Gonzalez-Martinez, A. R. (2016). Income Inequality: Implications and
Relevant Economic Policies. Panoeconomicus, 63(1), 1-24. doi:
http://dx.doi.org/10.2298/pan1601001A
Azzimonti, M., De Francisco, E., & Quadrini, V. (2014). Financial Globalization, Inequality,
and the Rising Public Debt. American Economic Review, 104(8), 2267-2302. doi:
http://dx.doi.org/10.1257/aer.104.8.2267
Bagwell, K. (2005). The Economic Analysis of Advertising Discussion Paper 0506-01. New
York: Department of Economics, Columbia University.
Baran, P. A., & Sweezy, P. M. (1966). Monopoly Capital: An Essay on the American
Economic and Social Order. New York: NYU Press.
139
Barba, A., & Pivetti, M. (2009). Rising household debt: Its causes and macroeconomic
implications-a long-period analysis. Cambridge Journal of Economics, 33(1), 113-
137. doi: http://dx.doi.org/10.1093/cje/ben030
Barnes, S., & Young, G. (2003). The rise in US household debt: assessing its causes and
sustainability. Bank of England Quarterly Bulletin, 43(4), 458-458.
Benhabib, J., & Bisin, A. (2002). Advertising, Mass Consumption, and Capitalism. New
York: NYU.
Benhabib, J., & Bisin, A. (2011). Social Construction of Preferences: Advertising. In J.
Benhabib, A. Bisin & M. Jackson (Eds.), Handbook of Social Economics (pp. 201-
220). New York: Elsevier B. V.
Bergh, A., & Bjørnskov, C. (2014). Trust, welfare states and income equality: Sorting out
the causality. European Journal of political economy, 35(2014), 183-199.
Bergh, A., & Nilsson, T. (2010). Do liberalization and globalization increase income
inequality? European Journal of political economy, 26(4), 488-505. doi:
http://dx.doi.org/10.1016/j.ejpoleco.2010.03.002
Berisha, E., & Meszaros, J. (2017). Household debt, economic conditions, and income
inequality: A state level analysis. The Social Science Journal, 54(1), 93-101. doi:
http://dx.doi.org/10.1016/j.soscij.2016.11.002
Berlemann, M., & Salland, J. (2016). The Joneses’ income and debt market participation:
Empirical evidence from bank account data. Economics Letters, 142, 6-9. doi:
http://dx.doi.org/10.1016/j.econlet.2016.02.030
Bloxham, P., & Kent, C. (2009). Household Indebtedness. Australian Economic Review,
42(3), 327-339. doi: 10.1111/j.1467-8462.2009.00564.x
Brown, S., Gray, D., & Roberts, J. (2015). The relative income hypothesis: A comparison of
methods. Economics Letters, 130, 47-50. doi:
http://dx.doi.org/10.1016/j.econlet.2015.02.031
Campbell, J. Y. (1987). Does Saving Anticipate Declining Labor Income? An Alternative
Test of the Permanent Income Hypothesis. Econometrica, 55(6), 1249-1273. doi:
10.2307/1913556
Cecchetti, S., Mohanty, M., & Zampolli, F. (2011). The real effects of debt. St. Louis:
Federal Reserve Bank of St Louis.
Charles, K. K., Hurst, E., & Roussanov, N. (2007). Conspicuous Consumption and Race
NBER Working Paper Series 13392. Cambridge, MA: National bureau of economic
research.
140
Checchi, D., & Visser, J. (2005). Pattern Persistence in European Trade Union Density: A
longitudinal analysis 1 950-1996. European Sociological Review, 21(1), 1-21. doi:
10.1093/esr/jci001
Clark, A. E., Westergård-Nielsen, N., & Kristensen, N. (2009). Economic Satisfaction and
Income Rank in Small Neighbourhoods. Journal of the European Economic
Association, 7(2-3), 519-527. doi: 10.1162/JEEA.2009.7.2-3.519
Cochrane, J. H. (2012). A Brief Parable of Over-Differencing. Manuscript. Chicago:
University of Chicago, Booth School of Business.
Coffey, D., & Tomlinson, P. R. (2003). Coordination and Hierarchy in the Japanese Firm:
The Strategic Decision-making Approach vs. Aoki. In M. Waterson (Ed.),
Competition, Monopoly and Corporate Governance: Essays in Honour of Keith
Cowling (pp. 3-19). Cheltenham, UK: Edward Elgar Publishing.
Cowling, K., & Sugden, R. (1994). Beyond Capitalism: Towards a New World Economic
Order. London: Pinter.
Cowling, K., & Tomlinson, P. R. (2005). Globalisation and corporate power. Contributions
to Political Economy, 24(1), 33-54.
Crespo, N., Moreira, S. B., & Simoes, N. (2015). An Integrated Approach for the
Measurement of Inequality, Poverty, and Richness. Panoeconomicus, 62(5), 531-555.
doi: http://dx.doi.org/10.2298/pan1505531C
CRP. (2014). Center for Responsive Politics - Lobbying Database. Retrieved May 8, 2014,
from http://www.opensecrets.org/lobby/
CSRI. (2013). Global Wealth Report 2013. Zurich: Credit Suisse Research Institute.
Cynamon, B. Z., & Fazzari, S. M. (2013). Inequality and Household Finance during the
Consumer Age Working Paper No. 752. Annandale-on-Hudson, NY: Levy Economics
Institute of Bard College.
D’Orlando, F., & Sanfilippo, E. (2010). Behavioral foundations for the Keynesian
consumption function. Journal of Economic Psychology, 31(6), 1035-1046. doi:
http://dx.doi.org/10.1016/j.joep.2010.09.004
Darity, W. A. (2008). International encyclopedia of the social sciences (2 ed.). Detroit:
Macmillan Reference USA.
Datta, D. (2014). Economic growth and the problem of balancing consumption between rich
and poor. Economic Analysis and Policy, 44(1), 85-94. doi:
http://dx.doi.org/10.1016/j.eap.2014.02.002
Davidson, R., & MacKinnon, J. G. (1993). Estimation and Inference in Econometrics. New
York: Oxford University Press.
141
Davies, J. B., Sandstrom, S., Shorrocks, A., & Wolff, E. N. (2008). The World Distribution
of Household Wealth Discussion Paper 2008/003. Helsinki: World Institute for
Development Economic Research (UNU-WIDER).
Debelle, G. (2004a). Household debt and the macro-economy. BIS Quarterly Review, March
2004, 51–64.
Debelle, G. (2004b). Macroeconomic Implications of Rising Household Debt BIS Working
Paper No. 153. Basel, Switzerland: Bank for International Settlements.
DeJong, D. N., Nankervis, J. C., Savin, N. E., & Whiteman, C. H. (1992a). Integration
Versus Trend Stationary in Time Series. Econometrica, 60(2), 423-433. doi:
http://dx.doi.org/10.2307/2951602
DeJong, D. N., Nankervis, J. C., Savin, N. E., & Whiteman, C. H. (1992b). The power
problems of unit root test in time series with autoregressive errors. Journal of
Econometrics, 53(1), 323-343. doi: http://dx.doi.org/10.1016/0304-4076(92)90090-E
Dicken, P. (2015). Global Shift: Mapping the Changing Contours of the World Economy (7
ed.). New York, London: The Guilford Press.
Dickey, D. A., & Fuller, W. A. (1979). Distribution of the estimators for autoregressive time
series with a unit root. Journal of the American Statistical Association, 74(366), 427.
Duesenberry, J. S. (1949). Income, saving, and the theory of consumer behavior. Cambridge,
MA: Harvard University Press.
Dunn, S. P., & Pressman, S. (2005). The economic contributions of John Kenneth Galbraith.
Review of Political Economy, 17(2), 161-209. doi:
http://dx.doi.org/10.1080/09538250500067254
Dynan, K. E., & Kohn, D. L. (2007). The Rise in US Household Indebtedness: Causes and
Consequences. Paper presented at the The Structure and Resilience of the Financial
System, Sydney.
Elliott, G., Rothenberg, T. J., & Stock, J. H. (1996). Efficient tests for an autoregressive unit
root. Econometrica. Journal of the Econometric Society, 64(4), 813.
Farnsworth, K., & Fooks, G. (2015). Corporate Taxation, Corporate Power, and Corporate
Harm. The Howard Journal of Criminal Justice, 54(1), 25-41. doi:
http://dx.doi.org/10.1111/hojo.12112
Fieldhouse, A. (2013). Rising Income Inequality and the Role of Shifting Market-Income
Distribution, Tax Burdens, and Tax Rates. Washington: Economic policy institute.
Flavin, M. A. (1981). The Adjustment of Consumption to Changing Expectations About
Future Income. Journal of Political Economy, 89(5), 974-1009.
142
Foster, J. B. (2002). Monopoly Capital and the New Globalization. Monthly Review: An
Independent Socialist Magazine, 53(8), 16.
Foster, J. B., & Magdoff, F. (2009). The great financial crisis: Causes and consequences.
New York: NYU Press.
Frank, R. H. (2011). The Darwin Economy: Liberty, Competition, and the Common Good.
New Jersey: Princeton University Press.
Friedman, M. (1957a). The permanent income hypothesis A theory of the consumption
function (pp. 20-37): Princeton University Press.
Friedman, M. (1957b). A theory of the consumption function: A study by the National Bureau
of Economic Research: Princeton University Press.
Friedman, M. (1988). Money and the Stock Market. Journal of Political Economy, 96(2),
221-245.
Galbraith, J. K. (1952). American Capitalism: The Concept of Countervailing Power.
Boston: Houghton Mifflin.
Galbraith, J. K. (1958). The Affluent Society. Boston: Houghton Mifflin.
Galbraith, J. K. (1967). The New Industrial State (2 ed.). Harmondsworth: Penguin Books.
Galbraith, J. K. (2012). Inequality and Instability: A Study of the World Economy Just Before
the Great Crisis. New York: Oxford University Press.
Gentina, E., Shrum, L. J., & Lowrey, T. M. (2016). Teen attitudes toward luxury fashion
brands from a social identity perspective: A cross-cultural study of French and U.S.
teenagers. Journal of Business Research, 69(12), 5785-5792. doi:
http://dx.doi.org/10.1016/j.jbusres.2016.04.175
Grant, R. R. (1997). Measuring Corporate Power: Assessing the Options. Journal of
Economic Issues, 31(2), 453-460.
Green, H., Harper, I., & Smirl, L. (2009). Financial Deregulation and Household Debt: The
Australian Experience. Australian Economic Review, 42(3), 340-346. doi:
http://dx.doi.org/10.1111/j.1467-8462.2009.00561.x
Greene, W. H. (2012). Econometric Analysis (7 ed.). Upper Saddle River, NJ: Prentice Hall.
Hall, R. E. (1978). Stochastic Implications of the Life Cycle-Permanent Income Hypothesis:
Theory and Evidence. Journal of Political Economy, 86(6), 971-987.
Hall, R. E., & Mishkin, F. S. (1982). The Sensitivity of Consumption to Transitory Income:
Estimates from Panel Data on Households. Econometrica, 50(2), 461-481. doi:
http://dx.doi.org/10.2307/1912638
143
Harris, E., & Sammartino, F. (2011). Trends in the Distribution of Household Income
between 1979 and 2007. Washington: Congress of the United States, Congressional
Budget Office.
Hartmann, D., Guevara, M. R., Jara-Figueroa, C., Aristarán, M., & Hidalgo, C. A. (2017).
Linking Economic Complexity, Institutions, and Income Inequality. World
Development, 93, 75-93. doi: http://dx.doi.org/10.1016/j.worlddev.2016.12.020
Hodgson, G. M. (2012). Thorstein Veblen: The Father of Evolutionary and Institutional
Economics. In E. S. Reinert & F. L. Viano (Eds.), Thorstein Veblen: Economics for an
Age of Crises (pp. 283-295). London & New York: Anthem Press.
Hungerford, T. (2012). Taxes and the Economy: An Economic Analysis of the Top Tax
Rates Since 1945 CRS Report for Congress. Washington: Congressional Research
Service.
Hungerford, T. (2013). Changes in Income Inequality Among U.S. Tax Filers between 1991
and 2006: The Role of Wages, Capital Income, and Taxes. Available at SSRN:
https://ssrn.com/abstract=2207372 or http://dx.doi.org/10.2139/ssrn.2207372
doi:http://dx.doi.org/10.2139/ssrn.2207372
Iacoviello, M. (2008). Household Debt and Income Inequality, 1963–2003. Journal of
Money, Credit and Banking, 40(5), 929-965. doi: http://dx.doi.org/10.1111/j.1538-
4616.2008.00142.x
Iredale, W., & van Vugt, M. (2012). Altruism as showing off: a signaling perspective on
promoting green behaviour and acts of kindness. In S. C. Roberts (Ed.), Applied
Evolutionary Psychology (pp. 173-185). Oxford: Oxford University Press.
Jacobsen, D. H., & Naug, B. E. (2004). What influences the growth of household debt?
Economic Bulletin (Norges Bank), 75(3), 103-111.
Johansson, A., Kisch, P., & Mirata, M. (2005). Distributed economies – A new engine for
innovation. Journal of Cleaner Production, 13(10), 971-979. doi:
https://doi.org/10.1016/j.jclepro.2004.12.015
Josifidis, K., Dragutinović Mitrović, R., Supić, N., & Glavaški, O. (2016). Redistribution
and Transmission Mechanisms of Income Inequality - Panel Analysis of the Affluent
OECD Countries. Panoeconomicus, 63(2), 231-258. doi:
http://dx.doi.org/10.2298/pan1602231J
Kaminsky, G., & Schmukler, S. L. (2003). Short-Run Pain, Long-Run Gain: The Effects of
Financial Liberalization NBER. Cambridge, MA: National Bureau of Economic
Research.
Kapferer, J.-N., & Laurent, G. (2016). Where do consumers think luxury begins? A study of
perceived minimum price for 21 luxury goods in 7 countries. Journal of Business
Research, 69(1), 332-340. doi: http://dx.doi.org/10.1016/j.jbusres.2015.08.005
144
Kastanakis, M. N., & Balabanis, G. (2012). Between the mass and the class: Antecedents of
the “bandwagon” luxury consumption behavior. Journal of Business Research, 65(10),
1399-1407. doi: http://dx.doi.org/10.1016/j.jbusres.2011.10.005
Keen, S. (2009). Household Debt: The Final Stage in an Artificially Extended Ponzi Bubble.
Australian Economic Review, 42(3), 347-357. doi: http://dx.doi.org/10.1111/j.1467-
8462.2009.00560.x
Kent, C., Ossolinski, C., & Willard, L. (2007). The Rise of Household Indebtedness. Paper
presented at the The Structure and Resilience of the Financial System, Reserve Bank
of Australia, Sydney.
Keynes, J. M. (1936). The General Theory of Employment, Interest and Money. United
Kingdom: Palgrave Macmillan.
Khan, K., Anwar, S., Ahmed, M., & Kamal, M. A. (2015). Estimation of Consumption
Functions: The Case of Bangladesh, India, Nepal, Pakistan and Sri Lanka. 17(1), 113-
124.
Kim, H. J., Lee, D., Son, J. C., & Son, M. K. (2014). Household indebtedness in Korea: Its
causes and sustainability. Japan and the World Economy, 29, 59-76. doi:
http://dx.doi.org/10.1016/j.japwor.2013.12.001
Kochan, T. A. (2013). The American Jobs Crisis and Its Implication for the Future of
Employment Policy: A Call for a New Jobs Compact. ILR Review, 66(2), 291-314.
Kumhof, M., Rancière, R., & Winant, P. (2015). Inequality, Leverage, and Crises. American
Economic Review, 105(3), 1217-1245. doi: http://dx.doi.org/10.1257/aer.20110683
Lah, M., Sušjan, A., & Redek, T. (2016). Corporate Communication and Economic Theory:
An Institutionalist Perspective. Journal of Economic Issues, 50(1), 121-144.
Laperche, B., Galbraith, J. K., & Uzunidis, D. (Eds.). (2006). Innovation, Evolution and
Economic Change: New Ideas in the Tradition of Galbraith. Cheltenham, U.K.: Elgar.
Lora, E., & Olivera, M. (2007). Public debt and social expenditure: Friends or foes?
Emerging Markets Review, 8(4), 299-310. doi:
http://dx.doi.org/10.1016/j.ememar.2006.12.004
Luo, Y. (2001). Toward a Cooperative View of MNC-Host Government Relations: Building
Blocks and Performance Implications. Journal of International Business Studies,
32(3), 401-419.
Luttmer, E. F. P. (2005). Neighbors as Negatives: Relative Earnings and Well-Being*. The
Quarterly Journal of Economics, 120(3), 963-1002. doi: 10.1093/qje/120.3.963
Marx, K. (1867). Das Kapital: Kritik der politischen Oekonomie. Hamburg: Verlag von Otto
Meisner.
145
Mas-Colell, A., Whinston, M. D., & Green, J. R. (1995). Microeconomic Theory. Oxford:
Oxford university press.
Meghir, C. (2004). A Retrospective on Friedman's Theory of Permanent Income. Economic
Journal, 114(496), F293-F306. doi: http://dx.doi.org/10.1111/j.1468-
0297.2004.00223.x
Meng, X., Hoang, N. T., & Siriwardana, M. (2013). The determinants of Australian
household debt: A macro level study. Journal of Asian Economics, 29, 80-90. doi:
http://dx.doi.org/10.1016/j.asieco.2013.08.008
Meniago, C., Mukuddem-Petersen, J., Petersen, M. A., & Mongale, I. P. (2013). What causes
household debt to increase in South Africa? Economic Modelling, 33, 482-492. doi:
http://dx.doi.org/10.1016/j.econmod.2013.04.028
Mercer, H. (1995). Constructing a Competitive Order : The Hidden History of British
Antitrust Policies. Cambridge: Cambridge University Press.
Miller, G. (2009). Spent: Sex, Evolution and the Secrets of Consumerism. London: William
Heinemann/Random House.
Minsky, H. P. (1982). Can “It” Happen Again?: Essays on Instability and Finance. New
York: M.E. Sharpe.
Mirata, M., Nilsson, H., & Kuisma, J. (2005). Production systems aligned with distributed
economies: Examples from energy and biomass sectors. Journal of Cleaner
Production, 13(10), 981-991. doi: https://doi.org/10.1016/j.jclepro.2004.12.018
Mishel, L., Bivens, J., Gould, E., & Shierholz, H. (2012). The State of Working America (12
ed.). Ithaca, N.Y.: Cornell University Press.
Mishel, L., & Shierholz, H. (2013). A Decade of Flat Wages: The Key Barrier to Shared
Prosperity and a Rising Middle Class Briefing paper No. 365. Washington: Economic
policy institute.
Modigliani, F., & Brumberg, R. (1954). Utility analysis and the consumption function: An
interpretation of cross-section data. In K. Kurihara (Ed.), Post Keynesian Economics
(pp. 388–436).
Molinari, B., & Turino, F. (2009). Advertising, Labor Supply and the Aggregate Economy:
A long run Analysis Working Paper 09.16. Sevilla: Universidad Pablo de Olavide.
Molinari, B., & Turino, F. (2013). Advertising and Aggregate Consumption: a General
Equilibrium Assessment. Sevilla: Universidad Pablo de Olavide.
Mont, O., & Power, K. (2013). Understanding factors that shape consumption ETC/SCP
Working Paper (Vol. 1/2013, pp. 103). Copenhagen: The International Institute for
Industrial Environmental Economics.
146
Montgomerie, J. (2006). Giving Credit where it's Due: Public Policy and Household Debt in
the United States, the United Kingdom and Canada. Policy and Society, 25(3), 109-
141. doi: http://dx.doi.org/10.1016/S1449-4035(06)70085-6
Nepomuceno, M. V., & Laroche, M. (2015). The impact of materialism and anti-
consumption lifestyles on personal debt and account balances. Journal of Business
Research, 68(3), 654-664. doi: http://dx.doi.org/10.1016/j.jbusres.2014.08.006
O’Hara, P. A. (2008). Principle of Circular and Cumulative Causation: Fusing Myrdalian
and Kaldorian Growth and Development Dynamics. Journal of Economic Issues
(Association for Evolutionary Economics), 42(2), 375-387.
OECD. (2006). Has the Rise in Debt Made Households More Vulnerable? Paris: OECD.
OECD. (2011). An Overview of Growing Income Inequalities in OECD Countries. Paris:
OECD.
OECD. (2013). Crisis Squeezes Income and Puts Pressure on Inequality and Poverty. Paris:
OECD.
OECD. (2015). OECD.StatsExtracts. Retrieved September 25, 2015, from OECD
http://stats.oecd.org/#
OECD. (2016a). Income inequality remains high in the face of weak recovery OECD
Publications, Income Distribution Database (IDD). Paris: OECD.
OECD. (2016b). OECD.StatsExtracts. Retrieved June 3, 2016, from OECD
http://stats.oecd.org/#
OECD. (2017). OECD.StatsExtracts. Retrieved September 3, 2017, from OECD
http://stats.oecd.org/#
Oh, H., & Reis, R. (2012). Targeted transfers and the fiscal response to the great recession.
Journal of Monetary Economics, 59, S50-S64. doi:
http://dx.doi.org/10.1016/j.jmoneco.2012.10.025
Ortiz, I., & Cummins, M. (2011). Global Inequality: Beyond the Bottom Billion: A Rapid
Review of Income Distribution in 141 Countries. New York: UNICEF.
Ostry, J. D., Berg, A., & Tsangarides, C. G. (2014). Redistribution, Inequality, and Growth.
New York: International Monetary Fund.
Overesch, M., & Rincke, J. (2011). What Drives Corporate Tax Rates Down? A
Reassessment of Globalization, Tax Competition, and Dynamic Adjustment to Shocks.
Scandinavian Journal of Economics, 113(3), 579-602. doi: 10.1111/j.1467-
9442.2011.01650.x
147
Palley, T. I. (2010). The Relative Permanent Income Theory of Consumption: A Synthetic
Keynes-Duesenberry-Friedman Model. Review of Political Economy, 22(1), 41-56.
doi: http://dx.doi.org/10.1080/09538250903391954
Peoples, J., & Sugden, R. (2000). Divide and rule by transnational corporations. In C. N.
Pitelis & R. Sugden (Eds.), The nature of the transnational firm (Vol. 2, pp. 174-192).
New York: Routledge.
Piketty, T. (2014). Capital in the Twenty-first Century. Cambridge Massachusetts: Harvard
University Press.
Piketty, T., & Saez, E. (2003). Income Inequality in the United States, 1913-1998. The
Quarterly Journal of Economics, 118(1), 1-39.
Piketty, T., Saez, E., & Stantcheva, S. (2011). Optimal Taxation of Top Labor Incomes: A
Tale of Three Elasticities: National Bureau of Economic Research.
Porenta, F. (2014). The economics of cumulative and circular causation derived from the
ideas of Veblen and Galbraith. (Master’s thesis), University of Ljubljana, Faculty of
Economics, Ljubljana.
Porenta, F. (2017). Impact of Corporate Power on Consumption, Debt and Inequality:
Political-economic model of CCC. Economic and Business Review, 19(2), 155-179.
doi: 10.15458/85451.46
Porenta, F. (2018). Was Piketty right? Empirics of CCC Model: Corporate Power,
Consumption, Debt and Inequality. Panoeconomicus, Advance online publication.
doi: 10.2298/PAN160920019P
Pressman, S. (2007). Economic Power, the State, and Post-Keynesian Economics.
International Journal of Political Economy, 35(4), 67-86.
Rajan, R. G. (2010). Fault Lines: How Hidden Fractures Still Threaten the World Economy
Economy. New Jersey: Princeton University Press.
RBA. (2003). Household debt: What the data show. Reserve Bank of Australia Bulletin,
March, 1-11.
Reich, R. B. (2013). Aftershock: The Next Economy and America’s Future (3 ed.). New
York: Vintage Books, Random House.
Roach, B. (2007). Corporate Power in a Global Economy. Medford, MA: Global
Development and Environment Institute, Tufts University.
Robinson, J. (1954). The production function and the theory of capital. Review of Economic
Studies, 21(2), 81-106.
148
Rubin, P. H., & Capra, M. C. (2011). The Evolutionary Psychology of Economics. In C. S.
Roberts (Ed.), Applied Evolutionary Psychology (pp. 7-15). Oxford: Oxford
University Press.
Saez, E., & Zucman, G. (2016). Wealth Inequality in the United States since 1913: Evidence
from Capitalized Income Tax Data. The Quarterly Journal of Economics, 131(2), 519-
578. doi: http://dx.doi.org/10.1093/qje/qjw004
Sargent, T. J. (1978). Rational Expectations, Econometric Exogeneity, and Consumption.
Journal of Political Economy, 86(4), 673-700.
Schaltegger, C. A., & Weder, M. (2014). Austerity, inequality and politics. European
Journal of political economy, 35, 1-22. doi:
http://dx.doi.org/10.1016/j.ejpoleco.2014.03.005
Scherer, F. M., Beckenstein, A., Kaufer, E., Murphy, R. D., & Bougeon-Maassen, F. (1975).
The Economics of Multi-plant Operation: An International Comparisons Study.
Cambridge, MA: Harvard University Press.
Schindler, M. (2009). Measuring Financial Integration: A New Data Set. IMF Econ Rev,
56(1), 222-238. doi: 10.1057/imfsp.2008.28
Schwert, G. W. (1989). Tests for unit roots: A Monte Carlo investigation. Journal of
Business and Economic Statistics, 7(2), 147-159.
Scott, J. (1985). Theoretical Framework and Research Design. In F. Stockman, R. Ziegler &
J. Scott (Eds.), In Networks of Corporate Power: A Comparative Analysis of Ten
Countries (pp. 1-19). Cambridge: Polity Press.
Scott, R. H., & Pressman, S. (2015). Inadequate Household Deleveraging: Income, Debt,
and Social Provisioning. Journal of Economic Issues, 49(2), 483-492. doi:
http://dx.doi.org/10.1080/00213624.2015.1042794
Senik, C. (2008). Ambition and Jealousy: Income Interactions in the ‘Old’ Europe versus
the ‘New’ Europe and the United States. Economica, 75(299), 495-513. doi:
10.1111/j.1468-0335.2007.00629.x
Stata. (2016). Three-stage estimation for systems of simultaneous equations. Retrieved May
27, 2016, from http://www.stata.com/manuals14/rreg3.pdf
Swank, D. (2002). Global Capital, Political Institutions, and Policy Change in Developed
Welfare States. Camgridge: Cambridge University Press.
Temme, D., Diamantopoulos, A., & Pfegfeidel, V. (2014). Specifying formatively-measured
constructs in endogenous positions in structural equation models: Caveats and
guidelines for researchers. International Journal of Research in Marketing, 31(3), 309-
316. doi: https://doi.org/10.1016/j.ijresmar.2014.03.002
149
Tudela, M., & Young, G. (2005). The determinants of household debt and balance sheets in
the United Kingdom. Bank of England Quarterly Bulletin, 45(3), 373-373.
Turinetti, E., & Zhuang, H. (2011). Exploring determinants of U.S. household debt. Journal
of Applied Business Research, 27(6), 85-91.
UNCTAD. (1993-2015). World Investment Report. Geneva: United Nations Publications.
UNCTAD. (2007). The Universe of the Largest Transnational Corporations. New York:
United Nations Publications.
USBEA. (2017). US Bureau of Economic Analysis - National Economic Accounts.
Retrieved September 2, 2017 http://www.bea.gov/National/Index.htm
USCB. (2015). US Census Bureau. Retrieved October 17, 2015
http://www.census.gov/hhes/www/income/data/historical/household/
USCB. (2017). US Census Bureau. Retrieved September 2, 2017
http://www.census.gov/hhes/www/income/data/historical/household/
Vakratsas, D., & Ambler, T. (1999). How Advertising Works: What Do We Really Know?
Journal of Marketing, 63(1), 26-43.
Veblen, T. (1899). The Theory of the Leisure Class: An Economic Study in the Evolution of
Institutions. New York: Macmillan.
Visser, J. (2016). ICTWSS Data base. from Amsterdam Institute for Advanced Labour
Studies (AIAS), University of Amsterdam
Vitali, S., Glattfelder, J. B., & Battiston, S. (2011). The Network of Global Corporate
Control. PloS one, 6(10), e25995. doi: http://dx.doi.org/10.1371/journal.pone.0025995
WID. (2017). The World Wealth and Income Database. Retrieved September 3, 2017, from
Paris School of Economics http://www.wid.world/
Wilkinson, R., & Pickett, K. (2011). The Spirit Level: Why Greater Equality Makes Societies
Stronger. London: Bloomsbury Press.
Zehavi, A., & Zahavi, A. (1999). The Handicap Principle : A Missing Piece of Darwin's
Puzzle. New York: Oxford University Press.
Zellner, A., & Theil, H. (1962). Three-stage least squares: simultaneous estimation of
simultaneous equations. Econometrica, 30, 54-78.

APPENDIX
1
Summary in Slovenian language / Daljši povzetek disertacije v slovenskem
jeziku
Neenakost v ZDA stalno narašča od sredine sedemdesetih let 20. stoletja. To je bila
neposredna posledica naraščajoče korporacijske moči podjetij in socialnega
prestrukturiranja trga dela. Slednje je posledica povečane pogajalske moči korporacijskih
družb, ki so povzročile spremembe v porazdelitvi prihodkov. Na drugi strani se je zmanjšala
pogajalska moč delavcev, v Združenih državah pa je sindikalna prisotnost pod povprečjem
OECD. Naraščajoča korporacijska moč dodatno vlaga ogromne vire v oglaševanje in
spodbuja potrošnjo. Ta proces ni le odgovor na potrebe potrošnikov, temveč ustvarjanje
potrošniških želja, ki niso organske. To neizogibno rezultira v presežnih zasebnih dobrinah,
ki niso resnično potrebne in v pomanjkanju javnih dobrin, kot so izobraževanje,
infrastruktura ali zdravje. Glede na zmanjševanje spodnjih 90 odstotkov deleža porazdelitve
dohodka, taka vsiljena potrošnja, to je družbena norma, 'dohajati Novakove' (angl. ‘keeping
up with the Joneses’), rezultira v zadolženosti gospodinjstev in na povpraševanju,
temelječem na dolgu. S 70-odstotno zgodovinsko visokim deležem porabe v ameriškem
BDP, sistemska dinamika ogroža trajnost in blaginjo gospodarstva.
Ali globalne korporacije v interesu kapitala dejansko povzročajo globalno osiromašenje
ljudi? Glede na Pikettyja (2014), je bila stopnja dobička dalj časa višja od stopnje
gospodarske rasti. To pomeni, da je naraščajoča neenakost neposreden rezultat tega procesa,
zaradi česar lastniki kapitala še naprej povečujejo svoje bogastvo, vpliv in pogajalsko moč
pri razdelitvi dohodka. To ima za posledico naraščajočo spiralo, ki še povečuje njihovo
prevlado. Vse večja prevlada kapitala povzroča tudi več drugih neželenih posledic poleg
naraščajoče neenakosti. Prvič, kapital spodbuja potrošniško vedenje, da zagotovi večje
povpraševanje. Povečana osebna poraba prepleta porazdelitev dohodka med potrošnjo in
prihranki (in naložbami v izobraževanje, itd.), in povzroči naraščajočo zadolženost. Slednje
je ponovno podprto s strani kapitala preko interesov sektorja finančnih storitev. Sama vlada
bi lahko ta proces obrnila, vendar je sama po sebi žrtev procesa povečevanja zadolženosti in
povečanja korporativne moči, zato ima omejeno sposobnost vplivati na smer kapitalističnega
razvoja. Naraščajoča korporativna moč zato v razmerah omejene gospodinjske oziroma
potrošniške in državne moči, vodi h kumulativni in krožni vzročnosti (angl. cumulative and
circular causation - CCC), kjer se neenakost in omejena državna moč zgolj povečujejo.
Ali naraščajoča korporativna moč, vodi do potrošnje, temelječi na bahavi potrošnji in
potrošništvu, naraščanja javnega in gospodinjskega dolga ter dohodkovne neenakosti?
Obstaja več empiričnih dejstev o povečani dohodkovni neenakosti v zadnjih 40 letih (OECD,
2011, 2015), naraščanju javnega in gospodinjskega dolga (Cecchetti et al., 2011; OECD,
2015), povečani potrošnji (OECD, 2015) in povečani korporativni moči (UNCTAD, 2007),
vendar le nekaj študij preučuje vzročne zveze med temi spremenljivkami. Empirične študije

2
so pokazale, da obstaja dolgo obdobje stagnantnih plač (Mishel & Shierholz, 2013), kar
samo krepi dohodkovno neenakost. Neenakost se nadalje povečuje zaradi zmanjšanja
davkov (Fieldhouse, 2013) in obstaja močna povezava med zmanjšanjem najvišjih davčnih
stopenj in povečanjem najvišjega 1 odstotka dohodkovnega deleža od leta 1975 v 18 državah
OECD, vendar povečanje najvišjega odstotka dohodkovnega deleža ni bilo prevedeno v
višjo gospodarsko rast (Piketty et al., 2011). Dodaten oster prepad je imetje bogastva, v
katerem ima spodnja polovica svetovnega prebivalstva manj kot 1 odstotek celotnega
bogastva. Po drugi strani pa ima najbogatejših 10 odstotkov v lasti 86 odstotkov svetovnega
bogastva, in zgolj 1 odstotek ima v lasti 46 odstotkov globalnih sredstev (CSRI, 2013).
Piketty and Saez (2003) sta tudi pokazala, da se je delež najvišjega 1 odstotka v skupnem
dohodku pred obdavčitvijo, od sedemdesetih let več kot podvojil. Nekatere posledice
povečane neenakosti so tudi počasna gospodarska rast (Ostry et al., 2014), politična
nestabilnost (Ortiz & Cummins, 2011) in višja brezposelnost (James K. Galbraith, 2012).
Kumulativna in krožna vzročnost (CCC model) opisuje družbeno-gospodarsko dinamiko z
vrsto medsebojno povezanih vzročnosti, ki tvorijo neravnotežno spiralo. Model proučuje
razmerja med štirimi sistemskimi komponentami ali gradbenimi elementi, v naslednjem
zaporedju: korporativna moč, potrošnja, dolg gospodinjstev in neenakost. Korporativne
družbe, ki se opirajo na svojo korporativno moč, so spodbudile naraščajoče potrošništvo, kar
je povečalo zasebno potrošnjo in dolg. Po drugi strani je povečevanje dolga okrepilo proces
naraščajoče dohodkovne neenakosti zaradi pomanjkanja sredstev za naložbe v izobraževanje
ali ustvarjanje prihrankov. Naraščajoča neenakost je nadalje povečala pogajalsko moč
kapitala in zaprla CCC model.
Namen te disertacije je empirično ovrednotiti veljavnost predlaganega CCC mehanizma na
povprečju držav OECD in podatkov za ZDA. Razlog za prvo je, da je OECD največja
ekonomska (članska) organizacija najbolj naprednih gospodarstev in prav tako najbolj
vplivna. Lahko se uporablja tudi kot merilo za ZDA model, da se oceni dinamika ameriških
spremenljivk in celotnega ZDA modela, v primerjavi s povprečjem držav OECD. Razlog za
analizo podatkov ZDA je, da so ZDA največje državno gospodarstvo in najbolj vplivno. Z
osredotočanjem na najpomembnejšo svetovno gospodarstvo lahko na eni strani podaljšamo
časovne serije in na drugi strani poglobimo znanje o trendih naraščajoče moči podjetij in
potrošništva. Zaradi velikosti in vpliva ameriškega gospodarstva so makroekonomske
posledice primarnega pomena za ves svet. Poleg tega lahko iz analize za ZDA pridobimo
tudi z razumevanjem morebitnih problemov ali koristi tudi za druge razvite države.
Cilj raziskave je izdelati nov empirični model, ki preučuje odnose med korporativno močjo,
potrošnjo, dolgom in neenakostjo. Disertacija je zasnovana kot zbirka štirih člankov; tesno
in logično povezanih raziskovalnih dokumentov. Prinaša več izvirnih prispevkov na
področju znanosti; gradi celovit model, ki pojasnjuje vpliv korporativne moči na
gospodarsko učinkovitost, empirično proučuje veljavnost CCC modela na podatkih OECD

3
in ZDA ter ponuja nekatere implikacije politik. Glavne sistemske spremenljivke se časovno
povečujejo, kar ni gospodarsko in družbeno vzdržno. Nekatere posledice bi lahko bile:
počasnejša gospodarska rast, socialni in zdravstveni problemi, manj možnosti izobraževanja,
manjši človeški kapital in manjša socialna mobilnost, politična nestabilnost in višja
brezposelnost. Poleg tega kaže, kako sistemska dinamika ogroža dolgoročno trajnostno rast
in slabša socialno kohezijo.
Prvi članek določa teoretični okvir z analizo dohodkovne neenakosti, potrošnje, dolga in
korporacij ter njihove korporativne moči. Predstavlja politično-ekonomski model, ki ga je
naredil Porenta (2014). Pri analizi zapletene dinamike gospodarstev, politično-ekonomski
model uporablja celovit pristop z opisno analizo in vzročno zvezo, ki z ekonomsko analizo
združuje darvinistična evolucijska načela, antropologijo, psihologijo in sociologijo. Pokaže,
da korporacije želijo izkoristiti enega najmočnejših človeških instinktov, to je reprodukcije,
in izkazovanja družbenega statusa. S predstavitvijo politično-ekonomskega modela, ki
temelji na logičnem opazovanju, vzrokih in posledicah, pa tudi empiričnih podatkih, lahko
opazimo, da obstaja jasen vidik kumulativne in krožne vzročnosti glavnih ugotovljenih
spremenljivk. Rastoča korporativna moč vodi v potrošnjo, temelječi na bahavi potrošnji in
potrošništvu, naraščajoči dolg, dohodkovno neenakost in netrajnostno rast.
Drugi članek postavlja empirični teoretični okvir. Gradi nov empirični model za empirično
preizkušanje politično-ekonomskega modela in povezav med CCC spremenljivkami.
Analizi obstoječih delnih enačb glavnih spremenljivk sistema, sledi gradnja novih modelnih
delnih enačb, skupaj z novo spremenljivko korporativne moči. Temu sledi sinteza modelnih
delnih enačb v nov ekonomski model, ki ga lahko ekonometrično testiramo. Ker obstoji
kumulativna in krožna vzročnost glavnih sistemskih spremenljivk, to pomeni, da so odvisne
spremenljivke v naslednji enačbi v nizu, tudi neodvisne spremenljivke. Ta ekonomski CCC
model ima štiri glavne sistemske spremenljivke in zato tvori sistem simultanih enačb, kar
ustvari nerekurzivni model.
Tretji članek empirično ocenjuje veljavnost predlaganega CCC mehanizma (CCC model),
na povprečju OECD držav. Pokaže, da se je v OECD gospodarstvih povečala korporativna
moč in da je finančna liberalizacija spodbudila ta proces. Povečana korporativna moč
pozitivno vpliva na osebno porabo, kar je v skladu z naraščajočimi prikazi bahave potrošnje,
temelječi na korporativni moči (trženje in ustvarjanje želja). Poleg tega dokazuje, da se je
zadolževanje povečevalo, kar je znova podprlo naraščajočo moč korporacij in kapitala.
Povečuje se neenakost, kar dodatno zmanjšuje pogajalsko moč delavcev, to je potrošnikov.
Spirala se nadaljuje v korist kapitala. Na splošno je v OECD, v obdobju raziskave, krog CCC
potrjen.
Četrti članek empirično ocenjuje veljavnost predlaganega CCC mehanizma (CCC model),
na ZDA podatkih. Opazimo lahko, da vse glavne sistemske spremenljivke naraščajo v

4
analiziranem obdobju. Naraščajoča korporativna moč vodi v povečano potrošnjo, kar
povzroča naraščajoči dolg gospodinjstev, slednje pa vodi v povečevanje neenakosti. Prav
tako lahko opazimo, da je dinamika v ZDA vodila v močno koncentracijo virov dohodka v
rokah najvišjih odstotkov porazdelitve dohodka in k spremembam v distribuciji dohodka, ki
zgolj povečujejo naraščajočo korporativno moč. Korporacije v ZDA vlagajo ogromne vire v
oglaševanje, zato spodbujajo potrošniško družbo in na dolgu temelječo potrošnjo. Če
združimo ta dejstva z zgodovinsko visokim deležem potrošnje v BDP v ZDA, lahko
sklepamo, da takšna sistemska dinamika nedvomno ogroža dolgoročno trajnostno rast in
slabša socialno kohezijo.
Poglavje razprava, obravnava glavne ugotovitve dveh CCC modelov, odgovarja na
raziskovalna vprašanja, ponudi nekatere implikacije politik ter poudarja prispevke k
literaturi oziroma k znanosti. OECD model se lahko uporabi tudi kot merilo za ZDA model,
tako, da se oceni dinamiko ameriških spremenljivk in celotnega ZDA modela. V obeh
modelih smo uporabili nerekurzivno strukturno modeliranje in tristopenjsko regresijo
najmanjših kvadratov sistemov simultanih strukturnih enačb. Rezultati v obeh modelih
podpirajo vidik kumulativne in krožne vzročnosti glavnih modelskih spremenljivk. Pri
primerjavi obeh modelov lahko opazimo, da je dinamika gibanja glavnih spremenljivk v
ZDA bolj intenzivna kot v OECD. Vse glavne ZDA spremenljivke so nad povprečjem držav
OECD. Rast korporativne moči v ZDA je presegla rast korporativne moči v OECD modelu.
Delež potrošnje v BDP je v ZDA precej nad povprečjem držav OECD. Enako je dolg
gospodinjstev v ZDA in dohodkovna neenakost v ZDA. Te empirične ugotovitve so v skladu
s procesom kumulativne in krožne vzročnosti, to je CCC modela. V ZDA CCC modelu je
povečanje korporativne moči večje od tistega v OECD modelu, s čimer je povzročena večja
rast vseh glavnih sistemskih spremenljivk. Takšna sistemska dinamika očitno dodatno
ogroža dolgoročno trajnostno rast in slabša socialno kohezijo v ZDA.
Pojem korporativne moči se uporablja v širšem kontekstu, ne zgolj za naraščajočo tržno
koncentracijo korporacij, temveč tudi glede njihovega vpliva na delavce, potrošnike in vlade.
V naslednjih odstavkih bodo na kratko predstavljeni vsi trije vidiki tega vpliva. Pomemben
element vpliva korporativne moči, preko njihovih oddelkov za oglaševanje, je tako
imenovano bahava ali vidna potrošnja (angl. conspicuous consumption). Bahava potrošnja
je danes večinoma socialno-ekonomsko vedenje, ki je pogosto tudi v revnejših socialnih
slojih, kjer oseba išče boljši družbeni status ali možnost, da vsaj ohranja obstoječi status in
poskuša odpravljati stigmo biti reven ali slabšanje svojega socialnega statusa (Charles et al.,
2007). Poleg tega evolucijska psihologija pojasnjuje bahavo potrošnjo kot teorijo sporočanja
ali hendikep načelo, ki dokazuje dobro socialno-ekonomsko kakovost osebe in njegov ali
njen namen privabiti gospodarske koalicijske partnerje ali spolne partnerje, s ciljem
izboljšati svoj lasten status in pridobiti možnost reprodukcije (Iredale & van Vugt, 2012;

5
Miller, 2009; Zehavi & Zahavi, 1999), s čimer ponazarja, kako je oglaševanje izkoristilo
naše dedne instinkte prikazovanja družbenega statusa za reproduktivno prednost.
Benhabib in Bisin (2002, 2011) v svojem empiričnem delu pojasnjujeta, da oglaševanje
neposredno vpliva na potrošniške želje. Oglaševanje vpliva na posameznikove preference,
ki so deloma socialni fenomen. Podjetja izkoriščajo svojo moč z oglaševanjem, da bi
ustvarili nove želje potrošnikov, pogosto za bahavo potrošnjo. Te želje so neresnične in
nepotrebne. Koncepti, kot so manipulacija s preferencami, komodifikacija kulture in
potrošništvo, so postali osrednje jedro postmodernistične kritike organizacije družbe.
Posledica ustvarjanja takšnih novih želja je povečanje porabe potrošnikov, povečuje pa se
tudi njihova ponudba dela. Vstopajo v delo in potrošniški cikel, kjer zmanjšujejo čas za
preživljanje prostega časa, kar posledično zmanjšuje blaginjo potrošnikov.
V modeliranju funkcije potrošnje ima prevladujoča hipoteza stalnega dohodka tudi nekaj
pomanjkljivosti, kot so npr. likvidnostne omejitve. Potrošniki imajo lahko po eni strani
omejitve zadolževanja ali po drugi strani dezinvestacijske omejitve. Te pomanjkljivosti so
privedle do nekaterih izboljšanih in razširjenih modelov. Nekatere nove raziskave temeljijo
na sodobnih vedenjskih modelih in Duesenberryjevi hipotezi relativnega dohodka
(Duesenberry, 1949). D’Orlando and Sanfilippo (2010) sta raziskala vlogo vedenjskih
principov v Keynesovi teoriji porabe in predstavila Keynesiansko agregatno potrošno
funkcijo, ki temelji na načelih sodobnih vedenjskih modelov. To omogoča boljšo ilustracijo
realnosti in je bolj skladno s Keynesovo teorijo porabe. Alvarez-Cuadrado in Van Long
(2011) sta predlagala ekonomijo prekrivajočih se generacij s heterogenim premoženjskimi
nivoji, kjer gospodinjstva povečujejo svojo korist iz relativne porabe, dediščine in prostega
časa. Zato je potrošnja posameznika spodbujena s primerjavo njegovega življenjskega
dohodka in njegove referenčne skupine. Na to se lahko gleda kot na različico stalnega
dohodka Duesenberryjeve hipoteze relativnega dohodka.
Palley (2010) je poskušal sintetizirati prednosti različnih modelov v tako imenovani
sintetični Keynes-Duesenberry-Friedman model, poimenovan tudi kot teorija relativnega
stalnega dohodka. Ta model ustvarja vzorce porabe, ki so skladni z obema empiričnima
rezultatoma iz podatkov v prerezu, ki kažejo, da imajo gospodinjstva z visokim dohodkom
višjo nagnjenost k varčevanju in dolgoročnim časovnim nizom podatkov za agregatno
potrošnjo. Novost je, da so odločitve o porabi gospodinjstev odvisne od relativnega stalnega
dohodka. Predlaga, da so odločitve o porabi motivirane z 'relativnimi' pomisleki glede
porabe ali 'dohajanjem Novakovih'. Poleg tega kaže, da so vzorci porabe podvrženi navadi
in se počasi zmanjšujejo zaradi zmanjšanja dohodka. Redistribucija dohodka
gospodinjstvom z nižjimi dohodki bo verjetno imela neto pozitiven učinek na agregatno
povpraševanje zaradi vedenja 'dohajanje Novakovih'. Model kaže, da lahko politika, ki
omejuje vedenje posnemanja, izboljša socialno blaginjo. Bogati poskušajo povečati
relativno porabo, gospodinjstva z nižjimi dohodki pa poskušajo slediti Novakovim.
6
Vpliv korporativne moči na delavce je naslednji v nizu. Korporativna moč, dopolnjena z
nadnacionalno proizvodnjo in liberalizacijo, pridobi poglobljen pogajalski položaj do
delovne sile. Kot sta opozorila Cowling in Tomlinson (2005), je bilo to doseženo z večjim
vplivom podjetij na vlade, da bi spremenili delovno zakonodajo. Ta strategija vključuje
izravnavo povečane moči sindikatov, doseženih v času zlate dobe. V sedemdesetih letih so
korporacije povečale razdrobljenost proizvodnje z večjim številom podjetji, franšizami in
podizvajalci. Za zniževanje stroškov je bila proizvodnja oddaljena od organiziranih
delavcev, torej sindikatov. Najprej znotraj držav, nato regionalno in končno globalno. V
ZDA se je proizvodnja preselila s severovzhoda proti jugu, nato z uveljavitvijo
severnoameriškega območja proste trgovine (NAFTA), še bolj južno do Mehike, nato v
Latinsko Ameriko in nato po svetu, kot je Azija.
Korporacije uporabljajo tako imenovano strategijo 'deli in vladaj', da zmanjšajo stroške dela
(Cowling & Sugden, 1994), grozijo s preselitvijo tovarne, kjer so sindikati preveč agresivni.
Ker že imajo večje število podjetji, zapiranje 'problematičnih' obratov deluje kot učinkovita
grožnja delavcem in njihovim sindikatom. Nadaljnja empirična študija s strani Scherer et al.
(1975) je pokazala, da so bila podjetja, ki so imela le en obrat, kaznovana z zmanjšano
pogajalsko močjo do sindikatov, medtem ko so podjetja z večjim številom podjetji uživala
naraščajočo pogajalsko močjo do sindikatov. Addison et al. (2003) je dokazal, da strategija
'deli in vladaj' ni prazna grožnja. Kjer je bil obstoj sindikata močan in aktiven, so bili obrati
bolj verjetno zaprti. Po drugi strani sindikalna dejavnost ni imela vpliva na zapiranje obratov
v korporacijah, ki delujejo z enim obratom. Podobno sta Peoples in Sugden (2000) opozorila,
da je strategija 'deli in vladaj' pomemben dejavnik odločitve korporacij za proizvodnjo v več
kot eni državi.
Sledi naslednji vpliv, to je vpliv korporativne moči na vlade. Eden od elementov tega vpliva
je omejevanje regulativne zakonodaje s strani korporativne moči. Kot prikazuje Mercer
(1995), so bile politike konkurence dejansko oblikovane s strani močnih poslovnih interesov.
Družbe imajo interes pri oblikovanju in izvajanju regulativne politike in, kot navajata
Cowling in Tomlinson (2005), takšno 'regulativno ujetje' kaže na to, da bo delovanje
regulatorjev v glavnem odražalo koristi reguliranih. Naslednji primer vpliva podjetij na
vlado so vse večje transnacionalne korporacije, ki izvajajo vpliv svoje korporativne moči
nad državami v kontekstu globalizacije (na primer transnacionalne operacije v več obratih,
franšize in podizvajalske pogodbe). Ustvarjajo strategijo 'deli in vladaj' nad vladam in
grozijo, da bodo vlagali v druge države kot pogajalski vzvod (Cowling & Sugden, 1994;
Dicken, 2015). Zahtevajo infrastrukturno podporo, naložbene subvencije, ugodne davčne
režime in delovno zakonodajo itd., da bi povečali svoj dobiček in vpliv podjetja.. S takšno
strategijo je transnacionalnim korporacijam uspelo ustvariti spodbudo konkurence med
državami za transnacionalne naložbe. Nekatere od posledic transnacionalne narave
korporacij so: (1) stagnantne plače, (2) šibkejši sindikati, (3) povečanje korporativne moči,
7
(4) mednarodne transferne cene in (5) zmanjšane globalne obveznosti za davek od dohodkov
pravnih oseb.
Slednje, in sicer zmanjšane obveznosti za davek od dohodkov pravnih oseb, sta preučevala
tudi Farnsworth in Fooks (2015). Trdita, da je globalizacija povečala davčno konkurenco
med državami in omogočila široko razširjeno izogibanje davkom od dohodkov pravnih oseb.
Nekatere največje korporacije plačujejo malo ali nič davka in v nekaterih primerih z aktivno
podporo vlad. To je posledica uspešnega lobiranja transnacionalnih korporacij v preteklih
30 letih. Lobirali so zaradi zmanjšanja davkov na podjetja in povečanja davčnih ugodnosti.
Poleg tega so nadnacionalne družbe redno vključene v razne dogovore oziroma ureditve za
zmanjšanje davkov, zaradi katerih so dejanske davčne stopnje precej nižje od nominalnih.
Na eni strani je uspešno lobiranje in korporativni vpliv na vlade, po drugi strani pa obstaja
profesionalna infrastruktura davčnega načrtovanja in izogibanja, ki ustreza zahtevam
podjetij po znižanih davčnih obveznostih. Po mnenju Swank (2002) se stopnje davka od
dohodkov pravnih oseb od leta 1960 naprej postopoma zmanjšujejo v večini držav OECD.
V ZDA je trenutna nominalna stopnja davka od dohodkov pravnih oseb za dobiček 35
odstotkov, vendar so dejanske davčne stopnje, ki jih plačujejo gospodarske družbe, precej
nižje in se gibljejo od 37,3 odstotka leta 1970, do 14,3 odstotka v letu 2009 in 19,7 odstotka
v letu 2015. Efektivna stopnja davka od dohodkov pravnih oseb je dejanska davčna stopnja,
plačana po odbitku za vse subvencije, kredite, popuste, davčne olajšave in druge ugodnosti
od lokalne ali zvezne vlade.
Vloga transnacionalnih korporacij (TNC) v svetovnem gospodarstvu je verjetno zelo
podcenjena, ker so TNC-ji medsebojno povezane na zelo zapleten način. Prav tako obstoji
pomanjkanje preglednosti, neformalni sporazumi niso razkriti, v resnici pa so TNC-ji še bolj
povezani zaradi različnih pogodbenih združenj ali poslovnih sporazumov, ki imajo v lasti
deleže drugih. Vitali et al. (2011) so v študiji kompleksnih sistemov pokazali, da obstaja
jedro 1.318 podjetij s prepletenim lastništvom. V rokah imajo 20 odstotkov svetovnih
poslovnih prihodkov in dodatno v lasti deleže večine največjih svetovnih velikih podjetij,
kar pomeni še dodatnih 60 odstotkov svetovnih prihodkov. Prav tako so našli super jedro
147 še tesneje prepletenih podjetij, kjer je njihovo celotno lastništvo v rokah drugih članov
te super entitete, kar nadzira 40 odstotkov celotnega bogastva v omrežju. Dejansko lahko
manj kot 1 odstotek vseh korporacij nadzoruje 40 odstotkov celotnega omrežja. Vsi ti
dejavniki omogočajo TNC-jem močan vpliv. Kljub vsemu temu je razvoj velikih korporacij
tudi pozitiven zaradi velikih vlaganj in izboljšav tehnologij in drugih inovacij.
Dodatni dejavniki, ki jih je treba upoštevati, so tudi lastnosti ali protislovja kapitalizma, in
sicer monopoli ali oligopoli. Kapitalistični sistem ima težnjo koncentracije in centralizacije
kapitala, kar je še posebej značilno za 20. stoletje, s prevlado TNC-jev v svetovnem
gospodarstvu. Ena od posledic je izključitev učinkovite cenovne konkurence. Proizvodnja
se medtem nadaljuje v skladu s povečanjem produktivnosti in zmanjševanjem proizvodnih
8
stroškov, to je stagnacija realnih plač. Zato se pojavlja velik in naraščajoči presežek naložb,
ki pa se srečuje z zmanjšanimi naložbenimi trgi. Ti so delno zmanjšani zaradi zrelosti
gospodarstev (Baran & Sweezy, 1966; Foster & Magdoff, 2009) in deloma zaradi povečanja
dohodkovne neenakosti, kar pa negativno vpliva na potrošnjo. Za naložbe svojih presežkov
je korporativna moč izumila nove finančne instrumente, liberalizacijo, globalizacijo in druge
vzvode vplivanja. Indoktrinacija potrošnika z zelo sofisticiranimi trženjskimi tehnikami je
ena glavnih poslovnih dejavnosti korporacij. Oglaševanje spodbuja potrošnike k posnemanju
in k bahavi potrošnji, s čimer povečuje prekomerno potrošništvo s socialno normo 'dohajanje
Novakovih'. Dodaten vzvod je tudi vpliv na javno mnenje, ki ga izvajajo 'mnenjski vodje' in
razni 'nevtralni' strokovnjaki, ki zagovarjajo korporacijske interese na zelo sofisticiran
način. Prav tako korporacije z veseljem kreditirajo spodbujeno potrošništvo, ki pa ni
organsko.
Povečana potrošnja in stagnirajoči dohodek vodita v zadolževanje. Zaradi zadolženosti, več
ljudi potrebuje socialno pomoč. Naraščajoči socialni transferji vodijo k nadaljnjem
povečevanju javnega dolga, ki že tako narašča zaradi posledic finančne liberalizacije in
reševanja zasebnega kapitala (Azzimonti et al., 2014; Lora & Olivera, 2007). Kot sta
opozorila Oh in Reis (2012), so se izdatki države hitro povečevali v državah OECD od leta
2007 do leta 2009, pri čemer je medianski delež transferjev predstavljal 64 odstotkov
povečanja porabe. V Združenih državah transferji predstavljajo 75 odstotkov povečanja
fiskalnih odhodkov ali 3,4 odstotka BDP, medtem ko socialni transferji predstavljajo 2,72
odstotka BDP. V ZDA se je zgodil velik kompozicijski odmik od vladnih nakupov k
transferjem, ki so se v zadnjih 50 letih več kot trikrat povečali kot delež BDP, do leta 2007
pa šteli že 39 odstotka celotnega proračuna.
Nadaljnja analiza Hungerford (2013) in Harris in Sammartino (2011) je pokazala, da od treh
možnih dejavnikov, ki prispevajo k spremembam dohodkovne neenakosti v ZDA, in sicer,
dohodkov od dela, dohodka od kapitala in davkov, so bili kapitalski dobički in dividende,
tisti ki največ prispevajo k spremembam v prihodkih, ki so privedli do povečanja
dohodkovne neenakosti. Ob spremljanju sprememb se pojavljata dva razvoja; (1) vsi viri
velikih prihodkov so postali močno koncentrirani v korist najvišjega odstotka porazdelitve
dohodka gospodinjstev in (2) spremembe v sestavi dohodka. Slednje prispeva k zmanjšanju
plač in drugih dohodkov od dela v deležu celotnega dohodka ter povečanju kapitalskih
dobičkov in drugih dohodkov od kapitala v deležu celotnega dohodka. To krepi dohodkovno
neenakost, saj so kapitalski dohodki bolj osredotočeni med najvišjim odstotkom porazdelitve
dohodka gospodinjstev, kot je prihodek od dela. Tovrstno 'iskanje rent' ljudi z najvišjimi
zaslužki, kot so korporativna vodstva, managerji in lastniki, lahko pripisujemo znižanju
najvišjih mejnih stopenj davka od dohodka od leta 1960 dalje, s čimer so dosegli višji delež
od skupnega dohodka, na račun plač delavcev (Fieldhouse, 2013).
9
Prerazporeditev dohodka bi lahko zmanjšala dohodkovno neenakost. Kljub temu, kot sta
pokazala Harris in Sammartino (2011), je ameriški zvezni sistem za obdavčitev in transfer
zmanjšal Gini indeks le za 17,1 odstotka v letu 2007, v primerjavi s 23,4 odstotnim
zmanjšanjem v letu 1979. Podobno se je neenakost pred davki povečala za 23,2 odstotka
med letoma 1979 in 2007, medtem ko se je poobdavčitvena, post-transferna neenakost
povečala za 33,2 odstotka. Zvezna davčna in transferna vloga pri zmanjševanju neenakosti
je tako neuspešna. Ta cikel samo krepi tiste z najvišjimi zaslužki, kar je mogoče opaziti tudi
v koncentraciji bogastva oziroma premoženja.
Saez in Zucman (2016) sta pokazala, da se je delež premoženja zgornjega 0,1 odstotka
porazdelitve povečal s 7 odstotkov leta 1978, na 22 odstotkov v letu 2012. V ZDA je bila
visoka koncentracija v letu 1929, nato se je zmanjšala do leta 1978, zatem pa ponovno
povečala do leta 2012, na ravni podobni leta 1929. Ljudje, ki imajo danes največ bogastva,
so mlajši in zaslužijo večji delež dohodkov od dela kot v šestdesetih letih prejšnjega stoletja.
Po drugi strani so ljudje, ki imajo spodnjih 90 odstotkov deleža premoženja, najprej povečali
delež svojega premoženja do osemdesetih let, ki se je nato postopno zmanjšal. Razlog za
takšno povečanje neenakosti v bogastvu v preteklih letih je povečanje najvišjih dohodkov in
naraščajoča stopnja neenakosti pri varčevanju, pri čemer se prihranki povečujejo za ljudi z
najvišjimi zaslužki in zmanjšujejo za druge.
Ta disertacija potrjuje pomen uporabe holističnega pristopa pri analizi zapletene dinamike
gospodarstev. Analiza dohodkovne neenakosti, potrošnje, dolga in korporacij ter njihove
korporativne moči se prične s teoretičnim okvirom in predstavitvijo politično-ekonomskega
modela, z uporabo opisne analize in vzročnim sklepanjem, ter združevanjem darvinističnih
evolucijskih načel, antropologije, psihologije in sociologije z ekonomsko analizo. Analiza
pokaže, kako želijo korporacije izkoristiti enega najmočnejših človeških instinktov
reprodukcije in prikazovanja družbenega statusa. Lahko ugotovimo, da obstaja jasen vidik
kumulativne in krožne vzročnosti glavnih ugotovljenih spremenljivk. Rastoča korporativna
moč vodi v potrošnjo, ki jo povzročajo bahava potrošnja in potrošništvo, naraščajoči dolg in
dohodkovno neenakost. Glavni namen te disertacije je empirično in ekonometrično
preverjanje predstavljenega politično-ekonomskega modela. Cilj raziskave je izdelati nov
ekonomski (empirični) model, ki preučuje odnose med CCC spremenljivkami, to je
korporativno močjo, potrošnjo, dolgom in neenakostjo, z ekonometričnimi metodami.
Na splošno lahko v obeh CCC modelih, to je za ZDA in OECD, opazimo, da v analiziranem
obdobju naraščajo vse glavne sistemske spremenljivke. Naraščajoča korporativna moč vodi
k povečani potrošnji. Ta povzroča naraščanje dolga, ki naprej vodi k povečanju dohodkovne
neenakosti. Lahko ugotovimo, da korporativna moč povzroča povečano potrošnjo s
kombiniranimi in kompleksnimi pristopi oglaševalskih tehnik za zagotovitev naložb podjetij
in zadostno povpraševanje po svojih izdelkih in storitvah. Oglaševanje izkorišča nekaj
močnih človeških instinktov, s čimer spodbuja potrošništvo in tržno kulturo. Nadalje,

10
povečana konzumeristična potrošnja vpliva na povečanje dolga gospodinjstev in javnega
dolga z več transmisijskimi mehanizmi, ki delujejo istočasno in se medsebojno krepijo.
Rastoči dolg gospodinjstev in javni dolg še bolj povečujejo neenakost, ker vladi
onemogočajo naložbe v izobraževanje, zdravstveno varstvo in drugo infrastrukturo ter z
zmanjševanjem socialnih transferjev. Večji dolg gospodinjstev prav tako povzroča, da ljudje
ne morejo vlagati v svoje izobraževanje ali povečati svoje prihranke in posledično njihovo
bogastvo in finančno neodvisnost. Nazadnje, neenakost povzroča povečanje korporativne
moči. Ljudje, ki so osiromašeni in neenaki v primerjavi z lastniki proizvodnje, so prav tako
šibkejši v pogajalskem procesu. Ne morejo izboljšati svojega položaja, zato se korporativna
moč poveča. Z naraščajočo korporativno močjo se začne nov krog vzročne zveze.
Glavne sistemske spremenljivke se akumulirajo v času, kar povzroči počasnejšo
gospodarsko rast, politično nestabilnost in višjo brezposelnost. Prav tako povzroča socialne
in zdravstvene težave, manj možnosti izobraževanja, manjši človeški kapital in manjšo
družbeno mobilnost. Ekonomske posledice tega procesa kažejo, da tak razvoj ne more biti
gospodarsko in družbeno trajnosten. Če je torej vprašanje, ali naj država izravna
korporativno moč, je odgovor pritrdilen. Nekateri ukrepi bi lahko bili v obeh, tako
redistributivnih kot distribucijskih vidikih, kot so zakonodaja o minimalni plači, krepitev
sindikatov ali pogajalske strani delavcev, podpiranje malih podjetij, izboljšanje človeškega
kapitala in družbene mobilnosti. Sprememba obdavčenja podjetij in dohodka oseb, tudi
lahko zmanjša vrzel v dohodkovni neenakosti. Nekateri prihodnji izzivi bi lahko bili tudi pri
reševanju dileme; naj dovolimo, da korporacije (in finančna podjetja) ostanejo preveliki, da
bi padli (angl. too big to fail)?
Koliko povpraševanja, temelječem na dolgu, si lahko neko gospodarstvo še privošči, je že
naslednje vprašanje. Seveda je tak dolg večinoma neproduktiven in iracionalen.
Najpogosteje se ne izplača. Takšen dolg je potrošniški dolg in se zato ne poplača sam od
sebe. Ni naložba, ki bi lahko prinesla kakšen prihodnji denarni pritok in se poplačala s
prihodnjimi prihodki. Gre za dolg zaradi človeških instinktov in zato ni primer homo
economicus-a. Kot kažejo najnovejše raziskave s področja evolucijske psihologije in
vedenjske ekonomije, se ljudje še vedno razvijajo in napredujejo, in bilo bi smiselno s strani
oglaševalcev, da nadomestijo svojo paradigmo prodaje izdelkov za prikazovanje statusa, s
proizvodi ali storitvami, ki implicirajo nekatere globlje mentalne lastnosti , kot so prijaznost,
inteligenca in ustvarjalnost.
V povzetku, ta disertacija daje več izvirnih prispevkov k literaturi. Prvič, to je prva empirična
raziskava med CCC spremenljivkami, korporativno močjo in njenim vplivom na potrošnjo,
dolgom in neenakostjo. Drugič, razširja znanje o trendih naraščajoče korporativne moči in
potrošništva na makro ravni ter transmisijskih mehanizmov. Poleg tega kaže, kako sistemska
dinamika ogroža dolgoročno trajnostno rast in poslabša socialno kohezijo ter rezultate
dosežkov socialne države.