Embed Size (px)
Citation preview
HÖGSKOLAN I GÄVLE
Master Thesis (Advanced level), 15hp Business and Administration
The Impact of Complaint Management on Customers Retention
Banking Industry in Sweden and Lebanon
Faculty of Education and Economic Studies Department of Business and Economic Studies
Hummam Wasfi and Olena Kostenko
1/6/2014
Supervisor: Ehsanul Huda Chowdhury
Examinator: Maria Fregidou-Malama
Second Cycle
Title: The Impact of Complaint Management on Customer Retention Level: Final assignment for Master Degree in Business Administration Authors: Hummam Wasfi, Olena Kostenko
Supervisor: Ehsanul Huda ChowdhuryFiD Date: 2014 – June
Aim: The purpose of this study is to examine or inspect the aftermath of effective complaint
management structure in relevance to customer’s retention in banking industry.
Design/methodology/approach: The framework is structured on the bases of determining the
strength of the relationships between the following variables complaint management, customer’s
satisfaction and loyalty. Whereas, quantitative data were gathered via questionnaire, and further
analyzed using SPSS, particularly, employing the relationship measurement tools Correlation
and Linear regression analysis to calculate the extent to which each variable affects the other.
Findings: The aftermath of analysis led to fundamentally privileged outcome, whereas,
subsequent to computing the extent to which complaint management influences customer
retention, we were able to extract three formulas to determine the linear relationships between
the variables that stimulate this calculation process.
Suggestions for future research: To enhance the representation of sample, future studies should
target more cities with variant circumstances, and apply this type of analysis to other industries
Originality: This study contributes idiosyncratic evidence to companies on the systematic
influence of complaint management on customer’s retention, furthermore, repercussions of these
findings has led to analysis distinguishing the distinctive response of customers to complaint
management in Sweden and Lebanon.
Keywords: Complaint Management, Satisfaction, Loyalty, Retention, Banks, Sweden, Lebanon.
ABSTRACT

Table of Contents 1. Introduction ......................................................................................................................................... 1
2. Theoretical framework ....................................................................................................................... 4
2.1. Service recovery and Complaint handling ................................................................................ 4
2.1.1. Service recovery: its evolution and importance ............................................................... 4
2.1.2. Complaint handling versus Service recovery ................................................................... 5
2.2. Customer loyalty ......................................................................................................................... 8
2.3. Effective complaint handling and loyalty (H1) ....................................................................... 11
2.4. Effective complaint handling and customer satisfaction (H2) .............................................. 12
2.5. Customer satisfaction and its relation to loyalty (H3) ........................................................... 13
2.6. Characteristic of banking services ........................................................................................... 15
2.7. Contextual background: the banking industry of Lebanon .................................................. 16
2.8. Contextual background: the banking industry of Sweden .................................................... 18
2.9. Synthesis and research model .................................................................................................. 19
3. Methodology: ..................................................................................................................................... 21
3.1. Research design and method: .................................................................................................. 21
3.2. Approach ................................................................................................................................... 25
3.3. Instrument and measurement .................................................................................................. 25
3.4. Data collection ........................................................................................................................... 27
3.5. Data analysis .............................................................................................................................. 28
3.5.1. Correlation analysis .......................................................................................................... 28
3.5.2. Regression analysis ........................................................................................................... 29
3.6. Reliability and Validity ............................................................................................................. 29
3.6.1. Reliability ........................................................................................................................... 29
3.6.2. Validity ............................................................................................................................... 31
4. Empirical Findings ............................................................................................................................ 33
4.1. Sample Description ................................................................................................................... 33
4.2. Correlation Analysis ................................................................................................................. 34
4.3. Regression Analysis .................................................................................................................. 36
4.4. Comparison of Customer Behavior ......................................................................................... 37
4.4.1. Correlation Analysis ......................................................................................................... 37
4.4.2. Regression Analysis by Country ...................................................................................... 39
5. Analysis and Discussion .................................................................................................................... 41
5.1. Examination of Sample Selection and Sample Distribution ................................................. 41
5.2. Examination of Correlation between Variables and Verification of Hypotheses ............... 43
5.2.1. Discussion on H1 ............................................................................................................... 43
5.2.2. Discussion on H2 ............................................................................................................... 45
5.2.3. Discussion on H3 ............................................................................................................... 47
5.3. Comparative analysis: .............................................................................................................. 48
5.3.1. Comparison of the relationship between effective complaint handling and loyalty in
Lebanon and Sweden: ....................................................................................................................... 49
5.3.2. Comparison of the relationship between effective complaint and customer satisfaction
in Lebanon and Sweden: .................................................................................................................. 50
5.3.3. Comparison of the relationship between customer satisfaction and loyalty in Lebanon
and Sweden: ....................................................................................................................................... 52
6. Conclusion ......................................................................................................................................... 54
6.1. Study limitations and Suggestions for Future Studies ........................................................... 54
6.2. Scientific Contribution ............................................................................................................. 55
6.3. Managerial Implications........................................................................................................... 55
6.4. Summary and Reflection .......................................................................................................... 56
References: .................................................................................................................................................. 58
Appendix ..................................................................................................................................................... 67
FIGURES:
Figure 1: Conceptual framework .............................................................................................. 20
Figure 2: Classification of Marketing Research Data ............................................................. 23
TABLES:
Table 1: Differences between Exploratory and Conclusive Research ................................... 22
Table 2: Qualitative versus Quantitative Research ................................................................. 24
Table 3: Gender Distribution of Sample ................................................................................... 33
Table 4: Age Distribution of Sample ......................................................................................... 33
Table 5: Number of years of relationship with the Bank ........................................................ 34
Table 6: SPSS Correlation Table............................................................................................... 35
Table 7: SPSS Correlation (Sweden's data set) ........................................................................ 38
Table 8: SPSS Correlation (Lebanon's data set) ...................................................................... 39
Table 9: Results of regression analyses with data split by country ........................................ 40
To Dr. Bassem Mamaari & Dr. Maria Fregidou-Malama,
for their guidance and provision,
& To our beloved parents
1
1. Introduction
This chapter embodies the scheme of this study, whereas the research motif is presented, in
addition to an outline of the research plan and the research objective.
The contemporary advancement of commerce and emerging of markets has led to radical
economical fluctuations and inflamed fierce competition (Narteh, 2013a). As a result, the
consumer today has a multitude of alternatives to exceed his expectations when making a
purchasing decision, whereas, rivalry has reached its climax (Leal & Pereira, 2003).
Consequently, given the assumption that loyal customers are a vital ingredient of a sustainable
business operation, therefore, retaining these customers is no doubt an interactive catalyst that
will systematically influence the long-term success of any enterprise in today’s service-driven
economy. In this regard, customer retention strategy signifies the vaccine that must be utilized by
enterprises to diminish the risk of substitutes (Komunda & Osarenkhoe, 2012).
Given these dynamics, and in order to attain and sustain the state of customer satisfaction, this
research underlines the nexus between complaint management strategy in relation to customer
satisfaction and loyalty. Meanwhile, the objective in this study is to provide empirical evidence
that effective complaint management strategy has a positive impact on customer’s satisfaction
and loyalty, research shows that the correlation between complaint management and customer
loyalty are important for two reasons. Primarily, customers who voice their complaints embody
the most loyal of customers and consequently it should be the firm’s top priority to enhance their
service in order to retain these loyal customers (Eccles & Durand, 1998). Also, satisfied
customers will enhance the company’s market share by spreading positive word-of-mouth and
performing as a costless marketing power, whereas, their counterpart will have the opposite
impact (Raman, 1999; Hocutt, Bowers & Donavan, 2006). This argument is further reinforced by
studies that show that dissatisfied customers tell about ten to twenty people about their bad
experience (Edvardsson, Tronvoll & Höykinpuro, 2011), conversely, satisfied customers will
trust the firm to a large extent and are more likely to repeat their purchase and talk positively
about their successful purchase to their acquaintances (Fecikova, 2004) .
2
In the medley of these beliefs, this study highlights the dynamic role of effective communication
between suppliers and their customers, particularly, in complaint management structure.
Inevitably, a well-founded communication structure constitutes an elementary component of the
complaint-handling process; as a result, effective communication is a significant variable in our
paradigm (Andreassen, 2000). Following Boshoff (1997) the mass of customers who experience
service failure do not report that dysfunction to the supplier. Consequently, as a result of
unreliable communication tools, lots of firms lose clients without extending cognition of what
went wrong. That being said, therefore, firms have to stimulate and facilitate communication
channels with their clients so as to receive feedback and suggestions on their service.
Subsequently, to further strengthen our argument, this research will underline another advantage
of effective complaint handling resembling in satisfied customers acting as advocates of the firm
through spreading positive word of mouth. In this conception, Hocutt et al. (2006) acknowledged
the process of effective complaint-handling as an art, whereas, the existence of the three essential
elements in the process that are high redress, responsiveness and courtesy, will lead costumers to
end up more satisfied with the service than when no service failure occurs (Hocutt, Bowers &
Donavan, 2006). These findings were further explained by Duffy et al. (2006) were they
demonstrated that customer’s satisfaction is not positively affected by an apology that does not
include a serious recovery action, customers must be given the chance to elucidate their
complaints and these problems must be the firm’s top priority (Duffy, Miller & Bexley, 2006).
That being said, the major elements of effective complaint handling are an apology, remedy,
explanation, attentiveness and promptness (Boshoff, 1999; Smith & Wagner, 1999, Yavas et al.,
2003).
Within this framework, due to the increase of competition and demand on the financial
institutions we have chosen the banking industry as the scope of our research, whereas, empirical
data will be collected by examination of the relationships between banks and their clients. To
further explain, consistent with Leal and Pereira (2003) the banking industry occupies a unique
position in complaint management, simultaneously, it has also been identified as a financially
competent field that has had an apparent progression in their services based on valuable
consumer behavior research (Leal & Pereira, 2003). Furthermore, primary data will be collected
from University of Gavle in Sweden and the Lebanese American University in Lebanon. In this
3
regard, interestingly, approximately 88% of the market share of the total deposits and loans
within Sweden are held by the four largest banks namely, Swedbank, Handelsbanken, Nordea
and SEB (Swedish Bankers' Association 2013). Implicitly, the Swedish banking industry is
essentially subjugated by the aforementioned four banks, whereas, in Lebanon approximately 87
% of loans and deposits are held by 24 banks (Chahine & Safieddine, 2008; Association of
Banks in Lebanon, 2012). Given this, the significant variation in statistics regarding the number
of banks in each country has attracted our adherence to underline customer’s response to
complaint management in both Sweden and Lebanon. Indeed, the two countries are poles apart
in their economic circumstances (Chahine & Safieddine, 2008), therefore, the assimilation of the
two research arenas will accumulate a dyadic integration to avoid bias in our findings and ensure
a more representative sample.
In this formulation, this study has adopted quantitative methodology, whereas, data were
collected using a questionnaire that was distributed to students and faculty in University of Gavle
and Lebanese American University. Further, results of quantitative research was analyzed via
SPSS (software package used for statistical analysis), in particular, utilizing the relationship
measurement tools, correlation and linear regression analysis in order to postulate an answer to
the following research question
‘To what extent does effective complaint management influence customer’s
satisfaction and loyalty? ‘’
Subsequently, this study underlines the difference in customer’s response to complaint
management between the two countries, Sweden and Lebanon.
4
2. Theoretical framework
This chapter postulates a multitude of previous studies in the fields of complaint management
and customer relations, whereas, subsequent to screening a variety of deliberate philosophies and
establishing a valid literature foundation in this area, three hypotheses regarding the relationships
between (complaint management, customer satisfaction and loyalty) will be advanced to be
examined in the following chapters.
2.1. Service recovery and Complaint handling
2.1.1. Service recovery: its evolution and importance
In recent years, service recovery has received a lot of attention by researchers and
marketers due to the importance of service quality in the competitive environment of the
contemporary service era. In 1970s and early 1980 “service recovery” was meant to deal mostly
with damages within telecommunication, renovating of computers or recuperating from natural
destructive forces (Brown, Cowles & Tuten, 1996, p.34). Since then, more and more marketers
together with scholars have stressed an importance of being not only reactive toward service
problems (Andreasen & Best, 1977) but also potential long-lasting benefit from recovery which
can manifest itself thorough enhancing customer loyalty and spreading positive word of mouth
(Berry, Zeithaml & Parasuraman, 1988). After publication an article “The profitable art of
service recovery” written by Hart et al. (1990) attention toward unsatisfactory service encounters
and complaint handling efforts was changed into proactive one while recognition of the strategic
role of service recovery in competitive environment, that requires creative thinking and well-
deliberated strategy in attempt to retain customer’s goodwill (Brown, Cowles & Tuten, 1996;
Lovelock & Wirtz, 2011).
Moreover, service recovery has been receiving more and more attention in response to the
increasing customer expectations caused by the intensive competition in the marketplace. In an
attempt to attract more customers, marketers tend to give outstanding promises to differentiate
the service among rivals that consequently leads to escalating customer’s expectations (Brown,
Cowles & Tuten, 1996). In this regard, Grönroos (1990) points out that it is much easier for
marketers to give promises but it is much more difficult to manage employees to meet
customer’s hopes; consequently over-promising contributes to creating a “gap” – the difference
between customer expectations, based on exaggerated promises, and actual customer perception
5
of offered service (Zeithaml, Berry & Parasuraman, 1993; Hamer, 2006). Given these dynamics,
the necessity to assimilate high customer expectations and competition of service provider,
results into an increasing need of employing effective service recovery strategies (Brown,
Cowles & Tuten, 1996).
2.1.2. Complaint handling versus Service recovery
Service recovery can be defined as an action undertaken by service provider in response to
service failure (Grönroos, 1990) in attempt to deliver service right at the second try (Berry,
Parasuraman, 1991; Zemke & Bell, 1990). Following Lovelock and Wirtz:
‘Service recovery is an umbrella term for systematic efforts by a firm to correct a problem
following a service failure and to retain a customer’s goodwill” (2011, p.354).
Having said that, service recovery is a broad concept that is regarded as a proactive customer
retention tool, service recovery is supposed to address the failure encounters before complaints
are lodged (Bendall-Lyon & Powers, 2001). On the other hand, complaint handling is a major
part of service recovery and is majorly characterized by the following actions: a) encouraging
complaints to enhance service quality; b) creating a special complaint department ; c) ensuring a
quick and fast response on lodged complaints; d) installing a complaint database e) affirming
that all unsatisfactory service encounters are identified; f) using compliant database for tracking
trends for further improvements (Bendall-Lyon & Powers, 2001). In this regard, as current study
aims to investigate effect of effective complaint handling on customer satisfaction and customer
loyalty, further focus will be done on this particular component of servicer recovery concept.
Essentially, intangible nature of services makes it difficult to understand and meet customers’
expectations meanwhile increasing the likelihood of errors which can take place both from
operational and consumer’s perspectives (Parasuraman, Zeithaml & Berry, 1991). Giving this
dynamic, conducting business in service industry implies elaboration of systematic approach for
effective complaint handling and Zemke and Bell define it as:
“a thought-out, planned, process for returning aggrieved customers to a state of
satisfaction with the organization after a service or product has failed to live up to
expectations” (1990, p.43).
In this notion, consistent with Thwaites and Williams (2006) it is five times more expensive to
attract new customers rather than retaining existing ones. Additionally, disappointment with the
6
offered service may lead to spreading negative word of mouth, this idea is further reinforced by
the findings of Sousa and Voss (2009) and Morrisson and Huppertz (2010) who claimed that,
dissatisfied customers may tell from ten to twenty people about their bad experience, whereas if
the problem is resolved successfully, it usually is shared amongst up to five people on average.
Moreover, Tax and Brown (1998) argues that only about 5 % to 10% of customers who are
dissatisfied with offered service lodge their complaints to service provider. In this regard,
Stephens and Gwinner (1998) provide numbers of reasons which explain customer’s
unwillingness to complain. It is suggested that among those are follows: 1) customers regards
complaining as an action which does not worth efforts; 2) customers does not believe that
refund/ compensation will be maid; 3) customers consider complaining as unpleasant situation
and usually do not know how to lodge compliant and to whom; 4) customers may avoid conflict
if it involves people who they know and have to cooperate with again (Stephens &
Gwinner,1998).
Additionally, Goodwin and Verhage (1990) have pointed out in their study, that the complaint
behavior is dependent on the customer perception role and social norms of society; more
specifically, customers are discouraged to voice their complaints and criticize the service
provider’s work if they consider that they have low power of influence and are unable to control,
impact or question the service provider’s expertise due to social norms or lack of professional
knowledge in certain service field (for instance, medicine, jurisprudence etc.). In this sense,
studies related to customer complaint behavior distinguishes between four main reasons that
urges customers to lodge the problem, among those are follows: a) to get refund compensating
economic loss; b) to escape anger and recover self-esteem; c) to help improving service quality
(in case of high customer involvement into service delivery like university or main bank); d) or
just because of altruistic motivation aspiring to prevent other people experiencing the same
problem (Lovelock & Wirtz, 2011). That said, effective complaint handling implies developing
and employing thoughtful procedures that implies encouraging customers to lodge complaints
and returning disgruntled customers into delighted one.
Indeed, risk of unsatisfactory service encounter is higher and role of effective complaint handling
is more important in highly competitive environment with abundance of choices of alternative
7
substitutes (Lovelock & Wirtz, 2011). In this regard, a research conducted by Narteh (2013b)
sheds a light upon key factors that determine retail bank switching. Findings of this study
indicate that failure to deliver core service appropriately as well as defection in complaint
handling is the main determinants of customers’ decision to switch banks, besides, the author
points out that factors which explain switching customer behavior in developing countries are
not essentially different from the reasons which account for retail banking switching in
developed countries.
Following Lovelock & Wirtz (2011) complaint handling efforts should be regarded as
investments which help to retain customers and protect long-term stream of profit. Policies of
complaint handing management may imply apologizing, excusing or material compensation
(Dube & Maute, 1994) as well as redoing core service right at the second try correcting what
went wrong (Zemke & Bell, 1990). In this regard, Miller et al. (2000) divide complaint handling
strategies into two types: psychological and tangible strategy. The psychological approach is
focused on actions like explaining the problem to the customer and apologizing whereas, in this
case, emphasis is applied on communication; meanwhile, the tangible approach is concentrated
on refunding and material compensation.
Similarly, Parasuraman et al. (1988) suggested that the problem resolution process consists
of two dimensions: a technical and a functional dimension. The technical dimension is
considered as an outcome of complaint handling, more specifically what customer receives
eventually after the service provider’s efforts to fix the problem, whereas, the functional
dimension relates to process of its execution. Furthermore, Berry and Parasuraman (1991)
emphasize the prominence of functional dimension in complaint handling process and point out
that the outcome is more essential while delivering original service; yet it can depend on type of
service at the point.
Generally, studies on service encounters have occupied focus of business scholars to a broader
extent in US rather than in other countries including developing ones; additionally, in essence
with Raven and Welsh (2004) Middle Eastern countries are considered as under-research areas at
large. Simultaneously, apart from the work conducted by Bitner et al. (1990), Brown et al.
(1996), Andreassen (2000), Sousa and Voss (2009), Morrisson and Huppertz (2010), Komunda
and Osarenkhoe (2012) less attention has been paid to impact the effective complaint on
8
customer behavior especially in banking industry. Moreover, findings of previous studies in the
service recovery field are arguable. For instance, some studies argue that effective complaint
handling is able to enhance customer satisfaction higher than if no failure has occurred in the
first place, so called “service recovery paradox” (Smith & Bolton, 1998; Hansen & Danaher,
1999). However, other scholars such as Sousa and Voss (2009) point out that effect of service
recovery paradox do exist but not substantial, whereas McCollough et al. (2000) completely
reject significant impact of effective complaint handling on customer satisfaction and loyalty.
Moreover, consistent with Winsted (1999) people with different cultural background have
different expectations from service provider towards service encounters. Having said that, this
research is aiming to contribute to a growing body of knowledge about service encounters and
customer satisfaction by examining relationships between effective complaint handling and
customer patronage behavior in commercial banking industry of Lebanon and Sweden
2.2. Customer loyalty
In earlier studies, loyalty has been described as a repetitive purchasing behavior for the same
product or brand over time (Jacoby & Kyner, 1973). In this regard, loyal customers continue
their acquisitions from the same service provider and they are very likely to patronize new
services/products; moreover, loyal customers tend to spread favorable word of mouth by
recommending the services or products to others (Fisher, 2001; Oh, 2006). In the following
study, (Dick & Basu, 1994) argue, that depending on customer patronage behavior and relative
attitudes toward a service provider, customers exhibit different levels of commitment/loyalty. In
essence with Oliver (1999), attitudinal and behavioral approaches can be applied to measure
customer loyalty, where the attitudinal approach is identified as favorable attitude towards a
particular supplier which is a result of a satisfactory and positive experience with
services/products; in this case customers trust the supplier, and consequently recommend the
product to others (Gustafsson, Johnson & Roos, 2005). The second approach analyzes customer
purchasing behavior and investigates the frequency of procurement of the same service/product
in loyalty assessment (Jones & Farquhar, 2003).
Following Dick and Basu’s (1994) framework, Rowley (2005) investigated the nature of loyalty
and proposed speculative model and categorized loyalty into 4Cs: captive, convenient, contented
and committed. Captive loyalty is characterized by repetitive patronage behavior of customer
9
toward certain brand or service due to absence of other alternatives, such customers do not have
a wide range of choices, to switch or they just consider switching costs too high and
inconvenient. In this case, customer attitude towards a brand/service is neutral. Furthermore,
intermittent purchasing decision is another reason of being bound up with a service/product
provider as it can be in financial service industry. In this notion, customers often are subscribed
to a variety of financial services from different service providers; however mortgage credit is
likely to take place with only one of them. Undoubtedly, a mortgage account is described by
relatively high switching costs; hence, customers in this case exhibit captive loyalty having had a
difficulty to terminate the relationship. However, service provider should not consider its
customer as unlikely to switch, because in conditions of high competition the customer can be
poached by rivals, who can handle circumstances with high switching costs (for instance,
compensating mortgage redemption payments or removing some formalities making switching
process earthier). In case of having big share of captive customers, firm is suggested to develop
strategies oriented on strengthening relations with its customers alongside both behavioral and
attitudinal dimensions, because such type of clients can be lost due to fluctuations in market
structure or personal circumstances (Rowley, 2005).
Consistent with Rowley (2005) convenient loyalty is characterized by a recurrent visiting
behavior with low engagement into buying process and is associated with routine without any
particular affection toward brand/provider. Generally, following factors as location, opening
hours, membership discounts etc. are the only determinants of loyalty; consequently, such
customers are vulnerable to fluctuations in structure of the market or in personal life and
ultimately can be lost by the availability of a more convenient alternative, despite their
satisfaction with the current product or service (Rowley, 2005)
Contented loyals exhibit positive attitude toward brand/service provider but indolent in their
purchasing behavior. In this case, customer’s purchasing decision in favor of certain
service/product is based only on meritocracy. More precisely, they repeat their acquisition for
specific items, simultaneously, do not expand their expenditures over other services/products of
the same brand, because each purchase decision is done separately based on its merits; in this
regard, additional services/products can be considered as irrelevant to customer’s requirements.
10
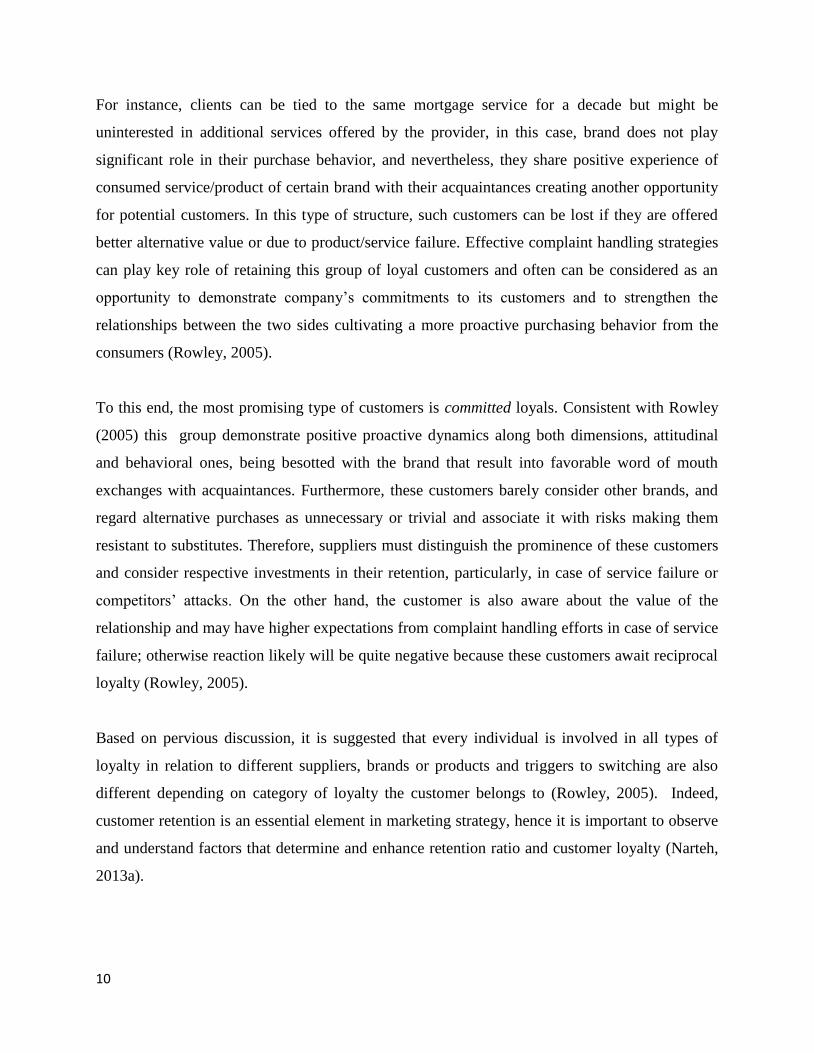
For instance, clients can be tied to the same mortgage service for a decade but might be
uninterested in additional services offered by the provider, in this case, brand does not play
significant role in their purchase behavior, and nevertheless, they share positive experience of
consumed service/product of certain brand with their acquaintances creating another opportunity
for potential customers. In this type of structure, such customers can be lost if they are offered
better alternative value or due to product/service failure. Effective complaint handling strategies
can play key role of retaining this group of loyal customers and often can be considered as an
opportunity to demonstrate company’s commitments to its customers and to strengthen the
relationships between the two sides cultivating a more proactive purchasing behavior from the
consumers (Rowley, 2005).
To this end, the most promising type of customers is committed loyals. Consistent with Rowley
(2005) this group demonstrate positive proactive dynamics along both dimensions, attitudinal
and behavioral ones, being besotted with the brand that result into favorable word of mouth
exchanges with acquaintances. Furthermore, these customers barely consider other brands, and
regard alternative purchases as unnecessary or trivial and associate it with risks making them
resistant to substitutes. Therefore, suppliers must distinguish the prominence of these customers
and consider respective investments in their retention, particularly, in case of service failure or
competitors’ attacks. On the other hand, the customer is also aware about the value of the
relationship and may have higher expectations from complaint handling efforts in case of service
failure; otherwise reaction likely will be quite negative because these customers await reciprocal
loyalty (Rowley, 2005).
Based on pervious discussion, it is suggested that every individual is involved in all types of
loyalty in relation to different suppliers, brands or products and triggers to switching are also
different depending on category of loyalty the customer belongs to (Rowley, 2005). Indeed,
customer retention is an essential element in marketing strategy, hence it is important to observe
and understand factors that determine and enhance retention ratio and customer loyalty (Narteh,
2013a).
11
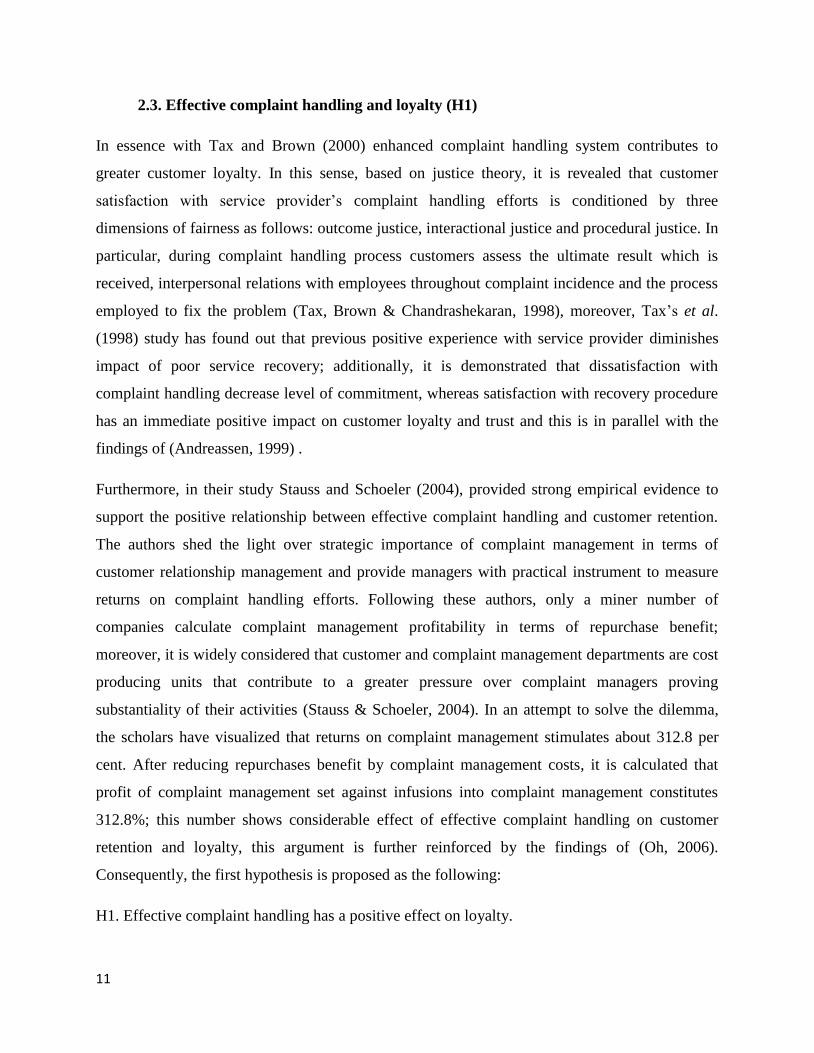
2.3. Effective complaint handling and loyalty (H1)
In essence with Tax and Brown (2000) enhanced complaint handling system contributes to
greater customer loyalty. In this sense, based on justice theory, it is revealed that customer
satisfaction with service provider’s complaint handling efforts is conditioned by three
dimensions of fairness as follows: outcome justice, interactional justice and procedural justice. In
particular, during complaint handling process customers assess the ultimate result which is
received, interpersonal relations with employees throughout complaint incidence and the process
employed to fix the problem (Tax, Brown & Chandrashekaran, 1998), moreover, Tax’s et al.
(1998) study has found out that previous positive experience with service provider diminishes
impact of poor service recovery; additionally, it is demonstrated that dissatisfaction with
complaint handling decrease level of commitment, whereas satisfaction with recovery procedure
has an immediate positive impact on customer loyalty and trust and this is in parallel with the
findings of (Andreassen, 1999) .
Furthermore, in their study Stauss and Schoeler (2004), provided strong empirical evidence to
support the positive relationship between effective complaint handling and customer retention.
The authors shed the light over strategic importance of complaint management in terms of
customer relationship management and provide managers with practical instrument to measure
returns on complaint handling efforts. Following these authors, only a miner number of
companies calculate complaint management profitability in terms of repurchase benefit;
moreover, it is widely considered that customer and complaint management departments are cost
producing units that contribute to a greater pressure over complaint managers proving
substantiality of their activities (Stauss & Schoeler, 2004). In an attempt to solve the dilemma,
the scholars have visualized that returns on complaint management stimulates about 312.8 per
cent. After reducing repurchases benefit by complaint management costs, it is calculated that
profit of complaint management set against infusions into complaint management constitutes
312.8%; this number shows considerable effect of effective complaint handling on customer
retention and loyalty, this argument is further reinforced by the findings of (Oh, 2006).
Consequently, the first hypothesis is proposed as the following:
H1. Effective complaint handling has a positive effect on loyalty.
12
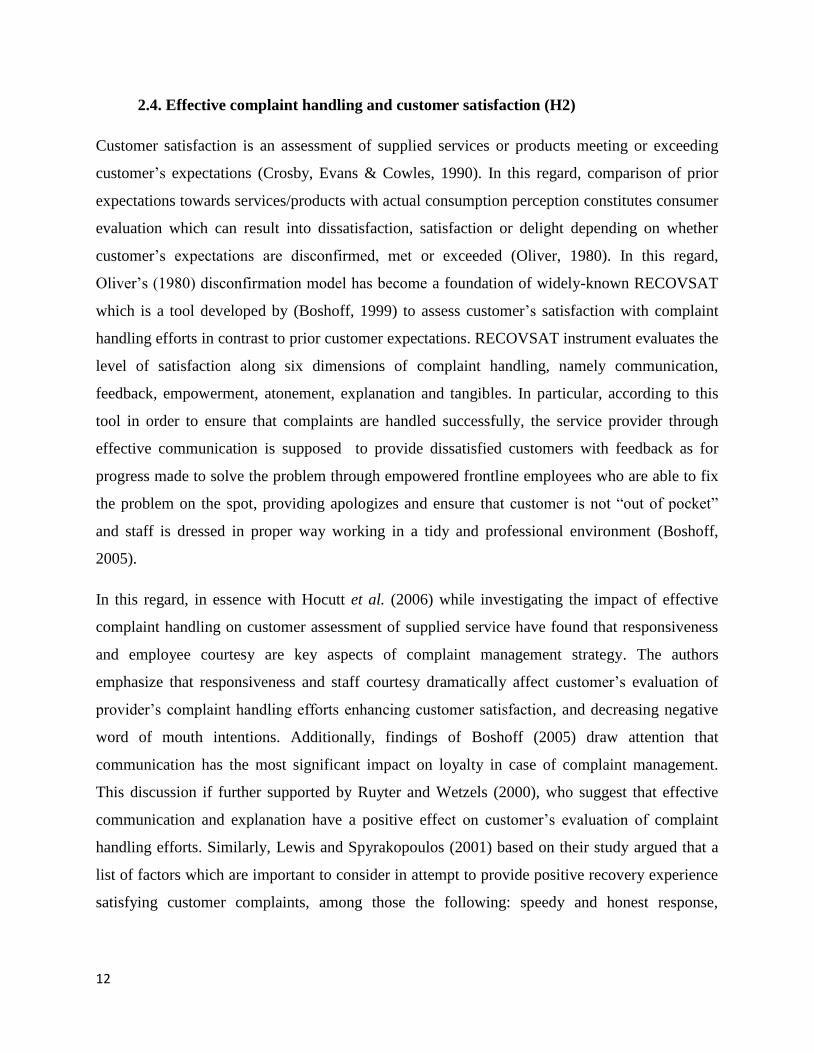
2.4. Effective complaint handling and customer satisfaction (H2)
Customer satisfaction is an assessment of supplied services or products meeting or exceeding
customer’s expectations (Crosby, Evans & Cowles, 1990). In this regard, comparison of prior
expectations towards services/products with actual consumption perception constitutes consumer
evaluation which can result into dissatisfaction, satisfaction or delight depending on whether
customer’s expectations are disconfirmed, met or exceeded (Oliver, 1980). In this regard,
Oliver’s (1980) disconfirmation model has become a foundation of widely-known RECOVSAT
which is a tool developed by (Boshoff, 1999) to assess customer’s satisfaction with complaint
handling efforts in contrast to prior customer expectations. RECOVSAT instrument evaluates the
level of satisfaction along six dimensions of complaint handling, namely communication,
feedback, empowerment, atonement, explanation and tangibles. In particular, according to this
tool in order to ensure that complaints are handled successfully, the service provider through
effective communication is supposed to provide dissatisfied customers with feedback as for
progress made to solve the problem through empowered frontline employees who are able to fix
the problem on the spot, providing apologizes and ensure that customer is not “out of pocket”
and staff is dressed in proper way working in a tidy and professional environment (Boshoff,
2005).
In this regard, in essence with Hocutt et al. (2006) while investigating the impact of effective
complaint handling on customer assessment of supplied service have found that responsiveness
and employee courtesy are key aspects of complaint management strategy. The authors
emphasize that responsiveness and staff courtesy dramatically affect customer’s evaluation of
provider’s complaint handling efforts enhancing customer satisfaction, and decreasing negative
word of mouth intentions. Additionally, findings of Boshoff (2005) draw attention that
communication has the most significant impact on loyalty in case of complaint management.
This discussion if further supported by Ruyter and Wetzels (2000), who suggest that effective
communication and explanation have a positive effect on customer’s evaluation of complaint
handling efforts. Similarly, Lewis and Spyrakopoulos (2001) based on their study argued that a
list of factors which are important to consider in attempt to provide positive recovery experience
satisfying customer complaints, among those the following: speedy and honest response,
13
listening, attention, care, flexibility, courtesy, communication, fixing the problem and financial
compensation.
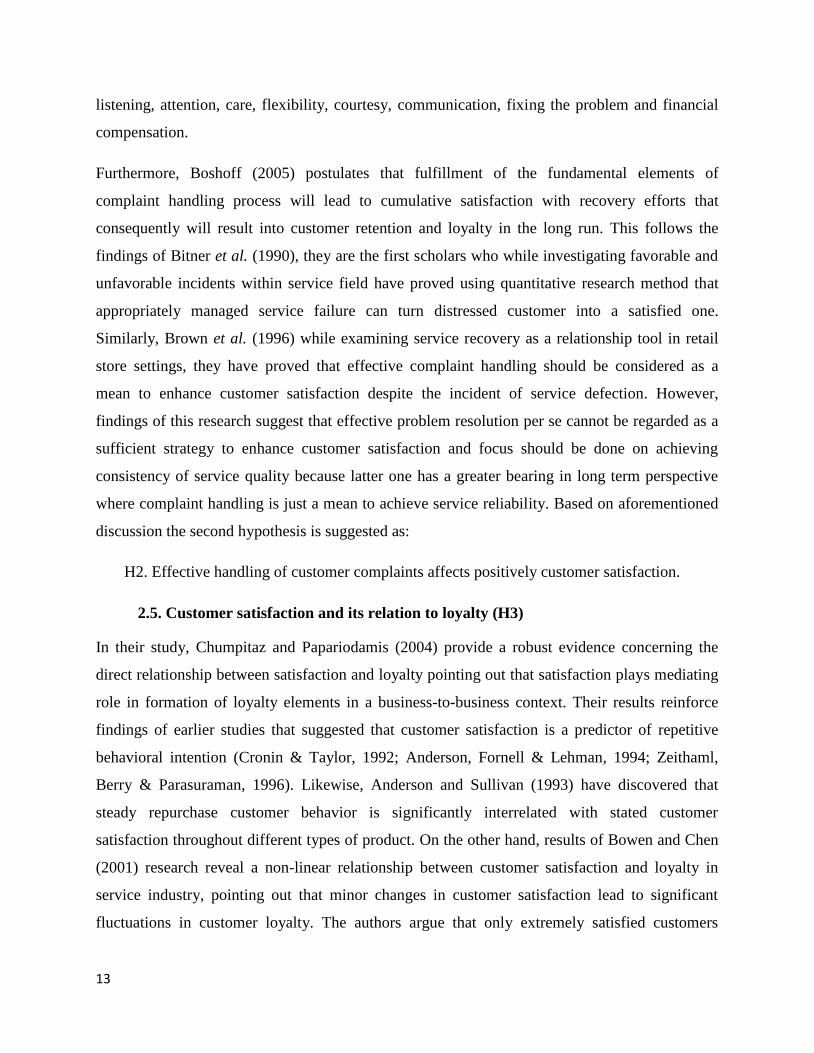
Furthermore, Boshoff (2005) postulates that fulfillment of the fundamental elements of
complaint handling process will lead to cumulative satisfaction with recovery efforts that
consequently will result into customer retention and loyalty in the long run. This follows the
findings of Bitner et al. (1990), they are the first scholars who while investigating favorable and
unfavorable incidents within service field have proved using quantitative research method that
appropriately managed service failure can turn distressed customer into a satisfied one.
Similarly, Brown et al. (1996) while examining service recovery as a relationship tool in retail
store settings, they have proved that effective complaint handling should be considered as a
mean to enhance customer satisfaction despite the incident of service defection. However,
findings of this research suggest that effective problem resolution per se cannot be regarded as a
sufficient strategy to enhance customer satisfaction and focus should be done on achieving
consistency of service quality because latter one has a greater bearing in long term perspective
where complaint handling is just a mean to achieve service reliability. Based on aforementioned
discussion the second hypothesis is suggested as:
H2. Effective handling of customer complaints affects positively customer satisfaction.
2.5. Customer satisfaction and its relation to loyalty (H3)
In their study, Chumpitaz and Papariodamis (2004) provide a robust evidence concerning the
direct relationship between satisfaction and loyalty pointing out that satisfaction plays mediating
role in formation of loyalty elements in a business-to-business context. Their results reinforce
findings of earlier studies that suggested that customer satisfaction is a predictor of repetitive
behavioral intention (Cronin & Taylor, 1992; Anderson, Fornell & Lehman, 1994; Zeithaml,
Berry & Parasuraman, 1996). Likewise, Anderson and Sullivan (1993) have discovered that
steady repurchase customer behavior is significantly interrelated with stated customer
satisfaction throughout different types of product. On the other hand, results of Bowen and Chen
(2001) research reveal a non-linear relationship between customer satisfaction and loyalty in
service industry, pointing out that minor changes in customer satisfaction lead to significant
fluctuations in customer loyalty. The authors argue that only extremely satisfied customers
14
demonstrate active positive attitudinal and behavioral intention towards the service provider
through patronage behavior and talk about their positive experience with acquaintances.
Subsequently, this outcome is in consistent with earlier studies by Oliva et al. (1992) who
indicate two key levels that affect relation between loyalty and satisfaction. In particular, when
satisfaction achieves certain point, loyalty increases dramatically; whereas if satisfaction has
minor declination, loyalty falls down significantly (Oliva, Oliver & MacMillan, 1992).
Consequently, the preceding fact means that having satisfied customers is not enough; managers
should aim to make their customers extremely satisfied in order to boost customer loyalty with
patronage behavior and positive word of mouth (Bowen & Chen, 2001).
Essentially, according to Reichheld and Sasser (1990) bottom line of service firm can be
enhanced by 100% only at the cost of escalating customer retention ratio by 5 %. Admittedly, the
percentage of retention shows to what extent current customers are satisfied with offered
service/product (Narteh, 2013a). Further, findings of Kelley and Davis (1994) underline
satisfaction as an essential element of customer and employee dedication. In regard of banking
sector, a study conducted by Narteh (2013a) shows that satisfaction with bank service, perceived
quality, bank’s image and availability of electronic bank services are the key factors that
determine student’s loyalty in retail banks of Ghana. Simultaneously, other studies in this field
suggest that the main determinants of customer satisfaction are quality of core service, pricing,
process of service delivery, environment where service is consumed and relationship developed
with client over time (Lymperopoulos, Chaniotakis & Soureli, 2006; Walker, Smither &
Waldman, 2008; Al-Eisa & Alhemoud, 2009 ).
Within banking industry customers can exhibit genuine commitment toward service provider
(Srinivasan, Anderson & Ponnavolu, 2002) or be falsely loyal, which means that even if
customer is dissatisfied, one will stay with bank because of other reasons related to external
factors (Afsar et al. 2010). In this regard, Afsar et al. (2010) while investigation determinants of
customer loyalty in relation to banking industry on the basis of Pakistan, the aforementioned
author have found out that loyalty is affected by the following elements: satisfaction, trust,
perceived quality and switching costs; moreover, all of these factors are interrelated and do
highly influence each other. Other studies, namely (Chumpitaz & Papariodamis, 2004; Wang et
al., 2004 p.178; Komunda & Osarenkhoe, 2012) also support positive correlation between
15
satisfaction and loyalty, however it is pointed out that relationship is not all the time linear
(Oliva, Oliver & MacMillan, 1992; Matos et al., 2009) especially in case of highly competitive
environment with low switching costs and if offered services/products are not substantially
differentiated (Morrisson & Huppertz, 2010). Having said that, satisfied customer still may
exhibit switching behavior (Bloemer & Odekerken-Schroder, 2002) unless service provider does
something extraordinary to delight his clients (Torres & Kline, 2006). Hence, based on
aforementioned discussion the third hypothesis of the present study is postulated as follows:
H3. Customer satisfaction leads to repeat patronage behavior and favorable word of mouth
reference to others.
2.6. Characteristic of banking services
Banking industry offers services oriented towards intangible assets (Lovelock 1983), that
requires maintaining superior quality due to the fact that banks offer undifferentiated products
(Marla, 1996), consequently contributes to a higher bargaining power of customers and
challenges related to customer retention (Karatepe, 2011). However, on the other hand Levesque
and McDougall (1996) points out that the banking industry is characterized by relatively high
switching costs that may contribute to captive loyalty described by Rowley (2005). In order to
survive, the banks should be proactive and responsive to changes of external environment
offering not only basic range of services (like deposit, loans and bank accounts) but also other
products (for instance, leasing, fund management etc.)(Zineldin, 2002). Moreover, customers’
deposits are not stable in comparison with loans. In this case, clients switch banks easily, but the
wider range of bank services customer purchases, the higher possibility that customer will
remain with the same bank (Zineldin, 2002).
Essentially, Lovelock (1983) defines customer relationship within banking industry as
“membership” and points out that banking service is characterized by discrete operations and
customization where service providers are aware of their customer’s needs and tend to build
continuing, formal relationship to ensure repetition of patronage behavior. Ultimately, customer
satisfaction and customer loyalty in banking industry is significantly influenced by convenience
of the offered service and the level of competition (Levesque & McDougall, 1996). In this
notion, a number of studies, namely Anderson et al. (1976), Thwaites and Vere (1995),
emphasizes that convenience and accessibility are key factors that determine customer choice
16
towards a certain bank and directly affect customer satisfaction and repetitive patronage
behavior. Additionally, the conventional aspect in banking industry is related to the nature of the
offered service. In this sense, some services require the physical presence of a customer in a bank
or specific branch; hence, the increasing number of branches contributes to greater accessibility
and convenience (Lovelock, 1983). However, in their study, Hinson et al. (2011) underlined that
geographical location is not as important, whereas, the authors argue that adherence to the best
high quality of modern world practices is a key determinant of a bank’s success. Similarly, in a
relevant study conducted by Narteh (2013a) , shows that satisfaction with bank service, bank’s
image and availability of electronic banking services are the key factors that determine loyalty in
retail banking. Further, Narteh (2013a) argues that due to the development of informational
technologies, the availability of electronic banking services has become an import factor that
affects consumer’s bank choice.
To this end, taking into account that customers with high level of commitments have higher
expectations from their service provider (Kelley & Davis, 1994), it is assumed that consistency
of service quality is a determinative factor that affects customer loyalty in banking industry
where effective complaint handling serves as a tool to sustain good quality.
2.7. Contextual background: the banking industry of Lebanon
Lebanon is regarded as a developing country, which due to its trading history and geographically
favorable location has become a financial center of the Middle East (Raven & Welsh, 2004),
which is known as oil-rich region (Abbasi & Hollman, 1993). Discovering commercial quantities
of oil in the 1930s in Gulf area contributed to boosting transformations in the desert countries of
the Middle East with further industrialization and improving living standards (increased social
mobility, communication, better education and healthcare) (Abbasi & Hollman, 1993; Ali, 1990).
According to Hofstede et al. (2010) Lebanon is regarded as collectivistic societies (IDV 38) with
relatively high power distance (PDI 80) and to a slighter extent score uncertainty avoidance
index – 68 UAI; moreover, Lebanon scores low at long term orientation dimension (Hofstede,
Hofstede & Minkov, 2010 p.259). Following Donthu and Yoo (1998), Furrer et al. (2000), Dash
et al. (2009) culture influences customer expectations and perception of service quality. In this
regard, Donthu and Yoo (1998) relating Hofstede’s et al. (2010) power distance, uncertainty
17
avoidance and long term orientation dimensions to customer expectations of service quality, for
which they point out those customers from high-power distance countries, are characterized by
lower expectations of service quality. In essence with Dash et al. (2009), high PDI customers
value the tangible aspects of offered service; short-term oriented and high-uncertainty-avoidance
customers are found to have higher overall service quality expectations (Donthu & Yoo, 1998).
In this sense, service providers especially in financial institutions are regarded as more powerful
and respected by their customers due to competence, expertise and knowledge they possess in
certain professional field of activities; hence, in such cultures customers perceive service
provider’s work is beyond of their grasp and service providers are likely to treat their customers
differently than in developed countries (Donthu & Yoo, 1998). Thereby, such acceptance of
power inequality results into lower overall service quality expectations set by customers. Further,
“weak power” consumers are more tolerant toward service failure, poor reliability and
responsiveness of “powerful” bank compare to their counterparts from low power distance
cultures, where the latter ones expect and accept high service quality (Donthu & Yoo, 1998;
Furrer, Liu & Sudharshan, 2000). Moreover, it is worth noting that quality standards in
developing countries on average are not clearly defined, which means that quality of offered
service may not be controlled (Raven & Welsh, 2004), consequently may contribute to lower
customer expectations (Raven & Welsh, 2004).
Banking industry of Lebanon is considered as stable and reliable, which plays an important role
in the economy of the country. In this sense, Lebanese banks remain to be the main source of
financial resources for private individuals and business units of Lebanon (Raven & Welsh, 2004;
Association of Banks in Lebanon, 2011). Based on the annual report published by Association of
Banks in Lebanon (ABL), as of 2012 there are 71 banks operating in Lebanon, whereas, 51 are
commercial and 17 are investment banks (Association of Banks in Lebanon, 2012). Being
historically open to overseas, there are 11 representative offices 12 branches of foreign banks
including Arab ones operating in Lebanon. That said, the total 984 branches are well-distributed
across the country relevant to the dispersion of its economic activities. Bancarization1 rate of
Lebanon is relatively high in relevance to other Arab and developing countries and consists of
29.3 commercial bank branches per 100 000 adults as of 2013 (The World Bank Group, 2014b).
1Bancarization refers to the accessibility and usage of financial services at large and banking services in particular; precisely, this
term reflects to what extent the numbers of bank branches are spread within a certain location (Anastasi et al., 2006)
18
Lebanese banks continuously improve and develop their systems for payment increasing the
number of ATM machines to facilitate their banking services. In this regard, statistics shows that,
as of 2013, the number of ATM machines is 41.33 machine per 100 000 adults (The World Bank
Group, 2014a). Further, banks in Lebanon continually improve the tools of payment issuing
smart cards that display partnership between business units, communication networks (smart
phone applications to facilitate payments). In terms of electronic services, Lebanese banks meet
the level of standards of some developed countries regardless of the need to spread contemporary
culture of payments among the people and exert more efforts into social development,
particularly, in rural areas (Association of Banks in Lebanon, 2012).
2.8. Contextual background: the banking industry of Sweden
Sweden is regarded as highly developed economy with 8th
highest income per capita scoring
highly in such national performance as health, education, democracy and life quality at large
(CIA, 2014). As of December 2012 Swedish banking market consisted of 117 banks, whereas,
foreign subsidiaries and branches are composed of 29 entities; however, 75 per cent of the total
market share is concentrated between the four largest banks as namely, Swedbank, SEB, Nordea
and Handelsbanken (Swedish Bankers' Association 2013). In this notion, as of 2013, there are
21.8 commercial bank branches and 43.1 ATM machines per 100 000 adults (The World Bank
Group, 2014a; The World Bank Group, 2014b).
In 1990 Swedish legislative framework allowed foreign banks to open their branches that
contributed to increasing numbers of banks for the last two decades (Swedish Bankers'
Association, 2008). Despite the fact that the banking market is controlled mainly by the four
aforementioned banks, competition within the industry still remains intensive due to the advent
of foreign rivals and other local financial institutions entering traditional banks’ territory
(Zineldin, 2002); consequently, this has led to significant structural changes that are taking place
within financial market of Sweden nowadays (Swedish Bankers' Association, 2008). Moreover,
due to the rapid development of information technologies, the importance of convenient access
to branch offices has decreased and now customers’ shifted their use to internet service banking
enabling customers to access the traditional banking service via internet. The changes in
financial market and development of new technologies has contributed to increasing
19
opportunities for financial institutions to perform their services, and further intensifying
competition within industry (Swedish Bankers' Association, 2008).
Study conducted by Zineldin (2002) has revealed that location of bank for Swedish customers is
not a chief aspect in bank selection. In this regard, factors such as transaction accuracy,
effectiveness in complaint handling, speed of service, friendliness and helpfulness of bank
personnel are found to be the main determinants of service provider selection; moreover, this
study shows that Swedish customers value quality of staff performance, technologically – based
services and bank’s reputation, whereas, excellence of these aspects can compensate lower bank
performance at other factors. The findings of Zineldin’s (2002) research suggest the customers in
Sweden value “functional quality” (how service is delivered) over “technical quality” (what is
eventually delivered, what customer receives). Moreover, Swedish banks offer almost the same
range of services/products and such marketing tools as interesting advertising or
recommendations are not effective instruments in influencing the bank selection (Zineldin,
2002). Hence, it is important for banks to ensure in delivering a high service quality as Swedish
customers are not price sensitive and need an efficient delivery system and service quality
(Zineldin, 2002).
According to Hofstede et al. (2010) study, Sweden is considered as individualistic country
(IDV71) scoring low at uncertainty avoidance (UAI 29) and power distance (PDI 31) dimensions
and somewhere in the middle at long-term orientation index (LTO 53). Following Dash et al.
(2009) customers from low power distance countries expect reliable and responsive service
having high overall service quality expectations. Also, according to the aforementioned author,
consumers that are part of individualistic societies have lower expectations toward empathy and
assurance while delivery process. However, this assumption contradict findings of Donthu and
Yoo (1998) who suggest that individualistic consumers do expect empathy, assurance and
confirm that they have high expectations of overall quality.
2.9. Synthesis and research model
Having revised studies conducted in the service field, we can say that, effective complaint
handling leads to customer satisfaction which consequently leads to customer loyalty. Moreover,
if the service provider’s efforts towards problem resolution exceed customer expectations it will
20
lead to customer loyalty which manifests itself through positive customer attitude and repurchase
behavior. In this regard, customer satisfaction plays mediating role to enhance customer
patronage behavior after effective problem resolution. However, the impact of effective
complaint handling on customer satisfaction and customer loyalty is conditioned by external
factors, such as culture and specific characteristics of banking industries of two countries. In this
regard, external factors determine customer expectations as for service quality which can
enhance or diminish positive impact of effective problem resolution.
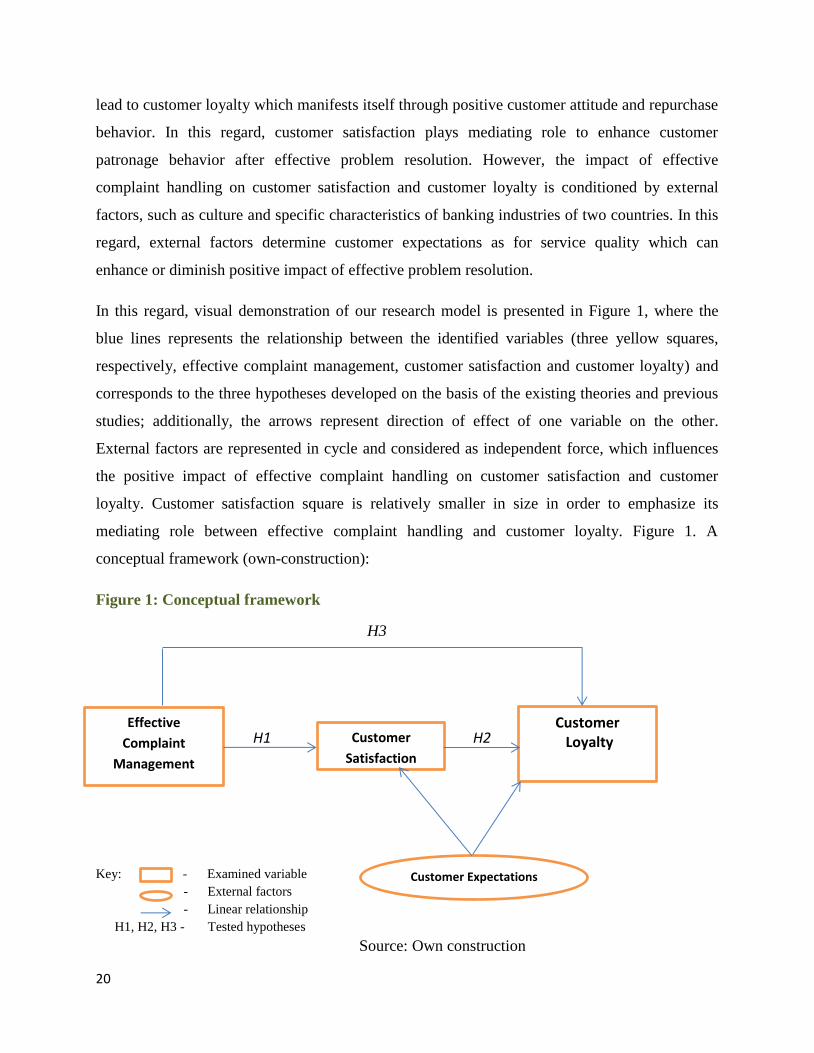
In this regard, visual demonstration of our research model is presented in Figure 1, where the
blue lines represents the relationship between the identified variables (three yellow squares,
respectively, effective complaint management, customer satisfaction and customer loyalty) and
corresponds to the three hypotheses developed on the basis of the existing theories and previous
studies; additionally, the arrows represent direction of effect of one variable on the other.
External factors are represented in cycle and considered as independent force, which influences
the positive impact of effective complaint handling on customer satisfaction and customer
loyalty. Customer satisfaction square is relatively smaller in size in order to emphasize its
mediating role between effective complaint handling and customer loyalty. Figure 1. A
conceptual framework (own-construction):
Figure 1: Conceptual framework
H3
H1 H2
Key: - - Examined variable
- External factors
- Linear relationship
H1, H2, H3 - Tested hypotheses
Source: Own construction
Effective
Complaint
Management
Customer
Satisfaction
Customer Loyalty
Customer Expectations
21
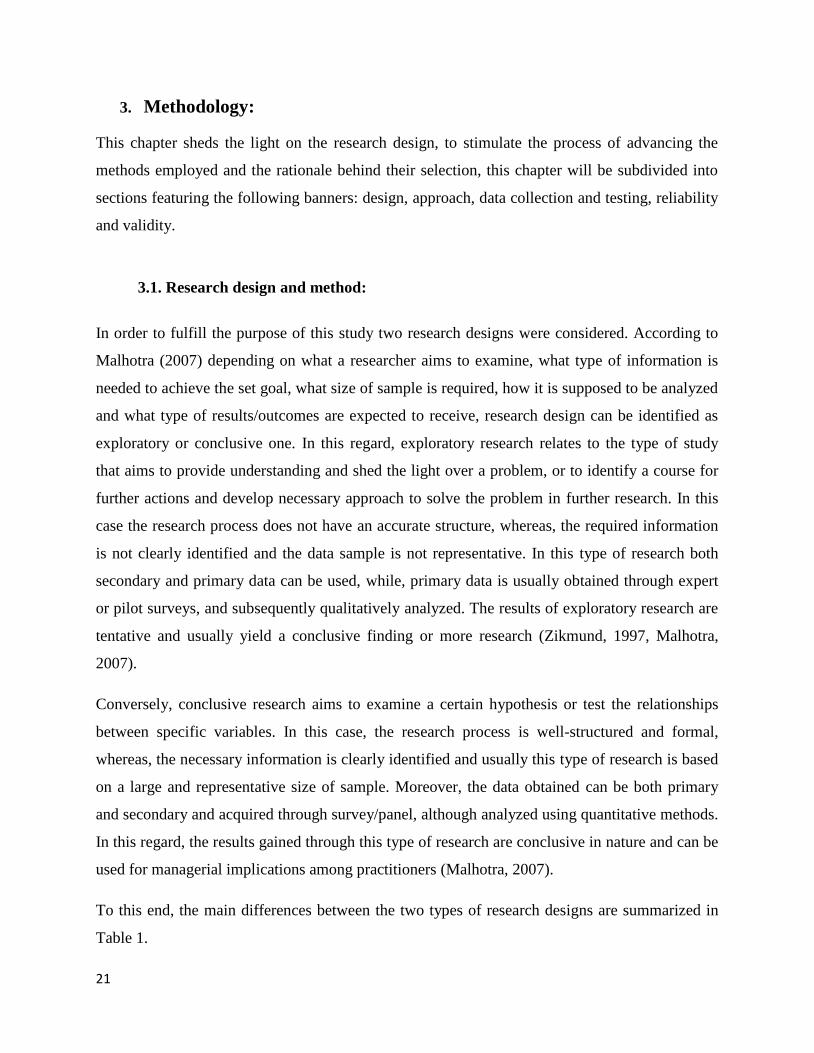
3. Methodology:
This chapter sheds the light on the research design, to stimulate the process of advancing the
methods employed and the rationale behind their selection, this chapter will be subdivided into
sections featuring the following banners: design, approach, data collection and testing, reliability
and validity.
3.1. Research design and method:
In order to fulfill the purpose of this study two research designs were considered. According to
Malhotra (2007) depending on what a researcher aims to examine, what type of information is
needed to achieve the set goal, what size of sample is required, how it is supposed to be analyzed
and what type of results/outcomes are expected to receive, research design can be identified as
exploratory or conclusive one. In this regard, exploratory research relates to the type of study
that aims to provide understanding and shed the light over a problem, or to identify a course for
further actions and develop necessary approach to solve the problem in further research. In this
case the research process does not have an accurate structure, whereas, the required information
is not clearly identified and the data sample is not representative. In this type of research both
secondary and primary data can be used, while, primary data is usually obtained through expert
or pilot surveys, and subsequently qualitatively analyzed. The results of exploratory research are
tentative and usually yield a conclusive finding or more research (Zikmund, 1997, Malhotra,
2007).
Conversely, conclusive research aims to examine a certain hypothesis or test the relationships
between specific variables. In this case, the research process is well-structured and formal,
whereas, the necessary information is clearly identified and usually this type of research is based
on a large and representative size of sample. Moreover, the data obtained can be both primary
and secondary and acquired through survey/panel, although analyzed using quantitative methods.
In this regard, the results gained through this type of research are conclusive in nature and can be
used for managerial implications among practitioners (Malhotra, 2007).
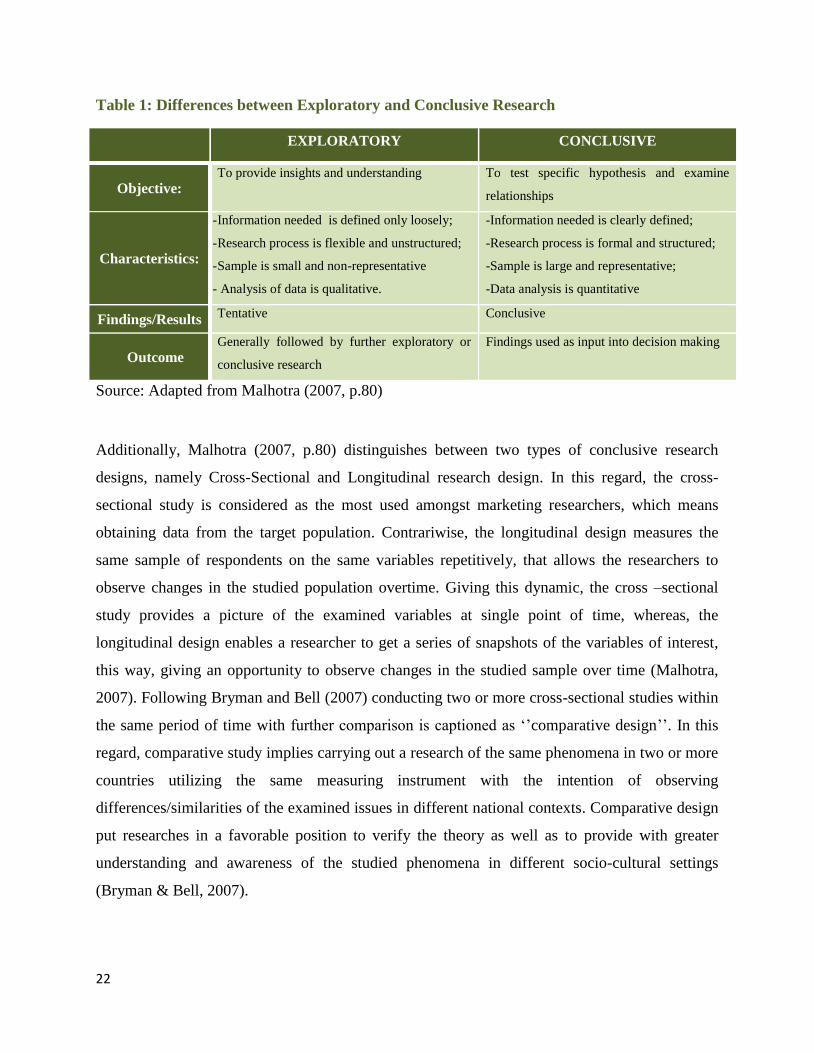
To this end, the main differences between the two types of research designs are summarized in
Table 1.
22
Table 1: Differences between Exploratory and Conclusive Research
EXPLORATORY CONCLUSIVE
Objective: To provide insights and understanding To test specific hypothesis and examine
relationships
Characteristics:
- Information needed is defined only loosely;
- Research process is flexible and unstructured;
- Sample is small and non-representative
- Analysis of data is qualitative.
-Information needed is clearly defined;
-Research process is formal and structured;
-Sample is large and representative;
-Data analysis is quantitative
Findings/Results Tentative Conclusive
Outcome Generally followed by further exploratory or
conclusive research
Findings used as input into decision making
Source: Adapted from Malhotra (2007, p.80)
Additionally, Malhotra (2007, p.80) distinguishes between two types of conclusive research
designs, namely Cross-Sectional and Longitudinal research design. In this regard, the cross-
sectional study is considered as the most used amongst marketing researchers, which means
obtaining data from the target population. Contrariwise, the longitudinal design measures the
same sample of respondents on the same variables repetitively, that allows the researchers to
observe changes in the studied population overtime. Giving this dynamic, the cross –sectional
study provides a picture of the examined variables at single point of time, whereas, the
longitudinal design enables a researcher to get a series of snapshots of the variables of interest,
this way, giving an opportunity to observe changes in the studied sample over time (Malhotra,
2007). Following Bryman and Bell (2007) conducting two or more cross-sectional studies within
the same period of time with further comparison is captioned as ‘’comparative design’’. In this
regard, comparative study implies carrying out a research of the same phenomena in two or more
countries utilizing the same measuring instrument with the intention of observing
differences/similarities of the examined issues in different national contexts. Comparative design
put researches in a favorable position to verify the theory as well as to provide with greater
understanding and awareness of the studied phenomena in different socio-cultural settings
(Bryman & Bell, 2007).
23
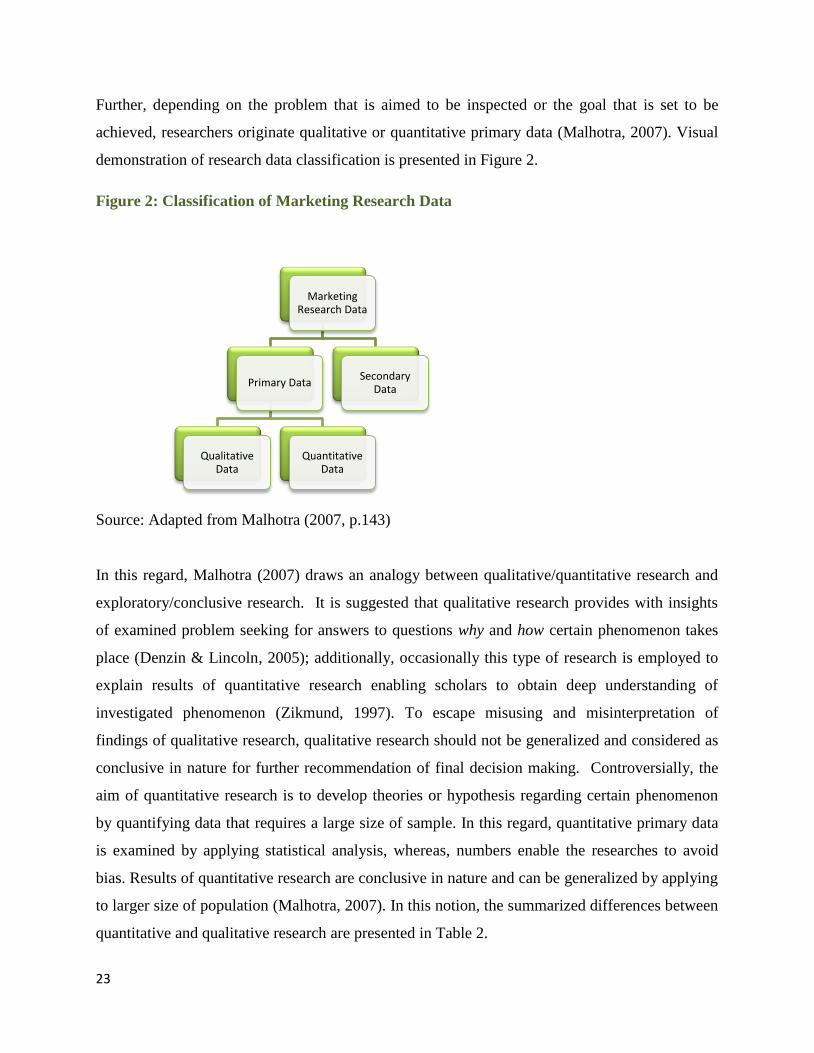
Further, depending on the problem that is aimed to be inspected or the goal that is set to be
achieved, researchers originate qualitative or quantitative primary data (Malhotra, 2007). Visual
demonstration of research data classification is presented in Figure 2.
Figure 2: Classification of Marketing Research Data
Source: Adapted from Malhotra (2007, p.143)
In this regard, Malhotra (2007) draws an analogy between qualitative/quantitative research and
exploratory/conclusive research. It is suggested that qualitative research provides with insights
of examined problem seeking for answers to questions why and how certain phenomenon takes
place (Denzin & Lincoln, 2005); additionally, occasionally this type of research is employed to
explain results of quantitative research enabling scholars to obtain deep understanding of
investigated phenomenon (Zikmund, 1997). To escape misusing and misinterpretation of
findings of qualitative research, qualitative research should not be generalized and considered as
conclusive in nature for further recommendation of final decision making. Controversially, the
aim of quantitative research is to develop theories or hypothesis regarding certain phenomenon
by quantifying data that requires a large size of sample. In this regard, quantitative primary data
is examined by applying statistical analysis, whereas, numbers enable the researches to avoid
bias. Results of quantitative research are conclusive in nature and can be generalized by applying
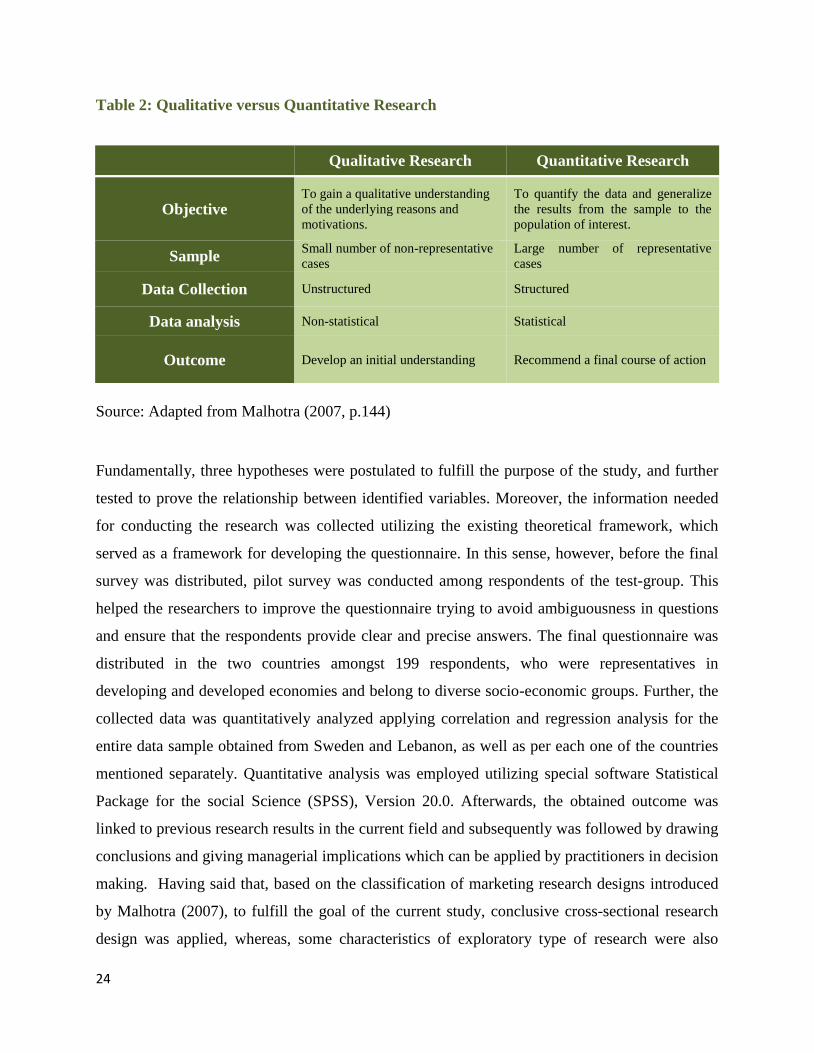
to larger size of population (Malhotra, 2007). In this notion, the summarized differences between
quantitative and qualitative research are presented in Table 2.
Marketing Research Data
Primary Data
Qualitative Data
Quantitative Data
Secondary Data
24
Table 2: Qualitative versus Quantitative Research
Source: Adapted from Malhotra (2007, p.144)
Fundamentally, three hypotheses were postulated to fulfill the purpose of the study, and further
tested to prove the relationship between identified variables. Moreover, the information needed
for conducting the research was collected utilizing the existing theoretical framework, which
served as a framework for developing the questionnaire. In this sense, however, before the final
survey was distributed, pilot survey was conducted among respondents of the test-group. This
helped the researchers to improve the questionnaire trying to avoid ambiguousness in questions
and ensure that the respondents provide clear and precise answers. The final questionnaire was
distributed in the two countries amongst 199 respondents, who were representatives in
developing and developed economies and belong to diverse socio-economic groups. Further, the
collected data was quantitatively analyzed applying correlation and regression analysis for the
entire data sample obtained from Sweden and Lebanon, as well as per each one of the countries
mentioned separately. Quantitative analysis was employed utilizing special software Statistical
Package for the social Science (SPSS), Version 20.0. Afterwards, the obtained outcome was
linked to previous research results in the current field and subsequently was followed by drawing
conclusions and giving managerial implications which can be applied by practitioners in decision
making. Having said that, based on the classification of marketing research designs introduced
by Malhotra (2007), to fulfill the goal of the current study, conclusive cross-sectional research
design was applied, whereas, some characteristics of exploratory type of research were also
Qualitative Research Quantitative Research
Objective To gain a qualitative understanding
of the underlying reasons and
motivations.
To quantify the data and generalize
the results from the sample to the
population of interest.
Sample Small number of non-representative
cases
Large number of representative
cases
Data Collection Unstructured Structured
Data analysis Non-statistical Statistical
Outcome Develop an initial understanding Recommend a final course of action
25
observed. Following Zikmund (1997) each conclusive research comprises features of exploratory
one, like designing a pilot version of survey instrument and analyzing existing studies/theories to
sharpen the concept and narrow down the aim of the study. Moreover, comparative study was
also applied to find similarities and differences in customer behavior in two different national
contexts. Subsequently, the justification and explanation of chosen research design will be
discussed in following chapters.
3.2.Approach
Depending on the method of establishing relationship between theory and empirical evidence
there are two widely used research approaches which are considered by scientists in attempt to
explain empirical findings, namely Induction and Deduction (Capaldi & Proctor, 2008).
Inductive approach is applied when researchers execute a specific observations of reality adduce
patterns and set up tentative hypothesis which is followed by broad generalization and creating a
theory (Bryman & Bell, 2007). On the other hand, deductive approach is an opposite method to
inductive and applied approach, whereas, when a researcher bases his study on existing theories
establishes a logical relationship between concepts by developing hypothesis and then to
concrete empirical evidence (Neuman, 1997); afterwards the assumed hypothesis are tested
enabling scientists to verify whether the theory is in consistent with the reality. Having said that,
this study was conducted using a deductive approach, whereas, the researcher formulated
theoretical framework and developed hypothesis, which later on were tested based on empirical
evidence; furthermore, the research findings were compared to the existing literature to draw
conclusions and suggestions for further research.
3.3.Instrument and measurement
To fulfill the purpose of this study, a survey research method was applied as appropriate tool to
collect primary data. This technique allows the researchers to obtain respondent’s opinion,
attitude and describe their behavioral patterns (Zikmund, 1997). Basically, an additional
advantage of survey research lies in the possibility of obtaining accurate and quick primary data
while covering large number of respondents (Zikmund, 1997). Further, the questionnaire was
constructed to reflect the research hypothesis and perceive customer feelings related to the
overall satisfaction with their bank service, also customer’s expectations from service provider in
26
case of service failure and customer behavior pattern in response on effective/poor complaint
handling management. Before the final questionnaire was applied, the researchers had designed a
pilot survey instrument and administrated among respondents of test-group to test it for
ambiguities and comprehension. Afterwards, various changes and improvements were
incorporated which was followed by employing coefficient Cronbach’s alpha to ensure internal
consistency reliability of items in the scale. In this regard, value of coefficient alpha has
consisted 0.788, which indicates high internal consistency of items and thus reliability of used
measurement. Thereby, the questionnaire is consisted of four parts, respectively, the first section
brought customers to recall the possible unsatisfactory purchase experience and reflect their
feelings and expectations in dealing with their service provider; whereas, the second part was
oriented to banking strategy in handling the service problems, simultaneously, the third section is
related to customer’s reaction and intention in response to the bank efforts in managing customer
complaints; and finally, the last section entails questions regarding the demographic
characteristics (age, gender) and length of relationship with the bank. Demographic information
was used to identify whether male’s customer behavior, intention and attitude on the subject are
the same as that of females and whether respondents in different ages differ in their responses.
Within this framework, a five point Likert scale was applied to measure customer satisfaction,
complaint handling management and customer loyalty aspects varying from “strongly agree” to
“strongly disagree”. A Likert scale is considered as balanced rating scale with odd number of
categories (Malhotra, 2007). Traditional guidelines suggest employing scale with odd number of
categories to avoid obtaining neutral or indifferent responses from the respondents, where the
number of categories should be between 5 and 9 (about seven plus/minus two)(Malhotra, 2007).
Moreover, one of the advantages of using a Liker scale lies in its simplicity of interpretation.
More specifically, it is easy to construct and administrate by researchers, while respondents
easily understand and comprehend how it should be used regardless whether the survey is
conducted by phone, e-mail or face-to face interview.
In order to ensure the reliability of the collected data the control question was put into
questionnaire to escape falsified responses due to inadvertency of the respondents. If statements
that my bank meets customer expectations as well as takes adequate time to respond to a lodged
complaints reflect respondent’s agreement and at the same time express agreement on statement
27
that my bank doesn’t notice the complaint made by customers, means that respondent contradict
him/herself and does not go through questionnaire attentively.
3.4.Data collection
Subsequently, 199 data samples were collected in University of Gavle, Gavle, Sweden and in the
Lebanese American University, Beirut, Lebanon. In this regard, the larger the sample sizes, the
more reflective and representative the results are, yet, there is no golden rule to determine how
large should it be; although in quantitative methods the minimum number is 30 for each group of
respondents (Zikmund, 1997). To ensure that primary data embraces various demographic and
socio-economic groups, the sampled population in Lebanon and Sweden was approached at a
business event, where attendees were representing diverse group of employees, students,
business owners and entrepreneurs, both male and female. In this regard, Dr. Bassem Mamaari, a
lecturer at the Department of Management in the Lebanese American University has facilitated
the process and contributed to this study by collecting the data from Lebanon and giving
valuable opinion from the Lebanese perspective. Furthermore, to collect reliable data,
questionnaires were distributed personally and respondents were instructed face-to-face if some
questions were found to be vague in order to escape misunderstanding and misinterpretations.
This method helped the study in three major ways, first, it ensured that the answers were not
being filled in randomly and, second, it allowed the scholars to explain each and every question
to the respondents in person to ensure their understanding of the questions and guarantee a valid
answer, particularly, since the study is conducted in English in two countries where English is
not the first language, and third, it allowed the scholars to communicate on a personal level with
the respondents and receive immediate feedback. Despite of all these advantages to the oral
questionnaire technique, the negative aspect of this it that it requires extra time, which explains
the number of sample in the study, (n=199). Survey is considered as an efficient and reliable
technic of data collection if the questions are asked and answered at the convenience of
representative sample of individuals; hence, attendees were approached and asked about their
agreement to participate in survey and those who gave approval were provided with the
questionnaire.
28
3.5.Data analysis
After having collected the data, the questionnaires were verified whether all questions are
answered and whether the control question indicates respondent’s diligence. Further, information
from the customer’s survey (demographic characteristics, length time of relationship with bank,
data reflecting customer satisfaction, customer behavior and bank’s complaint management) was
entered into special software Statistical Package for the social Science, version 20.0 and further
analyzed. Subsequently, the information from the survey was assessed and further interpreted in
the following sequence. Firstly, to compare responses customer survey was descriptively
analyzed using frequencies and percentages. Further, correlation analysis and Pearson’s
coefficient were applied to examine relationship and level of liaison between variables.
Afterwards, linear regression analysis was applied in order to identify predictors of customer
loyalty and customer satisfaction. In this regard, to prove the first hypothesis complaint handling
was determined as an independent variable, whereas customer loyalty was identified as
dependent variable. Thereby, to examine second hypothesis, effective complaint handling was
detected as independent variable, meanwhile customer satisfaction was assigned as dependent
variable. For testing third hypothesis, customer satisfaction was considered as a predictor,
whereas, customer loyalty was assigned as dependent variable. In this sense, correlation and
regression analysis were applied for the whole sample size from both countries, and afterwards
responses from each country were analyzed separately. Explanation of nature of two
aforementioned statistical analyses is discussed below.
3.5.1. Correlation analysis
Correlation analysis is a procedure to identify linear relationship between two variables, for
instance, X and Y. More precisely, it looks to determine the existence of straight–line
relationships between the variables indicating the level of variation in X in relevance to the
variation in Y. This analysis was introduced by Karl Pearson; statistical indicator used in
correlation analysis and is named after Karl Pearson as Pearson correlation coefficient. That said,
the coefficient of correlation (r) is used to inspect the strength of the relation between variables,
whereas, the value of the r varies between -1 to 1. In this regard, if the value of coefficient is
positive means the relationship between the identified variables is moving in the same direction,
whereas the negative value of the coefficient indicates opposite relationships. Furthermore, when
29
the value of coefficient is equal to 1 it indicates a perfect positive relation, meanwhile, if the
value of coefficient is somewhere between 0.6 – 1 it designates a strong positive correlation, and
when it varieties between 0.3-0.6 it indicates a moderate relationship (Malhotra, 2007; Zikmund,
1997).
3.5.2. Regression analysis
Regression analysis a statistical tool used to analyze the relationship between one dependent and
one or more independent variables to examine the following issues: a) to determine whether the
independent variable, or predictor, explains any variations in the dependent variables; b) to
inspect the strength of the relationship between the variables, thereby determining to what extent
the predictor influences the variation in the dependent variable. Moreover, it is worth noting that
the establishment of the relationship between dependent and independent variables in case of
regression analysis does not imply causation. More precisely, regression analysis deals with
extent and nature of association between the examined variables and does not imply causal
relationships between them. In this regard, primary measure of regression is ‘’R’’, the value of R
indicates how precise the predictor is in predicting the results, in another context, how strong is
the relationship between the identified variables. Another output of regression is ‘’R2’’, R
2
provides the researcher a more accurate measure and it describes the extent of variance in the
scores explained by the independent variable or the predicator. The value of R2 ranges between 0
and 1, and is not subjected to any golden rule, the researcher is given the liberty to interpret the
value of R2
based on the relationship studied (Malhotra, 2007; Zikmund, 1997).
3.6.Reliability and Validity
3.6.1. Reliability
To ensure the accuracy of the measurement used in the study several approaches of assessing
reliability were considered. Reliability refers to the "consistency" and "repeatability" of research
measures, which means to what extent the measurements are free from error, whereas, by
consistent we imply whether the scale generate steady results if the same repeated measurement
is applied (Malhotra, 2007; Zikmund, 1997). In this notion, such measuring instrument as
questioner has to include reliable questions which would produce precise answers from
30
respondents. That said, for instance, putting in scale such options as “often” or “seldom” is
unlikely to provide with reliable answers as perception of frequency and rarity is different for
different people. The goal of achieving reliability of data should be developing measuring
instrument which would generate the same results each time the analysis is applied, if a scholar
conducts a research on the same subject repeatedly. High association between scores, which
were gathered through different administrations of the same scale, means that the measuring
instrument is reliable and scale comprises consistent results (Zikmund, 1997). Following
(Malhotra, 2007) there are three approaches for evaluation of reliability:
Test – Retest Reliability
Alternative – Forms Reliability
Internal Consistency Reliability
Test-retest reliability implies administrating the same example of scales between respondents in
different time interval, usually in two or four weeks, ensuring that conditions of measuring
process are approximately the same. In order to identify similarities in replies, correlations
coefficient is applied; the higher value of correlation coefficient explains higher measurement of
reliability. In this regard, there are number of disadvantages of this type of the test, among those
are the follows: respondents may remember replies from the first time and are likely to provide
the same answers; due to obtaining favorable information about measured object within time
interval between measuring processes respondents’ attitude and hence answers are likely to be
different; in certain cases time can be sensitive aspect and thus prevent to apply this test of
reliability (Malhotra, 2007).
Alternative – Forms Reliability implies developing of two different forms of scales which
measure the same object and are equal in terms of content; in this case, respondents are measured
in two different time interval, between two to four weeks by two different sets of scale items. In
order to evaluate reliability using this test, correlation coefficient is also applied. In this notion,
disadvantage of this approach is that it is timing consuming and additionally it is quite difficult to
develop two equivalent forms of the scale in respect to the content (Zikmund, 1997).
31
The last one, which is internal consistency reliability, is applied to evaluate internal consistency
of items in scale through summing several items in order to form an entire score for the whole
scale. For applying this assessment approach usually Cronbach’s alpha coefficient is used. In this
regard, value of coefficient alpha varies from 0 to 1, where magnitude above 0,6 indicates high
internal consistency of items and thus reliability. It is worth noting that value of Cronbach’s
alpha tends to be higher with increasing numbers of scale items and such a way the magnitudes
of the coefficient can artificially and inappropriately raised (Malhotra, 2007).
To this end, in our study, internal consistency reliability approach and coefficient alpha were
applied to ensure that internal consistency and reliability of used measurement. Test-retest and
alternative forms reliability approaches were rejected due to disadvantages that are related to
time consumption, large sample size (N=199), difficulties to conduct survey in two countries
twice.
3.6.2. Validity
The term validity refers to measuring the instrument’s ability to measure what is elected to be
measured (Zikmund, 1997). In this regard, researchers are supposed to ensure the validity of the
measurement applied, whether it will actually calculate what is intended to measure and whether
it will help to reach the set goal. There are two types of validity: internal and external validity.
Internal validity relates to the process that ensures whether the statements used in questionnaire
are in parallel with research objective and whether the conclusions obtained after analyzing the
data will be relevant to the purpose of the study. Therefore, questionnaire was developed based
on the framework and methods that are effectively leveraged by previous researches related to
the field of research. Additionally, pilot survey was administrated among respondents of test-
group to ensure clarity of the questions and to avoid using ambiguous statements, which
consequently contributed to a greater opportunity of developing a valid questionnaire.
Furthermore, while statistical data analysis of the study construct validity will be established; this
approach implies verifying the empirical evidence with theoretical logic regarding the
investigated concept (Bryman & Bell, 2007).
32
Conversely, an external validity refers to the term ‘generalizing’ which means to what extent the
findings of the research can be applied to other people in other places in different times (Trochim
& Donnelly, 2007). Having said that, the external validity of the current study is considered as a
high one, because the respondents were selected applying random procedure; moreover, the
respondents were representatives of developing and developed countries and inhabitants of a
capital city and a town. In this sense, to embrace representatives from various demographic and
socio-economic groups, the sampled population in Lebanon and Sweden was approached at a
business event, where attendees were representing diverse group of employees, students,
business owners and entrepreneurs, both male and female. However, as the respondents of the
research were mainly well-educated people, external validity concerning people aspect suggested
by (Trochim & Donnelly, 2007) is limited, which means that findings of the research explains
customer behavior only within educated students.
It is worth noting, that reliability of measuring instrument is an essential aspect of the overall
validity. However, reliability per se is not a sufficient attribute and significantly interrelated with
validity. Giving these dynamics, validity cannot be obtained without having reliable
measurement (Zikmund, 1997; Malhotra, 2007).
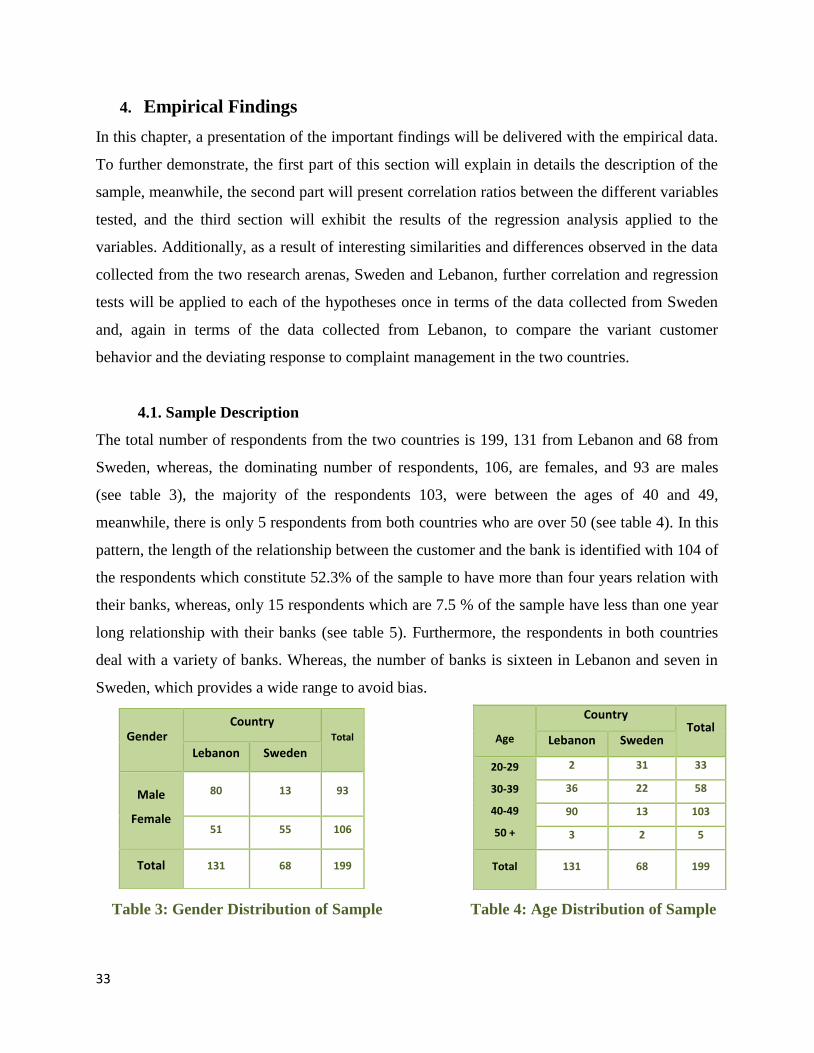
33
4. Empirical Findings
In this chapter, a presentation of the important findings will be delivered with the empirical data.
To further demonstrate, the first part of this section will explain in details the description of the
sample, meanwhile, the second part will present correlation ratios between the different variables
tested, and the third section will exhibit the results of the regression analysis applied to the
variables. Additionally, as a result of interesting similarities and differences observed in the data
collected from the two research arenas, Sweden and Lebanon, further correlation and regression
tests will be applied to each of the hypotheses once in terms of the data collected from Sweden
and, again in terms of the data collected from Lebanon, to compare the variant customer
behavior and the deviating response to complaint management in the two countries.
4.1. Sample Description
The total number of respondents from the two countries is 199, 131 from Lebanon and 68 from
Sweden, whereas, the dominating number of respondents, 106, are females, and 93 are males
(see table 3), the majority of the respondents 103, were between the ages of 40 and 49,
meanwhile, there is only 5 respondents from both countries who are over 50 (see table 4). In this
pattern, the length of the relationship between the customer and the bank is identified with 104 of
the respondents which constitute 52.3% of the sample to have more than four years relation with
their banks, whereas, only 15 respondents which are 7.5 % of the sample have less than one year
long relationship with their banks (see table 5). Furthermore, the respondents in both countries
deal with a variety of banks. Whereas, the number of banks is sixteen in Lebanon and seven in
Sweden, which provides a wide range to avoid bias.
Table 3: Gender Distribution of Sample Table 4: Age Distribution of Sample
Gender
Country Total
Lebanon Sweden
Male
Female
80 13 93
51 55 106
Total 131 68 199
Age
Country Total
Lebanon Sweden
20-29
30-39
40-49
50 +
2 31 33
36 22 58
90 13 103
3 2 5
Total 131 68 199
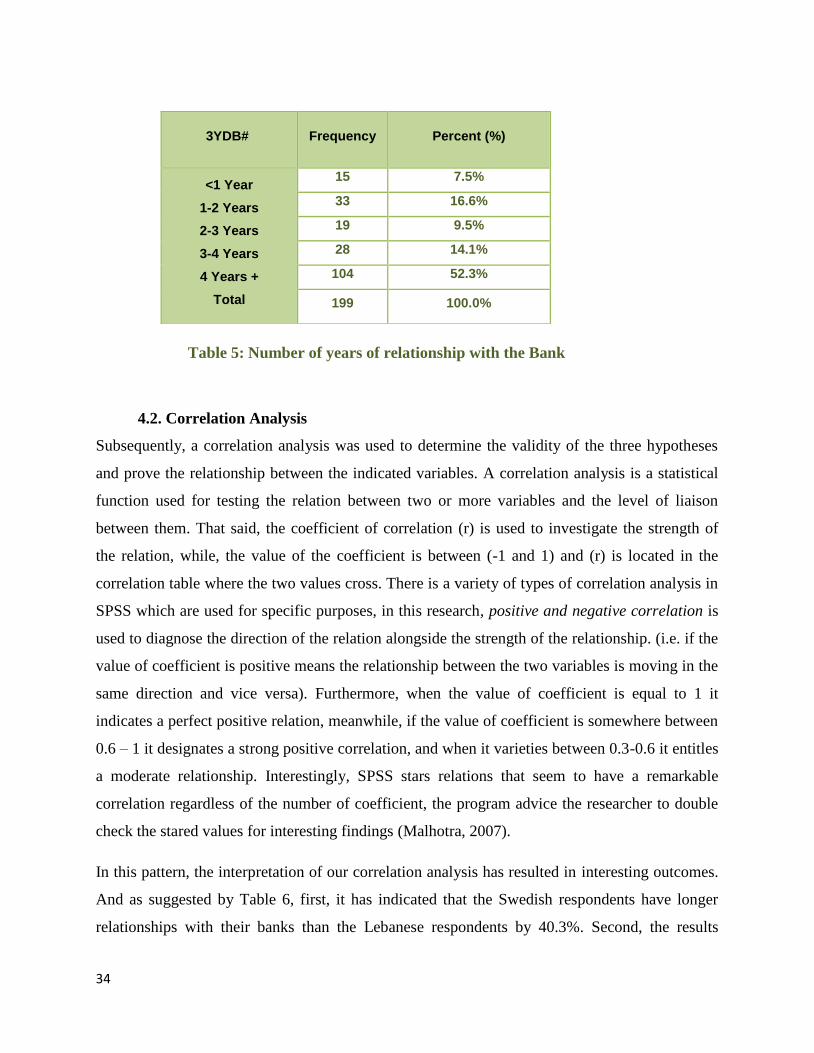
34
Table 5: Number of years of relationship with the Bank
4.2. Correlation Analysis
Subsequently, a correlation analysis was used to determine the validity of the three hypotheses
and prove the relationship between the indicated variables. A correlation analysis is a statistical
function used for testing the relation between two or more variables and the level of liaison
between them. That said, the coefficient of correlation (r) is used to investigate the strength of
the relation, while, the value of the coefficient is between (-1 and 1) and (r) is located in the
correlation table where the two values cross. There is a variety of types of correlation analysis in
SPSS which are used for specific purposes, in this research, positive and negative correlation is
used to diagnose the direction of the relation alongside the strength of the relationship. (i.e. if the
value of coefficient is positive means the relationship between the two variables is moving in the
same direction and vice versa). Furthermore, when the value of coefficient is equal to 1 it
indicates a perfect positive relation, meanwhile, if the value of coefficient is somewhere between
0.6 – 1 it designates a strong positive correlation, and when it varieties between 0.3-0.6 it entitles
a moderate relationship. Interestingly, SPSS stars relations that seem to have a remarkable
correlation regardless of the number of coefficient, the program advice the researcher to double
check the stared values for interesting findings (Malhotra, 2007).
In this pattern, the interpretation of our correlation analysis has resulted in interesting outcomes.
And as suggested by Table 6, first, it has indicated that the Swedish respondents have longer
relationships with their banks than the Lebanese respondents by 40.3%. Second, the results
3YDB# Frequency Percent (%)
<1 Year
1-2 Years
2-3 Years
3-4 Years
4 Years +
Total
15 7.5%
33 16.6%
19 9.5%
28 14.1%
104 52.3%
199 100.0%
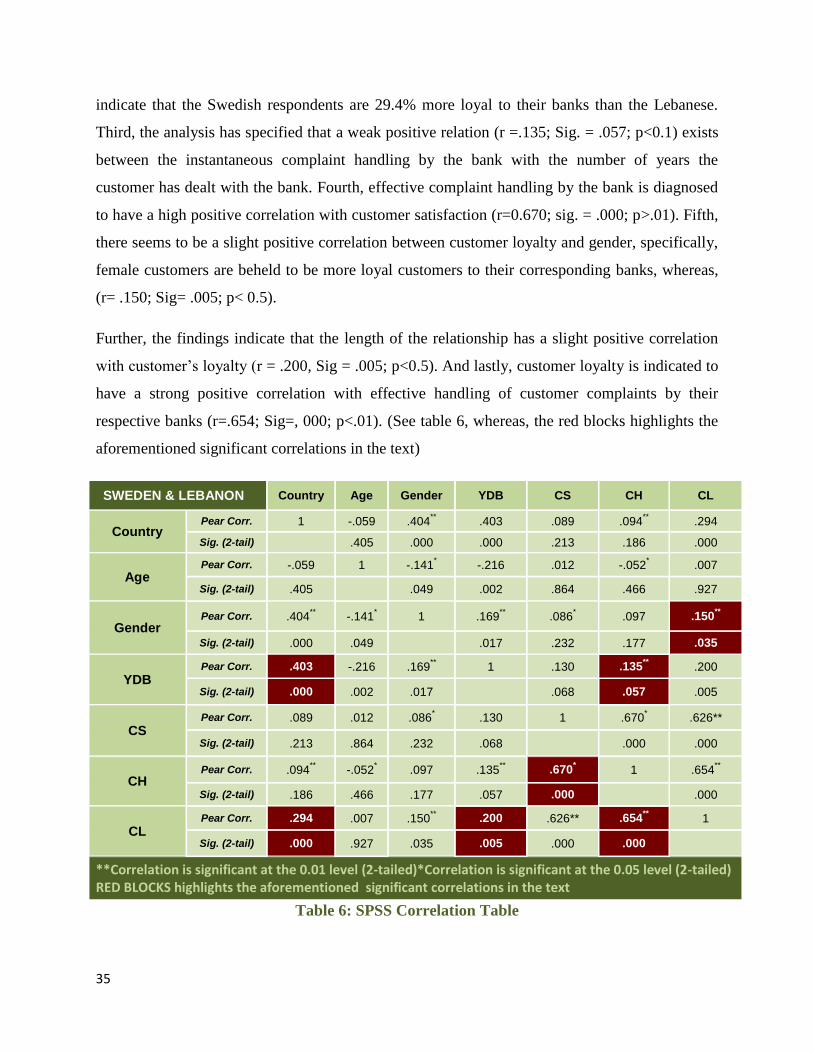
35
indicate that the Swedish respondents are 29.4% more loyal to their banks than the Lebanese.
Third, the analysis has specified that a weak positive relation (r =.135; Sig. = .057; p<0.1) exists
between the instantaneous complaint handling by the bank with the number of years the
customer has dealt with the bank. Fourth, effective complaint handling by the bank is diagnosed
to have a high positive correlation with customer satisfaction (r=0.670; sig. = .000; p>.01). Fifth,
there seems to be a slight positive correlation between customer loyalty and gender, specifically,
female customers are beheld to be more loyal customers to their corresponding banks, whereas,
(r= .150; Sig= .005; p< 0.5).
Further, the findings indicate that the length of the relationship has a slight positive correlation
with customer’s loyalty (r = .200, Sig = .005; p<0.5). And lastly, customer loyalty is indicated to
have a strong positive correlation with effective handling of customer complaints by their
respective banks (r=.654; Sig=, 000; p<.01). (See table 6, whereas, the red blocks highlights the
aforementioned significant correlations in the text)
SWEDEN & LEBANON Country Age Gender YDB CS CH CL
Country Pear Corr. 1 -.059 .404
** .403 .089 .094
** .294
Sig. (2-tail) .405 .000 .000 .213 .186 .000
Age Pear Corr. -.059 1 -.141
* -.216 .012 -.052
* .007
Sig. (2-tail) .405 .049 .002 .864 .466 .927
Gender Pear Corr. .404
** -.141
* 1 .169
** .086
* .097 .150
**
Sig. (2-tail) .000 .049 .017 .232 .177 .035
YDB Pear Corr. .403 -.216 .169
** 1 .130 .135
** .200
Sig. (2-tail) .000 .002 .017 .068 .057 .005
CS Pear Corr. .089 .012 .086
* .130 1 .670
* .626**
Sig. (2-tail) .213 .864 .232 .068 .000 .000
CH Pear Corr. .094
** -.052
* .097 .135
** .670
* 1 .654
**
Sig. (2-tail) .186 .466 .177 .057 .000 .000
CL Pear Corr. .294 .007 .150
** .200 .626** .654
** 1
Sig. (2-tail) .000 .927 .035 .005 .000 .000
**Correlation is significant at the 0.01 level (2-tailed)*Correlation is significant at the 0.05 level (2-tailed) RED BLOCKS highlights the aforementioned significant correlations in the text
Table 6: SPSS Correlation Table
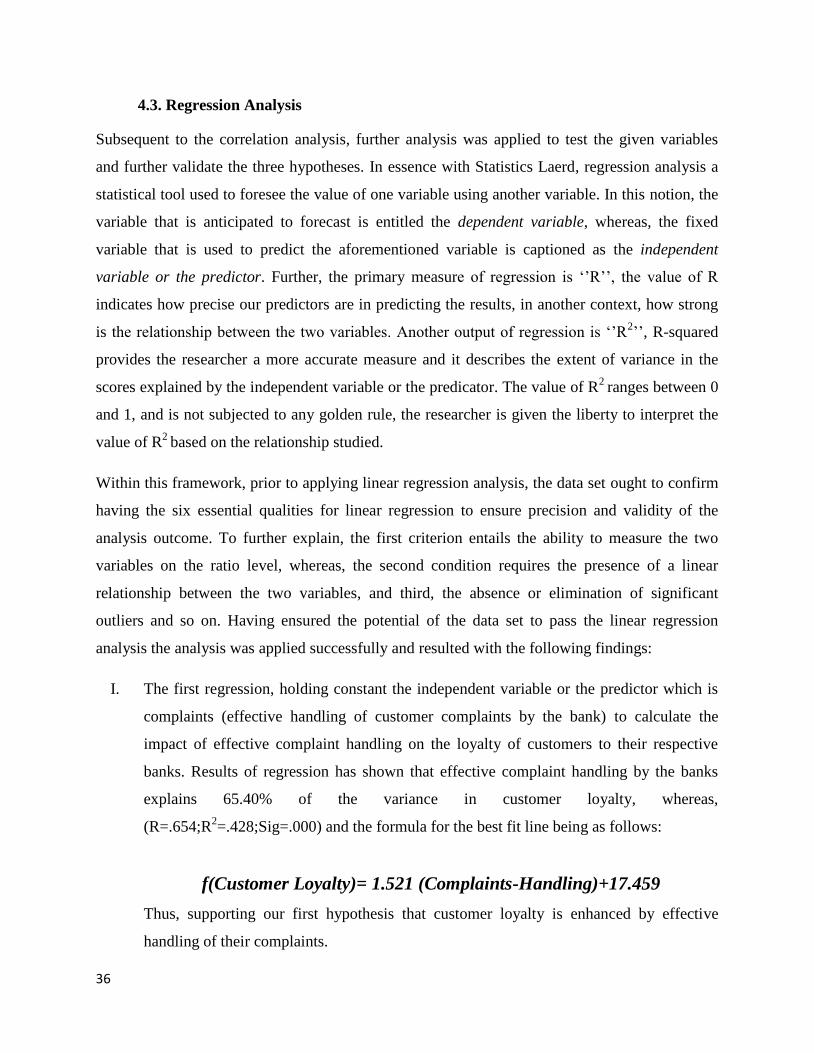
36
4.3. Regression Analysis
Subsequent to the correlation analysis, further analysis was applied to test the given variables
and further validate the three hypotheses. In essence with Statistics Laerd, regression analysis a
statistical tool used to foresee the value of one variable using another variable. In this notion, the
variable that is anticipated to forecast is entitled the dependent variable, whereas, the fixed
variable that is used to predict the aforementioned variable is captioned as the independent
variable or the predictor. Further, the primary measure of regression is ‘’R’’, the value of R
indicates how precise our predictors are in predicting the results, in another context, how strong
is the relationship between the two variables. Another output of regression is ‘’R2’’, R-squared
provides the researcher a more accurate measure and it describes the extent of variance in the
scores explained by the independent variable or the predicator. The value of R2
ranges between 0
and 1, and is not subjected to any golden rule, the researcher is given the liberty to interpret the
value of R2
based on the relationship studied.
Within this framework, prior to applying linear regression analysis, the data set ought to confirm
having the six essential qualities for linear regression to ensure precision and validity of the
analysis outcome. To further explain, the first criterion entails the ability to measure the two
variables on the ratio level, whereas, the second condition requires the presence of a linear
relationship between the two variables, and third, the absence or elimination of significant
outliers and so on. Having ensured the potential of the data set to pass the linear regression
analysis the analysis was applied successfully and resulted with the following findings:
I. The first regression, holding constant the independent variable or the predictor which is
complaints (effective handling of customer complaints by the bank) to calculate the
impact of effective complaint handling on the loyalty of customers to their respective
banks. Results of regression has shown that effective complaint handling by the banks
explains 65.40% of the variance in customer loyalty, whereas,
(R=.654;R2=.428;Sig=.000) and the formula for the best fit line being as follows:
f(Customer Loyalty)= 1.521 (Complaints-Handling)+17.459
Thus, supporting our first hypothesis that customer loyalty is enhanced by effective
handling of their complaints.
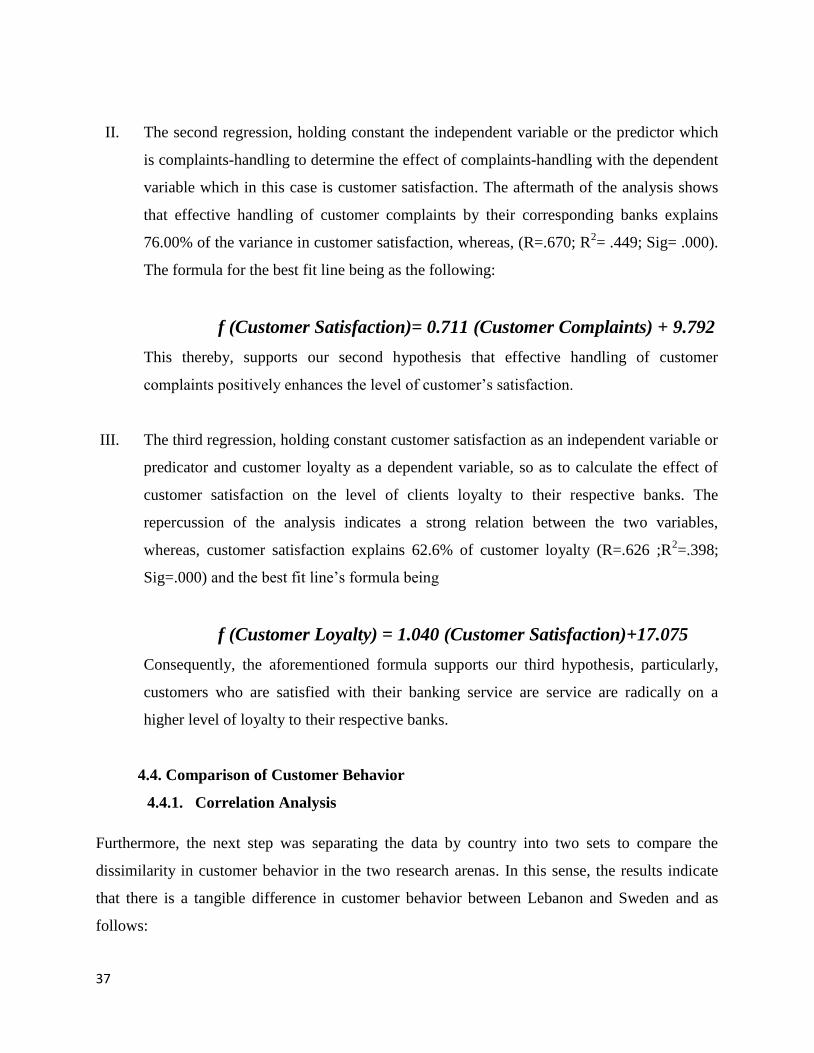
37
II. The second regression, holding constant the independent variable or the predictor which
is complaints-handling to determine the effect of complaints-handling with the dependent
variable which in this case is customer satisfaction. The aftermath of the analysis shows
that effective handling of customer complaints by their corresponding banks explains
76.00% of the variance in customer satisfaction, whereas, (R=.670; R2= .449; Sig= .000).
The formula for the best fit line being as the following:
f (Customer Satisfaction)= 0.711 (Customer Complaints) + 9.792
This thereby, supports our second hypothesis that effective handling of customer
complaints positively enhances the level of customer’s satisfaction.
III. The third regression, holding constant customer satisfaction as an independent variable or
predicator and customer loyalty as a dependent variable, so as to calculate the effect of
customer satisfaction on the level of clients loyalty to their respective banks. The
repercussion of the analysis indicates a strong relation between the two variables,
whereas, customer satisfaction explains 62.6% of customer loyalty (R=.626 ;R2=.398;
Sig=.000) and the best fit line’s formula being
f (Customer Loyalty) = 1.040 (Customer Satisfaction)+17.075
Consequently, the aforementioned formula supports our third hypothesis, particularly,
customers who are satisfied with their banking service are service are radically on a
higher level of loyalty to their respective banks.
4.4. Comparison of Customer Behavior
4.4.1. Correlation Analysis
Furthermore, the next step was separating the data by country into two sets to compare the
dissimilarity in customer behavior in the two research arenas. In this sense, the results indicate
that there is a tangible difference in customer behavior between Lebanon and Sweden and as
follows:
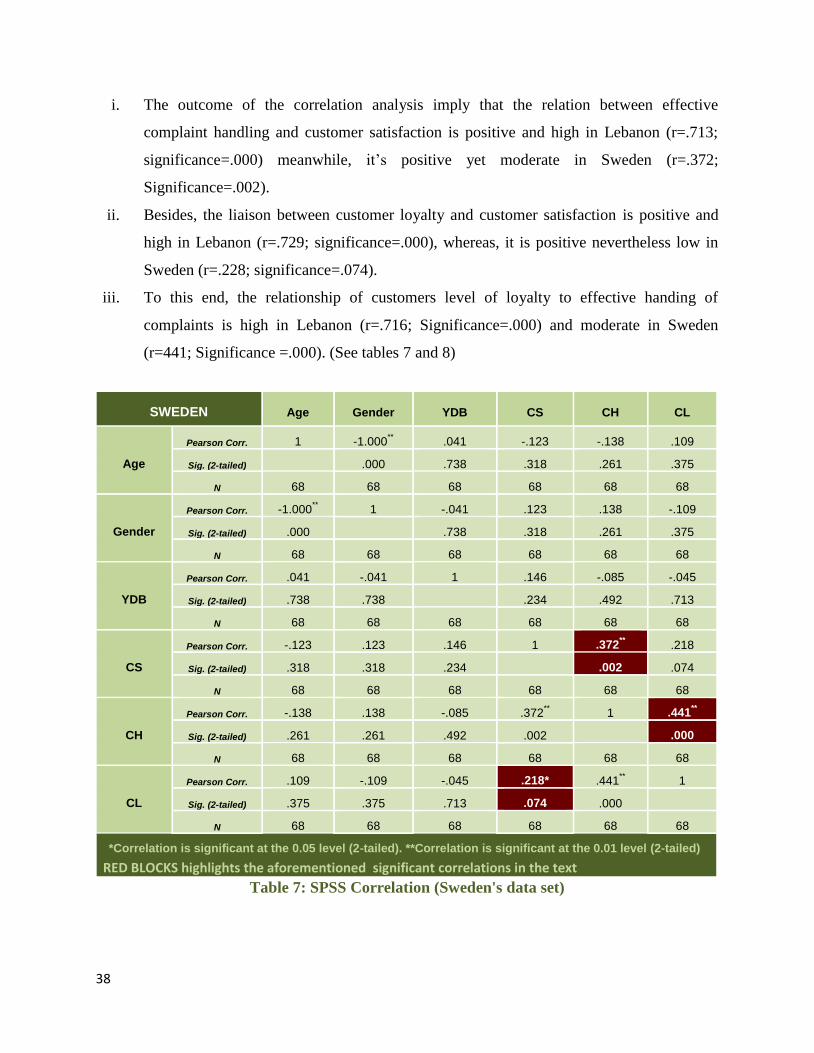
38
i. The outcome of the correlation analysis imply that the relation between effective
complaint handling and customer satisfaction is positive and high in Lebanon (r=.713;
significance=.000) meanwhile, it’s positive yet moderate in Sweden (r=.372;
Significance=.002).
ii. Besides, the liaison between customer loyalty and customer satisfaction is positive and
high in Lebanon (r=.729; significance=.000), whereas, it is positive nevertheless low in
Sweden (r=.228; significance=.074).
iii. To this end, the relationship of customers level of loyalty to effective handing of
complaints is high in Lebanon (r=.716; Significance=.000) and moderate in Sweden
(r=441; Significance =.000). (See tables 7 and 8)
Table 7: SPSS Correlation (Sweden's data set)
SWEDEN Age Gender YDB CS CH CL
Age
Pearson Corr. 1 -1.000** .041 -.123 -.138 .109
Sig. (2-tailed) .000 .738 .318 .261 .375
N 68 68 68 68 68 68
Gender
Pearson Corr. -1.000** 1 -.041 .123 .138 -.109
Sig. (2-tailed) .000 .738 .318 .261 .375
N 68 68 68 68 68 68
YDB
Pearson Corr. .041 -.041 1 .146 -.085 -.045
Sig. (2-tailed) .738 .738 .234 .492 .713
N 68 68 68 68 68 68
CS
Pearson Corr. -.123 .123 .146 1 .372** .218
Sig. (2-tailed) .318 .318 .234 .002 .074
N 68 68 68 68 68 68
CH
Pearson Corr. -.138 .138 -.085 .372** 1 .441
**
Sig. (2-tailed) .261 .261 .492 .002 .000
N 68 68 68 68 68 68
CL
Pearson Corr. .109 -.109 -.045 .218* .441** 1
Sig. (2-tailed) .375 .375 .713 .074 .000
N 68 68 68 68 68 68
*Correlation is significant at the 0.05 level (2-tailed). **Correlation is significant at the 0.01 level (2-tailed)
RED BLOCKS highlights the aforementioned significant correlations in the text
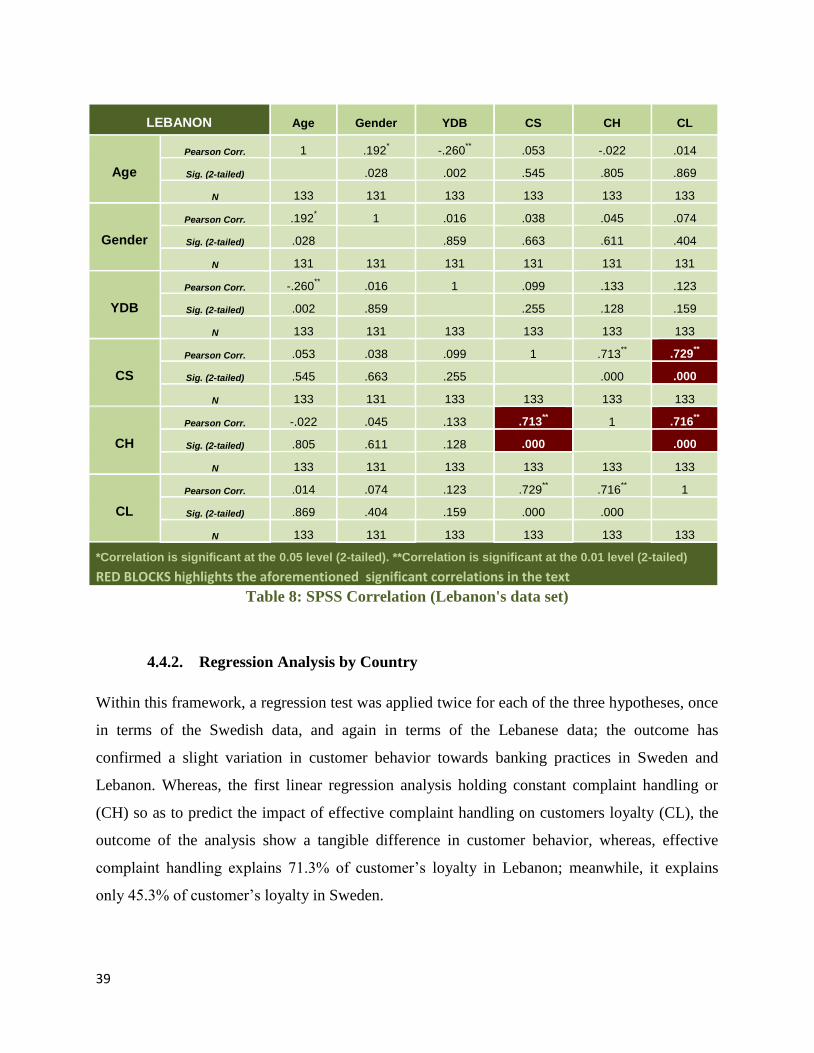
39
Table 8: SPSS Correlation (Lebanon's data set)
4.4.2. Regression Analysis by Country
Within this framework, a regression test was applied twice for each of the three hypotheses, once
in terms of the Swedish data, and again in terms of the Lebanese data; the outcome has
confirmed a slight variation in customer behavior towards banking practices in Sweden and
Lebanon. Whereas, the first linear regression analysis holding constant complaint handling or
(CH) so as to predict the impact of effective complaint handling on customers loyalty (CL), the
outcome of the analysis show a tangible difference in customer behavior, whereas, effective
complaint handling explains 71.3% of customer’s loyalty in Lebanon; meanwhile, it explains
only 45.3% of customer’s loyalty in Sweden.
LEBANON Age Gender YDB CS CH CL
Age
Pearson Corr. 1 .192* -.260
** .053 -.022 .014
Sig. (2-tailed) .028 .002 .545 .805 .869
N 133 131 133 133 133 133
Gender
Pearson Corr. .192* 1 .016 .038 .045 .074
Sig. (2-tailed) .028 .859 .663 .611 .404
N 131 131 131 131 131 131
YDB
Pearson Corr. -.260** .016 1 .099 .133 .123
Sig. (2-tailed) .002 .859 .255 .128 .159
N 133 131 133 133 133 133
CS
Pearson Corr. .053 .038 .099 1 .713** .729
**
Sig. (2-tailed) .545 .663 .255 .000 .000
N 133 131 133 133 133 133
CH
Pearson Corr. -.022 .045 .133 .713** 1 .716
**
Sig. (2-tailed) .805 .611 .128 .000 .000
N 133 131 133 133 133 133
CL
Pearson Corr. .014 .074 .123 .729** .716
** 1
Sig. (2-tailed) .869 .404 .159 .000 .000
N 133 131 133 133 133 133
*Correlation is significant at the 0.05 level (2-tailed). **Correlation is significant at the 0.01 level (2-tailed)
RED BLOCKS highlights the aforementioned significant correlations in the text
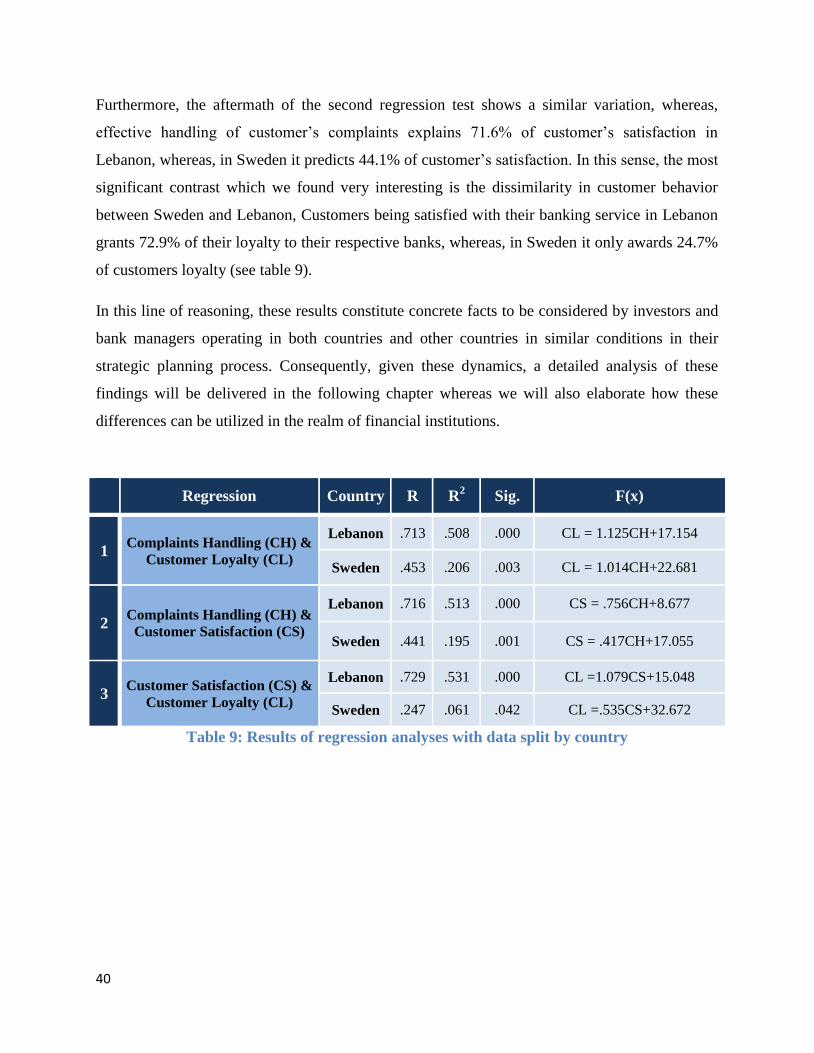
40
Furthermore, the aftermath of the second regression test shows a similar variation, whereas,
effective handling of customer’s complaints explains 71.6% of customer’s satisfaction in
Lebanon, whereas, in Sweden it predicts 44.1% of customer’s satisfaction. In this sense, the most
significant contrast which we found very interesting is the dissimilarity in customer behavior
between Sweden and Lebanon, Customers being satisfied with their banking service in Lebanon
grants 72.9% of their loyalty to their respective banks, whereas, in Sweden it only awards 24.7%
of customers loyalty (see table 9).
In this line of reasoning, these results constitute concrete facts to be considered by investors and
bank managers operating in both countries and other countries in similar conditions in their
strategic planning process. Consequently, given these dynamics, a detailed analysis of these
findings will be delivered in the following chapter whereas we will also elaborate how these
differences can be utilized in the realm of financial institutions.
Table 9: Results of regression analyses with data split by country
Regression Country R R
2 Sig. F(x)
1 Complaints Handling (CH) &
Customer Loyalty (CL)
Lebanon .713 .508 .000 CL = 1.125CH+17.154
Sweden .453 .206 .003 CL = 1.014CH+22.681
2 Complaints Handling (CH) &
Customer Satisfaction (CS)
Lebanon .716 .513 .000 CS = .756CH+8.677
Sweden .441 .195 .001 CS = .417CH+17.055
3 Customer Satisfaction (CS) &
Customer Loyalty (CL)
Lebanon .729 .531 .000 CL =1.079CS+15.048
Sweden .247 .061 .042 CL =.535CS+32.672
41
5. Analysis and Discussion
This part of the research will feature a detailed examination of the sample description, the
findings, and ultimately emphasize the variant response in customer response to complaint
management in Sweden and Lebanon.
5.1. Examination of Sample Selection and Sample Distribution
In this configuration, subsequent to having the data subjected to several types of analysis and
having demonstrated the results, this section elaborates accumulation and validation of the
outcome by relating the results of this research to findings of previous research, in addition to the
author’s perspective. Whereas, in order to facilitate the process to the reader. This section will
be in the chronological sequence of events starting by sample selection and data collection and
ending with the final outcomes, their significance, and impact.
Given these dynamics, in order to avoid bias and to harvest more reliable findings we have
chosen two countries with both similarities and differences that best serve their purpose of
ensuring sustainability of the findings. In this notion, both Lebanon and Sweden have a large
number of Banks in operation which is 71 and 117 respectively, this multitude of banks in both
countries yields high competition and customer sophistication due to availability of alternatives
that also suggests a large frame of reference for the customers (Raven & Welsh, 2004).
Therefore, banks in both countries have to spend a considerable amount of time, effort and
resources in execution of continuous research in the field of customer magnetism and retention
strategy in order to survive this severe competition. In the light of those facts, the researchers
were led to believe that, as a reason of this high banking sophistication in both arenas, examining
the impact of effective complaints-handling structure and customer satisfaction on customer
loyalty in Sweden and Lebanon together will result in tangible findings and provide a bigger
picture to significant details that would add ultimate value and increase originality of this study.
On the other hand, in terms of cultural dimensions the two countries are poles apart in terms of
cultrure, when compared via Hofstede’s et al. (2010) cultural measurement tools. In this sense,
following Hofstede’s et al. (2010) model the power distance indicator for Lebanon were
calculated to be 80%, meanwhile, Sweden scored 31% in the same dimension, likewise, in regard
of (individualism vs collectivism) Lebanon scored 38% categorizing itself in the column of
42
collectivist societies, whereas, Sweden scored 71% in the same dimension labelling itself as one
of the top individualistic societies and so on.
This cultural difference is highly significant as it indicates that we are dealing with a diverse
range of in culturally distant countries, whereas, in addition the culture variance, the two
research arenas are contradictory in terms of political stability, economical setting and indeed
geographical location. Given this scenario, the diversity in the sample chosen equips this study to
avoid bias, provide more reliable results, and increase originality of findings.
Interestingly, more was done in order to avoid bias and rushed answers to the questionnaire, the
researchers decided to use a different technique which is an oral questionnaire, whereas, each of
the questions in the survey was asked to the respondents orally, meanwhile, the researchers were
the ones to mark the answer in the survey. This method helped the study in three ways, first, it
ensured that the answers were not being filled in randomly and, second, it allowed the scholars to
explain each and every question to the respondents in person to ensure their understanding of the
questions and guarantee a valid answer, particularly, since the study is conducted in English in
two countries where English is not the first language, and third, it allowed the scholars to
communicate on a personal level with the respondents and receive immediate feedback. Despite
of all these advantages to the oral questionnaire technique, the negative aspect of this it that it
requires extra time, which explains the number of sample in the study, (n=199). Nevertheless, the
scholars evaluated their options and decided that the advantages of the oral questionnaire
technique weighs more that the disadvantages, and therefore has decided to go with a relatively
smaller number of sample for the sake of ensuring accurate outcome.
As for the sample description, the largest represented group in the study which constitutes
(n=103/199) of the respondents aged between 40 and 49 years. Consequently, the high
concentration of respondents of this group in the sample has added a broader vision to the
responses, and as a result of their age, their answers exhaled of genuine experiences, whereas,
most of them have more than one frame of reference since they have dealt with more than one
bank in their adulthood.
Furthermore, 52.3% of the sample which constitutes the frequency of (n= 104 respondents/199)
have dealt with the same bank for the period of more than four years. Indeed, the large focus of
43
this group indicates that more than half of the respondents have at least four years of dealing
with the bank which we considered a reasonable time to draw conclusion on whether these
clients are satisfied with the service or not, and therefore, these respondents are in the right place
to advance their opinion about their banking service.
As for gender distribution, the number of respondents is almost divided fairly between the two
genders, whereas, the number of female respondents from both countries was (n =109/199),
meanwhile, males constituted (n=93/199) of the total sample. The fair assimilation of both
genders in the sample has led to more representative selection process since men and women
often have different perception of values including loyalty (Alvesson & Billing, 2009) .
5.2. Examination of Correlation between Variables and Verification of Hypotheses
In this regard, two types of analysis were utilized to examine the relationship between the given
variables that are correlation and regression analysis for the data set as a whole (results from both
Sweden and Lebanon). Conveniently, this section will go over the findings of both analyses
simultaneously in the purpose of analyzing the outcome of each hypothesis in the identical
aforementioned sequence.
5.2.1. Discussion on H1
As the results of correlation analysis indicated a positive correlation of (r=.654; Sig=, 000;
p<.01) between effective handling of customers’ complaints by the banks and customer’s loyalty,
the first hypothesis of this research was validated. To further authenticate this outcome and
provid details on this correlation, we have applied linear regression test on the same relationship,
holding complaints handling as the independent variable and customer’s loyalty as dependent
variable. In this notion, the results of linear regression has presented that effective complaint
handling by the banks explains 65.40% of the variance in customer loyalty, whereas,
(R=.654;R2=.428;Sig=.000).
Given this, the preceding findings affirm the outcomes of other studies in the field of customer
retention such as that of (Andreassen, 1999; Tax & Brown, 2000; Stauss & Schoeler, 2004;
Boshoff, 2005; Oh, 2006), whereas, these studies have emphasized the positive impact of
effective complaints-handling on customer’s retention strategy and loyalty. In their pioneer work
44
Stauss and Schoeler (2004) argue that a lot of companies are not aware of the essential
prominence of effective complaint handling structure. In this notion, these companies fail to
secure the effective complaint handling structure as they face difficulties to calculate the direct
impact it has on customers’ retention, additionally, they find it hard to compute the financial
yield of the latter on profit which causes them to losing clients continuously as a consequence of
this knowledge deficit.
This knowledge deficit in this area is no doubt dangerous and causes a direct threat to a
company’s market share. Stauss and Schoeler (2004) emphasizes, a key factor into acquiring an
effective complaint handling structure is to employ a system to determine the benefits of
complaint management in all its forms, in order to reach transparency in terms of the profit
income of the latter instead of regarding it as a cost. Essentially, on his part, Boshoff (2005)
taking into consideration the importance of determining the benefit of effective complaint
management strategies, he develops a model ‘’RECOVSAT’’ to determine the benefit of service
recovery and assess its impact on customers behavior, whereas, his model were proven highly
effective in its purpose, therefore we have underlined that it is highly recommended for
contemporary enterprises to utilize the findings of Boshoff (2005) in assessing the outcomes of
complaint management.
Within this framework, the earlier data provides empirical evidence about the strong nexus
between loyalty and conflict management. In his deliberate contribution to complaint
management literature Boshoff (2005) asserts that customers will become more loyal to the firm
if they were assured that serious actions will be taken towards their complaints based on
embedded corporate policies, Additionally, his conclusions also suggest that a large aspect of
complaint management structure is effective communication, which also corresponds to verdicts
of literature revision in this study that highlights the prominence of enhanced communication
structure by indicating that 70% of customer who are unsatisfied with their services will not
complain, and about 30% that only report their problems (Eccles & Durand, 1998), and
therefore, taking serious actions of the common difficulties that are faced by those reporting
customers is no doubt an essential part of the firm’s attempt to retain all the 100%. In this
formulation, the firm must regard these frequently reported errors by the 30% as a hint of the
problems that the other 70% might have confronted and did not communicate to the firm.
45
5.2.2. Discussion on H2
Subsequent to discussing the impact and prominence of the correlation between complaint
handling and customers’ loyalty that was found in this research, investigating the second finding
is no less vital than the first one despite its extreme relevance, confidently, customers’
satisfaction is interrelated to their loyalty, however, the existence of both is a key factor for
success to companies and must be examined separately.
In this sense, outcome of correlation table (6) indicated a high positive connection between
influential handling of customers’ complaints by their respective banks with customers’
satisfaction, whereas, (r=0.670; sig. = .000; p>.01). Consequently, the second hypothesis in this
research was supported. Furthermore, results of linear regression holding constant the
independent variable complaints-handling to determine its effect on customers’ satisfaction,
indicated that effective handling of customer complaints explains 67.00% of the variance in
customer satisfaction, whereas, (R=.670; R2= .449; Sig= .000). This empirical evidence equips
us with additional tools to argue that substantial adherence must be paid to customers’ needs, and
their complaints must become the firm’s top priority, particularly, since a minor positive change
in the level of their satisfaction can lead to radical enhancement of loyalty (Oliva, Oliver &
MacMillan, 1992).
Furthermore, the authors emphasized that conflict management exhales more paybacks than
loyalty, whereas, it will also serve as a costless marketing power to the firms due to positive
word of mouth, loyal customers frequently talk about their positive experiences with their service
providers to their acquaintances promoting the firm and dramatically increasing its market share
(Raman, 1999). On the other hand, when customers’ expectations are not met, negative word of
mouth will be spread and they will advise others against purchasing the suppliers’
product/services. Studies of Hocutt et al. (2006), underlined that in order to attain the state of
customers’ satisfaction, employee’s responsiveness to complaints must be associated with
courtesy and understanding, additionally, and employees must demonstrate concern in handling
these complaints and exhibit and instant action.
This idea is reinforced by the belief that complaining customers’ embodies the most loyal ones,
and they are utmost expected to repeat the purchase, besides, studied of Eccles and Durand
46
(1998) strengthen the argument by stating that when their reported errors are handled properly
by the supplier, these complaining customers will promote the firm more than if their
expectations were met in the first place, ultimately, by taking about their experience with the
firm in effective complaint-handling and their consequent satisfaction.
Within this philosophy, sustainable complaint management continues to receive significant
adherence as a consequence of the radical increase in customer expectations that arises with the
increasing competition in the marketplace. Whereas, a firm on its part must provide a reason for
the purchaser to select its product over those of other firms, many companies today promise
customers’ satisfaction with services, yet, the number of those who keep their promises is not
nearly relevant to the latter. For this reason, service managers need to comprehend the
prominence of keeping promises, whereas, failure to do so will not meet the customers’
expectations when they were guaranteed to be served at certain level of proficiency and within a
certain timeframe, which will ultimately lead to customers’ dissatisfaction despite the fact that
the error reported was well recovered (Brown, Cowles & Tuten, 1996). In this sense, therefore,
companies must develop their complaint management strategy in careful consideration of their
physical and human resources to as to keep their promises and retain their clientele.
Also following Brown et al. (1996) service providers should focus on two main aspects when
designing their complaint management structure, the first is, portraying a transaction focus at the
moment when the complaint is being reported, ensuring the professional attitude and courtesy by
the staff responding to complaints, an explanation of the error and an apology on behalf of the
firm and extending the clients time frame and procedure of the complaint handling process goes
a long way in customers relief. The second, depicting a relationship approach since the key motif
of complaint management to firms is not merely to improve the after sale service and recover the
error reported , but also to enhance the delivery process of the service and pledge assurance of a
gratifying experience to their clients. Furthermore, the second aspect underlines consistency of
delivery and reliability for the purpose of enhancing a long-term relationship with the customers.
In the light of these facts, we have to highlight that the preceding ingredients of service quality
and complaints management are essential to regulate the re-purchase process and ensure the level
of satisfaction, meanwhile, the is always a possibility for mistakes and defects to happen, there
should be no tolerance in terms of amending those errors. In this regard, our finding has
47
indicated specified that a weak positive relation (r =.135; Sig. = .057; p<0.1) exists between the
instantaneous complaint handling by the bank with the number of years the customer has dealt
with the bank (See table 6).
5.2.3. Discussion on H3
Unremittingly, the authors were able to affirm the last hypothesis which is meant to accumulate
the findings of the first and second hypotheses to reach the goal of the research question in this
study while preserving the main objective that is to attain customer’s loyalty via enhanced
complaint management. Whereas, results of the correlation table (6) exhaled domineering results
(r= 626, Sig= 000; p<.01) in terms of the relationship between satisfaction and loyalty.
Furthermore, results of the second analysis provided more support, whereas, the repercussion of
linear regression between satisfaction and loyalty indicates a strong relation between the two
variables, with the following calculations, customer satisfaction explains 62.6% of customer
loyalty (R=.626; R2=.398; Sig=.000).
In essence with Narteh (2013a), customer loyalty is defined as the repetitive purchase over a
period of time of a product that is selected amongst several of other alternatives by an individual
or group or a company. In his article, Narteh (2013a) argues that attitudinal and behavioral
approaches are the best way to measure customers’ loyalty as discussed in the literature section.
Moreover, he emphasized that the primary determinant to loyalty is effective service quality that
leads to customer satisfaction and ultimately loyalty which strengthen our argument.
Studies of Leal and Pereira (2003) indicate that customer satisfaction is a prediction of loyalty,
whereas, their findings emphasizes that an apology by the frontline employee on behalf of the
firm in case of service failure is an important factor to customer satisfaction, additionally, in
critical situations, compensation were proven to have a larger impact than an apology in
customer retention.
To this end, the fact that errors happen is somehow an acceptable and unfortunate mistake, but
choosing to tolerate their occurrence is a decision. Indeed, it is a choice that will lead the firm to
losing clientele and depict a bad reputation in the market place. That said, complaint
48
management is about making the best out of the situation for the benefit of both the firm, and
their clientele.
In this notion, Japanese car manufacturer Toyota, which in 2012 were considered the largest car
manufacturer in the world in terms of production, has demonstrated a fundamental example in
terms of achieving customer satisfaction and loyalty via effective service quality and complaint
handling (Pravda.Ru, 2012). In 2012, Toyota motors withdrew more than 7.5 million vehicles
from around the globe because of malfunctioning power-window-switches; this vehicle
withdrawal was distributed between the United States, Europe, China, Japan, and other markets.
Furthermore, the recall was the largest for the car manufacturer since 2009, whereas, more about
12 million cars were withdrew for different minor dysfunctions (Pravda.Ru, 2012). In the
aforementioned occasion, the window switch dysfunction error was reported recurrently by their
service branches which caused the manufactured to recall several models although most of the
cars were functioning appropriately. In our perception, despite the high cost that this car
manufacturer has spent in this occasion, Toyota has demonstrated an ideal model of responsible
service quality in regard to attempts of sustaining a certain level of value in their products so as
to withstand customer satisfaction, and sustain competitive advantage. Toyota were aware that
despite the high cost of recalling 7.5 million vehicles in one year, they will preserve their brand
imagine and gain market respect, further, they will gain customers’ respect and loyalty in the
longer term. Today the 8th
of May 2014, according the British business news BBC, Japanese car
manufacturer has recorded a dramatic significant growth in its profit over the past two years,
Toyota has verified its profit in sales up to $17.8bn up to March 31st , 2014 which is double the
profit made a year ago (BBC, 2014).
5.3. Comparative analysis:
Despite the fact that the findings of this study strongly support all the three hypotheses that were
developed on the basis of theoretical framework of the study, the results derived from each
country separately differs in a way that has attracted our adherence. In an attempt to explain why
the strength of the relationship between effective complaint management, customer satisfaction
and customer loyalty differs in Lebanon and Sweden, the findings presented in empirical part of
the research will be further discussed and analyzed from the perspective of external factors
49
related to cultural differences of customers, competition and specific characteristics of banking
industries of both countries.
5.3.1. Comparison of the relationship between effective complaint handling and loyalty in
Lebanon and Sweden:
Considering correlation tables (7 and 8), the analysis conduct on the data sets from both
countries separated has revealed that the strength of relations between effective complaint
handling and customer loyalty in Lebanon is essentially stronger rather than that in Sweden. In
this regard, correlation coefficient derived from Sweden’s data set is (R=0,441**; sig.=0,000)
whereas correlation coefficient retrieved from Lebanon’s data set is (R=0,716**; sig.=0,000)
(see Table 7 and Table 8 respectively). Results of regression analysis shows that 71.3% of the
variance in customer’s loyalty of Lebanon is determined by effective complaint handling
(R=0,713; R2=0,508; Sig. =0,000); whereas, in case of Sweden effective complaint accounts only
for 45.3 % of customer’s loyalty to the service provider (R=0,453; R2=0,206; Sig. =0,003).
Within this framework, in an attempt to understand the essential variations in results between the
two countries further analysis in relevance to brand equity will be applied in this section.
Following Tax et al. (1998) accumulative goodwill (equity) is achieved through previous
satisfaction experiences with the organization that positively impacts evaluation of complaint
handling efforts, and even decreases the negative impact of poorly managed complaint incidents.
More precisely, satisfaction with the prior encounters diminishes negative outcome of poorly
managed customer complaint, because customers still are willing to deal with service provider
taking into account the relationship with the provider based on previous satisfying experience
(Tax, Brown & Chandrashekaran, 1998). Moreover, initial unfavorable experience with
organization increase customer expectations from service recovery (Tax, Brown &
Chandrashekaran, 1998). Further, consistent with Donthu and Yoo (1998) the customer overall
expectations from delivered service are higher in countries that score relatively low at Hofstede’s
et al. (2010) power distance dimension such as Sweden; whereas, customer expectations in
Lebanon are lower, as this country scores higher at power distance.
That being said, customer expectations in the two countries varies due to Hofstede’s et al.
(2010) power distance dimension, it is likely that impact of effective complaint handling will be
50
greater on customer attitude and repurchase behavior in the case of Lebanon compared to
Sweden. Customers in Sweden expect and accept high quality service, whereas Lebanese
customers have lower overall service quality expectations, presumably, it is more challenging for
complaint managers in Sweden to employ effective recovery actions that will exceed the high
customer expectations, and utilize the occurrence of service failure for renewing customer’s
commitment.
Additionally to the aforementioned discussion, different levels of liaison between effective
handling of customer’s problems and loyalty in the two countries can be explained by different
scores at Hofstede’s et al. (2010) individualism dimension. Following Hofstede et al. (2010)
Sweden is considered as an individualistic society, whereas Lebanon is regarded as collectivistic
society, in this regard, people who belong to individualistic cultures prioritize their own interest
over the reference group; hence, customers are more likely to prioritize their own interests
without taking into consideration the interest of the service provider. Having said that,
customers from individualistic societies such as Sweden are likely to have a low level of
tolerance in case of delivering poor service quality, and afterwards are likely not to be interested
in developing long term relationship with service provider. It can be explained by specific
cultural characteristics related to the individualism dimension that suggest that individualistic
customers are well-experienced and feel free entering or leaving the reference group they belong
to, essentially, having overall high tendency to terminate the relationship with the service
provider in case of experiencing poorly handled complaint. Conversely, customers from
collectivistic societies prioritize group over personal interest, which means that they are more
likely to have high level of tolerance in case of service failure and they wouldn’t simply leave
the service provider, essentially, having overall tendency to establish and maintain long lasting
relationship with the bank because one is considered as member of their in-group (Donthu &
Yoo, 1998).
5.3.2. Comparison of the relationship between effective complaint and customer
satisfaction in Lebanon and Sweden:
Having compared the distinctive response of customers to complaint management using findings
of correlation analysis applied to each country separately, it was revealed that the significance of
relationship between customer satisfaction and effective complaint handling in Lebanon is
51
substantially stronger than that in Sweden, whereas, (Lebanon: r = 0,713**, sig. = 0,000;
Sweden: r = 0,372**, sig. = 0,002). Therefore, according to Oliver (1980) the customer
evaluation of perceived service can result into dissatisfaction, satisfaction or delight depending
on whether their expectations are disconfirmed, met or exceeded. In this regard, Lebanon
belongs to high power distance culture (Hofstede, Hofstede & Minkov, 2010). Based on their
study, Donthu and Yoo (1998) we can explain this phenomenon as if the “weak power”
Lebanese customers are likely to have lower level of service quality expectations and are more
tolerant towards “powerful” service provider’s reliability and responsiveness shortcomings than
their counterparts from low power distance Sweden. Consequently, it seems that effective
complaint handling employed by banks in Lebanon exceed low customer expectations making
customers delighted which ultimately lead to a greater satisfaction as also described by Oliver
(1980).
Conversely, based on empirical findings in this research, we can observe that complaint
management has lower influence on customer satisfaction in case of Sweden. Essentially, the
reason behind this phenomenon can be explained that Swedish customers expect and accept high
level of service quality from the service provider as it is suggested by Donthu and Yoo (1998).
Additionally, Dash et al. (2009) also point out that customers from low power distance countries
assume reliable and responsive service having high service quality expectations. Giving this
dynamic, it is likely that complaint handling efforts employed by banks in response to failure
encounters simply meet Swedish customer expectations and does not lead to extra delight as it is
the case for Lebanese customers; thereby, higher customer expectations in Sweden explains the
less significant moderate relationship between effective complaint handling and customer
satisfaction. Whereas, to further support this claim, our results of linear regression analysis
reinforces this suggestion showing that effective complaint handling in Lebanon determines
71.6% of the variance in customer satisfaction (R=0,716; R2=0,513;Sig.=0,000), on the other
hand, in case of Sweden it explains about 44.1% of the same variable (R=0,441;
R2=0,195;Sig.=0,001).
52
5.3.3. Comparison of the relationship between customer satisfaction and loyalty in
Lebanon and Sweden:
This step of analysis underlines the variation in customer’s response to satisfaction in relevance
to loyalty in the two tested countries. Whereas, after comparing results of correlation analysis
applied for each country independently, a variance in strength of liaison between the two
variables was observed between the results of analysis of two countries. Implicitly, in case of
Sweden Pearson’s correlation coefficient is (R=0,218*; sig. =0,074), whereas in Lebanon the
coefficient is (R=0,729**; sig. =0,000). Thus, the extent of positive correlation between
satisfaction and loyalty is substantially stronger in Lebanon compared to Sweden. Similarly,
repercussions of linear regression analyses further supports our claim by indicating that
satisfaction in Lebanon explains 72.9% of customers loyalty (R=0,729; R2=0,531; Sig.=0,000);
whereas, in Sweden customer satisfaction grants only 24.7% of customer committed intention
(R=0,247; R2=0,061;Sig.=0,042).
In their study, Bowen and Chen (2001) argue that only extremely satisfied customers
demonstrate positive attitudinal and behavioral intention toward service provider through
patronage behavior and spreading favorable word of mouth. Essentially, additional efforts should
be employed by the firm to exceed level of customer expectation and attain loyal who
demonstrate positive attitudinal and behavioral actions as described by Rowley (2005).
In this sense, it is more likely that Swedish customers being representatives of low power
distance culture have higher expectations toward service delivery comparing to their counterparts
from high power distance Lebanon. In this regard, the relevant articles concerning characteristics
of banking industries in Sweden and Lebanon suggests that on average banks within both
countries deliver similarly high quality service. Both countries have equal level of bancarization,
where the bank branches as well as automated teller machines are distributed to the same extent
across countries depending on the location of their economic activities.
Furthermore, the customer service of Lebanese banks meet level of standards of some developed
countries and try to keep pace with development of new technologies meeting new upcoming
customers’ needs. Further, in the following studies the authors Anderson et al. (1976), Thwaites
and Vere (1995) point out that convenience and accessibility are key factors that determine the
53
customer choice towards a certain bank and directly affect customer satisfaction and repetition of
purchasing act; in this regard, Lovelock (1983) emphasizes that the increasing number of bank
branches contributes to a greater accessibility, however, findings of Narteh (2013a)’s research
points out that due to the development of informational technologies, availability of electronic
banking services has become an important factor that affects the consumer selection of the bank.
Thereby, taking into account contemporary banking and modern practices of payment including
electronic banking services are still inadequately spread among Lebanese customers, the
geographical bank location remain to play a key role in the choice of bank to the Lebanese
customer.
To this end, based on the aforementioned claims, we came to a realization that bank managers
have to design their complaint management strategy taking into account vital elements such as
customer behavior, expectations and competition. Whereas, in this study, despite the similar
service quality provided by the Swedish and Lebanese banks, Lebanese customers seemed to be
more inclined to recognize complaint management efforts by their banks than the Swedes, due to
lower expectations of quality provided. Therefore, given these dynamics, Lebanese banks have
to underline effective complaint management to retain customers, and besides sustaining
effective complaint management, Swedish banks have to look for additional incentives to exceed
their customers’ expectations and ultimately ensure their loyalty.
54
6. Conclusion
The final chapter of this research highlights the limitations endured, the scientific contribution of
the study, and a brief conclusion of the previous chapters.
6.1. Study limitations and Suggestions for Future Studies
This study has accumulated dynamic findings to extend our cognitions in the field of complaint
management and customers’ service, despite the existence of few research limitations that will be
explained in this section. In this regard, it can be argued that the two cities chosen to collect the
primary data does not quiet represent the countries intended to be examined. Whereas, Beirut is
the capital of Lebanon, and does not reflect an accurate representation of the country as a whole,
moreover, our first research arena, the Lebanese American University is one of the most
expensive educational centers in the middle-east with extremely high tuition fees that can only be
afforded by upper-class community. In the same pattern, our second research arena, the city of
Gavle might not be a good representation of Sweden as a whole considering its small size.
Furthermore, larger sample size could have yielded a more representative data, although due to
time limitations, it was regarded that focusing on 199 respondents to get accurate and valid
responses was the best alternative.
Given these limitations, we emphasize that, to enhance the representation of sample, if
applicable, future studies should target more cities with variant circumstances, in order to draw a
full picture of the countries included in comparison. On the other hand, this study has focused on
utilizing quantitative research methodology since the focus here was on statistical analysis and
extracting formulas to calculate the impact of variables on each other, whereas, another approach
to this topic can be an expansion to employing both quantitative and qualitative research
methodology so as to go in depth in attaining more information and genuine examples from bank
managers. In this sense, the triangulation approach can look at this topic from a different
perspective and perhaps results in more managerial implications. Moreover, meanwhile this
study has focused its analysis on the banking industry; future studies might consider testing other
industries, such as car manufacturing, or telecommunication, so as to advocate effective after
sale service and make sure that customer complaints are well heard and taken into account, and
true value is being delivered in all products.
55
6.2. Scientific Contribution
The singularity of this research is embodied in the valid presentation of the direct link between
the efforts that companies invest in responding to customer’s complaints and the tangible profit
rewarded in return over that investment. In this regard, it does not necessitate a specialist to
illustrate that complaint handling leads to satisfaction; yet, the challenge in this study was to
mathematically calculate to what extent complaint management enhances satisfaction and
loyalty. Many studies in this field have emphasized the importance of complaint management in
modern enterprises, yet, this study were able to extract formulas to compute how much
complaint management enhances the overall profit.
Moreover, the multitude of previous studies in the fields of complaint management and customer
relations was revised in this research and the screening of a variety of deliberate ideas and
establishing of a valid literature foundation has led to an strong integration of the past
philosophies with current or modern evidence.
Furthermore, findings of this research is advanced by the selection of sample, whereas, the two
countries are poles apart in many aspects including economical standing, and even customers
response to effective complaint management, evidently, the diversity in sample selection
enhanced the originality of this research, and consequently, led to more reliable findings.
6.3. Managerial Implications
Assimilating the philosophies of the past with modern evidence in the current study has formed a
tool for bank managers to underline the importance of customer retention, particularly, with the
increasing competition in the industry. This research provides managers formulas to calculate the
profit margin with the enhanced complaint management structure. Further, this study
demonstrates with empirical evidence that the impact of complaint management on customer
retention varies from a country to the other and is dependent on multiple factors such as culture,
competition, customer behavior, and level of sophistication of service. That is being said,
therefore, bank managers have to design their complaint management strategy taking into
account these vital elements. For instance, in this study, despite the similar service quality
provided by the Swedish and Lebanese banks, Lebanese customers seemed to be more inclined
56
to recognize complaint management efforts by their banks than the Swedes, due to lower
expectations of quality provided. Therefore, given these dynamics, Lebanese banks have to
underline effective complaint management to retain customers, and besides sustaining effective
complaint management, Swedish banks have to look for additional incentives to exceed their
customers’ expectations and ultimately ensure their loyalty.
6.4. Summary and Reflection
Intensifying the prominence of customers’ loyalty, this research underlines the idiosyncratic
connection between customers’ satisfaction and loyalty via effective complaint management
structure. Implicitly, this study is aimed to advance an answer to the following question ‘’ what
is the impact of effective complaint management on customers’ loyalty?’’, In this regard, we
have revised a multitude of research in this area, focusing on the remarkable works of Oliver
(1980), Bitner et al. (1990), Dick and Basu (1994), Brown et al. (1996), Tax et al. (1998),
Andreassen (1999), Andreassen (2000), Tax and Brown (2000), Leal and Pereira (2003), Boshoff
(2005), Rowley (2005), Lymperopoulos et al. (2006), Oh (2006), Walker et al. (2008), Al-Eisa
and Alhemoud (2009), Komunda and Osarenkhoe (2012), Lovelock and Wirtz (2011), Narteh
(2013a). Subsequently, realizing the difficulties that firms face to calculate the profit generated
from effective complaint management, and the impact of the latter on satisfaction and loyalty,
three hypotheses were postulated to empirically determine via statistical analysis the liaison
between the three following variables; complaint management, satisfaction and loyalty.
In this configuration, as a result of the sophistication and enhancement of complaint management
in banking industry, a questionnaire was developed to examine the relationship between banks
and their clients, focusing on the impact of banking service and complaint handling in attempt of
customer’s retention. Within this framework, so as to get a broader perspective and more reliable
findings, the study was conducted in two contrasting countries in terms of economic
circumstances, customer behavior and other factors. Whereas, responses to the questionnaire
were collected from University of Gavle (Gavle, Sweden), and Lebanese American University
(Beirut, Lebanon) during April 2014, escalating a total of 199 valid responses to the
questionnaire.
57
Subsequently, the outcome of quantitative research was analyzed via SPSS (software package
used for statistical analysis), in particular, utilizing the relationship measurement tools,
correlation and linear regression analysis. In this notion, the repercussion of the analysis led to
fundamentally privileged findings, whereas, after computing the extent to which each variable
affect the other, we were able to extract three formulas to determine the linear relationships
between the variables and stimulate its calculation process.
Furthermore, emphasizing the distinction of these relationships, the scholars developed a detailed
analysis to compare the findings with previous research and validate the outcome, moreover; an
evaluation of customer behavior was executed to compare the responses of banking customers to
complaint management in the contrasting research arenas, Sweden and Lebanon. Additionally,
highlighting other privileges and determinants of loyalty, such as communication and positive
word of mouth; meanwhile, loyal customers play a protagonist role in advocating brands and
consequently increasing its market share via spreading positive word of mouth, the establishment
of an effective communication structure is an essential and imperative aspect of loyalty to
stimulate the complaint handling process and receive immediate feedback on the service
provided.
That said, repercussions of this research provide solid data regarding the vital adherence that
firms must pay to customers’ needs and complaints, and the necessity to design sustainable
complaint management strategy so as to retain current customers, protect brand imagine, and
ultimately transform a onetime customer into a lifetime client.
58
References:
Abbasi, S.M. & Hollman, K. 1993, "Business success in the Middle East", Management
Decision, Vol. 31, No. 1, pp. 55-9.
Afsar, B., Rehman, Z.U., Qureshi, J.A. & Shahjehan, A. 2010, "Determinants of customer
loyalty in the banking sector: The case of Pakistan", African Journal of Business
Management, Vol. 4, No. 6, pp. 1040-1047.
Al-Eisa, A.S. & Alhemoud, A.M. 2009, "Using a multiple-attribute approach for measuring
customer satisfaction with retail banking services in Kuwait", International Journal of Bank
Marketing, Vol. 27, No. 4, pp. 294-314.
Ali, A.J. 1990, "Decision-making style, individualism, and attitudes toward risk of Arab
executives", International Studies of Management and Organization, Vol. 22, No. 3, pp. 53-
73.
Alvesson, M. & Billing, Y.D. 2009, Understanding gender and organizations, 2. ed. edn, SAGE,
London.
Anastasi, A., Blanco, E., Elosegui, P. & Sangiácomo, M. 2006, "Bancarization and determinants
of availability of banking services in Argentina", Working paper, [Online], no. 15. May, 29
2014. Available from:
http://www.bcra.gov.ar/pdfs/investigaciones/WP%202006%2015_i.pdf. [May, 29 2014].
Anderson, E., Fornell, C. & Lehman, D. 1994, "Customer satisfaction, marketing share and
profitability: findings from Sweden", Journal of Marketing, Vol. 58, No. 3, pp. 63-6.
Anderson, E. & Sullivan, M. 1993, "The antecedents and consequences of customer satisfaction
for firms", Marketing Science, Vol. 12, No. 2, pp. 125-43.
Anderson, W.T.J., Cox, E.P.I. & Fulcher, D.H. 1976, "Bank selection decisions and market
segmentation", Journal of Marketing, Vol. 40, No. 1, pp. 40-5.
Andreasen, A.R. & Best, A. 1977, "Consumers complain-does business respond?", Harvard
Business Review, Vol. 55, No. 4, pp. 93-101.
Andreassen, T.W. 1999, "What drives customer loyalty with complaint resolution?", Journal of
Service Research, Vol. 1, No. 4, pp. 324-32.
Andreassen, T.W. 2000, "Antecedents to satisfaction with service recovery", European Journal
of Marketing, Vol. 34, No. 1, pp. 156-175.
Association of Banks in Lebanon 2012, 2012-last update, Annual report 2012. Activity And
Performance Of The Lebanese Banking Sector In 2012: Part Four [Homepage of
59
Association of Banks in Lebanon], [Online]. Available:
http://www.abl.org.lb/landingpage.aspx?pageid=452 [2014, 04/28].
Association of Banks in Lebanon 2011, June 30, 2011-last update, Main characteristics
[Homepage of Association of Banks in Lebanon], [Online]. Available:
http://www.abl.org.lb/subPage.aspx?pageid=360 [2014, 04/28].
BBC 2014, 8 May 2014-last update, Toyota profit nearly doubles to $17.8bn [Homepage of
BBC], [Online]. Available: http://www.bbc.com/news/business-27321767 [2014, 05/15].
Bendall-Lyon, D. & Powers, T.L. 2001, "The Role of Complaint Management in the Service
Recovery Process", Joint Commission Journal on Quality and Patient Safety, Vol. 27, No.
5, pp. 278-286.
Berry, L. & Parasuraman, A. 1991, Marketing Services: Competing through Quality, The Free
Press, New York, NY.
Berry, L.L., Zeithaml, V.A. & Parasuraman, A. 1988, "The Service-Quality Puzzle", Business
horizons, Vol. 31, Vo. 5, pp. 35-43.
Bitner, M.J., Booms, B. & Tetreault, M.S. 1990, "The service encounter: diagnosing favorable
and unfavorable incidents", Journal of Marketing, Vol. 54, No.1, pp. 71-84.
Bloemer, J. & Odekerken-Schroder, G. 2002, "Store satisfaction and store loyalty explained by
customer and store-related factors", Journal of Consumer Satisfaction, Dissatisfaction and
Complaining Behavior, Vol. 15, No. 11, pp. 68-80.
Boshoff, C. 1997, "An experimental study of service recovery options", International Journal of
Service Industry Management, Vol. 8, No. 2, pp. 110-130.
Boshoff, C. 1999, "RECOVSAT: an instrument to measure satisfaction with transaction-
specific recovery", Journal of Service Research, Vol. 1, No. 3, pp. 236-49.
Boshoff, C. 2005, "A re-assessment and refinement of RECOVSAT: An instrument to measure
satisfaction with transaction-specific service recovery", Managing Service Quality, Vol. 15,
No. 5, pp. 410-425.
Bowen, J.T. & Chen, S. 2001, "The relationship between customer loyalty and customer
satisfaction", International Journal of Contemporary Hospitality Management, Vol. 13, No.
5, pp. 213-217.
Brown, S.W., Cowles, D.L. & Tuten, T.L. 1996, "Service recovery: its value and limitations as a
retail strategy", International Journal of Service Industry Management, Vol. 7, No. 5, pp.
32-46.
60
Bryman, A. & Bell, E. 2007, Business research methods, 2nd edn, Oxford University Press Inc.,
New York.
Capaldi, E.J. & Proctor, R.W. 2008, "Are Theories to Be Evaluated in Isolation or Relative to
Alternatives? An Abductive View", The American Journal of Psychology, Vol. 121, No. 4,
pp. 617-641.
Chahine, S. & Safieddine, A. 2008, "Corporate governance and the external monitoring of banks
in Lebanon", Corporate Governance, Vol. 8, No. 3, pp. 258-270.
Chumpitaz, R. & Papariodamis, N.G. 2004, "Service quality and marketing performance in
business-to-business markets: exploring the mediating role of client satisfaction", Managing
Service Quality, Vol. 14, No. 2/3, pp. 235-248.
CIA 2014, 2014-last update, Sweden [Homepage of Central Intelligence Agency], [Online].
Available: https://www.cia.gov/library/publications/the-world-factbook/geos/sw.html [2014,
05/19].
Cronin, J.J.J. & Taylor, S.A. 1992, "Measuring service quality: a re-examination and extension",
Journal of Marketing, Vol. 56, No. 3, pp. 55-68.
Crosby, L.A., Evans, K.R. & Cowles, D. 1990, "Relationship quality in services selling: an
interpersonal influence approach", Journal of Marketing, Vol. 54, No. 3, pp. 68-81.
Dash, S., Bruning, E. & Acharya, M. 2009, "The effect of power distance and individualism on
service quality expectations in banking: A two-country individual- and national-cultural
comparison", International Journal of Bank Marketing, Vol. 27, No. 5, pp. 336-358.
Denzin, N.K. & Lincoln, Y.S. 2005, The Sage handbook of qualitative research, 3rd edn, Sage
Publications Ltd, Thousand Oaks, California.
Dick, A.S. & Basu, K. 1994, "Customer loyalty: toward an integrated conceptual framework",
Journal of the Academy of Marketing Science, Vol. 22, No. 2, pp. 99-113.
Donthu, N. & Yoo, B. 1998, "Cultural influences on service quality expectations", Journal of
Service Research, Vol. 1, No. 2, pp. 178-86.
Dube, L. & Maute, M.F. 1994, The effect of defensive marketing strategies on customer
responses to service failure, working paper presented at the Frontiers in Services Marketing
Conference edn, Vanderbilt University, Nashville, Tennessee.
Duffy, J.A.M., Miller, J.M. & Bexley, J.B. 2006, "Banking customers' varied reactions to service
recovery strategies", International Journal of Bank Marketing, Vol. 24, No. 2, pp. 112-132.
Eccles, G. & Durand, P. 1998, "Complaining customers, service recovery and continuous
improvement", Managing Service Quality, Vol. 8, No. 1, pp. 68-71.
61
Edvardsson, B., Tronvoll, B. & Höykinpuro, R. 2011, "Complex service recovery processes:
how to avoid triple deviation", Managing Service Quality, Vol. 21, Vo. 4, pp. 331-349.
Fecikova, I. 2004, "An index method for measurement of customer satisfaction", The TQM
Magazine, Vol. 16, No. 1, pp. 57-66.
Fisher, A. 2001, "Winning the battle for customers", Journal of Financial Service Marketing,
Vol. 6, No. 2, pp. 77-83.
Furrer, O., Liu, B.S.C. & Sudharshan, D. 2000, "The relationships between culture and service
quality perceptions", Journal of Service Research, Vol. 2, No. 4, pp. 355-71.
Goodwin, C. & Verhage, B.J. 1990, "Role Perceptions of Services: A Cross-Cultural
Comparison with Behavioral Implications", Journal of Economic Psychology, Vol. 10, No.
4, pp. 543–558.
Grönroos, C. 1990, Service Management and Marketing: Managing the Moments of Truth in
Service Competition, Lexington Books, Lexington, Massachusetts.
Gustafsson, A., Johnson, M. & Roos, I. 2005, "The effects of customer satisfaction, relationship
commitment dimensions, and triggers on customer retention", Journal of Marketing, Vol.
69, No. 4, pp. 210-18.
Hamer, L.O. 2006, "A confirmation perspective on perceived service quality", Journal of
Services Marketing, Vol. 20, No. 4, pp. 219-232.
Hansen, D.E. & Danaher, P.J. 1999, "Inconsistent performance during the service encounter:
What's a good start worth?", Journal of Service Research, vol. 1, no. February, pp. 227-35.
Hart, C.W.L., Heskett, J.L. & Sasser, W.E.J. 1990, "The profitable art of service recovery",
Harvard Business Review, Vol. 68, No. 4, pp. 148-56.
Hinson, R., Owusu-Frimpong, N. & Dasah, J. 2011, "Brands and service-quality perception",
Marketing Intelligence & Planning, Vol. 29, No. 3, pp. 264-283.
Hocutt, M.A., Bowers, M.R. & Donavan, D.T. 2006, "The art of service recovery: fact or
fiction?", Journal of Services Marketing, Vol. 20, No. 3, pp. 199-207.
Hofstede, G., Hofstede, G.J. & Minkov, M. 2010, Cultures and organization: software of the
mind. Intercultural cooperation and its importance for survival. 3rd edn, McGraw-Hill,
New York.
Jacoby, J. & Kyner, R. 1973, Brand Loyalty: Measurement and Management, W. John Wiley &
Sons, New York.
62
Jones, H. & Farquhar, J.D. 2003, "Contact management and customer loyalty", Journal of
Financial Services Marketing, Vol. 8, No. 1, pp. 71-8.
Karatepe, O. 2011, "Service Quality, Customer Satisfaction and Loyalty: The Moderating Role
of Gender", Journal of Business Economics and Management, Vol. 12, No. 2, pp. 278-300.
Kelley, S.W. & Davis, M.A. 1994, "Antecedents to customer expectations for service recovery",
Journal of the Academy of Marketing Science, Vol. 22, No.1, pp. 52-61.
Komunda, M. & Osarenkhoe, A. 2012, "Remedy or cure for service failure?: Effects of service
recovery on customer satisfaction and loyalty", Business Process Management Journal, Vol.
18, No. 1, pp. 82-103.
Leal, R.P. & Pereira, Z.L. 2003, "Service recovery at a financial institution", International
Journal of Quality & Reliability Management, Vol. 20, No. 6, pp. 646-663.
Levesque, T. & McDougall, G.H.G. 1996, "Determinants of customer satisfaction in retail
banking", International Journal of Bank Marketing, Vol. 14, No. 7, pp. 12-20.
Lewis, B.R. & Spyrakopoulos, S. 2001, "Service failures and recovery in retail banking: the
customers’ perspective", International Journal of Bank Marketing, Vol. 19, No. 1, pp. 37-
48.
Lovelock, C.H. 1983, "Classifying Services to Gain Strategic Marketing Insights", Journal of
Marketing, Vol. 47, No. 3, pp. 9-20.
Lovelock, C.H. & Wirtz, J. 2011, Services marketing: people, technology, strategy, 7th edn,
Prentice Hall, Boston.
Lymperopoulos, C., Chaniotakis, I.E. & Soureli, M. 2006, "The importance of service quality in
bank selection for mortgage loans", Managing Service Quality, Vol. 16, No. 4, pp. 365-79.
Malhotra, N.K. 2007, Marketing research: an applied orientation, 5th ed. edn, Pearson Prentice
Hall, Upper Saddle River, New Jersey.
Marla, S. 1996, "Demographic discriminators of service quality in the banking industry", The
Journal of Services Marketing, Vol. 10, No. 4, pp. 6-22.
Matos, C.A.d., Rossi, C.A.V., Veiga, R.T. & Vieira, V.A. 2009, "Consumer reaction to service
failure and recovery: the moderating role of attitude toward complaining", Journal of
Services Marketing, Vol. 23, No. 7, pp. 462-475.
McCollough, M.A., Berry, L.L., Yadav, M.S., McCollough, M.A., Berry, L.L. & Yadav, M.S.
2000, "An Empirical Investigation of Customer Satisfaction after Service Failure and
Recovery", Journal of Service Research, Vol. 3, No. 2, pp. 121-137.
63
Miller, J.L., Craighead, C.W. & Karwan, K.R. 2000, "Service recovery: a framework and
empirical investigation", Journal of Operations Management, Vol. 18, No. 4, pp. 387-400.
Morrisson, O. & Huppertz, J.W. 2010, "External equity, loyalty program membership, and
service recovery", Journal of Services Marketing, Vol. 24, No. 3, pp. 244-254.
Narteh, B. 2013a, "Determinants of students’ loyalty in the Ghanaian banking industry", The
TQM Journal, Vol. 25, No. 2, pp. 153-169.
Narteh, B. 2013b, "Key determinant factors for retail bank switching in Ghana", International
Journal of Emerging Markets, Vol. 8, No. 4, pp. 409-427.
Neuman, W.L. 1997, Social Research Methods, Qualitative and Quantitative Approaches, Allyn
& Bacon, Needham Heights, Massachusetts.
Oh, D. 2006, "Complaining intentions and their relationships to complaining behavior of
academic library users in South Korea", Library Management, Vol. 27, No. 3, pp. 168-189.
Oliva, T.A., Oliver, R.L. & MacMillan, I.C. 1992, "A catastrophe model for developing service
satisfaction strategies", Journal of Marketing, Vol. 56, No. July, pp. 83-95.
Oliver, R.L. 1999, "Whence consumer loyalty?", Journal of Marketing, Vol. 63, No. 4, pp. 33-
44.
Oliver, R.L. 1980, "A cognitive model of the antecedents and consequences of satisfaction
decisions", Journal of Marketing Research, Vol. 17, No. 4 pp. 460-9.
Parasuraman, A., Zeithaml, V.A. & Berry, L.L. 1991, "Refinement and reassessment of the
SERVQUAL scale", Journal of Retail, Vol. 67, No. 4, pp. 420-50.
Parasuraman, A., Zeithaml, V.A. & Berry, L.L. 1988, "SERVQUAL: a multiple-item scale for
measuring consumer perceptions of service quality", Journal of Retailing, Vol. 64, No. 1,
pp. 12-40.
Pravda.Ru 2012, 10 October 2012-last update, Toyota recalls 7.4 million vehicles worldwide
over tiny switch. Available: http://english.pravda.ru/news/business/10-10-2012/122411-
toyota_recall-0/ [2014, 05/15].
Raman, P. 1999, "Way to create loyalty", New Straits Times, 17 August, Kuala Lumpur.
Raven, P. & Welsh, D.H.B. 2004, "An exploratory study of influences on retail service quality: a
focus on Kuwait and Lebanon", Journal of Services Marketing, Vol. 18, No. 3, pp. 198-214.
Reichheld, F.F. & Sasser, W.E.J. 1990, "Defections: quality comes to services", Harvard
Business Review, Vol. 68, No. 5, pp. 105-11.
64
Rowley, J. 2005, "The four Cs of customer loyalty", Marketing Intelligence & Planning, Vol. 23,
No. 6, pp. 574-581.
Ruyter, K.D. & Wetzels, M. 2000, "Customer equity considerations in service recovery: a cross-
industry perspective", International Journal of Service Industry Management, Vol. 11, No.
1, pp. 91-108.
Smith, A.K., Bolton, R.N. & Wagner, J. 1999, "A model of customer satisfaction with
service encounters involving failure and recovery", Journal of Marketing Research, Vol. 36,
No. 3, pp. 356-72.
Smith, A.K. & Bolton, R.N. 1998, "An experimental investigation of customer reactions to
service failure", Journal of Service Research, Vol. 1, No. 1, pp. 65-81.
Sousa, R. & Voss, C.A. 2009, "The effects of service failures and recovery on customer loyalty
in e-services: An empirical investigation", International Journal of Operations and
Production Management, Vol. 29, No. 8, pp. 834-64.
Srinivasan, S.S., Anderson, R.E. & Ponnavolu, K. 2002, "Customer loyalty in e-commerce: an
exploration of its antecedents and consequences", Journal of Retailing, Vol. 78, No. 1, pp.
41-51.
Stauss, B. & Schoeler, A. 2004, "Complaint management profitability: what do complaint
managers know?", Managing Service Quality, Vol. 14, No. 2, pp. 147-156.
Stephens, N. & Gwinner, P.K. 1998, "Why Don’t Some People Complain? A Cognitive-Emotive
Process Model of Consumer Complaining Behavior", Journal of the Academy of Marketing
Science, Vol. 26, No. 3, pp. 172–189.
Swedish Bankers' Association 2013, , Banks in Sweden [Homepage of Swedish Bankers'
Association], [Online]. Available:
http://www.swedishbankers.se/web/bf.nsf/$all/0B450AE7C2DC4B14C1257620003BB5EB
?open [2014, 04/30].
Swedish Bankers' Association 2008, November, 2008-last update, Banks in Sweden. Facts about
the Swedish banking market. [Homepage of Swedish Bankers' Asociation], [Online].
Available:
http://www.swedishbankers.se/web/bfmm.nsf/lupgraphics/BROCHUREBanksinSweden.pdf
/$file/BROCHUREBanksinSweden.pdf [2014, 04/30].
Tax, S.S. & Brown, S.W. 2000, "Service recovery: research insights and practices" in Swartz,
T.A. and Iacobucci, D. (Eds)" in Handbook of Services Marketing and Management, pp.
271-85. Sage Publication, Thousand Oaks, California.
Tax, S.S. & Brown, S.W. 1998, "Recovering and Learning from Service Failure", Sloan
Management Review, Vol. 49, No. 1, pp. 75-88.
65
Tax, S.S., Brown, S.W. & Chandrashekaran, M. 1998, "Customer evaluation of service
complaint experiences: implications for relationship marketing", Journal of Marketing, Vol.
62, No. 2, pp. 60-76.
The World Bank Group 2014a, 2014-last update, Automated teller machines (ATMs) (per
100,000 adults) [Homepage of The World Bank Group], [Online]. Available:
http://data.worldbank.org/indicator/FB.ATM.TOTL.P5 [2014, 05/12].
The World Bank Group 2014b, 2014-last update, Commercial bank branches (per 100,00
adults). Available: http://data.worldbank.org/indicator/FB.CBK.BRCH.P5 [2014, 05/12].
Thwaites, D. & Vere, L. 1995, "Bank selection criteria - a student perspective.", Journal of
Marketing Management, Vol. 11, No. 1-3, pp. 133-49.
Thwaites, E. & Williams, C. 2006, "Service recovery: a naturalistic decision-making approach",
Managing Service Quality, Vol. 16, No. 6, pp. 641-653.
Torres, E.N. & Kline, S. 2006, "From satisfaction to delight: a model for the hotel industry",
International Journal of Contemporary Hospitality Management, Vol. 18, No. 4, pp. 290-
301.
Trochim, W.M.K. & Donnelly, J.P. 2007, Research methods knowledge base, 3rd edn, Thomson
Custom Pub., Mason, Ohio.
Walker, A., Smither, J. & Waldman, D. 2008, "A longitudinal examination of concomitant
changes in team leadership and customer satisfaction", Personnel Psychology, Vol. 61, No.
3, pp. 547-77.
Wang, Y., Lo, H.P., Chi, R. & Yang, Y. 2004, "An integrated framework for customer value and
customer-relationship-management performance: a customer-based perspective from
China", Managing Service Quality, Vol. 14, No. 2, pp. 169-182.
Winsted, K.F. 1999, "Evaluating Service Encounters: a cross-cultural and cross-industry
exploration", Journal of Marketing Theory & Practice, Vol. 7, No. 2, pp. 106-23.
Yavas, U., Karatepe, O.M., Babakus, E. & Avci, T. 2003, "Customer complaints
and organizational responses: a study of hotel guests in Northern Cyprus", Journal of
Hospitality & Leisure Marketing, Vol. 11, No. 1/2, pp. 31-40.
Zeithaml, V.A., Berry, L.L. & Parasuraman, A. 1996, "The behavioral consequences of service
quality", Journal of Marketing, Vol. 60, No. 2, pp. 31-46.
Zeithaml, V.A., Berry, L.L. & Parasuraman, A. 1993, "The nature and determinants of customer
expectations of service", Journal of the Academy of Marketing Science, Vol. 21, No. 1, pp.
1-12.
66
Zemke, R. & Bell, C. 1990, "Service recovery: doing it right the second time", Training, Vol. 27,
No. 6, pp. 42-8.
Zikmund, W.G. 1997, Business research methods, 5th edn, The Dryden Press, Fort Worth,
Texas.
Zineldin, M. 2002, "Managing in the @ age: Banking service quality and strategic positioning",
Measuring Business Excellence, Vol. 6, No. 4, pp. 38-43.
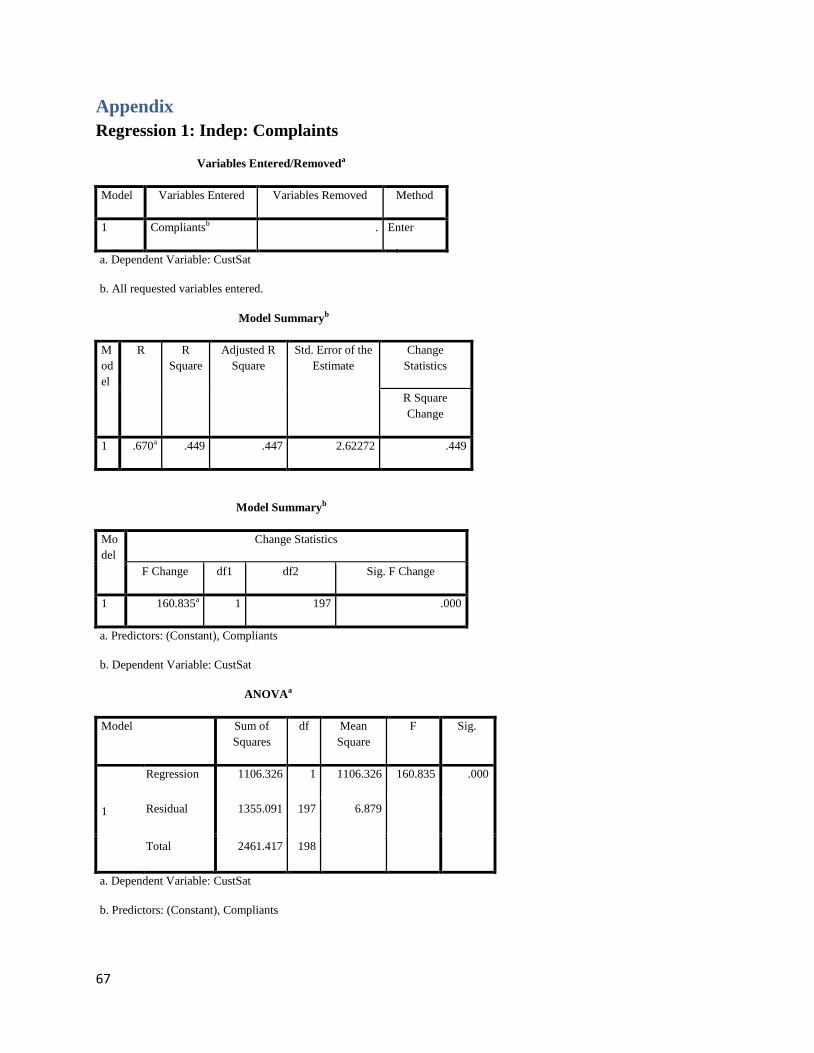
67
Appendix
Regression 1: Indep: Complaints
Variables Entered/Removeda
Model Variables Entered Variables Removed Method
1 Compliantsb . Enter
a. Dependent Variable: CustSat
b. All requested variables entered.
Model Summaryb
M
od
el
R R
Square
Adjusted R
Square
Std. Error of the
Estimate
Change
Statistics
R Square
Change
1 .670a .449 .447 2.62272 .449
Model Summaryb
Mo
del
Change Statistics
F Change df1 df2 Sig. F Change
1 160.835a 1 197 .000
a. Predictors: (Constant), Compliants
b. Dependent Variable: CustSat
ANOVAa
Model Sum of
Squares
df Mean
Square
F Sig.
1
Regression 1106.326 1 1106.326 160.835 .000
Residual 1355.091 197 6.879
Total 2461.417 198
a. Dependent Variable: CustSat
b. Predictors: (Constant), Compliants
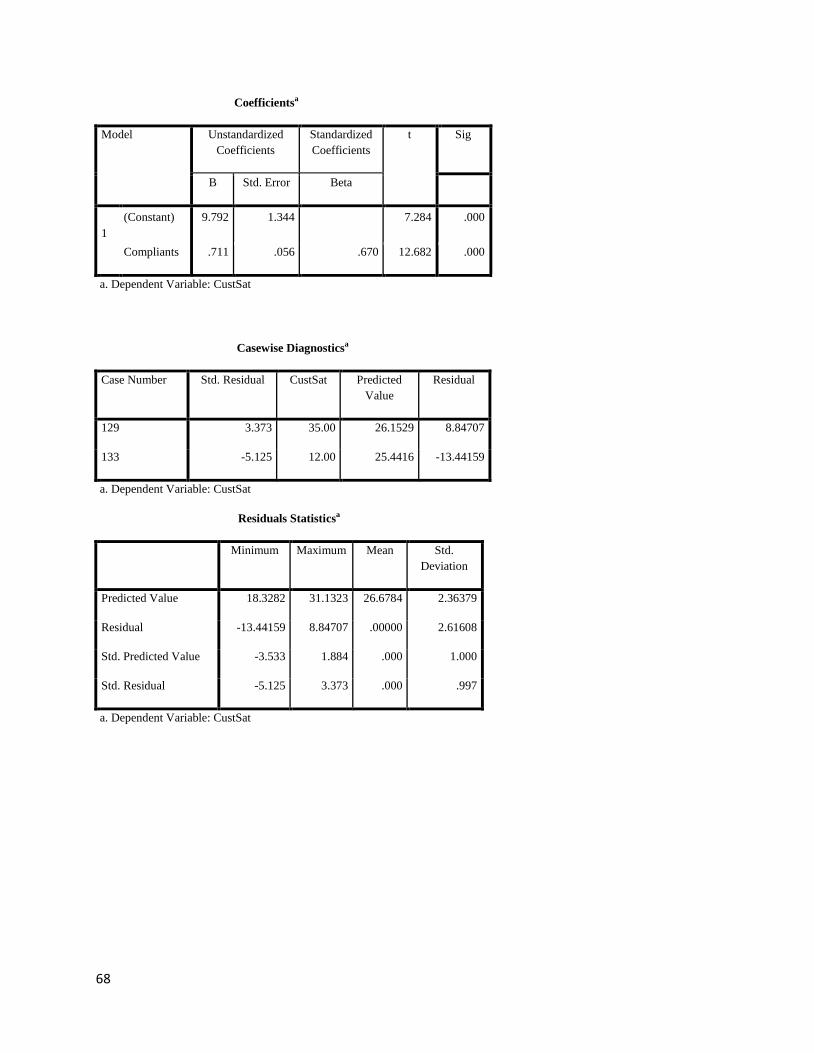
68
Coefficientsa
Model Unstandardized
Coefficients
Standardized
Coefficients
t Sig
B Std. Error Beta
1
(Constant) 9.792 1.344 7.284 .000
Compliants .711 .056 .670 12.682 .000
a. Dependent Variable: CustSat
Casewise Diagnosticsa
Case Number Std. Residual CustSat Predicted
Value
Residual
129 3.373 35.00 26.1529 8.84707
133 -5.125 12.00 25.4416 -13.44159
a. Dependent Variable: CustSat
Residuals Statisticsa
Minimum Maximum Mean Std.
Deviation
Predicted Value 18.3282 31.1323 26.6784 2.36379
Residual -13.44159 8.84707 .00000 2.61608
Std. Predicted Value -3.533 1.884 .000 1.000
Std. Residual -5.125 3.373 .000 .997
a. Dependent Variable: CustSat
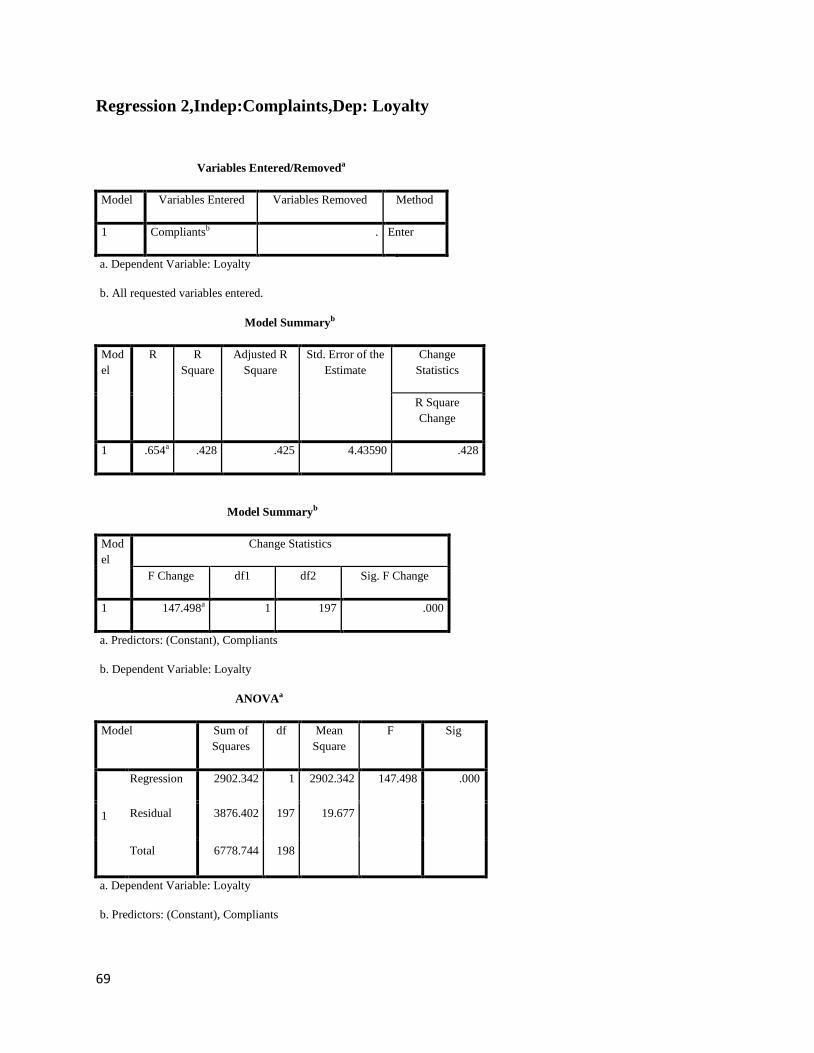
69
Regression 2,Indep:Complaints,Dep: Loyalty
Variables Entered/Removeda
Model Variables Entered Variables Removed Method
1 Compliantsb . Enter
a. Dependent Variable: Loyalty
b. All requested variables entered.
Model Summaryb
Mod
el
R R
Square
Adjusted R
Square
Std. Error of the
Estimate
Change
Statistics
R Square
Change
1 .654a .428 .425 4.43590 .428
Model Summaryb
Mod
el
Change Statistics
F Change df1 df2 Sig. F Change
1 147.498a 1 197 .000
a. Predictors: (Constant), Compliants
b. Dependent Variable: Loyalty
ANOVAa
Model Sum of
Squares
df Mean
Square
F Sig
1
Regression 2902.342 1 2902.342 147.498 .000
Residual 3876.402 197 19.677
Total 6778.744 198
a. Dependent Variable: Loyalty
b. Predictors: (Constant), Compliants
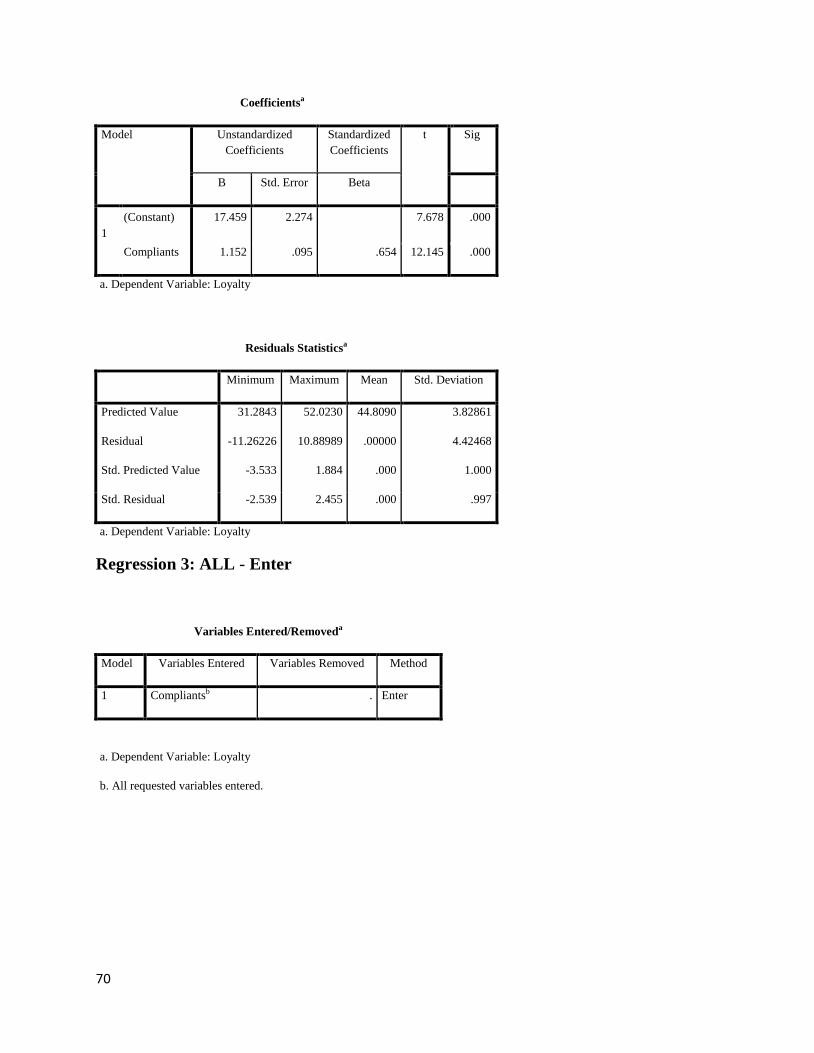
70
Coefficientsa
Model Unstandardized
Coefficients
Standardized
Coefficients
t Sig
B Std. Error Beta
1
(Constant) 17.459 2.274 7.678 .000
Compliants 1.152 .095 .654 12.145 .000
a. Dependent Variable: Loyalty
Residuals Statisticsa
Minimum Maximum Mean Std. Deviation
Predicted Value 31.2843 52.0230 44.8090 3.82861
Residual -11.26226 10.88989 .00000 4.42468
Std. Predicted Value -3.533 1.884 .000 1.000
Std. Residual -2.539 2.455 .000 .997
a. Dependent Variable: Loyalty
Regression 3: ALL - Enter
Variables Entered/Removeda
Model Variables Entered Variables Removed Method
1 Compliantsb . Enter
a. Dependent Variable: Loyalty
b. All requested variables entered.
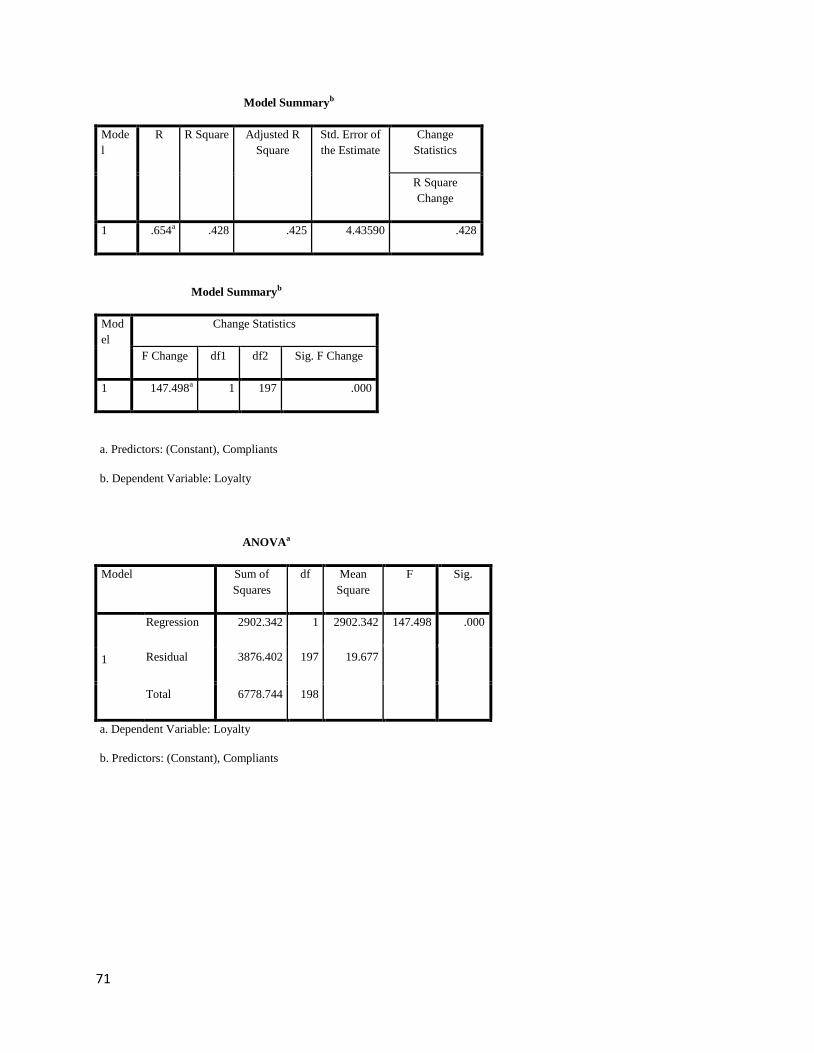
71
Model Summaryb
Mode
l
R R Square Adjusted R
Square
Std. Error of
the Estimate
Change
Statistics
R Square
Change
1 .654a .428 .425 4.43590 .428
Model Summaryb
Mod
el
Change Statistics
F Change df1 df2 Sig. F Change
1 147.498a 1 197 .000
a. Predictors: (Constant), Compliants
b. Dependent Variable: Loyalty
ANOVAa
Model Sum of
Squares
df Mean
Square
F Sig.
1
Regression 2902.342 1 2902.342 147.498 .000
Residual 3876.402 197 19.677
Total 6778.744 198
a. Dependent Variable: Loyalty
b. Predictors: (Constant), Compliants
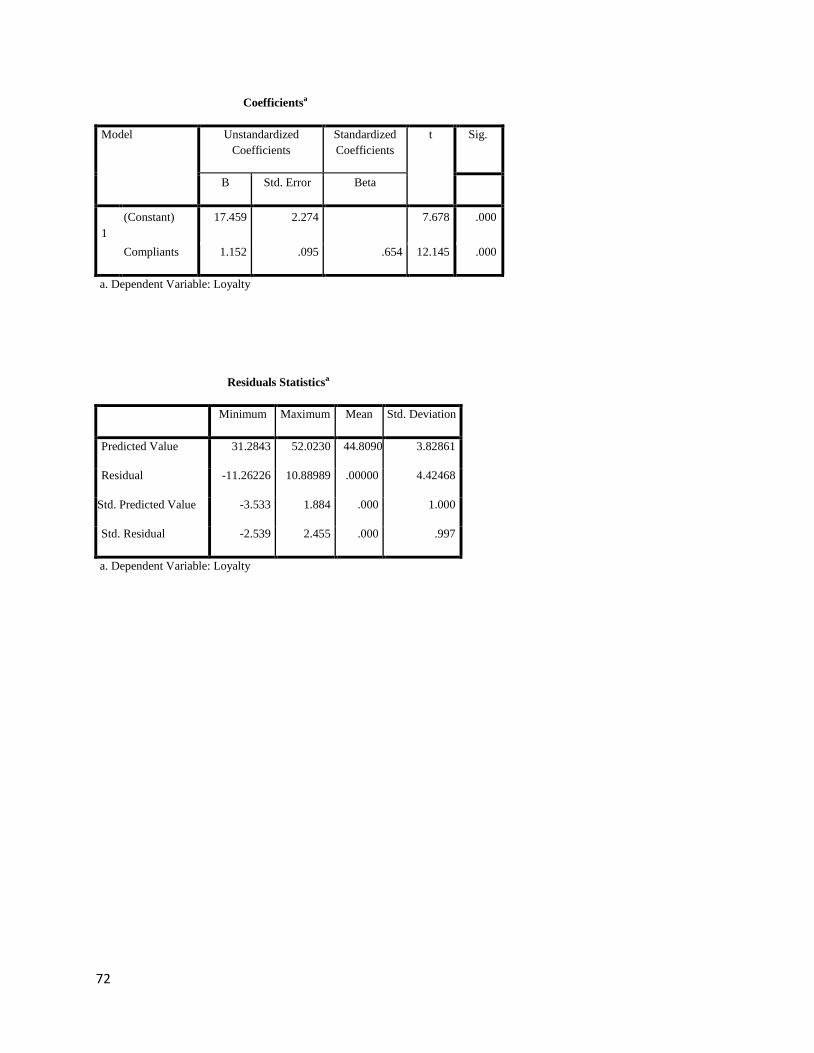
72
Coefficientsa
Model Unstandardized
Coefficients
Standardized
Coefficients
t Sig.
B Std. Error Beta
1
(Constant) 17.459 2.274 7.678 .000
Compliants 1.152 .095 .654 12.145 .000
a. Dependent Variable: Loyalty
Residuals Statisticsa
Minimum Maximum Mean Std. Deviation
Predicted Value 31.2843 52.0230 44.8090 3.82861
Residual -11.26226 10.88989 .00000 4.42468
Std. Predicted Value -3.533 1.884 .000 1.000
Std. Residual -2.539 2.455 .000 .997
a. Dependent Variable: Loyalty
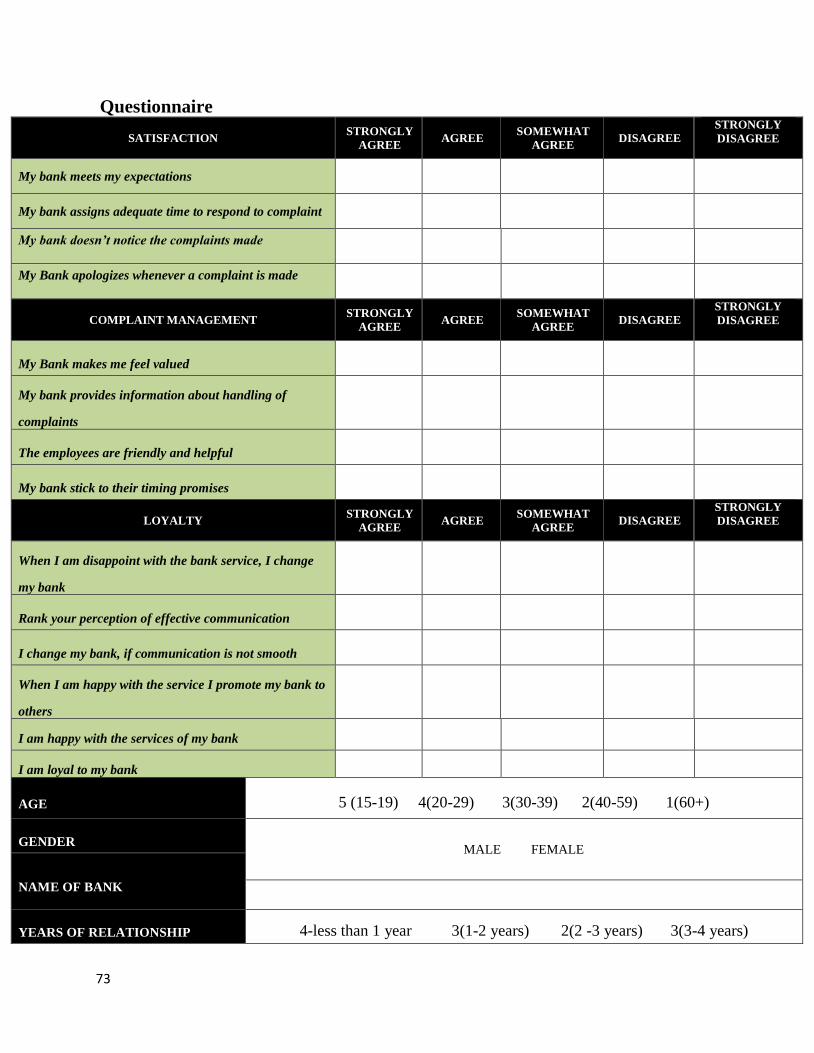
73
Questionnaire
SATISFACTION STRONGLY
AGREE AGREE
SOMEWHAT
AGREE DISAGREE
STRONGLY
DISAGREE
My bank meets my expectations
My bank assigns adequate time to respond to complaint
My bank doesn’t notice the complaints made
My Bank apologizes whenever a complaint is made
COMPLAINT MANAGEMENT STRONGLY
AGREE AGREE
SOMEWHAT
AGREE DISAGREE
STRONGLY
DISAGREE
My Bank makes me feel valued
My bank provides information about handling of
complaints
The employees are friendly and helpful
My bank stick to their timing promises
LOYALTY STRONGLY
AGREE AGREE
SOMEWHAT
AGREE DISAGREE
STRONGLY
DISAGREE
When I am disappoint with the bank service, I change
my bank
Rank your perception of effective communication
I change my bank, if communication is not smooth
When I am happy with the service I promote my bank to
others
I am happy with the services of my bank
I am loyal to my bank
AGE 5 (15-19) 4(20-29) 3(30-39) 2(40-59) 1(60+)
GENDER MALE FEMALE
NAME OF BANK
YEARS OF RELATIONSHIP 4-less than 1 year 3(1-2 years) 2(2 -3 years) 3(3-4 years)

74