Embed Size (px)
Citation preview

The Impact of Competitive Intensity on Future Profitability and Future Stock Returns
by
Feng Li University of Michigan
Ross School of Business
Russell Lundholm University of British Columbia
Sauder School of Business
Michael Minnis University of Chicago
Booth School of Business
August 2011 We would like to thank Daniel Beneish (discussant), Patricia Fairfield, seminar participants at the University of Arizona, the UBCOW conference, Georgetown University, the University of Texas-Dallas, the University of Waterloo, the University of Illinois-Chicago, the Winter Accounting Conference at the University of Utah, Massachusetts Institute of Technology, Santa Clara University, Eastern Illinois University, Duke University, The University of British Columbia, and Syracuse University for helpful comments.

The Impact of Competitive Intensity on Future Profitability and Future Stock Returns
ABSTRACT In this paper we investigate how management’s disclosures of their competitive environment are related to the firm’s future profitability and future stock returns. We find that the rate of diminishing returns on investment is negatively related to the frequency of references to competition in the 10-K. We also find that the well-documented asset growth/accrual anomaly in future stock returns is significantly larger for firms with frequent references to competition than for firms with relatively fewer references. Together, our results provide evidence that competition influences the rate of diminishing returns on investment, and that investors’ failure to take this into account is a major cause of the asset growth/accrual anomaly. Keywords: competition, disclosure, earnings persistence, earnings mean reversion, diminishing marginal returns

1
1. INTRODUCTION
In this paper we investigate how management’s discussion of competition in the
10-K can be used to predict a firm’s future profitability and future stock returns.
Financial statement analysis textbooks commonly recommend starting the evaluation
process by considering the firm’s competitive environment and its strategy for operating
in its environment (Healy and Palepu 2007, Lundholm and Sloan 2007, Penman 2009).
Further, the SEC recommends that the management discussion and analysis (MD&A)
section of the firm’s 10-K filing include a discussion of any changes in the firm’s
competitive position if these changes are the cause of the reported results (Exchange Act
Release No 34-48960). However, the SEC has recently expressed concern that many
companies provide only boilerplate disclosures in the MD&A (Pozen 2008). This raises
the question, is there information about the firm’s competitive environment that can be
gleaned directly from the firm’s own disclosures? In this paper we develop a measure of
competitive intensity based on statements made in the firm’s 10-K and show how this
new measure helps predict future operating performance. We also find that our
measure reveals something about the firm’s future performance that is not fully
understood by the stock market.
How management perceives the competitive intensity of the firm’s environment
can significantly influence their operating and investing decisions. For example, how
they price their products depends on how they perceive the threat of substitutes from
existing rivals or the threat of new entrants into their markets. How rapidly they invest
in assets depends on whether they believe there are many or few rivals, and how
contestable the investments are by those rivals. Further, the realized level of

2
competition has an obvious impact on the subsequent payoffs to these operating and
investing decisions. A simple model that incorporates these ideas relates a firm’s
competitive environment to the rate of diminishing marginal returns on existing assets
and on new investments. Economists have long held that competition causes these
returns to mean-revert. Stigler (1963) states that “There is no more important
proposition in economic theory than that, under competition, the rate of return on
investment tends toward equality in all industries. Entrepreneurs will seek to leave
relatively unprofitable industries and enter relatively profitable industries.” We
hypothesize that the more competitive intensity management reports in their 10-K, the
faster the returns on new investments and existing assets will mean revert.
Consistent with these ideas, we find that a firm’s return on net operating assets
(RNOA) mean reverts more severely, and that returns on new investment in net
operating assets diminish faster, when management makes more references to
competition in the 10-K. We show that these results are robust to different measures of
profitability, different definitions of assets, and controlling for other measures of
competition. Further, the economic significance of the results is shocking. The
coefficient of mean reversion on RNOA is -0.197 for the lowest decile of competitive
intensity but -0.292 for the highest decile of competition intensity. Furthermore, after
controlling for the mean reversion effect, the rate of diminishing returns on new
investments in net operating assets (NOA) is -0.086 for the lowest decile of competitive
intensity and -0.160 for the highest decile.
After documenting how competition conditions the relation between future
changes in RNOA, the past level of RNOA, and past changes in NOA, the next question is

3
whether the stock market appropriately prices these relations. Extensive prior research
on the accrual anomaly in accounting, or the asset growth anomaly in finance,
documents a negative relation between changes in assets and future abnormal stock
returns (see Richardson et al. 2005, Cooper et al. 2008, Hirshleifer et al. 2004, and
references therein). Although a number of explanations for the anomaly have been
offered, most relevant for our work are the results in Fairfield et al. (2003). They argue
that the anomaly arises because the market fails to fully account for diminishing
marginal returns to investment, and is surprised when future RNOA changes in response
to changes in NOA. If this is the case then the mispricing should be most pronounced
when the rate of diminishing returns on new investment is the fastest. Based on our
previous results, this would be the case when reported competitive intensity is high.
Consistent with this, we find that the mispricing of changes in net operating assets (i.e.
accruals) is largest when management’s references to competition are the highest.
Within the highest quintile of reported competitive intensity, a portfolio that takes a
long position in the lowest quintile of change in NOA and a short position in the highest
quintile earns a 21.5% size-adjusted return in the subsequent year; when reported
competitive intensity is in the lowest quintile the same hedge strategy earns only 8.4%.
We show that these results are robust to different measures of asset growth and other
controls for risk.
Our measure of a firm’s competitive environment is surprisingly simple: we
count the number of references to competition in the firm’s 10-K filing, being careful to
remove phrases such as “less competitive,” and then scale by the total number of words
in the document. The result is a measure of the competitive intensity as perceived by

4
management and reported in their 10-K. This measure is intended to capture the
broadest notion of competition – the basic idea that more intense behavior from new
and existing rivals diminishes a firm’s ability to earn profits. While many of the
references to competition in the 10-K might be boilerplate, we find a surprising amount
of variation in our measure. The first quartile value is 0.28 competition words per
thousand 10-K words and the third quartile is 0.86 words per thousand. Although the
measure is weakly correlated with the Herfindahl index, we show that the bulk of the
explanatory power in our measure comes from differences between firms within an
industry, something that industry concentration measures such as the Herfindahl index
cannot capture. To validate our measure we compare it to nine other measures of
competition taken from the literature, showing that it is weakly related to many of them,
but captures something that is distinctly new. In particular, our results remain
significant after controlling for these other measures of competition.
An extensive literature in accounting establishes that a firm’s disclosures can be
influenced by concerns for what a rival firm may learn from the disclosure.1
1 For example, Wagenhofer (1990), Hayes and Lundholm (1996), Harris (1998), Leuz (2004), Berger and Hann (2007) is only a partial list of this literature.
While
taking these strategic forces into consideration would, in principle, increase the
information that can be gleaned from the management statements about competition,
our approach is simply to take the statements at face value. At the cost of losing some
information, we avoid having to make assumptions about the manager’s motive in
disclosing, which can be quite complex (see Karuna 2007, 2010 and Li 2010). Given the
empirical success of our simple measure, we leave the study of strategic motives to
future work.

5
In the next section we discuss our new measure of competition in more detail and
develop our hypotheses in the context of the existing literature. We present the results
from our tests in section 3 and conclude in section 4.
2. MEASURES AND HYPOTHESES
2.1 What is Competition and How Do We Measure it?
We present a new measure of competitive intensity based on textual analysis of a
firm’s 10-K filing. Before discussing the construction of the measure, it is useful to
consider what we could hope to capture with any measure of competition. How
competition affects firm performance is a central question in business and economics.
Porter (1979) famously identifies five sources of competitive intensity in an industry
that determine a firm’s performance (barriers to entry, threat of substitutes, competitive
rivalry, bargaining power of customers, and bargaining power of suppliers). A resource-
based view of competition emphasizes limiting imitation from rivals by developing
unique and rare resources (Barney 1986). Consistent with this view, Brown and
Kimbrough (2011) find that the degree to which a firm’s earnings co-vary with industry
earnings is negatively related to the firm’s level of identifiable intangible assets (e.g.
patents, copyrights, legal contracts). Another notion of competition, labeled ‘Red
Queen’ competition, describes how firms respond to innovation by rival firms with
innovations of their own, resulting in a self-escalating system wherein performance is
initially enhanced through innovation but later reduced by the responsive innovation of

6
rivals (Barnett and McKendrick 2004).2
Empirically, the most common measures of competition found in the literature
are concentration ratios, either the Herfindahl index or the four-firm concentration
ratio; both focus on the distribution of production across firms within the industry.
Concentrated industries, where the bulk of production is done by a few firms, are
thought to earn abnormal profits because barriers to entry thwart new entrants and the
existing firms can more easily collude (i.e., there is little competitive rivalry).
One can imagine that in different firms and
different contexts, management’s perception of their competitive environment might be
due to any of these concepts. But, as Barnett and McKendrick note, “A defining
characteristic of competition is that one organization’s solution becomes its rivals’
problem.” It is this broad construct that we wish to measure with our textual analysis of
management’s statements in the 10-K.
Although industry concentration ratios have a rich history in economics, they
lack precision when it comes to detecting how an individual firm’s operating and
investing decisions, and the financial consequences of those decisions, might be
influenced by competition. First, concentration is only defined at the industry level,
while we show that there is considerable variation in managements’ perceptions of
competition within an industry. Second, industries are sometimes crude ways to group
companies. Amazon is classified as “Retail-Catalog & Mail-Order Houses” (SIC code
5961) while eBay is classified as “Services-Business Services” (SIC code 7389) even
though they compete intensely in the online retail market. Accenture, the consulting
2 The name “Red Queen” competition comes from the Lewis Carroll’s Through the Looking Glass (Carroll 1960). When Alice realizes that, although she is running as fast as she can she doesn’t seem to get anywhere, the Red Queen responds: “Here, you see, it takes all the running you can do, to keep in the same place.”

7
services business spun out from Arthur Andersen, is also in SIC code 7389 along with
eBay, even though they are clearly in very different businesses. More broadly, Rauh and
Sufi (2010) offer large-sample evidence showing that SIC-code-based industry
definitions bear little relation to the list of competitors that firms disclose in their proxy
statements. Third, management decisions are based on their beliefs about competition,
which may not correspond with the industry’s actual competitive landscape or its
concentration ratio. In fact, if concentration ratios were perfect measures of
competition, we would expect no variation in managements’ discussions of competition
within an industry, and concentration ratios would explain all the variation across
industries. What we observe is markedly different; there is considerable variation in the
number of references to competition within industries and concentration ratios explain
very little of the variation across industries. Consistent with this, Dedman and Lennox
(2009) survey private firm managers in the UK and find no relation between the
managers’ perceptions of their competitive environment and the industry concentration
ratio.
We measure management’s perceptions of the intensity of the competition they
face using textual analysis of the firm’s 10-K filing. We count the number of occurrences
of “competition, competitor, competitive, compete, competing,” including those words
with an “s” appended, and then remove any case where “not,” “less,” “few,” or “limited”
precedes the word by three or fewer words. To control for 10-K length, we scale the
number of competition related words by the total number of words in the 10-K.. The
resulting measure of perceived competition is

8
NWORDSNCOMPPCTCOMP =
,
where NCOMP and NWORDS are the net number of occurrences of competition words
and the total number of words in a 10-K, respectively. In the empirical analysis, we use
the variable COMP, which is the decile-ranked value of PCTCOMP, computed each year,
then scaled to be in [0,1]. In robustness checks, we also construct a size-adjusted version
and a within industry-year version of PCTCOMP.
To illustrate the types of management statements our measure captures, figure 1
gives six examples. The first example from Columbia Sportswear offers a rather
standard reference to existing rivals. The second example from MHI Hospitality talks
about how competition may limit investment opportunities when investments are
contestable. The third example, also from Columbia Sportswear, refers to competition
for inputs, in this case for employees. The fourth example from Open Text Corp. sounds
exactly like “Red Queen” competition, describing a system of continual innovation in
response to rivals’ innovations.3
3 Open Text also illustrates why we use the whole 10-K filing rather than only the MD&A section. In their 2008 filing there were 74 competition references (out of 61,290 words); 19 in Item 1 Description of Business, 29 in Item 1A Risk Factors, 3 in Item 7 MD&A, 1 in Item 10 Directors and Officers, and 22 in Item 11 Executive Compensation. Further, because companies do not use uniform descriptions of the required items in a 10-K filing, it would be difficult to design an algorithm that would cleanly isolate each section.
The fifth example from First National Energy Corp
illustrates why we remove references to competition that are preceded by the words
“no” or “limited.” Finally, comparing the fifth example with the sixth example from Oil
Dri Corp. illustrates the subtlety of language and why no algorithm will be perfect. Oil
Dri’s reference to competition should count, and yet it will wrongly be eliminated

9
because it is preceded by “limited by.”4
Our approach is simple, parsimonious, and effective. To capture the abstract
notion of perceived competition in a more structured way would require much more
detailed assumptions about the context and linguistic structure of the references to
competition notions. However, more complicated methods in computational linguistics
and natural language processing literature often lead to minimum improvement at
significant costs (Berry 2004). For instance, Turney (2002) uses a simple unsupervised
learning algorithm to classify customer reviews of products on epinions.com into
positive and negative categories and shows that a parsimonious approach performs
equally well compared to more structured models.
Because of its stature in the literature, we make extensive comparisons between
our measure and the Herfindahl index. Further, in the beginning of section 3 we further
assess the construct validity of our measure by correlating it with nine other measures
of competition offered in Karuna (2007, 2010) and Li (2010). These papers examine
how industry-level competition influences management’s voluntary disclosures about
future operating activities (e.g. management earnings forecasts, segment disclosures,
research and development expenditures, order backlog). In contrast, we measure how
management’s disclosures about competition reveal information about future operating
performance.
4 As a practical matter, the part of the algorithm that eliminates competition references preceded by negative words has little impact on the results. An even simpler algorithm that counts only references to “competition” and “competitor” and these words with an “s” appended produces results that are extremely close to those reported here.

10
2.2 Hypotheses
We examine how the intensity of a firm’s competitive environment affects its
future financial performance by estimating the impact on the rate of mean reversion in
returns on existing assets and the rate of diminishing returns on new investments.
There are a number of reasons to expect competition to affect these two rates. Consider
a firm with no change to its asset base. Porter’s five forces give a laundry list of reasons
why firms with unusually high returns on existing assets will suffer declining returns as
competition arrives to erode their competitive advantage. Similarly, firms with
unusually low returns on existing assets will benefit from reduced competition as
competitors leave their markets in search of higher asset returns elsewhere.
Now consider how competition influences the return on new investments or
divestments (i.e. a changing asset base). Absent any competitive forces, returns on
investments typically diminish. For example, when growing, Starbucks opens stores at
the most profitable locations first so that subsequent investments are necessarily less
profitable. Similarly, when shrinking, Starbucks closes the least profitable stores first so
that the remaining assets are necessarily more profitable.5
5 Adam Smith (1776) summarized this hypothesis with “It may be laid down as a maxim, that wherever a great deal can be made by the use of money, a great deal will commonly be given for the use of it; and that wherever little can be made by it, less will commonly be given for it.” See also Karl Marx (1894) “The Tendency of the Rate of Profit to Fall,” Chapter 3 of Das Kapital, Volume 3.
This intuition is formalized
by Warusawitharana (2008). He presents a model where diminishing marginal returns
induce firms to invest or divest as their profitability changes. Effectively the firm is
attempting to adjust its size until its return on assets equals its cost of capital.
Consistent with this, he finds that a firm’s return on assets is a significant predictor of
asset sales and purchases. We hypothesize that competition intensifies this effect, as it

11
increases the rate of diminishing marginal returns. Real option theory maintains that in
the face of uncertain payoffs, a viable strategy is to wait and only invest when the
expected return exceeds some threshold higher than the cost of capital. Grenadier
(2002) shows, however, that this threshold decreases in the presence of competition if
rival firms can take contestable investment opportunities away from the firm. Simply
put, Starbucks will have a lower threshold for investment when making store-opening
decisions if there is a possibility that Caribou Coffee will claim the best locations while
they wait. Empirically, Akdogu and McKay (2009) find that firms in competitive
industries make large investments sooner than firms in monopolistic industries. This
leads to our first hypothesis.
H1: The change in next year’s RNOA is decreasing in the current level of RNOA and
decreasing in the change in current NOA. Both effects become more negative as
reported competition intensifies.
The first half of the hypothesis is supported by considerable prior accounting
research. Nissim and Penman (2001) find that return on equity mean reverts to an
economy-wide average (about 12%), and Fairfield et al. (2009) show that the return on
equity mean reverts to an economy-wide rate and not an industry rate. Fama and
French (2000) show that the mean reversion is significant after controlling for cross-
sectional correlation. Stigler (1968) and Lev (1983) find evidence of higher levels of
earnings persistence in concentrated industries and industries with higher barriers to
entry, respectively. Cheng (2005) finds that the rate of mean reversion in abnormal

12
return on equity is slower for larger firms in concentrated industries with barriers to
entry. Healy et al. (2011) find that international variation in measures of competition
predict international variation in the rate of mean reversion in return on equity.6
Fairfield et al. (2003) extend these results by estimating the relation between
future return on total assets (ROA), current ROA, and changes in net operating assets.
They find that the future ROA is significantly decreasing in the changes in NOA after
controlling for the current ROA. Richardson et al. (2005) find a similar result by
regressing future ROA on current ROA and total accruals, where total accruals equals the
change in NOA plus the change in non-cash net financial assets (i.e., non-cash financial
assets less financial liabilities). They find that, after controlling for current ROA, future
ROA is significantly decreasing in total accruals.
7 They then decompose total accruals
and find that the diminishing rates of return are driven primarily by the changes in the
net operating assets, as opposed to changes in the net financial assets. 8
The first half of our paper furthers these financial statement analysis results by
conditioning the relations between future RNOA, current RNOA and changes in NOA on
the level of competitive intensity. After establishing a statistically significant and
economically large influence of competition on accounting rates of return, we ask if the
stock market correctly prices the moderating influence of competition. There is a wealth
6 Dickinson and Sommers (2011) study a number of variables that are hypothesized to proxy for ‘competitive effort,’ including inventory turnover, the ratio of operating liabilities to net operating assets, financial leverage and net financial assets. They find that these variables help to predict next year’s industry and risk-adjusted RNOA as main effects, but they find no evidence that the variables condition the rate of mean reversion in returns. 7 Curtis and Lewis (2010) find that the negative relation between future ROA and changes in NOA is due largely to firms with ‘old’ assets. 8 A different branch of the literature further decomposes return on asset measures into the profit margin times the asset turnover ratio, finding that changes in profit margin are more transitory than changes in asset turnover. See Nissim and Penman (2001), Fairfield and Yohn (2001), and Soliman (2008).

13
of literature documenting the mispricing of accruals or, almost equivalently, asset
growth. Recently, Richardson et al. (2005) find that there is an 18% difference in one
year ahead size-adjusted returns between the bottom and top deciles of firms sorted on
the change in NOA (scaled by average total assets). Given that changes in NOA are the
primary driver of diminishing marginal return on assets in their paper, this suggests that
investors do not fully appreciate this effect. Similarly, Cooper et al. (2008) report a 20%
difference in next year’s returns between the bottom and top deciles of firms sorted on
the percentage growth in total assets after making standard risk adjustments.
The explanations for these results vary. Sloan (1996) originally argued that
investors fail to appreciate that accruals mean revert faster than cash flows, while
Fairfield et al. (2003) argue that they fail to understand diminishing marginal rates of
return on investment. Titman et al. (2004) argue that investors fail to account for
empire-building management, noting that the mispricing of asset growth is significantly
lower in periods when corporate oversight is highest. Hirshliefer et al. (2004) argue
that investors simply have limited attention and are misled by past reported earnings
that exceed past cash flows, as captured by the growth in net operating assets. Because
we find that reported competitive intensity has such a strong effect on the rate of
diminishing marginal returns on investment, we hypothesize that the mispricing of asset
growth will depend on the degree of reported competition.
H2: The one-year-ahead abnormal returns to a long/short portfolio based on the change
in NOA is increasing in the level of reported competitive intensity.

14
Note that the hypothesis conditions the asset growth anomaly on reported competitive
intensity, it does not propose a main effect for competition by itself. Further, we
propose that competition affects future stock returns through a specific mechanism:
investors fail to account for diminishing returns on new investment, causing the asset
growth anomaly, and competitive intensity affects the rate of diminishing returns, and
should therefore affect the abnormal returns to an asset growth trading strategy.
3. RESULTS
3.1 The Sample
We construct our sample based on the intersection of firm-years available on the
EDGAR filings database, where we get the textual data on perceived competition, and the
Compustat annual file for years 1995-2006. Most EDGAR filings are not available prior
to 1995. We merge these databases based on Compustat GVKEY and the SEC’s Central
Index Key and eliminate financial firms (SIC codes 6000-6999). For the returns tests we
require the firm to have data on CRSP at the time of portfolio formation but we do not
impose this requirement for the financial performance tests.
We require that the firm have sufficient financial data to compute the return on
net operating assets, return on total assets, the change in net operating assets, the
change in total assets, and the book-to-market ratio. We also eliminate firms with sales,
net operating assets or total assets that are less than zero, or if their market value is less
than $1 million. Finally, consistent with prior studies, we eliminate firms with extreme
financial ratios. Specifically, we eliminate firms with return on net operating assets or
return on total assets greater than 100% or less than -100%, and eliminate firms with
15
sales growth of greater than 1000%. The final sample is 28,678 firm-years for the
financial performance tests (which require next year’s RNOA data) and 31,946 for the
returns tests (which only require the current year’s data). All financial variables other
than returns are winsorized at the 1% and 99% level.
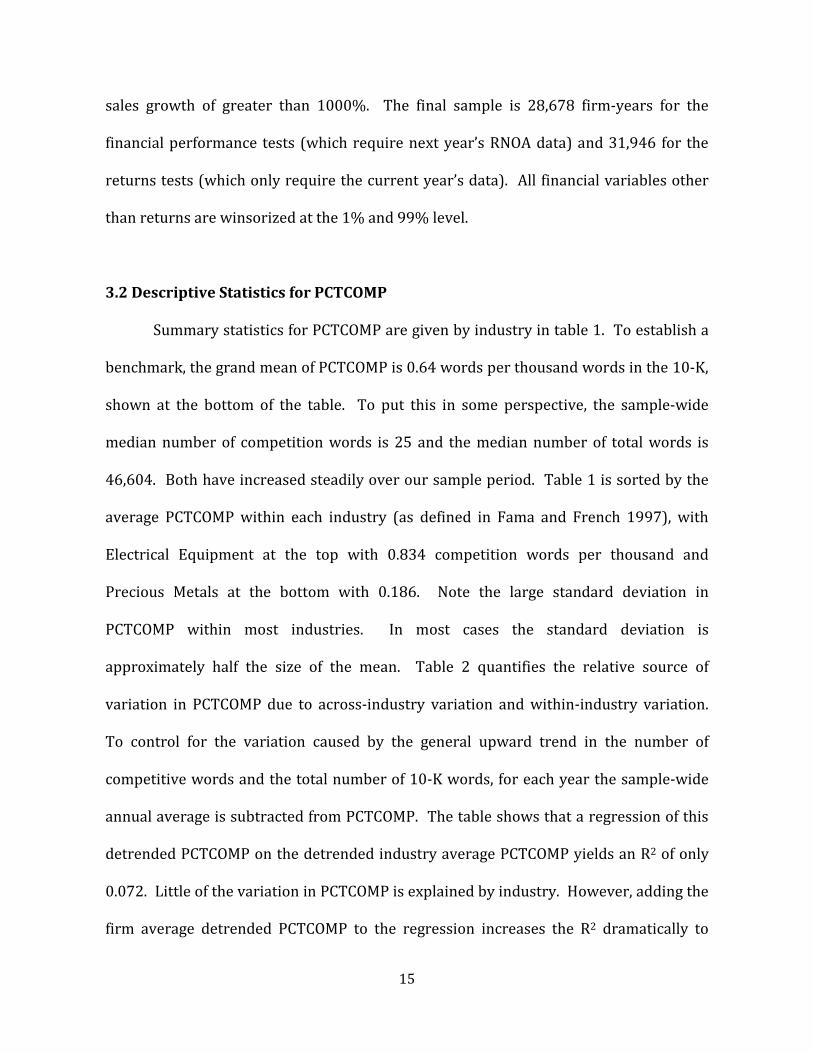
3.2 Descriptive Statistics for PCTCOMP
Summary statistics for PCTCOMP are given by industry in table 1. To establish a
benchmark, the grand mean of PCTCOMP is 0.64 words per thousand words in the 10-K,
shown at the bottom of the table. To put this in some perspective, the sample-wide
median number of competition words is 25 and the median number of total words is
46,604. Both have increased steadily over our sample period. Table 1 is sorted by the
average PCTCOMP within each industry (as defined in Fama and French 1997), with
Electrical Equipment at the top with 0.834 competition words per thousand and
Precious Metals at the bottom with 0.186. Note the large standard deviation in
PCTCOMP within most industries. In most cases the standard deviation is
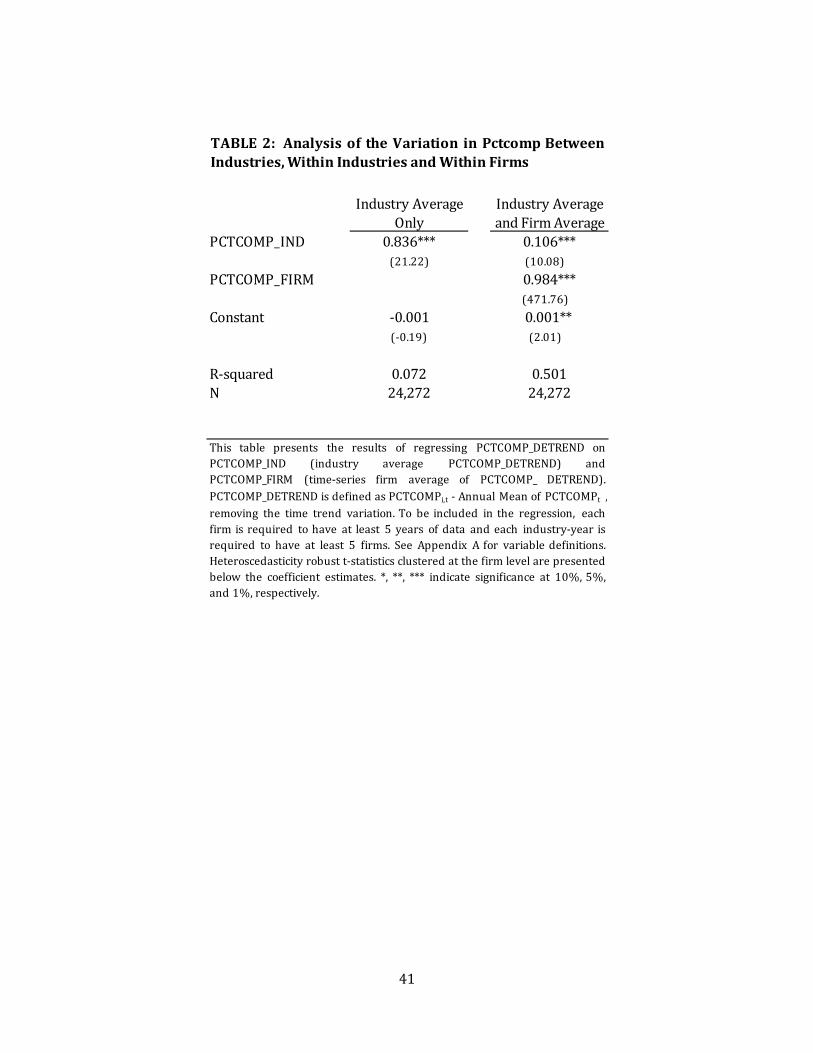
approximately half the size of the mean. Table 2 quantifies the relative source of
variation in PCTCOMP due to across-industry variation and within-industry variation.
To control for the variation caused by the general upward trend in the number of
competitive words and the total number of 10-K words, for each year the sample-wide
annual average is subtracted from PCTCOMP. The table shows that a regression of this
detrended PCTCOMP on the detrended industry average PCTCOMP yields an R2 of only
0.072. Little of the variation in PCTCOMP is explained by industry. However, adding the
firm average detrended PCTCOMP to the regression increases the R2 dramatically to

16
0.501. Industry membership does not capture much of the variation in management’s
discussion of the firm’s competitive environment, while the measure’s average at the
firm level captures a significant amount of the variation.
To validate that our measure is picking up the broadly-defined construct
“competition,” in table 3 we relate it to the nine measures of competition offered in Li
(2010).9
9 See the discussion in Li (2010) for references to the accounting and economics literature that originally proposed each of these measures, and for precise definitions of the computations of the measures.
These are 1) the weighted average of property, plant, and equipment in the
industry (IND-PPE); 2) the weighted average of research and development in the
industry (IND-R&D); 3) the weighted average of capital expenditures in the industry
(IND-CPX). For these three weighted average measures, each firm’s amount is weighted
by the ratio of its segment sales to industry aggregate sales, creating a “representative
firm” measure for each industry. The other measures are 4) the product market size
(IND-MKTS), measured as the natural log of industry aggregate sales; 5) the four-firm
concentration ratio (IND-CON4), measured as the sum of market shares of the four
largest firms in an industry; 6) the Herfindahl-Hirschman Index (IND-HHI), measured as
the sum of squared market shares of all firms in an industry; 7) the total number of firms
in the industry (IND-NUM); 8) the price-cost margin (IND-MGN), measured as industry
aggregate sales divided by industry aggregate operating costs; and 9) the return on
assets (IND-ROA), measured as industry aggregate operating profit before depreciation
divided by industry aggregate total assets. The first four measures are commonly
considered to measure competition from new rivals, measures five to seven are
considered measures of competition from existing rivals, and measures eight and nine
are measures of industry profitability and as such could attract attention from either

17
new or existing rivals. Other than IND-NUM, all constructs are predicted to be
decreasing as competition increases. Note also that, consistent with the industrial
organization view of competition, all nine measures are defined at the industry level.
Panel A of table 3 gives the value of each alternative competition measure sorted
by quintiles of PCTCOMP, along with t-statistics for the difference in means between the
top and bottom quintile. Panel B gives the Pearson and Spearman correlations. As table
3 shows, PCTCOMP is weakly related to most of the other proxies for competitive
intensity. Two measures have the wrong sign, IND-R&D and IND-MKTS, although the
Spearman correlation between IND-MKTS and PCTCOMP is insignificantly positive. Of
particular note, based on the t-statistic size, are IND-PPE, IND-R&D, and IND-NUM.
Firms in industries with larger PP&E levels reference competition in their 10-K
significantly less than firms in industries with smaller PP&E levels, consistent with the
idea that the required investment in these industries creates barriers to entry, and so
competitors pose a less significant threat to them. Firms in industries with more
member firms (IND-NUM) reference competition more frequently, consistent with the
idea that they experience more competition from existing rivals and hence, reference
competition more frequently. Both effects are economically significant; firms in the
lowest quintile of PCTCOMP have 47 percent more PPE and 63 percent fewer firms in
their industry than firms in the highest quintile of PCTCOMP.
The only variable that appears anomalous in table 3 is IND-R&D, which is
increasing with PCTCOMP when the prediction is that it should be decreasing. The
argument, based on a resource-model of competition given in Li (2010), is that firms
create barriers to entry with R&D expenditures, and yet we find that the firms with the

18
largest R&D expenditures discuss competition the most in their 10-K. However, Brown
and Kimbrough (2011) argue and find empirical support for the idea that R&D
expenditures only create barriers to entry when they are associated with a recognized
intangible asset, such as a patent, copyright or other legal contract. Further, R&D
expenditures may represent “Red Queen” competition, and the management’s
discussion is in response to the need to make continuous innovations in response to
rivals’ innovations (as the example of Open Text Corp. in figure 1 illustrated).
In sum, PCTCOMP appears to be a valid measure of competition insofar as it is
correlated to other well-known measures, but the relatively low correlations imply that
PCTCOMP is not simply a noisy version of another construct. In particular, we show in
the next section that our measure is significant in the presence of these other measures,
and gains a significant portion of its predictive power from its within-industry
variation.10
3.3 Other Variable Definitions and Descriptive Statistics
The remaining variable definitions follow the definitions used in the prior
literature (the Xpressfeed codes are italicized in parentheses—see Appendix A for
additional description of the variable definitions). Financial statement variables without
a time subscript are measured as of the end of the current fiscal year t. RNOA is defined
as operating income after depreciation (oiadp) divided by the average net operating
10 In addition to restricting variation at the industry level, research suggests other practical limitations of industry concentration measures. Ali et al. (2009), for example, find that industry-based concentration measures of competition constructed using only the public firm data available in Compustat are poor proxies for the actual industry concentration measures which should take into account privately owned firms as well. We consider this a further advantage of our measure because a firm’s discussion of competition is not restricted to only publicly owned firms.

19
assets (NOA), where NOA is defined as net accounts receivable (rect) + inventories (invt)
+ all other current assets (aco) + net property, plant and equipment (ppent) +
intangibles (intan) + all other assets (ao) – accounts payable (ap) – all other current
liabilities (lco) – all other liabilities (lo). This construction of NOA follows Fairfield et al.
(2003). Our object of prediction is the one-year-ahead change in RNOA, denoted as
D_RNOAt+1.
We focus on RNOA rather than ROA because diminishing returns to investment
apply primarily to operating assets.11
Other financial variables used as descriptive measures, or as controls in the
return regressions, are as follows. Market value (MV) is calculated as the natural log of
the market value of equity at the end of the fiscal year (price (prc) x shares outstanding
(shrout)). The book-to-market ratio (BM) is included as a risk control, computed as the
fiscal year-end book value of common equity (ceq) divided by the market value of equity
at the end of the fiscal year. Sales growth is defined as the year-over-year percentage
Consistent with this, in untabulated tests we find
similar but weaker evidence supporting our first hypothesis based on the return on
assets (ROA), defined as operating income after depreciation divided by average total
assets (at). Nonetheless, because the finance literature studied the relation between the
change in total assets and future returns, we carry this variable through the analysis and
use it to examine the second hypothesis (in addition to the change in net operating
assets).
11 Financial assets and liabilities may exhibit diminishing returns for sufficiently large changes. However, the rate of return on investments in financial assets does not generally vary with the size of the investment until the investment is completely owned and the next best financial investment is made. Similarly, the rate of interest charged on a financial obligation does not vary within a debt issue, but may increase when a new issue is made.
20
change in sales (sales).
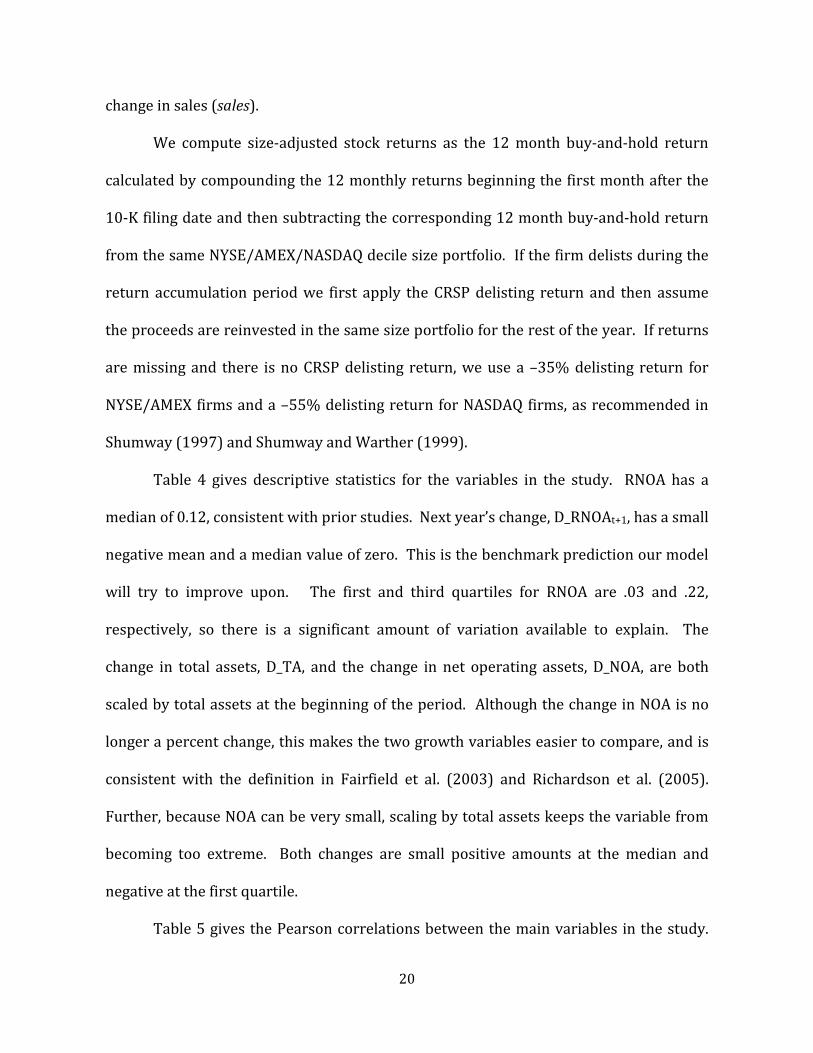
We compute size-adjusted stock returns as the 12 month buy-and-hold return
calculated by compounding the 12 monthly returns beginning the first month after the
10-K filing date and then subtracting the corresponding 12 month buy-and-hold return
from the same NYSE/AMEX/NASDAQ decile size portfolio. If the firm delists during the
return accumulation period we first apply the CRSP delisting return and then assume
the proceeds are reinvested in the same size portfolio for the rest of the year. If returns
are missing and there is no CRSP delisting return, we use a –35% delisting return for
NYSE/AMEX firms and a –55% delisting return for NASDAQ firms, as recommended in
Shumway (1997) and Shumway and Warther (1999).
Table 4 gives descriptive statistics for the variables in the study. RNOA has a
median of 0.12, consistent with prior studies. Next year’s change, D_RNOAt+1, has a small
negative mean and a median value of zero. This is the benchmark prediction our model
will try to improve upon. The first and third quartiles for RNOA are .03 and .22,
respectively, so there is a significant amount of variation available to explain. The
change in total assets, D_TA, and the change in net operating assets, D_NOA, are both
scaled by total assets at the beginning of the period. Although the change in NOA is no
longer a percent change, this makes the two growth variables easier to compare, and is
consistent with the definition in Fairfield et al. (2003) and Richardson et al. (2005).
Further, because NOA can be very small, scaling by total assets keeps the variable from
becoming too extreme. Both changes are small positive amounts at the median and
negative at the first quartile.
Table 5 gives the Pearson correlations between the main variables in the study.

21
In terms of our variable of interest, COMP (the decile-ranked value of PCTCOMP), the
most extreme correlation is with market value (MV); bigger firms report relatively less
competition than smaller firms. In terms of D_RNOAt+1, the two main effects of
diminishing marginal returns are present; the future change in RNOA has a negative
correlation with the current period’s level (RNOA) and a negative correlation with the
current period’s change in operating assets (D_NOA). Further, the economic magnitude
of the relation between D_RNOAt+1 and firm size, as measured by MV, is immaterial.
3.4 The Influence of Reported Competition on Changes in Future Performance
To assess the impact of reported competition on the rate of diminishing returns
on current and new investments, we estimate variations on the following two
regressions:
D_RNOAi,t+1 = ΣβtIt + β1*RNOAi,t + β2*D_NOAi,t + ei,t (1)
and
D_RNOAi,t+1 = ΣβtIt + β1*RNOAi,t + β2*D_NOAi,t +
β3*COMPi,t + β4*RNOAi,t*COMPi,t + β5*D_NOAi,t*COMPi,t + ei,t . (2)
The first regression gives the estimated diminishing marginal return relations before
any consideration of reported competition and the second regression fully interacts all
the variables in the first regression with COMP (recall that COMP is scaled such that it is
zero in the lowest decile and one in the highest decile). In equation 1, β1 measures the
rate of mean reversion in RNOA absent any change in NOA; as such, it measures the

22
diminishing marginal rate of return on existing assets. Controlling for the mean
reversion in RNOA, the coefficient β2 estimates the diminishing marginal rate of return
on changes in NOA. Both β1 and β2 are hypothesized to be negative. In equation 2, these
effects are conditioned on the level of COMP, as measured by the coefficients β4 and β5,
both of which are hypothesized to be negative. Both regressions have year fixed effects,
denoted by ΣβtIt (in the tables we report only the average of the yearly fixed effects).
We include year fixed effects to control for a common period effect across all firms in a
year. In addition, all t-statistics are computed with standard errors clustered at the firm
level to control for unspecified correlation between observations for the same firm in
different years.
Consistent with prior research (Fairfield and Yohn 2001, Soliman 2008, Curtis
and Lewis 2010), the sample for the diminishing marginal return regressions in table 6
is limited to firms with positive operating income. While RNOA mean-reverts for a loss
firm, the rate of mean reversion is likely not the same as the rate for profit firms (Fama
and French 2000); the earnings of loss firms are more transitory than the earnings of
gain firms (Li 2011). Further, the rate of mean reversion toward profit is unlikely to be
increased by competition, which is what equation 2 would predict for loss firms.
Nevertheless, for completeness, in table 7 we give the results for the full sample.
The first column in table 6 shows significant diminishing marginal returns. The
coefficient of -0.114 on D_NOA means RNOA is estimated to decrease next year by over
10% of the increase in NOA, all else equal. The mean reversion coefficient of -0.256
implies that RNOA next year is estimated to decrease by over a quarter of the current
year’s RNOA. These coefficient estimates are consistent with prior studies. Column 2 in

23
table 6 reports the model when our measure of reported competition is interacted with
all the variables in column 1. The significant negative coefficients on COMP_D_NOA and
COMP_RNOA show that competition accelerates the rate of diminishing returns on new
investments and existing assets, respectively. And the economic magnitude is
impressive. The mean reversion coefficient on RNOA is -0.199 when competition is in
the lowest decile and is -0.199-0.089=-0.288 when competition is in the highest decile.
Similarly, the coefficient on D_NOA is -0.079 when competition is in the lowest decile
and -0.079-0.073=-0.152 when competition is in the highest decile.12
The last column in table 6 replaces RNOA with net operating margin (PM) and net
operating asset turnover (ATO). This is exploratory because we do not have a
hypothesis for why reported competition might affect margins or turnovers differently.
For a given level of operating assets, competition could reduce sales, and hence ATO, and
for a given level of sales, competition could reduce profit, and hence PM. What we see in
the third column of table 6 is that both effects are significant.
Table 7 presents four robustness tests. The first column estimates equation 2 on
the full sample that includes loss firms (approximately 19% of the sample). The main
effects of diminishing marginal returns on existing assets and new investments are still
present. Competition speeds the rate of mean reversion in RNOA by -0.039, which is
somewhat less than for the profit-only sample, and speeds the rate of diminishing
returns on new investment by -0.031, also less than in the profit-only sample. Both
12 While we are limited in the number of cross sections relative to prior studies, we also estimate the results using annual cross sectional regressions and average the coefficient estimates across the years. Following this approach, the coefficient estimates (t-statistics) are -0.073 (-2.72) and -0.064 (-2.12) for COMP_D_NOA and COMP_RNOA, respectively. While this approach controls for cross-sectional dependence, our main results account not only for cross sectional correlation using a time fixed effects but also for time series dependence within a firm by clustering the standard errors (Petersen 2009).

24
results remain significant but at lower levels.
Column 2 of table 7 presents results for a size-adjusted measure of perceived
competition. The concern is that the weak negative correlation between PCTCOMP and
size (measured as MV) is causing PCTCOMP to proxy for an underlying size effect. To
address this, we regress PCTCOMP on MV each year and use the residual as a size-
adjusted PCTCOMP. Column 2 shows that this adjustment has very little effect on the
results; the coefficient estimates and significance are very similar to the original results
in table 6.
The third column in table 7 forces the competition measure to capture only intra-
industry variation – something that the traditional industry-based measures of
competition cannot do. To construct this measure we create deciles of PCTCOMP within
each industry-year (as opposed to each year). The results in column 3 reveal that a
significant portion of the predictive power from our competition measure comes from
variation within the industry. While the coefficients on COMP_RNOA and COMP_D_NOA
are smaller than in table 6 (i.e., inter-industry variation has some explanatory power as
expected), they are still statistically significant and economically relevant. Again, this is
predictable variation that, by definition, an industry-level measure of competition
cannot capture.
Finally, in the fourth column of table 7 we include the current year change in
RNOA (D_RNOA) in the regression to account for any correlation between
contemporaneous performance and management’s discussion of competition. If, for
example, management tends to blame a decline in performance on competition and this
decline persists, then our competition measure may simply be picking up information

25
that is already included in the financial results. Column 4 indicates that, while changes
in performance persist (i.e., the coefficient on D_RNOA is significantly positive,
consistent with Fairfield and Yohn 2001), this has little effect on the magnitude of the
coefficients on COMP_RNOA and COMP_D_NOA.
In table 3 we validated our measure by showing that it was weakly correlated
with other accepted measures of competition. Table 8 shows that our results are not
due to an omitted-correlated variable problem where PCTCOMP is only a proxy for
another true competition effect. In particular, for each of the nine alternative
competition measures, we estimate the following equation, where IND-COMP is replaced
with the particular alternative measure in question:
D_RNOAi,t+1 = ΣβtIt + β1*RNOAi,t + β2*D_NOAi,t +
β3*COMPi,t + β4*RNOAi,t*COMPi,t + β5*D_NOAi,t*COMPi,t +
β3*IND_COMPi,t + β4*RNOAi,t*IND_COMPi,t + β5*D_NOAi,t*IND_COMPi,t + ei,t (3)
If our measure COMP is simply a noisy proxy for one of the IND-COMP measures, then
including them both in the same regression will cause COMP’s interactions with RNOA
and D_NOA to become insignificant. Table 8 gives the results. Looking across the row
for COMP_RNOA and COMP_D_NOA shows that, with only one exception, the interactions
remain significant in the presence of all nine alternative proxies for competition.
Further, the coefficient magnitudes generally remain comparable to the levels in table 6,
while the coefficients on the alternative measure interactions are found to be both
negative and positive in sign.
In sum, we find that reported competitive intensity, as measured by

26
management’s discussion of competition in the 10-K, has a significant and economically
meaningful influence on the rate of diminishing return on existing assets and the rate of
diminishing returns on new investments/divestments. The results hold for a number of
different specifications designed to control for competing explanations and alternative
measures of competition.
To illustrate the effect of competition on the return on existing assets and new
investments, figures 2a and 2b graph the estimated coefficients from equation 1 within
each quintile of PCTCOMP. As both figures show, as reported competition increases, the
rates of diminishing returns become more negative. The biggest effect on the rate of
mean reversion in RNOA comes in the middle quintiles of PCTCOMP, while the biggest
effect on the rate of diminishing returns on new investment comes in the lowest
PCTCOMP quintile.
3.5 The Influence of Reported Competition on the Asset Growth Anomaly in Stock Returns
One explanation for the abnormal stock returns following changes in assets (i.e.
the growth anomaly in finance or the accrual anomaly in accounting) is that the market
fails to fully account for diminishing marginal returns to investment (Fairfield et al.
2003). Consequently, when assets increase investors are disappointed in the following
period when the return on assets falls. Similarly, when assets decline they are
pleasantly surprised when the return on assets increases. If this is the case then the
amplifying effect that competition has on the rates of diminishing marginal returns
should in turn amplify the returns to a hedge strategy based on changes in assets. To
investigate this, table 9 panel A gives the size-adjusted returns in the year following the

27
10-K filing (beginning in the month after the filing) for each combination of PCTCOMP
quintile and D_NOA quintile.
First, to establish some benchmarks, note that there is a significant asset growth
anomaly but no competition anomaly (as a main effect) in our data. To see this, totaling
across all levels of PCTCOMP the mean return in the first quintile of D_NOA is 0.081 and
the mean return in the fifth quintile is -0.062, resulting in a hedge return of 14.3%. This
is consistent with Richardson et al. (2005), Cooper et al. (2008) and a host of other
studies. In contrast, totaling across all levels of D_NOA, the mean return in the bottom
quintile of PCTCOMP is 0.016 and the mean return in the top quintile of PCTCOMP is
0.040, so the hedge return on reported competition as a main effect is 3.4%, which is
insignificant.
With benchmark returns in place, we assess our hypothesis that competition
amplifies the asset growth anomaly by comparing the return to the asset growth hedge
portfolio when PCTCOMP is high (quintile 5) versus when PCTCOMP is low (quintile 1).
As the table shows, competition clearly amplifies the asset growth anomaly. In the
highest quintile of PCTCOMP the asset growth hedge is 21.4%. In the lowest quintile of
PCTCOMP the asset growth hedge is only 8.4%. The difference in these two hedge
returns is 13.0% and is significant with a Fama MacBeth t-statistic of 2.89 (computed on
the mean annual abnormal returns for the 12 years in our sample). Clearly competition,
as measured by management’s discussion in the 10-K, plays a crucial role in the asset
growth anomaly. The results suggest that investors do not appreciate diminishing
returns on new investments/divestments and, in particular, do not appreciate the
amplifying effect that competition plays in this relation. Further, table 9 panel B shows

28
that the more traditional measure of competition, the Herfindahl index, does not exhibit
the same amplifying influence on the asset growth anomaly. For this table we construct
the Herfindahl index based on 3-digit SIC codes (HERF3) to eliminate some of the
extreme values that arise using a 4-digit composition. Table 9 shows that the hedge
return on D_NOA is only 4.1% larger in the highest quintile of HERF3 than in the lowest
quintile of HERF3.
The returns in table 9 are size-adjusted. As a specification check, in table 10 we
estimate Fama-MacBeth regressions on the decile-ranked values of the variables and
include the book-to-market ratio and the log of the market value of equity as additional
risk controls. We also estimate the regression using the change in total assets, D_TA,
rather than the change NOA to be comparable to the definition used in the finance
literature (Cooper et al. 2008). All independent variables are sorted into quintile ranks
and scaled to be between zero and one. The regressions are estimated separately on
each of the 12 years and then the coefficients are averaged across years. Because each
variable is scaled to be between zero and one, the coefficient estimates the hedge return
between the top and bottom deciles (although all the middle deciles still affect the
estimate). The first two columns show the main effect of the growth anomaly and then
the interactive effect of the growth anomaly with our measure of competitive intensity.
After controlling for book-to-market and market value, the estimated hedge return on
D_NOA is 11.8%. The second column shows the interaction with COMP. When COMP is
interacted with D_NOA, the D_NOA main effect is no longer significant but the interaction
term is significant. In other words, only when conditioned on the degree of competition
does the asset growth anomaly manifest itself. Interpreting some extreme values, when

29
COMP is in the lowest decile (COMP=0), the estimated return to a hedge on D_NOA is
0.058 and insignificant; when COMP is in the highest decile (COMP=1), the estimated
hedge return is 0.058+0.121 = 0.179 and is significant. Columns 3 and 4 show similar
results based on D_TA. There is an asset growth effect shown in column 3, with an
estimated hedge return of 10.4%, but when this is interacted with COMP, the hedge
returns on D_TA are only present when interacted with COMP. In both sets of tests, after
controlling for the book-to-market ratio and market value, the main effect of asset
growth is no longer present; it is only significant when conditioned on the level of
competition.
Figure 3 illustrates the impact of perceived competition on the asset growth
anomaly. For each quintile of PCTCOMP the figure gives the size-adjusted return to the
lowest and highest change in NOA quintiles (taken from table 9 panel A). The separation
of the two lines shows that there is clearly a main effect due to differences in the asset
growth rates. Beyond this, however, note that the lines diverge as PCTCOMP increases.
In the end, the asset growth hedge return in the highest quintile of PCTCOMP is roughly
twice as large as the hedge return in the lowest quintile of PCTCOMP.
4. CONCLUSION
By simply counting the number of times a firm refers to competition in its 10-K,
we measure a firm’s competitive intensity in a simple yet novel way. We show that this
measure is only weakly related to industry concentration and exhibits significant
variation across firms within the same industry. Further, we show that competition
magnifies the rate at which a firm’s return on net operating assets mean reverts and

30
exhibits diminishing returns to new investment. Conditioning a forecast of next year’s
return on net operating assets by the level of competition results in a significant and
economically meaningful difference between high and low levels of competition for the
average firm. When our measure of competition is in the highest quintile the rate of
diminishing returns on existing assets is almost 50 percent faster, and the rate of
diminishing returns on new investments is almost 100 percent faster, then when
competition is in the lowest quintile. Finally, we show that high levels of reported
competition amplify the well-documented asset growth/accrual stock market anomaly.
The size-adjusted hedge return on a long/short portfolio formed on the change in net
operating assets is almost three times larger in the highest quintile of competition than
in the lowest quintile. Further, after controlling for the book-to-market effect and size
effect, the asset growth anomaly is only present in the subset of firms where our
measure of competition is high. These return results are consistent with the prediction
that investors do not fully account diminishing returns on investments, and competition
exacerbates this effect.

31
REFERENCES Akdogu, E. and P. McKay. 2009. Investment and competition. Journal of Financial and
Quantitative Analysis 43(2): 299-330. Ali, A., S. Klasa, and E. Yeung. 2009. The limitations of industry concentration measures
constructed with Compustat data: Implications for finance research. The Review of Financial Studies 22(10): 3839-3871.
Barnett, W. P., & McKendrick, D. 2004. Why are some organizations more competitive
than others? Evidence from a changing global market. Administrative Science Quarterly 49: 535–571.
Barney, J. 1986. The types of competition and the theory of strategy: Toward an
integrative framework. Academy of Management Review 11: 791–800. Berger, P. and R. Hann. 2007. Segment profitability and the proprietary and agency costs
of disclosure. The Accounting Review 82(4): 869-906. Berry, M.W., 2004, Survey of Text Mining. Springer-Verlag New York LLC. Brown, N. and M. Kimbrough. 2011. Intangible investment and the importance of firm-
specific factors in the determination of earnings. Review of Accounting Studies, forthcoming.
Carroll, L. 1960. The annotated Alice: Alice’s adventures in wonderland and through the
looking- glass. New York: New American Library. Cheng, Q. 2005. The role of analysts’ forecasts in accounting-based valuation: A critical
evaluation. Review of Accounting Studies 10: 5-31. Cooper, M., H. Gulen, and M. Schill. 2008. Asset growth and the cross-section of stock
returns. The Journal of Finance 63 (4): 1609-1651. Curtis, A. and Lewis, M. 2010. The comparability of accounting rates of return under
historical cost accounting. Available at SSRN: http://ssrn. com/abstract=1660671. Dedman, E. and C. Lennox. 2009. Perceived competition, profitability and the
withholding of information about sales and the cost of sales. Journal of Accounting and Economics 48 (2-3): 210-230.
Dickinson, V. and Sommers, G. 2011. Which Competitive Efforts Lead to Future
Abnormal Economic Rents? Available at SSRN: http://ssrn. com/abstract=1012856. Fairfield, P. and T. Yohn. 2001. Using asset turnover and profit margin to forecast
changes in profitability. Review of Accounting Studies 6(4): 371-385.

32
Fairfield, P., J. Whisenant, and T. Yohn. 2003. Accrued earnings and growth:
implications for future profitability and market mispricing. The Accounting Review 78 (1): 353-371.
Fairfield, P., S. Ramnath, and T. Yohn. 2009. Do industry-level analyses improve
forecasts of financial performance? Journal of Accounting Research 47(1): 147-178. Fama, E., and K French. 1997. Industry costs of equity. Journal of Financial Economics 43:
153–193. Fama, E., and K French. 2000. Forecasting Profitability and Earnings. Journal of Business
73(2): 161-175. Grenadier, S. 2002. Option exercise games: An application to the equilibrium investment
strategies of firms. Review of Financial Studies 15(3): 691-721. Harris, M. 1998. The association between competition and managers’ business segment
reporting decisions. Journal of Accounting Research 36: 111-128. Hayes, R. and R. Lundholm. 1996. Segment reporting to the capital market in the
presence of a competitor. Journal of Accounting Research 34 (2): 261-79. Healy, P. and K. Palepu. 2007. Business Analysis and Valuation: Using Financial
Statements, Text and Cases. South-Western College Publishers, 4ed. Healy, P., Serafeim, G., Srinivasan, S. and Yu, G. 2011. Market Competition, Government
Efficiency, and Profitability Around the World. Available at SSRN: http://ssrn. com/abstract=1865878
Hirshleifer, D., K. Hou, S. Teoh, and Y. Zhang. 2004. Do investors overvalue firms with
bloated balance sheets? Journal of Accounting and Economics 38: 297-331. Karuna, C., 2007. Industry product market competition and managerial incentives.
Journal of Accounting and Economics 43(2): 275-298. Karuna, C., 2010. Industry product market competition and corporate voluntary
disclosure: Evidence from discretionary forward-looking line items at the industrial segment level. Working paper.
Leuz, C. 2004. Proprietary versus nonproprietary disclosures: Evidence from Germany.
The Economics and Politics of Accounting. Oxford University Press, New York, NY. Lev, B. 1983. Some economic determinants of time-series properties of earnings. Journal
of Accounting and Economics 5: 31-48.

33
Li, K. 2011. How well do investors understand loss persistence? Review of Accounting Studies, forthcoming.
Li, X., 2010. The impact of product market competition on the quantity and quality of
voluntary disclosures. Review of Accounting Studies 15(3): 663-711. Lundholm, R. and R. Sloan. 2007. Equity Valuation and Analysis. McGraw-Hill. Marx, K. 1894. Das Kapital, Vol. 3. Nissim, D.,and S. Penman. 2001. Ratio analysis and equity valuation: From research to
practice. Review of Accounting Studies 6: 109–54
Penman, S. 2009. Financial Statement Analysis and Security Valuation. McGraw-Hill, 4ed. Petersen, M. 2009. Estimating standard errors in finance panel data sets: Comparing
approaches. The Review of Financial Studies 22(1) 435-480. Porter, M. 1979. How competitive forces shape strategy. Harvard business Review,
March/April. Pozen, R., committee chairman. (2008). Final Report of the Advisory Committee on
Improvements to Financial Reporting to the United States Securities and Exchange Commission, August 1. Washington, DC: Securities and Exchange Commission Advisory Committee.
Rauh, J. and Sufi, A. 2010. Explaining Corporate Capital Structure: Product Markets,
Leases, and Asset Similarity. Available at SSRN: http://ssrn. com/abstract=1592463. Richardson, S., R. Sloan, M. Soliman, and I. Tuna. 2005. Accrual reliability, earnings
persistence and stock prices. Journal of Accounting and Economics 39: 437-485. Shumway, T. 1997. The delisting bias in CRSP data. Journal of Finance 52 (March): 327-
340. Shumway, T., and V.A. Warther. 1999. The delisting bias in CRSP’s Nasdaq data and its
implications for the size effect. Journal of Finance 54 (December): 2361-2379. Sloan, R., 1996. Do stock prices fully reflect information in accruals and cash flows about
future earnings? The Accounting Review 71: 289–315. Smith, A. 1776. An inquiry into the nature and causes of the wealth of nations. W. Strahan
and T. Cadell, London. Soliman, M. 2008. The use of DuPont analysis by market participants. The Accounting
Review 83(3): 823-853.

34
Stigler, G. 1963. Capital and rates of return in manufacturing industries. Princeton
University Press, Princeton, NJ. Stigler, G. 1968. The organization of industry. Irwin, Homewood, IL. Titman, S., K. Wei, and F. Xie. Capital Investments and Stock Returns. Journal of
Financial and Quantitative Analysis 39(4): 677-700. Turney, P. 2002. Thumbs up or thumbs down? Semantic orientation applied to
unsupervised classification of reviews. In Proceedings of the 40th annual meeting of the Association for Computational Linguistics, 417–424.
Wagenhofer, A. 1990. Voluntary disclosure with a strategic opponent. Journal of
Accounting and Economics 12: 341-363. Warusawitharana, M. 2008. Corporate asset purchases and sales: Theory and evidence.
Journal of Financial Economics 87: 471-497.
35
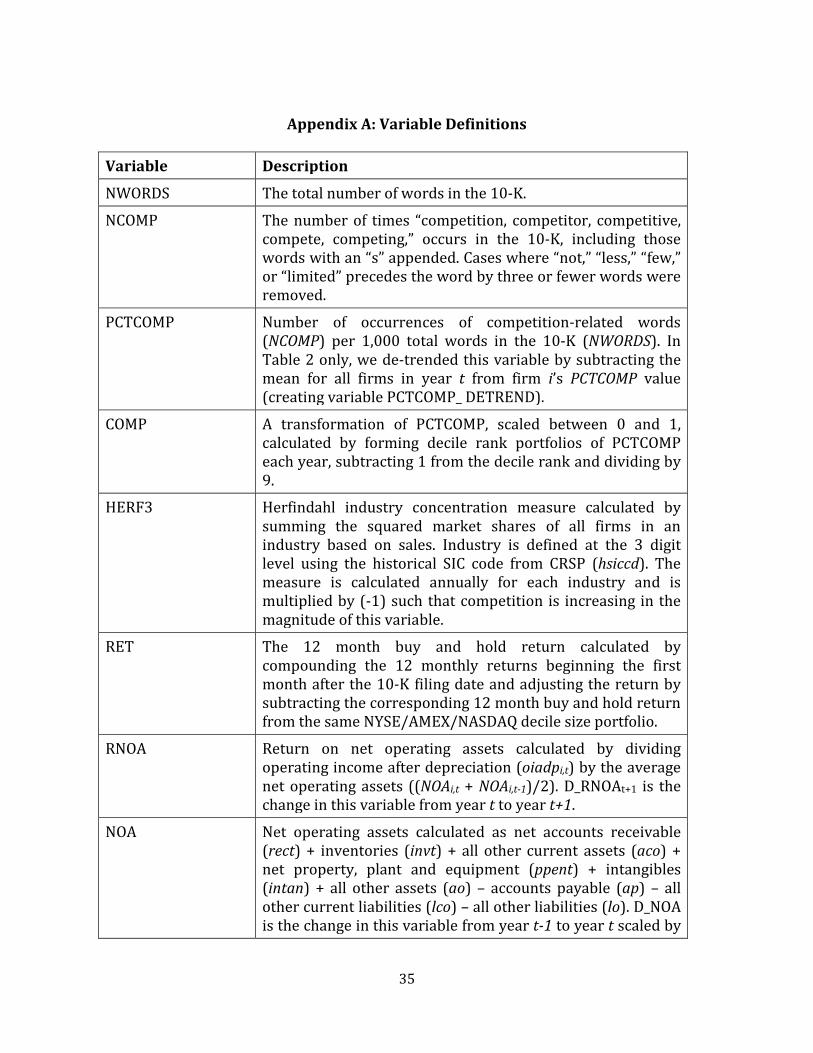
Appendix A: Variable Definitions
Variable Description
NWORDS The total number of words in the 10-K.
NCOMP The number of times “competition, competitor, competitive, compete, competing,” occurs in the 10-K, including those words with an “s” appended. Cases where “not,” “less,” “few,” or “limited” precedes the word by three or fewer words were removed.
PCTCOMP Number of occurrences of competition-related words (NCOMP) per 1,000 total words in the 10-K (NWORDS). In Table 2 only, we de-trended this variable by subtracting the mean for all firms in year t from firm i’s PCTCOMP value (creating variable PCTCOMP_ DETREND).
COMP A transformation of PCTCOMP, scaled between 0 and 1, calculated by forming decile rank portfolios of PCTCOMP each year, subtracting 1 from the decile rank and dividing by 9.
HERF3 Herfindahl industry concentration measure calculated by summing the squared market shares of all firms in an industry based on sales. Industry is defined at the 3 digit level using the historical SIC code from CRSP (hsiccd). The measure is calculated annually for each industry and is multiplied by (-1) such that competition is increasing in the magnitude of this variable.
RET The 12 month buy and hold return calculated by compounding the 12 monthly returns beginning the first month after the 10-K filing date and adjusting the return by subtracting the corresponding 12 month buy and hold return from the same NYSE/AMEX/NASDAQ decile size portfolio.
RNOA Return on net operating assets calculated by dividing operating income after depreciation (oiadpi,t) by the average net operating assets ((NOAi,t + NOAi,t-1)/2). D_RNOAt+1 is the change in this variable from year t to year t+1.
NOA Net operating assets calculated as net accounts receivable (rect) + inventories (invt) + all other current assets (aco) + net property, plant and equipment (ppent) + intangibles (intan) + all other assets (ao) – accounts payable (ap) – all other current liabilities (lco) – all other liabilities (lo). D_NOA is the change in this variable from year t-1 to year t scaled by

36
average total assets.
ROA Return on assets calculated by dividing operating income after depreciation (oiadpi,t) by the average total assets ((ati,t-1 + ati,t)/2).
TA Total assets (ati,t). D_TA is the change in this variable from year t-1 to year t scaled by the average total assets.
BM Book to market ratio calculated as the fiscal year-end book value of common equity (ceqi,t) divided by the market value of equity at the end of the fiscal year (price (prc) x shares outstanding (shrout)).
MV MV_$ is market value of equity at the end of the fiscal year (price (prc) x shares outstanding (shrout)). MV is the natural log of MV_$. Firms with market values less than $1 million have been deleted.
SGROWTH Year-over-year percentage change in sales calculated as (Salei,t – Salei,t-1)/Salei,t-1.

37
Figure 1
Competition References 1) “The markets for sportswear, outerwear, footwear, and related accessories and equipment are highly competitive. In each of our geographic markets, we face significant competition from numerous and varying competitors. Some of our large wholesale customers also pose a significant competitive threat by marketing apparel, footwear and equipment under their own private labels.” Columbia Sportswear Co., 2-27-2009 2) “We compete for investment opportunities with entities that have substantially greater financial resources than we do. These entities generally may be able to accept more risk than we can prudently manage. This competition may generally limit the number of suitable investment opportunities offered to us. This competition may also increase the bargaining power of property owners seeking to sell to us, making it more difficult for us to acquire new properties on attractive terms.” MHI Hospitality Corp, 3-25-2009 3) “Our future success will also depend on our ability to attract and retain key managers, designers, sales people and others. We face intense competition for these individuals worldwide, and there is a significant concentration of well-funded apparel and footwear competitors in and around Portland, Oregon.” Columbia Sportswear Co. 2-27-2009 4) “The markets for our products are intensely competitive, and are subject to rapid technological change and other pressures created by changes in our industry. We expect competition to increase and intensify in the future as the pace of technological change and adaptation quickens and as additional companies enter into each of our markets. Numerous releases of competitive products have occurred in recent history and may be expected to continue in the near future.” Open Text Corp, 8-26-2008 5) “We believe that there is currently no or limited competition in the markets we plan to pursue, and there is an increasing demand due to the rising levels of installed wind energy capacity worldwide.” First National Energy Corp, 1-4-2011 6) “Our ability to acquire additional reserves in the future could be limited by competition from other companies for attractive properties.” Oil Dri Corp, 10-12-2010

38
FIGURE 2a: Coefficient β1 by PCTCOMP Quintile in:D_RNOA t+1 = β0 + β1 *RNOA + β2 *D_NOA
FIGURE 2b: Coefficient β2 by PCTCOMP Quintile in:D_RNOA t+1 = β0 + β1 *RNOA + β2 *D_NOA
-0.30
-0.28
-0.26
-0.24
-0.22
-0.20
1 2 3 4 5
Coefficient on RNOA
-0.14
-0.13
-0.12
-0.11
-0.10
-0.09
-0.08
-0.07
-0.06
1 2 3 4 5
Coefficient on D_NOA

39
FIGURE 3: Future Size-adjusted Returns by PCTCOMP Quintile for Low and High D_NOA
-0.15
-0.1
-0.05
0
0.05
0.1
0.15
1 2 3 4 5
D_NOA Quintile 1
D_NOA Quintile 5

40
Fama-French Industry Mean Median Std. Dev. nElectronic Equipment 0.834 0.770 0.415 193Computers 0.821 0.736 0.381 106Telecommunications 0.821 0.723 0.406 117Measuring and Control Equip 0.800 0.709 0.380 78Electrical Equipment 0.777 0.730 0.431 70Medical Equipment 0.743 0.700 0.339 103Business Services 0.713 0.641 0.380 407Alcoholic Beverages 0.702 0.620 0.325 8Recreational Products 0.694 0.571 0.380 31Miscellaneous 0.663 0.561 0.353 14Retail 0.658 0.589 0.343 82Pharmaceutical Products 0.657 0.640 0.205 105Wholesale 0.631 0.566 0.290 161Textiles 0.610 0.507 0.353 9Machinery 0.607 0.519 0.372 133Shipbuilding, Railroad Equip 0.585 0.457 0.359 5Food Products 0.575 0.488 0.361 35Automobiles and Trucks 0.570 0.519 0.305 57Printing and Publishing 0.569 0.619 0.216 26Steel Works, Etc. 0.567 0.538 0.253 68Rubber and Plastic Products 0.564 0.512 0.302 28Business Supplies 0.561 0.492 0.288 39Construction Materials 0.556 0.569 0.215 59Healthcare 0.552 0.497 0.267 80Aircraft 0.551 0.469 0.244 12Consumer Goods 0.545 0.465 0.251 54Entertainment 0.545 0.443 0.286 55Construction 0.542 0.495 0.312 50Apparel 0.538 0.509 0.251 34Candy and Soda 0.533 0.522 0.210 9Personal Services 0.532 0.484 0.301 34Transportation 0.520 0.516 0.232 111Utilities 0.512 0.438 0.307 138Defense 0.512 0.430 0.236 9Chemicals 0.500 0.489 0.226 70Fabricated Products 0.497 0.465 0.247 14Shipping Containers 0.490 0.560 0.194 6Agriculture 0.437 0.458 0.142 7Restaurants, Hotel, Motel 0.416 0.368 0.227 35Petroleum and Natural Gas 0.378 0.329 0.216 163Nonmetallic Mines 0.314 0.256 0.186 10Precious Metals 0.186 0.153 0.179 9
Total 0.633 0.566 0.349 2,834
This table presents the industry mean, median and standard deviation for PCTCOMP.To calculate the industry mean, the mean of PCTCOMP is calculated for each firmwith at least 5 years of data and the industry statistics are calculated from the firmmeans for each industry with at least 5 firms.
TABLE 1: Competition Measure by Fama-French Industry
41
Industry Average Industry AverageOnly and Firm Average
PCTCOMP_IND 0.836*** 0.106***(21.22) (10.08)
PCTCOMP_FIRM 0.984***(471.76)
Constant -0.001 0.001** (-0.19) (2.01)
R-squared 0.072 0.501N 24,272 24,272
This table presents the results of regressing PCTCOMP_DETREND onPCTCOMP_IND (industry average PCTCOMP_DETREND) andPCTCOMP_FIRM (time-series firm average of PCTCOMP_ DETREND).PCTCOMP_DETREND is defined as PCTCOMPi,t - Annual Mean of PCTCOMPt , removing the time trend variation. To be included in the regression, eachfirm is required to have at least 5 years of data and each industry-year isrequired to have at least 5 firms. See Appendix A for variable definitions.Heteroscedasticity robust t-statistics clustered at the firm level are presented below the coefficient estimates. *, **, *** indicate significance at 10%, 5%,and 1%, respectively.
TABLE 2: Analysis of the Variation in Pctcomp BetweenIndustries, Within Industries and Within Firms

42
TABLE 3: Relation Between PCTCOMP and Various Industry Competition Measures
Panel A: By PCTCOMP Quintile
PCTCOMP Quintile IND-PPE↓ IND-R&D↓ IND-CPX↓ IND-MKTS↓ IND-HHI↓ IND-CON4↓ IND-NUM↑ IND-MGN↓ IND-ROA↓1 3,891.4 87.4 389.9 9.32 0.300 0.720 49.31 1.123 0.1262 3,188.9 116.5 322.2 9.31 0.298 0.733 48.40 1.111 0.1233 2,797.2 142.5 290.6 9.32 0.284 0.725 51.99 1.107 0.1244 2,567.4 179.4 284.1 9.34 0.277 0.723 58.53 1.109 0.1265 2,641.5 251.5 320.3 9.55 0.262 0.704 78.45 1.110 0.127
Diff (5) - (1) -1,249.9*** 164.0*** -69.6*** 0.23*** -0.039*** -0.016*** 29.14*** -0.013*** 0.001t-stat (-13.55) (26.99) (-6.68) (6.39) (-7.97) (-3.70) (15.04) (-5.55) (1.28)
Relation consistent with arrow? Y N Y N Y Y Y Y N (n/s)
Panel B: Correlation coefficients between PCTCOMP and Industry Measures
Correlation IND-PPE IND-R&D IND-CPX IND-MKTS IND-HHI IND-CON4 IND-NUM IND-MGN IND-ROA Pearson 0.101 -0.203 0.022 -0.026 0.065 0.091 0.197 0.040 -0.052 Spearman 0.110 -0.204 0.042 0.007 0.059 0.086 0.166 0.056 -0.055
Potential Entrants Existing Rivals Profitability
This table presents the relation between PCTCOMP and various industry level competition measures. Panel A presents the results by quintile of PCTCOMP. Thearrows represent the expected relation between the intensity of competition in the industry and the competition measure. Difference in means tests between themeans of quintiles (5) and (1) are presented at the bottom of each column. *, **, *** indicate significance at the 10%, 5%, and 1% levels, respectively. Panel Bpresents univariate correlations. In Panel B, all competition measures except IND-NUM are multiplied by (-1) such that all are increasing in the level of compeition.We follow Li (2010) in defining the industry competition variables: IND-PPE, IND-R&D, and IND-CPX are the weighted average of property, plant, and equipment,research and development, and capital expenditures in the industry, respectively. To calculate each industry measure, each firm's value is weighted by a ratio of itssales to the total industry sales. Following Li (2010), we use firm segment data to calculate these values. IND-MKTS is the natural log of aggregate industry sales; IND-CON4 is the sum of the market shares of the four largest firms in the industry; IND-HHI is the sum of the squared market shares of all firms in the industry; IND-NUM is the total number of firms in the industry; IND-MGN is the industry aggregate sales divided by the industry aggregate operating costs; and, IND-ROA is theindustry aggregate operating profit before depreciation divided by industry aggregate total assets.
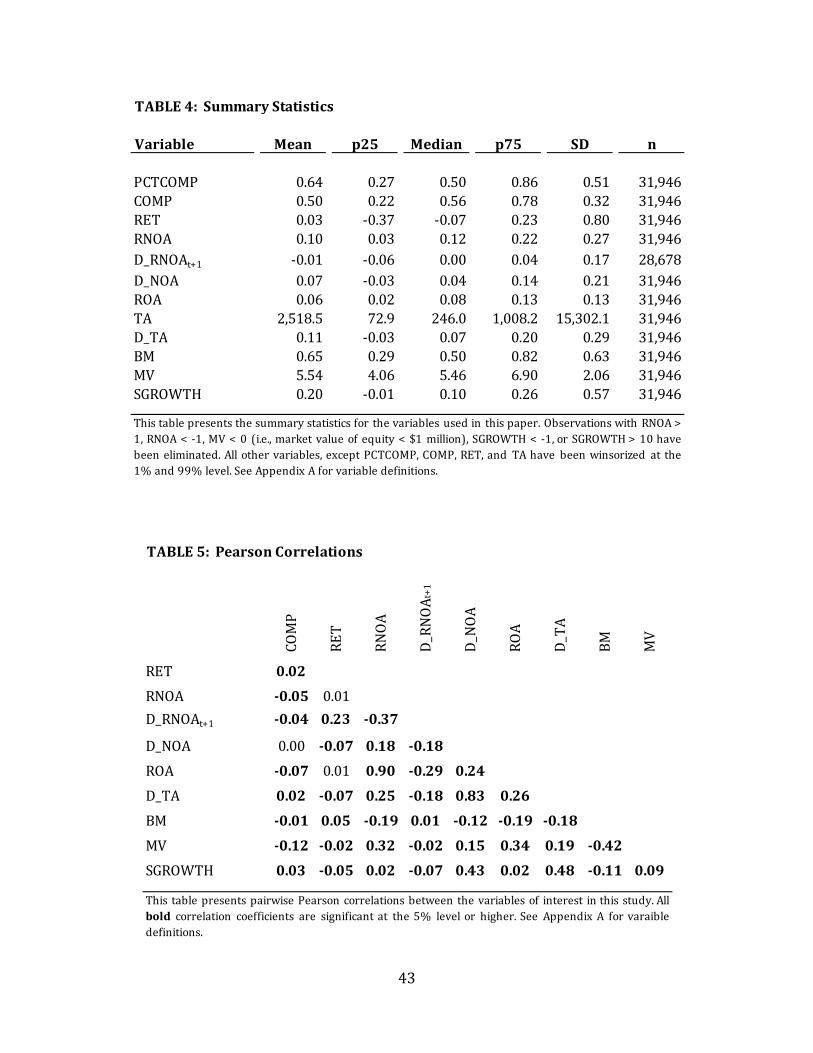
43
Variable Mean p25 Median p75 SD n
PCTCOMP 0.64 0.27 0.50 0.86 0.51 31,946COMP 0.50 0.22 0.56 0.78 0.32 31,946RET 0.03 -0.37 -0.07 0.23 0.80 31,946RNOA 0.10 0.03 0.12 0.22 0.27 31,946D_RNOAt+1 -0.01 -0.06 0.00 0.04 0.17 28,678D_NOA 0.07 -0.03 0.04 0.14 0.21 31,946ROA 0.06 0.02 0.08 0.13 0.13 31,946TA 2,518.5 72.9 246.0 1,008.2 15,302.1 31,946D_TA 0.11 -0.03 0.07 0.20 0.29 31,946BM 0.65 0.29 0.50 0.82 0.63 31,946MV 5.54 4.06 5.46 6.90 2.06 31,946SGROWTH 0.20 -0.01 0.10 0.26 0.57 31,946
This table presents the summary statistics for the variables used in this paper. Observations with RNOA >1, RNOA < -1, MV < 0 (i.e., market value of equity < $1 million), SGROWTH < -1, or SGROWTH > 10 havebeen eliminated. All other variables, except PCTCOMP, COMP, RET, and TA have been winsorized at the1% and 99% level. See Appendix A for variable definitions.
TABLE 4: Summary Statistics
TABLE 5: Pearson Correlations
COM
P
RET
RNO
A
D_R
NO
At+1
D_N
OA
ROA
D_T
A
BM MV
RET 0.02RNOA -0.05 0.01D_RNOAt+1 -0.04 0.23 -0.37
D_NOA 0.00 -0.07 0.18 -0.18ROA -0.07 0.01 0.90 -0.29 0.24D_TA 0.02 -0.07 0.25 -0.18 0.83 0.26BM -0.01 0.05 -0.19 0.01 -0.12 -0.19 -0.18MV -0.12 -0.02 0.32 -0.02 0.15 0.34 0.19 -0.42SGROWTH 0.03 -0.05 0.02 -0.07 0.43 0.02 0.48 -0.11 0.09
This table presents pairwise Pearson correlations between the variables of interest in this study. Allbold correlation coefficients are significant at the 5% level or higher. See Appendix A for varaibledefinitions.

44
Independent variables(1) (2) (3)
D_NOA -0.114*** -0.079*** -0.080***(-21.33) (-9.45) (-9.28)
RNOA -0.256*** -0.199***(-26.58) (-11.54)
ATO -0.011***(-6.64)
PM -0.152***(-7.71)
COMP -0.003 0.015*(-0.52) (1.74)
COMP_D_NOA -0.073*** -0.090***(-4.45) (-5.33)
COMP_RNOA -0.089***(-3.18)
COMP_ATO -0.010***(-3.58)
COMP_PM -0.159***(-3.86)
Avg. Year FE 0.028*** 0.028*** 0.035***
R-squared 0.183 0.188 0.152N 23,062 23,062 23,062
Dependent variable: D_RNOAt+1
TABLE 6: Pooled Regressions of Changes in Return on Net Operating Assets and Competition
This table presents the results of a pooled OLS regression of future changes in RNOA on (1)contemporaneous D_NOA and RNOA; (2) including COMP and interactions; (3) D_NOA and componentsof RNOA (ATO and PM). Firms with negative RNOA have been deleted for this analysis. See Appendix Afor variable definitions. Year fixed effects are included and the average of these coefficients isreported. Heteroscedasticity robust t-statistics clustered at the firm level are presented below thecoefficient estimates. *, **, *** indicate significance at the 10%, 5%, and 1% levels, respectively.

45
(1) (2) (3) (4)Including Size-adjusted Industry-adjusted Including
Independent variables Loss Firms PCTCOMP COMP D_RNOAD_NOA -0.076*** -0.076*** -0.091*** -0.074***
(-8.51) (-8.90) (-10.70) (-8.87)
RNOA -0.219*** -0.209*** -0.224*** -0.206***(-18.03) (-11.85) (-13.20) (-11.95)
D_RNOA 0.071***(6.26)
COMP -0.022*** 0.003 -0.003 -0.003(-5.38) (0.66) (-0.59) (-0.58)
COMP_D_NOA -0.030* -0.080*** -0.045*** -0.065***(-1.82) (-4.88) (-2.86) (-4.05)
COMP_RNOA -0.039** -0.071** -0.060** -0.086***(-2.09) (-2.54) (-2.15) (-3.08)
Avg. Year FE 0.031*** 0.025*** 0.029*** 0.028***
R-squared 0.167 0.186 0.187 0.193N 28,678 23,062 22,333 23,062
This table presents the results of a pooled OLS regression of future changes in RNOA (D_RNOAt+1) on the current level of RNOA, D_NOA,and COMP. Column (1) includes firms with RNOA < 0. Column (2) presents results after size-adjusting PCTCOMP. PCTCOMP is size-adjusted by using the residuals of annual regressions of PCTCOMP on MV and then forming deciles in the same manner as theunadjusted PCTCOMP variable. Column (3) presents results after industry-adjusting COMP. COMP is industry-adjusted by creating theCOMP deciles of PCTCOMP by year and industry (rather than just year) for those industry-years with at least 10 firms (based on theFama-French 48 industry classification algorithm). Column (4) presents the results after including current year change in RNOA(D_RNOA). See Appendix A for variable definitions. Year fixed effects are included and the average of these coefficients is reported.Heteroscedasticity robust t-statistics clustered at the firm level are presented below the coefficient estimates. *, **, *** indicatesignificance at the 10%, 5%, and 1% levels, respectively.
Dependent variable: D_RNOAt+1
TABLE 7: Robustness Tests of Changes in Return on Net Operating Assets and Competition

46
(1) (2) (3) (4) (5) (6) (7) (8) (9)Independent variables IND-PPE IND-R&D IND-CAPX IND-MKTSIZE IND-CON4 IND-HHI IND-NUM IND-MGN IND-ROARNOA -0.243*** -0.269*** -0.255*** -0.250*** -0.150*** -0.165*** -0.150*** -0.225*** -0.202***
(-10.04) (-9.96) (-10.53) (-9.96) (-6.24) (-6.69) (-6.55) (-9.81) (-8.90) D_NOA -0.079*** -0.149*** -0.085*** -0.096*** -0.074*** -0.076*** -0.060*** -0.076*** -0.118***
(-6.82) (-9.43) (-7.19) (-7.64) (-6.28) (-6.22) (-5.15) (-6.55) (-9.04) COMP -0.001 -0.005 -0.002 -0.002 -0.003 -0.002 -0.004 -0.001 -0.001
(-0.18) (-0.85) (-0.32) (-0.45) (-0.53) (-0.42) (-0.69) (-0.17) (-0.24) COMP_RNOA -0.085*** -0.046 -0.080*** -0.073** -0.066** -0.072** -0.051* -0.084*** -0.082***
(-2.76) (-1.51) (-2.62) (-2.40) (-2.16) (-2.37) (-1.68) (-2.76) (-2.69) COMP_D_NOA -0.076*** -0.056*** -0.077*** -0.079*** -0.079*** -0.079*** -0.079*** -0.076*** -0.077***
(-4.32) (-3.24) (-4.39) (-4.50) (-4.50) (-4.47) (-4.50) (-4.33) (-4.38) IND-COMP -0.006 -0.007 -0.004 0.000 0.003 0.001 -0.004 -0.005 -0.011**
(-1.18) (-0.99) (-0.79) (0.01) (0.56) (0.13) (-0.63) (-0.90) (-2.09) IND-COMP_RNOA 0.074** 0.140*** 0.097*** 0.088*** -0.119*** -0.084** -0.122*** 0.047 -0.009
(2.32) (3.98) (3.09) (2.74) (-3.68) (-2.57) (-4.13) (1.53) (-0.31) IND-COMP_D_NOA 0.002 0.120*** 0.016 0.041** -0.001 0.001 -0.027 -0.003 0.079***
(0.13) (5.48) (0.98) (2.34) (-0.05) (0.05) (-1.56) (-0.19) (4.51) Avg. Year FE 0.031*** 0.030*** 0.030*** 0.027*** 0.026*** 0.027*** 0.028*** 0.029*** 0.034***
R-squared 0.191 0.198 0.193 0.194 0.194 0.192 0.197 0.191 0.192N 19,866 19,866 19,866 19,866 19,866 19,866 19,866 19,866 19,866This table presents the results of a pooled OLS regression of future changes in RNOA (D_RNOA) on the current level of RNOA, D_NOA, and COMP after controlling for various industry-level measuresof competition. We follow Li (2010) for the definition of the industry competition measures (see Table 3 for definitions). To be consistent with the calculation of COMP, we use deciles of the industrycompetition measures, scaled between 0 and 1. See appendix A for other variable definitions. Year fixed effects are included and the average of these coefficients is reported. Heteroscedasticityrobust t-statistics clustered at the firm level are presented below the coefficient estimates. *, **, *** indicate significance at the 10%, 5%, and 1% levels, respectively.
Dependent variable: D_RNOAt+1
TABLE 8: Tests of Changes in Return on Net Operating Assets Controlling for Industry Competition

47
Panel A: PCTCOMP and D_NOA quintiles
D_NOA quintile 1 2 3 4 5 Total Diff (5) - (1)1 0.071 0.027 0.069 0.118 0.124 0.081 0.0532 0.044 0.040 0.062 0.041 0.088 0.055 0.0443 0.006 0.041 0.063 0.060 0.066 0.049 0.0604 -0.033 0.003 0.029 0.038 0.010 0.010 0.0435 -0.012 -0.040 -0.079 -0.078 -0.090 -0.062 -0.077
Total 0.016 0.015 0.028 0.034 0.040 0.027
Diff (5) - (1) 0.084 0.067 0.148 0.196 0.214
Diff-in-diff 0.130**t-stat (2.89)
Panel B: HERF3 and D_NOA quintiles
D_NOA quintile 1 2 3 4 5 Total Diff (5) - (1)1 0.063 0.053 0.070 0.119 0.093 0.081 0.0292 0.028 0.020 0.100 0.064 0.044 0.055 0.0163 0.042 0.027 0.040 0.081 0.055 0.049 0.0134 -0.004 -0.020 0.036 0.029 -0.009 0.010 -0.0055 -0.077 -0.067 -0.021 -0.031 -0.088 -0.062 -0.011
Total 0.010 0.005 0.044 0.055 0.015 0.027
Diff (5) - (1) 0.140 0.121 0.091 0.150 0.180
Diff-in-diff 0.041t-stat (0.85)
PCTCOMP quintile
HERF3 quintile
This table presents the annual means of size adjusted returns partitioned by quintiles of PCTCOMP and D_NOA (Panel A) andHERF3 and D_NOA (Panel B). The differences between quintiles (5) and (1) are presented at the end of each row and column.See Appendix A for variable definitions. *, **, *** indicate significance at the 10%, 5%, and 1% levels, respectively. Only diff-in-diff significance levels are presented.
TABLE 9: Analysis of Stock Market Returns Across Quintiles

48
Independent variablesD_NOA -0.118** -0.058
(-2.73) (-1.66) COMP_D_NOA -0.121***
(-3.71) D_TA -0.104** -0.051
(-2.23) (-1.06)COMP_D_TA -0.106**
(-2.78)COMP 0.091 0.085
(1.44) (1.65)BM 0.093** 0.093** 0.090** 0.090**
(2.46) (2.73) (2.39) (2.70)MV 0.007 0.007 0.011 0.011
(0.17) (0.19) (0.27) (0.29)Constant 0.036 -0.010 0.029 -0.014
(0.94) (-0.46) (0.75) (-0.72)
R-squared 0.012 0.015 0.011 0.015N 31,946 31,946 31,946 31,946
Dependent variable: RETt+1
This table presents the results of Fama-Macbeth regressions of size adjusted returns oncompetition, changes in assets, and control variables. The coefficient estimates are averagesobtained from 12 annual regressions. The t-statistics are based on averages and standarddeviations of the 12 parameter estimates obtained from the annual regressions. Allindependent variables have been transformed into quintile ranks and scaled between 0 and1. See Appendix A for variable definitions. *, **, *** indicate significance at the 10%, 5%, and1% levels, respectively.
TABLE 10: Fama-Macbeth Regressions of Future Stock Returns, AssetGrowth, and Competition