Embed Size (px)
Citation preview

THE IMPACT OF CLASSROOM PERFORMANCE SYSTEM-BASED
INSTRUCTION WITH PEER INSTRUCTION UPON STUDENT ACHIEVEMENT
AND MOTIVATION IN EIGHTH GRADE MATH STUDENTS
by
Tracy Michelle Hunter Allison
Liberty University
A Dissertation Presented in Partial Fulfillment
Of the Requirements for the Degree
Doctor of Education
Liberty University
January, 2012

Copyright © 2012
by Tracy Michelle Hunter Allison

The Impact of Classroom Performance System-Based Instruction with Peer Instruction
Upon Student Achievement and Motivation in Eighth
Grade Math Students
by Tracy Michelle Hunter Allison
A Dissertation Presented in Partial Fulfillment
Of the Requirements for the Degree
Doctor of Education
Liberty University, Lynchburg, VA
January, 2012
APPROVED BY:
RANDALL DUNN, EdS, Chair
JAN OTTER, PhD, Committee
JANE ZAHNER, PhD, Committee
SCOTT B. WATSON, PhD, Associate Dean, Advanced Programs

ABSTRACT
Tracy Michelle Hunter Allison. THE IMPACT OF CLASSROOM PERFORMANCE
SYSTEM-BASED INSTRUCTION WITH PEER INSTRUCTION UPON STUDENT
ACHIEVEMENT AND MOTIVATION IN EIGHTH GRADE MATH STUDENTS.
School of Education, January, 2012.
The researcher employed two designs to address the research question for this particular
study. This quasi-experimental non-equivalent control group study compared the math
achievement of 92 eighth grade students who received Classroom Performance System
(CPS)-based instruction using Peer Instruction (PI) to 76 eighth grade students who
received CPS-based math instruction without PI. Posttest scores were statistically
analyzed using an ANCOVA. Iowa Test of Basic Skills scores were used as a covariate.
A statistic control group design was employed to examine student motivation for the
same group of students under the same conditions. Student motivation data from the
Instructional Materials Motivation Survey (IMMS) were statistically analyzed using
MANOVA and independent sample t-tests. The results showed that eighth grade
students who received CPS-based math instruction using PI had significantly higher math
achievement scores. Student motivation scores were statistically higher when analyzing
all four components of the IMMS together. When analyzing the components separately,
two of four subscales were significantly higher for the treatment group.

ii
Dedication
To my wonderful husband, Chris, who is the love of my life and the man with
whom I look forward to sharing the rest of my life: Thank you for your patience, support,
understanding, love, and help throughout this long endeavor as well as during all the
other difficult situations that life has thrown our way, yet we have endured together over
the years. I could not have done this without you, and I love you so much. Thank you for
being both mom and dad so many times, all the clothes you have washed, all the meals
you have cooked, and all the dishes you have cleaned. Thank you for all the times you
allowed me to work on my dissertation and spent time with our kids when I felt so guilty
about having to work instead of being a mom.
To my incredible children, Brittany and Mason Allison, who are the joys of my
life and the most precious gifts that God has given me: Thank you for your patience in
enduring a process that we all thought would never end. I hope one day that you can
fully understand that I worked so hard for this degree not only for myself, but so I could
hopefully provide a better life for you. I hope that I have been a role model for each of
you regarding the importance of being supportive of your family members in all
circumstances. I am so proud of you and want you to know that anything is possible, and
it is never too late to begin pursuing your dreams in life. Thank you for all the times you
have allowed me to work on my dissertation instead of playing. We have so much lost
time to make up, and I want you to know how much I love you both. I know the time we
have missed being together as a family has been the greatest sacrifice of all, but I hope it
is not too late and that we can begin to make up for it.

iii
To my dear late parents, Ernest and Errie Hunter, who were always so proud and
supportive of me: Thank you for instilling in me a desire to learn, to help others, and
most importantly, to love God. Thank you for all the sacrifices you made for me.
To my sisters and brother: Thank you for all your prayers, encouragement, and
support for all these years that I have been in school.
To my in-laws, Jimmie and Lynnette Allison: Thank you for raising an incredible
son who became my amazing husband. Thank you for being willing to babysit when I
needed to work on my dissertation.
To Kim Dailey and Crissy Manley, the teachers who helped make this research
project possible: Thank you so much for the hard work you put forth every day in order
to help your students learn while making sure they are engaged. Thank you for spending
countless hours doing a lot more work than you ever dreamed would be necessary for this
endeavor. Without your willingness to implement the intervention for me, I would not
have been able to complete this dissertation.
To Connie Franklin, my principal: Thank you for your support. Thank you for
making certain that our school has the latest technology and equipment available to help
meet the needs of students and to prepare them for the future.
To my friends and ―The Rats,‖ who embarked upon this journey with me: Your
prayers, support, encouragement, and immeasurable hours spent talking on the phone,
emailing, text messaging, and commenting on Facebook kept me going so many times
when I wanted to quit. Thanks for encouraging me to not give up and for being willing to
share your wealth of knowledge. Thanks for inviting me to be a part of a very special

iv
group of people whom I admire and have grown to love so much.
Most of all, I would like to thank God for giving me the ability to persevere and to
fulfill a life-long dream! ―For I know the plans I have for you,‖ declares the LORD,
―plans to prosper you and not to harm you, plans to give you hope and a future‖
(Jeremiah 29:11, KJV).

v
Acknowledgments
I would like to thank Randall Dunn, PhD, for serving as my dissertation
committee chair.
Words cannot express my gratitude to Jan Otter, PhD, for serving as my second
committee member and for giving valuable feedback and advice. Thank you for your
constant support, assistance, and copy editing throughout this process. Your willingness
to spend countless hours with me in person, on the phone with me, and through email
making suggestions, editing my work, and providing feedback will never be forgotten. I
would certainly have given up without you being my cheerleader and providing
encouragement to me to not give up.
To Jane Zahner, PhD: Thank you for serving as my third committee member and
copy editor. Your feedback and suggestions were invaluable, and I greatly appreciate
your willingness to serve on my committee, not once but for two degrees.
To Amanda Rockinson-Szapkiw, EdD: Thank you for serving as my research
consultant and for providing constructive feedback and for being willing to act as an
advocate for me.
To Craig Courbron, EdD candidate: Thank you for serving as my editor
throughout this process and for helping make me sound much more intelligent than I
really am!
To Grant Schissler, PhD candidate: Thank you for serving as my statistician and
for your willingness and patience to tutor me and answer my endless questions about
statistics.

vi
Table of Contents
Acknowledgements............................................................................................................. ii
List of Tables ................................................................................................................... vii
List of Figures.................................................................................................................. viii
List of Abbreviations ......................................................................................................... x
CHAPTER ONE: INTRODUCTION..................................................................................1
Background............................................................................................................. 1
Problem Statement.................................................................................................. 5
Purpose Statement .................................................................................................. 6
Significance of the Study........................................................................................ 6
Research Questions and Hypotheses ..................................................................... 7
Identification of Variables ..................................................................................... 9
Overview of Methodology…. ................................................................................ 9
Definition of terms................................................................................................ 10
Summary............................................................................................................... 11
CHAPTER TWO: REVIEW OF THE LITERATURE.................................................... 13
Review of the Related Literature…………………………………………...…....13
Conceptual or Theoretical Frameworks ............................................................... 18
Student Motivation………………………………………………….….……….. 23
Classroom Performance Systems………………………………………….……. 28
Peer Instruction……………………………….………………………………… 46

vii
Summary............................................................................................................... 49
CHAPTER THREE: METHODOLOGY ........................................................................ 50
Research Questions and Null Hypotheses ........................................................... 51
Design .................................................................................................................. 53
Participants ........................................................................................................... 54
Setting .................................................................................................................. 55
Instrumentation .................................................................................................... 56
Procedures............................................................................................................. 62
Data Analysis........................................................................................................ 69
Summary............................................................................................................... 71
CHAPTER FOUR: RESULTS......................................................................................... 72
Demographics........................................................................................................72
Research Questions and Hypotheses.....................................................................75
Data Analysis and Results: Student Achievement................................................ 77
Data Analysis and Results: Student Motivation................................................... 83
MANOVA............................................................................................................ 83
Independent t-tests................................................................................................ 90
Summary............................................................................................................... 91
CHAPTER FIVE: SUMMARY AND DISCUSSION .................................................... 93
Restatement of the Problem ................................................................................. 93
Restatement of the Research Questions and Null Hypotheses……….………… 95
Summary of the Results........................................................................................ 96

viii
Discussion of the Results...................................................................................... 98
Implications...………………………………………………………………...…103
Limitations ………………………………......................................................... 106
Recommendations............................................................................................... 109
Conclusion………………….............................................................................. 111
REFERENCES .............................................................................................................. 112
APPENDIX A: UNIT 7 MATH POSTTEST: SYSTEMS OF EQUATIONS AND
INEQUALITIES……………………………………………………..............................147
APPENDIX B: EXPERT-TEST VALIDATION OF UNIT 7 MATH POSTTEST.......154
APPENDIX C: TABLE OF SPECIFICATIONS FOR POSTTEST...............................155
APPENDIX D: EDUCATOR QUALIFICATIONS FOR VALIDATION OF UNIT 7
MATH POSTTEST………………………………...…………………………………..156
APPENDIX E: SAMPLE MOTIVATION SURVEY-INSTRUCTIONAL MATERIALS
MOTIVATION SURVEY (IMMS)……………………….……………………………159
APPENDIX F: APPROVAL EMAIL FROM IMMS AUTHOR, JOHN KELLER, TO
USE/MODIFY SURVEY……………………………………………………………....160
APPENDIX G: APPROVAL BY SCHOOL SYSTEM SUPERINTENDENT TO
CONDUCT RESEARCH………………………………………………………………161
APPENDIX H: APPROVAL BY SCHOOL PRINCIPAL TO CONDUCT RESEARCH
…………………………………………………………………………………………. 162
APPENDIX I: INSTITUTIONAL REVIEW BOARD APPROVAL ........................... 163
APPENDIX J: ADULT PARTICIPATION CONSENT FORM-ENGLISH…………. 164
ix
APPENDIX K: STUDENT PARTICIPATION CONSENT FORM-ENGLISH……... 165
APPENDIX L: STUDENT PARTICIPATION CONSENT FORM-SPANISH……… 167
APPENDIX M: STUDENT AND PARENT INFORMATION LETTER-ENGLISH.. 169
APPENDIX N: STUDENT AND PARENT INFORMATION LETTER-SPANISH…170
APPENDIX O: SAMPLE OF ONLINE VERSION OF IMMS SURVEY…………… 171
x
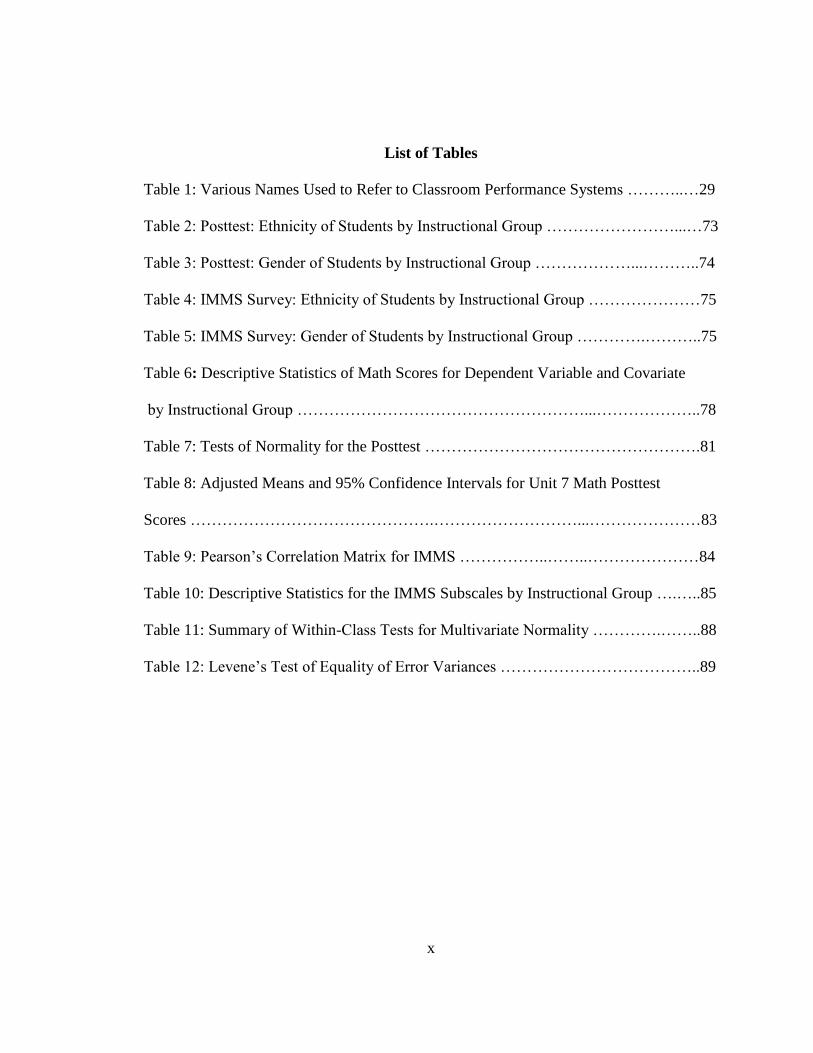
List of Tables
Table 1: Various Names Used to Refer to Classroom Performance Systems ………..…29
Table 2: Posttest: Ethnicity of Students by Instructional Group ……………………...…73
Table 3: Posttest: Gender of Students by Instructional Group ………………...………..74
Table 4: IMMS Survey: Ethnicity of Students by Instructional Group …………………75
Table 5: IMMS Survey: Gender of Students by Instructional Group ………….………..75
Table 6: Descriptive Statistics of Math Scores for Dependent Variable and Covariate
by Instructional Group ………………………………………………...………………..78
Table 7: Tests of Normality for the Posttest …………………………………………….81
Table 8: Adjusted Means and 95% Confidence Intervals for Unit 7 Math Posttest
Scores ……………………………………….………………………...…………………83
Table 9: Pearson‘s Correlation Matrix for IMMS ……………..……..…………………84
Table 10: Descriptive Statistics for the IMMS Subscales by Instructional Group ….…..85
Table 11: Summary of Within-Class Tests for Multivariate Normality ………….……..88
Table 12: Levene‘s Test of Equality of Error Variances ………………………………..89

xi
List of Figures
Figure 1: Posttest versus ITBS Mathematics total scores …………………………...…..79
Figure 2: Residuals versus predicted values by instruction …………….……………….82
Figure 3: Linear relationship of the IMMS subscale …………………..………………..87

xii
List of Abbreviations
AYP – Adequate Yearly Progress
CBM – Curriculum Based Measurement
CPS – Classroom Performance System
GPS – Georgia Performance Standards
IMMS – Instructional Materials and Motivation Survey
ITBS – Iowa Test of Basic Skills
NCLB – No Child Left Behind
PI – Peer Instruction
SBC – Standards Based Classroom

1
CHAPTER ONE: INTRODUCTION
Background
Twenty-first century learners expect instructors to utilize the technological tools
available to create an active learning environment where they can interact with the
material, the instructor, and their peers (Prensky, 2008). They no longer respond to
instructors who use the strictly traditional, instructor-led, lecture-based approaches of the
past (Duncan, 2006; Prensky, 2008). The No Child Left Behind Act (NCLB) of 2001
mandates that educators raise academic achievement each year until the year 2014 when
100% of students are expected to meet adequate yearly progress (AYP) (No Child Left
Behind [NCLB], 2002). Classrooms that implement active learning may be more likely
to produce students capable of reaching that standard (Florida State University Office of
Distance Learning, 2011; Michael, 2006).
Educators can work toward meeting the NCLB mandates by determining which
technologies and teaching strategies will enhance the learning environment in a way that
increases not only student engagement and motivation, but also academic achievement.
With so many choices available today, educators must be diligent in their quest for
technological tools and teaching strategies that will meet these challenges.
Many studies conducted at the postsecondary level have found that the
implementation of a Classroom Performance System (CPS), sometimes referred to as
clickers, is one way to incorporate technology in today‘s classrooms in order to engage
students (Bruff, 2009; Duncan, 2005; Gauci, Dantas, Williams, & Kemm, 2009). The use

2
of such technology is becoming more prevalent at the collegiate level and in K–12
schools as well. The term CPS refers to a wireless electronic response system that uses
remote control devices to allow an entire class to give immediate feedback to teachers
and students, thus allowing an instructor to quickly ascertain individual student academic
needs and modify instruction as needed (eInstruction, 2011).
Several meta-analyses and literature reviews address the use of CPS in the
classroom (Barber & Njus, 2007; Cain & Robinson, 2008; Caldwell, 2007; DeGange,
2011; Fies & Marshall, 2006; Judson & Sawada, 2002; Kay & LeSage, 2009; Keller et
al., 2007; MacArthur & Jones, 2008; Simpson & Oliver, 2007; Stowell & Nelson, 2007).
These nine meta-analyses and literature reviews provide much information about a
variety of topics related to the use of CPS in the postsecondary classroom, some of which
may be generalized to the K–12 classroom setting.
While many testimonials and anecdotal articles are available online, little
quantitative research is available in peer-reviewed journals about the use of CPS in the
K–12 classrooms in comparison to the amount of literature available about the use of
CPS in the postsecondary classroom. The researcher found five doctoral dissertations
about the use of CPS in the K–12 classroom (Lively, 2010; Musselman, 2008; Rigdon,
2010; Sartori, 2008; Shirley, 2009). Much research is available about teacher and student
perspectives on the use of CPS in postsecondary institutions (Ainuson, 2008; Fies &
Marshall, 2006; Graham, Tripp, Seawright, & Joeckel, 2007; Holmes, Blalock, Parker &
Haywood, 2006; Jackson, 2007; MacGeorge et al., 2008; May, 2007; Wood, 2004). The
researcher located one master‘s thesis about student motivation of elementary students
concerning the use of CPS; however, Peer Instruction (PI), a specific teaching strategy

3
that can be implemented with or without the use of CPS, was not a variable used in the
study (Thomsen, 2006). Van Dijk, Van den Ber, and Van Keulen (2001) researched the
effects of active learning and the use of CPS and PI on learning and student motivation in
a collegiate engineering class. Cutts, Carbone, and Van Haaster (2004) researched the
effects of PI in a postsecondary setting regarding the effects on learning due to clarifying
student misconceptions.
It is unclear whether CPS increases learning outcomes, or if it is just the latest in a
line of educational novelties that is currently en vogue. Research indicates that the use of
a CPS seems to motivate college students (Gauci et al., 2009; Radosevich, Salomon,
Radosevich, & Kahn, 2008). However, the researcher wanted to determine if the
implementation of such technology actually increases learning outcomes and motivation
for K–12 students.
According to Penuel, Boscardian, Masyn, and Crawford (2007):
Researchers who have studied student response systems in higher education share
a belief that the technology alone cannot bring about improvements to student
participation in class and achievement; rather, the technology must be used in
conjunction with particular kinds of teaching strategies. (p. 318)
CPS technology, when used along with research-based teaching practices, may have a
positive impact on student learning and student engagement (Jones, 2009; Mazur, 1997).
One such teaching strategy is PI.
Eric Mazur (1997, 2001) developed a pedagogical technique, PI, in which
instructors purposefully design instruction that allows students to work collaboratively
with their peers. After the instructor poses a question to the class, the students must

4
determine the answer to the question. Students must then work with at least one partner
in which they must try to convince their peers that their answer to the given question is
correct. Students must provide a rationale to their peers for why their answer is correct.
Thus, students learn from each other by explaining content to their classmates. The PI
strategy involves active learning, questioning techniques, peer discussions, student-
centered instruction, and formative assessment, with frequent or immediate feedback that
helps drive the instruction. Much research regarding the use of PI has been conducted at
the collegiate level (Crouch & Mazur, 2001; Duncan, 2005; Fagen, Crouch, & Mazur,
2002; Lasry, Mazur, & Watkins, 2008; Lucas; 2009; Turpen & Finkelstein, 2007). K–12
teachers may know this term by a related name such as the cooperative learning strategy
called think-pair-share or peer discussion (Engaging Technologies, 2008). In an effort to
ascertain if CPS technology actually enhances student learning at the middle school level,
the researcher wanted to (a) examine student achievement in relation to the
implementation of a CPS with PI and without PI in a middle school and (b) examine
student motivation in relation to CPS implementation with PI and without PI in a middle
school.
The researcher found many articles relating to the use of CPS and math at the
collegiate level (Blodgett, 2006; Bode, Drane, Kolikant, & Schuller, 2009; Butler, 2005;
Butler & Butler, 2006; Cline, 2006; Cline, Zullo, & Parker, 2007; d‘Inverno, Davis, &
White, 2003; King & Robinson, 2009a, 2009b, 2009c; Lomen & Robinson, 2004; Miller,
Santana-Vega, & Terrell, 2006); however, none of these studies included the use of PI
nor focused on student motivation. One study (Lucas, 2009) did include PI as a variable
in his study on the use of CPS in a math course at the collegiate level.

5
Problem Statement
Fostering meaningful learning and motivation among students is a long-standing
concern for all educators. Currently, all educators are faced with adapting their teaching
styles to the learning styles and needs of the ―Net Generation,‖ students who have grown
up in a digital world and who have different needs than students in the past (Prensky,
2008; Skiba & Barton, 2006). Students expect classrooms to be interactive and engaging.
Today‘s educators are also faced with ever decreasing budgets due to difficult economic
conditions coupled with ever increasing accountability demands from local, state, and
national mandates such as NCLB‘s high-stakes testing and requirements for meeting
AYP. NCLB (2002) insists that all students make gains in achievement and that all
students perform at or above grade level by 2014. Administrators and teachers are
charged with providing instruction and engaging learners in a learning environment that
produces high levels of academic achievement. Educators are expected to make sound
theoretical and research-based decisions regarding how to teach students (Kelly, 2011).
CPS may be a tool that helps educators accomplish this goal.
Over the past 10 years, CPS has been used as a technological tool for increasing
student engagement in postsecondary classrooms, but little research has been conducted
to measure its effectiveness in K–12 classrooms (Lively, 2010; Musselman, 2008;
Rigdon, 2010; Sartori, 2008; Shirley, 2009). With the United States mired in an
economic crisis and school system budgets feeling the impact of this crisis, research is
needed to determine if the purchase of a CPS is a wise use of limited funds.

6
This study was designed to address the problem of whether or not using CPS-
based math instruction in conjunction with a specific pedagogy (i.e., PI) can positively
affect student achievement and student motivation in K–12 classrooms.
Purpose Statement
The purpose of this study was to determine the impact of student use of a CPS
technology, supported with a PI strategy, on the academic achievement and motivation of
eighth grade math students. The researcher collected and analyzed the posttest data of
the participants. A student motivation survey, the Instructional Materials Motivation
Survey (IMMS), was distributed at the end of the study to gather self-reported student
motivation data about the use of CPS technology with and without PI.
The researcher and other professionals may use the results of the study in order to
justify the use of CPS in their classrooms. The goal was to provide information gleaned
from this research project to benefit other educators in the target school as well as other
schools in the district. For educators already using CPS, the researcher hoped to provide
effective models of CPS use that will make their implementation more effective in the
classroom.
Significance of the Study
There is a gap in the literature in regards to the effectiveness of CPS and PI in
middle schools. The findings of this study will contribute to filling that gap. Research on
the K–12 classroom regarding CPS use and PI in the K–12 classroom is extremely
limited in published literature. Most available information about CPS relating to the K–
12 classroom is anecdotal in nature and only available in a limited number of
dissertations. Fies and Marshall (2006) indicate that additional research is needed to

7
investigate different conditions of CPS use across a variety of settings. There is clearly a
need for additional research in regard to CPS and various aspects of use in the K–12
classroom (Lively, 2010; Musselman, 2008; Rigdon, 2010; Sartori, 2008; Shirley, 2009).
There is also a need for further research about student motivation in the K–12 classroom
(Dorr, 2006). The literature concurs that additional research is necessary regarding the
use of CPS technology in conjunction with a distinct theoretical framework as well as in
a variety of learning environments (Albon & Jewels, 2007; Jones, 2009).
This study will help administrators and teachers in the target school determine the
impact of CPS, with and without PI, on student math achievement and student
motivation. Other schools in the target district or nearby areas that use or anticipate using
CPS technology could benefit from this research as well. Educators could use the
findings of this study to help decide whether or not to adopt or modify the use of CPS in
classrooms at all levels to better meet the needs of students and increase student
achievement and student motivation.
Research Questions and Hypotheses
The following questions and hypotheses guided the researcher in this project:
Research Question 1: Is there a difference in student achievement mean scores
between eighth grade students who receive Classroom Performance System (CPS)-based
math instruction with Peer Instruction (PI) as opposed to those who receive CPS-based
math instruction without PI, as measured by the expert-validated Unit 7 math posttest?
Null Hypothesis 1: There is no statistically significant difference in the mean
scores on the expert-validated Unit 7 math posttest between eighth grade students who
receive CPS-based math instruction with PI as opposed to those who receive CPS-based
8
math instruction without PI, when controlling for prior knowledge.
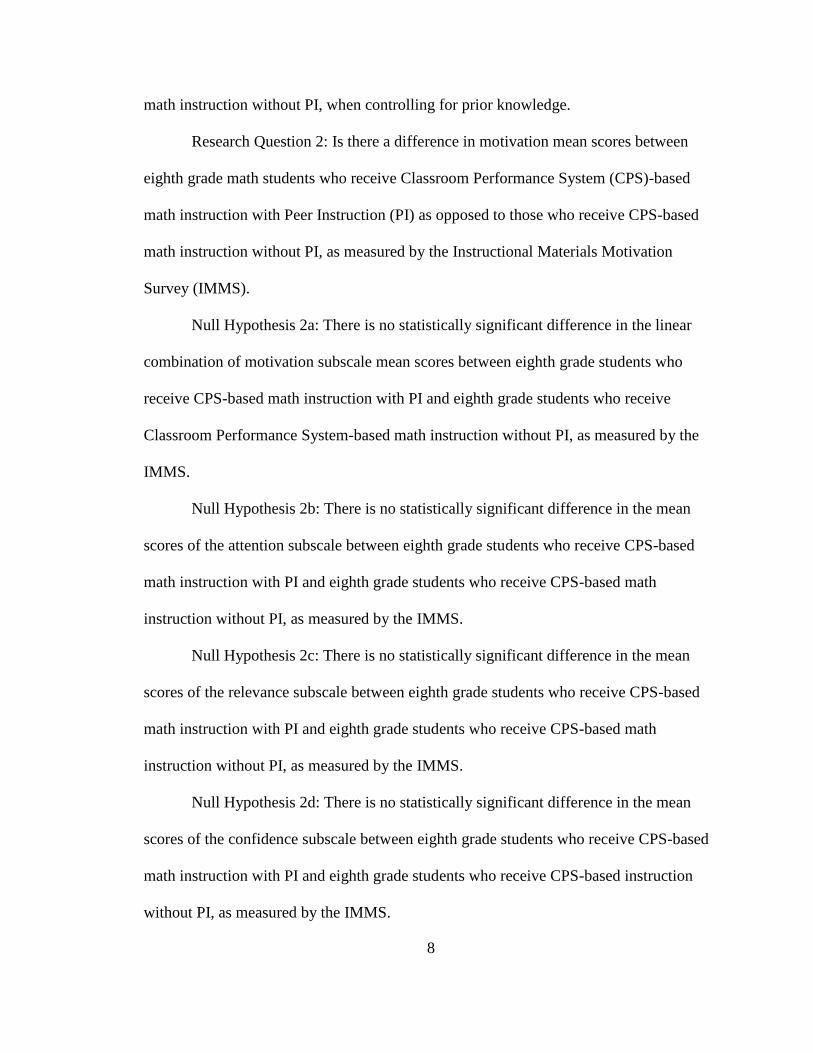
Research Question 2: Is there a difference in motivation mean scores between
eighth grade math students who receive Classroom Performance System (CPS)-based
math instruction with Peer Instruction (PI) as opposed to those who receive CPS-based
math instruction without PI, as measured by the Instructional Materials Motivation
Survey (IMMS).
Null Hypothesis 2a: There is no statistically significant difference in the linear
combination of motivation subscale mean scores between eighth grade students who
receive CPS-based math instruction with PI and eighth grade students who receive
Classroom Performance System-based math instruction without PI, as measured by the
IMMS.
Null Hypothesis 2b: There is no statistically significant difference in the mean
scores of the attention subscale between eighth grade students who receive CPS-based
math instruction with PI and eighth grade students who receive CPS-based math
instruction without PI, as measured by the IMMS.
Null Hypothesis 2c: There is no statistically significant difference in the mean
scores of the relevance subscale between eighth grade students who receive CPS-based
math instruction with PI and eighth grade students who receive CPS-based math
instruction without PI, as measured by the IMMS.
Null Hypothesis 2d: There is no statistically significant difference in the mean
scores of the confidence subscale between eighth grade students who receive CPS-based
math instruction with PI and eighth grade students who receive CPS-based instruction
without PI, as measured by the IMMS.

9
Null Hypothesis 2e: There is no statistically significant difference in the mean
scores of the satisfaction subscale between eighth grade students who receive CPS-based
math instruction with PI and eighth grade students who receive CPS-based instruction
without PI, as measured by the IMMS.
Identification of Variables
The independent variable in this study was the CPS-based pedagogy PI,
implemented during the unit of study. The treatment group used a CPS with PI while the
control group used only a CPS. The two dependent variables were math achievement and
student motivation concerning the use of the CPS with or without PI. Math achievement
was measured by scores on an expert-validated end-of-unit math assessment. Student
motivation was measured by using the IMMS (Keller, 2010b).
Overview of Methodology
The researcher determined that a quasi-experimental pretest-posttest
nonequivalent group design was appropriate to answer research questions (Creswell,
2005), and a static group design was appropriate to answer research question 2. The
research participants for this study included all eighth students in one rural, public middle
school in northeast Georgia. A total of 168 students participated in the study. There
were 92 students in the treatment group and 76 in the control group. Two eighth grade
middle school math teachers were involved in the study. One teacher used PI pedagogy
along with CPS instruction (treatment group), and one teacher used CPS instruction
without PI (control group).
Both the treatment group and the control group received the same instruction for
one unit of academic study (approximately four weeks). CPS was used at least twice per

10
week and incorporated approximately five questions during each use. Students in both
groups received formative and summative feedback on a weekly basis through the use of
a CPS (e.g., instant visual feedback, histograms). An end-of-unit posttest was
administered along with an online student motivation survey, the IMMS, at the end of the
study. The student achievement data from the posttest were analyzed using both
descriptive statistics and a one-way analysis of covariance (ANCOVA). Student
motivation data were analyzed using a multivariate analysis of variance (MANOVA) to
simultaneously analyze all components of the IMMS and multiple independent sample t-
tests to analyze each motivation subscale separately. The findings of this study are
presented and discussed in Chapter Four.
Definitions of Terms
Classroom performance system (CPS): CPS refers to a hardware/software system
that allows instructors to pose multiple-choice questions and receive instantaneous
feedback using remote control response pads, a computer projection device, a portable
receiver, and response analysis software (eInstruction, 2011).
Clickers: The term clickers refer to an electronic student response system. This
term is another name for CPS. This term sometimes refers to the remote control used
with a CPS (eInstruction, 2011).
Formative assessment: This type of assessment is part of the instructional process.
Formative assessment provides the instructor real-time information needed to alter
teaching methods and provides both instructors and students with information about
students‘ understanding of the material at a time when judicious changes can be made to
the instruction (Garrison & Ehringhaus, 2007).

11
Georgia Performance Standards (GPS): The GPS is a state-mandated curriculum
for each academic subject area in grades K–12 that tells the teacher what the student is
expected to know and be able to do (Georgia Department of Education, 2011a, 2011b).
Peer Instruction (PI): PI is a pedagogical technique developed by Eric Mazur, a
physics professor at Harvard University, in which students learn from each other by
explaining content to their classmates or peers and then trying to convince their peers that
they are correct and the reasons that they are correct (Mazur, 1997).
Study Island: Study Island is a web-based software program designed to correlate
with state-mandated curriculum for many states including Georgia. For a fee, this
program can be used by individual students or as a whole class when an electronic
response system such as CPS is incorporated (Study Island, 2011). For the purposes of
this study, it was used in conjunction with CPS to facilitate the use of questions given to
students.
Summative assessment: Summative assessment is part of the instructional process.
Summative assessment provides information to the instructor at the end of a unit of
instruction or course so that adjustments may be made to the curriculum or assessment
the next time the material is presented or assessed by the instructor (Garrison &
Ehringhaus, 2007).
Survey: For the purpose of this study, a survey refers to the online set of questions
in the IMMS. The questions were administered to student participants as a self-reflection
of their own learning and motivation as a result of the use of CPS using or not using PI
(Cherry, 2011; Keller, 2010a).
Summary

12
The use of technology in the classroom is one way to engage and motivate
students. When used in conjunction with a specific pedagogy, such as PI, the use of a
CPS has been shown to increase student achievement at the collegiate level. Since few
studies have been conducted in the K–12 arena regarding the use of CPS, this study was
designed to determine if CPS used in conjunction with PI has a positive impact on
student achievement and student motivation in eighth grade students. This quasi-
experimental quantitative study employed a posttest nonequivalent group design.
Chapter 2 examines the theoretical framework and relevant literature that supports
the study. Active Learning Theory and the ARCS Motivation Model are explored, along
with CPS and PI.

13
CHAPTER TWO: REVIEW OF THE LITERATURE
This review of the literature will present information on the implementation of a
Classroom Performance System (CPS) with a research-based pedagogy, Peer Instruction
(PI). The impact of the implementation of CPS-based instruction on student achievement
and student motivation in the classroom will be explored. Theory regarding pedagogy
used in the classroom in conjunction with a CPS will be included, along with information
about the implementation of PI.
Fostering meaningful learning and motivation among students is a long-standing
concern for all educators. Currently, educators are faced with adapting their teaching
styles to the learning styles and needs of the Net Generation, students who have grown up
in a digital world and who have different needs than students in the past (Prensky, 2008;
Skiba & Barton, 2006). Today‘s educators are also faced with decreasing budgets due to
difficult economic conditions coupled with increasing accountability demands from local,
state, and national mandates such as NCLB (2002) regarding high-stakes testing and
requirements for meeting AYP. Because of these demands educators need to make sound
theoretical and research-based decisions when teaching students (Kelly, 2011). The
purpose of this study was to determine the impact of CPS-based instruction when used
with PI on student achievement and motivation of eighth grade math students.
Review of the Related Literature
As recommended by Johnson and Christensen (2008), the researcher began a
focused search of the literature concerning CPS, PI, and theoretical frameworks by
reviewing two primary sources of information, books and journals, which were relevant

14
to the research topic. In addition, the researcher reviewed information found in computer
databases such as EBSCOhost, ERIC, and ProQuest to find peer-reviewed journals,
technical reports, academic theses and dissertations. The researcher found many more
articles related to the postsecondary use of CPS and PI than were available on CPS and PI
use in the K–12 setting. Additionally, the researcher obtained some information relating
to the student survey used in the research via personal email communication with the
author of the survey. Finally, the researcher was also able to find some articles related to
the research topic by using the Internet, being careful to use criteria suggested by Johnson
and Christensen (2008) to locate articles that appeared to provide credible and accurate
information. The researcher ultimately focused the search for literature primarily on
peer-reviewed articles and websites related to the research topic because of the constant
changes relating to technology, the increasing availability of information online related to
technology, and the fact that very few books have been written about CPS or PI.
The researcher conducted Boolean keyword searches of peer-reviewed literature
available primarily from online databases and the Internet. The searches focused on the
researcher‘s quest to find literature about the use of a CPS and the use of PI along with a
possible impact on student achievement and motivation in the middle school math
classroom. The researcher found it challenging to locate articles related to the focus of
the research due to the wide variety of names that educators use when referring to this
type of technology. The researcher used general terms including classroom performance
system, clickers, pedagogy, peer instruction, student achievement, student motivation,
student perceptions, teacher perceptions, middle school classroom, mathematics, surveys,
Instructional Materials Motivation Survey, John Keller, ARCS Model of Motivational

15
Design, K–12 education, meta-analysis, literature review, and theoretical frameworks.
These searches resulted in a multitude of articles. However, many of the located articles
were not relevant to the proposed research. In an effort to reduce the search results to
include only articles pertinent to the goal of the proposed study, the researcher performed
a more concentrated search by varying the combination of the previously listed general
terms. At this point, limited results were returned, and they indicated a possible gap in
the literature in regards to CPS using PI pedagogy in a middle school classroom and how
they impact student achievement and motivation.
A review of the literature yielded multiple meta-analyses or literature reviews
pertaining to CPS and related topics. Electronic response systems such as CPS have been
utilized in postsecondary classrooms since the 1960s (Deal, 2007). In the past decade,
CPS has become popular in the K–12 classroom as well. In fact, one manufacturer of
CPS technology, eInstruction, purports that their company has sold over one million sets
of CPS to schools that house K–12 classrooms (eInstruction, 2011). Accordingly, much
research has been conducted about various aspects of CPS and PI respectively; however,
most of the research has been conducted at the collegiate level.
Judson and Sawada (2002) provided an historical summary of CPS use prior to
1998 in postsecondary classrooms, thus most of this review is dated. The researchers
analyzed 11 peer-reviewed articles, seven conference reports or proceedings, one
website, two books, and three dissertations relating to ARS.
Fies and Marshall (2006) completed an analysis of methods used to assess CPS
with a focus on the benefits and limitations of such technology. In addition, the
researchers examined 23 peer-reviewed studies, which included only three articles that

16
were published after 2004. Therefore, much of the information in this literature was
outdated even at the time of publication.
Barber and Njus (2007) analyzed 12 peer-reviewed pieces of literature, including
other literature reviews relating to CPS, in order to compare the characteristics, benefits,
challenges, and drawbacks of six leading brands of radio-frequency CPS systems. Barber
and Njus‘ research can be used to help provide information to those people preparing to
select an appropriate CPS system.
Caldwell (2007) analyzed 40 peer-reviewed articles, seven conference articles,
five books, and two website articles related to CPS. The researcher examined the
literature on CPS as applicable to large-enrollment classes and summarized the best
practices for CPS use and student and faculty attitudes. She also discussed the successes,
outcomes, and challenges of this technology based upon educational research.
Simpson and Oliver (2007) completed a two-stage review in 2002 and 2006 of the
literature relating to CPS. The researchers analyzed more than 40 pieces of literature.
Twenty-six of the cited articles were from peer-reviewed journals, 14 were from
conferences or proceedings, and six were from websites. Six of their references were
books of educational theory relating to learning or CPS. The researchers identified six
themes in their review of the literature concerning CPS: environments in which CPS is
used, reasons or rationale for use, pedagogy, impact on the staff, organizational issues,
and student perceptions.
MacArthur and Jones (2008) completed an extensive review of 71 peer-reviewed
journal articles, seven websites, 14 conference papers, and three books relating to the use

17
of CPS. The researchers discussed the benefits and drawbacks of the technology as well
as pedagogy that are effective in using CPS.
Cain and Robinson (2008) examined the literature in 30 peer-reviewed studies
and two conference papers regarding CPS. The authors focused on the issues, benefits,
potential uses, and future areas of educational research of CPS instructional strategies in
relation to the health profession and more specifically to pharmacy education.
Kay and LeSage (2009) analyzed 67 peer-reviewed articles ranging from 2000 to
2007. The articles related to CPS research at the collegiate and professional level in the
medical field. Fifty-nine of those articles focused on math and science. The researchers
reviewed 26 terms used synonymously to identify CPS technology, which reinforces the
difficulty in finding and comparing literature regarding this topic. They discussed the
benefits and challenges of using this technology for both teachers and students. They
proposed that future research should center around (a) determining why certain benefits
and challenges affect the use of CPS, (b) analyzing the impact of certain types of
questions used with the technology, (c) conducting research in a broader range of
environments and subject areas, and (d) revealing individual differences in the use of this
type of technology (i.e., gender, grade levels, age, learning style, etc.).
Finally, De Gange (2011) examined 15 peer-reviewed studies on how CPS can
best be used to promote learner engagement and how to improve classroom education in
order to provide more effective and efficient instruction as it relates to nursing education.
The researcher focused on formative assessment, learning outcomes, student
participation, student interactivity, and student satisfaction (De Gange, 2011).

18
This review of the available literature on integration of a CPS in middle school
includes a limited number of articles that discuss CPS used in K–12 schools as compared
to articles pertaining to the use of CPS at the postsecondary level (Lively, 2010;
Musselman, 2008; Rigdon, 2010; Sartori, 2008; Shirley, 2009. Even most of these
included studies attempted to focus on whether or not CPS was used in the study, and not
on the pedagogy involved. However, ―The field of educational technology is under
external pressure to provide evidence of identifiable learning outcomes that can be
attributed to technology‖ (Schrum et al., 2007, p. 1). The debate about the use of
technology seems to be between the idea that technology is just an instructional delivery
mechanism (Clark, 1983; Rich, 2007; Schrum et al., 2007) and the idea that technology is
an end unto itself (Kozma, 1991).
Research on CPS suggests that this technology promotes learning when
accompanied with research-based pedagogy (Adams & Howard, 2009). The researcher
believes that using CPS-based instruction with PI will improve student motivation and,
ultimately, student achievement in the middle school classroom. Kelly (2011) stated,
―The field of education is changing and new theories and teaching methods can make all
the difference in the world for new, struggling, and even experienced teachers‖ (para. 7).
However, with today‘s economic hardships, funding for technology as well as staff
development funds for teaching educators how to use this technology are two of the first
areas to be cut from the budget (Kelly, 2011).
Conceptual or Theoretical Frameworks
Roblyer (as cited in Schrum et al., 2007) noted, ―The field of educational
technology currently lacks a clear theoretical foundation as a framework for research‖

19
(para. 1). Beatty and Gerace (2009) found CPS to be a promising instructional
technology, despite the inability of researchers to distinguish CPS technology from CPS
pedagogy. Several different theoretical frameworks can be found in the literature related
to the integration of various electronic response systems. These learning theories are
known as standards based classroom, active learning, Sociocultural Learning Theory, and
Constructivism.
Standards based classroom. In an effort to rise to the challenge of national,
state, and local mandates to improve the quality of education in all classrooms, educators
are expected to maintain a Standards Based Classroom (SBC). According to the Georgia
Department of Education (2011b), a SBC is one in which the curriculum, instruction,
student learning, and assessment are specifically aligned to a given set of academic
standards. In Georgia classrooms, these academic standards are the Georgia Performance
Standards (GPS). The GPS identify specific content and align the curriculum both
horizontally and vertically for each grade and subject area in grades K–12. The premise
of a SBC is that all students will have access to clearly communicated and understood
standards, and that all students will produce evidence of high levels of learning and
academic rigor. Thus, the teacher knows exactly what is to be taught, and the teacher and
student know and can communicate specifically what the student should know and be
able to do. The teacher will provide remediation and/or enrichment based upon the data
from the frequent formative assessments. In this type of well-designed instruction,
teachers plan collaboratively with subject area/grade level peers, teach, assess, and
reteach based upon assessment data. An important component of SBC teaching is
frequent meetings with same grade level and subject area teachers in order to discuss

20
assessment data, make adjustments in teaching or reteaching content, and tweak or
redesign the assessment. Assessment is one of the most important components of the
SBC, and must expressly measure the standards that are being taught.
SBC design is very structured. Every classwork assignment, homework
assignment, project, or test should relate to a specific standard or set of standards that has
been expressly taught. The class normally starts with a reference to the standard that is
being taught, as well as a discussion of an essential question that students should be able
to answer by the end of the class or unit, which is based on that previously-stated
standard. Throughout the instructional period, the teacher and the students should make
frequent references to the standard and use specific language from the standard. After a
brief teacher- or student-centered instructional period, there is a clearly defined work
period followed by some type of closure and/or brief formative assessment. Using
instructional technology in the SBC is recommended in order to help promote active
learning (International Society for Technology and Education, 2000; Palak & Walls,
2009).
Active learning. Active learning is referred to in many research articles that
discuss the use of electronic response systems (Hoffman & Goodwin, 2006; Martyn,
2007; Paschal, 2002). Active learning, often associated with Bruner (1961), refers to
engaging students‘ minds in the learning process. Research indicates that students who
are actively engaged in their learning will grasp and retain more information, thus
resulting in deep learning (Berry, 2009; Moredich & Moore; 2007; Trotter, 2005). Phil
Schlechty (2002) and The Schlechty Center have completed much work regarding the
importance of student engagement and its affect upon student achievement. Additional

21
research by Fies and Marshall (2006) indicated that the benefits of CPS most commonly
seen at the postsecondary level were students‘ perceptions of class being more fun and
engaging, and both instructors and students becoming more aware of the level of the
students‘ understanding.
According to the Center for Teaching Excellence (2009) at Virginia
Commonwealth University, the use of CPS has great potential for creating a learning-
centered, active classroom by:
1. providing frequent feedback to both students and professors on a daily basis.
2. exploring and exposing hidden misconceptions that both students and
instructors may bring with them to class.
3. using it in conjunction with active learning techniques that are particularly
suitable for large class settings.
4. surveying student attitudes, opinions, and behaviors.
5. informing instructors about the effectiveness of various teaching methods or
learning activities.
Various researchers have coupled active learning and the integration of a CPS
with positive results. Jones (2009) found that a student response system along with PI
resulted in a positive impact on learning when used to facilitate active learning in large
undergraduate courses. Results from Paschal (2002) indicate that learning physiology
concepts is potentially more effective when in-class quizzes and activities are used in
conjunction with instant feedback via a CPS rather than traditional learning activities
such as passive lectures or homework. Berry (2009) engaged in research in
postsecondary nursing classes using CPS with a focus on active learning teaching

22
methods, which resulted in increased student learning outcomes as well as student
satisfaction. Gauci, Williams, and Kemm (2009) further added to the body of literature
by investigating whether an active learning environment and the implementation of CPS
resulted in improved learning and student engagement. Results indicated an increase in
both student motivation and engagement as well as increases in exam scores. Radosevich
et al. (2008) examined whether CPS impacted student motivation and fostered active
learning. Results of the study showed that teachers who used the CPS as an integral part
of classroom instruction performed better on a midterm exam, reported greater
engagement in the class and higher expectations of success, and performed higher on a
knowledge-retention test given at the end of the semester.
Constructivism. The Constructivist theory of learning based upon the ideas of
Dewey, Vygotsky, and Piaget has been the foundational concept used by many
researchers who have studied various types of classroom response systems.
Funderstanding (2008) said that Constructivism in the classroom focuses on connections
between facts and promoting awareness of learning in students. Constructivist instructors
use strategies that are in tune to student questions and encourage students to analyze,
interpret, and predict information. Constructivist teachers also use open-ended questions
to promote student dialogue.
Constructivism is student-centered and sometimes called ―discovery learning‖
because students are provided opportunities to construct knowledge through discovery,
projects, or authentic learning (D‘Angelo et al., 2011). In this model, students frequently
work together in cooperative groups, and learners‘ responses often guide the direction of
the lesson and instructional strategies. The instructor acts more as a facilitator of learning

23
than as a traditional teacher who simply transfers information to his students. Active
learning falls under the umbrella of the Constructivist learning theory.
Barnett (2006) states, ―personal knowing is created by students in interaction with
the material, other students, the instructor, their memories, and the world in general‖ (p.
2). Other researchers have advocated for Constructivist learning coupled with student-
centered learning (Preszler, Dawe, Shuster, & Shuster, 2007), peer and classroom
discussion (Penuel et al., 2007), self-managed learning experiences (Harper, 2009), and
the use of PI (Wood, 2004).
Sociocultural learning. Another theory associated with the use of CPS
instruction is the Sociocultural Theory. Penuel, Abrahamson, and Roschelle (2006)
propose that Vygotsky‘s Sociocultural Theory provides an explanation of the experiences
and outcomes for students using electronic response systems because it addresses the
issues of classroom interactions and dynamic structuring of the classroom. Sociocultural
Theory states that learning cannot be separated from social interactions between
individuals. A major aspect of PI is social interaction, which will be discussed later in
this research.
Student Motivation
Student motivation studies. This review of the literature indicates that many
studies are related to student motivation, which is a critical piece of the puzzle for
educators seeking to improve student achievement. Teachers use a variety of
pedagogical methods to engage and motivate their students. Motivating and engaging
students can be difficult as many intrinsic and extrinsic elements and factors can affect
student motivation and engagement. Muller, Eklund, and Sharma (2006) discussed the
24
implementation of technology in the classroom. These researchers suggested that
classrooms that are already using successful intervention should be studied to discern
what motivational techniques are being utilized, and then use that information to perform
new intervention experiments. Research indicates that the use of a CPS seems to
motivate college students (Gauci et al., 2009; Radosevich et al., 2008).
The motivational tactics used by teachers must lead to a mastery of the
instructional goals. Entertainment is not the purpose of motivating students. The
purpose is to promote learning (Keller, 2006a). CPS is a great way to maintain a high
level of student motivation and involvement; lecturing destroys motivation and decreases
attention to content (Duncan, 2005). Calhoun (n.d.) stated, ―The use of a CPS is one
technological tool that by its very nature motivates and engages students through active
and cooperative learning‖ (para. 1). Beatty (2004) and McLoughlin (2008) stated that by
engaging students‘ minds in class that CPS-based instruction makes students active
participants in the learning process. Teachers can sometimes utilize classroom
management techniques or tools that are fun or promote positive feelings about the
teacher or the course, but do not promote learning (Keller, 2006a). CPS can also be used
as a fun tool for teachers to promote learning; however, sound and effective pedagogical
methodology must be employed along with the use of CPS in order for student learning
to take place. The goal of teaching with CPS is improved student learning, but many
other benefits will be reaped for both teacher and student (Calhoun, n.d.). Unfortunately,
many teachers do not even recognize improved student learning as the goal of using
technology in the classroom, and definitely do not understand which pedagogy to use to
accomplish that goal (Schrum et al., 2007). Student learning can certainly be impacted

25
positively using CPS if it is used to facilitate feedback, identify and correct student
preconceptions, and direct adjustments to teaching strategies (eInstruction, 2010).
However, to fully realize the potential of the CPS technology, an appropriate instructional
design should be utilized with the technology.
ARCS model of motivational design. Research is plentiful that indicates student
achievement and student motivation are paramount to student learning. However, the
age-old question of how to increase student motivation has concerned, frustrated, and
challenged instructors for years. Keller (1984, 1999) purports that instructors can
purposefully and systematically design instruction and manage the learning environment
to stimulate student motivation. Keller (1984) developed the ARCS model of
motivational design which can be used to help instructors purposefully design instruction
to encourage, promote, and increase student motivation. The ARCS model can be broken
down into four components related to the motivational requirements of learners:
attention, relevance, confidence, and satisfaction, all or part of which can be included in
instructional design in order to influence and motivate students to learn (Keller, 1987).
The four components were identified by Keller based upon a synthesis of research on
human motivation (Keller, 1999). The four components are referred to as principles
(Keller, 2008) and fundamental requirements (Keller, 2010a) in later research.
Attention. The first step in increasing student motivation is to acquire and
maintain the student‘s attention (Keller, 1987, 1999). Keller (2008) defines attention as
gaining, building, and sustaining the curiosity of the learner in an activity.
Relevance. Once the teacher has gained the students‘ attention, the second step in
increasing student motivation is to help the students understand the importance of the

26
lesson, to realize the personal connection of the topic, and to make the instruction
meaningful or authentic to the learner (Keller, 1987, 2008). Keller (1987) defines
relevance as satisfying the personal needs of the learner, which brings about positive
results. Keller (1999, 2008) further asserts that relevance results from the instructor
purposefully connecting the instructional content to the student‘s personal learning goals,
interests, learning styles, and experiences.
Confidence. The third step in increasing student motivation is to help build the
student‘s confidence (Keller, 1987). Some students can have too little or too much
confidence, which can impact their level of motivation (Keller, 1987). Keller (1987)
defines confidence as the learner‘s belief that he/she has the ability to learn and to expect
that he/she will be successful based on personal efforts.
Satisfaction. Last but not least, the fourth step in increasing student motivation is
to ascertain student satisfaction with the learning process or the results of the educational
experience (Keller, 1987). Keller (1987, 1999) defines satisfaction as the student‘s
personal sense of accomplishment through intrinsic or extrinsic rewards.
Keller (1987, 1999) provides practical instructional strategies that instructors can
use to design instruction and generate ideas in order to help attain each of the four
components related to motivation. Keller (1987, 1999) maintains that the attention
component can be built into instruction by piquing the learner‘s curiosity, using novel
approaches to teaching, asking questions, and generating inquiry. Keller (2008) discusses
the importance of varying one‘s teaching strategies or techniques and pacing, as students
will become bored with routine, no matter how interesting or novel the subject is at first.

27
Keller (1987, 1999) provided several instructional strategies for building the
relevance component of student motivation into instruction. The instructor can explain
learning objectives to students, provide individual learning opportunities, allow
cooperative learning activities, use simulations when possible, and give concrete
examples and analogies related to the students‘ current interests.
Additionally, Keller (1987, 1999) provides suggestions for instructional strategies
that incorporate the confidence component of student motivation into instruction.
Instructors could provide and discuss a rubric in order to explain the learner expectations
and grading criteria. Providing examples of quality student work also helps to build
confidence. The instructor could incorporate a wide variety of challenging learning
opportunities while providing multiple chances for individual success. Keller (1987,
1999) indicates that providing frequent feedback can build confidence.
Finally, Keller (1987,1999) provides instructional strategies that can help build
the satisfaction component of student motivation into instruction. Keller (1987, 1999)
suggests that satisfaction can be built into student motivation by using real-life examples
and problems; providing verbal praise, tangible rewards or incentives; or allowing the
learners to share or affirm their efforts. It should be stressed that in order to build
satisfaction, ―Students must feel that the amount of work required by the course was
appropriate‖ (Keller, 2008, p. 178), and that ―there was internal consistency between
objectives, content, and tests; and that there was no favoritism in grading‖ (Keller, 2010a)
p. 308). This statement by Keller (2008, 2010a) supports the state-mandated SBC
approach to teaching that is used in the classrooms at the research site.

28
Keller‘s ARCS model of motivational design and his validated instrument
developed for measuring motivation, the IMMS, have been used worldwide for many
years and the validity confirmed in a variety of disciplines (Carson, 2006; Chan, 2009;
Chen, 2011; Cheng & Yeh, 2009; Cook, Beckman, Thomas, & Thompson, 2009; Dunn,
Rockinson-Szapkiw, Holder, & Hodgson, 2010; Gabrielle, 2003; Huang et al., 2004;
Huett, Kalinowski, Moller, & Huett, 2008; Jaemu, Kim, & Lee, 2008; Jumanwan, 2011;
Keller, 1997; Kim & Keller, 2008; Keller & Suzuki, 2004; Liao & Wang, 2008; Means,
Jonassen & Dwyer, 1997; Rockinson-Szapkiw, Holder, & Dunn, 2011; Small, 2006;
Small & Gluck, 1994;Visser & Keller, 1990; Yang, Tsai, Chung, & Wu, 2009).
Classroom Performance Systems
Much information has been presented in this chapter related to learning and
instructional design theory. However, to this point, little information has been discussed
about CPS itself.
Definition of a CPS. CPS has been used in many commercial and educational
settings. CPS is a technological tool that affords instructors the ability to easily engage
students in active learning (Duncan, 2005). CPS is often utilized in postsecondary
classes (Beatty, 2004; Beatty & Gerace, 2009; Carnevale, 2005; Crouch & Mazur, 2001;
Duncan, 2005) and is becoming more popular in K–12 schools as well. CPS technology
allows and encourages all students to become active learners during instruction (Jones,
2009). Deal (2007) described CPS as an electronic system used to poll students and
gather immediate feedback. Boyd (2003) said the benefit of a CPS is that it allows
students to respond to questions without fear of verbalizing an incorrect answer. This is
29
possible because students give their answers to questions anonymously on a
computerized keypad, as opposed to more risky response options.
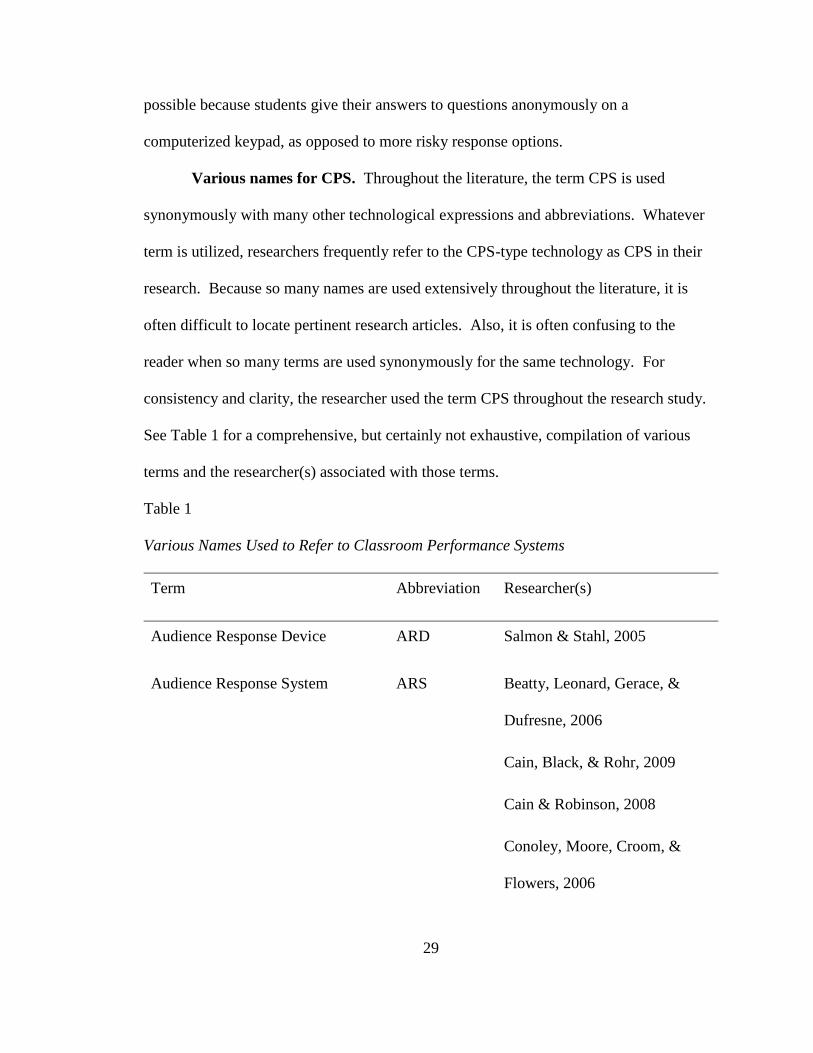
Various names for CPS. Throughout the literature, the term CPS is used
synonymously with many other technological expressions and abbreviations. Whatever
term is utilized, researchers frequently refer to the CPS-type technology as CPS in their
research. Because so many names are used extensively throughout the literature, it is
often difficult to locate pertinent research articles. Also, it is often confusing to the
reader when so many terms are used synonymously for the same technology. For
consistency and clarity, the researcher used the term CPS throughout the research study.
See Table 1 for a comprehensive, but certainly not exhaustive, compilation of various
terms and the researcher(s) associated with those terms.
Table 1
Various Names Used to Refer to Classroom Performance Systems
Term Abbreviation Researcher(s)
Audience Response Device ARD Salmon & Stahl, 2005
Audience Response System ARS Beatty, Leonard, Gerace, &
Dufresne, 2006
Cain, Black, & Rohr, 2009
Cain & Robinson, 2008
Conoley, Moore, Croom, &
Flowers, 2006

30
Graham et al., 2008
Gustafson & Crane, 2005
Holmes et al., 2006
Jackson, 2007
Judson & Sawada, 2006
Kay & Knaack, 2009
Kay & LaSage, 2009
Latessa & Mouw, 2005
MacGeorge et al., 2008
Medina et al., 2008
Penuel et al., 2006
Salmon & Stahl, 2005
Shirley, 2009
Silliman & McWilliams, 2004
Stowell & Nelson, 2007
Walton, Homan, Naimi, &
Tomivic, 2008
Audience Response Technology ART Albon & Jewels, 2007
Keong & Pieng, 2008
MacGeorge et al., 2008

31
Classroom Communication System CCS Beatty, 2004
Classroom Interaction System CIS Beuckman, Rebello, &
Zollman, 2006
Classroom Performance System CPS Bloemers, 2004
Boyd, 2003
Deal, 2007
Greer & Heaney, 2004
Lively, 2010
McGeorge et al., 2008
Thomsen, 2006
Classroom Response System CRS Bruff, 2009
Calhoun, n.d.
Deal, 2007
Duncan, 2005
Fies & Marshall, 2006
McLoughlin, 2008
Moredich & Moore, 2007
Rubner, 2011
Classroom Response Technology CRT Beatty & Gerace, 2009

32
Classroom Voting System CVS Cline, 2006
Cline et al., 2007
Clickers Adams & Howard, 2009
Addison, Wright, & Milner,
2009
Barber & Njus, 2007
Bode et al., 2009
Boyd, 2003
Brickman, 2006
Caldwell, 2007
Carnevale, 2005
De Gange, 2011
Duncan, 2005
Jackson, 2007
Keller et al., 2007
MacArthur & Jones, 2008
May, 2007
Nelson & Hauck, 2008
Prather & Brissenden, 2009

33
Pritchard, 2006
Sullivan, 2009
Wood, 2004
Zhu, 2007
Electronic Response Systems ERS Freeman, Blayney, & Ginns,
2006
Judson & Sawada, 2002
Satori, 2008
Electronic Voting Systems EVS Cutts et al., 2007
Draper & Brown, 2004
King & Robinson, 2009a
Simpson & Oliver, 2007
Group Response System GRS Carnaghan & Webb, 2007
Interactive Classroom
Communication System
ICCS Kay, 2009
Interactive Student Response
System
ISRS Blodgett, 2006
Mobile Response System MRS Rubner, 2011
Personal Response System PRS Ainsworth, n.d.

34
Ainuson, 2008
Barrett, Bornse, Erickson,
Markey, & Spiering, 2005
Butler, 2005
Butler & Butler, 2006
d‘Inverno et al., 2003
Elliot, 2003
Gauci et al., 2009
Gustafson & Crane, 2005
Hoffman & Goodwin, 2006
Hudson, McGowan, & Smith,
2010
Jackson, 2007
Lucas, 2009
Nightingale, Palumbo, &
Donahue, 2008
Roush & Song, 2011
Wit, 2003
Zahner, 2011
Personal Response Technology PRT Gustafson & Crane, 2005

35
Personal Response Unit PRU Barnett, 2006
Question-based gaming technology QBGT Door, 2006
Short Messaging Service Response
System
SMSRS Keong & Pieng, 2008
Student Response System SRS Dangel & Wang, 2008
Hall et al., 2005
Horowitz, 1998
Johnson & Meckelborg, 2008
Jones, 2009
Kaleta & Joosten, 2007
Manzo, 2009
Musselman, 2008
Penuel et al., 2007
Preszler et al., 2006
Radosevich et al., 2008
Rigdon, 2010
Student Response Technology SRT Greer & Heaney, 2004
Student Response Units SRU Duncan, 2006
Wireless Communication System WCS Paschal, 2002

36
Wireless Response Systems WRS Cleary, 2008
Note. Table based upon the work of Keong and Pieng (2008). Used with permission.
Implementation of a CPS. Research provides suggestions for implementation
procedures for teachers who are just starting out with this type of technology. Kaleta and
Joosten (2007) provided several implementation recommendations for those beginning to
use CPS for the first time at the collegiate level that could apply to K–12 schools as well.
These recommendations centered upon providing technical support for teachers and
students, encouraging faculty to redesign their course several months ahead of teaching
the course, negotiating the best price possible when students are required to purchase the
remotes, and using only one brand of student response system.
Classroom performance systems are easy to set up and use. However, prior to
use, instructors should receive training on how to use the technology and have a backup
plan for technological support as needed. Duncan (2005) developed a list of ideas with
corresponding explanations of how to best put those ideas into action. First, the teacher
should set up the classroom to make it amenable to CPS use. To prepare a classroom for
CPS use, the teacher should test the set of CPS using the technology in the setting where
the CPS will be used. This should be done prior to the first use with students. Secondly,
the teacher should have a clear set of goals in mind for CPS use and should plan in
advance how CPS use will be graded and explain this grading process to the students. If
the instructor‘s goal is student participation, then partial credit should be given for
incorrect answers. Third, the instructor should start with a few CPS questions per class
and increase the number of questions as the instructor‘s and student‘s comfort level with

37
the technology increases. The level of questions used by the instructor must not be too
simple or complex, relate to the standard(s) being taught in the course, and relate to
questions that will be on an exam. Fourth, the teacher should be prepared for class and
have a backup plan in the event that something does not work as planned. Finally, the
teacher should be encouraged by the use of CPS technology and the benefits that can be
afforded to both the teacher and the instructor and the student.
Advantages and uses of CPS for teachers and students. The main advantages
for obtaining feedback from electronic response systems as opposed to nontechnical
response systems for gathering feedback are the anonymity of responses, the capability to
immediately provide formative feedback, and the ability to project students‘ responses as
a histogram or graph on a projection screen for everyone in the class to view (Deal, 2007;
MacArthur & Jones, 2008). CPS can also save students‘ responses for future analysis,
interpretation, and assessment. The advantage of assigning each student his or her own
clicker is that attendance and quiz score data can be recorded immediately for that student
each time CPS is used (MacArthur & Jones, 2008). Keong and Pieng (2008) state, ―Its
prowess [CPS] lies not in the technology but in the capitalization of its ability to be used
as a tool to support education processes—teaching and lecturing‖ (p. 485).
A variety of advantages exist when implementing CPS. Duncan (2006) states that
the use of CPS is an easy way to get students to be more active. Deal (2007) reported
that the use of CPS ―can facilitate the process of drawing out prior knowledge,
maintaining student attention, and creating opportunities for meaningful engagement‖
(p. 1).

38
As is supported by proponents of SBC, the most successful implementations of
CPS occur when instructors set clear objectives and aid the achievement of those
objectives through thought provoking, engaging educational tasks (Crouch & Mazur,
2001; Deal, 2007). CPS assists instructors in reaching those goals by allowing them to
assess student comprehension and develop classroom tasks that allow for the application
of important aspects related to classroom standards for authentic learning (Deal, 2007).
Deal (2007) states that CPS implementation occurs in three formats: (a) monitoring the
classroom (attendance, attention, completion of assigned readings), (b) audience-paced
instruction (real-time evaluation of student comprehension), and (c) PI (question/response
cycle combined with discussion and debate among students).
CPS use develops meaningful engagement among students through collaboration
(Barnett, 2006), and does so even in large classes where engagement is often a major
concern. Elliot (2003) mentions that CPS reduces the teacher‘s workload and gives him
or her the ability to move freely about the room. Using CPS allows students to see visual
proof that they are not the only ones who do not understand a concept (Wood, 2004).
This would certainly help build self-confidence in normally quiet students or students
who are reticent to ask for help when they do not comprehend during a lesson.
CPS can be used for a variety of purposes in the classroom. Caldwell (2007)
listed the uses of CPS technology as ―spicing up standard lecture classes with periodic
breaks, assessing student opinions or understanding related to lecture, increasing the
degree of interactivity in large classrooms, conducting experiments on human responses,
and managing cooperative learning activities‖ (p. 10). Administration and immediate
scoring of summative assessment, formative assessment, and structuring of student

39
collaboration are other ways that CPS can be used in the classroom (MacArthur & Jones,
2008). Additional uses for CPS are assessing student preparation; ensuring
accountability about required classroom readings or homework; surveying students about
the pace, effectiveness, and teaching styles in lectures; polling students‘ opinions or
attitudes about a variety of topics/issues; probing students‘ pre-existing level of
understanding; completing practice problems; guiding student thinking; making lectures
fun; and using questions with multiple correct answers or only partially correct answers
to prompt discussion (Caldwell, 2007). CPS can be used to stimulate classroom
discussions as well as to assess students‘ comprehension of the curriculum in a non-
threatening manner (Kaleta & Joosten, 2007).
Other uses for CPS exist that can assist educators in a SBC. Penuel et al. (2007)
shared the following uses for CPS: gaining an enhanced idea of what students do and do
not know, promoting student achievement, making students more cognizant of and
responsible for their own learning, differentiating or individualizing instruction,
improving assessment and feedback, increasing teacher productivity, saving time
required for grading classroom assignments or tests, and assessing student knowledge.
Student achievement and CPS. According to the literature, CPS appears to be a
logical choice for educators in a SBC to help promote and increase student achievement.
Positive results have been obtained from studies regarding the implementation of CPS
and student achievement. Kaleta and Joosten (2007) found that the use of CPS positively
impacted student grades but not long-term student retention of information. Slavin and
Shiell (2008) indicated that there was a positive correlation between CPS scores and class
grades. A pilot study of CPS use in the 28,500 student K–12 school district in Boulder,

40
Colorado, resulted in increases in student achievement and student attention for students
who used CPS (Manzo, 2009). Thus, the Boulder Valley School District purchased CPS
for all math and science classes in its 12 middle schools and began training sessions for
the teachers in those schools (Manzo, 2009). Deal (2007) stated that research for an
entire course showed a 60% mean pass rate for lecture sessions in which a CPS was not
used, but an 80% mean pass rate for sections using CPS. Research conducted at the
University of Houston (2008) found that students‘ grades increased when CPS was
incorporated into lectures as opposed to their counterparts in more traditional classrooms
whose grades did not increase after lectures. Research participants at Ohio State
University (2008) who used CPS earned final exam scores that were about 10% higher
than students who did not, the difference being an equivalent of a full letter grade.
While many studies showed an increase in student achievement, there were other
studies that showed no increase. Greer and Heaney (2004) indicated that results were not
conclusive that CPS actually improved student learning of required materials presented in
a lecture format; however, due to the students‘ perception of increased learning, the CPS
technology will continue to be implemented at Penn State University, where the study
was conducted. Stowell and Nelson (2007) did not find better performance on learning
outcomes for CPS users as compared to flash card and hand raising audience
participation methods. Nightingale et al. (2008) found a statistically significant
difference in student grades between genders. One gender was the control group and the
other was the treatment group who used CPS; however, the article was not clear about
which gender had higher mean scores. The researchers found that overall student
achievement based upon final exam scores remained about the same. Lasry and Findlay

41
(2007) found no difference in achievement between students who used CPS and students
who used flashcards to provide student feedback.
Research supports that students perceive CPS as enhancing their learning (Albon
& Jewels, 2007; Caldwell, 2007; Fies & Marshall, 2006; Jackson, 2007; Judson &
Sawada, 2002; Poirier & Feldmen, 2007; Simpson & Oliver, 2007; Weiman & Perkins,
2005). Harlow et al., (n.d). found that 65% of students like using CPS, and 69% of
students believe that CPS helps them learn. Dangel and Wang (2008) examined the
relationship between the use of CPS and the level of student engagement and learning.
Both teachers and students perceived that CPS was beneficial; however, quantifiable
proof of learning could not be determined from the study. While not able to verify its
benefits for learning, their research did show that CPS promotes student engagement and
feedback, which are two aspects that promote learning. Students enjoy using CPS and
perceive it to have a positive effect on their learning (Barnett, 2006; Harlow, 2008;
Holmes et al., 2006; Jackson & Trees, 2003).
CPS and motivation. Research indicates that students respond positively to
CPS, especially when instructors use CPS to engage and motivate students and to provide
immediate feedback on their learning (Kaleta & Joosten, 2007; MacGeorge et al. 2008;
Trees & Jackson, 2007). Prather and Brissenden (2009) indicated that the use of CPS
technology (a) motivated students to want to answers questions correctly, (b) increased
student learning, (c) positively effected test scores, (d) increased student attention, and (e)
improved student interest in course content. Hall et al. (2005) found that CPS increased
student motivation and engagement in large enrollment classes at the postsecondary level.
Cain et al. (2009) indicated that the use of CPS technology improved student motivation

42
and attention as well as promoted student learning evidenced by higher course grades.
Walton et al. (2008) found that students at Purdue University perceived CPS as having a
positive effect on attention and classroom participation. Nonetheless, their perceptions
were neutral toward CPS‘s effect on motivation, utilization of instructional time, and
whether or not using CPS was enjoyable. Preszler et al. (2007) performed research at
New Mexico State University in order to determine the influence of CPS on student
attitudes and performance. The results of this study indicated that most students had a
positive impression of using CPS and believed that the technology improved their interest
in the class, improved their attendance, and improved their academic performance.
Additional support for improvement in student motivation can be found in the
literature. Mesa Public Schools in Arizona currently provide teacher training to their
elementary teachers on using CPS to increase student motivation and increase student
performance (Zahner, 2011). Manzo (2009) indicated that the use of CPS and PI increase
student achievement and attention in K–12 students. Satori (2008) confirmed that CPS
increased student achievement and motivation for K–12 students. Kay and Knaack
(2009) found increased student motivation in 10th through12th grade students. Bloemers
(2004) found increased student motivation and student performance with sixth grade
science students.
Duncan (2005) stated that student perceptions are relevant because teachers are
trying to build lifelong learners, and that is only likely if the students are interested and
involved in the course content. Ainsworth (n.d.) explored student perception on the use
of CPS in the classroom in postsecondary classrooms in Australia. That study indicated
that instructors usually make educational decisions about using technology to improve

43
classroom instruction and pedagogical practices without gathering student perceptions.
Ainsworth further suggested that asking for and understanding student perceptions could
enhance the implementation of CPS by the instructor. Research by Keong and Pieng
(2008) supported requesting feedback from students about CPS in order to gather
information about using this type of technology in education.
A major factor in student perception of CPS is determining whether or not it
provides enjoyment of learning. A majority of students enjoy using CPS and perceive it
to have a positive affect on their learning (Jackson & Trees, 2003) and would take classes
in the future that use CPS technology because it is easy to use and understand (Holmes et
al., 2006). This is especially true in lower-division courses as opposed to upper-division
courses (Preszler et al., 2007). Barnett (2006) found that students appreciate immediate
formative feedback, the interaction during lectures, peer comparisons, higher levels of
involvement, exam hints, and more effective learning. Students clearly enjoy the
presence of CPS in the classroom.
While research clearly indicates that there are many advantages to using CPS and
that most students enjoy using CPS and perceive that this technology helps them learn,
disadvantages relating to CPS in the literature have been reported and should be
considered. Research indicates that common negative complaints regarding the
implementation of CPS center around the cost for college students to purchase a remote
control (Barnett, 2006; Greer & Heaney, 2004; May, 2007; Zhu, 2007), problems
associated with technical difficulties (May, 2007; Silliman & McWilliams; 2004; Zhu,
2007), and lack of teacher skill/experience in using the technology (May, 2007), and
wasted time in class due to setting up and using the technology (Barnett, 2006). In

44
addition, Latessa and Mouw (2005) cited potential barriers to the use of CPS as the need
for more preparation time for teachers and the high cost of the technology. Elliot (2003)
said that a drawback to using this technology is that traditional lectures can cover more
material in the same amount of class time. Harlow et al. (2008) noticed that
administrators had an increased workload when CPS was used. However, May (2007)
indicated that negative comments about CPS use from teachers and students might be
informative to help guide future use and eliminate the negative issues related to CPS use.
In addition, even though the research points out several disadvantages regarding CPS
implementation, the researcher believes that the literature can provide possible solutions
to previously experienced difficulties. Appropriate preparation, technology support, and
knowledge of how researched-based pedagogy complements CPS use could enhance
future CPS implementation.
CPS Pedagogies. Several pedagogies are associated with the Constructivist and
Active Learning theories and implementation of CPS technology. Penuel et al. (2007)
indicated that while many different pedagogies exist and work well with CPS, all of the
models, which may have slight differences, have common elements. Some of these
commonalities are questioning techniques, displaying student responses via a histogram
or graph, and discussing and responding to student responses. To become proficient in
using these pedagogies, specialized training is necessary. These pedagogies include
Question Driven Instruction (Beatty et al., 2006), PI (Crouch & Mazur, 2001), Kolb‘s
Experiential Learning Theory (as cited in Fies & Marshall, 2006), Technology-Enhanced
Formative Assessment (Beatty & Gerace, 2009), Assessing to Learn (Dufrense & Gerace,

45
2004), Process-Oriented Guided-Inquiry (University of Massachusetts as cited in Fies &
Marshall, 2006), and Interactive Engagement (Hake, 1998).
All of the aforementioned pedagogical theories involve active learning,
questioning techniques, peer discussions, student-centered instruction, and formative
assessment with frequent or immediate feedback that helps drive the instruction. These
cooperative learning strategies have components known to some educators as think-pair-
share. The researcher utilized a combination of overlying themes from all the theories
discussed previously in this paper. However, the primary learning theory that was
incorporated in this research was the active learning theory while utilizing PI.
The researcher believes that students learn more effectively and are motivated
when learning is active and students can engage in discussion of subject content. The use
of formative assessment through frequent, immediate feedback via the use of CPS
technology allowed instructors to make immediate changes to the instruction based upon
that feedback. However, when conducting research to justify the use of CPS, there must
be a focus on student outcomes instead of just looking at whether or not technology was
used. Distinguishing between differences in results stemming from the use of technology
and the differences in results stemming from the type of methodology or teaching
pedagogy utilized is a difficult task at best. Penuel et al. (2007) said that appropriate
teaching strategies must be utilized in conjunction with CPS to make CPS more effective.
Elliot (2003) indicated that the implementation of CPS maintains student interest
and focus while augmenting active learning and the level of interaction in a lecture
setting, thus allowing teachers and students to more closely monitor the level of student
understanding. Students who use CPS work cooperatively and discuss their answers to

46
the questions posed by teachers and then prove the accuracy of their answer to their
peers. When CPS-based instruction is coupled with PI in this way, the resulting
pedagogy lends itself naturally to the active learning theory.
Peer Instruction
Crouch and Mazur‘s (2001) Constructivist instructional method known as PI, is
referred to repeatedly in multiple meta-analyses of current literature about CPS
(Caldwell, 2007; Fies & Marshall, 2006; Judson & Sawada, 2002; MacArthur & Jones,
2008). PI is one of the main pedagogies associated with the use of CPS (Sullivan, 2009).
Another name associated with PI is interactive engagement (Deal, 2007). Eric Mazur
(1997) developed the PI teaching method. PI instructors purposefully design instruction
that allows students to act by teaching and learning from each other (Gilbert, Hunsaker,
& Schmidt, 2007). PI also allows for any student misunderstanding of the material to be
clarified immediately (Mazur, 2011). This approach to learning requires that instruction
shift from the traditional teacher-led discussion of material to students either actively
seeking information from their peers or confirming their knowledge with their peers
(Deal, 2007). Mazur (2011) describes PI on his website as follows:
Lectures are interspersed with conceptual questions designed to expose common
difficulties in understanding the material. The students are given one to two
minutes to think about the question and formulate their own answers; they then
spend two to three minutes discussing their answers in groups of three to four,
attempting to reach consensus on the correct answer. This process forces the
students to think through the arguments being developed, and enables them (as
47
well as the instructor) to assess their understanding of the concepts even before
they leave the classroom. (para. 2)
For more than a decade in postsecondary classrooms, PI has been successfully
coupled with CPS (Hake, 1998; Mazur, 1997; Pritchard, 2006) and is a proven method of
increasing learning (Duncan, 2006). PI is naturally associated with active learning
because as students are engaged in their own learning, they are required to become active
participants in class and discuss answers with classmates (Duncan, 2005; Mazur, 2011;
Sullivan, 2009). This facet of PI only enhances the impact of CPS because it increases
student involvement, which can decrease the attention fade that can occur during
traditional lectures (Duncan, 2005).
Peer instruction and achievement. Much research is available that indicates
that PI increases student performance and learning (Conoley et al., 2006; Cortright,
Collins, & DiCarlo, 2005; Cortright, Collins, Rodenbaugh, & DiCarlo, 2003; Crouch &
Mazur, 2001; Crouch, Watkins, Fagen, & Mazur, 2007; Guiliodori, Lujan, & DiCarlo,
2006; Lasry, Mazur, & Watkins, 2008; Miller, Santana-Vega, Terrell, 2006; Perez et al.,
2010; Rao, Collins, & DiCarlo, 2002; Rao & DiCarlo, 2000; Smith et al., 2009; Smith,
Wood, Krauter, & Knight, 2011). However, contradictory to those results is research by
Mora (2010), which indicated that PI and typical lecturing by instructors both yielded
equal results in terms of student performance.
Sullivan (2009) purports that the development of effective questions when using
PI is critical to positive learning outcomes and whether or not the use of CPS is an
effective teaching tool. PI, when used along with CPS, often results in a higher level of
questioning (Duncan, 2005; Nicol & Boyle, 2003; Sullivan, 2009). Perez et al. (2010)

48
found that a 14.5% increase in learning gains (changing incorrect to correct answers after
peer discussion) were attributed to peer discussion; however, learning gains were
increased to 19.3% when students were shown the bar graph provided with CPS
technology.
Peer instruction and motivation. Student engagement is increased and students
are more responsible for their own learning when using PI (Zhu, 2007). Research is
available which indicates that instruction coupled with PI and CPS increases student
motivation (Nicol & Boyle, 2003; Prather & Brissenden, 2009). Lucas (2009) found that
PI with CPS enhanced student participation and comprehension. An interesting twist to
research by Lucas (2009) was that he required student participants to write down the
rationale for their answer in an effort to prevent students from being led astray by
domineering group members. Crouch and Mazur (2001) reported differing student
attitudes and opinions regarding courses taught with PI; however, very little change in
student attitude about the course from the beginning to the ending of the courses were
noted. Cortright, Collins, and DiCarlo (2005) indicated that their research participants
using PI were ―motivated, eager to learn, and had fun‖ (p. 109).
The rationale for PI is clear: When a student‘s mind is actively relating new
information to prior knowledge, lasting retention of new concepts is much more likely to
occur (Duncan, 2005; Mazur, 2011). The ability to apply the new information is also a
benefit of using PI techniques and enhancing learning outcomes (Duncan, 2005; Mazur,
2011). A major advantage to the PI strategy is that it can easily be implemented in any
class or subject area (Mazur, 2011). When appropriately used, PI can have a positive
impact on students‘ learning experiences and outcomes in postsecondary level students

49
(Deal, 2007). For these reasons, it appears that CPS and PI are a natural match in the
classroom. While CPS is not required for PI to be used, research indicates that the
technology enhances and facilitates the learning process much more effectively than non-
technological feedback methods (Deal, 2007). The researcher proposes that CPS along
with the PI strategy has the potential to increase student achievement and motivation in
middle school students as confirmed in the literature.
Summary
The use of CPS in classroom instruction has many positive benefits. Current
literature indicates that results vary at the collegiate level as to whether or not the
implementation of CPS actually affects student achievement or is only perceived to affect
student achievement. As most research has been conducted on CPS at the collegiate
level, a gap in the research indicates the need to study the impact of CPS when used
along with an appropriate pedagogy in K–12 schools. In addition, much research has also
been conducted on PI at the collegiate level; however, little research is available on PI in
the K–12 setting. According to the research, an important component of student learning
is student motivation. The current study sought to determine the impact of CPS-based
instruction with PI on student achievement and student motivation at the middle school
level. Chapter 3 presents the study‘s methodology including the research design,
participants, setting, instrumentation, procedures, and data analysis.

50
CHAPTER THREE: METHODOLOGY
NCLB (2002) requires that teachers increase student achievement so that all
students will perform at grade level by 2014. As a result, teachers are held to higher
standards than ever and are constantly searching for ways to improve student
achievement and motivation. Classrooms that implement active learning are much more
likely to produce students capable of reaching that standard (Florida State University
Office of Distance Learning, 2011; Michael, 2006). Classrooms that employ CPS-based
instruction along with PI could be beneficial for schools intent on achieving this goal.
Much research has been conducted in the past on CPS in education. However,
most of the available research in the literature consists of studies that have investigated
variables at the post secondary level in large-lecture classes or have frequently been
primarily qualitative in nature. There is a very narrow scope of quantitative research
regarding the effects of the implementation of technology such as CPS at the middle
school level (Lively, 2010; Manzo, 2009; Penuel et al., 2007; Sartori, 2008). Most
available research about CPS use in K–12 classrooms has focused on whether or not CPS
was used in instruction.
The researcher for this study attempted to identify the effects of the
implementation of CPS using PI on student math achievement and motivation in the
middle school classroom. Other researchers (Barnett, 2006; Caldwell, 2007; Fies &
Marshall, 2006; Preszler et al., 2006) have identified the need for additional research on
the use of CPS and its effects in the classroom using quantitative research methodologies.
Most available research about CPS did not focus on the pedagogy being used along with

51
the technology. Other research has failed to control variables and thus has failed to
determine whether or not the effects were a result of the technology itself or of the
instructional practices being used with the technology (Clark, 1983; Mayer et al, 2009).
The purpose of this research was to determine the impact of CPS-based math
instruction with a specific pedagogy, PI, on eighth grade student achievement and student
motivation. PI, as described more in detail in Chapter Two, was the independent variable
in the treatment group in this research endeavor. Student achievement and student
motivation were the dependent variables for both groups. The students received
instruction based on the GPS for that grade level and subject area. Both groups received
CPS-based math instruction. The instructional strategy, PI, was used in treatment group
classes only. A motivation survey, the IMMS, was administered at the end of the study
to all students to determine if there was a difference in student motivation between the
two groups.
This chapter describes the research methodology used in the quantitative study.
The chapter presents the research questions and null hypotheses, design, participants,
setting, instrumentation, procedures, and data analysis for the study.
Research Questions and Null Hypotheses
For this study, the researcher examined the impact of CPS using PI on eighth
grade math students‘ academic achievement scores and motivation in one rural middle
school in northeast Georgia. There were two questions that guided this research.
Research Question 1: Is there a difference in student achievement mean scores
between eighth grade students who receive Classroom Performance System (CPS)-based
math instruction with Peer Instruction (PI) as opposed to those who receive CPS-based

52
math instruction without PI, as measured by the expert-validated Unit 7 math posttest?
Null Hypothesis 1: There is no statistically significant difference in the mean
scores on the expert-validated Unit 7 math posttest between eighth grade students who
receive CPS-based math instruction with PI as opposed to those who receive CPS-based
math instruction without PI, when controlling for prior knowledge.
Research Question 2: Is there a difference in motivation mean scores between
eighth grade math students who receive Classroom Performance System (CPS)-based
math instruction with PI as opposed to those who receive CPS-based math instruction
without PI, as measured by the Instructional Materials Motivation Survey (IMMS)?
Null Hypothesis 2a: There is no statistically significant difference in the linear
combination of motivation subscale mean scores between eighth grade students who
receive CPS-based math instruction with PI and eighth grade students who receive CPS-
based math instruction without PI, as measured by the IMMS.
Null Hypothesis 2b: There is no statistically significant difference in the mean
scores of the attention subscale between eighth grade students who receive CPS-based
math instruction with PI and eighth grade students who receive CPS-based math
instruction without PI, as measured by the IMMS.
Null Hypothesis 2c: There is no statistically significant difference in the mean
scores of the relevance subscale between eighth grade students who receive CPS-based
math instruction with PI and eighth grade students who receive CPS-based math
instruction without PI, as measured by the IMMS.
Null Hypothesis 2d: There is no statistically significant difference in the mean
scores of the confidence subscale between eighth grade students who receive CPS-based

53
math instruction with PI and eighth grade students who receive CPS-based instruction
without PI, as measured by the IMMS.
Null Hypothesis 2e: There is no statistically significant difference in the mean
scores of the satisfaction subscale between eighth grade students who receive CPS-based
math instruction with PI and eighth grade students who receive CPS-based instruction
without PI, as measured by the IMMS.
Design
This quantitative research investigation utilized a quasi-experimental,
nonequivalent pretest-posttest only control group research design in order to determine if
there was a difference in student achievement and a static control group design for
student motivation between eighth grade students who received CPS-based math
instruction with PI and eighth grade students who received CPS-based math instruction
without PI. The researcher employed a quasi-experimental methodology since the groups
were already established before the study began (Ary, 2006). While the researcher was
not allowed to randomly assign the students for the study, the students were randomly
placed on teams prior to the beginning of the school year. Each team was assigned an
equivalent number of high, average, and low performing students. Efforts were made by
administration to ensure that the demographic makeup of each team was similar. Since
the control group and treatment group participants could not be randomly assigned to the
groups, a non-equivalent control-group design was chosen for this study (Borg & Gall,
1989). A flip of a coin determined which of the two teams would be the control group
and which would be the treatment group.

54
Originally, the pretest score was going to be used as the covariate. However,
once the pretest was administered and scored, it was evident that the students had limited
understanding of the standards to be taught as most students answered 0 or 1 out of 10
questions correctly. Because the point of a covariate is to account for initial differences
between groups and because all of the students in both groups did poorly on the pretest,
the researcher did not use the pretest data. To improve internal validity in the study, the
researcher ran an independent sample t-test on the mean pretest scores for both the
treatment group and the control group to determine if there was a significant difference
between the instruction groups. The pretest was not controlled for since there was no
significant difference between the two groups (t (166) = -1.849, p-0.066). Thus, the
posttest only design was determined to be the best choice (Gay & Airasian, 2003).
Instead, the researcher chose to use the ITBS as a covariate since the ITBS scores were
readily available to the researcher. The ITBS Mathematics Total standard scores proved
to be a significant predictor for the posttest. Creswell (2005) indicates that the ITBS is a
well-known norm-referenced achievement test used to measure and compare students‘
academic abilities.
Participants
This study used a convenience sample for participant selection. The participants
for this study included 168 eighth grade math students from one rural northeast Georgia
school. All of these students were selected based upon (a) enrollment in one of the
regular or cotaught math classes instructed by one of the two teachers willing to
participate in the study, (b) student willingness to participate in the study, and (c) receipt
of the student‘s signed parental consent form. Of the 168 student participants, 92

55
students were included in the treatment group and 76 students were included in the
control group and were analyzed for Research Question 1. However, only 152
participants completed the survey at the end of the study and were analyzed for Research
Question 2. The survey was completed by 83 students in the treatment group and by 69
students in the control group. Survey results were not obtained from 16 participants due
to technical difficulties during the administration of the online survey. It was impossible
for the teacher to tell which students‘ survey responses were not actually submitted. To
ensure that a student‘s responses were not counted twice, the teacher did not have any
students resubmit their responses.
Two eighth grade math teachers provided the intervention during the study. Each
teacher taught five classes per day. Each class consisted of approximately 28 potential
student participants.
Setting
The setting for this study was a public middle school located in a rural area of
northeast Georgia. According to the Georgia Department of Education (2010a, 2010b,
2010c), the school enrollment summary data indicated the school served 527 seventh and
eighth grade students at the time of the study. Approximately 67% of students were
eligible for free or reduced lunch. This Title 1 school served a diverse ethnic population.
Caucasian students accounted for 55.79% of the student population; Hispanic students
accounted for 33.21% of the student population; Asian students accounted for 3.99% of
the student population; African American students accounted for 3.80% of the population
multi-racial students accounted for 3.23% of the population. Out of this population of
students, 2% received English to Second or other Language (ESOL) services, almost 9%

56
received gifted services, and approximately 17% met Georgia eligibility requirements for
special education services. The students ranged in age from 12 to 15 years old. The
student body consisted of 51.66% of male students and 49.34% were female students.
The GPS developed by the Georgia Department of Education is the curriculum
that is followed in all classrooms at the school. The math teachers are required to follow
a standard-based class process. The teachers expressly align the standards from the
curriculum, the instruction, the assignments, the student feedback, and the assessment
(Georgia Department of Education, 2011b). Students from each group for all math
classes were supported with special education, ESOL, and remedial classes as appropriate
or needed.
Instrumentation
There were three separate instruments that were utilized during the data collection
phase of this study. The instruments were all designed to measure different aspects of
academic performance or motivation that comprised the research data. They included the
Unit 7 math posttest, the ITBS, and the IMMS.
Unit 7 math posttest. The Unit 7 math posttest was used to measure student
achievement (See Appendix A). The teacher-created, curriculum-based measurement
(CBM) focused on the content that the participating teachers presented during the unit
found to be reliable at the .91 level according to Cronbach‘s alpha. The GPS-based
questions for the Unit 7 math exam were taken from Study Island, an online bank of
questions specifically aligned and correlated to the GPS by professionals in the education
and consultant industry (Magnolia Consulting, 2008, 2011; Study Island, 2011).
Teacher-created tests have a long history of being utilized in educational research (Allen,

57
2005; Bangert, 2006; Crehan, 1974; Diederich, 1973; Frisbie, 1988; Griswold, 1990;
Hodge, 2010; King, 2010; Lai & Waltman, 2008; Martinez, Stecher, & Borko, 2009;
McMillan, 2005; Merwin, 1982; Moss, 2003; Muhundan, 2005; Parr, 2006; Popham,
2002; Ravid, 2006, 2009).
The two participating teachers administered the posttest to their students. The
participants were given the entire class period (60 minutes) to complete the expert-
validated, ten-question, multiple-choice test. Each correct answer was worth 10 points,
for a total of 100 possible points. For the purpose of this research and to expedite the
scoring of the instrument, no partial credit was given.
The Unit 7 math assessment was a teacher-made test, also referred to in this study
as an expert-validated test, that was validated by one assistant principal (who was also a
previous science and math teacher), one secondary curriculum director (who is also the
system‘s school improvement director), one high school math department teacher and
department head (who is also the gifted coordinator for the school system), two eighth
grade regular education math teachers, one eighth grade special education teacher, one
eighth grade ESOL teacher, one eighth grade gifted teacher, and two seventh grade
regular education math teachers (See Appendix B). All of the instrument reviewers are
experts in the fields of mathematics and education. These experts utilized their math
content area expertise, as well as knowledge of the GPS for eighth grade math
curriculum, to determine the face and content validity of each instrument. They
identified confusing words, unclear directions, and other problems that could negatively
impact the validity of the instrument. Along with their validation duties, these experts
were also asked to create a table of specifications for the ten questions on the test, which

58
were correlated to the eighth grade GPS for Unit 7 (See Appendix C). As recommended
by Williams (2009), an Educator Qualifications for Posttest Validation Chart is included
to help validate the expertise and experiences of the reviewers who helped confirm the
content validity of the teacher-made test (See Appendix D).
The expert-validated test is appropriate for the purposes of this particular research
study. A literature review of CPS research at the collegiate or professional level in the
medical field examined 67 current peer-reviewed articles with only four of those articles
including specific information about reliability and validity (Kay & LeSage, 2009). Out
of these four pieces of research, only one journal article included information about both
reliability and validity scores, while the other three journal articles listed validity
information only. In addition, none of the extremely limited number of dissertations
found regarding CPS in the K-12 setting included reliability and validity information for
the pretests and posttests.
Additional support for using the scores obtained from a CBM instrument rather
than a standardized test when researching technology in education comes from research
by Achacosco (2003) who states, ―Testing can include in-class exams or quizzes as well
as standardized testing. The advantage of this method of data collection is that exams are
a part of the educational system and scores are readily available‖ (p. 24).
ITBS. Scores from the 2010 administration of the ITBS (Form A, Level 13) were
utilized as a covariate to statistically adjust initial group differences in math achievement
as part of the ANCOVA. Salkind (2007) said that ANCOVA ―basically allows you to
equalize initial differences between groups‖ (p. 323).

59
The ITBS is comprised of 13 multiple choice achievement tests. However, for the
purposes of this research, only data from the overall Total Math score will be utilized.
The Total Math score is comprised of (a) math concepts and estimation, (b) math
problem-solving and data interpretation, and (c) math computation. ITBS scores were
readily available since the test is routinely given to all seventh grade students at the
research site each year. The ITBS is known to be a valid and reliable instrument for the
measurement of student math ability (Hoover et al., 2006). The reliability coefficient for
the ITBS Math Total, which is based on the Kuder-Richardson Formula, is .93 (Hoover et
al., 2006). The standard error of measurement score for the ITBS Math Total score is 7.4
(Hoover et al., 2006). This reliability coefficient indicates a satisfactory reliability
(Green & Salkind, 2008).
According to Dunbar et al. (2008), the ITBS yields the following types of scores:
raw score, percent correct, grade equivalent, developmental standard score, percentile
rank, stanine, and normal curve equivalent. Each of these scores has advantages and
disadvantages. For the purposes of this research, the researcher chose to utilize the
developmental standard scores obtained from the ITBS, which was administered to the
participants the previous year in the seventh grade. Dunbar et al. (2008) indicates that the
developmental standard score ―is a number that describes a student‘s location on an
achievement continuum‖ (p. 49). Dunbar et al. (2008) state, ―The main advantage of the
developmental standard score scale is that it mirrors reality better than the grade-
equivalent scale‖ (p. 49). The average range of developmental standards scores or
performance scores for seventh grade students for the ITBS is a score of 210 to 266, and
the median score for seventh grade students is a score of 239 (Dunbar et al. 2008).

60
IMMS. The IMMS was used to measure student motivation. The researcher
requested and received permission from the instrument‘s author to use and slightly
modify the IMMS to meet the needs of the research study at the middle school level (See
Appendices E and F). According to Keller (2010b), the author of the instrument, the
IMMS can be adapted to fit specific research needs in various situations. Keller indicates
that verb tenses can be changed, and that minor wording can be changed to fit the specific
situation being accessed. The survey was distributed to both the control and treatment
groups at the completion of the study to determine if there was a statistically significant
difference in motivation between the control and treatment groups.
The IMMS uses a Likert-type scale to gauge the responses of the participants.
For each of the subscales of the IMMS, the response scale ranges from 1 to 5, with a 1
response signifying not true, a 2 response signifying slightly true, a 3 response signifying
moderately true, a 4 response signifying mostly true, and a 5 response signifying very
true. There are 36 individual items requiring response, and each of these items falls into
one of four categories, which measure the motivational effect of the instructional
materials. Those four categories are: attention (12 items), relevance (nine items),
confidence (nine items), and satisfaction (six items). There is also a total scale score
(Keller, 2010b).
The IMMS can be scored in a couple of different ways. Since the response scale
ranges from 1 to 5 and the number of questions per subscale varies, the minimum score
on the IMMS survey is 36, and the maximum score is 180 (Keller, 2010b). However, for
the purposes of this study, the IMMS was scored using an average score on each of the
four subscales rather than the sum score so that the four subscale scores could easily be

61
compared. Keller (2010b) recommends this method as being an ―alternate and preferable
scoring method‖ (p. 282). This scoring method converts the totals for each subscale of
the IMMS into an average score ranging from 1 to 5 and makes it easier to compare
participant responses on each of the subscales (Keller, 2010b). The items written in a
negative format have reversed scoring (Keller, 2010b). Regardless of which way the
IMMS is scored, according to Keller (2010b), ―One cannot designate a given score as
high or low because there are no norms for the survey. Scores obtained at one point in
time, as in a pretest, can be compared with subsequent scores or with the scores obtained
by people in a comparison group‖ (p. 283-284). In addition, since the IMMS is a
―situation-specific measure, there is no expectation of a normal distribution of responses‖
(Keller, 2010b, p. 284). However, the researcher assumes the higher the average for each
subscale, the higher the motivation is for each of the subscales for the control group and
the treatment group.
The IMMS has been used in prior research in a wide variety of publications and
dissertations regarding varying aspects of technology integration (Carson, 2006; Chan
2009; Chen, 2011; Cheng & Yeh, 2009; Cook et al., 2009; Door, 2006; Gabrielle, 2003;
Huang et al., 2004; Huett et al., 2008; Jaemu et al., 2008; Jones, 2009; Jumanwan, 2011;
Kim & Keller, 2008; Liao & Wang, 2008; Small, 2006; Yang et al., 2009). It has been
widely used partly because of its excellent reliability and validity numbers. Prior
reliability testing of the IMMS instrument using the Cronbach's alpha measure indicated
that each of the five components (attention, relevance, confidence, satisfaction, and the
total scale score) had a satisfactory reliability coefficient of .81 or higher (Keller, 2010b).
Individual Cronbach‘s alpha scores are as follows: attention = .89, relevance = .81,

62
confidence = .90, satisfaction = .92, and total scale = .96 (Keller, 2010b). Prior validity
was established for the IMMS (Keller, 2010b) by various studies (Cook et al., 2009;
Gabrielle, 2003; Huang, Huang, Diefes-Dux, & Imbrie, 2006; Pittenger & Doering,
2010). For the present study, the Cronbach‘s alpha for attention, relevance, confidence,
and satisfaction was .86, .89, .91, and .86 respectively. The overall Cronbach‘s alpha
score was .91.
Procedures
Permissions. Permission was obtained from the superintendent of the school
system and the principal of the school to perform the research study (See Appendices G
and H). An application to the Institutional Review Board (IRB) of Liberty University
was submitted and approved for the research study (See Appendix I). No intervention
was conducted with students and no data were collected prior to approval from the IRB.
Permission for participation in the study was requested and obtained from teachers and
parents of all the student participants (See Appendices J and K). The researcher informed
and discussed consent with the participating teachers of the research at the beginning of
the project. The teachers of each group discussed the information concerning the
research and the consent forms with each of the student participants at the beginning of
the project. No one was considered a participant and no data for or about any individual
were utilized in this research without prior written consent from the participant and the
parent. All teachers and participants were made aware that they had the option to opt out
of the research at any time. Students were reassured by their teacher that participation
and responses gathered during this research were not related in any way to them as
individuals, the teacher‘s class as a whole, or their individual course grades, but all
63
collected data would be used to look at student achievement and student motivation.
Student participant information and consent forms for the research were provided in
English and Spanish (See Appendices K, L, M, and N).
Security and precautions. After receiving written approval from the IRB and
appropriate school personnel, the researcher executed the research plan. A list of all
eighth grade students at the research site was requested and received from the school
principal. Once this list was obtained, privacy, anonymity, confidentiality, and safety of
the research participants were achieved through the immediate placement of pseudo
labels upon participants, schools, and classrooms. Each of the potential student
participant names and teacher participant names was immediately given a distinctive
arbitrary number by the researcher to preserve confidentiality and the identity of all
participants. Data were not collected nor included for students who did not return a
signed parental consent to participate in the research or for whom no 2010 ITBS data
were available.
As a teacher and department head at the research site, the researcher had been
given prior password-protected access from the school principal to the school‘s online
data storage system, Powerschool, which then allowed the researcher to gather
demographic information for all student participants. The researcher requested and
received access from the school principal to obtain ITBS scores for the participants,
located in each participant‘s permanent school record which is kept in the school‘s locked
vault. When not being used by the researcher, all data obtained through the research
were kept locked in a personal filing cabinet located at the home of the researcher. The
key to the filing cabinet was kept in a secure location away from the filing cabinet. All

64
data obtained for the research will be kept for three years and will be destroyed after that
time.
The researcher requested and received password-protected access from the school
system‘s technology director to use their online Survey Monkey account in order to
develop and create a link to the online student motivation survey that was given to obtain
student participants at the end of the unit of math instruction. The account was used to
obtain student motivation data about CPS-based math instruction with and without the
use of PI.
Pretest administration. Prior to treatment, the teacher of both the treatment and
control groups administered the same expert-validated pretest, which covered content
from Unit 7: Systems of Equations and Inequalities (as recommended by the Georgia
Department of Education). To ensure consistency in grading the pretest, the students
recorded their answers on a Scantron sheet, which was read and scored electronically.
The teacher of both groups examined the Scantron sheets to account for any possible
grading errors due to poor erasures. Upon receipt of the pretest results from the teachers
of both groups, the researcher made the decision to not use that data because most
students received a score of 0 through 20 on the pretest. This was problematic because
the results may have resulted in bias in the interpretation of the results of the data by
indicating greater gains or a more significant difference in achievement from the pretest
to the posttest than what actually had been made. Thus, the researcher did not use pretest
data and instead used the 2010 ITBS data as a covariate.
Training and support. The researcher provided a set of the same brand and
model of infrared CPS response systems to each teacher participating in the research.

65
The researcher downloaded the appropriate version of eInstruction‘s CPS software to
each of the teacher‘s computer in the classroom and made certain that the technology
worked in conjunction with the computer and Smartboard in each teacher‘s classroom.
Prior to treatment, the researcher provided CPS technology training to both teachers at
the same time. The researcher also provided PI training to the teacher of the treatment
group only. Ongoing technical support for CPS or answers to questions related to PI
were provided as needed throughout treatment.
Treatment/intervention. Research was conducted that allowed the researcher to
monitor student achievement while implementing CPS-based math instructed using PI.
However, to reduce possible bias, the researcher was not directly involved in the research
process.
Both the treatment group and the control group received the same instruction from
each teacher based upon the state curriculum map for the eighth grade GPS for math for
Unit 7: Systems of Equations and Inequalities (as suggested by the Georgia Department
of Education), which was taught over an approximately four-week period. As required
by the local school system and to ensure consistency in what was taught and how it was
taught and assessed, the participating math teachers planned collaboratively at least one
time per week throughout the research. During their meetings, they developed and
revised a common instructional framework for this unit based upon the state
recommended curriculum map and framework suggested by the Georgia Department of
Education for the GPS for eighth grade math. For the past three years, the teachers who
implemented the research have planned together three to four times per week during a
common planning time. Frequent teacher collaboration with each other and the

66
researcher before, during, and after the treatment ensured that both teachers were
teaching the same content related to the GPS math standards for Unit 7 as closely as
possible at the same time and in the same manner. Teachers for both groups assigned the
same math practice problems during class and for homework. In addition, frequent
collaboration allowed teachers to develop the Unit 7 expert-validated test used in this
study.
The math instruction for both groups included CPS use; however, the PI
instructional strategy, was only utilized in the treatment group. All students received
formative feedback on a daily basis through the use of histograms and instant feedback
from the use of CPS. In addition, students in both groups received feedback with
traditional methods such as verbal and written commentary and grades on assignments
and tests. Summative feedback was given at the end of the unit on the paper and pencil
Unit 7 posttest. Teachers implemented CPS use for the duration of a four-week unit of
study in both the control and treatment groups. Teachers in both groups used CPS two-
three times per week during instruction, using at least five questions each time they used
CPS.
Teachers collaboratively selected math questions from Study Island (2011) based
upon the GPS and used these same CPS questions based upon the content to be taught
each day during instruction. To ensure that the teachers used the same questions at the
same time for instruction, these questions were uploaded to Study Island as customized
assessments rather than allowing random math questions to pop up on the screen. For
example, the purposefully chosen sets of questions were labeled for easy access by both
teachers as Week 1 Lesson 1, Week 1 Lesson 2, Week 2 Lesson 1, Week 2 Lesson 2, etc.

67
Teachers were then able to use data obtained from the CPS questions in order to guide,
drive, and change instruction during the implementation phase. The teacher of the
treatment group implemented PI for the duration of the four-week unit of study.
Concerns and issues that arose during the research were addressed with the teacher
participants by the researcher during a common planning time during or after the school
day.
CPS-based math instruction with PI was implemented with the treatment group as
follows:
1. The teacher posed a math question related to the GPS for Unit 7 content using the web-
based, standards-based program called Study Island and posed/projected the question
on a Smartboard.
2. The students used a remote control and cast their vote and gave their answer to the
question.
3. Students were encouraged to use and to engage in the PI strategy and discuss their
answers with their classmates seated close to them. Students explained their answers
and rationales for their answers to their peers. Students had the option to change their
votes before the answer was revealed.
4. The teacher revealed the correct answer by displaying it on the Smartboard.
5. Using the CPS technology, the teacher posted a histogram, so that the teacher and the
students received immediate feedback to see how their answers compared to the class
results for that particular math question.
6. The teacher lead a class-wide discussion about why one answer was correct as well as
why the other answers were not correct.

68
7. Based upon the results shown on the histogram and information gathered from the
class-wide discussion, the teacher adjusted the instruction as necessary. This process
was repeated until the teacher was finished asking questions. Thus, the teacher was to
use data obtained from CPS questions to guide, drive, and adjust instruction based
upon real-time data.
Similarly, CPS-based math instruction was implemented with the control group.
The only difference was step 3, the PI strategy, was omitted.
Unit 7 posttest administration. After the treatment, the teacher of both groups
administered the expert-validated posttest over Unit 7: Systems of Equations and
Inequalities (as proposed by the Georgia Department of Education). To ensure
consistency in grading on the posttest, the students recorded their answers on a Scantron
sheet, which was read and scored electronically. The teacher of both groups examined
the Scantron sheets to account for any possible grading errors due to poor erasures. The
teacher of each group provided the scores to the researcher.
IMMS administration. At the end of Unit 7, the IMMS was administered online
via Survey Monkey to participants in both groups in a safe, nonthreatening environment
in their math classrooms. As discussed earlier, survey results were not obtained from 16
participants due to technical difficulties during the administration of the survey. It was
impossible for the teacher to tell which students‘ survey responses were not actually
submitted. To ensure that a student‘s responses were not counted twice, the teacher did
not have any students resubmit their responses.
Surveys completed by the participants did not contain any individual names or
other identifying data and survey results were kept anonymous. Creswell (2005)

69
indicated that the use of ―electronic data collection in quantitative research is popular‖ (p.
159) and ―provides an easy, quick form of data collection‖ (p. 159). The researcher
believed that using the anonymity of an online survey format helped prevent
apprehension by the participants and may have encouraged honesty (Ary, Jacobs,
Razavieh, & Sorensen, 2006; Whelan, 2008). A paper version of the survey was
available to anyone who chose to complete this type of survey rather than the online
version. Care was taken by the teachers to make certain that students knew this was a
research project specifically relating to CPS use and that their participation and responses
were not detrimental to them in any way. To reduce possible bias, the researcher did not
have access to the students during the survey. A copy of the online survey was included
for review by the Liberty University Institutional Review Board (See Appendix O).
Data Analysis
This study investigated the effect of CPS-based math instruction with or without
PI on the achievement and motivation of eighth grade students. Parametric tests utilized
are discussed in this section.
Analysis of student achievement data. An analysis of covariance (ANCOVA)
was conducted to see if there was a difference in the Unit 7 mean posttest scores of
students who received CPS with PI and students who received CPS without PI. In order
for the results of the ANCOVA to be utilized and the results considered generalized to
the population of interests, several assumptions were verified using appropriate statistical
analyses: reliability of the covariate, linearity, homogeneity of regression, normality, and
homogeneity of variance. An ANCOVA has the ability to determine if the means
between the control group and the treatment group are statistically different while
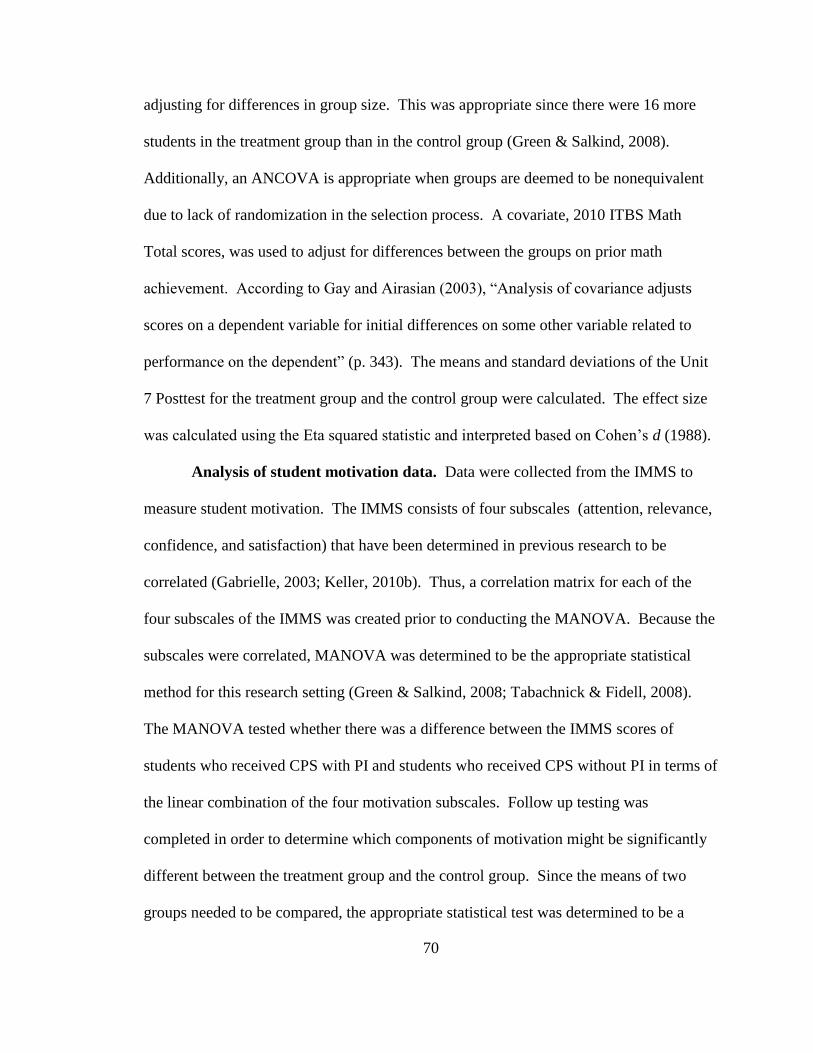
70
adjusting for differences in group size. This was appropriate since there were 16 more
students in the treatment group than in the control group (Green & Salkind, 2008).
Additionally, an ANCOVA is appropriate when groups are deemed to be nonequivalent
due to lack of randomization in the selection process. A covariate, 2010 ITBS Math
Total scores, was used to adjust for differences between the groups on prior math
achievement. According to Gay and Airasian (2003), ―Analysis of covariance adjusts
scores on a dependent variable for initial differences on some other variable related to
performance on the dependent‖ (p. 343). The means and standard deviations of the Unit
7 Posttest for the treatment group and the control group were calculated. The effect size
was calculated using the Eta squared statistic and interpreted based on Cohen‘s d (1988).
Analysis of student motivation data. Data were collected from the IMMS to
measure student motivation. The IMMS consists of four subscales (attention, relevance,
confidence, and satisfaction) that have been determined in previous research to be
correlated (Gabrielle, 2003; Keller, 2010b). Thus, a correlation matrix for each of the
four subscales of the IMMS was created prior to conducting the MANOVA. Because the
subscales were correlated, MANOVA was determined to be the appropriate statistical
method for this research setting (Green & Salkind, 2008; Tabachnick & Fidell, 2008).
The MANOVA tested whether there was a difference between the IMMS scores of
students who received CPS with PI and students who received CPS without PI in terms of
the linear combination of the four motivation subscales. Follow up testing was
completed in order to determine which components of motivation might be significantly
different between the treatment group and the control group. Since the means of two
groups needed to be compared, the appropriate statistical test was determined to be a

71
series of independent sample t-tests (Green & Salkind, 2008; Indiana University, 2006).
In order for the results of the t-tests to be utilized and generalized to the population of
interests, several assumptions were verified using appropriate statistical analyses:
multivariate normality, independence of units, homogeneity of variance matrices,
linearity, singularity, and multicollinearity. Independent sample t-tests were then
conducted to determine if the differences in the mean scores on each of the IMMS
subscales for the two groups were significant or if the differences were due to sampling
error.
Summary
This research was conducted in a public eighth grade middle school in rural
northeast Georgia during one four-week unit of math study. During the course of this
math unit, students in both the treatment group and the control group received CPS-based
math instruction. However, only the treatment group received PI in addition to the CPS-
based math instruction. At the end of the unit, student posttest scores were collected and
analyzed using an ANCOVA. Additionally, at the end of the treatment all students
completed a validated online survey, the IMMS, in order to measure motivation in
regards to CPS-based instruction with and without PI. The IMMS scores were analyzed
using a MANOVA and multiple independent sample t-tests. The results of the study are
presented in the following chapter.

72
CHAPTER FOUR: RESULTS
The purpose of this study was to determine the impact of a PI strategy, supported
by CPS technology use, on the academic achievement and motivation of eighth grade
math students in a middle school in northeast Georgia. In the first part of the study, the
researcher collected and analyzed posttest data for each of the participants in order to
determine the impact on student achievement. In the second part of the study, the
researcher collected and analyzed data from a survey instrument, the IMMS, in order to
determine the impact on student motivation.
Chapter 4 is organized into four sections: (a) demographic information for the
participants, (b) data analysis and results of an ANCOVA that measured the impact of
CPS-based math instruction with and without PI on student, (c) data analysis and results
of a MANOVA and independent t-tests that measured the impact of CPS-based math
instruction with and without PI on student motivation, and (d) a summary of the results.
Demographics
The participants for this study included 168 eighth grade students from one rural
northeast Georgia school. All of these students were selected based upon the following
criteria: (a) enrollment in one of the regular or cotaught math classes instructed by one of
the two teachers willing to participate in the study, (b) student willingness to participate
in the study, and (c) receipt of the student‘s signed parental consent form. Of the 168
student participants, 92 were included in the treatment group and 76 students were
included in the control group. Since not all students completed the IMMS survey,
demographic information for each question is presented separately.

73
Research Question 1 asked: Is there a difference in student achievement mean
scores between eighth grade students who receive CPS-based math instruction with PI as
opposed to those who receive CPS-based math instruction without PI, as measured by the
expert-validated Unit 7 math posttest?
A total of 168 students were administered the Unit 7 posttest. Tables 2 and 3
present the demographic information for these students by instructional group.
Table 2
Posttest: Ethnicity of Students by Instructional Group
Treatment Group Control Group Total
Ethnicity n % n % N %
African
American 2 2.10
10 13.16 12 7.14
Asian 5 5.43 4 5.26 9 5.36
Caucasian 40 43.48 29 38.67 69 41.07
Hispanic 39 42.39 29 38.67 68 40.48
Indian 0 0.00 1 1.32 1 0.60
Other 6 6.52 3 3.95 9 5.36
Total 92 100.00 76 100.00 168 100.00
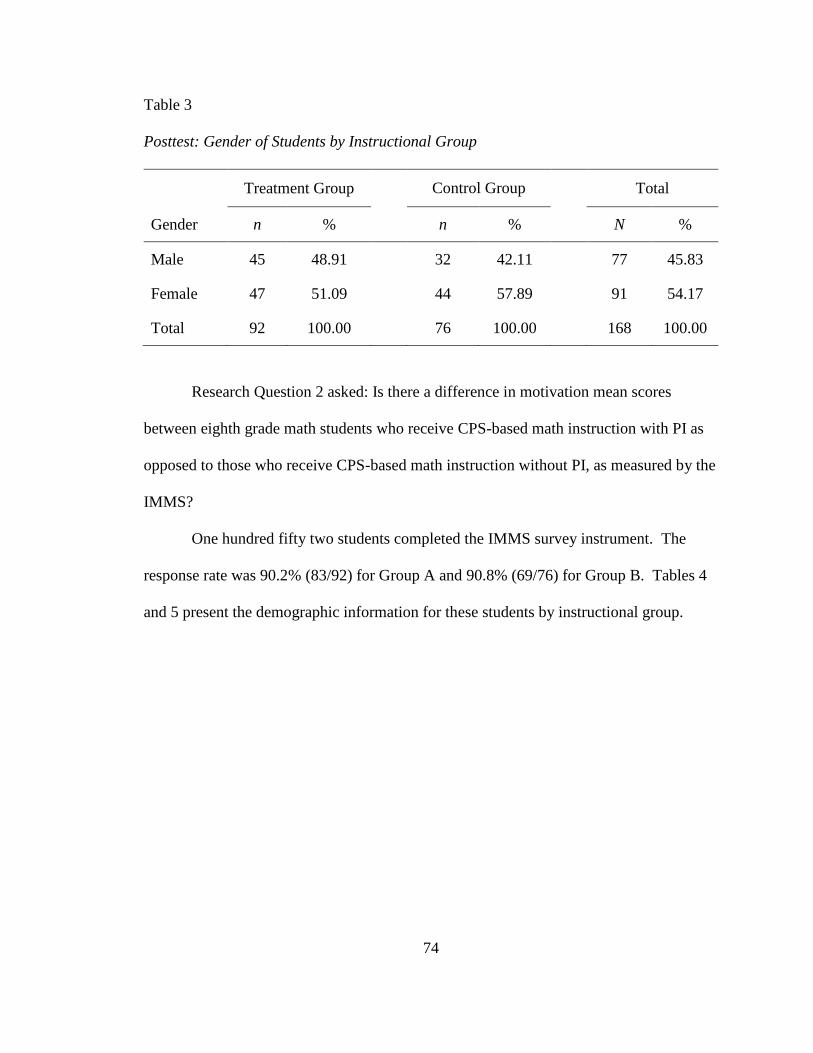
74
Table 3
Posttest: Gender of Students by Instructional Group
Treatment Group Control Group Total
Gender n % n % N %
Male 45 48.91 32 42.11 77 45.83
Female 47 51.09 44 57.89 91 54.17
Total 92 100.00 76 100.00 168 100.00
Research Question 2 asked: Is there a difference in motivation mean scores
between eighth grade math students who receive CPS-based math instruction with PI as
opposed to those who receive CPS-based math instruction without PI, as measured by the
IMMS?
One hundred fifty two students completed the IMMS survey instrument. The
response rate was 90.2% (83/92) for Group A and 90.8% (69/76) for Group B. Tables 4
and 5 present the demographic information for these students by instructional group.

75
Table 4
IMMS Survey: Ethnicity of Students by Instructional Group
Treatment Group Control Group Total
Ethnicity n % n % N %
African
American 2 2.40
7 10.10
9 5.92
Asian 4 4.80 3 4.30 7 4.61
Caucasian 33 39.80 28 40.60 61 40.13
Hispanic 38 45.80 27 39.10 65 42.76
Indian 0 0.00 1 1.40 1 0.66
Other 6 7.20 3 4.30 9 5.92
Total 83 100.00 69 100.00 152 100.00
Table 5
IMMS Survey: Gender of Students by Instructional Group
Treatment Group Control Group Total
Gender n % n % N %
Male 40 48.20
30 43.50
70 46.05
Female 43 51.80
39 56.50
82 53.95
Total 83 100.00
69 100.00
152 100.00
Research Questions and Hypotheses
For this study, the researcher examined the impact of PI using CPS on eighth
grade math students‘ academic achievement scores and student motivation in one rural
middle school in northeast Georgia. There were two questions that guided this research.

76
Research Question 1: Is there a difference in student achievement mean scores
between eighth grade students who receive Classroom Performance System (CPS)-based
math instruction with Peer Instruction (PI) as opposed to those who receive CPS-based
math instruction without PI, as measured by the expert-validated Unit 7 math posttest?
Null Hypothesis 1: There is no statistically significant difference in the mean
scores on the expert-validated Unit 7 math posttest between eighth grade students who
receive CPS-based math instruction with PI as opposed to those who receive CPS-based
math instruction without PI, when controlling for prior knowledge.
Research Question 2: Is there a difference in motivation mean scores between
eighth grade math students who receive Classroom Performance System (CPS)-based
math instruction with Peer Instruction (PI) as opposed to those who receive CPS-based
math instruction without PI, as measured by the Instructional Materials Motivation
Survey (IMMS)?
Null Hypothesis 2a: There is no statistically significant difference in the linear
combination of motivation subscale mean scores between eighth grade students who
receive CPS-based math instruction with PI and eighth grade students who receive CPS-
based math instruction without PI, as measured by the IMMS.
Null Hypothesis 2b: There is no statistically significant difference in the mean
scores of the attention subscale between eighth grade students who receive CPS-based
math instruction with PI and eighth grade students who receive CPS-based math
instruction without PI, as measured by the IMMS.
Null Hypothesis 2c: There is no statistically significant difference in the mean
scores of the relevance subscale between eighth grade students who receive CPS-based

77
math instruction with PI and eighth grade students who receive CPS-based math
instruction without PI, as measured by the IMMS.
Null Hypothesis 2d: There is no statistically significant difference in the mean
scores of the confidence subscale between eighth grade students who receive CPS-based
math instruction with PI and eighth grade students who receive CPS-based instruction
without PI, as measured by the IMMS.
Null Hypothesis 2e: There is no statistically significant difference in the mean
scores of the satisfaction subscale between eighth grade students who receive CPS-based
math instruction with PI and eighth grade students who receive CPS-based instruction
without PI, as measured by the IMMS.
Data Analysis and Results: Student Achievement
ANCOVA. A one-way ANCOVA was conducted using SPSS to determine if
there was a significant difference in scores on the end-of-unit test between eighth grade
students who received CPS-based math instruction with PI and those who received CPS-
based math instruction without PI. The PI strategy served as the independent variable
and included two levels: eighth grade students who received CPS-based math instruction
with PI and those who received CPS-based math instruction without PI. The dependent
variable was student achievement as measured by individual scores on an expert-
validated Unit 7 test. The 2010 ITBS Total Mathematic scores for each student served as
the covariate.
Assumptions. Preliminary analyses were conducted to evaluate assumptions for
the ANCOVA. Those assumptions include: (a) reliability of covariate, (b) linearity, (c)
homogeneity of regression, (d) normality, and (e) homogeneity of variance.
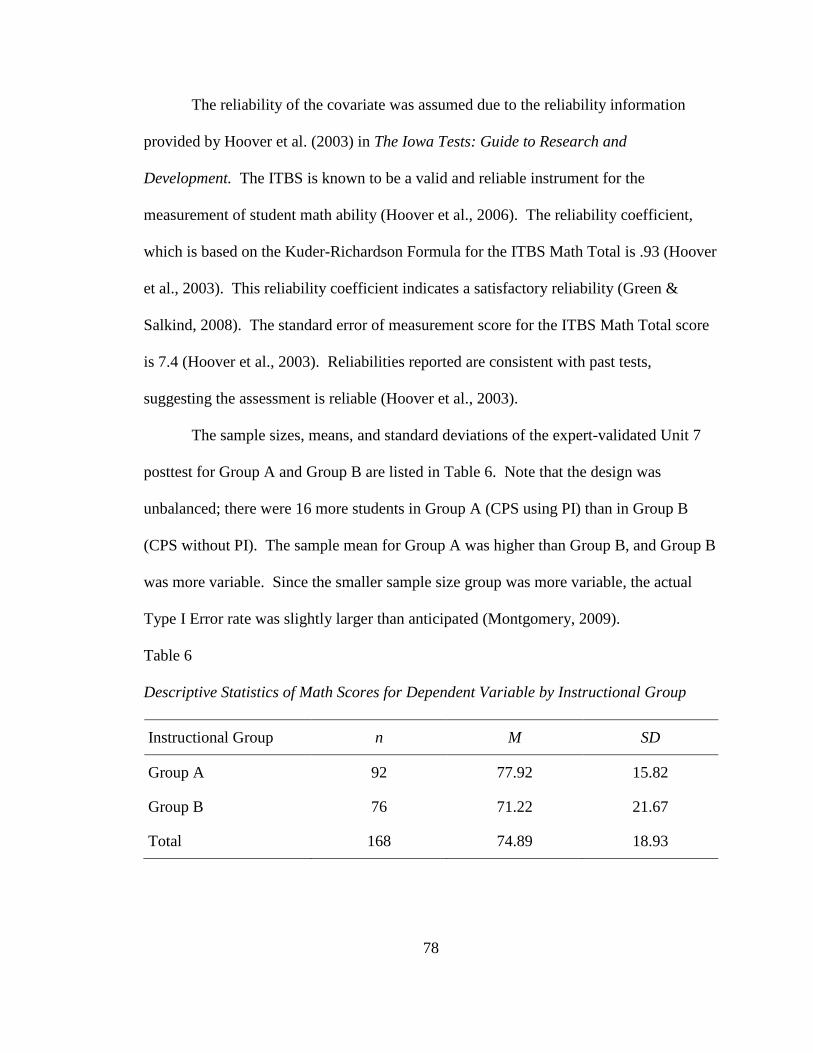
78
The reliability of the covariate was assumed due to the reliability information
provided by Hoover et al. (2003) in The Iowa Tests: Guide to Research and
Development. The ITBS is known to be a valid and reliable instrument for the
measurement of student math ability (Hoover et al., 2006). The reliability coefficient,
which is based on the Kuder-Richardson Formula for the ITBS Math Total is .93 (Hoover
et al., 2003). This reliability coefficient indicates a satisfactory reliability (Green &
Salkind, 2008). The standard error of measurement score for the ITBS Math Total score
is 7.4 (Hoover et al., 2003). Reliabilities reported are consistent with past tests,
suggesting the assessment is reliable (Hoover et al., 2003).
The sample sizes, means, and standard deviations of the expert-validated Unit 7
posttest for Group A and Group B are listed in Table 6. Note that the design was
unbalanced; there were 16 more students in Group A (CPS using PI) than in Group B
(CPS without PI). The sample mean for Group A was higher than Group B, and Group B
was more variable. Since the smaller sample size group was more variable, the actual
Type I Error rate was slightly larger than anticipated (Montgomery, 2009).
Table 6
Descriptive Statistics of Math Scores for Dependent Variable by Instructional Group
Instructional Group n M SD
Group A 92 77.92 15.82
Group B 76 71.22 21.67
Total 168 74.89 18.93

79
The ANCOVA was performed using SPSS. There must be a linear relationship
between the covariate (ITBS Mathematics Total score) and the response (posttest) in
order for the results to be generalized to the target population. The linearity relationship
can be seen in Figure 1 by examining the scatterplot of Posttest vs. ITBS Math Total.
Also, the Pearson correlation coefficient, r, of 0.34, p < .05 indicates a somewhat weak
linear relationship between posttest and ITBS Mathematics Total score.
Figure 1. Posttest versus ITBS mathematics total scores.
The regression slopes must be equal for each treatment group (Green & Salkind,
2008; Montgomery, 2009). The assumption of homogeneity of regression slopes was

80
tested by including the interaction term in the general linear model. The interaction of
instruction and ITBS Mathematics Total score yielded F(3,164) =1.60, p = .207, and 2
=
0.01. This data indicated that the interaction of instruction and ITBS Mathematics Total
scores was not statistically significant at the α = 0.05 level. The observed power is .24.
Also, because the estimated effect size was only .01, it can be safely assumed that the
interaction had very little effect on the response variable. Therefore, the homogeneity of
regression slopes assumption was met. Green and Salkind (2008) indicate that the effect
size index for ANCOVA is not strictly defined; however, the conventional upper limits
are .01 for small effect size, .06 for medium effect size, and .14 for large effect size.
Muijs (2011) said:
Eta squared varies between 0 and 1, and is interpreted in the usual way; that is,
0–0.1 is a weak effect, 0.1–0.3 is a modest effect, 0.3–0.5 is a moderate effect,
and > 0.5 is a strong effect (remember, though, that these cut-off points are just
guidelines)‖ (p. 183).
Multiple tests were conducted to determine if the assumption of normality was
met. Table 7 provides the tests of normality for the residuals for the posttest. This table
indicates that there is statistically significant evidence at the 5% significance level that
the residuals are not normally distributed. The appearance of a moderate departure from
normality does not necessarily imply a serious violation of the assumptions.
Montgomery (2009) states, ―Because the F test is only slightly affected, we say that the
analysis of variance is robust to the normality assumption‖ (p. 77). The model requires
independent observations. Since the posttest is a test with attention given to proctoring
and proper scoring, it is safe to assume that scores are independent.

81
Table 7
Tests of Normality for the Posttest
Kolmogorov-Smirnov
a Shapiro-Wilk
Statistic df p Statistic df p
Residual for Posttest .08 168 .010 .98 168 .007
aLilliefors Significance Correction.
In addition, the data must also meet the assumption of homogeneity of variance,
meaning that the distribution of the dependent variable for one of the groups being
compared must have constant variance across factor levels. Levene‘s Test of Equality of
Error Variances shows statistical evidence of the homogeneity of variances. Results
indicated that F(1,166) = 6.38, p = .013; therefore, equal variances cannot be assumed.
This test of significance indicates there is sufficient statistical evidence that the error
variances are unequal. Variance-stabilizing transformations were performed to correct
the inconstant error variances (Montgomery, 2009). The square root, log, reciprocal
square root, and reciprocal transformations were applied with no improvement in the
equality of variance (Montgomery, 2009). This increases the chance of a Type I Error,
thus a significant difference between groups may be found when there is not a
statistically significant difference in reality (Green & Salkind, 2008).
The scatterplot matrix in Figure 2 shows that the variances of the residuals versus
predicted values are not equal. For example, observe how the residuals for posttest
versus predicted posttest in Figure 2 are more condensed vertically for Group B (CPS
without PI) than Group A (PI with CPS).

82
Figure 2. Residuals versus predicted values by instruction.
ANCOVA results. Tables 6 and 7 and plots in Figures 1 and 2 indicate that the
modeling requirements of ANCOVA have been met. The general linear model was
analyzed with only the main effects, instruction and ITBS Mathematics Total score,
without the interaction term. The covariate ITBS Mathematics Total proved to be a
significant predictor for the posttest with F(1,165) = 24.46, p < 0.001, 2
= 0.13. This
indicates that the inclusion of the ITBS Mathematics Total score explained 12.9% of the
variation in posttest scores. The experimental factor of instruction is also a significant
predictor for posttest with F(2, 165) = 7.6, p = .007, 2
= 0.044. This result indicates that
instruction, which utilized PI with CPS, produced a statistically significant difference in
posttest scores. However, only 4.4% of the variation in posttest scores is explained by
instruction. This observed power is an example of post-hoc power, which has its
limitations. The observed power of 0.78 indicates that if the parameters are as expected,
the researcher would reject the null hypothesis 78% of the time when this experiment is
conducted.

83
The parameter estimates for the ITBS Mathematics Total for the instruction for
Group A is 7.49, with a 95% confidence interval (2.12, 12.85). This indicates that, on
average, a student in Group A scored 7.49 points higher on the expert-validated Unit 7
posttest than a student in Group B when accounting for the influence of ITBS
Mathematics Total scores.
Table 8 displays the adjusted means for posttest scores when using the ITBS
Mathematics Total score of 223.10 to evaluate the model. From this perspective, it is
easier to see the difference in means for each instructional group. There is a 7.6 point
difference in adjusted means, which shows a greater disparity than the 6.7 point
difference in actual mean posttest scores between classes.
Table 8
Adjusted Means and 95% Confidence Intervals for Unit 7 Math Posttest Scores
Instructional Group M
95% CI
SE LL UL
Group A 78.28 1.83 74.68 81.88
Group B 70.79 2.01 66.83 74.76
Note. CI = confidence interval; LL = lower limit; UL = upper limit.
After interpreting the results of the ANCOVA, the null hypothesis of no
difference in the mean math posttest scores between instructional groups was rejected
based upon statistically significant results.
Data Analysis and Results: Student Motivation
MANOVA. The purpose of this analysis was to determine the effect of the type
of instruction (CPS with the use of PI and CPS without using PI) on student motivation,

84
as measured by four response subscales: attention, relevance, confidence, and
satisfaction. A MANOVA is a multivariate procedure that simultaneously examines the
group differences between correlated dependent variables. Since the four subscales of
the IMMS are known to be correlated in previous research (Gabrielle, 2003; Keller,
2010b), a correlation matrix for each of the four subscales of the IMMS was created prior
to conducting the MANOVA. Since the data were multivariate and univariate normal
and the covariance matrices were equal, a MANOVA was appropriate (Muijs, 2011).
The Pearson Correlation Matrix is depicted in Table 9.
Table 9
Pearson‘s Correlation Matrix for IMMS
Variable Attention Relevance Confidence Satisfaction
Attention – .76* .69* .84*
Relevance – – .56* .81*
Confidence – – – .68*
Note. *p < .05.
The correlation matrix indicated that all correlations for each of the four subscales
of the IMMS were significant at the 0.01 level indicating that a MANOVA was an
appropriate test to use (Green & Salkind, 2008; Huberty & Olejnik, 2006; Tabachnick &
Fidell, 2007).
The pooled means and standard deviations for the four subscales of the IMMS
(attention, relevance, confidence, and satisfaction) were M = 3.00 (SD = .77), M = 3.20
(SD = .73), M = 3.18 (SD = .81), and M = 3.01 (SD = 1.00), respectively.
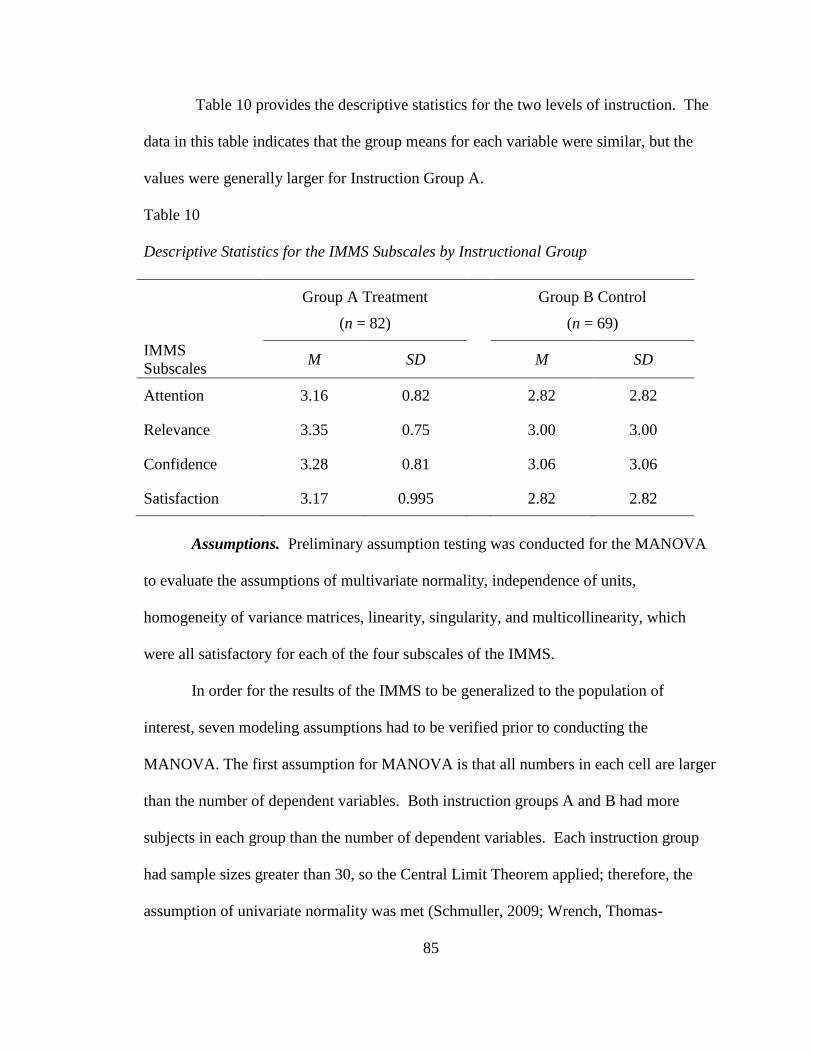
85
Table 10 provides the descriptive statistics for the two levels of instruction. The
data in this table indicates that the group means for each variable were similar, but the
values were generally larger for Instruction Group A.
Table 10
Descriptive Statistics for the IMMS Subscales by Instructional Group
Group A Treatment
(n = 82)
Group B Control
(n = 69)
IMMS
Subscales M SD M SD
Attention 3.16 0.82 2.82 2.82
Relevance 3.35 0.75 3.00 3.00
Confidence 3.28 0.81 3.06 3.06
Satisfaction 3.17 0.995 2.82 2.82
Assumptions. Preliminary assumption testing was conducted for the MANOVA
to evaluate the assumptions of multivariate normality, independence of units,
homogeneity of variance matrices, linearity, singularity, and multicollinearity, which
were all satisfactory for each of the four subscales of the IMMS.
In order for the results of the IMMS to be generalized to the population of
interest, seven modeling assumptions had to be verified prior to conducting the
MANOVA. The first assumption for MANOVA is that all numbers in each cell are larger
than the number of dependent variables. Both instruction groups A and B had more
subjects in each group than the number of dependent variables. Each instruction group
had sample sizes greater than 30, so the Central Limit Theorem applied; therefore, the
assumption of univariate normality was met (Schmuller, 2009; Wrench, Thomas-

86
Maddox, Richmond, & McCroskey, 2008). Equivalent group sizes are best, but not vital.
Learning Domain (2011) states, ―Generally, if the cell size [group size] is greater than 30,
assumptions of normality and equal variances are of less concern‖ (para. 1).
The second assumption for MANOVA is independence of units. The researcher
attempted to ensure that the assumption of independence was met by providing training
on how to proctor the IMMS survey to the teachers in charge of each instruction group.
Classroom control and a quiet environment were maintained during the administration of
the online survey in all classes. The teacher in charge of each group circulated among the
students as they completed the survey and provided uniform directions. Within the class
and across classes, students did not talk or discuss the survey questions while taking the
survey. Thus, the researcher assumed that each participant‘s scores on the IMMS
variables were independent from scores of all the other participants.
The third assumption for MANOVA is linearity. There should be a linear
relationship between any two dependent variables. Review of the matrix of scatterplots
revealed that this assumption was met since each group had equitable, balanced
distributions (Tabachnich & Fidell, 2008). See Figure 3 to view the linear relationship
between each pair of outcomes.

87
Figure 3. Linear relationship of the IMMS subscales.
The fourth and fifth assumptions are singularity and multicollinearity. Results of
the evaluation for singularity and multicollinearity were satisfactory. None of the
variables were redundant since none are a combination of two or more of the other
variables (Tabachnick & Fidell, 2008). Since none of the variables were considered very
highly correlated, i.e., .90 and above, multicollinearity does not exist (Tabachnick &
Fidell, 2008). Table 10 shows the correlations for the variables.
While not an actual assumption for a MANOVA, the presence of outliers should
be considered. After a careful review and comparison of the Mahalanobis distance score
with the critical values for each case, no univariate or multivariate outliers were found.
The sixth assumption for MANOVA is multivariate normality. Table 11 provides
a within-class summary of Mardia‘s skewness and kurtosis (Mardia, 1970). All results
show insignificant p values for both classes. The assumption of multivariate normality
was met.

88
Table 11
Summary of Within-Class Tests for Multivariate Normality
Instructional
Group Statistic n Estimate p-value
Group A Mardia's Skewness 83 1.25 17.28 .635
Group A Mardia's Kurtosis 83 23.12 -0.58 .562
Group B Mardia's Skewness 69 2.20 25.31 .190
Group B Mardia's Kurtosis 69 24.68 0.41 .684
The final assumption test for MANOVA is homogeneity of variance-covariance.
The assumption of homogeneity of variance-covariance was not tenable based on the
results of the Box‘s test, M = 26.82, F(2.60, 26.04) = 10.996, p = .004. This provides
evidence that the population covariance matrices are not equal. However, Tabachnick &
Fidell (2007) indicate that if the significance value is larger than .001, then the
assumption has not been violated. To be entirely confident in the analysis, Yao‘s Test
was performed using a macro. Huberty and Olejnik (2006) state, ―If the assumption of
equal covariance matrices is not met and the researcher doubts the validity of the
Hotelling T^2 test, a procedure analogous may be used [Yao‘s Test]‖ (p. 43).
yielded the following results T*2 =11 27 4 142 53 4 142 53 2 76 0 03.
This indicates that the classes have significantly different mean values when considering
all components of motivation simultaneously. Since there are only two populations being
compared, all of the multivariate effect size indices give the same value.
This indicates that the classes have significantly different mean values when considering all components of motivation simultaneously
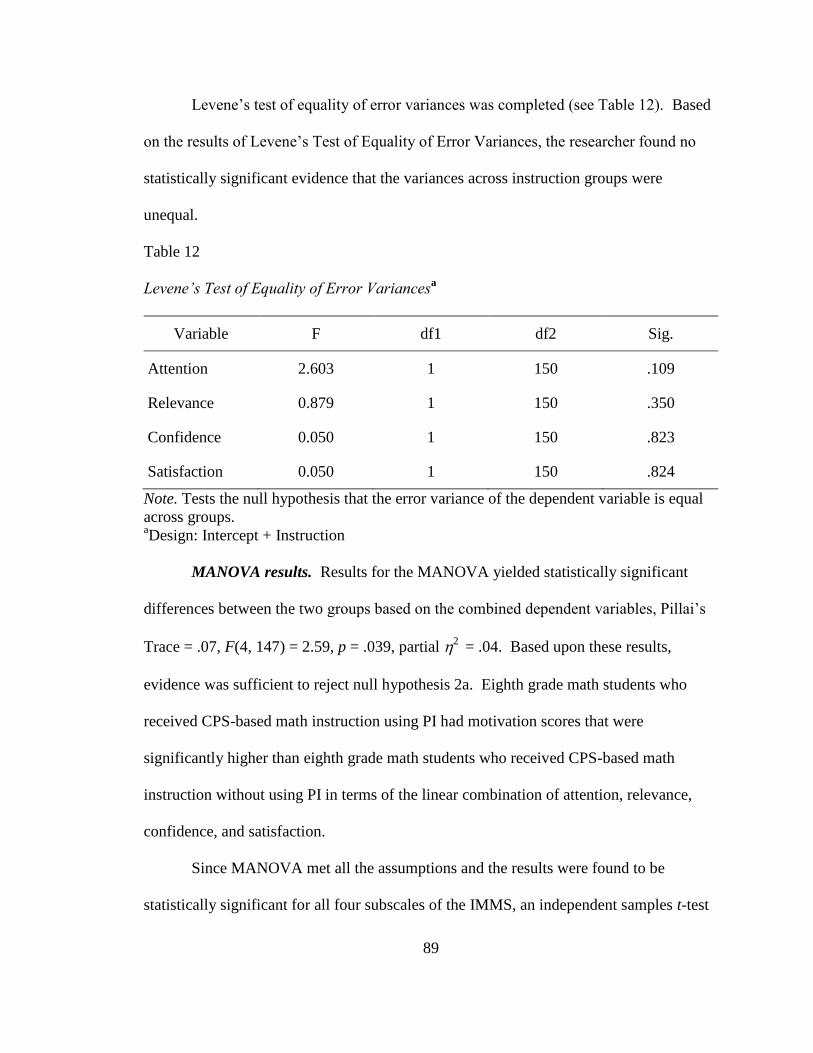
89
Levene‘s test of equality of error variances was completed (see Table 12). Based
on the results of Levene‘s Test of Equality of Error Variances, the researcher found no
statistically significant evidence that the variances across instruction groups were
unequal.
Table 12
Levene’s Test of Equality of Error Variancesa
Variable F df1 df2 Sig.
Attention 2.603 1 150 .109
Relevance 0.879 1 150 .350
Confidence 0.050 1 150 .823
Satisfaction 0.050 1 150 .824
Note. Tests the null hypothesis that the error variance of the dependent variable is equal
across groups. aDesign: Intercept + Instruction
MANOVA results. Results for the MANOVA yielded statistically significant
differences between the two groups based on the combined dependent variables, Pillai‘s
Trace = .07, F(4, 147) = 2.59, p = .039, partial 2 = .04. Based upon these results,
evidence was sufficient to reject null hypothesis 2a. Eighth grade math students who
received CPS-based math instruction using PI had motivation scores that were
significantly higher than eighth grade math students who received CPS-based math
instruction without using PI in terms of the linear combination of attention, relevance,
confidence, and satisfaction.
Since MANOVA met all the assumptions and the results were found to be
statistically significant for all four subscales of the IMMS, an independent samples t-test
90
was conducted as a follow-up analysis to examine the components of motivation
separately.
Independent t-tests. Since a significant result on the multivariate test of
significance was obtained, further analyses on the dependent variables were conducted in
the form of t tests. Using the Bonferroni method, each independent t test was tested at a
.0125 alpha level. This controlled for the experiment-wise Type I Error rate. While
some researchers purport that ANOVA is more robust than a t-test (Zhang, 2009), a
review of the literature indicates that a t-test can be just as robust as the ANOVA
(Zijlstra, 2004). In fact, a t-test is considered to be a special case of ANOVA (Indiana
University, 2006). Statistically, a t-test yields the same results as an ANOVA when there
are two levels of the grouping variable (McDonald, 2009; Wu, 2009).
T-test results. The researcher conducted a t-test for each subscale of the IMMS
(attention, relevance, confidence, and satisfaction). Results showed insignificant
differences for confidence, t(150) = 1.73, p = .085, d = 0.28, observed power = 0.21; and
for satisfaction t(150) = 2.21, p = .029, d = 0.36, observed power = 0.38 between the
group that received CPS-based math instruction with PI and the group that received CPS-
based math instruction without PI. Results showed significant differences between the
groups for attention, t(150) = 2.72, p = .007, d = 0.44, observed power = 0.57; and for
relevance t(150) = 3.03, p = .003, d = 0.49, observed power = 0.69. For the attention
component, the observed power is 0.57. Therefore, when this experiment was conducted,
there was a 57% chance of obtaining a statistically significant result when the null
hypothesis was actually false. For the relevance component, the observed power is 0.69.

91
Therefore, when this experiment was conducted, there was a 69% chance of obtaining a
statistically significant result when the null hypothesis was actually false.
An examination of the mean scores in Table 11 showed that students who
received PI had slightly higher mean scores for both confidence and satisfaction. Based
on Cohen‘s d, .2 is a small effect, .5 is a medium effect, and .8 is a large effect. The
effect size was medium for both attention and relevance. Based on the results, there was
insufficient evidence to reject the following null hypotheses: (a) There is no statistically
significant difference in confidence between eighth grade students who receive CPS-
based math instruction with PI and eighth grade students who receive CPS-based
instruction without PI, as measured by the IMMS, and (b) there is no statistically
significant difference in satisfaction between eighth grade students who receive CPS-
based math instruction with PI and eighth grade students who receive CPS-based math
instruction without PI, as measured by the IMMS. Sufficient evidence was found to
reject the following null hypotheses: (a) There is no statistically significant difference in
attention between eighth grade students who receive CPS-based math instruction with PI
and eighth grade students who receive CPS-based instruction without PI, as measured by
the IMMS, and (b) there is no statistically significant difference in relevance between
eighth grade students who receive CPS-based math instruction with PI and eighth grade
students who receive CPS-based instruction without PI, as measured by the IMMS.
Summary
Through the use of this quasi-experimental, posttest, nonequivalent groups design
research study, the researcher was able to determine if there was a statistical difference
between student achievement scores and the levels of student motivation for eighth grade

92
students who receive CPS-based math instruction with PI and eighth grade students who
receive CPS-based math instruction without PI. The first consideration was the
descriptive statistics for the data.
Statistical analyses were performed. An ANCOVA was performed using posttest
scores and the 2010 ITBS Mathematics Total scores as a covariate. A MANOVA and
independent t-test were also conducted. The use of PI with CPS-based math instruction
resulted in a statistically significant difference in motivation for two out of the four
subscales on the IMMS. The null hypotheses were rejected for the attention and
relevance subscales on the IMMS, but not for the confidence and satisfaction subscales
on the survey.
By determining if there was a statistically significant difference, the researcher
was able to decide if using a specific instructional strategy with CPS technology is
justified due to its impact on student achievement scores and student motivation.
Students who received CPS-based math instruction with PI demonstrated a statistically
significant increase in scores on an expert-validated unit posttest. Students who received
CPS-based math instruction with PI had statistically higher means for student motivation
in two out of four subscales, as measured by the IMMS. Chapter 5 will discuss the
implications of using PI with CPS based upon the results set forth in this chapter.

93
CHAPTER FIVE: SUMMARY AND DISCUSSION
The previous chapter presented data analysis utilizing an ANCOVA, a one-way
MANOVA, and multiple independent sample t-tests to compare the differences between
student achievement scores and motivation of eighth grade students who received CPS-
based math instruction with PI compared to eighth grade students who received CPS-
based math instruction without PI in one rural northeast Georgia middle school.
Descriptive statistics and summaries were also presented.
The purpose of this chapter is to review the findings of this study and discuss
them. This chapter is divided into the following sections: summary of the study,
statement of the problem, summary of the findings, discussion of the findings and the
implications in light of the relevant literature, study limitations, recommendations for
future research, and conclusion.
Restatement of the Problem
NCLB (2002) mandates that all students make gains in achievement and that all
students will perform at or above grade level by 2014. At the same time, students expect
classrooms to be interactive and engaging. Administrators and teachers are charged with
providing instruction and engaging learners in a learning environment that produces high
levels of academic achievement. CPS may be one of the tools that help accomplish this
goal. Over the past 30 years, CPS has been used as a technological tool for increasing
student engagement in postsecondary classrooms, but limited research has been
conducted to measure its effectiveness in K–12 classrooms (Lively, 2010; Musselman,
2008; Rigdon, 2010; Sartori, 2008; Shirley, 2009). Thus, the problem
94
addressed in this study was to determine if CPS, when used in conjunction with PI, could
be a viable solution for increasing both academic achievement and student motivation in
K–12 classrooms. A review of the literature affirmed conflicting results about the
effectiveness of the implementation of CPS technology in increasing student achievement
and student motivation.
Educators have long been charged with helping all students be successful in
school. Due to high stakes testing, educators are held even more accountable for making
certain that student achievement is a top priority. Integrating technology appropriately
into the classroom along with specific methodology is one way in which student
achievement scores may be increased. Students have grown up in a technologically
advanced world and have become more technologically savvy due to a flood of
technological gadgets on the market and in their home. Therefore, educators must be
aware of current strategies and technological tools that not only help engage and motivate
students to learn but actually result in increased student achievement. Students have
become bored with the traditional ways of learning and often lose interest and motivation
unless the teacher incorporates new instructional methods in order to increase student
motivation as well as student achievement, which is always the teacher‘s ultimate goal
(Chen, 2010).
This study focused on eighth grade students in one rural, public middle school in
northeast Georgia who were taught in a regular or cotaught math class. Both the
treatment and the control group included regular education students as well as students
with disabilities. Because of NCLB mandates, educators must raise academic
achievement each year until the year 2014 when 100% of students are expected to be on

95
grade level and all schools are expected to make AYP (NCLB, 2002). Classrooms that
implement active learning may be more likely to produce students capable of reaching
that standard (Florida State University Office of Distance Learning, 2011; Michael,
2006). Utilizing CPS-based instruction along with PI could be extremely successful for
schools intent on achieving AYP.
Restatement of the Research Questions and Null Hypotheses
This study focused on answering two research questions. Two research questions
guided the researcher during this study:
Research Question 1: Is there a difference in student achievement mean scores
between eighth grade students who receive Classroom Performance System (CPS)-based
math instruction with Peer Instruction (PI) as opposed to those who receive CPS-based
math instruction without PI, as measured by the expert-validated Unit 7 math posttest?
Null Hypothesis 1: There is no statistically significant difference in the mean
scores on the expert-validated Unit 7 math posttest between eighth grade students who
receive CPS-based math instruction with PI as opposed to those who receive CPS-based
math instruction without PI, when controlling for prior knowledge.
Research Question 2: Is there a difference in motivation mean scores between
eighth grade math students who receive Classroom Performance System (CPS)-based
math instruction with Peer Instruction (PI) as opposed to those who receive CPS-based
math instruction without PI, as measured by the Instructional Materials Motivation
Survey (IMMS)?
Null Hypothesis 2a: There is no statistically significant difference in the linear
combination of motivation subscale mean scores between eighth grade students who

96
receive CPS-based math instruction with PI and eighth grade students who receive CPS-
based math instruction without PI, as measured by the IMMS.
Null Hypothesis 2b: There is no statistically significant difference in the mean
scores of the attention subscale between eighth grade students who receive CPS-based
math instruction with PI and eighth grade students who receive CPS-based math
instruction without PI, as measured by the IMMS.
Null Hypothesis 2c: There is no statistically significant difference in the mean
scores of the relevance subscale between eighth grade students who receive CPS-based
math instruction with PI and eighth grade students who receive CPS-based math
instruction without PI, as measured by the IMMS.
Null Hypothesis 2d: There is no statistically significant difference in the mean
scores of the confidence subscale between eighth grade students who receive CPS-based
math instruction with PI and eighth grade students who receive CPS-based instruction
without PI, as measured by the IMMS.
Null Hypothesis 2e: There is no statistically significant difference in the mean
scores of the satisfaction subscale between eighth grade students who receive CPS-based
math instruction with PI and eighth grade students who receive CPS-based instruction
without PI, as measured by the IMMS.
Summary of the Results
Research question 1: student achievement. The primary purpose of this quasi-
experimental non-equivalent control group study was to examine the impact of CPS-
based math instruction on student achievement with and without PI. The researcher
studied two groups (a control group and a treatment group) of eighth grade math students

97
in a rural middle school during the spring of 2011. While both groups of students used
CPS, only the treatment group used the PI instructional strategy along with the use of
CPS. An expert-validated posttest was administered to 168 participants. The treatment
group consisted of 92 participants, and the control group consisted of 76 students.
The results of the ANCOVA showed a statistically significant difference in the
student achievement scores of the two groups. Students who received CPS-based math
instruction with PI had a mean score of 6.70 points higher on the expert-validated math
posttest before accounting for the covariate, 2010 ITBS scores. When accounting for and
adjusting the mean scores based upon the covariate, the adjusted mean score for the
posttest for the treatment group was 7.60 points higher than the control group. The
results of the ANCOVA indicated that the use of CPS-based math instruction along with
a PI instructional strategy does contribute to an increase in student achievement. Based
upon results from the analyses for Research Question 1, Null Hypothesis 1 was rejected
because there was a statistically significant difference in the academic achievement
scores of the treatment group.
Research question 2: student motivation. The secondary purpose of this static
control group study was to examine the impact of CPS-based math instruction with and
without PI on the student motivation of eighth grade students. The response rate for
completing the online survey was 90.2% (83/92) for treatment group and 90.8% (69/76)
for the control group. A MANOVA and multiple independent t-tests were used to
examine the scores for each group for the validated survey instrument, IMMS. The
results of the MANOVA indicated that students who received CPS-based math
instruction with PI had higher mean scores for motivation when the linear combination of

98
all four subscales of the IMMS survey were considered simultaneously. Since a
significant result on the multivariate test of significance was achieved, independent
sample t-tests were performed for each subscale of the IMMS. Using the Bonferroni
method, each independent t-test was tested at a .0125 alpha level to control for the
experiment-wise Type I error rate. The results of multiple t-tests indicated a statistically
significant difference in the student motivation scores of the treatment group in two out
of four of the subscales (attention and relevance). When the Bonferroni method was not
used to control for the experiment-wise Type I error rate, the results of multiple tests
indicated a statistically significant difference in the student motivation scores of the
treatment group in three out of four of the subscales (attention, relevance, and
satisfaction). The results of the MANOVA and multiple independent t-tests indicated
that the use of CPS-based math instruction along with a PI instructional strategy does
contribute to an increase in student motivation but only for attention and relevance.
Based upon the analysis of data for Research Question 2 Null Hypotheses 2a, 2b, and 2c
were rejected. Null Hypotheses 2d and 2e were not rejected. While there was a
difference in the third and fourth subscales of the IMMS relating to confidence and
satisfaction for the two groups, the difference was not statistically significant.
Discussion of the Results
Research question 1: student achievement. The findings of this study support
other research, which confirms that PI increases student performance and learning at the
postsecondary level (Conoley et al., 2006; Cortright et al., 2003; Cortright et al., 2005;
Crouch & Mazur, 2001; Crouch et al., 2007; Guiliodori et al., 2006; Lasry et al., 2008;
Miller et al., 2006; Rao et al., 2002; Rao & DiCarlo, 2000). The findings of this study are
99
contradictory to research by Mora (2010), which indicated that PI and typical lecturing by
instructors both yielded equal results for student performance.
The findings of this study support research that indicated students at the
postsecondary level enjoy using CPS and perceive that CPS enhanced their learning
(Albon & Jewels, 2007; Barnett, 2006; Caldwell, 2007; Fies & Marshall, 2006; Harlow et
al., 2008; Holmes et al., 2006; Jackson, 2007; Judson & Sawada, 2002; Poirier &
Feldman, 2007; Simpson & Oliver, 2007; Weiman & Perkins, 2005). Similar to the
results for this study, the use of CPS at the postsecondary resulted in higher scores in
student achievement such as overall student course grades, and student test scores (Deal,
2007; Kaleta & Joosten, 2007, Ohio State University, 2008; Slavin &Shiell, 2008; Kaleta
& Joosten, 2007; University of Houston, 2008). Contrary to the results of this research,
other researchers‘ results were not conclusive or yield mixed results that CPS actually
improved student achievement at the postsecondary level (Dangel & Wang, 2008; Greer
& Heaney, 2004; Lasry & Findlay, 2007; MacArthur & Jones, 2008; Nightingale et al.,
2008; Stowell & Nelson, 2007).
A review of the literature indicated evidence to support that PI as well as the use
of CPS increases student achievement. Based upon the review of the literature and the
current study‘s findings, there is an implication that administrators and teachers who
want to improve student achievement and ultimately make certain that students are able
to pass high-stakes standardized tests at the end of the year and meet AYP goals as
mandated by NCLB (2002) should encourage teachers to incorporate CPS into instruction
along with a pedagogy such as PI (Mazur, 2011). The findings of this study support that
use of CPS-based instruction with PI does increase student achievement.

100
The current study further contributes to the field of existing research by adding a
quantitative study on the impact of CPS-based instruction when used with the PI
instructional strategy on math student achievement in the K–12 setting. Most available
research on this topic related to CPS was conducted at the postsecondary level or did not
include PI as an instructional strategy. Most available studies in the K–12 setting have
examined the perceptions of teachers or students about CPS use or compared the
achievement of students in classrooms that use CPS with those that do not use CPS.
Research question 2: student motivation. The findings of this study support
other research, which confirms that that CPS or PI positively effect student motivation.
Zhu (2007) indicated that student engagement is increased and students are more
responsible for their own learning when using PI. Students perceive that motivation is
increased through the use of CPS (Judson & Sawada, 2006). Horowitz (1988) reported
that attention increases with the use of CPS technology. Students believe CPS is fun and
that teachers can turn a typical classroom lecture into an engaging learning experience,
thus providing the opportunity for student motivation to be increased (Albon & Jewels,
2007; Hoffman & Goodwin, 2006). Duncan (2005) indicated that student attitudes are
positive when CPS is used with peer discussions.
The findings of this study indicate that the students in the treatment group who
received CPS-based instruction with PI positively impacted the attention and relevance
components of student motivation. However, the confidence and satisfaction components
were not found to be statistically significant, which was surprising to the researcher since
current and previous research indicate that the four components of the IMMS are
correlated. As suggested by Hudson et al. (2010), the researcher believed that (a)

101
feedback from peer discussions and the instructor to clarify misunderstandings, and (b)
the ability to compare results with their peers without penalty would have positively
affected the score on the confidence component. In addition, Hudson et al. (2010)
suggest that (a) the realization that recently acquired knowledge can contribute to success
on current and future classroom performance, and (b) the ability to discuss responses to
questions related to course content should give students a sense of control over their
learning and positively affect the satisfaction component.
It is possible for educators to identify motivational requirements and to design
motivational enhancements as described by Keller (2010a) that will improve student
performance and student motivation (Keller & Suzuki, 2004). Using Keller‘s ARCS
model can help educators purposefully design instruction that will meet the need to
increase student motivation (Keller & Suzuki, 2004), which may ultimately increase
student achievement. The researcher did not use Keller‘s instructional design in this
study. Thus, the researcher is led to believe that if the study had been designed with the
addition of specific instructional strategies that the results for the confidence and
satisfaction components of the IMMS might have yielded different results. Keller (1999)
made the following suggestion for promoting confidence: Increase individual praise to
students so that their success is attributed to their own hard work and effort rather than
chance. Had Keller‘s instructional strategy been designed into this study, then the
confidence score could have been statistically significant for students who received CPS-
based instruction with PI. Keller (1999) also stated that confidence can be built into the
instructional design by making the objectives clear and by providing examples of
acceptable achievements. Thus, it is a surprise to the researcher that the confidence

102
scores for students who received CPS-based instruction with PI were not higher because
students were made aware of course objectives and the course objectives were often
referenced and examples of quality work were often provided as required in a SBC.
Additionally, Keller (1987) purports that confidence can be improved by increasing a
student‘s belief in their personal competence by providing multiple varied and
challenging opportunities for increasing the likelihood of learning success.
Keller (1999) made the follow suggestions for promotion satisfaction: Provide
tangible rewards such as certificates, special privileges, stickers, school supplies, etc.
Had Keller‘s instructional strategies been designed into this study, then the satisfaction
score could have been statistically significantly for students who received CPS-based
instruction with PI. In addition, Keller (1999) suggested that the satisfaction component
can be positively affected when students feel that the amount of work expected of them is
fair and appropriate.
Additionally, after the study and the survey data relating to motivation had been
analyzed, the researcher discussed possible reasons that the confidence and satisfaction
components of the PI group were not found to be statistically significant for the group
who received CPS-based instruction with PI. The teacher of the PI group felt it was
important to point out to the researcher that the complexity of the math material in Unit 7
may have affected the outcome of the student responses to the survey. Prior to the
answering the clicker questions, the students had to read each question, write out a
mathematical equation, graph the equation, and find the solution to the equation.
Teachers stated that with the complexity and level of higher-order thinking skills required
for the math questions in this particular unit, that students often felt rushed to determine

103
an answer so that they could then discuss the answer with their peers. The teacher of the
PI group also indicated that the questions used with CPS were limited in variety and
complexity compared to the problems practiced in class when not using CPS.
Implications
Administrators and educators are constantly looking for ways to improve student
achievement and motivation. The current study provides supporting evidence that
administrators should consider and encourage the continued use of CPS technology along
with PI in the classroom as one way to increase student achievement and student
motivation. However, based upon current economic hardships across the nation,
administrators and teachers should use caution when making recommendations for the
purchase of new CPS technology. Administrators could apply for grants to purchase CPS
technology or research CPS companies who allow schools to borrow CPS equipment.
Administrators could also check with other schools within their system that are not
utilizing the CPS technology that they have already purchased. In situations where CPS
technology is not available, educators could still implement the PI strategy with students.
The current study analyzed student achievement scores and student motivation in
math based on the use of CPS along with a specific instructional strategy, PI. The study
provides administrators and educators quantitative evidence to support or reject the
suggestion that CPS equipment be used in conjunction with PI in the K–12 classroom so
that a positive, active learning environment can be maintained. Keller (1984) theorized
in the ARCS model of motivation design that instruction can be purposefully and
systematically designed and implemented to stimulate increased student motivation and
ultimately, increased student achievement. Keller (2004) indicated that if all four

104
components of the ARCS model are met, then ―students are likely to not only have a high
level of motivation to learn in the immediate setting, but to also have a continuing
motivation to learn‖ (p. 232). Keller‘s (1999) model has been used successfully and
validated by many researchers (Carson, 2006; Chan, 2009; Chen, 2011; Cheng & Yeh,
2009; Cook, Beckman, Thomas, & Thompson, 2009; Dunn, Rockinson-Szapkiw, Holder,
& Hodgson, 2010; Gabrielle, 2003; Huang et al., 2004; Huett, Kalinowski, Moller, &
Huett, 2008; Jaemu, Kim, & Lee, 2008; Jumanwan, 2011; Keller, 1997; Kim & Keller,
2008; Keller & Suzuki, 2004; Liao & Wang, 2008; Means, Jonassen & Dwyer, 1997;
Rockinson-Szapkiw, Holder, & Dunn, 2011; Small, 2006; Small & Gluck, 1994;Visser &
Keller, 1990; Yang, Tsai, Chung, & Wu, 2009) and teachers in a wide variety of
instructional environments to acquire and maintain student attention, to help students
understand the personal relevance of material so that they can engage in authentic
learning experiences, to help build and maintain student confidence, and to ascertain
student satisfaction.
In terms of the current study, students who used CPS with PI had statistically
significant improved academic achievement, were more attentive, and felt that the
material was more relevant to them. While confidence and satisfaction scores for the
students who received CPS-based math instruction with PI were not considered
statistically significant, mean scores for those two components were higher than those for
the group who did not use PI. Using Keller‘s (1987, 1999) additional instructional
strategies, the confidence and satisfaction components of motivation for CPS-based
instruction could possibly have been increased.

105
This current study is unique from other relevant studies on this topic in that a two-
part design pre-test-posttest non-equivalent design and static control group was
implemented to determine the effect of the independent variable (PI) on the dependent
variables (student achievement and student motivation) while controlling for prior
knowledge. The field of existing literature was expanded by this study because it
provided additional evidence that a statistically significant difference exists in student
achievement and student motivation, in the areas of attention and relevance, when the PI
instructional strategy is added to the use of CPS at the K–12 level.
Research supports that CPS and PI increase student achievement and motivation.
Mesa Public Schools in Arizona currently provide teacher training to their elementary
teachers on how to utilize CPS to increase student motivation and increase student
performance (Zahner, 2011). Manzo (2009) indicated that the use of CPS in well planned
lessons resulted in increases in student achievement and attention. Satori (2008)
confirmed that CPS increased student achievement and motivation for K–12 students.
The use of CPS increased student motivation in tenth through twelfth grade students (Kay
& Knaack, 2009). Bloemers (2004) stated that CPS increased student motivation and
student performance with sixth grade science students (Bloemers, 2004). Preszler et al.
(2006) indicated that CPS improved students‘ performance, increased interest in their
courses, and motivated them to attend more lectures.
Limitations
Several limitations of this study were identified. First, the participants in this
study were not randomly assigned to the groups, as teachers and classes were already
intact once the research began. While the researcher was not allowed to randomly select

106
the students for the study, school administrators randomly placed the students into
classrooms on each of the two teams prior to the beginning of the school year. Each team
was assigned an equivalent number of high, average, and low performing students.
Students with disabilities and students with English as a second language were placed in
groups according to their individual needs. Efforts were made by administration to
ensure that the demographic makeup of each team was similar.
There was also a difference in the size of the groups. The researcher used
ANCOVA to minimize the difference between group sizes. A flip of a coin determined
the assignment of teams to either the control group or the treatment group.
The teachers that were recruited to assist with the research study were volunteers.
It is possible that this creates a selection bias. Because these teachers have volunteered to
be a part of the study, they may have had an incentive to see the study succeed or fail
based on their feelings toward the use of CPS or PI. Both these teachers had minimal
prior experience with CPS. However, training on how to use the CPS technology and
ongoing technical support was provided to both teachers. The research results may have
been different had both teachers had extensive experience in CPS prior to this study.
Training was also provided to the teacher of the treatment group on how to incorporate PI
with CPS.
The results of this study were generalized to one grade level of math students in
one small rural school in northeast Georgia. Students in a different grade level, at a
different school, in a different geographical location, or in a different subject area could
have had different academic skills, weaknesses, or results.

107
While the 2010 ITBS Total Math score was used as a covariate to control for
previous math achievement, there were several factors that were not considered. Factors
such as additional math support, participation in before school or after school academic
programs, extracurricular activities, family responsibilities, level of parental
support/involvement, gender, ethnicity, or socio-economic status were not included in the
statistical analysis. The researcher did not disaggregate student achievement or
motivation data based upon the aforementioned categories because those categories were
not related to the research questions.
There is also a validity threat with the teacher-created Unit 7 posttest. Although
teachers and others professionals considered to be experts in math and the educational
field validated the test, there was no statistical analysis conducted on the questions. It is
possible that these questions are neither reliable nor valid. However, to reduce this
threat, the test questions were specifically aligned to the objectives for the GPS math unit
being taught.
The assumption of homogeneity of variance between the groups could not be
assumed for the posttest results. Caution should be taken when interpreting the results of
the posttest because there is an increased chance of a Type I error.
Surveys have inherent limitations. Technical glitches may occur in an online
survey (University of Texas at Austin, 2008). Technical difficulties did occur during the
survey in this research, thus decreasing the available results from participants in the
treatment group and the control group. Therefore, the results of the study may be slightly
skewed. In addition, online surveys must be completed in one sitting and cannot be
saved and finished at a later date, thus students may have rushed through the survey if

108
little time remained in class (University of Saskatchewan, 2009). A major limitation of a
survey is that ―it relies on a self-report method of data collection. Intentional deception,
poor memory, or misunderstanding of the questions can all contribute to inaccuracies in
the data‖ (Maricopa Community College, n.d., para. 1). The teacher of each group
encouraged students to be honest when answering the survey questions and made sure
that students knew that the results of the survey were for research purposes only and that
their class grade would not be affected in anyway as a result of their answers. Finally,
the development of questions that would be general enough yet still appropriate for all
participants to answer the researcher‘s questions is difficult (Colorado State University,
2012). Because of this threat, the researcher used a validated survey instrument. Other
survey instruments were considered, but the IMMS was chosen because the survey‘s
questions suited this research study. This particular study used a Likert scale with
answers ranging from 1–5, creating the possibility of a midpoint system threat (Swain,
Weathers, & Neidrich, 2008).
Recommendations
Recommendations for practical applications. An analysis of the data showed
several practical recommendations and possibilities for further research. First,
administrators should encourage teachers to step out of their comfort zones and
incorporate CPS and/or other technologies into their weekly lesson plans (Lively, 2010).
Second, administrators and teachers should search for possible grants to provide funding
for CPS and then develop a checkout system for teachers who do not have a CPS in their
classrooms (Lively, 2010). Third, due to today‘s tough economy rather than hiring a
technology coordinator instructional coordinator for individual schools, administrators
109
could consider assigning select personnel already employed at the school (such as the
media specialist, instructional leader, or other computer literate personnel) to be
responsible for learning how to use and implement CPS and PI and other related
pedagogies. Fourth, administrators should search for creative ways to provide release
time and training to teachers on how to properly implement CPS and PI (Lively, 2010).
Recommendations for future research. The findings of this study support the
idea that CPS-based math instruction in conjunction with PI can increase student
achievement and motivation in eighth grade students. The findings of this study also
suggest that future studies extending the use of PI pedagogy with CPS to math units
might show increased student achievement and motivation. While this study
demonstrated that PI is an appropriate pedagogy to incorporate with the use of CPS in
eighth grade math students, the strategies may need to be modified to meet the needs of
other students. More research should be done which utilizes CPS technology along with
specific types of pedagogy other than PI. These strategies might include Assessing to
Learn (Dufresne & Gerace, 2004), Interactive Engagement (Hake, 1998), or Technology-
Enhanced-Formative Assessment (Beatty & Gerace, 2009).
Results from this study indicated that CPS-based instruction with PI increases
students‘ attentiveness and view of math‘s relevance. Using CPS-based instruction with
PI in math may be effective for students with disabilities such as those with Attention
Deficit with Hyperactivity Disorder. If the students see math as relevant and can pay
attention, then the instruction could be more effective. If the instruction is more
effective, then test scores may increase. If tests scores increase, then the school is much
more likely to meet AYP. This implication is an area of importance to the research site

110
because students with disabilities historically have problems meeting the minimum
requirements for high-stakes testing, and each year the research site‘s AYP success
hinges on the math scores of students with disabilities.
Further research could be undertaken that would survey and use a validated
instrument that investigates the perceptions of teachers and students regarding the use of
CPS with and without PI in the K–12 setting. If no such survey instrument exists, then
research could be conducted that leads to the creation of a validated survey pertaining to
the perceptions of teachers and students who have used CPS with and without PI.
Research could be conducted that further investigates student motivation
regarding the use of CPS with PI by incorporating a qualitative component. This type of
research could include focus groups and/or interviews of students in the K–12 setting.
Further research could be conducted that investigates the impact of various
demographic differences on student achievement and student motivation among students
who use CPS with PI in the K–12 setting. These differences could include factors such
as gender, ethnicity, and socioeconomic status.
Further research could be conducted that isolates various variables that might
influence student achievement or student motivation. These variables could include but
are not limited to variables such as additional math support before, during, or after the
school day; participation in afterschool activities; family responsibilities; and level of
parental support among students who use CPS with PI in the K–12 setting.
Further research could be conducted that utilizes a 2 x 4 factorial design. One
group would receive CPS-based instruction only. One group would receive PI-based

111
instruction only. One group would receive CPS-based instruction with PI. One group
would receive no CPS- or PI-based instruction.
Replication of this study could be done with any of the following variations: (a)
using a more valid instrument other than an expert-validated posttest for measuring
student achievement, (b) using an expert-validated test with more than 10 questions, (c)
using a different validated survey for measuring motivation, (d) expanding the length of
time for the instructional unit beyond a four-week unit, (e) using a different unit of study
in math; (f) using a different subject area, (g) using a different grade level in the K–12
setting, and (h) using a study based upon and designed according to Keller‘s (2006b)
ARCS Model of Design.
Conclusion
The results of this study indicated that eighth grade students who received CPS-
based math instruction combined with PI showed a statistically significant difference in
posttest scores compared to eighth grade students who received CPS-based math
instruction without PI. The findings from this study also demonstrated that student mean
scores for motivation were statistically significantly different on two out of four subscales
for eighth grade students who received CPS-based math instruction in conjunction with
PI compared to eighth grade students who did not receive CPS-based math instruction
with PI. Thus, this study suggests that the variable of PI used in conjunction with CPS
has a positive effect on enhancing student achievement and certain aspects of student
motivation in eighth grade students.

112
REFERENCES
Achacoso, M. (2003). Evaluating technology and instruction: Literature review and
recommendation. Unpublished manuscript, University of Texas, Austin, TX.
Retrieved from http://www.utexas.edu/academic/mec/LiteratureReview.pdf
Adams, H., & Howard, L. (2009). Clever clickers: Using audience response systems in
the classroom. Library Media Connection, 28(2), 54–56.
Addison, S., Wright, A., & Milner, R. (2009). Using clickers to improve student
engagement and performance in an introductory biochemistry class. Biochemistry
and Molecular Biology Education, 37(2), 84–91. doi:10.1002/bmb.20264
Ainsworth, A. (n.d.). Remote control in hand: Student perception on the use of personal
response systems to promote student interaction in the classroom. Paper presented
at the NCA 94th
Annual Convention, San Diego, CA. Retrieved from
http://www.allacademic.com/meta/p257444_index.html
Ainuson, K. (2008). Effectiveness of personal response systems as a classroom
technology tool at Clemson University. Paper presented at the APSA Teaching
and Learning Conference, San Jose, California. Retrieved from
http://www.allacademic.com/meta/p245644_index.html
Albon, R. J., & Jewels, T. (2007). The impact of audience response systems in a
multicultural Asian context. In R. J. Atkinson, C. McBeath, S. K. A. Soong, & C.
Cheers, (Eds.), ICT: Providing choices for learners and learning. Proceedings

113
ascilite Singapore 2007 (pp. 10–19). Singapore: Centre for Educational
Development, Nanyang Technological University. Retrieved from
http://www.ascilite.org.au/conferences/singapore07/procs/albon.pdf
Allen, J. D. (2005). Grades as valid measures of academic achievement of classroom
learning. The Clearing House, 78(5), 218–223. doi:10.3200/TCHS.78.5
Ary, D., Jacobs, L. C., Razavieh, A., & Sorensen, C. (2006). Introduction to research in
education (7th ed.). Belmont, CA: Thomson & Wadsworth.
Bangert, A. (2006). Two traditions for assessing student achievement. Retrieved from
http://www.montana.edu/teachlearn/Papers/tradassess.pdf
Barber, M., & Njus, D. (2007). Clicker evolution: Seeking intelligent design. CBE—Life
Sciences Education, 6(1), 1–20. doi:10.1187/cbe.06-12-0206
Barnett, J. (2006). Implementation of personal response units in very large lecture
classes: Student perceptions. Australasian Journal of Educational Technology,
22(4), 474–494.
Barrett, M. S., Bornsen, S. E., Erickson, S. L., Markey, V., & Spiering, K. (2005). The
personal response system as a teaching aid. Communication Teacher, 19(3), 89–
92. doi:10.1080/14704620500201806
Beatty, I. (2004). Transforming student learning with classroom communication systems.
Educause Centre for Applied Research Bulletin, 3, 2–13. Retrieved from
http://net.educause.edu/ir/library/pdf/ERB0403.pdf
Beatty, I. D., & Gerace, W. J. (2009). Technology-enhanced formative assessment: A
research-based pedagogy for teaching science with classroom response

114
technology. Journal of Science Education and Technology, 18(2), 1146–1162.
doi:10.1007/s10956-008-9140-4
Beatty, I. D., Leonard, W. J., Gerace, W. J., & Dufrense, R. J. (2006). Question driven
instruction: Teaching science (well) with an audience response system. In D.
Banks (Ed.), Audience Response Systems in Higher Education: Applications and
Cases (pp. 96–115). Hershey, PA: Information Science Publishing.
Berry, J. (2009). Technology support in nursing education: Clickers in the classroom.
Nursing Education Research, 30(5), 295–298. doi:10.1043/1536-5026-30.5.295
Beuckman, J., Rebello, N. S., & Zollman, D. (2006). Impact of a classroom interaction
system on student learning. AIP Conference Proceedings, 883, 129–132.
doi:10.1063/1.2508709
Blodgett, D. L. (2006). The effects of implementing an interactive student response
system in a college algebra classroom (Master‘s thesis, University of Maine).
Retrieved http://www.umaine.edu/center/files/2009/12/BlodgettThesis.pdf
Bloemers, B. (2004). Classroom performance systems in the classroom. Retrieved from
Michigan State University website:
https://www.msu.edu/~bloemer3/documents/812CPS.doc
Bode, M., Drane, D., Kolikant, Y. B., & Schuller, M. (2009). A clicker approach to
teaching calculus. Notices of the American Mathematical Society, 56(2), 253–256.
Borg, W. R., & Gall, M. D. (1989). Educational research. New York: Longman.
Boyd, D. K. (2003). CPS and learning by remote. Teachers.net Gazette, 4(6). Retrieved
from http://teachers.net/gazette/JUN03/boyd.html

115
Brickman, P. (2006). The case of the druid Dracula: A directed ―clicker‖ case study on
DNA fingerprinting. Journal of College Science Teaching, 36(2), 48–53.
Bruff, D. (2009). Teaching with classroom response systems: Creating active learning
environments. San Francisco: Jossey Bass.
Bruner, J. S. (1961). The act of discovery. Harvard Educational Review, 31(1), 21–32.
Butler, M. (2005). What I learned from using a personal response system. FOCUS:
Newsletter of Mathematical Association of America, 25(3), 15. Retrieved from
http://www.maa.org/pubs/pastissues.html
Butler, M., & Butler, F. (2006). Introduction to personal response systems and studies of
their use. Proceedings of the Second IASTED International Conference on
Education and Technology, Calgary, Alberta, Canada, 200–205. Retrieved from
http://dragon.ycp.edu/~fbutler/IntroPRS.pdf
Cain, J., Black, E. P., & Rohr, J. (2009). An audience response system strategy to
improve student motivation, attention, and feedback. American Journal of
Pharmaceutical Education, 73(2), 21. Retrieved from
http://www.ncbi.nlm.nih.gov/pmc/articles/PMC2690899/
Cain, J., & Robinson, E. (2008). A primer on audience response systems: Current
applications and future considerations. American Journal of Pharmaceutical
Education, 72(4), 77–86. http://www.ajpe.org/doi/full/10.5688/aj720477
Caldwell, J. E. (2007). Clickers in the large classroom: Current research and best-
practice tips. CBE Life Science Education, 6(1), 9–20. doi:10.1187/cbe.06-12-
0205

116
Calhoun, J. (n.d.). Classroom response systems. Retrieved from Carleton College,
Science Education Resource Center website:
http://serc.carleton.edu/sp/library/classresponse/index.html
Carnaghan, C., & Webb, A. (2007). Investigating the effects of group response systems
on student satisfaction, learning, and engagement in accounting education. Issues
in Accounting Education, 22(3), 391–409. doi:10.2308/iace.2007.22.3.391
Carnevale, D. (2005). Run a class like a game show: ―Clickers‖ keep students involved.
Chronicle of Higher Education, 51(42), B3. Retrieved from
http://www4.uwm.edu/ltc/srs/faculty/docs/Chronicle-Clickers.pdf
Carson, C. H. (2006). The relationship between hypermedia producers. Journal of
Education for Library and Information Science, 47(2), 106–26.
doi:10.2307/40324326
Center for Teaching Excellence (2009). Classroom performance system: Some initial
decisions: Course planning and design. Retrieved from Virginia Commonwealth
University, Center for Teaching Excellence website:
http://www.vcu.edu/cte/resources/cps/initial_decisions.htm
Chan, L. (2009). Applying motivational analysis in a web-based course. Innovations in
Education and Teaching International, 46(1), 91–103.
doi:10.1080/14703290802646123
Chen, C. (2011). E-book instruction and its effects on teaching and learning. In S. Barton,
J. Hedberg, & K. Suzuki (Eds.), Proceedings of Global Learn Asia Pacific 2011
(pp. 1282–1291). Melbourne, Australia. Available from
http://www.editlib.org/p/37331

117
Chen, M. (2010). If technology motivates students, then let’s use it! Retrieved from
http://www.edutopia.org/blog/motivating-students-technology
Cheng, Y., & Yeh, H. T. (2009). From concepts of motivation to its application in
instructional design: Reconsidering motivation from an instructional design
perspective. British Journal of Educational Technology 40(4), 597–605.
doi:10.1111/j.1467-8535.2008.00857.x
Cherry, K. (2011). What is a survey? Retrieved from
http://psychology.about.com/od/researchmethods/f/survey.htm
Clark, R. E. (1983). Reconsidering research on media learning. Review of Educational
Research, 53(4), 445–459. doi:10.3102/00346543053004445
Cleary, A. M. (2008). Using wireless response systems to replicate behavioral
research findings in the classroom. Teaching of Psychology, 35(1), 42–44.
doi:10.1080/00986280701826642
Cline, K. (2006). Classroom voting in mathematics. Mathematics Teacher, 100(2), 100–
104.
Cline, K., Zullo, H., & Parker, M. (2007). Teaching with classroom voting. FOCUS: The
Newsletter of the Mathematical Association of America, 27(5), 22–23. Retrieved
from www.carroll.edu/kcline/FOCUS-MathQuest.pdf
Colorado State University. (2012). Advantages and disadvantages of the survey
method. Retrieved from
http://writing.colostate.edu/guides/research/survey/com2d1.cfm
Conoley, J., Moore, G., Croom, B., & Flowers, J. (2006). A toy or a teaching tool? The
use of audience-response systems in the classroom. Techniques (The Journal of
118
the Association for Career and Technical Education), 81(7), 46–49. Retrieved
from http://www.cals.ncsu.edu/agexed/people/moore/intro.html
Cook, D. A., Beckman, T. J, Thomas, K. G., & Thompson, W. G. (2009). Measuring
motivational characteristics of courses: Applying Keller's instructional materials
motivation survey to a web-based course. Academic Medicine, 84(11), 1505–
1509. doi:10.1097/ACM.0b013e3181baf56d
Cortright, R. N., Collins, H. L., & DiCarlo, S. E. (2005). Peer instruction enhanced
meaningful learning: Ability to solve novel problems. Advances in Physiology
Education, 29(2), 107–11. doi:10.1152/advan.00060.2004.
Cortright, R. N., Collins, H. L., Rodenbaugh, D. W., & DiCarlo, S. E. (2003). Student
retention of course content is improved by collaborative-group testing. Advances
in Physiology Education, 27(3), 102–108. doi:10.1152/advan.00041.2002
Crehan, K. D. (1974). Item analysis for teacher-made mastery tests. Journal of
Educational Measurement, 11(4). 255–262. doi:10.1111/j.1745-
3984.1974.tb00997.x
Creswell, J. W. (2005). Educational research: Planning, conducting, and evaluating
quantitative and qualitative research. Upper Saddle River, NJ: Pearson.
Crouch, C. H., & Mazur, E. (2001). Peer instruction: Ten years of experience and
results. American Journal of Physiology, 69(9), 970–977.
doi:10.1119/1.1374249
Crouch, C. H., Watkins, J., Fagen, A. P., & Mazur, E. (2007). Peer instruction:
Engaging students one-on-one, all at once. In E. F. Redish and P. J. Cooney
(Series Eds.), Reviews in Physics Education Research: Vol. 1. Research-based

119
reform of university physics (pp. 1–55). Retrieved from
http://www.compadre.org/Repository/document/ServeFile.cfm?ID=4990&Do
cID=21
Cutts, Q., Carbone, A., & Van Haaster, K. (2004). Using an electronic voting system
to promote active reflection on coursework feedback. Proceedings of the 12th
International Conference on Computers in Education, Australia. Retrieved
from http://www.dcs.gla.ac.uk/~quintin/papers/ICCE04QC.pdf
D‘Angelo, C., Touchman, S., Clark, D., O‘Donnell, A., Mayer, R., Dean, D., &
Hmelo-Silver, C. (2011). Constructivism. Retrieved from
http://www.education.com/reference/article/constructivism/
Dangel, H. L., & Wang, C. (2008). Student response systems in higher education:
Moving beyond linear teaching and surface learning. Journal of Educational
Technology Development and Exchange, 1(1), 93–99. Retrieved from
http://www.sicet.org/journals/jetde/jetde08/paper08.pdf
Deal, A. (2007). Classroom response systems: A teaching with technology white paper.
Retrieved from Carnegie Mellon, Office of Technology for Education website:
http://www.cmu.edu/teaching/resources/PublicationsArchives/StudiesWhitepaper
s/ClassroomResponse_Nov07.pdf
De Gange, J. C. (2011). The impact of clickers in nursing education: A review of
literature. Nurse Education Today, 31(8), e34–e40.
doi:10.1016/j.nedt.2010.12.007
Diederich, P. B. (1973). Short-cut statistics for teacher-made tests. Princeton, NJ:
Educational Testing Service. Retrieved from

120
http://www1.unl.edu/search/?q=teacher-
made+tests&submit=Go&u=http%3A%2F%2Fwww.unl.edu%2F
d'Inverno, R., Davis, H., & White, S. (2003). Using a personal response system for
promoting student interaction. Teaching Mathematics and Its Applications, 22(4),
163–169. doi:10.1093/teamat/22.4.163
Doric, D., Nikolic-Doric, E., Jevremovic, V., & Malisic, J. (2007). On measuring
skewness and kurtosis. Quality & Quantity, 43(3), 481–493. doi:10.1007/s11135-
007-9128-9
Dorr, D. L. (2006). Enhanced learning performance in the middle school classroom
through increased student motivation, by the use of educational software and
question-based gaming technology (Doctoral dissertation). Retrieved from
ProQuest Dissertations and Theses database. (AAT 3254181).
Draper, S. W., & Brown, M. I. (2004). Increasing interactivity in lectures using an
electronic voting system. Journal of Computer Assisted Learning, 20(2), 81–94.
doi:10.1111/j.1365-2729.2004.00074.x
Dufresne, R. J., & Gerace, W. J. (2004). Assessing-to-learn: Formative assessment in
physics instruction. The Physics Teacher, 42(8), 18–23. doi:10.1119/1.1804662
Dunbar, S. B., Hoover, H. D., Frisbie, D. A., Oberley, K. R., Bray, G. B., Naylor, R. J.,
. . . & Hazen, T. (2008). The Iowa tests: Interpretive Guide for teachers and
counselors. Forms A, B, C: Levels 9–14. Rolling Meadows, IL: Riverside
Publishing Company.
Duncan, D. (2005). Clickers in the classroom: How to enhance science teaching using
classroom response systems. San Francisco: Pearson Education.

121
Duncan, D. (2006). Effective use of wireless student response units (―clickers‖).
Retrieved from http://casa.colorado.edu/~dduncan/clickers/ASP2007.pdf
Dunn, R., Rockinson-Szapkiw, A., Holder, D., & Hodgson, D. (2010). Of student
teachers and avatars: Working towards an effective model for geographically
distributed learning communities of pre-service educators using virtual worlds. In
D. Gibson & B. Dodge (Eds.), Proceedings of Society for Information Technology
& Teacher Education International Conference 2010 (pp. 423–427). Chesapeake,
VA: AACE. Retrieved from
http://digitalcommons.liberty.edu/educ_fac_pubs/153/
eInstruction. (2010). What the research says: Using eInstruction’s CPS to support
effective instruction. Retrieved from http://www.einstruction.com/support_down
loads/assessment/pulse/CPSPulse-Research-Whitepaper.pdf
eInstruction. (2011). Student response systems. Retrieved from
http://www.einstruction.com/products/student-response-systems
Elliot, C. (2003). Using a personal response system in economics teaching. International
Review of Economics Education, 1(1), 80–86. Retrieved from
http://www.economicsnetwork.ac.uk/iree/i1/elliott.htm
Engaging Technologies. (2008). Clickers and peer instruction. Retrieved from
http://www.engaging-technologies.com/peer-instruction.html
Fagen, A., Crouch, C., & Mazur, E. (2002). Peer instruction: Results from a range of
classrooms. The Physics Teacher, 40(4), 206–209. doi:10.1119/1.1474140

122
Fies, C., & Marshall, J. (2006). Classroom response systems: A review of the literature.
Journal of Science Education and Technology, 15(1), 101–109.
doi:10.1007/s10956-006-0360-1
Florida State University Office of Distance Learning (2011). Using active learning in the
classroom. In Instruction at FSU: A Guide to Teaching & Learning Practices (pp.
75–102). Retrieved from
http://ctl.fsu.edu/explore/onlineresources/docs/Chptr8.pdf
Freeman, M., Blayney, P., & Ginns, P. (2006). Anonymity and in class learning: The case
for electronic response systems. Australasian Journal of Educational Technology,
22(4), 568–580.
Frisbie, D. A. (Spring 1988). Reliability of scores from teacher-made tests. Educational
Measurement: Issues and Practice, 7(1), 25–35. doi:10.1111/j.1745-
3992.1988.tb00422.x
Funderstanding. (2008). Constructivism. Retrieved from
http://www.funderstanding.com/content/constructivism
Gabrielle, D. M. (2003). The effects of technology-mediated instructional strategies on
motivation, performance, and self-directed learning (Doctoral dissertation).
Retrieved from Proquest Dissertations and Theses database. (AAT 3137428)
Garrison, C., & Ehringhaus, M. (2007). Formative and summative assessments in the
classroom. Retrieved from
http://www.nmsa.org/Publications/WebExclusive/Assessment/tabid/1120/Default.
aspx

123
Gauci, S. A., Dantas, A. M., Williams, D. A., & Kemm, R. E. (2009). Promoting student-
centered active learning in lectures with a personal response system. Advances in
Physiology Education, 33(1), 60–71. doi:10.1152/advan.00109.2007
Gay, L. R., & Airasian, P. (2003). Educational research: Competencies for analysis and
applications (7th ed.). Upper Saddle River, New Jersey: Pearson.
Georgia Department of Education. (2010a). Georgia Department of Education, School
Year 2010–2011, Enrollment by Gender, Race/Ethnicity and Grade (PK–12),
Enrollment on Oct. 5, 2010 (FTE 2011-1). Retrieved from
http://app3.doe.k12.ga.us/ows-bin/owa/fte_pack_ethnicsex.display_proc
Georgia Department of Education. (2010b). Georgia Department of Education, School
Year 2010–2011, Enrollment by Grade Level (PK–12), Enrollment on Oct 5, 2010
(FTE 2011-1). Retrieved from
http://app3.doe.k12.ga.us/owsbin/owa/fte_pack_enrollgrade.display_proc
Georgia Department of Education. (2010c). Georgia Department of Education, Free and
Reduced Price Lunch Eligibility, Free and Reduced Price Meal Eligibility
October 31, 2010 (FY2011-1). Retrieved from
http://app3.doe.k12.ga.us/owsbin/owa/fte_pack_frl001_public.display_proc
Georgia Department of Education. (2011a). Curriculum, instruction, and assessment.
Retrieved from http://www.doe.k12.ga.us/ci_services.aspx
Georgia Department of Education. (2011b). Georgia performance standards (GPS).
Retrieved from
https://www.georgiastandards.org/Standards/Pages/BrowseStandards/BrowseGPS
.aspx
124
Gilbert, C. G., Hunsaker, S., & Schmidt, B. (2007). Peer instruction: Faculty as architects
of peer learning environments. BYU–Idaho Perspective, 7(2), 98–115. Retrieved
from http://www.byui.edu/perspective/v7n2pdf/v7n2_gilbert_et_al.pdf
Guiliodori, M. J., Lujan, H. L., & DiCarlo, S. E. (2006). Peer instruction enhanced
student performance on qualitative problem-solving questions. Advances in
Physiology Education, 30(4), 168–173. doi:10.1152/advan.00013.2006
Graham, C. R., Tripp, T. R., Seawright, L., & Joeckel, G. L. (2007). Empowering or
compelling reluctant participators using audience response systems. Active
Learning in Higher Education, 8(3), 233–258. doi:0.1177/1469787407081885
Green, S. B., & Salkind, N. J. (2008). Using SPSS for Windows and Macintosh:
Analyzing and understanding data (5th
Ed.). Upper Saddle River, NJ: Pearson.
Greer, L., & Heaney, P. J. (2004). Real-time analysis of student comprehension: An
assessment of electronic student response technology in an introductory earth
science course. Journal of Geoscience Education, 52(4), 345–351.
doi:10.1177/1469787407081885
Griswold, P. A. (1990). Assessing relevance and reliability to improve the quality of
teacher-made tests. NASSP Bulletin, 74(18). doi:10.1177/019263659007452305
Gustafson, C., & Crane, L. (2005). Polling your audience with wireless technology.
Journal of Extension, 43(6). Retrieved from
http://www.joe.org/joe/2005december/tt3.php
Hake, R. R. (1998). Interactive-engagement vs. traditional methods: A six-thousand-
student survey of mechanics test data for introductory physics courses. American
Journal of Physics, 66(1), 64–74. doi:10.1119/1.18809

125
Hall, R. H., Collier, H. L., Thomas, M., & Hilgers, M. G. (2005). A student response
system for increasing engagement, motivation, and learning in high enrollment
lectures. Paper presented at the 11th Americas Conference on Information
Systems, Omaha, Nebraska. Retrieved from
http://www.ctel.mst.edu/documents/hall_et_al_srs_amcis_proceedings.pdf
Harlow, J., Kushnir, L. P., Bank, C., Browning, S., Clark, J., Cordon, A., . . . Serbanescu,
P. (2008). What’s all the clicking about? A study of classroom response system
use at the University of Toronto. Retrieved from
http://www.upscale.utoronto.ca/PVB/Harrison/Clickers/Clickers_PVB.pdf
Harper, B. E. (2009). I‘ve never seen or heard it this way! Increasing student engagement
through the use of technology-enhanced feedback. Teaching Educational
Psychology, 3(3), 1–8. Retrieved from http://www.teachingeducpsych.org/recent-
issues-1/2009
Hodge, K. (2010). A study of problem-based learning content acquisition and academic
achievement in career and technical education courses at the middle-school level
(Doctoral dissertation). Retrieved from ProQuest Dissertations and Theses
database. (AAT 3409270)
Hoffman, C., & Goodwin, S. (2006). A clicker for your thoughts: Technology for active
learning. New Library World, 107(9/10), 422–433.
doi:10.1108/03074800610702606
Holmes, R. G., Blalock, J. S., Parker, M. H., & Haywood, V. B. (2006). Student accuracy
and evaluation of a computer-based audience response system. Journal of Dental

126
Education, 70(12), 1355–1361. Retrieved from
http://www.jdentaled.org/content/70/12/1355.full.pdf
Hoover, H. D., Dunbar, S. B., Frisbie, D. A., Oberley, K. R., Ordman, V. L., Naylor, G.
B., . . . Shannon, G. P. (2003). The Iowa tests: Guide to research and
development. Rolling, Meadows, IL: Riverside Publishing Company.
Hoover, H. D., Dunbar, S. B., Frisbie, D. A., Oberley, K. R., Bray, G. B., Naylor, R. J.,
. . . Qualls, A. L. (2006). The Iowa tests of basic skills: Complete/core battery.
2005 norms and score conversions. Form A: Levels 5–14. Rolling Meadows, IL:
Riverside Publishing Company.
Horowitz, H. M. (1998). Student response systems: Interactivity in a classroom
environment. Retrieved from
http://www4.uwm.edu/ltc/srs/faculty/docs/HorowitzIBMSRS.pdf
Huang, D. W., Diefes-Dux, H., Imbrie, P. K., Daku, B., & Kallimani, J. G. (2004).
Learning motivation evaluation for a computer-based instructional tutorial using
arcs model of motivational design. Paper presented at the 34th
Annual Frontiers in
Education Conference 2004, Savannah, GA. doi:10.1109/FIE.2004.1408466
Huang, W., Huang, W., Diefes-Dux, H., & Imbrie, P. K. (2006). A preliminary validation
of attention, relevance, confidence and satisfaction model-based instructional
material motivational survey in a computer-based tutorial setting. British Journal
of Educational Technology, 37(2), 243–259. doi:10.1111/j.1467-
8535.2005.00582.x
Huberty, C. J., & Olejnik, S. (2006). Applied MANOVA and discriminate analysis.
Hoboken, NJ: John Wiley and Sons.
127
Hudson, M., McGowan, L., & Smith, C. (2011). Technology and learner motivation in
library instruction: A study of personal response systems. Indiana Libraries,
30(1), 20–27. Retrieved from
http://journals.iupui.edu/index.php/IndianaLibraries/article/viewFile/1911/1822
Huett, J., Kalinowski, K. E., Moller, L., & Huett, K. (2008). Improving the motivation
and retention of online students through the use of ARCS-based e-mails.
American Journal of Distance Education, 22(3), 159–176.
doi:10.1080/08923640802224451
Indiana University. (2006). Comparison using the one-way ANOVA, GLM, and
regression. Retrieved from Indiana University, Stat/Math Center website:
http://www.indiana.edu/~statmath/stat/all/ttest/ttest6.html
Jackson, J. (2007). Audience or personal response systems (aka, ―clickers‖) — Tools or
toys? Science Education at the Crossroads. Retrieved from
http://www.sciedxroads.org/2007/JonJackson.pdf
Jackson, M., & Trees, A. R. (2003). Clicker implementation and assessment. Boulder,
CO: Information and Technology Services and Faculty Teaching Excellence
Program, University of Colorado. Retrieved from
http://comm.colorado.edu/mjackson/clickerreport.htm doesn‘t work
Jaemu, L., Kim, Y., & Lee, Y. (2008). A web-based program to motivate underachievers
learning number sense. International Journal of Instructional Media, 35(2), 185–
194.
Johnson, B., & Christensen, L. (2008). Educational research: Quantitative, qualitative,
and mixed approaches (3rd
ed.). Los Angeles: SAGE Publications, Inc.

128
Johnson, T., & Meckelborg, A. (2009). Student response systems: A cure for lecturalgia?
In J. Luca & E. Weippl (Eds.), Proceedings of World Conference on Educational
Multimedia, Hypermedia and Telecommunications 2008 (pp. 4709–4717).
Chesapeake, VA: AACE. Available from http://www.editlib.org/p/29042
Jones, M. E. (2009). The impact of collaborative and individualized student response
system pedagogy on learner motivation, metacognition, and transfer (Doctoral
dissertation). Retrieved from ProQuest Dissertations and Theses. (ATT 3356303)
Judson, E., & Sawada, D. (2002). Learning from past and present: Electronic response
systems in college lecture halls. Journal of Computers in Mathematics and
Science Teaching, 21(2), 167–181.
Judson, E., & Sawada, D. (2006). Audience response systems: Insipid contrivances or
inspiring tools? In D. Banks (Ed.), Audience Response Systems in Higher
Education: Applications and Cases (pp. 26–39). Hershey, PA: Information
Science Publishing. doi:10.4018/978-1-59140-947-2.ch002
Jumawan, F. V. (2011). Healthy plate: Consuming balanced meals as a nutritional
strategy to Type II diabetes prevention. Retrieved from
http://etec.hawaii.edu/proceedings/masters/2011/etec_jumawan.pdf
Kaleta, R., & Joosten, T. (2007). Student response systems: A University of Wisconsin
system study of clickers. EDUCAUSE Center for Applied Research (ECAR)
Research Bulletin, 2007(10), 2–12. Retrieved from
http://www.educause.edu/ECAR/StudentResponseSystemsAUnivers/157592

129
Kay, R. H. (2009). Examining gender differences in attitudes toward interactive
classroom communication systems (ICCS). Computers & Education, 52(4), 730–
740. doi:10.1016/j.compedu.2008.11.015
Kay, R., & Knaack, L. (2009). Exploring the use of audience response systems in
secondary school science classrooms. Journal of Science Education &
Technology, 18(5), 382–392. doi:10.1007/s10956-009-9153-7
Kay, R. H., & LaSage, A. (2009). Examining the benefits and challenges of using
audience response systems: A review of the literature. Computers & Education,
53(3), 819–827. doi:10.1016/j.compedu.2009.05.001
Keller, C., Finkelstein, K., Perkins, S., Pollock, C., Turpen, C., & Dubson, M. (2007).
Research-based practices for effective clicker use. In L. Hsu, C. Henderson, & L.
McCullough (Eds.), Proceedings of the 2007 Physics Education Research
Conference: Vol. 951 (pp. 128–131). Melville, NY: AIP Conference Proceedings.
doi:10.1063/1.2820913
Keller, J. M. (1984). The use of the ARCS model of motivation in teacher training. In K.
Shaw & A. J. Trott (Eds.), Aspects of educational technology Volume 17: Staff
development and career updating (pp. 140–145). London: Kogan Page.
Keller, J. M. (1987). Strategies for stimulating the motivation to learn. Performance &
Instruction, 26(8), 1–7. doi:10.1002/pfi.4160260802
Keller, J. M. (1997). Motivational design and multimedia: Beyond the novelty effect.
Strategic Human Resource Development Review, 1(1), 188–203.
Keller, J. M. (1999). Motivation in cyber learning environments. International Journal of
Educational Technology, 1(1), 7–30.

130
Keller, J. M. (2006a). What is the ARCS model? Retrieved from
http://www.arcsmodel.com/Mot%20dsgn%20A%20model.htm
Keller, J. M. (2006b). What is motivational design? Retrieved from
http://www.arcsmodel.com/Mot%20dsgn%20Mot%20dsgn.htm
Keller, J. M. (2008). First principles of motivation to learn and e3-learning. Distance
Education, 29(2), 175–185. doi:10.1080/01587910802154970
Keller, J. M. (2010a). Five fundamental requirements for motivation and volition in
technology-assisted distributed learning environments. Goiania, 35(2), 305–321.
doi:10.5216/ia.v35i2.12668
Keller, J. M. (2010b). Motivational design for learning and performance: The ARCS
model approach. New York, NY: Springer. doi:10.1007/978-1-4419-1250-3_3
Keller, J. M., & Suzuki, K. (2004). Learner motivation and e-learning design: A
multinationally validated process. Journal of Educational Media, 29(3), 229–239.
doi:10.1080/1358t65042000283084
Kelly, M. (2011). How budget cuts affect teachers. Retrieved from
http://712educators.about.com/od/issuesineducation/tp/teaching_budget_cuts.htm
Keong, M. W., & Pieng, G. C. (2008). E-learning – The use of audience response
technology (ART) via SMS in large lecture classes. [Special Issue]. International
Journal of the Computer, the Internet and Management, 16(SP3), 3.1–3.9.
Retrieved from http://www.ijcim.th.org/SpecialEditions/v16nSP3/v16nSP3.htm
Kim, C., & Keller, J. M. (2008). Effects of motivational and volitional email messages
(mvem) with personal messages on undergraduate students. British Journal of
Educational Technology, 39(1), 36–51. doi:10.1111/j.1467-8535.2007.00701.x

131
King, S. L. (2010). The effects of vocabulary instruction on reading improvement in a
middle school health education classroom (Doctoral dissertation). Retrieved from
ProQuest Dissertations and Theses database. (AAT 3427811)
King, S. O., & Robinson, C. L. (2009a). ‗Pretty lights‘ and math! Increasing student
engagement and enhancing learning through the use of electronic voting systems.
Computers in Education, 53(1), 189–199. doi:10.1016/j.compedu.2009.01.012
King, S. O., & Robinson, C. L. (2009b). Staff perspectives on the use of technology for
enabling formative assessment and automated student feedback. ITALICS, 8(2),
24–35.
King, S. O., & Robinson, C. L. (2009c). Formative teaching: A conversational
framework for evaluating the impact of response technology on student
experience, engagement, and achievement. Paper presented at the 39th Annual
Frontiers in Education (FIE) Conference, San Antonio, Texas.
doi:10.1109/FIE.2009.5350527
Kozma, R. B. (1991). Learning with media. Review of Educational Research, 61(2), 179–
211. doi:10.3102/00346543061002179
Lai, E. R., & Waltman, K. (2008). Test preparation: Examining teacher perceptions and
practices. Educational Measurement: Issues and Practice, 27(2), 28–45.
doi:10.1111/j.1745-3992.2008.00120.x
Lasry, N., & Findlay, J. (2007). Clickers in the classroom: Implementing peer instruction
in Cegep. Paper presented at the 30th Annual McGraw-Hill Ryerson National
Teaching, Learning, and Technology Conference: The Spirit of Inquiry –
Developing Critical Thinking, Creativity and Community, Montreal, Quebec.

132
Retrieved from
http://www.cdc.qc.ca/parea/786494_lasry_john_abbott_PAREA_2006.pdf
Lasry, N., Mazur, E., & Watkins, J. (2008). Peer instruction: From Harvard to the two-
year college. American Journal of Physics, 76(11), 1066–1069.
doi:10.1119/1.2978182
Latessa, R., & Mouw, D. (2005). Use of an audience response system to augment
interactive learning. Innovations in Family Medicine Education, 37(1), 12–14.
Retrieved from www.stfm.org/fmhub/fm2005/january/robyn12.pdf
Learning Domain. (2011). Multivariate analysis of variance (MANOVA): What are the
assumptions for using MANOVA? Retrieved from
http://www.learningdomain.com/Topic17-MANOVA2.html
Learning Theories Knowledgebase. (2009). Behaviorism. Retrieved from
http://www.learning-theories.com/behaviorism.html
Liao, H. C., & Wang, Y. H. (2008). Applying the ARCS motivation model in
technological and vocational education. Medical University Contemporary Issues
In Education Research, 1(2), 53–58. Retrieved from
http://journals.cluteonline.com/index.php/CIER/article/view/1202/1186
Lively, B. R. (2010). A study of the impact of the classroom performance system (CPS)
on fourth and fifth grade student social studies academic performance (Doctoral
dissertation). Retrieved from ProQuest Dissertations and Theses database. (ATT
3409895)
Lomen, D. O., & Robinson, M. K. (2004). Using ConcepTests in single and multivariable
calculus. Paper presented at the 16th Annual International Conference on

133
Technology in Collegiate Mathematics, Chicago, IL. Retrieved from
http://math.arizona.edu/~lomen/conceptests.html
Lucas, A. (2009). Using peer instruction and i-clickers to enhance student participation in
calculus. PRIMUS, 19(3), 219–231. doi:10.1080/10511970701643970
MacArthur, J. R., & Jones, L. L. (2008). A review of literature reports of clickers
applicable to college chemistry classrooms. Chemistry Education Research and
Practice, 9(3), 187–195. doi:10.1039/b812407h
MacGeorge, E. L., Homan, S. R., Dunning, J. B., Elmore, D., Bodie, G. D., Evans, E., . . .
Geddes, B. (2008). Student evaluation of audience response technology in large
lecture classes. Education Technology Research Development, 56(2), 125–145.
doi:10.1007/s11423-007-9053-6
Magnolia Consulting, LLC. (2008). Study Island scientific research base: July 15, 2008.
Retrieved from http://www.iaak.net/App_Content/Documents/SI%20
Foundational%20Report%207-25-08.pdf
Magnolia Consulting, LLC. (2011). Study Island scientific research base: October 5,
2011. Retrieved from
http://www.magnoliaconsulting.org/Study%20Island%20Foundational%20Report
Manzo, K. K. (2009). Student-response systems provide instant classroom feedback:
Clickers send student responses with the push of a button. Digital Directions:
Trends and Advice for K–12 Technology Leaders, 4. Retrieved from
http://www.edweek.org/dd/articles/2009/06/17/04feedback.h02.html
Mardia, K. V. (1970). Measures of multivariate skewness and kurtosis with applications.

134
Biometrika, 57(3), 519–530. doi:10.1093/biomet/57.3.519
Maricopa Community College. (n.d.). Survey limitations. Retrieved from
http://www.mcli.dist.maricopa.edu/proj/res_meth/rmvl/survey_limits.html
Martinez, J. F., Stecher, B., & Borko, H. (2009). Classroom assessment practices,
teacher judgments, and student achievement in mathematics: Evidence from the
ECLS. Educational Assessment, 14(2). doi:10.1080/10627190903039429
Martyn, M. (2007). Clickers in the classroom: An active learning approach. EDUCAUSE
Quarterly, 2, 71–74. Retrieved from
http://net.educause.edu/ir/library/pdf/EQM0729.pdf
May, V. (2007). Clickers at Dartmouth College. Retrieved from
http://74.125.47.132/search?q=cache:unw4PQPCXroJ:www.dartmouth.edu/~dcal/
resources/documents/Clickers%2520at%2520Dartmouth.doc+clickers+at+dartmo
uth+college&cd=1&hl=en&ct=clnk&gl=us
Mayer, R. E., Stull, A., DeLeeuw, K., Almeroth, K., Bimber, B., Chun, D., . . . Zhang, H.
(2009). Clickers in college classrooms: Fostering learning with questioning
methods in large lecture classes. Contemporary Educational Psychology,34(1),
51–57. doi:10.1016/j.cedpsych.2008.04.002
Mazur, E. (1997). Peer Instruction: A user's manual. New Jersey: Prentice Hall.
doi:10.1063/1.881735
Mazur, E. (2011). Mazur Group: Chaos in the classroom? Retrieved from
http://mazur.harvard.edu/research/detailspage.php?rowid=8
McDonald, J. H. (2009). Handbook of Biological Statistics (2nd ed.). Baltimore,
Maryland: Sparky House Publishing.

135
McLoughlin, E. (2008). Enhancing the learning environment using classroom response
systems. Paper presented at International Symposium for Engineering Education
2008, Dublin, Ireland. Retrieved from
http://www.ndlr.ie/mecheng/drupal/sites/all/download/isee08/papers/028_Enhanci
ng%20the%20learning%20environment%20using%20classroom%20response%2
0systems.pdf
McMillan, J. H. (2005). Understanding and improving teachers‘ classroom assessment
decision-making: Implications for theory and practice. Educational Measurement:
Issues and Practice, 22(4), 34–33. doi:10.1111/j.1745-3992.2003.tb00142.x
Means, T. B., Jonassen, D. H., & Dwyer, F. M. (1997). Enhancing relevance: Embedded
ARCS strategies vs. purpose. Educational Technology Research and
Development, 45(1), 5–18. doi:10.1007/BF02299610
Medina, M. S., Medina, P. J., Wanzer, D. S., Wilson, J. E., Er, N., & Britton, M. L.
(2008). Use of an audience response system (ARS) in a dual-campus classroom
environment. American Journal of Pharmaceutical Education, 72(2), 1–7.
doi:10.5688/aj720238
Merwin, J. C. (1982). Standardized tests: One tool for decision making in the classroom.
Educational Measurement: Issues and Practice, 1(1), 14–16.
Michael, J. (2006). Where‘s the evidence that active learning works? Advances in
Physiology Education, 30(4), 159–167. doi: 110.11 152/aa dvan.0 0053.22006
Miller, R. L., Santana-Vega, E., & Terrell, M. S. (2006). Can good questions and peer
discussion improve calculus instruction? PRIMUS, 16(3), 193–203.
doi:10.1080/10511970608984146

136
Montgomery, D. C. (2009). Design and analysis of experiments (7th
ed.). Hoboken, NJ:
Wiley.
Mora, G. (2010). Peer instruction and lecture tutorials equally improve student learning
in introductory geology classes. Journal of Geoscience Education, 58(5), 286–
297. doi:10.5408/1.3559693
Moredich, C., & Moore, E. (2007). Engaging students through the use of classroom
response systems. Nurse Educator, 32(3), 113–116.
doi:10.1097/01.NNE.0000270225.76661.74
Moss, P. A. (2003). Reconceptualizing validity for classroom assessment. Educational
Measurement: Issues and Practice, (22)4, 12–25. doi:10.1111/j.1745-
3992.2003.tb00140.x
Muhundan, A. (2005). Effects of using graphing calculators with a numerical approach
on students’ learning of limits and derivatives in an applied calculus course at a
community college (Doctoral dissertation). Retrieved from ProQuest Dissertations
and Theses database. (UMI Number: 3188424)
Muijs, D. (2011). Doing quantitative research in education with SPSS (2nd
ed.). London:
SAGE Publications.
Muller, D. A., Eklund, J., & Sharma, M. D. (2006). The future of multimedia learning:
Essential issues for research. Paper presented at the Australian Association for
Research in Education, Sydney, Australia. Retrieved from
http://www.aare.edu.au/05pap/mul05178.pdf

137
Musselman, M. R. (2008). A critical analysis of teaching with student response systems
in middle school classrooms (Doctoral dissertation). Retrieved from ProQuest
Dissertations and Theses database. (ATT 3342314)
Nelson, M. L., & Hauck, R. V. (2008). Clicking to learn: A case study of embedding
radio-frequency based clickers in an introductory management information
systems course. Journal of Information Systems Education, 19(1), 55–59.
Nicol, D. J., & Boyle, J. T. (2003). Peer instruction versus class-wide discussion in large
classes: A comparison of two interaction methods in the wired classroom. Studies
in Higher Education, 28(4), 458–473. doi:10.1080/0307507032000122297
Nightingale, J. P., Palumbo, A. K., & Donahue, J. F. (2008). The impact of personal
response systems on student learning in undergraduate business courses. 2008
ASCUE Proceedings, North Myrtle Beach, SC, 57–62. Retrieved from
http://www.ascue.org/files/proceedings/2008/p57.pdf
No Child Left Behind (NCLB) Act of 2001, Pub. L. No. 107-110, § 115, Stat. 1425
(2002).
Ohio State University. (2008, July 18). Students who use ‗clickers‘ score better on
physics tests. ScienceDaily. Retrieved from
http://www.sciencedaily.com/releases/2008/07/080717092033.htm
Owens, A. M. (2009). Do your teachers need a personal trainer? Learning & Leading
with Technology. Retrieved from http://www.eric.ed.gov:80/PDFS/EJ842797.pdf
Palak, D., & Walls, R. T. (2009). Teacher‘s beliefs and technology practices: A mixed-
methods approach. Journal of Research on Technology in Education, 41(4), 417–
441.

138
Parr, A. M. (2006). Teacher made test reliability: a comparison of test scores and student
study habits from Friday to Monday in a high school biology class in Monroe
County, Ohio. Retrieved from
http://etd.ohiolink.edu/view.cgi?acc_num=marietta1142864088
Paschal, C. B. (2002). Formative assessment in physiology teaching using a wireless
communication system. Advances in Physiology Education, 26(4), 299–308.
Penuel, W. R., Abrahamson, A. L., & Roschelle, J. (2006). Theorizing the transformed
classroom: A sociocultural interpretation of the effects of audience response
systems in higher education. In D. Banks (Ed.), Audience response systems in
higher education: Applications and cases (pp. 187–208). Hershey, PA:
Information Science Publishing. doi:10.4018/9781591409472.ch013
Penuel, W. R., Boscardin, C. K., Masyn, K., & Crawford, V. (2007). Teaching with
student response systems in elementary and secondary education settings: A
survey study. Educational Technology Research and Development, 55(4),
315–346. doi:10.1007/s11423-006-9023-4
Perez, K. E., Strauss, E. A., Downey, N., Galbraith, A., Jeanne, R., & Cooper, S. (2010).
Does displaying the class results affect student discussion during peer instruction?
CBE—Life Sciences Education, 9(2), 133–140. doi:10.1187/cbe.09–11–0080
Pittenger, A., & Doering, A. (2010). Influence of motivational design on completion rates
in online self-study pharmacy-content courses. Distance Education, 31(3), 275–
293. doi:10.1080/01587919.2010.513953
Poirier, C. R., & Feldman, R. S. (2007). Promoting active learning using individual
response technology in large introductory psychology classes. Teaching of
139
Psychology, 34(3), 194–196. doi:10.1080/00986280701498665
Popham, W. J. (2002). Classroom assessment: What teachers need to know. Journal of
Educational Measurement, 39(1), 85–90.
Prather, E. E., & Brissenden, G. (2009). Clickers as data gathering tools and students‘
attitudes, motivations, and beliefs on their use in this application. Astronomy
Education Review, 8(1). doi:10.3847/AER2009004
Prensky, M. (2008). Turning on the lights. Educational Leadership, 65(6), 40–45.
Preszler, R. W., Dawe, A., Shuster, C. B., & Shuster, M. (2006). Assessment of the
effects of student response systems on student learning and attitudes over a broad
range of biology courses. CBE—Life Sciences Education, 6(1), 29–41.
doi:10.1187/cbe.06-09-0190
Pritchard, D. (2006). The use of ―clicker‖ technology to enhance the teaching/learning
experience. Retrieved from http://hedc.otago.ac.nz/hedc/asd/Digital-
ResourcesforyourTeaching/mainParagraphs/012/document/ClickersReport.pdf
Radosevich, D. J., Salomon, R., Radosevich, D. M., & Kahn, P. (2008). Using student
response systems to increase motivation, learning, and knowledge retention.
Innovate Journal of Online Education, 5(1). Retrieved from
http://www.innovateonline.info/index.php?view=article&id=449
Rao, S. P., Collins, H. L., & DiCarlo, S. E. (2002). Collaborative testing enhances student
learning. Advances in Physiology Education, 26, 37–41.
Rao, S. P., & DiCarlo, S. E. (2000). Peer instruction improves performance on quizzes.
Advances in Physiology Education, 24, 51–55.
140
Ravid, R. (2006). An overview of testing. Unpublished manuscript, Department of
Educational Foundations and Inquiry, National Louis University, Chicago, IL.
Ravid, R. (2009). Assessment in K–12 education. Unpublished manuscript, Department
of Educational Foundations and Inquiry, National Louis University, Chicago, IL.
Rich, P. (2007). The current state of instructional technology. In M. K. Barbour & M.
Orey (Eds.), The Foundations of Instructional Technology. Retrieved from
http://projects.coe.uga.edu/ITFoundations/index.php?title=The_Current_State_of
_Instructional_Technology
Rigdon, J. (2010). The effect of student response systems in middle school math
classrooms (Doctoral dissertation). Retrieved from ProQuest Dissertations and
Theses database. (ATT 3403489)
Rockinson-Szapkiw, A. J., Holder, D. E., & Dunn, R. (2011). Motivating students to
learn: Is there a difference between traditional books and e-Books? Retrieved
from http://digitalcommons.liberty.edu/educ_fac_pubs/185/
Roush, C., & Song, L. (2011). The impact of using clickers technology on classroom
instruction: Students‘ and teachers‘ perspectives. In M. Koehler & P. Mishra
(Eds.), Proceedings of Society for Information Technology & Teacher Education
International Conference 2011 (pp. 2674–2677). Chesapeake, VA: AACE.
Available from http://www.editlib.org/p/36718
Rubner, G. (2011). Mobile phone-based classroom response system. In T. Bastiaens &
M. Ebner (Eds.), Proceedings of World Conference on Educational Multimedia,
Hypermedia and Telecommunications 2011 (p. 2539). Chesapeake, VA: AACE.
Available from http://www.editlib.org/p/38216

141
Salkind, N. J. (2007). Statistics for people who (think they) hate statistics: The Excel
edition. Thousand Oaks, CA: Sage Publications, Inc.
Salmon, T. P., & Stahl, J. P. (2005). Wireless audience response system: Does it make a
difference? Journal of Extension, 43(3). Retrieved from
http://www.joe.org/joe/2005june/rb10p.shtml
Sartori, T. M. (2008). An empirical investigation of electronic student response systems
in a K–12 school district: The relationship of ongoing assessment on student
achievement (Doctoral dissertation). Retrieved from ProQuest Dissertations and
Theses database. (UMI 3310871).
Schlechty, P. (2002). Working on the work: An action plan for teachers, principals, and
superintendents. San Francisco: Jossey-Bass.
Schmuller, J. (2009). Statistical analysis with Excel for dummies (2nd
ed.). Hoboken, NJ:
Wiley.
Schrum, L., Thompson, A., Maddux, C., Sprague, D., Bull, G., & Bell, L. (2007).
Editorial: Research on the effectiveness of technology in schools. The roles of
pedagogy and content. Contemporary Issues in Technology and Teacher
Education, 7(1). Retrieved from
http://www.citejournal.org/vol7/iss1/editorial/article1.cfm
Shirley, M. L. (2009). A model of formative assessment practice in secondary science
classrooms using an audience response system (Doctoral dissertation). Retrieved
from ProQuest Dissertations and Theses database. (UMI 3375899)
Silliman, S. E., & McWilliams, L. (2004). Observations on benefits/limitations of an
audience response system. Proceedings of the 2004 American Society for

142
Engineering Annual Conference and Exposition, Salt Lake City, Utah, 2531.
Retrieved from http:// soa.asee.org/paper/conference/paper-view.cfm?id=19658
Simpson, V., & Oliver, M. (2007). Electronic voting systems for lectures then and now:
A comparison of research and practice. Australasian Journal of Educational
Technology, 23(2), 187–208.
Skiba, D. J., & Barton, A. J. (2006). Adapting your teaching to accommodate the net
generation of learners. The Online Journal of Issues in Nursing, 11(2). Manuscript
4. doi:10.3912/OJIN.Vol11No02Man04
Slavin, A., & Shiell, R. (2008). Using clickers to enhance student participation. Teaching
at Trent, 11(1), 1–4. Retrieved from
http://www.trentu.ca/idc/documents/Fall2008Issue1.pdf
Small, R. V. (2006). Designing motivation into library and information skills instruction.
American Library Association. Retrieved from
http://www.ala.org/ala/mgrps/divs/aasl/aaslpubsandjournals/slmrb/slmrcontents/v
olume11998slmqo/small.cfm
Small, R. V., & Gluck, M. (1994). The relationship of motivational conditions to
effective instructional attributes: A magnitude scaling approach. Educational
Technology, 34(8), 33–40.
Smith, M. K., Wood, W. B., Adams, W. K., Wieman, C., Knight, J. K., Guild, N., & Su,
T. T. (2009). Why peer discussion improves student performance on in-class
concept questions. Science, 323(5910), 122-124. doi: 10.1126/science.1165919
Smith, M. K., Wood, W. B., Krauter, K., & Knight, J. K. (2011). Combining peer
discussion with instructor explanation increases student learning from in-class

143
concept questions. Cellbioed (10)1, 55–63. doi:10.1187/cbe.10-08-0101
Stowell, J. R., & Nelson, J. M. (2007). Benefits of electronic audience response systems
on student participation, learning, and emotion. Teaching of Psychology, 34(4),
253–258. doi:10.1080/00986280701700391
Study Island. (2011). Study island. Retrieved from http://www.studyisland.com/
Su, T. T. (2009). Why peer discussion improves student performance on in-class concept
questions. Science, 323(5910), 122–124. doi:10.1126/science.1165919
Sullivan, R. (2009). Principles for constructing good clicker questions: Going beyond
rote learning and stimulating active engagement with course content. Journal of
Educational Technology Systems, 37(3), 335–347. doi:10.2190/ET.37.3.i
Swain, S. D., Weathers, D., & Neidrich, R. W. (2008). Assessing three sources of
misresponse to reversed Likert items. Journal of Marketing Research, 24(1),
116-131. doi:10.1509/jmkr.45.1.116
Sytsma, R. (n.d.). Factor analytic results from a semantic differential on the construct
optimism. Retrieved from http://www.gifted.uconn.edu/oht/faoptim.html
Tabachnick, B. G., & Fidell, L. S. (2007). Using multivariate statistics (5th
ed.). Boston:
Pearson.
Thomsen, N. R. (2006). Integrating the use of classroom performance systems in the
elementary classroom. (Unpublished master‘s thesis). Emporia State University,
Emporia, KS.
Trees, A. R., & Jackson, M. H. (2007). The learning environment in clicker classrooms:
Student processes of learning and involvement in large university-level courses

144
using student response systems. Learning, Media, and Technology, 32(1), 21–40.
doi:10.1080/17439880601141179
Trotter, A. (2005). Technology turns test-prep into clicking experience. Education Week,
24(36), 8–9.
Turpen, C., & Finkelstein, N. (2007). Understanding how physics faculty use peer
instruction. In L. Hsu, C. Henderson, & L. McCullough (Eds.), Proceedings for
the Physics Education Research Conference: Vol. 951, (pp. 204–207). Melville,
NY: AIP Conference Proceedings. doi:10.1063/1.2820934
University of Houston. (2008, March 25). College students score higher in classes that
incorporate instructional technology than in traditional classes. ScienceDaily.
Retrieved from http://www.sciencedaily.com/releases/2008/03/08032412515.htm
University of Saskatchewan. (2009). Survey tool-limitations.
Retrieved from
http://www.usask.ca/its/services/websurvey_tool/limitations.php
University of Texas at Austin. (2008). Disadvantages of online surveys. Retrieved
from http://www.utexas.edu/learn/surveys/disadvantages.html
Van Dijk, L. A., Van den Ber, G. C., & Van Keulen, H. (2001). Interactive lectures in
engineering education. European Journal of Engineering Education, 26(1), 15–
18. doi:10.1080/03043790123124
Visser, J., & Keller, J. M. (1990). The clinical use of motivational messages: An inquiry
into the validity of the ARCS model of motivational design. Instructional Science,
19(6), 467–500. doi:10.1007/BF00119391

145
Walton, A., Homan, S., Naimi, L., & Tomovic, C. (2008). Student perceptions of a
wireless audience response system. Interactive Technology and Smart Education,
5(4), 217–229. doi:10.1108/17415650810930901
Whelan, T. J. (2008). Antecedents of anonymity perceptions in Web-based surveys. Paper
presented at the 23rd annual meeting of the Society for Industrial and
Organizational Psychology, San Francisco, CA.
Wheeler, M., Renchler, R., Conley, K., & Summerlight, S. (Eds.). (2000). National
educational technology standards for students: Connecting curriculum and
technology. Eugene, OR: International Society for Technology in Education
(ISTE). Retrieved from ERIC database. (ED473132)
Wieman, C., & Perkins, K. (2005). Transforming physics education. Physics Today,
58(11), 36–41. doi:10.1063/1.2155756
Williams, M. W. (2009). Comparison of fifth-grade students’ mathematics as evidenced
by Georgia’s criterion-referenced competency test: Traditional and
departmentalized settings (Doctoral dissertation). Retrieved from
http://digitalcommons.liberty.edu/doctoral/139/
Wit, E. (2003). Who wants to be …The use of a personal response system in statistics
teaching. MSOR Connections, 3(2), 14–20. Retrieved from
http://www.mathstore.ac.uk/newsletter/may2003/pdf/whowants.pdf
Wood, W. B. (2004). Clickers: A teaching gimmick that works. Developmental Cell,
7(7), 796–798. doi:10.1016/S1534-5807(04)00414-9
146
Wrench, J. S., Thomas-Maddox, C., Richmond, V. P., & McCroskey, J. C. (2008).
Quantitative research methods for communication: A hands-on approach. New
York, NY: Oxford University Press.
Wu, X. L. (2009). Chapter 7 analysis of variance. Retrieved from
http://brainimaging.waisman.wisc.edu/~perlman/R/Chapter%20seven%20%20An
alysis%20of%20Variance.pdf
Yang, J. C., Huang, Y. T., Tsai, C. C., Chung, C. I., & Wu, Y. C. (2009). An automatic
multimedia content summarization system for video recommendation. Journal of
Educational Technology & Society, 12(1), 49–61.
Zahner, K. (2011). Using clickers to increase student motivation and performance 2.
Retrieved from http://www.mpsaz.org/clickers/calendar/event/259175/
Zhang, G. (2009). t-Test: The good, the bad, the ugly, and the remedy. The Middle
Grades Research Journal, 4(2), 25–34.
Zhu, E. (2007). Teaching with clickers. Center for Research on Learning and Teaching
Occasional Papers, 22, 1–8.
Ziljstra, W. (2004). Comparing the student's t and the ANOVA contrast procedure with
five alternative procedures. (Unpublished master‘s thesis). University of
Groningen, Groningen, Netherlands. Retrieved from
http://www.ppsw.rug.nl/~kiers/ReportZijlstra.pdf

147
APPENDIX A: UNIT 7 POSTTEST–SYSTEM OF EQUATIONS AND
INEQUALITIES
Student Name: _____________________________ Date: _____________________
Directions: Please read each question carefully to make sure you use the appropriate
method to solve each question. Each question answered correctly will be worth 10 points
each. Be sure to show your all your work on the test paper. Partial credit will be given
based on work shown.

148

149

150

151

152

153

154
APPENDIX B: EXPERT VALIDATION OF UNIT 7 POSTTEST–SYSTEMS OF
EQUATIONS AND INEQUALITIES
ALGEBRA
Students will use linear algebra to represent, analyze and solve problems. They will use
equations, tables, and graphs to investigate linear relations and functions, paying
particular attention to slope as a rate of change.
M8A5. Students will understand systems of linear equations and inequalities and
use them to solve problems.
a. Given a problem context, write an appropriate system of linear equations or
inequalities
b. Solve systems of equations graphically and algebraically, using technology as
appropriate.
c. Graph the solution set of a system of linear inequalities in two variables.
d. Interpret solutions in problem contexts.
Directions: Based upon the attached teacher-made test, please answer the following
questions:
Question Number of
Yes Responses
Number of No
Responses
Comments/ Suggestions
Percentage of Yes Responses
Does the test have clear, complete directions? 11 0 100%
Do the test questions measure the specific elements of the math standards listed? 10 1 90.91%
Do the test questions use the language of the standard? 11 0 100%
Is an adequate number of questions included per element for this standard? 10 1 90.91%
Do you think the level of the test is appropriate? 10 1
Not difficult enough 90.91%
Do you think that students will have sufficient time to complete this test in a 50 to 60 minute class time? 11 0 100%

155
APPENDIX C: TABLE OF SPECIFICATIONS FOR POSTTEST
TABLE OF SPECIFICATIONS FOR 8TH GRADE MATH
UNIT 7 POSTTEST
8th Grade GPS Standards and Elements Pretest/Posttest Question(s) Correlations
M8A5
Students will understand systems of linear equations and inequalities and use them to solve problems.
a. Given a problem context, write an appropriate system of linear equations or inequalities.
#6, 9
b. Solve systems of equations graphically and algebraically, using technology as appropriate.
#1, 2, 5, 7, 10
c. Graph the solution set of a system of linear inequalities in two variables.
#3, 8
d. Interpret solutions in problem contexts.
#4, 6, 9

156
APPENDIX D: EDUCATOR QUALIFICATIONS FOR VALIDATION OF 7TH
GRADE MATH POSTTEST
Educator Position(s) Held Years in
Position(s)
Degree(s) Held Certifications/
Endorsements
1 7th
Grade Math Teacher 16 BS; MEd; EdS
Middle Grades
Math/Science
8th
Grade Math Teacher 1
7th
Grade Math/Science
teacher
2
6th
Grade Science
Teacher
3
2 High School Math
Teacher
31 BS; MEd
Mathematics
Leadership
Certification
Gifted Program
Coordinator
4 EdS
Teaching and
Learning
Gifted
Endorsement
8th
Grade Math Teacher 4
3 Middle School
Assistant Principal
1 BS
Agricultural
Economics
Leadership
Certification
Middle School
Math/Science Teacher
8 MPA
Public
Administration
EdS
Curriculum and
Instruction
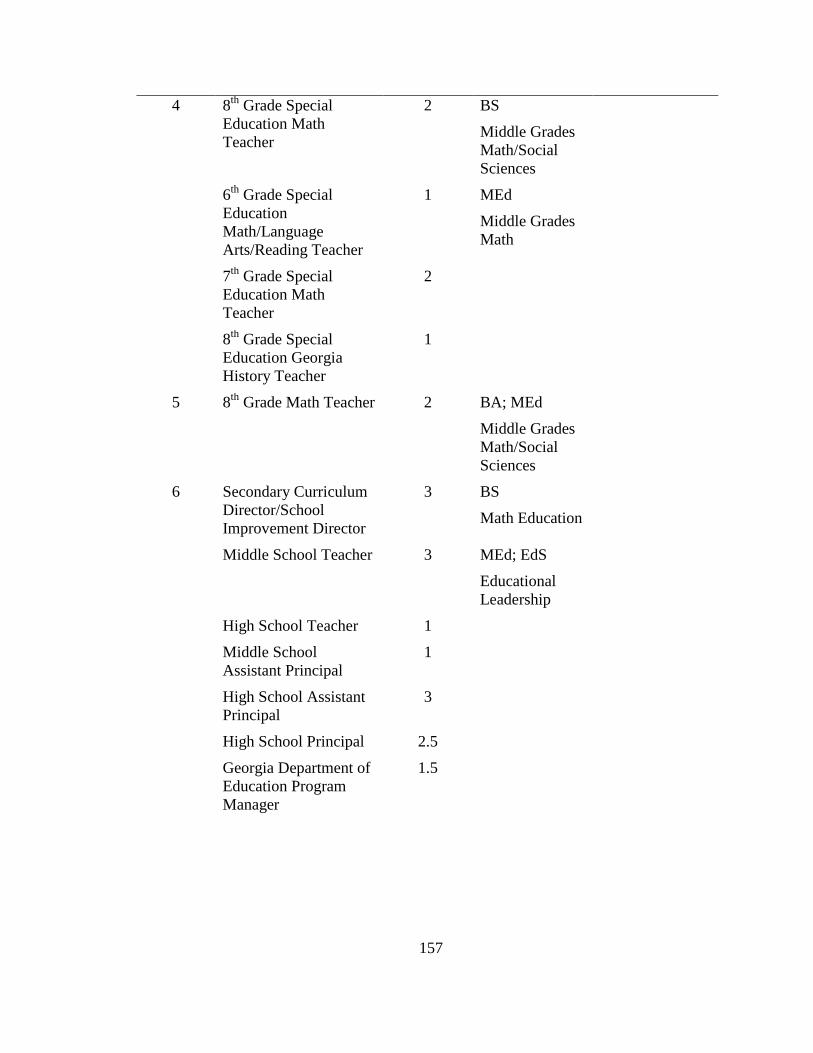
157
4 8th
Grade Special
Education Math
Teacher
2 BS
Middle Grades
Math/Social
Sciences
6th
Grade Special
Education
Math/Language
Arts/Reading Teacher
1 MEd
Middle Grades
Math
7th
Grade Special
Education Math
Teacher
2
8th
Grade Special
Education Georgia
History Teacher
1
5 8th
Grade Math Teacher 2 BA; MEd
Middle Grades
Math/Social
Sciences
6 Secondary Curriculum
Director/School
Improvement Director
3 BS
Math Education
Middle School Teacher 3 MEd; EdS
Educational
Leadership
High School Teacher 1
Middle School
Assistant Principal
1
High School Assistant
Principal
3
High School Principal 2.5
Georgia Department of
Education Program
Manager
1.5

158
7 6th
–8th
Grade Middle
School ESOL
Math/Language Arts
Teacher
3 BA; MBA
Business
Administration
K–12 ESOL
Certification
Elementary Teacher 7 MAT
Middle Grades
K–5 Elementary
Certification
ESL Adult Education
Instructor
10 EdS
Curriculum and
Instruction
6–12 Broad-field
Social Sciences
Certification
8 8th
Grade Middle
School Math Teacher
15 BS; MEd
Middle Grades
Math/Science
6th
Grade Math/Science
Teacher
4 EdS
Instructional
Design/
Technology/
Curriculum
6th
Grade Social
Studies/Science
Teacher
1
9 6th
–8th
Grade Math
Teacher-Gifted
4 BS; MEd
Middle Grades
Math
Gifted
Endorsement
7th
–8th
Grade Language
Arts Teacher-Gifted
2
10 7th
Grade Middle
School Math Teacher
23 BA
Middle Grades
Math/ Language
Arts
5th
Grade Elementary
Teacher
2 MEd
Middle Grades
Math/Reading/
Language Arts

159
APPENDIX E: SAMPLE MOTIVATION SURVEY–INSTRUCTIONAL
MATERIALS MOTIVATION SURVEY (IMMS)

160
APPENDIX F: APPROVAL EMAIL FROM IMMS AUTHOR, JOHN KELLER,
TO USE/MODIFY IMMS SURVEY

161
APPENDIX G: APPROVAL BY SCHOOL SYSTEM SUPERINTENDENT TO
CONDUCT RESEARCH
March 2, 2011 To Whom It May Concern: I (name removed) grant permission to allow Tracy Allison to conduct a quantitative study examining the impact of a classroom performance system and the use of peer instruction upon student achievement and student motivation of middle school students to be conducted at (name removed). I understand that the information gathered would be for research purposes only, and the identity and identifying information of all participants will be kept confidential. Sincerely. (name removed)

162
APPENDIX H: APPROVAL BY SCHOOL PRINCIPAL TO CONDUCT
RESEARCH
March 2, 2011 To Whom It May Concern: I (name removed) grant permission to allow Tracy Allison to conduct a quantitative study examining the impact of a classroom performance system and the use of peer instruction upon student achievement and student motivation of middle school students to be conducted at (name removed). I understand that the information gathered would be for research purposes only, and the identity and identifying information of all participants will be kept confidential. Sincerely, (Name removed)

163
APPENDIX I: INSTITUTIONAL REVIEW BOARD APPROVAL

164
APPENDIX J: ADULT PARTICIPANT CONSENT FORM-ENGLISH
You are being asked to participate in a project as a doctoral class assignment under the direction
of Dr. Randall S. Dunn and conducted through Liberty University. The University in accordance
with its policy regarding the Protection of Human Research Subjects asks that you give your
signed agreement to participate in this project. Please ask the doctoral student researcher, Tracy
M. Allison, any questions you have to help you understand this research project. A basic
explanation of the research is given below.
The researcher intends to investigate the impact of the implementation of a Classroom
Performance System (CPS) with Peer Instruction in the middle school classroom on student
achievement as well as to gather perceptions and assess motivation of students using such
technology and pedagogy. The researcher will ask you to create and administer an expert-
validated pre- and post end-of-unit assessment, use CPS two times per week during the four-week
unit of study, and to administer two online student surveys at the end of the unit. The evaluation
of the research proposal will include pre- and post-data compilation and interpretation and
scheduled surveys after parent permission is obtained.
Your name will remain confidential at all times. You will not be identified in the research report.
Liberty University is an equal opportunity educational institution. It is not the intent of the
institution to discriminate against any person based on sex, race, religion, color, national origin or
handicap of the individual.
Questions regarding the conduct of this research may be directed to me, Tracy M. Allison, at
(706) 778-7121 or at my email address [email protected] or my dissertation committee chair,
Dr. Randall S. Dunn at 1-800-424-9595 or email him at [email protected].
Refusal to participate in this study will have no effect on any future services you may be entitled
to from the school system. Should you agree to participate in this study and decide later that you
wish to withdraw, you will be free to withdraw from the study at any time without penalty. If you
agree to participate at this time, please sign and date this statement. You may keep a copy of this
consent form for your records. Thank you very much for your willingness to participate in this
research project.
Teacher Name (printed): ______________________________________________________
Teacher Signature: _____________________________________ Date: _______________
School Administrator Signature: __________________________ Date: _______________
Copy on File
© Allison & Zahner, 2004. Permission to use granted.

165
APPENDIX K: STUDENT PARTICIPANT CONSENT FORM-ENGLISH
Introduction: You child is being asked to participate in a research project as a doctoral class
assignment under the direction of Dr. Randall S. Dunn and conducted through Liberty University.
The University in accordance with its policy regarding the Protection of Human Research
Subjects asks that you give your signed agreement to participate in this project. The researcher
intends to examine the impact of the implementation of Classroom Performance System (CPS)
technology, also commonly referred to as ‗clickers‘, with a research based-pedagogy, Peer
Instruction, in 8th grade math classes upon student achievement and to assess student motivation
using such technology and pedagogy. The researcher will not be directly involved in the research
process. Your child was selected as a possible participant because he/she may fit the criteria for
this study (i.e. middle school math student) and he/she is enrolled in an 8th grade math class
whose teacher will be participating in a research project in order to facilitate a candidate in the
SOE dissertation process. This informed consent outlines the facts, implications, and
consequences of the research study. A basic explanation of the procedures for the research is
given below.
Inquiries: Please ask the doctoral student researcher, Tracy M. Allison, any questions you have
to help you understand this research project. The researcher will gladly answer any inquiries
regarding the purpose and procedures of the present study. Inquiries or questions regarding this
research may be directed to me, Tracy M. Allison, at (706) 778-7121 or at my email address
[email protected] or my instructor, Dr. Randall S. Dunn, at 1-800-424-9595, or email him at
[email protected]. If you or your parents have any questions about rights or this form, please
email the current IRB chair for Liberty University, Dr. Fernando Garzon, at [email protected].
Liberty University is an equal opportunity educational institution. It is not the intent of the
institution to discriminate against any person based on sex, race, religion, color, national origin or
handicap of the individual.
Procedures: Your child‘s teacher will create and administer an expert-validated pre- and post
end-of-unit assessment over the standards taught in one unit of math instruction. The teacher will
use clickers two times per week during the four-week unit of study. At the end of the unit, your
child will be asked to complete an online student survey consisting of approximately 36 questions
including questions about demographics and student motivation about the implementation of
clickers with or without Peer Instruction into the 8th grade math classroom. The length of time
needed to complete the online survey is estimated to be approximately 20 minutes of class time.
The evaluation of the research proposal will include pre- and post-data compilation and
interpretation and scheduled survey after parent permission is obtained. Participation will be
anonymous and voluntary.
Untried/ Risks: The researcher will use multiple-choice questions based upon a previously used
survey instrument regarding clicker and/or peer instruction for students at the college level but
which may have not been used previously with middle school students. The study may involve
risks to the participant, which are currently unforeseeable.
Benefits: Participants may benefit from increased understanding of the use of clickers using a
research-based pedagogy. The potential publication of the findings of this study may prove
beneficial to students, faculty, and higher education administrators as they seek to proactively

166
improve the use of technology along with a specific pedagogy in order to increase student
achievement, student perceptions, and student motivation of middle school math students.
Compensation: Participants will not receive compensation for participation.
Participation: Refusal to participate in this study will have no effect on your grade or any future
services you may be entitled to from the school system. Should you agree to participate in this
study and decide later that you wish to withdraw, you will be free to withdraw from the study at
any time without penalty. If you agree to participate at this time, please sign and date this
statement. You may keep a copy of this consent form for your records. Thank you very much for
your willingness to participate in this research project.
Confidentiality: The researcher will take precautions to protect participant identity by not using
the names of participants or a specific class period in her results or writing. However, since this
study is limited to students in one of two middle schools in one school system, the identities of
the participants could be inferred. The survey will be located on a secure online server. Data is
stored on the server and is kept in a password-protected database. It is conceivable that
engineering staff at the web hosting company may need to access the database for maintenance
reasons and research assistants may also access data when collecting and analyzing data. The
information will be stored on the survey site for the duration of three years and will then be
deleted by the researcher. The researchers will store all research documentation on a password-
protected portable hard drive for the duration of three years and will then delete the
documentation from the computer database. Any hard copies of the data will be stored in a
locked filing cabinet and shredded at the end of three years.
Statement of Consent: South Habersham Middle School and Liberty University, their agents,
trustees, administrators, faculty, and staff are released from all claims, damages, or suits, not
limited to those based upon or related to any adverse effect upon you which may arise during or
develop in the future as a result of my participation in this research. (Please understand that this
release of liability is binding upon you, your heirs, executors, administrators, personal
representatives, and anyone else who might make a claim through or under you.)
------------------------------------------------------------------------------------------------------------
Student Name (printed): __________________________________________________
Student Signature: _________________________________ Date: _______________
Parent Signature: __________________________________ Date: _______________

167
APPENDIX L: STUDENT PARTICIPATION CONSENT FORM-SPANISH
Introducción: Su hijo está siendo invitado a participar en un proyecto de investigación como una
tarea de clase doctoral bajo la dirección del Dr. Randall S. Dunn y llevó a cabo a través de
Liberty University. La Universidad de conformidad con su política de Protección de Sujetos
Humanos de Investigación le pide que dé su acuerdo firmado para participar en este proyecto. El
investigador tiene la intención de examinar el impacto de la aplicación del Aula del rendimiento
del sistema (CPS) de tecnología, también se conoce comúnmente como "clickers", con una
investigación basada en la pedagogía, Peer Instrucción, en el 8 o grado de las clases de
matemáticas a los logros de los estudiantes y para evaluar estudiantes motivación utilizando dicha
tecnología y la pedagogía. El investigador no estará directamente involucrado en el proceso de
investigación. Su hijo ha sido seleccionada como participante posible porque él / ella puede
cumplir los criterios para este estudio (es decir, los estudiantes de matemática de la escuela) y él /
ella se inscribió en una clase de matemáticas de 8 o grado cuyo maestro estará participando en un
proyecto de investigación con el fin de facilitar un candidato en el proceso de tesis de SOE. Este
consentimiento informado se expondrán los hechos, las implicaciones y consecuencias de la
investigación. Una explicación básica de los procedimientos de la investigación se da a
continuación.
Preguntas: Por favor, pregunte el investigador doctorando, Tracy M. Allison, cualquier duda que
tenga para ayudar a entender este proyecto de investigación. El investigador estará encantado de
contestar cualquier pregunta sobre el propósito y los procedimientos del presente estudio.
Cualquier pregunta o preguntas con respecto a esta investigación podría ser dirigida a mí, Tracy
M. Allison, en el (706) 778-7121 o en mi [email protected] dirección de correo electrónico o
mi instructor, el Dr. Randall S. Dunn, al 1-800-424-9595, o email él en [email protected]. Si
usted o sus padres tiene alguna pregunta acerca de los derechos o la forma de este, por favor
escriba el actual presidente del IRB para la Libertad de la Universidad, el Dr. Fernando Garzón,
Liberty University es una institución de igualdad de oportunidad educativa. No es la intención de
la institución de discriminar contra cualquier persona por razón de sexo, raza, religión, color,
origen nacional o discapacidad del individuo.
Procedimiento: El maestro de su niño va a crear y administrar un experto validados antes y
después de la evaluación al final de su unidad sobre los estándares enseñados en una unidad de
enseñanza de las matemáticas. El maestro se usarán contadores dos veces por semana durante la
unidad de cuatro semanas de estudio. Al final de la unidad, su hijo tendrá que completar una
encuesta de estudiantes en línea que consiste en aproximadamente 36 preguntas que podrán
incluir preguntas sobre la demografía y la motivación de los estudiantes sobre la aplicación de
clickers con o sin el par de instrucciones en el aula de matemáticas de 8 o grado. El tiempo
necesario para completar
la encuesta en línea se estima en aproximadamente 20 minutos de tiempo de clase. La
evaluación de la propuesta de investigación se incluyen pre-y post-compilación e interpretación
de datos y la encuesta programada después de permiso de los padres se obtiene. La participación
será voluntaria y anónima.
Espera de juicio / Riesgos: El investigador utilizará preguntas de opción múltiple basadas en un
instrumento de encuesta utilizado anteriormente en relación clicker y / o instrucción entre pares

168
para estudiantes a nivel universitario, pero que no puede haber sido utilizado previamente con los
estudiantes de escuela intermedia. El estudio puede implicar riesgos para el participante, que
actualmente son imprevisibles.
Beneficios: Los participantes podrán beneficiarse de una mayor comprensión de la utilización de
clickers usando una pedagogía basada en la investigación. La posible publicación de los
resultados de este estudio pueden resultar beneficiosos para los estudiantes, profesores y
administradores de la educación superior en sus esfuerzos por mejorar de forma dinámica el uso
de la tecnología, junto con una pedagogía específica para aumentar el rendimiento estudiantil, las
percepciones de los estudiantes, y la motivación de los estudiantes de estudiantes de secundaria
de matemáticas.
Retribución: Los participantes no recibirán compensación por la participación.
Participación: La negativa a participar en este estudio no tendrá ningún efecto en su grado o
cualquier servicio futuro que puede tener derecho a la del sistema escolar. Si usted de acuerdo en
participar en este estudio y más tarde decide que desea retirar, usted tendrá la libertad de retirarse
del estudio en cualquier momento sin penalización. Si usted acepta participar en este momento,
por favor, firmar y fechar la declaración de este. Usted puede guardar una copia de este
formulario de consentimiento para su archivo. Muchas gracias por su disposición a participar en
este proyecto de investigación.
Confidencialidad: El investigador tomará las precauciones necesarias para proteger la identidad
de los participantes por no usar los nombres de los participantes o de un período de clases
específicas en sus resultados o la escritura. Sin embargo, ya que este estudio se limita a los
estudiantes en una de las dos escuelas intermedias en el sistema escolar, la identidad de los
participantes podría ser deducido. La encuesta se encuentra en un servidor en línea seguro. Los
datos se almacenan en el servidor y se guarda en una base de datos protegida por contraseña. Es
concebible que el personal de ingeniería de la empresa de alojamiento web puede ser necesario
para acceder a la base de datos por razones de mantenimiento y asistentes de investigación
también pueden acceder a los datos en la recopilación y análisis de datos. La información se
almacena en el sitio de la encuesta de la duración de tres años y luego será eliminado por el
investigador. Los investigadores se almacenará toda la documentación de la investigación en una
protegida por contraseña disco duro portátil para la duración de tres años y luego eliminar la
documentación de la base de datos informática. Todas las copias impresas de los datos se
almacenarán en un archivador bajo llave y destrozado al final de tres años.
Declaración de Consentimiento: Sur Habersham Middle School y la Universidad de la Libertad,
sus agentes, custodios, administradores, profesores y empleados se liberan de todas las demandas,
daños, o trajes, no se limita a losbasados en o relacionados con ningún efecto adverso sobre ti que
puede surgir durante o desarrollar en el futuro como resultado de mi participación en esta
investigación. (Por favor, comprenda que esta liberación de responsabilidad civil es obligatorio
para usted, sus herederos, ejecutores, administradores, representantes personales, y cualquier otra
persona que pueda hacer una reclamación a través de o debajo de ti.)
Nombre del alumno (letra de molde): _________________________________________
Firma del Estudiante: _________________________________ Fecha: ______________
Firma del padre: ____________________________________ Fecha: _______________

169
APPENDIX M: STUDENT AND PARENT INFORMATION LETTER–ENGLISH
March 11, 2011
Dear Parents and Students:
As a teacher at South Habersham Middle School (SHMS) and as a doctoral candidate at Liberty
University, I am honored to have the opportunity to work with your child‘s math teacher in using
technology in the classroom called a Classroom Performance System, often referred to as ‗clickers‘. In
addition to training your child‘s teacher on how to use this technology, I will also provide specific
instructional strategies for using the ‗clickers‘ in the classroom.
As a result of this teacher training, your child‘s math teacher will use this technology with all students
to teach a four-week math unit in the classroom. The teacher will be able to use this technology and
teaching strategies as tools, which may help improve student achievement and motivation by providing
instant feedback to all students. Thus, the teachers will be able to use data obtained from the clicker
questions in order to immediately guide, drive, and change instruction rather than wait until test time to
know how your child is performing. Your child‘s teacher has created a pretest and posttest that will be
given to all students to determine mastery of the math standards for the instructional unit.
Much research is available at the collegiate level that supports the use of this technology along with
specific teaching strategies. I would like to examine the results at the middle school level. This type
of technology is already used on a routine basis in several other classes at SHMS. However, in order
to examine a statistical impact of this technology and methodology in your child‘s math class, I need to
obtain your prior written consent. Participation would in no way affect your child‘s grade; however, it
is hoped that your child‘s grades would improve as a result of using the technology with specific
teaching strategies. Your child‘s name or other identifying information would not be used anywhere in
the study.
I am asking your help in explaining this process to your child and am asking for permission to use and
analyze your child‘s student achievement data and responses to an online survey at the end of the math
unit. Your child‘s math teacher will use the technology and will administer a pre- and posttest to all
students in the classroom regardless of parent consent to participate in the research study. However,
without parent and student permission, no student achievement data or survey responses can be used in
my study.
The school superintendent and school principal have granted permission for me to engage in this
research at SHMS.
For more specific information concerning this study, please see the attached Parent/Student Consent
form, or please contact me.
Sincerely,
Tracy M. Allison, Teacher

170
APPENDIX N: STUDENT AND PARENT INFORMATION LETTER-SPANISH
12 de marzo 2011
Queridos Padres y Estudiantes:
Como profesor en el South Habersham Middle School (SHMS) y como un candidato doctoral en la
Universidad Liberty, me siento honrado de tener la oportunidad de trabajar con el maestro de matemáticas
de su hijo en el uso de la tecnología en el aula llamado Aula del rendimiento del sistema, a menudo
referido como 'clickers'. Además de la formación del profesorado de su hijo sobre cómo utilizar esta
tecnología, también proporcionará estrategias de enseñanza específica para el uso del 'clickers' en el aula.
Como resultado de esta formación del profesorado, el maestro de su hijo matemáticas usará esta tecnología
con todos los estudiantes para enseñar una unidad de matemáticas de cuatro semanas en el aula. El maestro
será capaz de utilizar esta tecnología y estrategias de enseñanza como herramientas, que pueden ayudar a
mejorar el rendimiento de los estudiantes y la motivación, proporcionando información instantánea a todos
los estudiantes. Por lo tanto, los profesores podrán utilizar los datos obtenidos a partir de las preguntas
clicker a fin de orientar de inmediato, la unidad, y la instrucción cambio en lugar de esperar hasta el tiempo
de prueba para saber cómo su hijo se está realizando. El maestro de su hijo ha creado un pretest y posttest
que se le dará a todos los estudiantes para determinar el dominio de los estándares de matemáticas para la
unidad de instrucción.
Muchas investigaciones se encuentra disponible a nivel universitario que apoya el uso de esta tecnología
junto con las estrategias de enseñanza específicos. Me gustaría examinar los resultados a nivel de escuela
intermedia. Este tipo de tecnología ya se utiliza de forma rutinaria en varias otras clases en SHMS. Sin
embargo, con el fin de examinar un efecto estadístico de esta tecnología y metodología en la clase de
matemáticas de su hijo, lo que necesito para obtener su consentimiento previo por escrito. La participación
de ninguna manera afectar a su hijo de grado, sin embargo, se espera que las calificaciones de su hijo
mejorará como resultado de la utilización de la tecnología con las estrategias de enseñanza específicos. El
nombre de su hijo o con otra información de identificación no se utilizaría en cualquier parte del estudio.
Les pido su ayuda para explicar este proceso a su hijo y pido permiso para usar y analizar los datos de su
hijo estudiante de los logros y las respuestas a una encuesta en línea al final de la unidad de las
matemáticas. El maestro de su hijo matemáticas utilizará la tecnología y administración de un pre-y
posttest a todos los estudiantes en el aula, independientemente del consentimiento de los padres a participar
en el estudio de investigación. Sin embargo, sin permiso de los padres y el estudiante, no hay datos logros
de los estudiantes o respuestas a la encuesta puede ser utilizado en mi estudio.
El superintendente de la escuela y el director de la escuela han concedido el permiso para mí participar en
esta investigación en SHMS.
Para obtener información más específica acerca de este estudio, por favor consulte el documento de
consentimiento, o póngase en contacto conmigo.
Atentamente,
Tracy M. Allison, Maestros
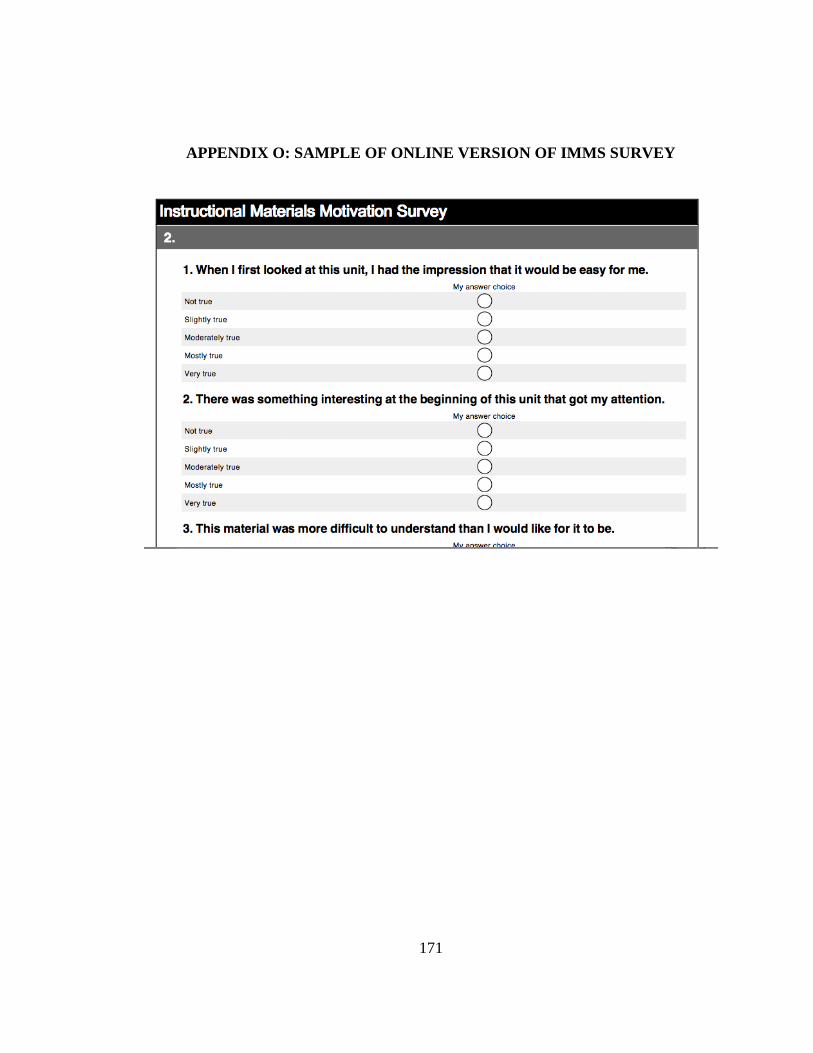
171
APPENDIX O: SAMPLE OF ONLINE VERSION OF IMMS SURVEY