Embed Size (px)
Citation preview
THE IMPACT OF CIRCULATION ARTERIES
ON NAIROBI’S URBAN FORM
By:
Lagat David Kipchirchir
Bachelor of Architecture, Honours (U.O.N)
NOVEMBER, 2012
UNIVERSITY OF NAIROBI
ADD LIBRARY
This thesis is presented as part fulfilment for the award of Master of Architecture Degree, University of Nairobi
2011/2012

DECLARATION
This is my original work and to the best of my knowledge has not been
presented for the award of a degree in this or any other university.
Signed:....Im & Q ..........................Date: . . . $ * . . „ . Of?X2-.
Lagat David Kipchirchir (Reg. No.: B52/64972/2010) - CANDIDATE
This thesis has been submitted for examination with our approval as the
university supervisors:
Date: A S . 1 $ \% :
Dr. P. A. Makachia - SUPERVISOR
Department of Architecture and Building Science
University of Nairobi
DEDICATION
To my beloved parents, brothers and sisters
111
ACKNOWLEDGEMENTS
This thesis would not have been possible without genuine support of many
actors both at institutional and individual capacities, all of whom I am unable
to mention here. 1 however wish to extend my profound gratitude and
indebtedness to the following:
First, to acknowledge the Almighty God through whom all things become.
To my dedicated supervisors Prof. T.J.C. Anyamba and Dr. P.A. Makachia for
their positive critique and guidance throughout this study. Special thanks also
go to the chairman Arch. E.O. Abonyo and all lecturers in the Department of
Architecture & Building Science who have since impacted this work.
To the administration of the University of Nairobi and NOMA-SEARCH
program facilitators for giving me the opportunity to learn within and beyond
my country’s borders. Very special thanks also go to Architectural Department
staff in the Ministry of Public Works especially Arch. Kafuna, and City
Council of Nairobi officers for their valued contribution.
I wish to also thank my colleagues Liombo, Kyaka, Wandia, Caleb, Susan and
Hellen who took their valuable time to objectively shape this work. To my
colleagues within and without the Kenyan borders in the NOMA Program
2010/11 East African tour -thank you for the synergy. Last but not least, to my
family and friends for their unwavering encouragement and support, especially
Faith, Aida, Andrew, Ben and Uncle Moses-I am forever grateful.
IV
TABLE OF CONTENTS
DECLARATION................................................................................................ii
DEDICATION................................................................................................... iii
ACKNOWLEDGEMENTS.............................................................................. iv
TABLE OF CONTENTS................................................................................... v
LIST OF ACRONYMS.......................................................................................x
LIST OF FIGURES............................................................................................xi
LIST OF TABLES...........................................................................................xiv
ABSTRACT.......................................................................................................xv
CHAPTER ONE: INTRODUCTION________________________________1
1.0 BACKGROUND...........................................................................................1
1.1 PROBLEM STATEMENT.......................................................................... 2
1.2 OBJECTIVES OF THE STUDY.................................................................3
1.3 RELEVANCE/JUSTIFICATION............................................................... 4
1.4 PROPOSITION.............................................................................................5
1.5 LIMITATION/SCOPE..................................................................................5
1.6 DEFINITION OF OPERATIONAL TERMS.............................................6
1.7 THESIS STRUCTURE................................................................................ 7
CHAPTER TW O: LITERATURE REVIEW ------------------------------------- 9
2.0 INTRODUCTION.........................................................................................9
2.1 HISTORICAL MOVEMENTS IN PLANNING......................................11
2.2 THEORY OF THE CITY...........................................................................15
2.2.1 City Image.......................................................................................... 16
a) Building the Image.................................................................................... 16
b) Legibility....................................................................................................17
v
2.3 URBAN MORPHOLOGY......................................................................... 21
2.3.1 Space Syntax........................................................................................22
2.3.2 Space and Anti-Space......................................................................... 24
a) Figure Ground Theory............................................................................. 25
b) The Linkage Theory..................................................................................25
c) The Place Theory......................................................................................26
2.3.3 Transects..............................................................................................26
2.3.4 Visual Analysis....................................................................................27
2.4 LEGAL AND POLITICAL FRAMEWORKS: PRACTICE, CODES &
GUIDELINES................................................................................................... 27
2.4.1 British Use-Based /Plan-Led Codes...................................................28
2.4.2 American Form-Based Codes.............................................................30
2.5 DESK-STUDY OF CURITIBA, BRAZIL...............................................33
2.5.1 Introduction..........................................................................................33
2.5.2 Planning and Implementation............................................................ 33
2.5.3 Land Use Policies.................................................................................35
2.5.4 Urban Design Strategies...................................................................... 37
2.6 CONCLUSION........................................................................................... 37
2.7 CONCEPTUAL FRAMEWORK..............................................................39
CHAPTER THREE: RESEARCH METHODOLOGY------------------------40
3.0 INTRODUCTION.......................................................................................40
3.1 RESEARCH DESIGN................................................................................41
3.2 RESEARCH STRATEGIES...................................................................... 42
3.2.1 Interpretive -Historical, Archival & Documentary Analysis:......... 42
3.2.2 Case Study Strategy:........................................................................... 43
vi
2.2.2 Theory o f Permanence........................................................................ 20
3.3 CHOICE AND JUSTIFICATION OF STUDY CASES.........................44
3.4 DATA COLLECTION TECHNIQUES...................................................47
3.4.1 Interviews:............................................................................................47
3.4.2 Observations:........................................................................................48
3.4.3 Photographs and Measurements:........................................................ 48
3.4.4 Documentary analysis:........................................................................ 48
3.4.5 Maps:.................................................................................................... 49
3.5 DATA ANALYSIS AND PRESENTATION..........................................49
CHAPTER FOUR: THE CONTEXT_______________________________50
4.0 INTRODUCTION.......................................................................................50
4.1 THE SHIFTING CITY SPACE.................................................................51
4.1.1 Non-Motorized Phase:........................................................................ 51
a) Nairobi before foreigners; the era of the Caravan and the Manyatta....51
b) The Era o f the Palanquin, Rickshaws, Mule Carts and the ‘Tin-house’52
4.1.2 Motorized Phase...................................................................................56
a) The Era o f the Motor Car and the Stone-Building................................. 56
b) Continuity: Permanence and Style.......................................................... 59
4.2 DEVELOPMENT PLANS......................................................................... 62
4.2.1 COLONIAL NAIROBI....................................................................... 63
a) 1906 Plan for a Railway Town................................................................63
b) 1927 Plan for a Settler Capital.................................................................66
c) The 1948 Master-Plan for a Colonial Capital.........................................68
4.2.2 POST-COLONIAL NAIROBI............................................................72
a) 1973 Metropolitan Growth Strategy (MGS)...........................................73
b) The 1979 Rezoning Strategy.................................................................... 76
vii
c) The 2008 Metropolis Plan..................................................................... 77
4.3 PRACTICE CODES & GUIDELINES....................................................79
4.3.1 Planning Structure............................................................................... 79
4.3.2 Tools for Development Control......................................................... 80
a) The Building Code....................................................................................80
b) Zoning Regulations...................................................................................81
c) Circulation Channels................................................................................ 82
4.4 OVERVIEW TO ANALYSIS...................................................................85
4.4.1. City-Scale Analysis............................................................................ 85
4.4.2 Street-Scale Analysis.......................................................................... 88
a) Moi Avenue -CBD....................................................................................89
b) Mumias South Road -Burn Bum ............................................................ 91
4.5 CONCLUSION...........................................................................................93
CHAPTER FIVE: FINDINGS & ANALYSIS_______________________ 95
5.1 CITY SCALE ANALYSIS........................................................................ 95
5.1.0 Introduction..........................................................................................95
5.1.1 City's Planning and Growth Patterns.................................................97
5.1.2 Impacts o f the Changing Character of Arteries on Urban Form... 100
5.1.3 Circulation Arteries and Informality................................................ 104
5.2 STREET-SCALE ANALYSIS................................................................ 105
5.2.1 Moi Avenue - CBD Nairobi..............................................................105
5.4.2 Planned Settlement -the case of Bum Bum.....................................112
CHAPTER SIX: CONCLUSIONS & RECOMMENDATIONS-----------119
6.1 CONCLUSIONS....................................................................................... 119
6.2 RECOMMENDATIONS..........................................................................123
viii
6.2.1 Mandate 123
6.2.2 Planning Strategies and Implementation........................................123
AREAS FOR FURTHER RESEARCH.................................................... 127
BIBLIOGRAPHY______________________________________________ 128
APPENDICES__________________________________________________133
APPENDIX I: ZONING.................................................................................133
APPENDIX II: ESSENTIAL ATTRIBUTES OF FORM-BASED CODES136
APPENDIX III: GENERAL OBSERVATION CHECKLIST....................139
APPENDIX IV: INTERVIEWEE’S SCHEDULE......................................140
IX
LIST OF ACRONYMS
BRT - Bus Rapid Transit
CABE - Commission for Architecture and the Built Environment
CBD - Central Business District
CCN/NCC -City Council of Nairobi / Nairobi City Council
DRSRS - Department of Resource Surveys and Remote Sensing
EMCA -Environment Management and Coordination Act
GC - Ground Coverage
GoK - Government of Kenya
IPPUC -Instituto de Pesquisa e Planejamento Urbano de Curitiba (Institute for
Research and Urban Planning of Curitiba)
ISOCARP -International Society of City and Regional Planners
KeNHA -Kenya National Highways Authority
KIPPRA -Kenya Institute for Public Policy Research and Analysis
KURA -Kenya Urban Roads Authority
MARS -Modem Architectural Research Group
MGS -Metropolitan Growth Strategy
NOMA-SEARCH - Norwegian Masters-Southern and East African Research
Cooperation for Habitat
NUSG -Nairobi Urban Study Group
PR -Plot Ratio
UNEP -United Nations Environmental Program
UON - University o f Nairobix
LIST OF FIGURES
Fig. 2.1: Land-uses in the non-motorized and the motorized eras...................14
Fig. 2.2: Convex map o f the town G .................................................................. 23
Fig. 2.3: Axial map of town G ............................................................................23
Fig. 2.4: G. Nolli’s map of Rome 1748 showing use of figure-ground theory 24
Fig. 2.5: The illustration of urban design theories............................................24
Fig. 2.6: Transect o f Haynie-Sirrine neighbourhood. Greenville, SC, 2001 ...26
Fig. 2.7: Urban design framework for Digbeth Millennium Quarter,
Birmingham, UK, 1996.......................................................................................30
Fig. 2.8: Wake Forest, NC, downtown Master Plan, 2003-2004....................31
Fig. 2.9: The integration conceptshowing the five structural axes..................34
Fig. 2.10: The ‘trinary’ traffic system in the structural avenues......................35
Fig. 2.11: Schematic arrangement of structural axes........................................36
Fig. 2.12: Curitiba -Zoning has been integrated into the transport plan and tall
buildings are permitted only along the main routes..........................................36
Fig. 2.13: A sample community centre plugged into the transportation system
............................................................................................................................... 37
Fig. 2.14: Conceptual Framework Diagram......................................................39
Fig. 4.1: Shift in spatial qualities of Bazaar Street (now Biashara Street)...... 51
Fig. 4.2: Maasai Manyatta.................................................................................. 52
Fig. 4.3: Map of Nairobi area showing the Location of ‘Enkare Nyrobi’ ......52
Fig. 4.4: Rossenrode & Mac John’s General Merchants & Bar in Nairobi,
1902...................................................................................................................... 53
Fig. 4.5: View of the First DC’s Office and Court House (Nairobi -1900).... 53
Fig. 4.6: Nairobi Circa, 1900..............................................................................54
Fig. 4.7: Transportation means and the urban street.........................................55
Fig. 4.8: The general plan of Nairobi, 1901 -the road as an artery had began to
define the landscape............................................................................................ 56
Fig. 4.9: Nairobi, 1928........................................................................................57
Fig. 4.10: Aerial view of Nairobi in 1940s....................................................... 57
Fig. 4.11: Government House, Nairobi.............................................................. 61
Fig. 4.12: ‘Huge building of the future’............................................................. 61
xi
Fig. 4.13: Nairobi boundary changes from 1900 until 1963 after which they
have not changed.................................................................................................62
Fig. 4.14: The City of Nairobi C. 1906 -no evidently defined road networks 64
Fig. 4.15: Nairobi Municipal Area 1927........................................................... 67
Fig. 4.16: Grid Layout of Eastleigh...................................................................68
Fig. 4.17: 1948 Colonial Racial Residential Segregation and Functionalism.69
Fig. 4.18: The heart of the 1948 Master plan for a colonial capital depicting
Nairobi as a civic centre..................................................................................... 70
Fig. 4.19: Major transport axes of the city in the MGS decentralization plan .75
Fig. 4.20: Rezoning Strategy Plan -See Appendix I for zoning interpretation 76
Fig. 4.21: Nairobi’s historical and projected population, 1950-2025..............77
Fig. 4.22: Present and proposed extent o f the Nairobi Metropolitan Area......78
Fig. 4.23: CCN Council and Committee Structure........................................... 80
Fig. 4.24: Infrastructure and general land uses................................................. 84
Fig. 4.25: Map o f Nairobi showing the city’s main channels & distribution...85
Fig. 4.26: Location of Moi Avenue.................................................................... 89
Fig. 4.27: Layout concept of Bum Bum with a Bum Bum services concept..92
Fig. 4.28: Proposal for Bum Bum Phase II 1971.............................................. 92
Fig. 4.29: Piece meal transformations at Phase IV Junction.............................93
Fig. 5.1: Circulation channels and urban character, sections A,B & C............95
Fig. 5.2: Character of City’s enclosures along main circulation channels...... 96
Fig. 5.3: Relationship o f main arterial network and urban growth..................96
Fig. 5.4: Aerial imaging showing the relationship of main arterial network,
build areas and zoning......................................................................................... 97
Fig. 5.5: The relationship of arterial channels and zoning................................98
Fig. 5.6: Land-use and arterial channels............................................................ 98
Fig. 5.7: Lot sizes and arterial networks............................................................ 99
Fig. 5.8: Plan for City’s By-passes and Link roads.......................................... .99
Fig. 5.9: Forest Road transformations and developments 2002&2011.......... 101
Fig. 5.10: Mobil Plaza Shopping Centre 2002&2011..................................... 102
Fig. 5.11: Githurai round about in 2003 and in 2011 respectively................ 102
Fig. 5.12: Pedestrianisation & conversion of streets from two-way to one-way
...................................................................................................................104
X ll
Fig. 5.13: Nairobi’s road networks...................................................................105
Fig. 5.14: Oblique view of Moi Avenue.......................................................... 108
Fig. 5.15: A Section of Moi Avenue.................................................................108
Fig. 5.16: Schematic section S-01 through Moi Avenue................................ 109
Fig. 5.17: The Urban Block/lot.........................................................................109
Fig. 5.18: The 1930’s Art-Deco buildings and the Modem glass-clad..........110
Fig. 5.19: Prominence of Mumias South Road............................................... 112
Fig. 5.20: Bum Bum’s changing image from 2002 -2011 respectively......... 113
Fig. 5.21: (a) Mumias South road Phase V & (b)Loop Road, Phase 1........... 113
Fig. 5.22: Bum Bum's Main Circulation Spine...............................................114
Fig. 5.23: Schematic section through the Mumias South spine......................115
Fig. 5.24: Transformations with balconies overlooking the spine................. 115
Fig. 6.1: Managing sprawl................................................................................ 122
Fig. 6.2: Avenues for path-related developments at city-scale level............. 125
Fig. 6.3: Glare emanating from building’s facade...........................................127
xui
LIST OF TABLES
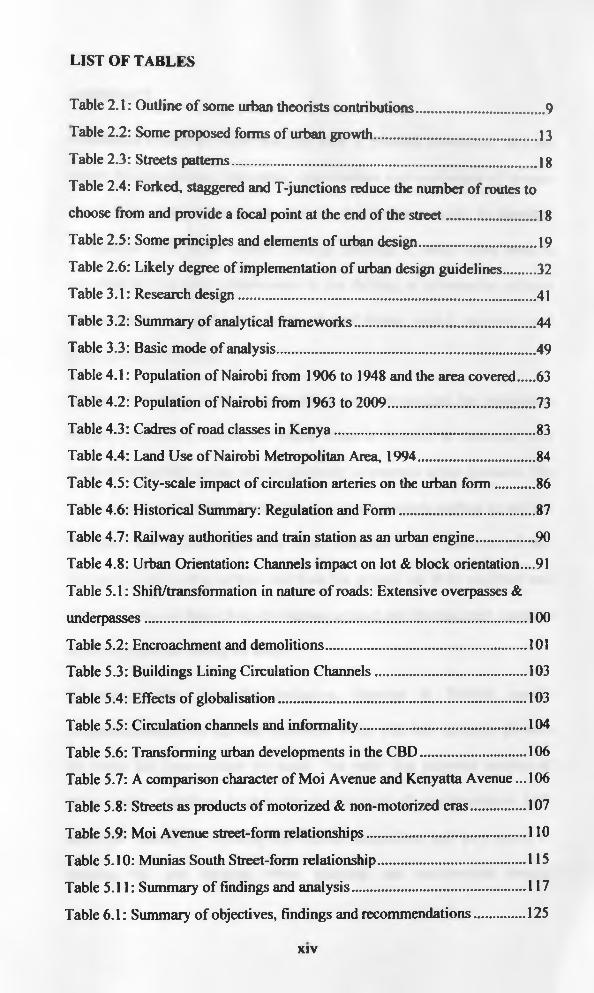
Table 2.1: Outline of some urban theorists contributions................................ 9
Table 2.2: Some proposed forms of urban growth............................................13
Table 2.3: Streets patterns...................................................................................1 g
Table 2.4: Forked, staggered and T-junctions reduce the number of routes to
choose from and provide a focal point at the end of the street......................... 18
Table 2.5: Some principles and elements of urban design................................ 19
Table 2.6: Likely degree of implementation of urban design guidelines.........32
Table 3.1: Research design................................................................................. 41
Table 3.2: Summary of analytical frameworks................................................. 44
Table 3.3: Basic mode of analysis...................................................................... 49
Table 4.1: Population of Nairobi from 1906 to 1948 and the area covered.....63
Table 4.2: Population of Nairobi from 1963 to 2009........................................ 73
Table 4.3: Cadres of road classes in Kenya.......................................................83
Table 4.4: Land Use of Nairobi Metropolitan Area, 1994................................84
Table 4.5: City-scale impact of circulation arteries on the urban form ...........86
Table 4.6: Historical Summary: Regulation and Form.....................................87
Table 4.7: Railway authorities and train station as an urban engine................90
Table 4.8: Urban Orientation: Channels impact on lot & block orientation....91
Table 5.1: Shift/transformation in nature o f roads: Extensive overpasses &
underpasses.........................................................................................................100
Table 5.2: Encroachment and demolitions....................................................... 101
Table 5.3: Buildings Lining Circulation Channels.........................................103
Table 5.4: Effects of globalisation................................................................... 103
Table 5.5: Circulation channels and informality............................................. 104
Table 5.6: Transforming urban developments in the CBD............................ 106
Table 5.7: A comparison character of Moi Avenue and Kenyatta Avenue ...106
Table 5.8: Streets as products o f motorized & non-motorized eras...............107
Table 5.9: Moi Avenue street-form relationships............................................110
Table 5.10: Munias South Street-form relationship.........................................115
Table 5.11: Summary of findings and analysis...............................................117
Table 6.1: Summary of objectives, findings and recommendations............. 125
xiv
ABSTRACT
Circulation arteries are more than just lines of potential movement; they are
stages for observation, presenting opportunities and challenges of diverse
social, functional and economic nature. Failure for example to introduce
compatible development models through planning & design often leads to
overwhelmed physical infrastructure & the thriving of informality; subjects
whose costs are significant in terms o f most human, social, economic, and
environmental variables.
The main objective o f this study therefore was to investigate the relationship
between circulation arteries and urban forms in Nairobi, to determine how
such a relationship can be utilized positively to structure urban precincts. The
study adopted qualitative, descriptive case-study research method to analyze
the cause and impact. Structured direct observation and interview of key
informants was used to collect data from the ground and from architects and
urban planners, to help inform the various archival and documentary materials
collected prior and during the study.
It emerges that from the beginning planning in Nairobi merely
compartmentalized the city into functional zones with little attention given to
the fabric that interconnects the zones. The study thus proposes creation of
urban design guidelines to steer the development of arterial-oriented built
form’s in Nairobi by exposing their spatial adaptations, and as a means to
bridging the gap between urban planning and architectural design.
xv
CHAPTER ONE: INTRODUCTION
"In the study o f town-planning and civic art, the main problem which is to be
considered is the means o f locomotion, as it is the problem from which all the
others relating to the design o f a city derive
CHAPTER OUTLINE:
1.0 Background to the study 1. 1 Problem statement1.2 Objectives o f the study1.3 Relevance/Justification1.4 Proposition1.5 Limilation/Scope1.6 Definition o f operational terms1.7 Thesis structure
1.0 BACKGROUND
Reforming the urban planning system is a critical challenge in urban sector
reforms in the face o f burgeoning problems of urban growth and population
concentration in cities, especially in third-world countries. The efficiency of
urban settlements largely depends upon how well they are planned, how
economically they are developed and how efficiently they are managed, key in
this case being circulation arteries linking different locations within the ever
expanding limits. However, the urban planning process in the past has suffered
from many inadequacies. The process o f planning has been long, its
implementation weak, and has largely been confined to the detailing of land
use, paying inadequate attention to environmental responses.
1 Rational Architecture o f Cities: Fundamental Principles o f the Lineal City, in Ben Matteson, writing-cities-mit. wikispaces. com/file/view/matteson_ll.329 v01. doc
1
Circulation arteries are platforms for functional, economic and social
development hence should be attractive, active and well functioning. The
Government of Kenya has various guidelines intended to guide and control the
design and planning of the streets within its urban centers but have either been
unsuitable, un-effectively implemented or out rightly disregarded. With
mounting infrastructural and land pressures in Nairobi, some streets have been
pedestrianised to accommodate more people, some have been converted from
two way to one way for similar reasons, and still in some cases buildings have
been brought down to allow for road expansion. Nevertheless, in both planned
and unplanned settlements continuous transformations are happening as urban
dwellers & managers attempt to take advantage of every existing open space,
be it a road, railway or riparian reserve leading to continued redefinition of the
urban environments.
1.1 PROBLEM STATEMENT
Over years, Nairobi’s planning has functionally compartmentalized the city
with undue consideration as to the nature of circulation channels linking her
divergent zones. Similarly, official plans do not factor compatible
development that respects the character o f circulation channels and adjacent
areas so that a gradual transformation in the built environment is not evident.
This fails to tap into the huge opportunities offered by circulation arteries
resulting in among others continued sprawl, overwhelmed & shabby physical
environments and thriving informality; subjects with significant impacts on
city’s social, economic and environmental outlook which the study explores.
2
As noted above, the problem is generally related to the city’s spatial aesthetics
and functional structure, key being her continued growth and responses to
development tools. It is observed that over time, different parts of the city
have grown from within and from without, with a complexity of socio
political and institutional influences which often defeat planning systems
mandate in city’s growth, that is, to protect amenity and the environment in
the public interest (CCN, 2004, p. 1). Thus despite the fact that circulation
arteries constitute the main quotient o f urban fabric, their planning objectives
are hardly executed, and developments often go ahead of their realization. In
addition, it is generally observed that with decreasing primacy of existing
circulation channels in terms of development and access, varied urban
character is observed, with globalisation setting in through the setting of large
bill-boards, posters and Smog. These observations point to dynamic attributes
associated with circulation channels which the study attempts to unravel.
1.2 OBJECTIVES OF THE STUDY
The author seeks to explore three main objectives, namely:
(i) To investigate if there are any design-based urban planning strategies
considered in the determination of the nature and location of
circulation channels.
(ii) To inquire into the relationship between the size of Circulation
Channel’s and the resultant urban forms/uses.
(iii) To explore how circulation channels have/may be used to structure
urban precincts.
3
13 RELEVANCE/JUSTIFICATION
I'rom various regional and local levels, Nairobi’s urban dynamics presents
vibrant city but a look at its facts in the Nairobi’s Vision 2030 Metro Plan
(GoK, 2008) presents some startling facts. The population o f Nairobi is noted
to have increased from a mere 100,000 inhabitants in 1948 to some 3.5 million
and 4.7 million people for night and day population respectively by 2005.
These projected statistics also show that by the year 2020 Nairobi’s night
population alone will be a staggering 6.7 Million people (GoK, 2008, p. 27).
Some of the consequences of such a growth are increased mobility, security
and spatial needs. The value of a functioning system economically and
socially thus cannot be overemphasized.
Although the city displays a strong monocentric form due to activity
concentration on the CBD, other forms can be discerned such as polycentric,
sectoral and linear forms. Planning has however continued to allow for fresh
development, subdivisions, change o f use, and amalgamations without
considering the macro-impacts in terms o f form & connectivity. The current
character of development thus indicates a more of demand-led instead of
infrastructure-led systems (Mwaura, 2006, p. 3) yet it can be argued that long
term urban problems can be best tackled through close working relationship
between land-use and transportation planning. Change of zoning for example
from residential to office and commercial ideally mean complete
reconstruction and widening of existing roads but developments are
continually being carried out without equal upgrading of existing
infrastructure.
4
It should be understood that as land is absorbed for urban purposes, open land
areas disappears with finality, and its redemption expensive. Considering the
way in which public land has been treated, public concerns about problems
caused by sprawling urban development from the loss o f cherished open
spaces and environmental degradation to haphazard development patterns,
transformations and traffic gridlock, it defeats the hypothetical preposition on
the role of current planning. This thesis explores how the relationship of
development control tools and proper consideration of circulation arteries can be
used towards the design of efficient urban environments.
1.4 PROPOSITION
The subject of the relationship between urban forms and the inherent
circulation channels is broad. Nonetheless, the author assumes that there is a
pattern in which urban forms are shaped by the character of surrounding
channels functionally, socially and economically. The author also assumes that
circulation arteries constitute the city’s key frameworks and further attributes
the current relationship between built forms and circulation channels to the
gap that exists between urban planning concepts and design interventions.
1.5 LIMITATION/SCOPE
This study was undertaken over a specified period of time using limited
financial resources. To overcome these constraints, manageable representative
cases were selected and analyzed, with the support of in-depth archival and
documentary evidence. There were also the institutional bottlenecks and
bureaucratic procedures in accessing some of the vital resources for the study
leading to frequent time consuming follow-ups.
5
The inquiry also recognized roads, railways and water-ways as the
predominant circulation arteries with varying potentials in the city of Nairobi.
However due to the limitations stated above, this study engaged superficially
on the all the three but granted study emphasis to roads.
1.6 DEFINITION OF OPERATIONAL TERMS
This section defines some of the key terms used in the thesis and whose
meanings for the sake of this study are taken as follows:
Arteries/Channels: Refers to routes of potential movements which
can be roads, railways or waterways along which an observer
customarily, occasionally, or potentially moves (Lynch, 1960, p. 47).
Form: Refers to the shape, visual appearance, or configuration of built
objects; their two or three-dimensional profile.
Sprawl: Refers to the spreading out of the city and its suburbs over
more and more rural land at the periphery o f the city over time, with
the style o f that conversion being more important than the amount of
the conversion.
Streetscape: Refers to the perspective view along a street, especially
o f the natural and man-made elements in or near the street right of
way, including street trees, lawns, signs, street lights, above-ground
utilities, drainage structures, sidewalks, bus stop shelters and general
street furniture.
Transformations: A thorough or dramatic change in form or
appearance over a period of time.
6
Typology: Refers to the general form, structure, or character
distinguishing a particular circulation channel or built form from
another; hence, potentially a pattern or model after which can be made.
Urban Form: Refers to the physical layout and design of the city; the
overall shape and pattern of an urban area based on its visual and
material impact, density, traffic patterns and topography.
1.7 THESIS STRUCTURE
This thesis has been structured into six chapters, each dealing with particular
aspects o f the study:
This chapter focuses on the general introductory appraisal to
the study which encompasses the problem definition, objectives
o f the study, its relevance, limitations, scope and study’s
proposition. It also features the overall structure of the thesis.
O This chapter constitutes the literature review section which is
an analysis of relevant data from books, journals, research
papers and internet, connecting theory and practise. This
section is concluded with the drawing o f a conceptual
framework.
This chapter is committed to the methods applied in carrying
out the research. It outlines the research design, the research
strategies, criteria for selecting study cases, techniques for
collecting & analysing data and final presentation techniques.
7
( 4 ) cJlaPter Reuses on Urban History of Nairobi, which forms
~ the bedrock upon which the current city was embedded. It
previews the city’s informal and formal planning strategies
through her motorized and non-motorized epochs thus bench
marking the study.
© i
o
This chapter focuses on the actual findings and analysis of data
from the study. It interprets and explains the findings with
regard to the study objectives.
This chapter elaborates on the study’s conclusions and
recommendations as derived from the study. Areas for further
research are also suggested.
8

CHAPTER TWO: LITERATURE REVIEW
City planning finds its validation in the intuitive recognition that a
burgeoning market society cannot be trusted to produce spontaneously a
habitable, sanitary, or even efficient city, much less a beautiful one ' - Murray
Bookchin, the Limits o f the City (1986)2
CHAPTER OUTLINE:
2.0 Introduction2. / Historical movements in planning2.2 Theory o f the city2.3 Urban Morphology2.4 Legal and political frameworks: practice, codes & guidelines2.5 Desk-study o f Curitiba, Brazil2.6 Conclusion2.7 Conceptual framework
2.0 INTRODUCTION
The city has been the focus of many scholars who have tried to understand and
describe how they exist/have existed over time. Table 2.1 below outlines
contributions of some internationally renowned urban theorists/designers.
Table 2.1: Outline o f some urban theorists contributions
URBANTHEORIST
APPROACH ADOPTED
Lynch, 1960 and 1984
The Image of the City: Analyses and formulates urban components and organizing principles which help in legibility o f urban areas.Good City Form: A summation & Extension o f his vision
Thomas Gordon Cullen 1961
The Concise Townscape: A key motivator in the townscape movement who created the concept of ’serial vision’, defining the urban landscape as a series of related spaces.
2 www.aboutplarming.org/quotes.html
9
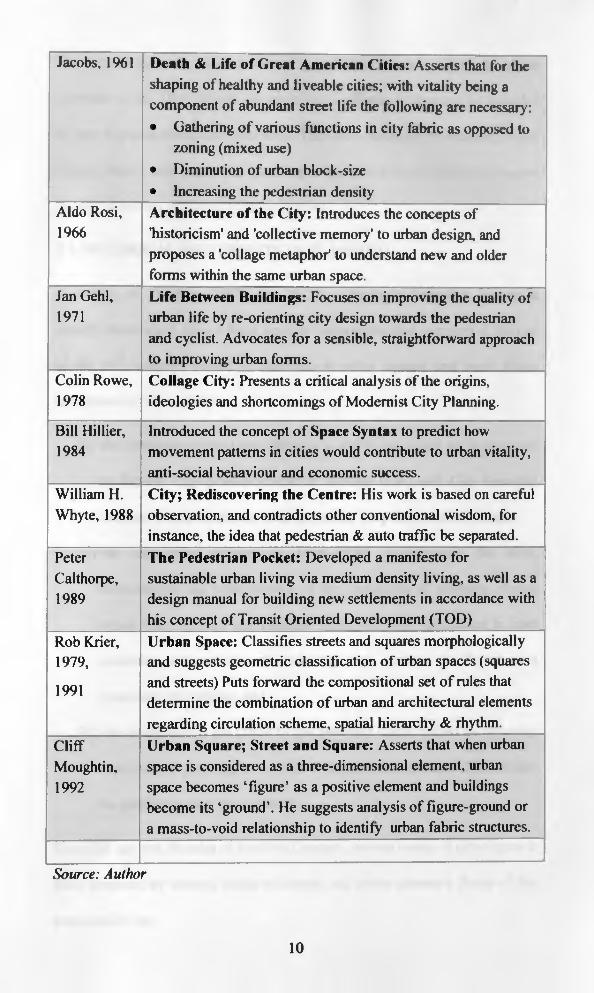
Jacobs, 1961 Death & Life of Great American Cities: Asserts that for the shaping of healthy and liveable cities; with vitality being a component of abundant street life the following are necessary:• Gathering of various functions in city fabric as opposed to
zoning (mixed use)• Diminution of urban block-size• Increasing the pedestrian density
Aldo Rosi, 1966
Architecture of the City: Introduces the concepts of 'historicism' and 'collective memory' to urban design, and proposes a 'collage metaphor1 to understand new and older forms within the same urban space.
Jan Gehl, 1971
Life Between Buildings: Focuses on improving the quality of urban life by re-orienting city design towards the pedestrian and cyclist. Advocates for a sensible, straightforward approach to improving urban forms.
Colin Rowe, 1978
Collage City: Presents a critical analysis of the origins, ideologies and shortcomings of Modernist City Planning.
Bill Hillier, 1984
Introduced the concept o f Space Syntax to predict how movement patterns in cities would contribute to urban vitality, anti-social behaviour and economic success.
William H. Whyte, 1988
City; Rediscovering the Centre: His work is based on careful observation, and contradicts other conventional wisdom, for instance, the idea that pedestrian & auto traffic be separated.
PeterCalthorpe,1989
The Pedestrian Pocket: Developed a manifesto for sustainable urban living via medium density living, as well as a design manual for building new settlements in accordance with his concept of Transit Oriented Development (TOD)
Rob Krier, 1979,
Urban Space: Classifies streets and squares morphologically and suggests geometric classification of urban spaces (squares
1991 and streets) Puts forward the compositional set of rules that determine the combination of urban and architectural elements regarding circulation scheme, spatial hierarchy & rhythm.
CliffMoughtin,1992
Urban Square; Street and Square: Asserts that when urban space is considered as a three-dimensional element, urban space becomes ‘figure’ as a positive element and buildings become its ‘ground’. He suggests analysis of figure-ground or a mass-to-void relationship to identify urban fabric structures.
Source: Author
10
I he present growing concentration of populations in cities especially of the
countries ol the Third World, demands that serious consideration be accorded
to their physical forms and structures. This study attempts to examine a brief
history, theory and practise of planning and urban forms/structures advanced
to address related problems of urban growth.
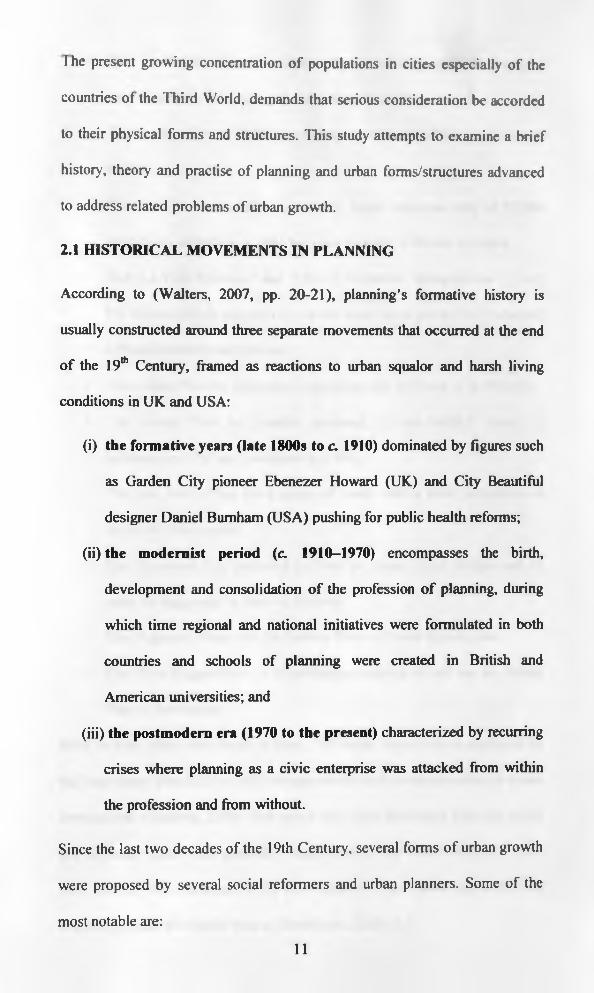
2.1 HISTORICAL MOVEMENTS IN PLANNING
According to (Walters, 2007, pp. 20-21), planning’s formative history is
usually constructed around three separate movements that occurred at the end
o f the 19th Century, framed as reactions to urban squalor and harsh living
conditions in UK and USA:
(i) the formative years (late 1800s to c. 1910) dominated by figures such
as Garden City pioneer Ebenezer Howard (UK) and City Beautiful
designer Daniel Burnham (USA) pushing for public health reforms;
(ii) the modernist period (c. 1910-1970) encompasses the birth,
development and consolidation o f the profession of planning, during
which time regional and national initiatives were formulated in both
countries and schools of planning were created in British and
American universities; and
(iii) the postmodern era (1970 to the present) characterized by recurring
crises where planning as a civic enterprise was attacked from within
the profession and from without.
Since the last two decades of the 19th Century, several forms of urban growth
were proposed by several social reformers and urban planners. Some of the
most notable are:
11

• The ‘La Cuidad Lineal', a linear city of 30,000 population proposed
near Madrid by Don Arturo Soria y Mata in 1882;
• The Garden City of 32,000 population advanced by Hbenezer Howard
in 1898;
• The ‘La Cite Industrielle’, a partially linear industrial city of 35,000
population published in 1901 by Tony Gamier, a French architect;
• The ‘La Ville Radieuse' and ‘City of Tomorrow’ designed for 1.5 and
3.0 million people respectively on the linear principle by Le Corbusier,
a Swiss architect and planner;
• The Linear Plan for Stalingrad prepared in the 1930s by N.A. Milytin;
• The Linear Plan for London prepared by the MARS Group of
architects in 1937 and published in 1941;
• The Jose Serfs Plan for a group of towns with a total population of
about 960,000 people;
• The Broadacre City prepared in 1940 by Frank Lloyd Wright and its
versions suggested by Melvin Webber;
• The Dispersed Sheet and the Galaxy Plans of Kevin Lynch; and
• The ‘Five Fingers Plan’ of Copenhagen centered on rail and the Radial
Plan of Stockholm.
Most of these plans were linear in form. The linear disposition is explained by
the importance attached to public transportation and communication in urban
development (Obateru, 2008). The radial city plans developed after the initial
sets of linear plans were generally adaptations of the linear concept. Such
were the ‘La Ville Radieuse’, ‘City of Tomorrow’, the ‘Five Fingers Plan' of
Copenhagen and the Radial Plan of Stockholm, Table 2.2.12
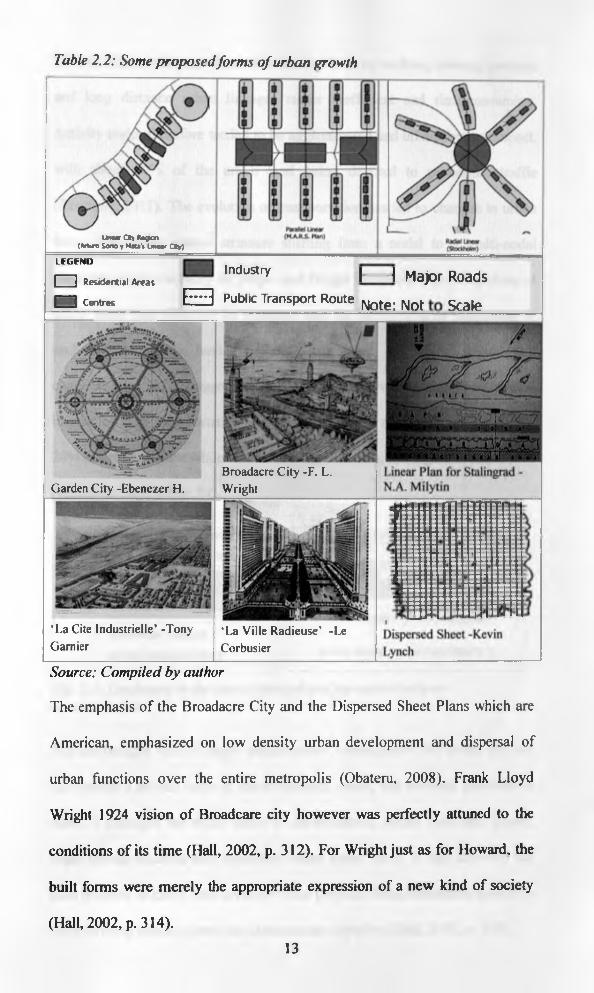
Source: Compiled by author
The emphasis of the Broadacre City and the Dispersed Sheet Plans which are
American, emphasized on low density urban development and dispersal of
urban functions over the entire metropolis (Obateru, 2008). Frank Lloyd
Wright 1924 vision of Broadcare city however was perfectly attuned to the
conditions of its time (Hall, 2002, p. 312). For Wright just as for Howard, the
built forms were merely the appropriate expression of a new kind of society
(Hall, 2002, p. 314).
LFGFND
n Residential Areas
H Centres
industry |— | Major Roads
E E 3 Public Transport Route ^ N o t ^
Table 2.2: Some proposed form s o f urban growth
Line* Qt> Regran (Arti*o Sono y Mata1! Unaar C ty)
Garden City -Ebenezer H.
‘La Cite Industrielle' -Tony Gamier
Broadacre City -F. L. Wright
‘La Ville Radieuse’ -Le Corbusier
13
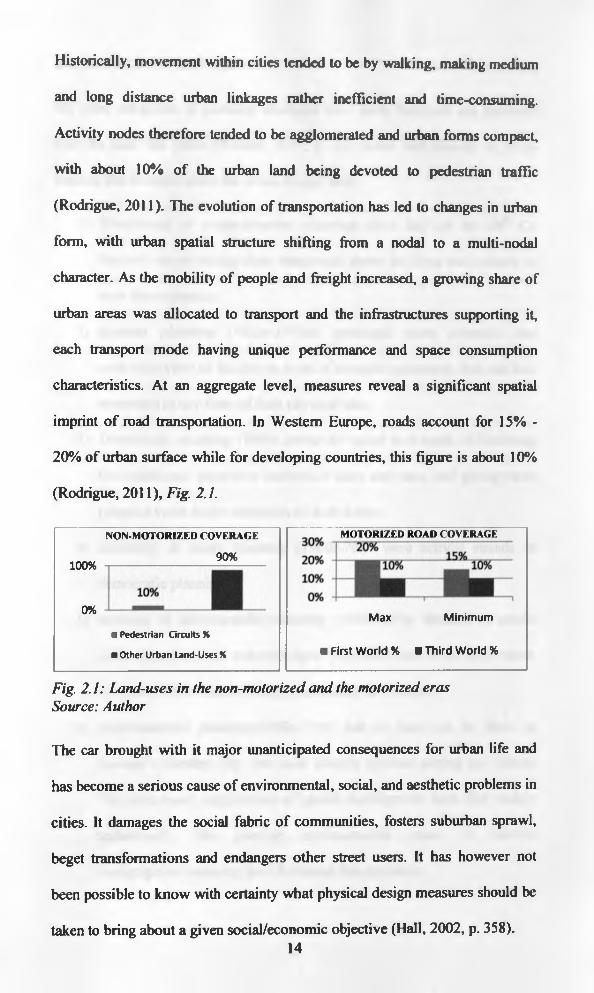
Historically, movement within cities tended to be by walking, making medium
and long distance urban linkages rather inefficient and time-consuming.
Activity nodes therefore tended to be agglomerated and urban forms compact,
with about 10% of the urban land being devoted to pedestrian traffic
(Rodrigue, 2011). The evolution of transportation has led to changes in urban
form, with urban spatial structure shifting from a nodal to a multi-nodal
character. As the mobility of people and freight increased, a growing share of
urban areas was allocated to transport and the infrastructures supporting it,
each transport mode having unique performance and space consumption
characteristics. At an aggregate level, measures reveal a significant spatial
imprint o f road transportation. In Western Europe, roads account for 15% -
20% of urban surface while for developing countries, this figure is about 10%
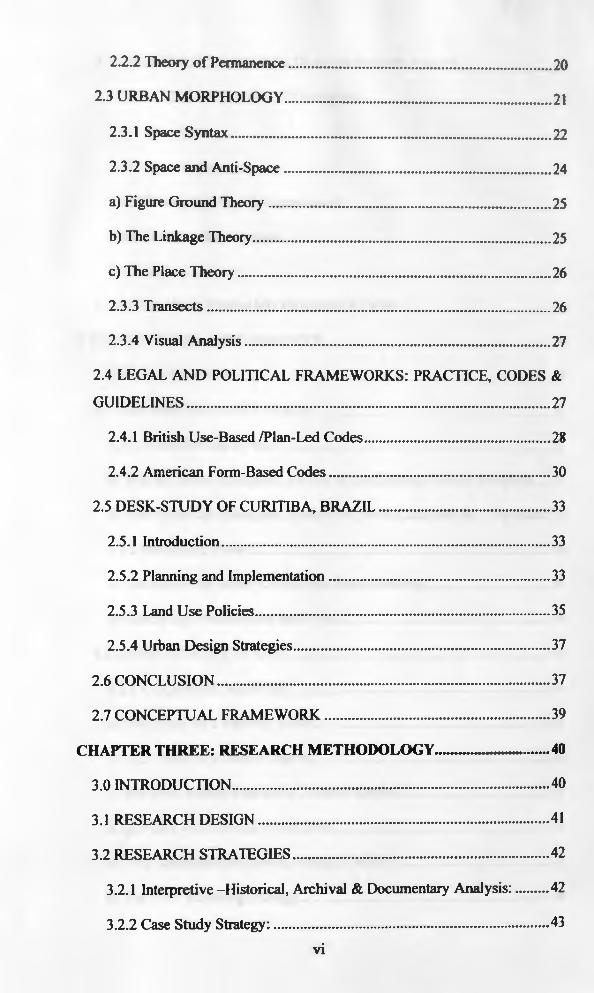
(Rodrigue, 2011), Fig. 2.1.
NON-MOTORIZED COVERAGE
100%
0%
90%
■ Pedestrian Circuits %
■ Other Urban Land-Uses %
MOTORIZED ROAD COVERAGE
Max Minimum
■ First World % ■ Third World %
Fig. 2.1: Land-uses in the non-motorized and the motorized eras Source: Author
The car brought with it major unanticipated consequences for urban life and
has become a serious cause of environmental, social, and aesthetic problems in
cities. It damages the social fabric of communities, fosters suburban sprawl,
beget transformations and endangers other street users. It has however not
been possible to know with certainty what physical design measures should be
taken to bring about a given social/economic objective (Hall, 2002, p. 358).14
2.2 THEORY OF THE CITY
Six main categories o f planning strategies have been theorized and practiced
over the past 100 years (Walters, 2007, p. 31), some with strands of place
making that brought about the urban design field:
1) Traditional or comprehensive planning (first ha lf o f the 2(fh C):
focused on producing clear statements about the form and content of
new developments.
2) Systems planning (1950s-1970s): promoted more scientific and
analytical view of the city as a set of complex processes, and was less
interested in any form of final physical plan.
3) Democratic planning (1960s onwards): arose as a result of loosening
the traditional, repressive barriers o f class and race, and giving more
people a voice in the formation o f their future.
4) Advocacy & equity planning (1960s-70s): were activist strands of
democratic planning
5) Strategic & incrementalist planning (1950's-60's): focused on small-
scale objectives and acknowledged pragmatic real-world constraints.
They are still influential today, particularly in America.
6) Environmental planning(1960s-70's): has its roots as far back as
Howard’s Garden City, but most directly evolved during the 1960's-
70s when many implications o f global development were first widely
understood’. The growing environmental crises of climate
change/global warming have furthered this approach.
15
In 1927, Patrick Abercrombie warned about the dangers of conceiving master
planning as a static exercise in physical typologies, crediting Patrick Geddes
with enriching the process o f town planning and avoiding the discipline
becoming merely a sterile and mechanical mix of typological cliches (Walters,
2007, p. 60). In the context of modem architecture, Rossi tried to find out a
solution to the problem - ‘what should be the inner logic o f the whole
structure o f a town ’?, (Rossi, 1984). In his writings, Rossi criticized the lack
o f understanding o f the city in current architectural practice. He argued that a
city must be studied and valued as something constructed over time; of
particular interest to him were urban artefacts that withstand the passage of
time. Rossi held that the city is conceived as a spatial system composed of
many parts that remembers its past. To him the part and whole character of a
city challenges an aspect of functionalist theory i.e. zoning.
2.2.1 City Image
a) Building the Image
Most often, our perception o f the city is not sustained, but rather partial,
fragmentary, mixed with other concerns. Nearly every sense is in operation,
and the image is the composite of them all. As manipulators of the physical
environment, city planners and designers are primarily interested in the
external agent, in the interaction which produces the environmental image.
Different environments resist or facilitate the process of image-making. A
clear image enables one to move about easily and quickly. A vivid and
integrated physical setting, capable of producing a sharp image, plays a social
role as well.
16
b) Legibility
This refers to the ease with which city’s parts can be recognized organized
into coherent patterns, (Lynch, 1960). Legibility is crucial in the city setting
and rebuilding through the perceptual theory. Although clarity or legibility are
by no means the only important property of a beautiful city, it is of special
importance when considering environments at the urban scale. Good forms are
supported by the presence of others and by special way-finding devices: maps,
street numbers, route signs, bus placards (Lynch, 1984).
Kevin Lynch describes mental maps obtained from residents in Boston, Los
Angeles and Jersey (Lynch, 1960). He observed that where blind spots existed,
it affected how people moved around, how they gave directions to others and
also contributed or reinforced fears they may have had about certain
neighbourhoods, hence the emotional and physical well-being o f the inhabitant
population. He moves from these maps and observations and tries to develop
rules of thumb for urban design. Lynch describes paths, one of the five key
city elements he identifies, and connects it to the visual experience noting that
a greater part o f city’s experiences arise from movement through it. This
places the aesthetic theory on facets o f perceptual theory where proportion is
important to the overall massing of the building as well as the building's
details and path related accessories.
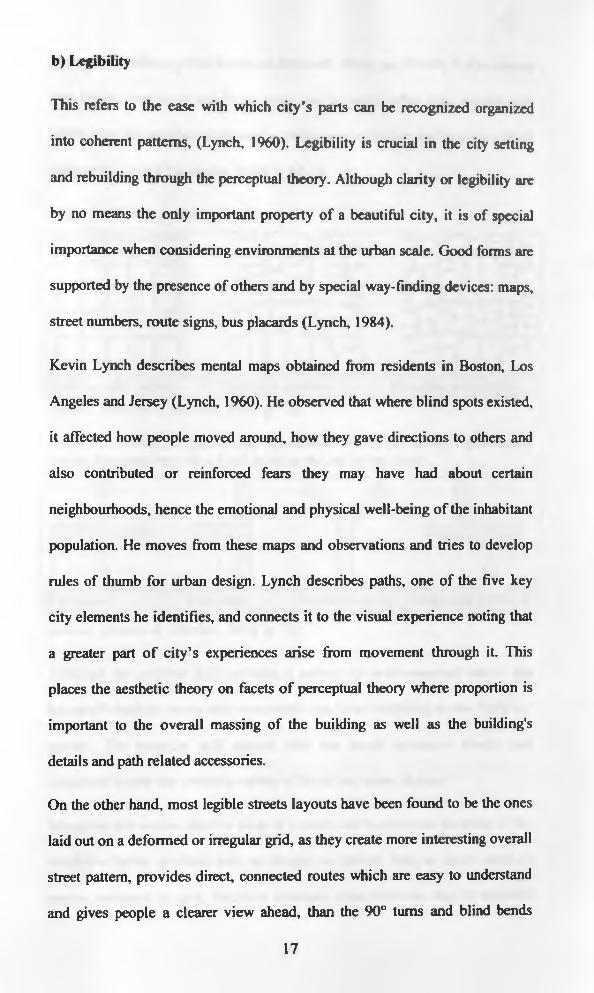
On the other hand, most legible streets layouts have been found to be the ones
laid out on a deformed or irregular grid, as they create more interesting overall
street pattern, provides direct, connected routes which are easy to understand
and gives people a clearer view ahead, than the 90° turns and blind bends
17
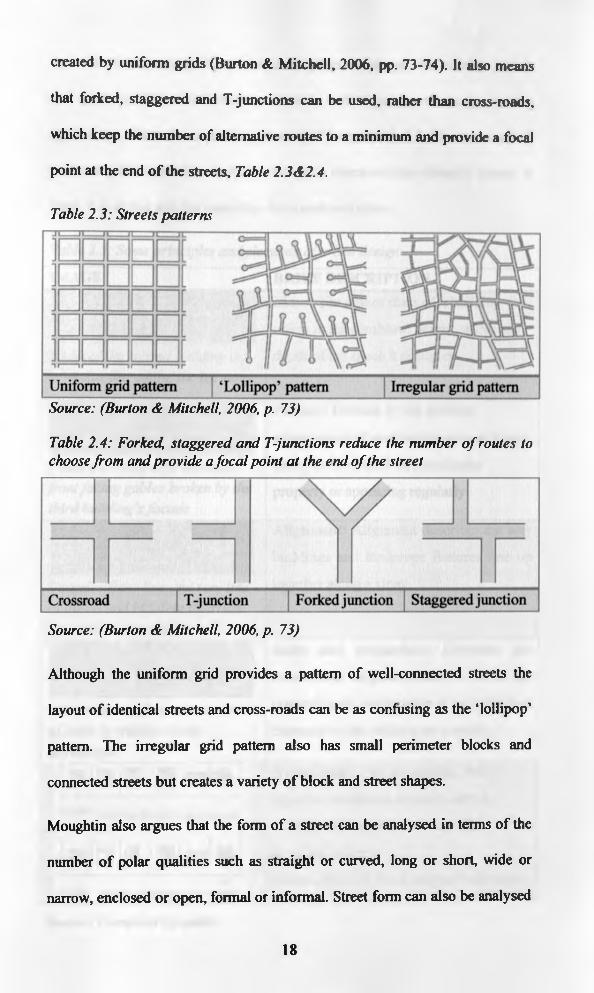
created by uniform grids (Burton & Mitchell, 2006, pp. 73-74). It also means
that forked, staggered and T-junctions can be used, rather than cross-roads,
which keep the number of alternative routes to a minimum and provide a focal
point at the end o f the streets. Table 2.3A2.4.
Table 2.3: Streets patterns
Source: (Burton & Mitchell, 2006, p. 73)
Table 2.4: Forked, staggered and T-junctions reduce the number o f routes to choose from and provide a focal point at the end o f the street
Source: (Burton & Mitchell, 2006, p. 73)
Although the uniform grid provides a pattern of well-connected streets the
layout of identical streets and cross-roads can be as confusing as the ‘lollipop’
pattern. The irregular grid pattern also has small perimeter blocks and
connected streets but creates a variety o f block and street shapes.
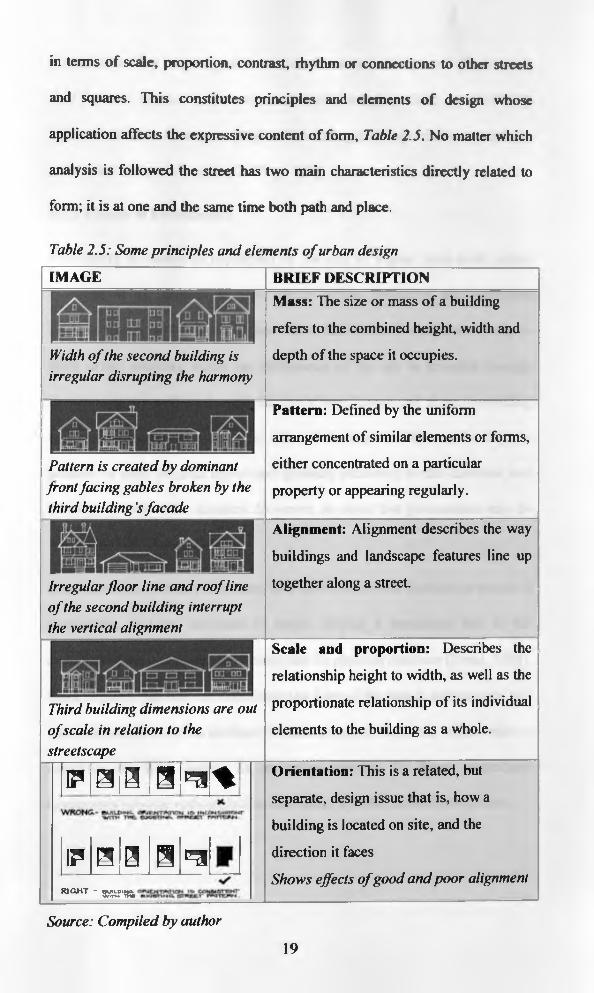
Moughtin also argues that the form of a street can be analysed in terms of the
number o f polar qualities such as straight or curved, long or short, wide or
narrow, enclosed or open, formal or informal. Street form can also be analysed
18
in terms of scale, proportion, contrast, rhythm or connections to other streets
and squares. This constitutes principles and elements o f design whose
application affects the expressive content o f form, Table 2.5. No matter which
analysis is followed the street has two main characteristics directly related to
form; it is at one and the same time both path and place.
Table 2.5: Some principles and elements o f urban design
IMAGE BRIEF DESCRIPTION
Width o f the second building is irregular disrupting the harmony
Pattern is created by dominant front facing gables broken by the third building’s facade
Irregular floor line and roof line o f the second building interrupt the vertical alignment
Third building dimensions are out o f scale in relation to the streetscape
F [B ia ,B l^ f+
IP a a a par a a H T ■ zrx'm
Mass: The size or mass o f a building
refers to the combined height, width and
depth of the space it occupies.
Pattern: Defined by the uniform
arrangement of similar elements or forms,
either concentrated on a particular
property or appearing regularly.
Alignment: Alignment describes the way
buildings and landscape features line up
together along a street.
Scale and proportion: Describes the
relationship height to width, as well as the
proportionate relationship of its individual
elements to the building as a whole.
Orientation: This is a related, but
separate, design issue that is, how a
building is located on site, and the
direction it faces
Shows effects o f good and poor alignment
Source: Compiled by author
19
Streets have often been regarded as routes for motor vehicles to the extent that
their function as place have been overlooked (Moughtin, 2003, pp. 133-134).
The ratio of width o f street to height o f enclosing buildings remains critical for
good street design (Moughtin, 2003, p. 141).
2.2.2 Theory of Permanence
This theory is related to hypothesis o f the city as a giant man-made object
produced in the process of time, which affects collective and individual
artefacts (Rossi, 1984). Rossi argues ‘urban history’ is the most useful way to
study urban structure where the persistence of the city is revealed through
‘monuments’ as well as through the city’s basic layout and plans. According
to Rossi, cities try to retain their axis of development by maintaining the
position of their original layout and growing according to the direction and
meaning of their older artefacts. However, he notes that permanence may be
‘propelling’ or ‘Pathological’.
Rossi identifies ‘Primary Elements’ o f a city as those that function as nuclei of
aggregation, and are dominant in nature playing a permanent role in the
evolution of the city overtime to constitute its physical structure (Rossi, 1984).
Rossi explains that one can experience the form of the past in monuments, and
that monuments as urban artefacts become important elements which helps to
constitute the total picture of an urban context. To Rossi, sometimes
monuments become pathological as they stand in isolation from the present.
20

2 3 URBAN MORPHOLOGY
Urban morphology approaches human settlements as generally unconscious
products that emerge over long periods, through the accrual of successive
generations of building activity. This leaves traces that serve to structure
subsequent building activity and provide opportunities and constraints for city
building processes, such as land subdivision, infrastructure development, or
building construction. Articulating and analysing the logic of these traces is
the central question of urban morphology.
Urban morphology provides an understanding of the form, creation and
transformation processes, spatial structure and character of human settlements
through an analysis of historical development processes and the constituent
parts that composes the settlements, (T0P911, 2012, p. 2). In this essence, urban
morphology is used as an important assessment tool or method in determining
the change-transformation processes o f urban fabrics, making sense of the
historical roots o f spatial and functional structures and bringing them to the
present day. The basic premises for the typo-morphological studies are hinged
on three main principles (Top^u, 2012, p. 2):
(i) Urban form is defined by three fundamental physical elements:
buildings and their related open spaces, plots or lots, and streets.
(ii) Urban form can be understood at different levels of resolution.
Commonly, four are recognized corresponding to the building/lot, the
street/block, the city and the region.
(iii) Urban form can be understood historically since the elements of which
it is comprised undergo continuous transformation and replacement.
21

Conzen considered land uses, building structures, plot pattern and street
pattern to be the most important (Conzen, I960)3. Buildings, particularly the
land uses they accommodate, are usually the least resilient elements. Although
more enduring, the plot pattern changes over time as individual plots are
subdivided or amalgamated. The Street plan also tends to be the most enduring
element. On the other hand, the main topic of the studies conducted by (ICrier,
1979) was the examination of urban history and historical urban pieces
through morphological and typological analyses, while (Rossi, 1984) studied
sociological, cultural and psychological reasons for the formation of urban
form and fabric. Considering the diverse approaches used by scholars, it was
necessary to preview some of the tools used in morphological studies.
23.1 Space Syntax
This theory studies space4 as a pattern of relationships (Peponis, 2002). It
attempts to make explicit the spatial relationships that underlie our everyday
experience of the designed environment and the way it functions culturally
and socially. The aim of space syntax is to arrive at an understanding of
principles of spatial design and a critical evaluation of precedents and
prospects. Syntactic analysis is a space-based and evidence-based way of
bringing architecture, urban design, planning and transport planning together
(Hillier & Tim, 2010). It assumes there is an intelligible structure to built
space as it is perceived and explored by users moving through space.
3See (Topcu, 2012, p. 2)
4 Spaces are understood as voids (streets, squares, rooms, fields, etc.) between walls, fences and other impediments or obstructions that restrain (pedestrian) traffic and/or the visual field.
22
1 o deal with street connectivity and design, it represents space as a network of
potential lines of movement. It studies the possible paths that link any two
locations (topology); number of direction changes along a path (directional
structure); distance between intersections, length of uninterrupted street lines,
and streets widths (metric properties) in street networks. It assumes basic
dynamics of the city as a form-function where movement-seeking land uses
seek locations that are movement-rich, while others, often including
residences, migrate to less-movement rich parts of the network, with feedback
and multiplier effects, that is, where one shop appears, others tend to follow. It
also assumes that streets from which other streets can be reached with fewer
directional changes attract more people. This then tend to attract retail and
other land uses that depend on the volumes of pedestrian traffic, and
consequently the volumes of both pedestrians and uses are multiplied.
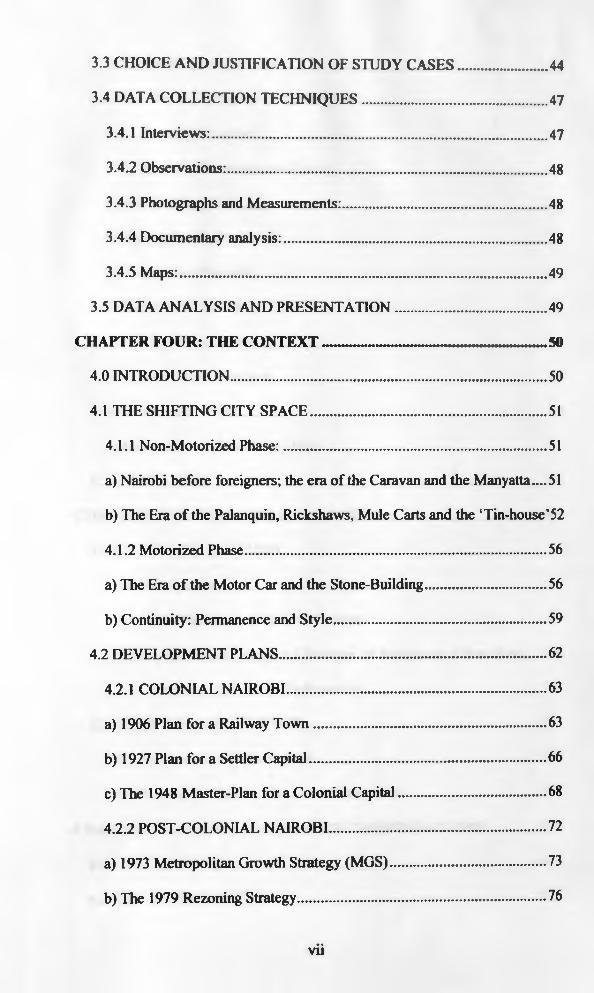
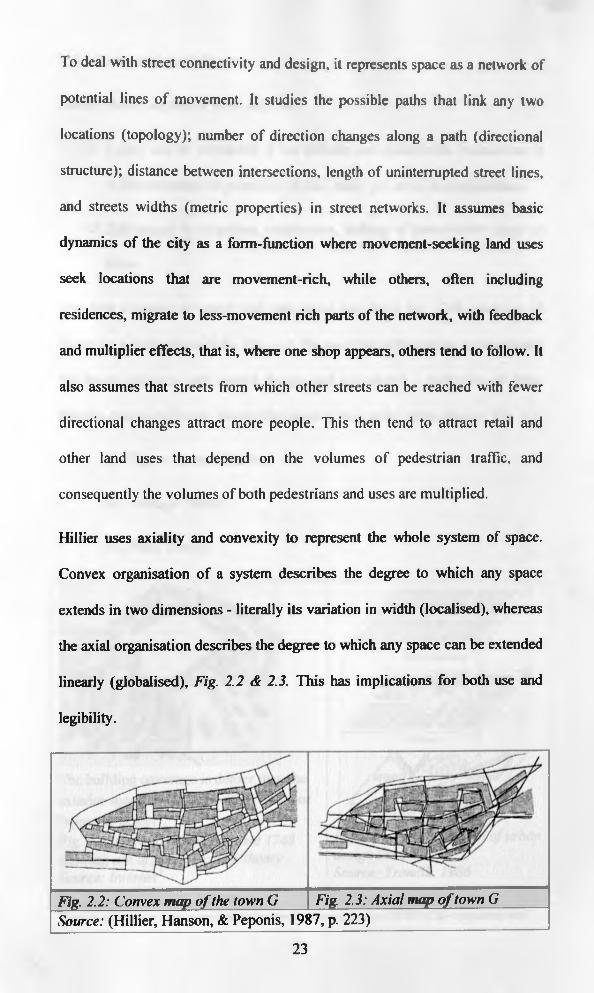
Hillier uses axiality and convexity to represent the whole system of space.
Convex organisation of a system describes the degree to which any space
extends in two dimensions - literally its variation in width (localised), whereas
the axial organisation describes the degree to which any space can be extended
linearly (globalised), Fig. 2.2 & 2.3. This has implications for both use and
legibility.
Fig. 2.2: Convex map o f the town G Fig. 2.3: Axial map o f town GSource: (Hillier, Hanson, & Peponis, 1987, p. 223)
23
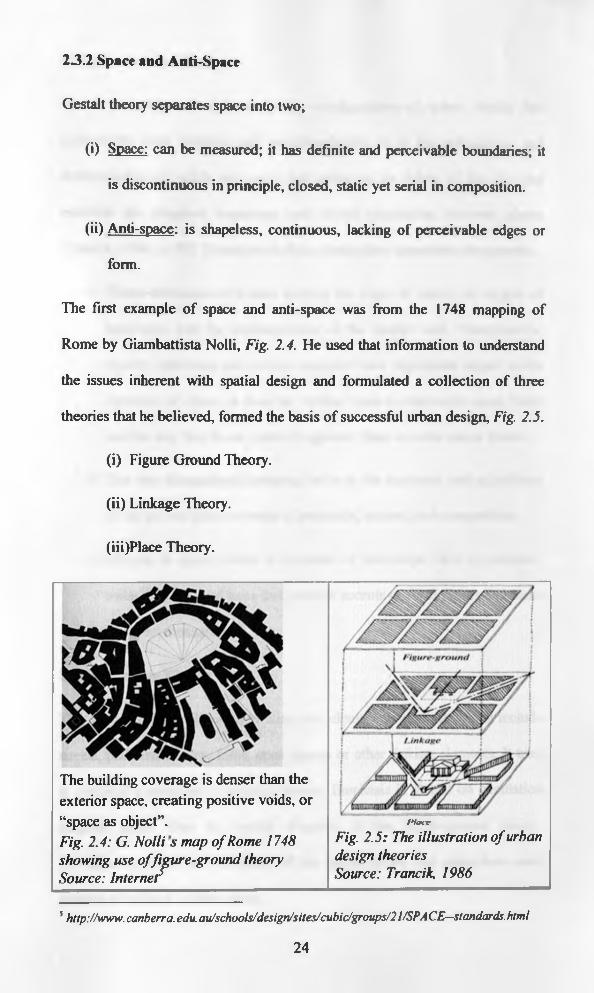
23.2 Space and Anti-Space
Gestalt theory separates space into two;
(i) Space: can be measured; it has definite and perceivable boundaries; it
is discontinuous in principle, closed, static yet serial in composition.
(ii) Anti-space: is shapeless, continuous, lacking of perceivable edges or
form.
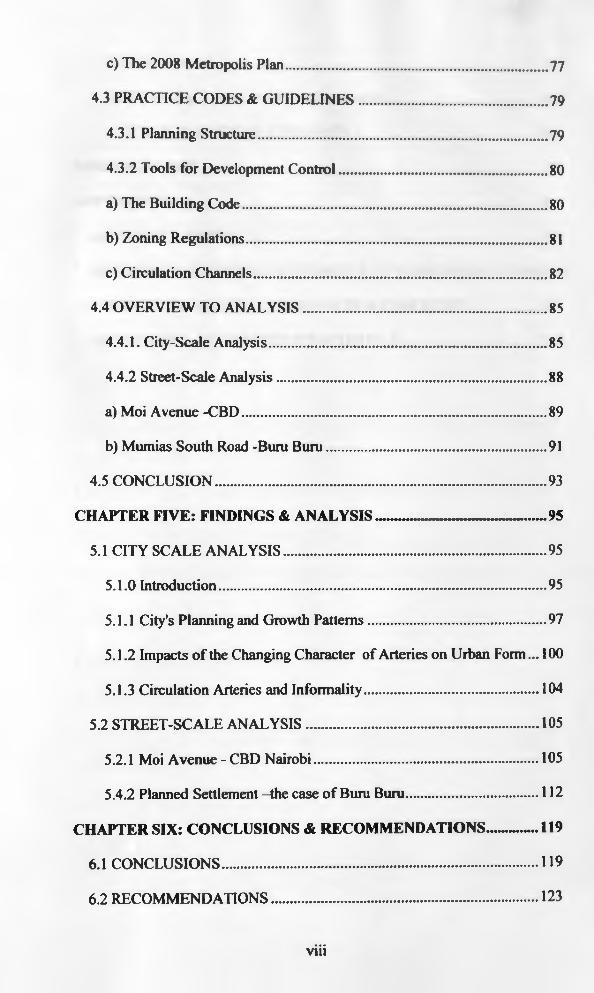
The first example of space and anti-space was from the 1748 mapping of
Rome by Giambattista Nolli, Fig. 2.4. He used that information to understand
the issues inherent with spatial design and formulated a collection of three
theories that he believed, formed the basis of successful urban design, Fig. 2.5.
(i) Figure Ground Theory.
(ii) Linkage Theory.
(iii) Place Theory.
The building coverage is denser than the exterior space, creating positive voids, or “space as object”.Fig. 2.4: G. Nolli s map o f Rome 1748 showing use o f fiptre-ground theory Source: Internet5
ria v r
Fig. 2.5: The illustration o f urban design theories Source: Traneik. 1986
5 http://www. Canberra, edu. au/schools/design/sites/cubic/groups/21/SPA CE—standards, html
24
a) Figure Ground Theory
Spatial orientation is defined by the configuration of urban blocks that
collectively form districts and neighbourhoods. It is the articulation and
differentiation o f solids and voids that make up the fabric o f the city and
establish the physical sequences and visual orientation between places
(Trancik, 1986, p. 97). Precedent studies reveals three important components:
(i) Three-dimensional frame; defines the edges of space, the degree of
enclosure, and the characteristics of the spatial wall. Transparency,
opacity, openings, and surface ornament have significant impact on the
character o f space, as does the vertical mass to horizontal space. Scale
and the way this frame meets the ground plane are also major factors.
(ii) The two-dimensional pattern; refers to the treatment and articulation
of the ground plane in terms of materials, texture, and composition.
(iii) Objects in space; refers to elements of streetscape such as sculpture,
water features, and trees that provide accents or focal points and make
the street memorable.
b) The Linkage Theory
This is derived from lines connecting one element to another, which include
streets, pedestrian ways, linear open spaces or other linking elements. It tries
to establish a structure of ordering streets. Emphasis is placed on circulation
diagram rather than the spatial diagram of the figure-ground theory.
Movement systems and efficiency of the infrastructure take precedents over
patterns o f defined outdoor space.
25
c) The Place Theory
Place theory adds the aspects of human needs, cultural, historical and natural
contexts, which it offers the physical space additional richness by
incorporating unique forms and details indigenous to the setting. Socio
cultural values and visual perception of space users are important
considerations for the design of circulation channels.
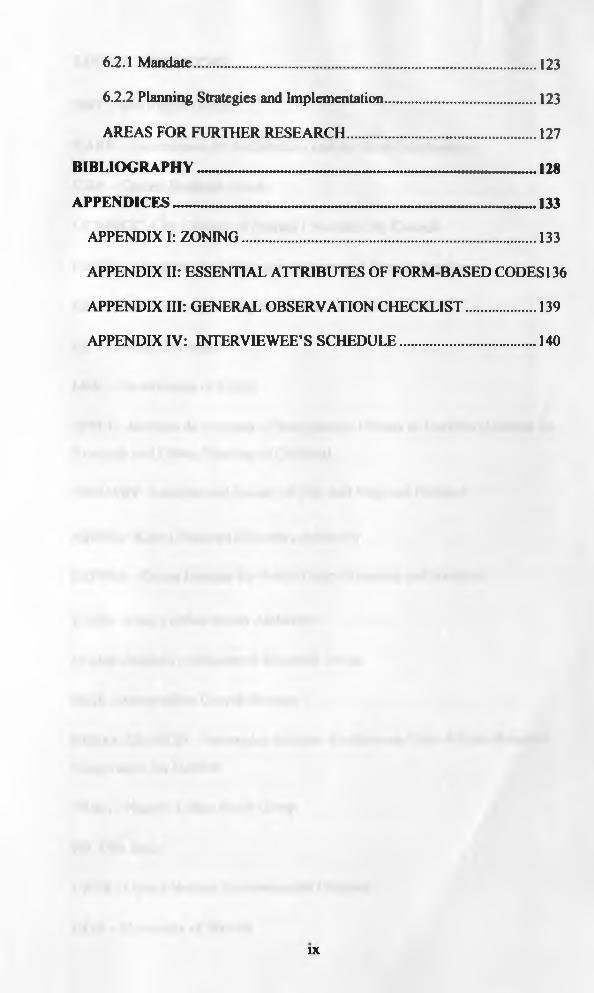
2 3 3 Transects
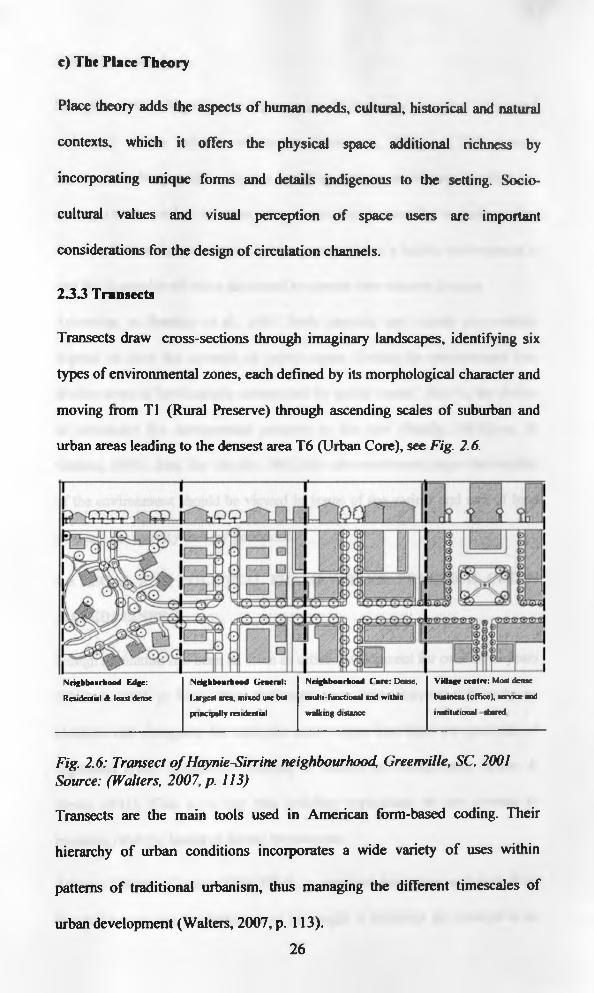
Transects draw cross-sections through imaginary landscapes, identifying six
types of environmental zones, each defined by its morphological character and
moving from T1 (Rural Preserve) through ascending scales of suburban and
urban areas leading to the densest area T6 (Urban Core), see Fig. 2.6.
Neighbourhood Edge:
Residential & least dense
Neighbourhood General:
largest area, mixed use but
principally residential
Neighbourhood ( ’ore: Dense,
m ulti-functional and within
w alking distance
Village centre: Most dense
business (office), service and
institutional shared
Fig. 2.6: Transect o f Haynie-Sirrine neighbourhood, Greenville, SC, 2001 Source: (Walters, 2007, p. 113)
Transects are the main tools used in American form-based coding. Their
hierarchy of urban conditions incorporates a wide variety of uses within
patterns of traditional urbanism, thus managing the different timescales of
urban development (Walters, 2007, p. 113).
26
2.3.4 Visual Analysis
Moughtin defines legibility as the ways in which people perceive, understand
and react to the urban environment (Moughtin, 2003, p. 220). Lynch
developed techniques for analysing legibility and suggested ways in which the
concept can be used to structure urban environments classified as paths, nodes,
districts, landmarks and edges.. He demonstrated that a legible environment is
one that is capable of being structured by people into accurate images.
According to Bentley et al, 1985 ‘both physical and visual permeability
depend on how the network of public space divides the environment into
blocks: areas of land entirely surrounded by public routes’, that is, the choice
of movement the environment presents to the user (Bently, McGlynn, &
Graham, 1985). Just like (Jacobs, 1961) the aforementioned argue that vitality
of the environment should be viewed in terms of the variety and mix of land
uses and the activity thereby generated.
2.4 LEGAL AND POLITICAL FRAMEWORKS: PRACTICE, CODES
& GUIDELINES
Design regulation has been an issue in cities development for over 2000 years
(Walters, 2007, p. 83). Urban challenges have been analyzed differently by
planners and designers for example some argue that they are products of
regulation crisis, calculative thinking or burden o f management (Imrie &
Street, 2011). This is to say that building regulations do not emerge in
isolation, or at the hands of distant bureaucrats.
Arthur Coleman Comey (1886-1954), a graduate landscape architect from
Harvard argues that the limitation of the height of buildings for example is an
27
important issue in civic development, affecting land values and character of
larger cities. In determining a reasonable regulation of height, he argues it will
be noticed that factors of congestion, light, air, and to a large extent the
architectural effect vary in nearly a direct ratio as the width o f the street upon
which the building faces. He thus concludes that the width of street would
seem to be an essential element in the regulation of building heights.
Despite several similarities o f objectives and techniques, the differences
between the planning/design systems in different countries make easy transfer
of concepts and methodologies from one country to another difficult. There
has been much discussion comparing Britain’s Plan-led Regulations/Codes
and American Form-Based Zoning Ordinances which I examine briefly.
2.4.1 British Use-Based /Plan-Led Codes
Planning practice in Britain has been shaped for long by detailed guidance
notes on planning policy issued by the central government; which establishes
the objectives and preferred mechanisms for action to be adopted by local
governments. In this system, private developers are expected to follow
planning directives to get their projects approved, and only in exceptional
cases will developments that do not comply with the plan be permitted.
However, the government has radically overhauled the planning system, and is
seeking to guarantee better design through design coding. This is because it
was observed that so much suburban development in Britain was falling below
expected standards, thus beginning in the 1990s, British planning policies
begun to embrace urban design concepts (Walters, 2007, p. 12). A greater part
of it is attributed to Gordon Cullen’s ‘Notation’ system developed in the mid-
28
1960s meant to improve the standards of new housing design in the towns and
villages, which was well illustrated and full of sensible advice about urban
spaces and contextual architecture.
In recognition o f the importance o f Urban Design, Britain conceived
Commission for Architecture and the Built Environment (CABE)6 (Walters,
2007, p. 62). In a 2002 document by CABE 4Urban Design Guidance \ her
author Robert Cowan wrote:
"... a master plan should show in some detail how the principles are to
be implemented. I f the master plan shows an area designated for
mixed-use development, ...it should show a layout (of buildings, streets
and other public spaces) that will support such uses ... by ensuring
that the footprints o f the buildings are appropriate ... (Cowan: p.
13)7"
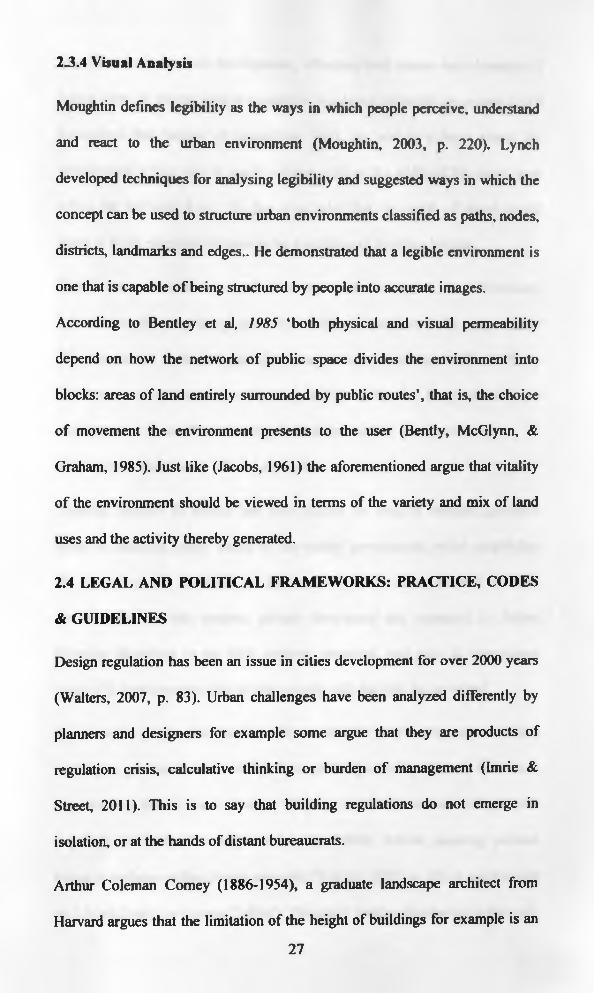
Current typical master plans sets out proposals for buildings, spaces,
movement and land use in three dimensions and match these aspirations with
an implementation strategy, Fig. 2.7. This new scope and content for master
plans is very similar to the American one where urban design guidelines and
codes act as the generative ‘DNA’, establishing consistent design principles
across a wide range of projects (Walters, 2007, pp. 92-93).
6 the government’s advisory body on architecture and the built environment
7 In (Walters, 2007)
29
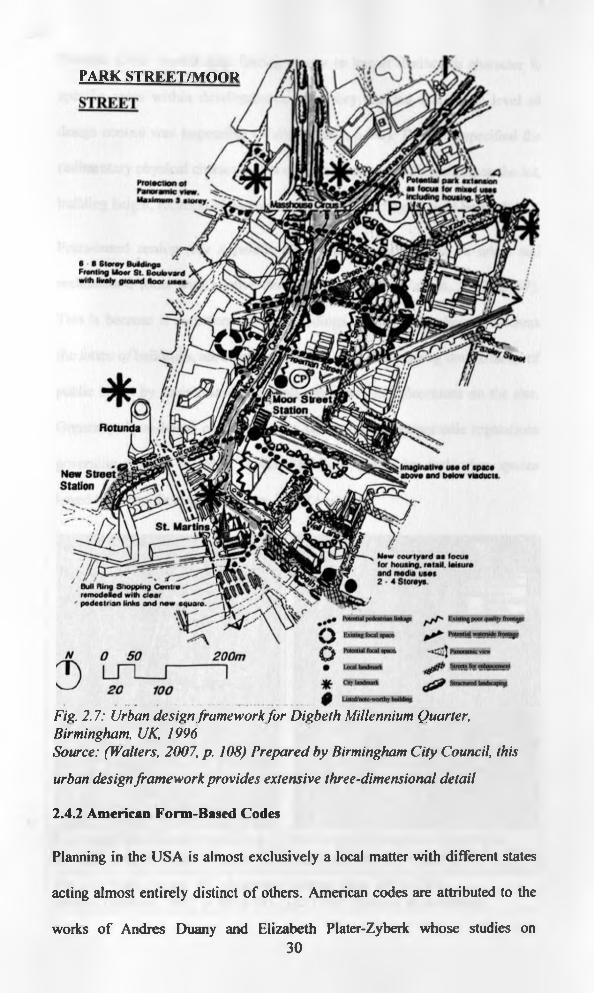
PARK STREET/MOO!*
Fig. 2.7: Urban design framework for Digbeth Millennium Quarter, Birmingham, UK, 1996Source: (Walters, 2007, p. 108) Prepared by Birmingham City Council, this
urban design framework provides extensive three-dimensional detail
2.4.2 American Form-Based Codes
Planning in the USA is almost exclusively a local matter with different states
acting almost entirely distinct of others. American codes are attributed to the
works o f Andres Duany and Elizabeth Plater-Zyberk whose studies on30
‘Seaside Code’ ended with finding a way to impart distinctive character to
specific areas within developments, after they realized that high level of
design control was impossible (Walters, 2007, p. 90). The code specified the
rudimentary physical characteristics of each class, controlling siting on the lot,
building height, location of porches and how outbuildings should be handled.
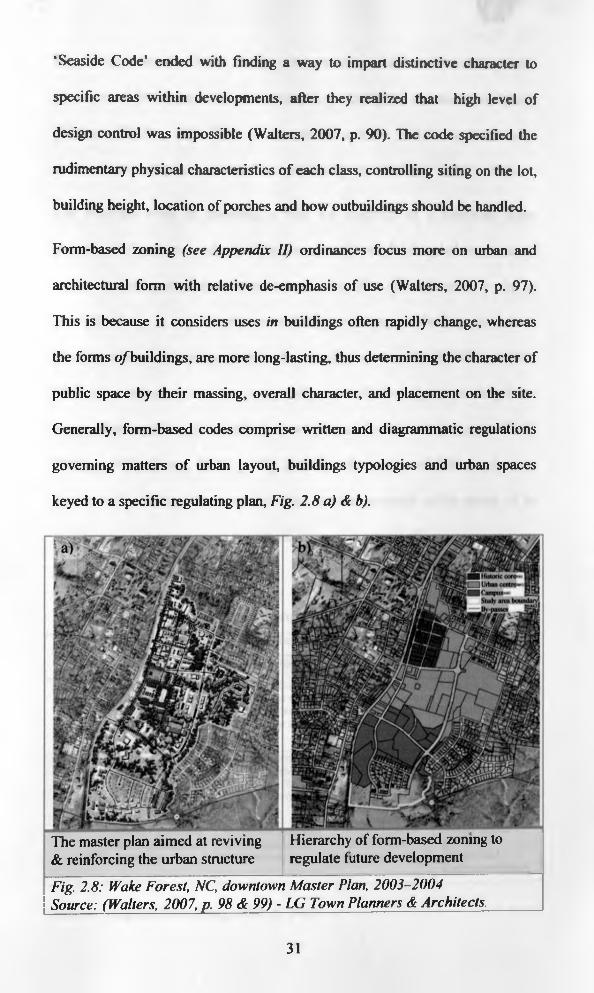
Form-based zoning (see Appendix II) ordinances focus more on urban and
architectural form with relative de-emphasis of use (Walters, 2007, p. 97).
This is because it considers uses in buildings often rapidly change, whereas
the forms o/buildings, are more long-lasting, thus determining the character of
public space by their massing, overall character, and placement on the site.
Generally, form-based codes comprise written and diagrammatic regulations
governing matters of urban layout, buildings typologies and urban spaces
keyed to a specific regulating plan, Fig. 2.8 a) & b).
Fig. 2.8: Wake Forest, NC, downtown Master Plan, 2003-2004 Source: (Walters, 2007, p. 98 & 99) - LG Town Planners & Architects.
The master plan aimed at reviving & reinforcing the urban structure
Hierarchy of form-based zoning to regulate future development
31
Regulating plans are almost always site specific and derived from the master
plan created for a particular development, normally by a community group
(Walters, 2007, p. 98). Both the American and the British systems codes
streets & sidewalks as a series of hierarchical types, (Walters, 2007, p. 135).
The Marxian view of planning is that the structure of a capitalist state,
including its land-uses and activity patterns, is the result of capital in pursuit of
profit and since capitalism wishes to circumscribe state planning as far as
possible, there is an in-built contradiction creating an inadequacy where
planning always solves one problem by creating another, (Hall, 2002, p. 369).
Well stipulated plans however can provide a set of clear signals to the private
sector, thus enabling it to make its own phased investment programs (Hall,
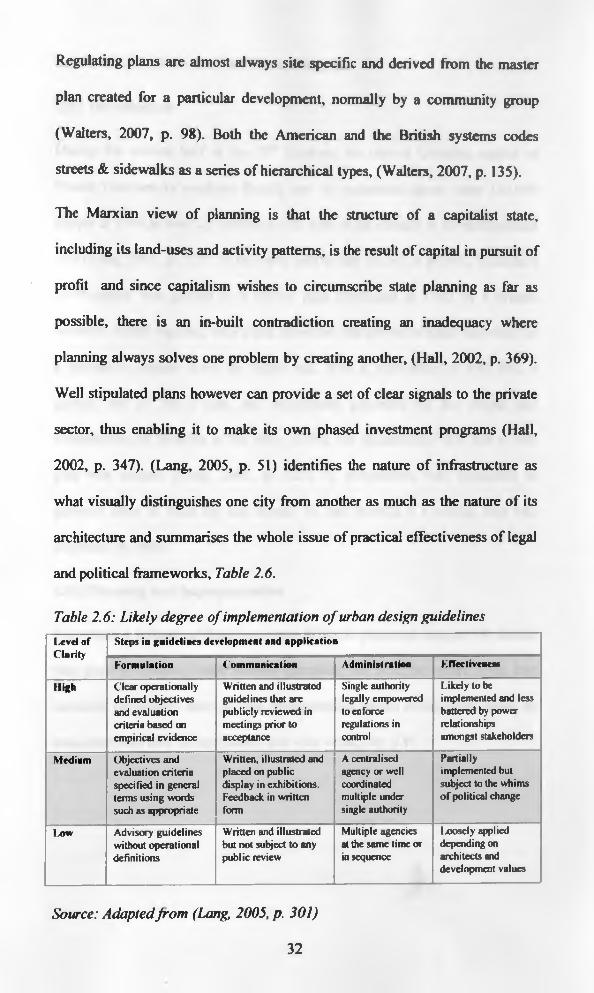
2002, p. 347). (Lang, 2005, p. 51) identifies the nature o f infrastructure as
what visually distinguishes one city from another as much as the nature of its
architecture and summarises the whole issue of practical effectiveness of legal
and political frameworks, Table 2.6.
Table 2.6: Likely degree o f implementation o f urban design guidelinesI * v e l o f
C la r ity
S te p s in g u id e l in e s d e v e lo p m e n t a n d a p p l ic a t io n
F o r m u la t io n C o m m u n ic a t io n A d m in is tr a tio n E ffe c t iv e n e ss
H ig h Clear operationally defined objectives and evaluation criteria based on empirical evidence
Written and illustrated guidelines that are publicly reviewed in meetings prior to acceptance
Single authority legally empowered to enforce regulations in control
Likely to be implemented and less battered by power relationships amongst stakeholders
M e d iu m Objectives and evaluation criteria specified in general terms using words such as appropriate
Written, illustrated and placed on public display in exhibitions. Feedback in written form
A centralised agency or well coordinated multiple under single authority
Partially implemented but subject to the whims of political change
I.OW Advisory guidelines without operational definitions
Written and illustrated but not subject to any public review
Multiple agencies at the same time or in sequence
Loosely applied depending on architects and development values
Source: Adaptedfrom (Lang, 2005, p. 301)
32
2.5 DESK-STUDY OF CURITIBA, BRAZIL
2.5.1 Introduction
During the second half of the 20* Century, the city of Curitiba, capital of
ParanA Province in southern Brazil, saw its population grow from 120,000
people in 1940 to over 2.5 million by the turn of the century in its metropolitan
area (Lang, 2005, p. 325). In the early part of this period of growth, Curitiba’s
development was guided by a master plan developed in 1943 by a French
urbanist, Alfred Agache, which had proposed that growth should take place in
a concentric manner from the centre out. With a population of 470, 000, a
growth rate of 5% a year, and excitement generated by the design and
development of Brasilia in the early 1960s, the municipality felt that a new
plan was needed (Lang, 2005, p. 325). A competition was organized to
generate ideas o f what the city should be, and through it a zoning map was
proposed by 1965.
2.5.2 Planning and Implementation
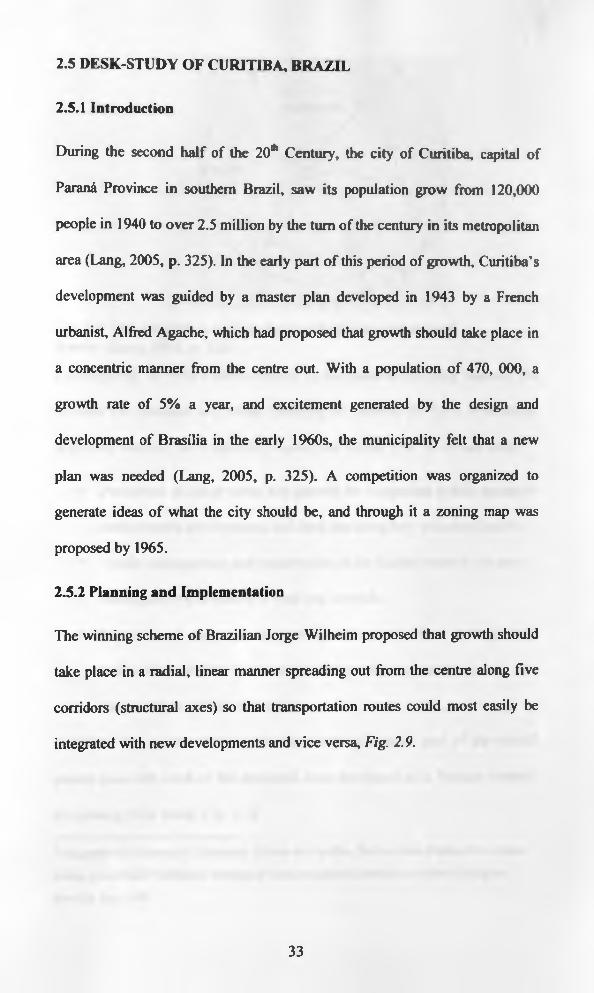
The winning scheme of Brazilian Jorge Wilheim proposed that growth should
take place in a radial, linear manner spreading out from the centre along five
corridors (structural axes) so that transportation routes could most easily be
integrated with new developments and vice versa, Fig. 2.9.
33
Fig. 2.9: The integration conceptshowing the five structural axes Source: (Lang, 2005, p. 326)
Consequently, in 1966 Curitiba created an independent planning institute, the
Institute for Research and Urban Planning of Curitiba (IPPUC), to develop,
supervise, monitor, and continually update the Master Plan. Its values were:8
■ Promotion of linear urban city growth by integrating public transport,
road network development, and land use along key ‘structural axes’;
■ Traffic decongestion and preservation of the historic central city core;
■ Management and control of land use citywide;
■ Provision o f economic support incentives to urban developers to
realize land use aims and to assist in employment generation; and
■ Improvement of infrastructure.
Curitiba’s bus system was thus developed as an integral part of the overall
master plan with each of the structural axes developed as a “trinary system”
comprising three roads, Fig. 2.10.
8 Integracao do Sistema de Transporte Urbano de Curitiba, Buleze-Melo-Fialho-Neto-Junior- Karas, presented at Technical Meeting of Latin American Countries on Urban Transport,
Brasilia, Sept 1985
34
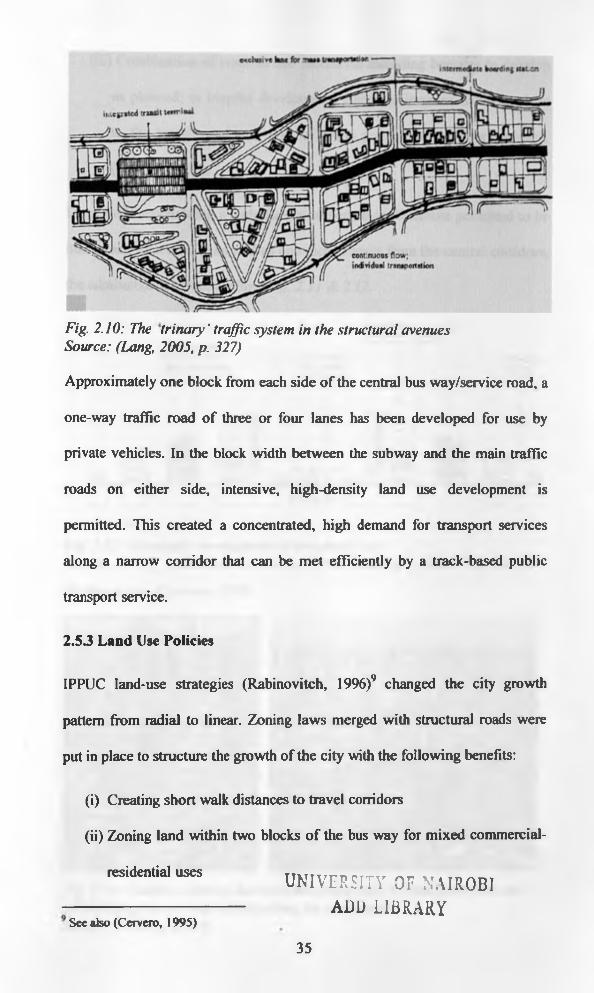
Fig. 2.10: The trinary ’ traffic system in the structural avenues Source: (Lang, 2005, p. 327)
Approximately one block from each side of the central bus way/service road, a
one-way traffic road of three or four lanes has been developed for use by
private vehicles. In the block width between the subway and the main traffic
roads on either side, intensive, high-density land use development is
permitted. This created a concentrated, high demand for transport services
along a narrow corridor that can be met efficiently by a track-based public
transport service.
2.53 Land Use Policies
IPPUC land-use strategies (Rabinovitch, 1996)9 changed the city growth
pattern from radial to linear. Zoning laws merged with structural roads were
put in place to structure the growth of the city with the following benefits:
(i) Creating short walk distances to travel corridors
(ii) Zoning land within two blocks o f the bus way for mixed commercial-
residential uses U N I V E R S I T Y O F N A IR O B I
— ADD LIBRARYSee also (Cervero, 1995)
35
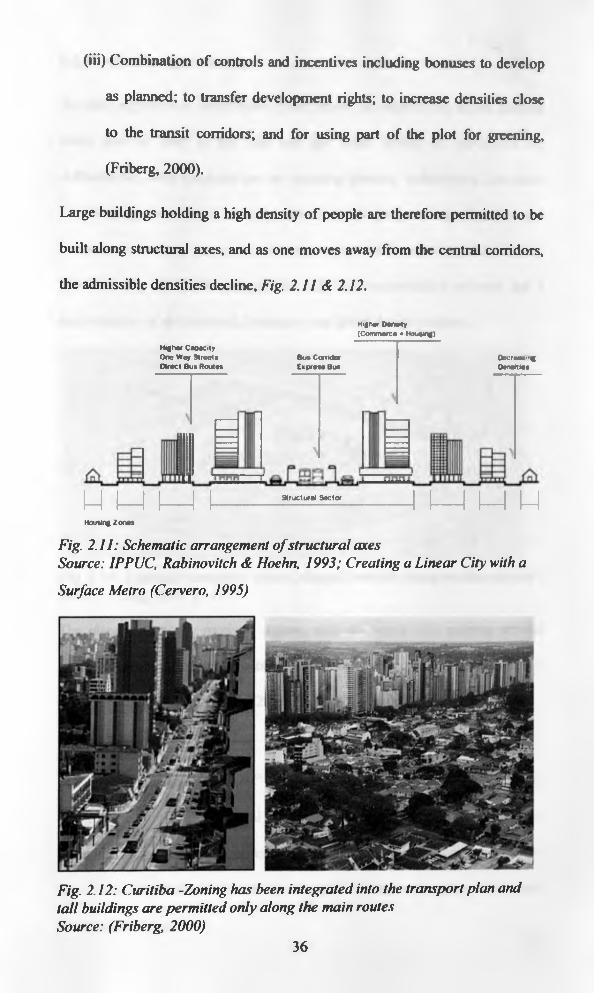
(iii) Combination of controls and incentives including bonuses to develop
as planned; to transfer development rights; to increase densities close
to the transit corridors; and for using part of the plot for greening,
(Friberg, 2000).
Large buildings holding a high density o f people are therefore permitted to be
built along structural axes, and as one moves away from the central corridors,
the admissible densities decline, Fig. 2.11 & 2.12.
Fig. 2.12: Curitiba -Zoning has been integrated into the transport plan and tall buildings are permitted only along the main routes Source: (Friberg, 2000)
H u her Capacity One Wuy Streets Direct Bus Routes
M M I — IHousing Zones
Higher Density (Commerce ♦ Housing)
Bus Corridor Express Bus
DecreasingDensities
Structural Sector I— I M W
Fig. 2.11: Schematic arrangement o f structural axesSource: IPPUC, Rabinovitch & Hoehn, 1993; Creating a Linear City with a
Surface Metro (Cervero, 1995)
36
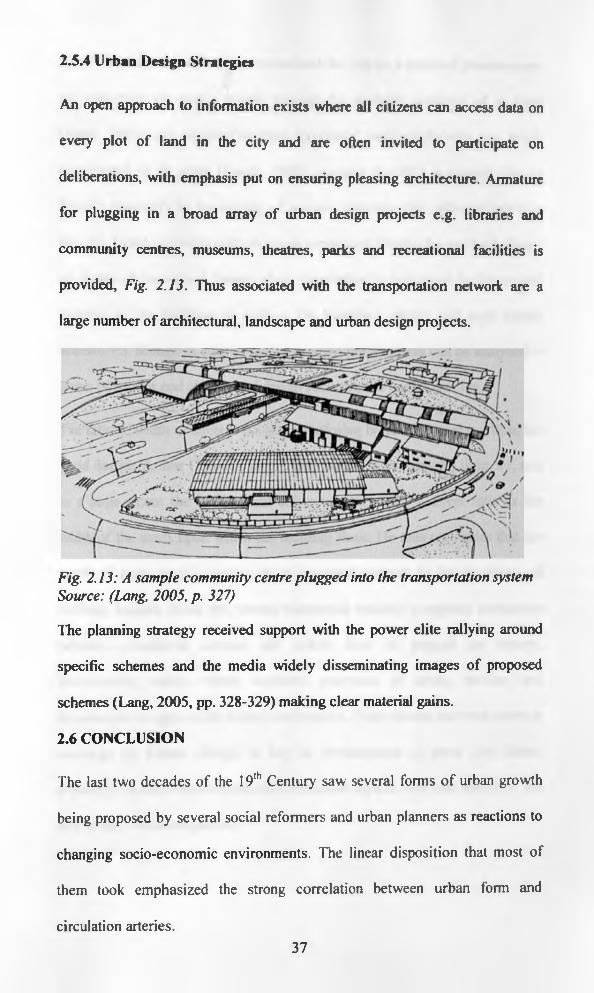
2.5.4 Urban Design Strategies
An open approach to information exists where all citizens can access data on
every plot of land in the city and are often invited to participate on
deliberations, with emphasis put on ensuring pleasing architecture. Armature
for plugging in a broad array of urban design projects e.g. libraries and
community centres, museums, theatres, parks and recreational facilities is
provided, Fig. 2.13. Thus associated with the transportation network are a
large number of architectural, landscape and urban design projects.
Fig. 2.13: A sample community centre plugged into the transportation system Source: (Lang, 2005, p. 327)
The planning strategy received support with the power elite rallying around
specific schemes and the media widely disseminating images of proposed
schemes (Lang, 2005, pp. 328-329) making clear material gains.
2.6 CONCLUSION
The last two decades of the 19th Century saw several forms of urban growth
being proposed by several social reformers and urban planners as reactions to
changing socio-economic environments. The linear disposition that most of
them took emphasized the strong correlation between urban form and
circulation arteries.37
Rossi’s abstract theoretical idea conceived the city as a physical phenomenon,
an instrument for man’s delight through the aesthetic potential of its form
(Rossi, 1984). His object of analysis ‘typology’ analysed the city as a whole
constructed by its parts. (Lynch, 1960), presents legibility a concept akin to
Rossi’s especially in the identity of primary elements like paths as basics to
the city. Lynch connects paths to visual experience placing the aesthetic theory
on facets of perceptual theory where proportion is important to the overall
massing o f the building as well as the building's details and path related
accessories. Moughtin adds to this by arguing that the form can be analysed in
terms principles and elements of design such as scale and proportion.
The ratio of width of street to height of enclosing buildings remains critical for
good design. Arthur Coleman argues that factors of congestion, light, air, and
to a large extent the architectural effect vary in nearly a direct ratio as the
width of the street upon which the building faces. He thus concludes that the
width of street would seem to be an essential element in the regulation of
building heights. From the various theoretical studies, it appears correlation
between circulation arteries and urban form is pegged on history,
functionality, safety, visual harmony, provision of urban services and
introduction of appropriate incentives/bonuses. These factors however seem to
converge on Urban Design as key in development of good city forms,
especially its three-dimensional and contextual aspects, and thus should be the
aim of any well-managed city.
38
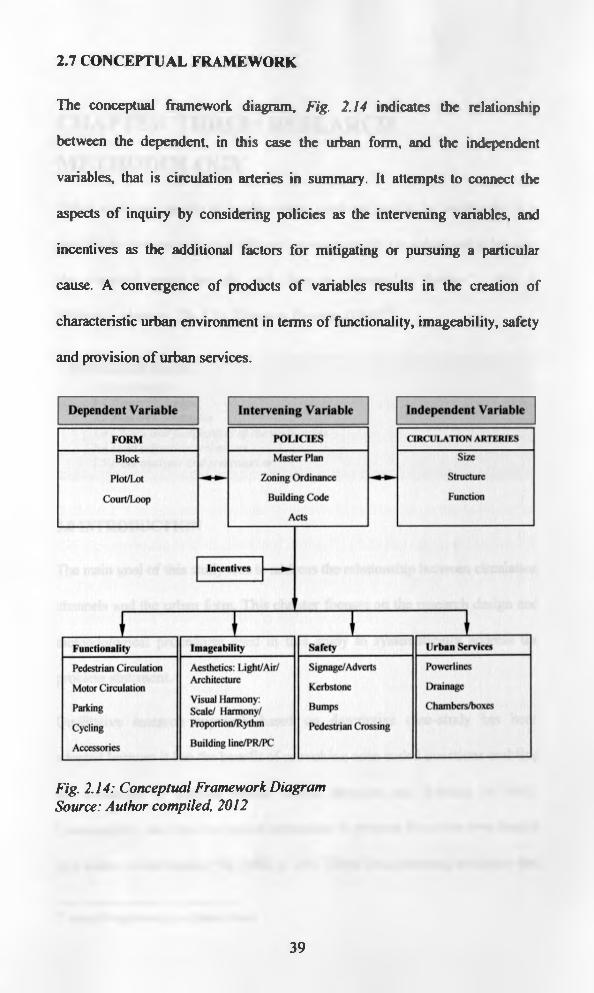
2.7 CONCEPTUAL FRAMEWORK
The conceptual framework diagram, Fig. 2.14 indicates the relationship
between the dependent, in this case the urban form, and the independent
variables, that is circulation arteries in summary. It attempts to connect the
aspects of inquiry by considering policies as the intervening variables, and
incentives as the additional factors for mitigating or pursuing a particular
cause. A convergence of products o f variables results in the creation of
characteristic urban environment in terms of functionality, imageability, safety
and provision of urban services.
Fig. 2.14: Conceptual Framework Diagram Source: Author compiled, 2012
39
CHAPTER THREE: RESEARCH
METHODOLOGY
When a planner speaks o f implementing goals rationally, he implies that it is
possible to demonstrate logically and experimentally the relationship between
the proposed means and the ends they are intended to further’ - Alan A.
Altshuler, planner, The City Planning Process (1965)10
CHAPTER OUTLINE:
3.0 Introduction3.1 Research design3.2 Research strategies3.3 Choice and justification o f the study cases3.4 Data collection techniques3.5 Data analysis and presentation
3.0 INTRODUCTION
The main goal o f this study was to address the relationship between circulation
channels and the urban form. This chapter focuses on the research design and
methodological procedures used in this study to systematically address the
problem statement.
Qualitative research approach based on descriptive case-study has been
adopted because it has the benefit of provoking open ended questions enabling
the researcher to explain factual issues, thoughts and feelings in detail.
Consequently, one can even ask a respondent to propose his or her own insight
into certain occurrences (Yin, 2002, p. 89). Three data gathering strategies that
10 www.aboutplanning.org/quotes.html
40
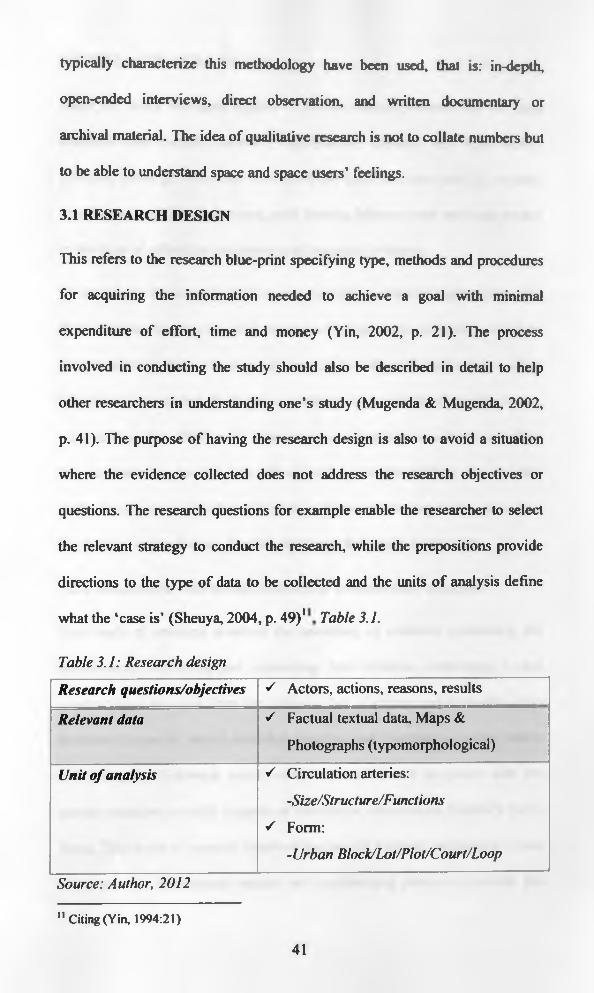
typically characterize this methodology have been used, that is: in-depth,
open-ended interviews, direct observation, and written documentary or
archival material. The idea of qualitative research is not to collate numbers but
to be able to understand space and space users’ feelings.
3.1 RESEARCH DESIGN
This refers to the research blue-print specifying type, methods and procedures
for acquiring the information needed to achieve a goal with minimal
expenditure of effort, time and money (Yin, 2002, p. 21). The process
involved in conducting the study should also be described in detail to help
other researchers in understanding one’s study (Mugenda & Mugenda, 2002,
p. 41). The purpose of having the research design is also to avoid a situation
where the evidence collected does not address the research objectives or
questions. The research questions for example enable the researcher to select
the relevant strategy to conduct the research, while the prepositions provide
directions to the type of data to be collected and the units o f analysis define
what the ‘case is’ (Sheuya, 2004, p. 49)1 Table 3.1.
Table 3.1: Research design
Research questions/objectives S Actors, actions, reasons, results
Relevant data S Factual textual data. Maps &
Photographs (typomorphological)
Unit o f analysis S Circulation arteries:
-Size/Structure/Functions
S Form:
-Urban Block/Lot/Plot/Court/Loop
Source: Author, 2012
"Citing (Yin, 1994:21)
41
3.2 RESEARCH STRATEGIES
There are many strategies applied in social sciences research but the most
common ones include surveys, experiments, histories and case studies
(Sheuya, 2004, p. 49). They are based on logic and are used to explore,
describe and explain phenomena, each bearing inherent pros and cons related
to the logic of collection and analysis o f empirical evidence.
To investigate the impact of circulation Arteries on Nairobi’s urban form, this
study employs two key research strategies (not mutually exclusive) guided by
three conditions, that is, the type of research, investigator’s control over actual
behavioural events and, the focus on contemporary and historical phenomena.
As noted by (Yin, 2002, p. 5), when the research question is ‘how’ or ‘why’,
and no control is needed over behavioural events the strategy can be case-
study. He however notes that if there is no focus on contemporary events, then
the strategy can be history. The two strategies then apply in this case.
3.2.1 Interpretive -Historical, Archival & Documentary Analysis:
This mode of research involved the searching of evidence concerning the
phenomenon, collecting and organizing that evidence, evaluating it and
constructing a narrative from the evidence that is holistic and believable. This
involved the use o f several available drawings and literature collected before
and during the fieldwork which were then studied and compared with the
current situation to verify impacts of circulation channels on Nairobi’s built-
forms. This mode o f research involved the uses of Archival documents—from
newspapers to institutional records and architectural plans—to provide the
42

required data. Non-verba] representations—especially plans and sketches—
were considered a special source of data.
To clearly understand Nairobi’s historical background and the contexts of her
architecture and planning, this study explored some elements of historical
research namely:
a) The pre-existing social and institutional, economic and physical
context in which developments in Nairobi occurred.
b) The various actors, i.e. Architects, organizations and institutions,
whose decisions and actions helped shape Nairobi’s Built Form.
c) The actions taken by the actors with the resources available.
d) The acts: The functions and forms of the works generated and their
impacts on the context and the resulting situation.
e) The lessons learnt from the experience.
Library research thus involved intensive analysis of relevant books, journals
and any other relevant publications relating to people’s perception of built
environment.
3.2.2 Case Study Strategy:
A case study is an empirical inquiry that investigates a phenomenon within its
real-life context, especially when the boundaries between phenomenon and
context are not clearly evident, (Yin, 2002, p. 13). This suited this study since
it covers contextual conditions with the belief that they may be pertinent to the
phenomena of study. According to (Yin, 2002, p. 15), case-study is a way of
investigating an empirical topic by following a set of pre-specified procedures.
43
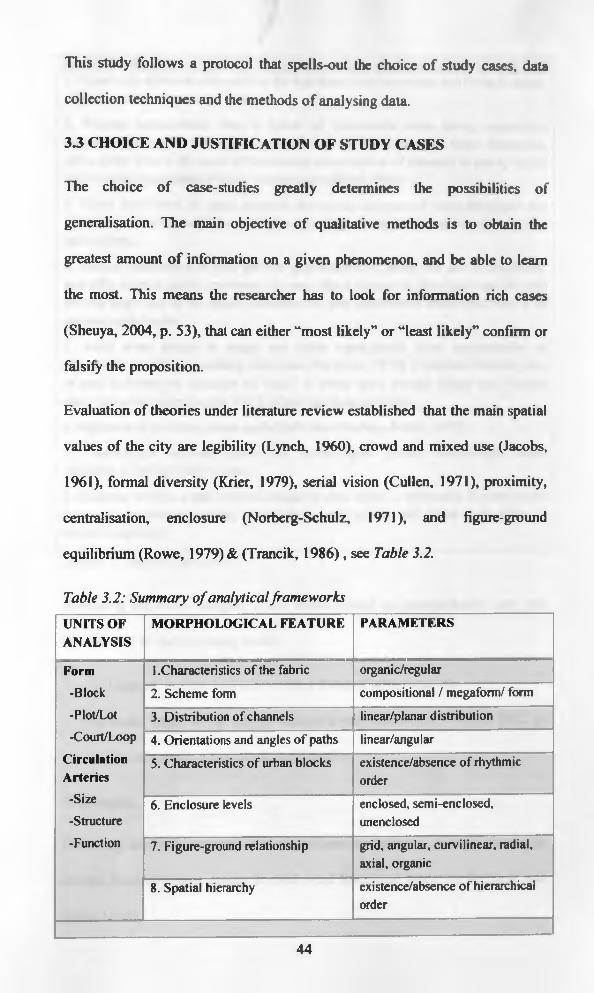
This study follows a protocol that spells-out the choice of study cases, data
collection techniques and the methods of analysing data.
3 3 CHOICE AND JUSTIFICATION OF STUDY CASES
The choice o f case-studies greatly determines the possibilities of
generalisation. The main objective of qualitative methods is to obtain the
greatest amount o f information on a given phenomenon, and be able to learn
the most. This means the researcher has to look for information rich cases
(Sheuya, 2004, p. 53), that can either “most likely” or “least likely” confirm or
falsify the proposition.
Evaluation of theories under literature review established that the main spatial
values of the city are legibility (Lynch, 1960), crowd and mixed use (Jacobs,
1961), formal diversity (Krier, 1979), serial vision (Cullen, 1971), proximity,
centralisation, enclosure (Norberg-Schulz, 1971), and figure-ground
equilibrium (Rowe, 1979) & (Trancik, 1986), see Table 3.2.
Table 3.2: Summary o f analytical frameworks
UNITS O F A N A LY SIS
M O R PH O LO G IC A L FEA TU R E PARAM ETERS
Form
-Block-Plot/Lot-Court/Loop
CirculationArteries
-Size-Structure-Function
I .Characteristics of the fabric organic/regular
2. Scheme form compositional / megaform/ form
3. Distribution of channels linear/planar distribution
4. Orientations and angles of paths linear/angular
5. Characteristics of urban blocks existence/absence of rhythmic order
6. Enclosure levels enclosed, semi-enclosed, unenclosed
7. Figure-ground relationship grid, angular, curvilinear, radial, axial, organic
8. Spatial hierarchy existence/absence of hierarchical order
44
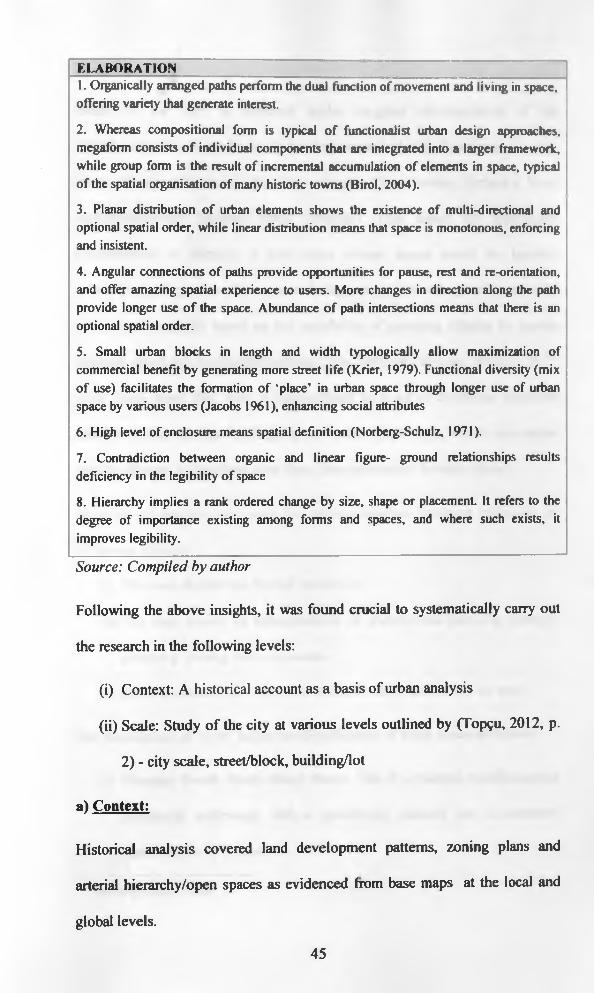
1. Organically arranged paths perform the dual function of movement and living in space, offering variety that generate interest.
2. Whereas compositional form is typical of functionalist urban design approaches, megaform consists of individual components that are integrated into a larger framework, while group form is the result of incremental accumulation of elements in space, typical of the spatial organisation of many historic towns (Birol, 2004).
3. Planar distribution of urban elements shows the existence of multi-directional and optional spatial order, while linear distribution means that space is monotonous, enforcing and insistent.
4. Angular connections of paths provide opportunities for pause, rest and re-orientation, and offer amazing spatial experience to users. More changes in direction along the path provide longer use of the space. Abundance of path intersections means that there is an optional spatial order.
5. Small urban blocks in length and width typologically allow maximization of commercial benefit by generating more street life (Krier, 1979). Functional diversity (mix of use) facilitates the formation of ‘place’ in urban space through longer use of urban space by various users (Jacobs 1961), enhancing social attributes
6. High level of enclosure means spatial definition (Norberg-Schulz, 1971).
7. Contradiction between organic and linear figure- ground relationships results deficiency in the legibility of space
8. Hierarchy implies a rank ordered change by size, shape or placement. It refers to the degree of importance existing among forms and spaces, and where such exists, it improves legibility.
Source: Compiled by author
Following the above insights, it was found crucial to systematically carry out
the research in the following levels:
(i) Context: A historical account as a basis of urban analysis
(ii) Scale: Study of the city at various levels outlined by (Top9u, 2012, p.
2) - city scale, street/block, building/lot
a) Context:
Historical analysis covered land development patterns, zoning plans and
arterial hierarchy/open spaces as evidenced from base maps at the local and
global levels.
ELABORATION
45
b) Scale:
Study of the city at different scales targeted developments of the
neighbourhood to block-by-block developments, including functions, plot size,
block size (modifications), Building volumes (Floor levels), Setbacks, Road
widths/Sidewalks (general Street frontage). This called for typological
classification to identify a few cases whose scope could be handled
exhaustively. Type is neither a spatial diagram nor the average of a serial list
but is fundamentally based on the possibility of grouping objects by certain
inherent structural similarities/pattems (Yin, 2002) & (Moneo, 1978, p. 23)12.
Aldo Rossi notes that, type is characterized by a set of consistent structural
characteristics, whether building type or public space type, which can endure
despite changes in functions over time, thus permanent through history.
Selection of specific case areas for detailed analysis therefore relied on the
following criteria:
(i) The case should be a formal settlement
(ii) The case should be representative of architectural/planning strategy/
genre e.g. zoning for comparison.
(iii) The area should have adequate documentation accessible for study
The formulation of ‘type’ led to the identification of study cases as follows:
(i) Mumias South Road -Buru Buru: This is a planned middle-income
residential settlement, with a specifically planned and documented
central spine as its anchor.
12 Cited in (Keitany, 2006)
46
(ii) Moi Avenue -CBD: Concentration of settlement began in the central
traditional centre like in many cities of the world; consequently this
area has seen the most land use changes representative of the
motorized and non-motorized epochs (Morgan, 1967). It is a planned
commercial zone, well documented.
3.4 DATA COLLECTION TECHNIQUES
The employment o f each method of data collection was determined by the
type of data that the researcher intended to collect at each stage. Selected data
collection tools used included:
3.4.1 Interviews:
An interview is a formal or informal oral questionnaire, with the intermediate
being referred to as in-depth interviews. Interviews were particularly useful
for getting the story behind some of the experiences as they made it possible to
obtain data meeting the objectives and offers opportunities to clarify
questions. Whereas formal interviews have a tendency of limiting respondents,
informal interviews can be too amorphous, hence this study utilized in-depth
interviews, where standardised open-ended schedules were used (Appendix
IV). The purpose o f the schedule was to make sure that at the end of the
interview all relevant issues have been discussed.
Using the schedule, some fifteen key informants were targeted. These were
people particularly knowledgeable in the subjects of interest (professional
architects & urban planners), and who also gave their opinions and
suggestions on how to deal with some o f the study’s concerns.
47

3.4.2 Observations:
Observations bring a researcher into direct contact with the context for
concrete experience. The researcher in this case used non-participant
observations guided by a checklist (Appendix III) to make thorough
observation of on-going activities within and about the case areas so as to
explore space utilization in relation to designer’s and planners expectations.
Observation, interviews and archival material are mutually reinforcing
techniques, hence presented an avenue for data triangulation. Some of the
devices engaged to record observation’s data includes the use of annotated
diagrams/sketches, drawings, photographs, or a combination o f these.
3.4.3 Photographs and Measurements:
Aerial photography and panoramic techniques for obtaining three-dimensional
views of the landscape from the air or land provided necessary enablement to
perform detailed studies of the aforementioned, especially through time series
analysis and thus ease in drawing visual comparisons. This helped elaborate
the character of channels, buildings, open spaces and activities thus the
drawing o f the requisite relationships. Photographs capture ingenious details
that other methods may not record. Where necessary, measurements were
carried out using tape or scaled-up drawings, to measure specific
characteristics o f buildings or circulation channels, to check scales and
proportion.
3.4.4 Documentary analysis:
The most important use of documents is to increase and corroborate evidence
from other sources by for example unveiling information given by others on48

the same phenomenon. Yin cautions investigators when using documentary
analysis "....as it was written fo r some specific purpose and audience other
than those in the case-study being undertaken " (Yin, 2002).
3.4.5 Maps:
Analysis o f several map records in the light of actual settings were relied on to
help draw comparisons on growth characteristics of city form over the years,
and to project likely future scenarios. Generally descriptive notes provided an
easier way of capturing qualitative data in the field and during interviews
especially on character and patterns evident in the study areas.
3.5 DATA ANALYSIS AND PRESENTATION
Data Analysis is the examination, categorization, tabulation and testing of data
to address initial prepositions o f the study (Yin, 2002, p. 109). Categorization
of data collected was done through pattern matching to facilitate a non-
empirical analysis. The variables in Table 3.3 below were applied:
Table 3.3: Basic mode o f analysis
Site layout Building form
- Analysis of the immediate surroundings to
establish relationships between buildings,
circulation channels and any other site features
which affect the site’s resources
- Analysis of the placement of activities by way
of visual observation and interviews to establish
measures to deal with challenges
- Analysis o f the buildings
geometry and massing
- Analysis o f the buildings
orientation in relation to the
circulation channels
Source: Author
Data presentation was done descriptively using maps, photos, sketches, tables
and analytical diagrams that simplify the data for ease of understanding and
interpretation.49
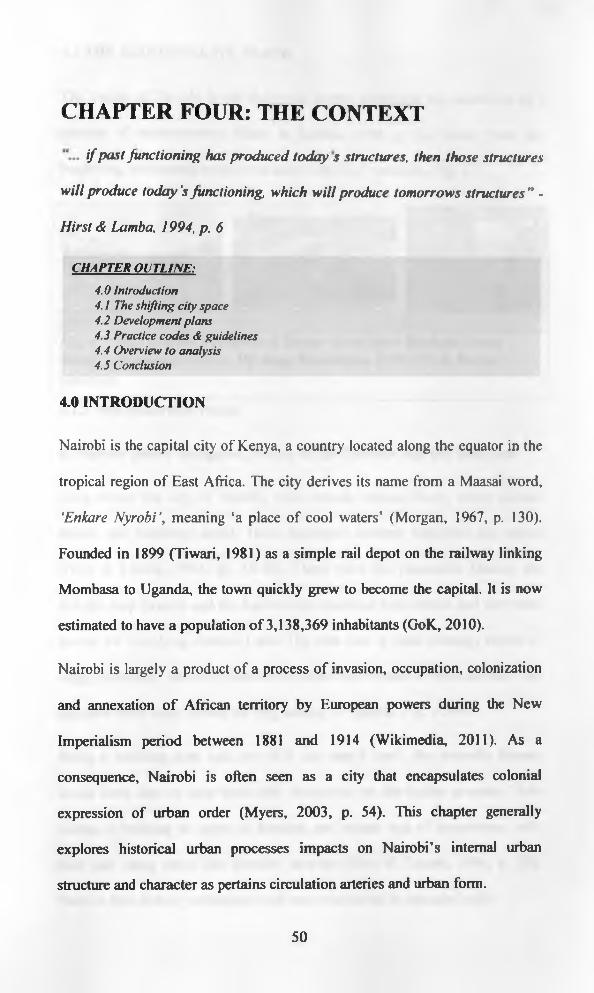
CHAPTER FOUR: THE CONTEXT
i f past functioning has produced today s structures, then those structures
will produce today’s functioning, which will produce tomorrows structures ” -
Hirst & Lamba, 1994, p. 6
CHAPTER OUTLINE:
4.0 Introduction4.1 The shifting city space4.2 Development plans4.3 Practice codes & guidelines4.4 Overview to analysis4.5 Conclusion
4.0 INTRODUCTION
Nairobi is the capital city of Kenya, a country located along the equator in the
tropical region of East Africa. The city derives its name from a Maasai word,
'Enkare Nyrobi\ meaning ‘a place of cool waters’ (Morgan, 1967, p. 130).
Founded in 1899 (Tiwari, 1981) as a simple rail depot on the railway linking
Mombasa to Uganda, the town quickly grew to become the capital. It is now
estimated to have a population o f 3,138,369 inhabitants (GoK, 2010).
Nairobi is largely a product of a process of invasion, occupation, colonization
and annexation o f African territory by European powers during the New
Imperialism period between 1881 and 1914 (Wikimedia, 2011). As a
consequence, Nairobi is often seen as a city that encapsulates colonial
expression of urban order (Myers, 2003, p. 54). This chapter generally
explores historical urban processes impacts on Nairobi’s internal urban
structure and character as pertains circulation arteries and urban form.
50
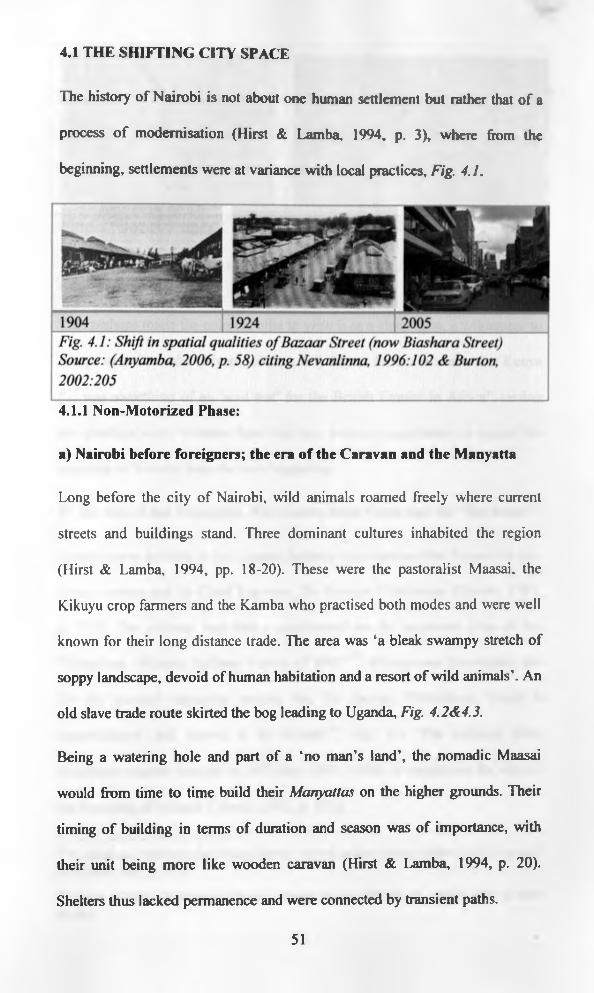
4.1 THE SHIFTING CITY SPACE
The history of Nairobi is not about one human settlement but rather that of a
process o f modernisation (Hirst & Lamba, 1994, p. 3), where from the
beginning, settlements were at variance with local practices, Fig. 4.1.
4.1.1 Non-Motorized Phase:
a) Nairobi before foreigners; the era of the Caravan and the Manyatta
Long before the city of Nairobi, wild animals roamed freely where current
streets and buildings stand. Three dominant cultures inhabited the region
(Hirst & Lamba, 1994, pp. 18-20). These were the pastoralist Maasai, the
Kikuyu crop farmers and the Kamba who practised both modes and were well
known for their long distance trade. The area was ‘a bleak swampy stretch of
soppy landscape, devoid of human habitation and a resort of wild animals’. An
old slave trade route skirted the bog leading to Uganda, Fig. 4.2&4.3.
Being a watering hole and part of a ‘no man’s land’, the nomadic Maasai
would from time to time build their Manyattas on the higher grounds. Their
timing of building in terms of duration and season was of importance, with
their unit being more like wooden caravan (Hirst & Lamba, 1994, p. 20).
Shelters thus lacked permanence and were connected by transient paths.
51
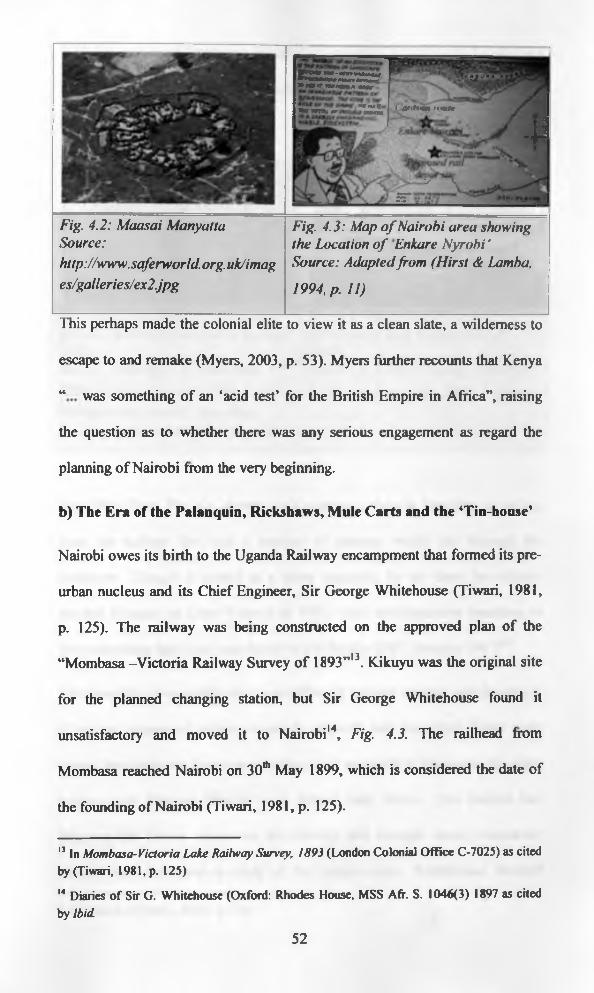
SS22JZiZZL'ZZf?*gfT "fmm* M«r
* * * * * *wr n r m #» own
i
• * v * •* 9
i i ) r i ! \ r m r , , u t r j
. j J
V <y55* 1
Fig. 4.2: Maasai Many alia Source:http://www. saferworld. org. uk/imag es/galleries/ex2.jpg
Fig. 4.3: Map o f Nairobi area showing the Location o f Enkare Nyrobi ’ Source: Adapted from (Hirst & Lamba,
1994, p. 11)
This perhaps made the colonial elite to view it as a clean slate, a wilderness to
escape to and remake (Myers, 2003, p. 53). Myers further recounts that Kenya
“ was something of an ‘acid test’ for the British Empire in Africa”, raising
the question as to whether there was any serious engagement as regard the
planning o f Nairobi from the very beginning.
b) The Era of the Palanquin, Rickshaws, Mule Carts and the Tin-house1
Nairobi owes its birth to the Uganda Railway encampment that formed its pre-
urban nucleus and its Chief Engineer, Sir George Whitehouse (Tiwari, 1981,
p. 125). The railway was being constructed on the approved plan of the
“Mombasa -Victoria Railway Survey o f 1893”13. Kikuyu was the original site
for the planned changing station, but Sir George Whitehouse found it
unsatisfactory and moved it to Nairobi14, Fig. 4.3. The railhead from
Mombasa reached Nairobi on 30th May 1899, which is considered the date of
the founding of Nairobi (Tiwari, 1981, p. 125).
13 In Mombasa-Victoria Lake Railway Survey, 1893 (London Colonial Office C-7025) as cited by (Tiwari, 1981, p. 125)
14 Diaries of Sir G. Whitehouse (Oxford: Rhodes House, MSS Afr. S. 1046(3) 1897 as cited by Ibid
52
With the coming o f foreigners, building construction shifted from the mud and
wattle walls with grass thatched roofing to timber and iron sheet construction
(Loki, 2009, p. 34), Fig. 4.4 & 4.5.
Fig. 4.4: Rossenrode & Mac John's Fig. 4.5: View o f the First D C’s General Merchants & Bar in Nairobi, Office and Court House (Nairobi - 1902 1900)Source: Muthaiga, Stephen Mills Source: A Jubilee History 1900-1950,2006:33 cited in (Loki, 2009, p. xvii) - N.C.C. cited in (Loki, 2009, p. 35) This shows a wood & iron sheet building o f Nairobi’s founding years
The 1900 Circa, Fig. 4.6, shows city’s arteries at the city founding as having
been the railway line and a number of streams which cut through the
landscape. Though it started as a mere campsite, by the time the railway
reached Kisumu on Lake Victoria in 1901, most administrative functions in
the protectorate had been transferred to it (Obudho 1981; Morgan 1967)15.
The township grew rapidly due to an influx of railway workers and the arrival
of various groups of settlers in search of profit and adventure. These were
Asians businessmen; Europeans seeking land and wealth; European big game
hunters; and Africans from all over British East Africa. The Indians had
followed the labour camps on the railway and brought small, temporary
bazaars into existence in each of the major stops. Whitehouse himself
15 As cited in (Myers, 2003, p. 34)
53
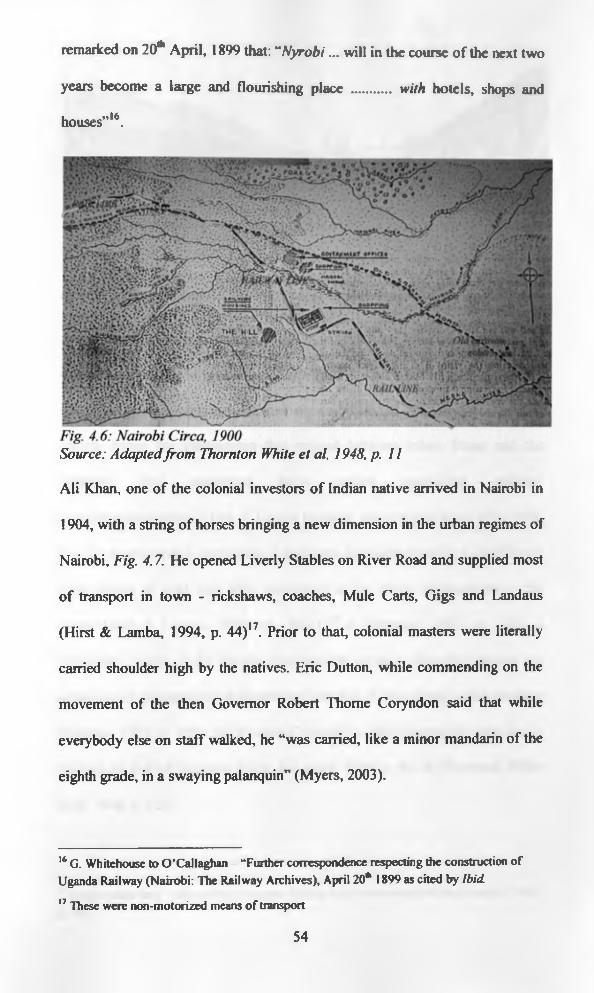
remarked on 20th April, 1899 that: “Nyrobi... will in the course of the next two
years become a large and flourishing place ........... with hotels, shops and
houses”16 17.
Source: Adaptedfrom Thornton White et al, 1948, p. 11
Ali Khan, one of the colonial investors of Indian native arrived in Nairobi in
1904, with a string of horses bringing a new dimension in the urban regimes of
Nairobi, Fig. 4.7. He opened Liverly Stables on River Road and supplied most
o f transport in town - rickshaws, coaches, Mule Carts, Gigs and Landaus
(Hirst & Lamba, 1994, p. 44) '1. Prior to that, colonial masters were literally
carried shoulder high by the natives. Eric Dutton, while commending on the
movement of the then Governor Robert Thome Coryndon said that while
everybody else on staff walked, he “was carried, like a minor mandarin of the
eighth grade, in a swaying palanquin” (Myers, 2003).
16 G. Whitehouse to O’Callaghan - “Further correspondence respecting the construction of Uganda Railway (Nairobi: The Railway Archives), April 20th 1899 as cited by Ibid.
17 These were non-motorized means of transport
54
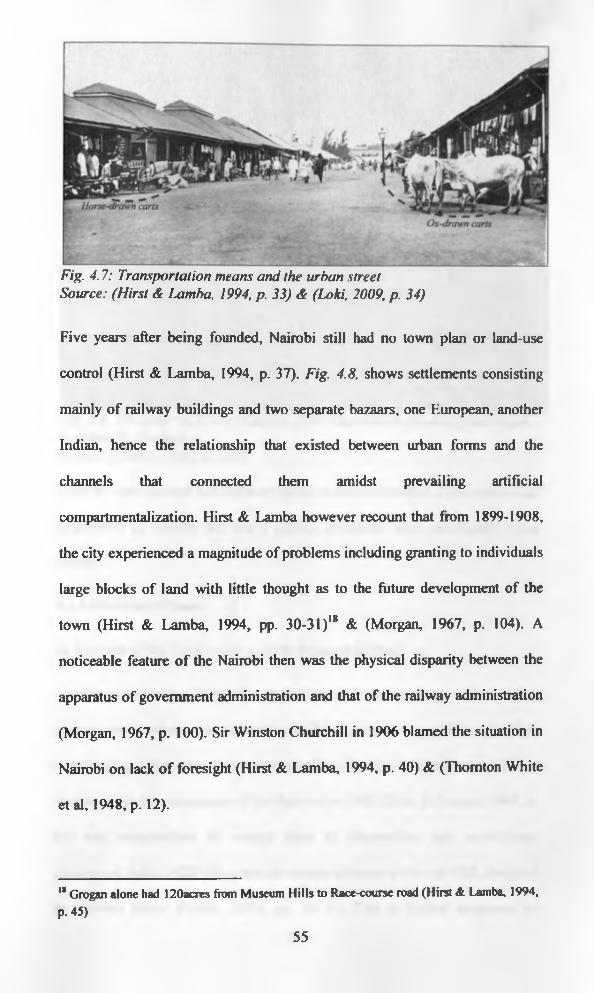
Fig. 4.7: Transportation means and the urban street Source: (Hirst & Lamba, 1994, p. 33) & (Loki, 2009, p. 34)
Five years after being founded, Nairobi still had no town plan or land-use
control (Hirst & Lamba, 1994, p. 37). Fig. 4.8, shows settlements consisting
mainly of railway buildings and two separate bazaars, one European, another
Indian, hence the relationship that existed between urban forms and the
channels that connected them amidst prevailing artificial
compartmentalization. Hirst & Lamba however recount that from 1899-1908,
the city experienced a magnitude of problems including granting to individuals
large blocks of land with little thought as to the future development of the
town (Hirst & Lamba, 1994, pp. 30-31)18 & (Morgan, 1967, p. 104). A
noticeable feature o f the Nairobi then was the physical disparity between the
apparatus of government administration and that of the railway administration
(Morgan, 1967, p. 100). Sir Winston Churchill in 1906 blamed the situation in
Nairobi on lack o f foresight (Hirst & Lamba, 1994, p. 40) & (Thornton White
etal, 1948, p. 12).
|g Grogan alone had I20acres from Museum Hills to Race-course road (Hirst & Lamba, 1994, P- 45)
55
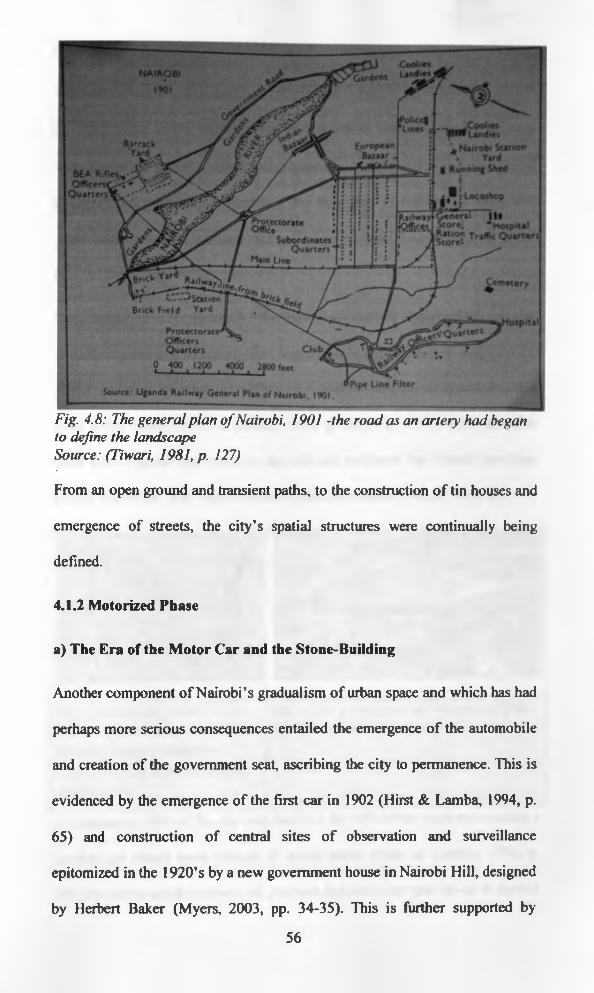
Fig. 4.8: The general plan o f Nairobi, 1901 -the road as an artery had began to define the landscape Source: (Tiwari, 1981, p. 127)
From an open ground and transient paths, to the construction o f tin houses and
emergence of streets, the city’s spatial structures were continually being
defined.
4.1.2 Motorized Phase
a) The Era of the Motor Car and the Stone-Building
Another component o f Nairobi’s gradualism of urban space and which has had
perhaps more serious consequences entailed the emergence o f the automobile
and creation of the government seat, ascribing the city to permanence. This is
evidenced by the emergence of the first car in 1902 (Hirst & Lamba, 1994, p.
65) and construction of central sites of observation and surveillance
epitomized in the 1920’s by a new government house in Nairobi Hill, designed
by Herbert Baker (Myers, 2003, pp. 34-35). This is further supported by
56
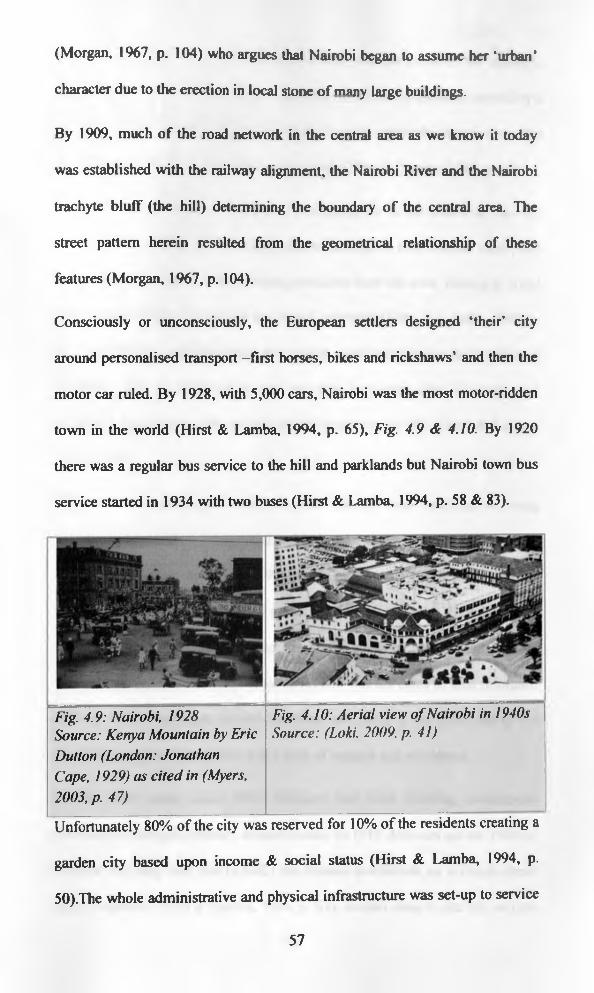
(Morgan, 1967, p. 104) who argues that Nairobi began to assume her ‘urban’
character due to the erection in local stone of many large buildings.
By 1909, much o f the road network in the central area as we know it today
was established with the railway alignment, the Nairobi River and the Nairobi
trachyte bluff (the hill) determining the boundary of the central area. 'Hie
street pattern herein resulted from the geometrical relationship of these
features (Morgan, 1967, p. 104).
Consciously or unconsciously, the European settlers designed ‘their’ city
around personalised transport -first horses, bikes and rickshaws’ and then the
motor car ruled. By 1928, with 5,000 cars, Nairobi was the most motor-ridden
town in the world (Hirst & Lamba, 1994, p. 65), Fig. 4.9 & 4.10. By 1920
there was a regular bus service to the hill and parklands but Nairobi town bus
service started in 1934 with two buses (Hirst & Lamba, 1994, p. 58 & 83).
Fig. 4.9: Nairobi, 1928 Fig. 4.10: Aerial view o f Nairobi in 1940sSource: Kenya Mountain by Eric Source: (Loki, 2009, p. 41)Dutton (London: Jonathan Cape, 1929) as cited in (Myers,2003, p. 47)
Unfortunately 80% of the city was reserved for 10% of the residents creating a
garden city based upon income & social status (Hirst & Lamba, 1994, p.
50).The whole administrative and physical infrastructure was set-up to service
57
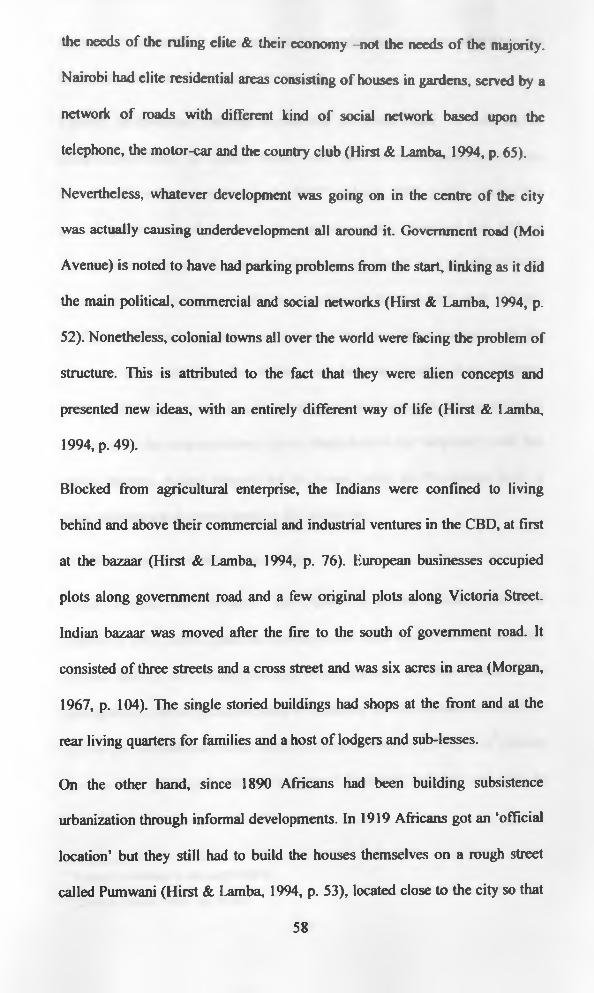
the needs of the ruling elite & their economy -not the needs o f the majority.
Nairobi had elite residential areas consisting o f houses in gardens, served by a
network of roads with different kind of social network based upon the
telephone, the motor-car and the country club (Hirst & Lamba, 1994, p. 65).
Nevertheless, whatever development was going on in the centre of the city
was actually causing underdevelopment all around it. Government road (Moi
Avenue) is noted to have had parking problems from the start, linking as it did
the main political, commercial and social networks (Hirst & Lamba, 1994, p.
52). Nonetheless, colonial towns all over the world were facing the problem of
structure. This is attributed to the fact that they were alien concepts and
presented new ideas, with an entirely different way of life (Hirst & Lamba,
1994, p. 49).
Blocked from agricultural enterprise, the Indians were confined to living
behind and above their commercial and industrial ventures in the CBD, at first
at the bazaar (Hirst & Lamba, 1994, p. 76). European businesses occupied
plots along government road and a few original plots along Victoria Street.
Indian bazaar was moved after the fire to the south of government road. It
consisted o f three streets and a cross street and was six acres in area (Morgan,
1967, p. 104). The single storied buildings had shops at the front and at the
rear living quarters for families and a host of lodgers and sub-lesses.
On the other hand, since 1890 Africans had been building subsistence
urbanization through informal developments. In 1919 Africans got an ‘official
location’ but they still had to build the houses themselves on a rough street
called Pumwani (Hirst & Lamba, 1994, p. 53), located close to the city so that
58
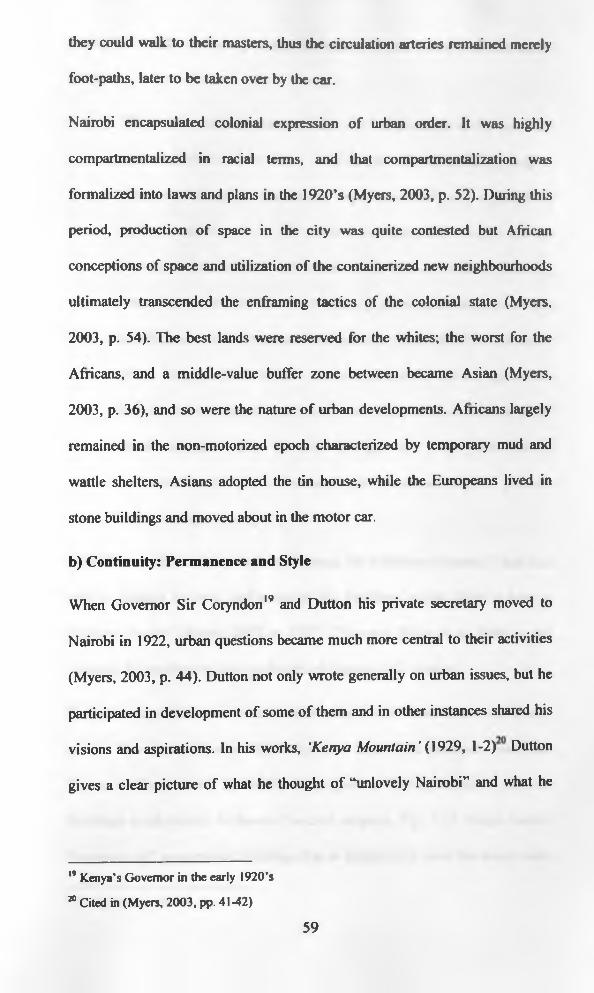
they could walk to their masters, thus the circulation arteries remained merely
foot-paths, later to be taken over by the car.
Nairobi encapsulated colonial expression of urban order. It was highly
compartmentalized in racial terms, and that compartmentalization was
formalized into laws and plans in the 1920*s (Myers, 2003, p. 52). During this
period, production o f space in the city was quite contested but African
conceptions of space and utilization of the containerized new neighbourhoods
ultimately transcended the enframing tactics of the colonial state (Myers,
2003, p. 54). The best lands were reserved for the whites; the worst for the
Africans, and a middle-value buffer zone between became Asian (Myers,
2003, p. 36), and so were the nature of urban developments. Africans largely
remained in the non-motorized epoch characterized by temporary mud and
wattle shelters, Asians adopted the tin house, while the Europeans lived in
stone buildings and moved about in the motor car.
b) Continuity: Permanence and Style
When Governor Sir Coryndon19 20 and Dutton his private secretary moved to
Nairobi in 1922, urban questions became much more central to their activities
(Myers, 2003, p. 44). Dutton not only wrote generally on urban issues, but he
participated in development of some of them and in other instances shared his
visions and aspirations. In his works, ‘Kenya Mountain ’ (1929, 1 -2) Dutton
gives a clear picture of what he thought of “unlovely Nairobi” and what he
19 Kenya’s Governor in the early 1920’s
20 Cited in (Myers, 2003, pp. 41-42)
59
thought it ought to be especially as pertains urban forms and circulation
arteries:
“ There may one day arise a citizen who will proclaim to the world his
pride in Nairobi. .... in 1926 . . . .it had the look o f a mining camp . .
..littered with refuse; the streets were cumbered with a jumble o f
architectural abuses.........the roads were execrable. ... maybe one day
Nairobi will be laid out with tarred roads, with avenues o f flowering
trees, flanked by noble spaces and stately squares; a cathedral worthy
offaith and country; museums and galleries o f art, theatres and public
offices. He proceeded and said ....a town plan ambitious enough to turn
Nairobi into a thing o f beauty has been slowly worked out, and much
has already been done. But until that plan has borne fruit, Nairobi
must remain what it was then, a slatternly creature, unfit to queen it
over so lovely a country. ”
Later Dutton admits that at least one avenue, the Delamere Avenue, “ was laid
with a thought or two, and some o f the buildings which flank it have a
pleasing design” (Myers, 2003, p. 42)21. (Thornton White et al, 1948, p. 14)
supports this attributing it to leadership o f Captain E.S. Grogan.
Dutton’s works are also seen in creation of spaces of observation with Baker,
case of Government House where they used ideas from classical Greek and
Roman architecture for the deliberate purpose of linking Britain’s imperial
Buildings symbolically to those of ancient empires, Fig. 4.11. Huge, indeed
“monumental” government buildings Baker designed all over the world were
21 Citing (Dutton 1944 a, 10)
60
placed high on hills, in bright sunlight, for all to see the “ideals of law, order,
and government” (Myers, 2003, p. 49). The Nairobi government House, with
its colonnaded patio, tiled roof and loggias giving vistas across the city below
from the slopes of Nairobi Hill incorporated these central features.
Fig. 4.11: Government House, NairobiSource: Architecture and Personalities by Herbert Baker (London: Country Life, Ltd., 1944) as cited by (Myers, 2003, p. 49)
Fig. 4.12: Huge building o f the fu tu re 'Source: Architects sketch o f Sadler house in Nairobi: A Jubilee History 1900-1950, a publication by the CCNas cited in (Loki, 2009, p. 70)
T * i b j i
Around late 1950’s the city grew very fast for city’s structures to cope. The
self-help city built much of the needed infrastructure and created new forms of
urban social organisations independent o f modem city’s functioning (Hirst &
Lamba, 1994, p. 122). Preferences never changed -cars were planned for more
than people. “Professionals; many of them new in the job could only hold on
to the guidelines o f the master-plan. Many parents got a car, before a ‘good’
house, and so ferried children to school across the city. Bazaar Street for
example evolved from a street o f ox-drawn carts to a heavily motorised urban
street. The urban morphology also changed from that dominated by tin-roofed
constructions to stone/concrete construction. In 1964, the city increased its
size ten-fold from 32 sq. miles to 266 sq. Miles, meaning more infrastructural
needs (Hirst & Lamba, 1994, p. 138).
61
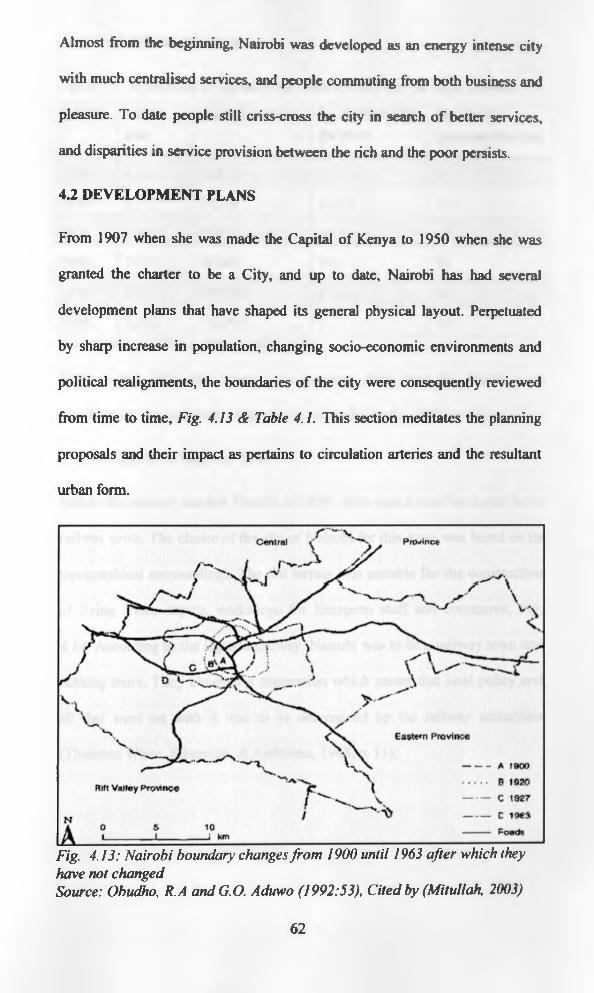
Almost from the beginning, Nairobi was developed as an energy intense city
with much centralised services, and people commuting from both business and
pleasure. To date people still criss-cross the city in search o f better services,
and disparities in service provision between the rich and the poor persists.
4.2 DEVELOPMENT PLANS
From 1907 when she was made the Capital of Kenya to 1950 when she was
granted the charter to be a City, and up to date, Nairobi has had several
development plans that have shaped its general physical layout. Perpetuated
by sharp increase in population, changing socio-economic environments and
political realignments, the boundaries o f the city were consequently reviewed
from time to time, Fig. 4.13 & Table 4.1. This section meditates the planning
proposals and their impact as pertains to circulation arteries and the resultant
urban form.
Fig. 4.13: Nairobi boundary changes from 1900 until 1963 after which they have not changedSource: Obudho, R.A and G.O. Aduwo (1992:53), Cited by (Mitullah, 2003)
62
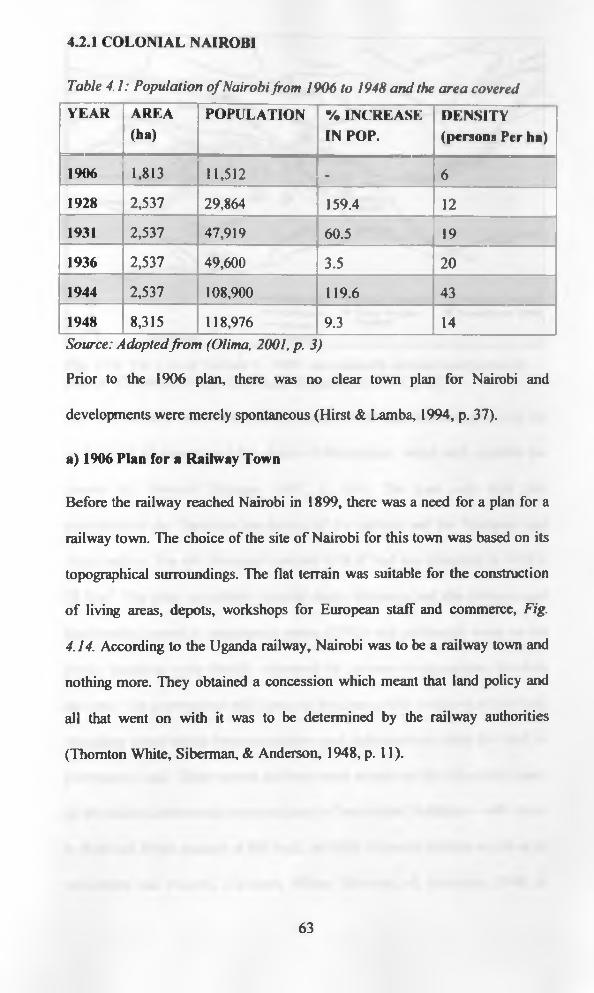
4.2.1 COLONIAL NAIROBI
Table 4.1: Population o f Nairobi from 1906 to 1948 and the area covered
YEAR AREA(ha)
POPULATION % INCREASE IN POP.
DENSITY (persons Per ha)
1906 1,813 11,512 > 6
1928 2,537 29,864 159.4 12
1931 2,537 47,919 60.5 19
1936 2,537 49,600 3.5 20
1944 2,537 108,900 119.6 43
1948 8,315 118,976 9.3 14Source: Adopted from (Olima, 2001, p. 3)
Prior to the 1906 plan, there was no clear town plan for Nairobi and
developments were merely spontaneous (Hirst & Lamba, 1994, p. 37).
a) 1906 Plan for a Railway Town
Before the railway reached Nairobi in 1899, there was a need for a plan for a
railway town. The choice of the site o f Nairobi for this town was based on its
topographical surroundings. The flat terrain was suitable for the construction
o f living areas, depots, workshops for European staff and commerce, Fig.
4.14. According to the Uganda railway, Nairobi was to be a railway town and
nothing more. They obtained a concession which meant that land policy and
all that went on with it was to be determined by the railway authorities
(Thornton White, Siberman, & Anderson, 1948, p. 11).
63
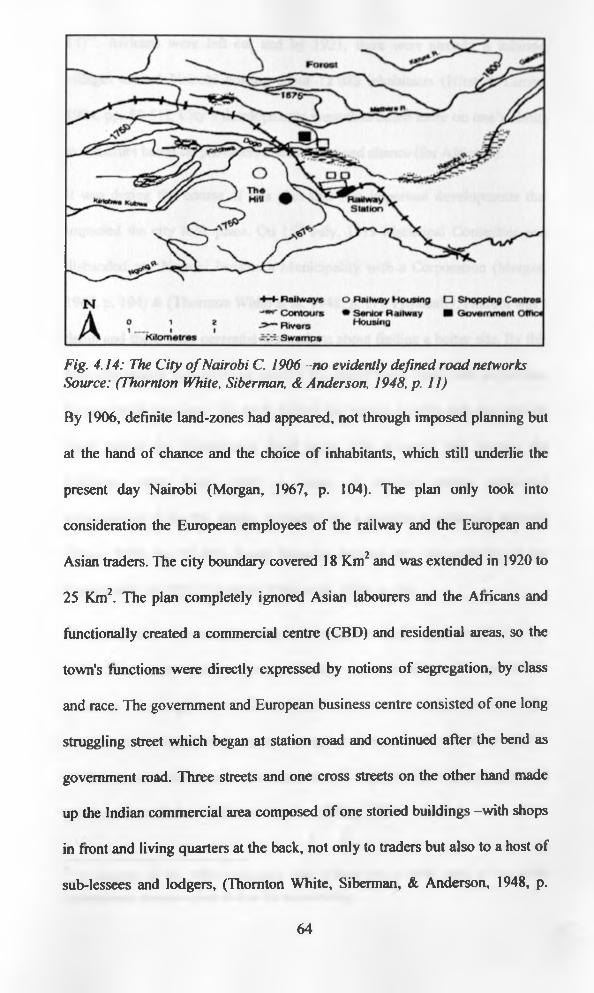
Fig. 4.14: The City o f Nairobi C. 1906 -no evidently defined road networks Source: (Thornton White, Si her man, & Anderson, 1948, p. 11)
By 1906, definite land-zones had appeared, not through imposed planning but
at the hand of chance and the choice o f inhabitants, which still underlie the
present day Nairobi (Morgan, 1967, p. 104). The plan only took into
consideration the European employees o f the railway and the European and
Asian traders. The city boundary covered 18 Km2 and was extended in 1920 to
25 Km2. The plan completely ignored Asian labourers and the Africans and
functionally created a commercial centre (CBD) and residential areas, so the
town's functions were directly expressed by notions of segregation, by class
and race. The government and European business centre consisted of one long
struggling street which began at station road and continued after the bend as
government road. Three streets and one cross streets on the other hand made
up the Indian commercial area composed of one storied buildings -with shops
in front and living quarters at the back, not only to traders but also to a host of
sub-lessees and lodgers, (Thornton White, Siberman, & Anderson, 1948, p.
64
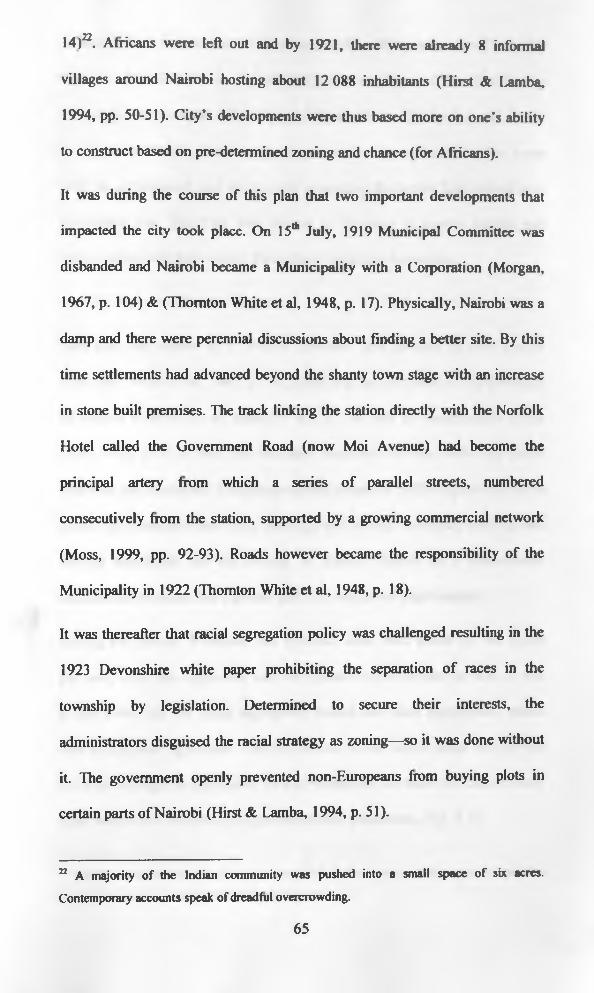
14)22. Africans were left out and by 1921, there were already 8 informal
villages around Nairobi hosting about 12 088 inhabitants (Hirst & Lamba,
1994, pp. 50-51). City’s developments were thus based more on one’s ability
to construct based on pre-determined zoning and chance (for Africans).
It was during the course of this plan that two important developments that
impacted the city took place. On 15th July, 1919 Municipal Committee was
disbanded and Nairobi became a Municipality with a Corporation (Morgan,
1967, p. 104) & (Thornton White et al, 1948, p. 17). Physically, Nairobi was a
damp and there were perennial discussions about finding a better site. By this
time settlements had advanced beyond the shanty town stage with an increase
in stone built premises. The track linking the station directly with the Norfolk
Hotel called the Government Road (now Moi Avenue) had become the
principal artery from which a series of parallel streets, numbered
consecutively from the station, supported by a growing commercial network
(Moss, 1999, pp. 92-93). Roads however became the responsibility of the
Municipality in 1922 (Thornton White et al, 1948, p. 18).
It was thereafter that racial segregation policy was challenged resulting in the
1923 Devonshire white paper prohibiting the separation o f races in the
township by legislation. Determined to secure their interests, the
administrators disguised the racial strategy as zoning—so it was done without
it. The government openly prevented non-Europeans from buying plots in
certain parts of Nairobi (Hirst & Lamba, 1994, p. 51).
22 A majority of the Indian community was pushed into a small space of six acres.
Contemporary accounts speak of dreadful overcrowding.
65
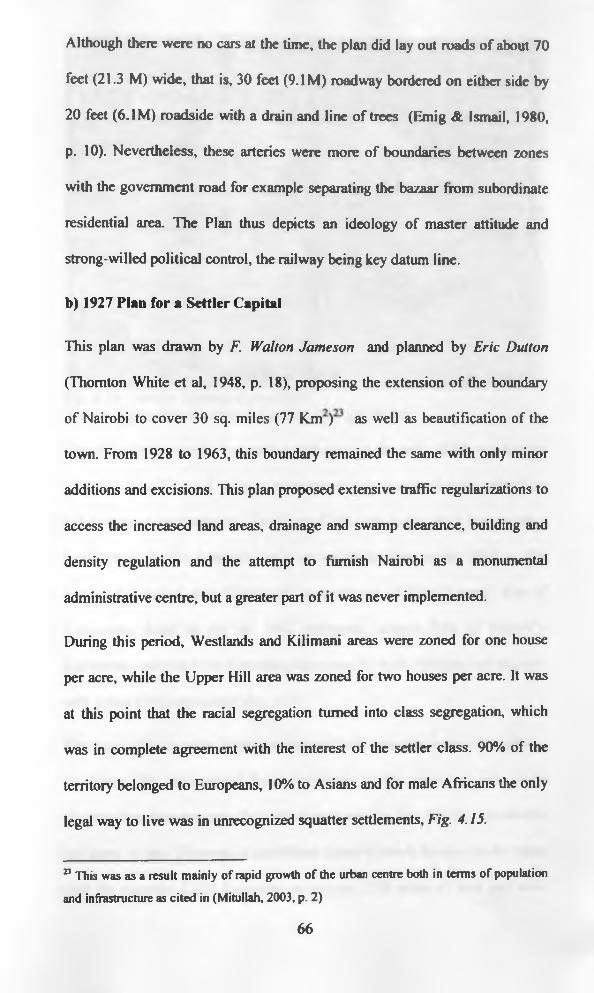
Although there were no cars at the time, the plan did lay out roads of about 70
feet (21.3 M) wide, that is, 30 feet (9.1M) roadway bordered on either side by
20 feet (6.1M) roadside with a drain and line of trees (Emig & Ismail, 1980,
p. 10). Nevertheless, these arteries were more of boundaries between zones
with the government road for example separating the bazaar from subordinate
residential area. The Plan thus depicts an ideology of master attitude and
strong-willed political control, the railway being key datum line.
b) 1927 Plan for a Settler Capital
This plan was drawn by F. Walton Jameson and planned by Eric Dutton
(Thornton White et al, 1948, p. 18), proposing the extension o f the boundary
of Nairobi to cover 30 sq. miles (77 Km ) as well as beautification of the
town. From 1928 to 1963, this boundary remained the same with only minor
additions and excisions. This plan proposed extensive traffic regularizations to
access the increased land areas, drainage and swamp clearance, building and
density regulation and the attempt to furnish Nairobi as a monumental
administrative centre, but a greater part o f it was never implemented.
During this period, Westlands and Kilimani areas were zoned for one house
per acre, while the Upper Hill area was zoned for two houses per acre. It was
at this point that the racial segregation turned into class segregation, which
was in complete agreement with the interest of the settler class. 90% of the
territory belonged to Europeans, 10% to Asians and for male Africans the only
legal way to live was in unrecognized squatter settlements. Fig. 4.15. 23
23 This was as a result mainly of rapid growth of the urban centre both in terms of population
and infrastructure as cited in (Mitullah, 2003, p. 2)
66
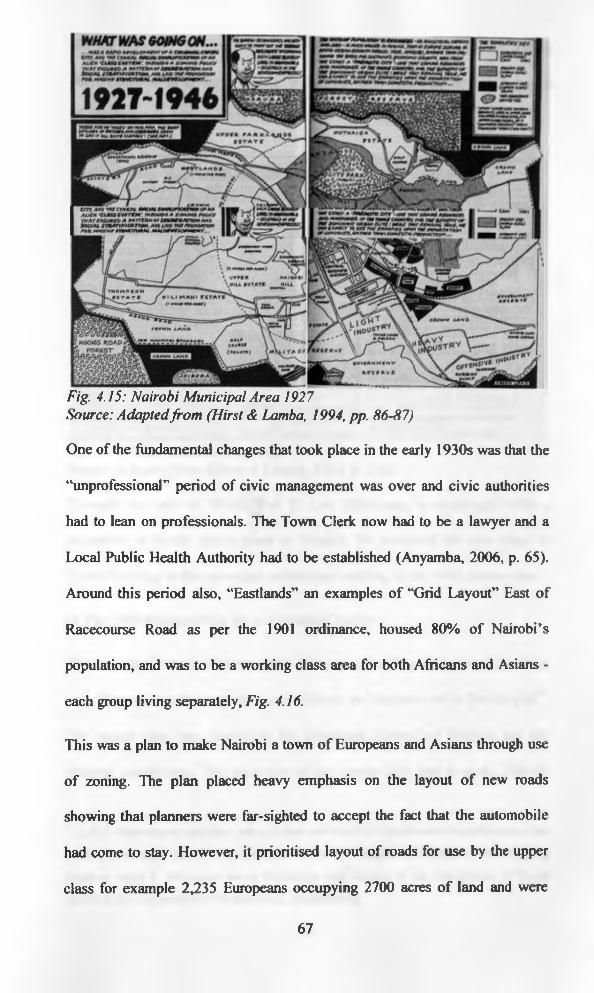
Fig. 4.15: Nairobi Municipal Area 1927Source: Adaptedfrom (Hirst & Lamba, 1994, pp. 86-87)
One of the fundamental changes that took place in the early 1930s was that the
“unprofessional” period of civic management was over and civic authorities
had to lean on professionals. The Town Clerk now had to be a lawyer and a
Local Public Health Authority had to be established (Anyamba, 2006, p. 65).
Around this period also, “Eastlands” an examples o f “Grid Layout” East o f
Racecourse Road as per the 1901 ordinance, housed 80% of Nairobi’s
population, and was to be a working class area for both Africans and Asians -
each group living separately, Fig. 4.16.
This was a plan to make Nairobi a town o f Europeans and Asians through use
of zoning. The plan placed heavy emphasis on the layout of new roads
showing that planners were far-sighted to accept the fact that the automobile
had come to stay. However, it prioritised layout of roads for use by the upper
class for example 2,235 Europeans occupying 2700 acres o f land and were
67
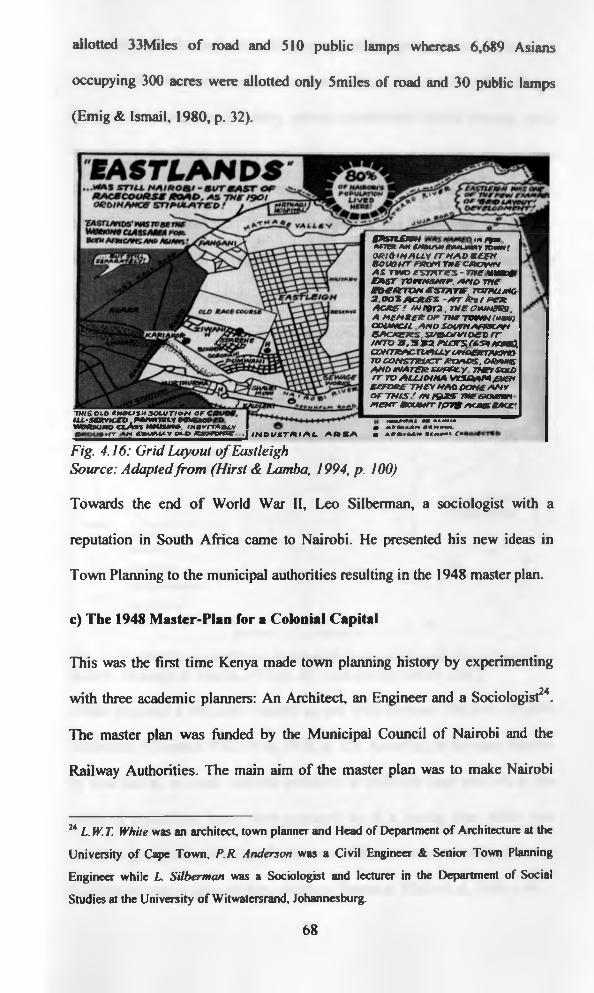
allotted 33Miles o f road and 510 public lamps whereas 6,689 Asians
occupying 300 acres were allotted only 5miles of road and 30 public lamps
(Emig & Ismail, 1980, p. 32).
TN / S O L O tN tH J S H S O C U T tO M O F*IL L -S a tv tce t) , PMVATWLV PB C IO I H M W W a A s t M U S M f r , iM B V IT A a c VPi m K C m V SXXJAU-V Ot-D g g v w g . I IH O U S T A IA L . A A B A
Fig. 4.16: Grid Layout o f EastleighSource: Adaptedfrom (Hirst & Lamba, 1994, p. 100)
gASTLEFSM / * / * »AfTHt AH e m u w RAMJFMy TOmmfo r iO i h a l l s ( t m a o s e e n b o u g h t e p c m i t h e a w w i v a s t w o e s t a t e s , - ~~ rr n u n mE A S T TOWMSMfP. A M O TUT M R 1 M E S T A T E , TOTHU/AO 2 ,O o S A C A £ S - A r k * / P E A A C R E f tHrOVX.THEOW M EDS.A M E M B E K O P THE TOW M (HSM ) COOMC4L A M D SOUTH AERtCAM OAcjoeas. su&Gtvtoco rr /HTO 3 ,3 * 2 puarsrssoAcmO.COMTRAC-TLYUJ-Y UMOOETA/etMO TO C O N ST K V C T R O A D S . OBA4BS AMO W A T E R SU PP LY 774EY SOLD r r TO A U J O /M A V t3 B A M £ V C H BEFORE TH E Y MAD DOME A M Y o r T H IS ' SM r&ZST THE G <xe9ti M E A T BOUGHT / p r s ACAES BACf.
HBUPfml cm CBW4IB • A h U M H iC N « O ie A r d iu n % c m €*>l c p
Towards the end o f World War II, Leo Silberman, a sociologist with a
reputation in South Africa came to Nairobi. He presented his new ideas in
Town Planning to the municipal authorities resulting in the 1948 master plan.
c) The 1948 Master-Plan for a Colonial Capital
This was the first time Kenya made town planning history by experimenting
with three academic planners: An Architect, an Engineer and a Sociologist24.
The master plan was funded by the Municipal Council of Nairobi and the
Railway Authorities. The main aim of the master plan was to make Nairobi
24 L. W. T. White was an architect, town planner and Head of Department of Architecture at the University of Cape Town, P.R. Anderson was a Civil Engineer & Senior Town Planning Engineer while L Silberman was a Sociologist and lecturer in the Department of Social
Studies at the University of Witwatersrand, Johannesburg.
68
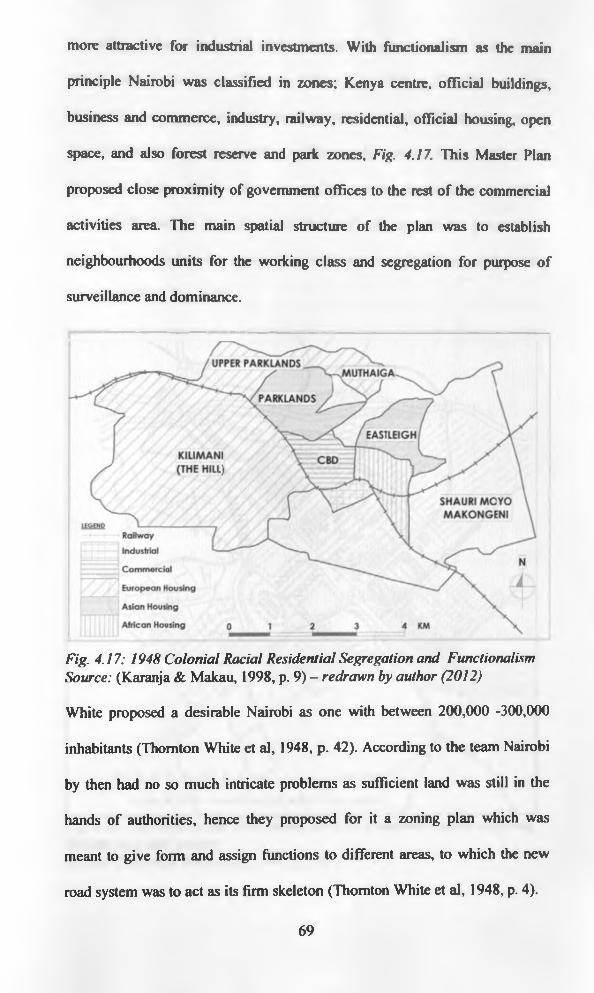
more attractive for industrial investments. With functionalism as the main
principle Nairobi was classified in zones; Kenya centre, official buildings,
business and commerce, industry, railway, residential, official housing, open
space, and also forest reserve and park zones, Fig. 4.17. This Master Plan
proposed close proximity of government offices to the rest of the commercial
activities area. The main spatial structure of the plan was to establish
neighbourhoods units for the working class and segregation for purpose o f
surveillance and dominance.
Fig. 4.17: 1948 Colonial Racial Residential Segregation and Functionalism Source: (Karanja & Makau, 1998, p. 9) - redrawn by author (2012)
White proposed a desirable Nairobi as one with between 200,000 -300,000
inhabitants (Thornton White et al, 1948, p. 42). According to the team Nairobi
by then had no so much intricate problems as sufficient land was still in the
hands of authorities, hence they proposed for it a zoning plan which was
meant to give form and assign functions to different areas, to which the new
road system was to act as its firm skeleton (Thornton White et al, 1948, p. 4).
69
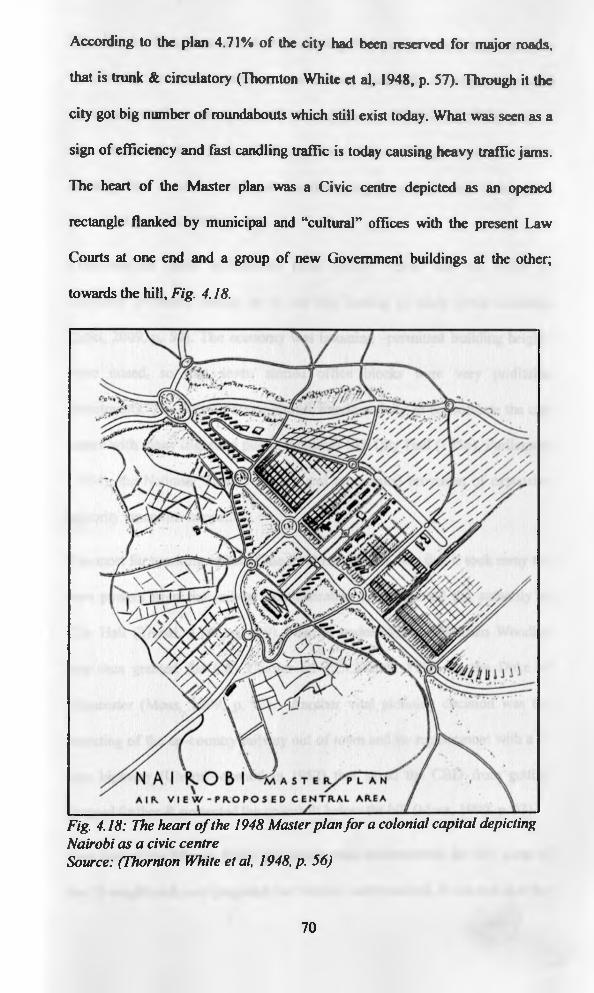
According to the plan 4.71% of the city had been reserved for major roads,
that is trunk & circulatory (Thornton White et al, 1948, p. 57). Through it the
city got big number of roundabouts which still exist today. What was seen as a
sign of efficiency and fast candling traffic is today causing heavy traffic jams.
The heart of the Master plan was a Civic centre depicted as an opened
rectangle flanked by municipal and “cultural” offices with the present Law
Courts at one end and a group of new Government buildings at the other;
towards the hill, Fig. 4.18.
Fig. 4.18: The heart o f the 1948 Master plan for a colonial capital depictingNairobi as a civic centreSource: (Thornton White et al, 1948, p. 56)
70

The Master Plan was aimed at reshaping Nairobi in order to create the
conditions for the economic, social and political modernisation and
development of the colony over 25 years (Ihomton White et al, 1948, p. 1). It
was also aimed at confining further growth within existing boundaries of the
municipality. In other words, it was designing for containment rather than
growth (Anyamba, 2006, p. 71).
Functionalism freed architecture from history. There was an influx of
European architects setting up in the city leading to many great buildings
(Loki, 2009, p. 50). The economy was booming -permitted building heights
were raised, so that seven storied office blocks were very profitable
investments. The 40’s-50’s saw almost frantic activity to consolidate the city
centre with many dignified public buildings like City Hall (1956), Parliament
(1954), the National Theatre (1952), and accelerated provision of expensive
minority amenities happening.
The most far reaching effect of the 1948 master plan was that it took away the
veto powers from the railway administration and bestowed the authority to
City Hall (Tiwari, 1981, p. 129). Nairobi under Mayor Alderman Woodley
was thus granted the City Charter on 13th March, 1950, by the Duke of
Gloucester (Moss, 1999, p. 93). Another vital planning decision was the
rerouting of the up-country railway out o f town and its replacement with a 6-
lane highway (Uhuru -opened in 1952) that saved the CBD from getting
clogged further & protected the greenbelt below the hill (Moss, 1999, p. 93).
Very few of the Master Plan’s proposals were implemented, in fact, none of
the 50 neighbourhoods proposed for Nairobi were realised. It seemed that the
71
Master Plan was mostly used for political expediency, rather than as a tool for
stimulating the urban process (Anyamba, 2006, p. 72). Creation of a CBD
composed of administration and commerce increased the commuting of
labour-force and transportation needs for goods, raising traffic chaos. The plan
used road networks to implement class and race segregation. It also divided
the road system into national/regional roads and main local roads based on
existing plans with no provisions as regards cyclists for example (Emig &
Ismail, 1980, p. 43). Nevertheless it saw increased use of industrial building
materials like concrete, steel and glass and the principle of physical division
and decomposition which however made planning to look conservative as
much as it may have seemed liberal (Emig & Ismail, 1980).
4.2.2 POST-COLONIAL NAIROBI
At independence, Nairobi was situated within a vibrant economy and had a
functioning city government. In fact, many of the housing estates and roads
were built during the late sixties and the early seventies. The euphoria inspired
by independence brought a new wave o f construction activity resulting in
many prestigious and bulky buildings. These filled spaces where hovels
(shacks) and water filled holes had lurked for decades (Moss, 1999, p. 93).
In 1963 the boundary of Nairobi was extended to cover an area of
approximately 266 square miles (686 Km2), Fig. 4.13. There have not been
any major boundary changes since then but the city’s functions have
developed and expanded beyond. By this time Africans who formed a major
part of the population lived in the Eastern parts, while Europeans and Asians
lived in the Western suburbs. This position is reflected today not so much in
72
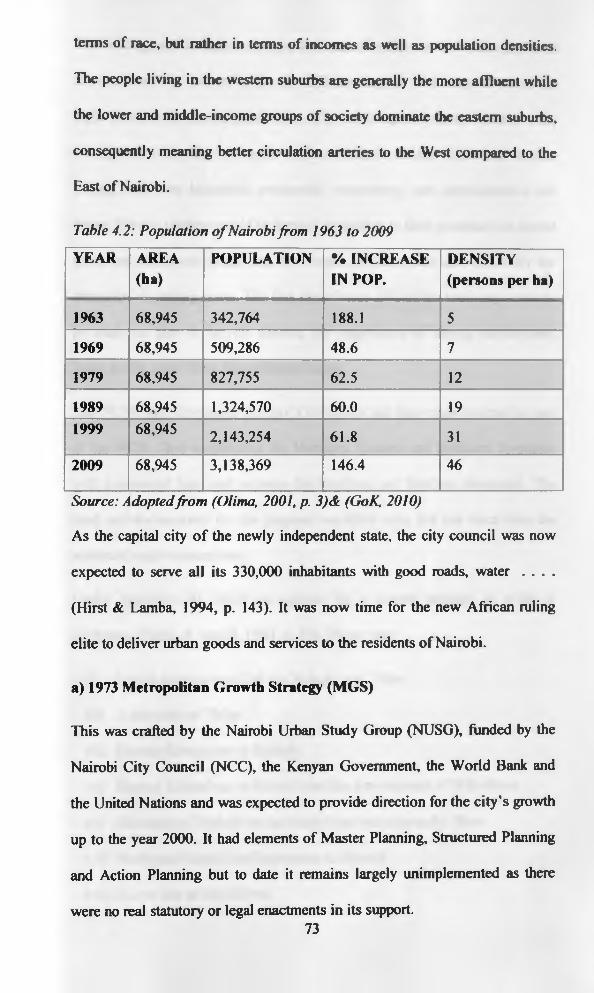
terms of race, but rather in terms of incomes as well as population densities.
The people living in the western suburbs are generally the more affluent while
the lower and middle-income groups of society dominate the eastern suburbs,
consequently meaning better circulation arteries to the West compared to the
East of Nairobi.
Table 4.2: Population o f Nairobi from 1963 to 2009
YEAR AREA(ha)
POPULATION % INCREASE IN POP.
DENSITY (persons per ha)
1963 68,945 342,764 188.1 5
1969 68,945 509,286 48.6 7
1979 68,945 827,755 62.5 12
1989 68,945 1,324,570 60.0 191999 68,945 2,143,254 61.8 31
2009 68,945 3,138,369 146.4 46
Source: Adoptedfrom (Olima, 2001, p. 3)& (GoK, 2010)
As the capital city o f the newly independent state, the city council was now
expected to serve all its 330,000 inhabitants with good roads, water . . . .
(Hirst & Lamba, 1994, p. 143). It was now time for the new African ruling
elite to deliver urban goods and services to the residents of Nairobi.
a) 1973 Metropolitan Growth Strategy (MGS)
This was crafted by the Nairobi Urban Study Group (NUSG), funded by the
Nairobi City Council (NCC), the Kenyan Government, the World Bank and
the United Nations and was expected to provide direction for the city’s growth
up to the year 2000. It had elements of Master Planning, Structured Planning
and Action Planning but to date it remains largely unimplemented as there
were no real statutory or legal enactments in its support.73
The Strategy was towards consequent decentralization and the development of
alternative service centres within the different districts of the city to reduce the
high densities in the Central Area. The outlying secondary centres were
anticipated to develop as major settlements independent of the city centre,
having their own industrial, residential, commercial and administrative sub
zones. Service centres would be located in relation to their potential catchment
areas and near main roads and bus routes, which would also allow for the
attraction of passing trade. The fact that almost 25% of the total trips were to
be made on foot or bicycle showed the importance o f having employment
areas not far away from the residential areas.
The NUSG also developed the city’s by-passes and link-roads concept as part
o f the MGS. They established the Northern, Eastern and Southern by-passes
with a proposed link road between the Northern and Southern by-passes. The
road corridor reserved for this purpose was 60M wide, but has since been the
source of major contentions.
Under Appendix III, MGS set options for a growth strategy in order of
preference (Emig & Ismail, 1980, p. 60). These were:
(i) Lineal development linking Nairobi and Thika
(ii) A new city at Thika
(iii) Eastern Extensions to Nairobi
(iv) Eastern Extensions to Nairobi and the development of Athi-River
(v) Extension o f Nairobi to the North-East and minimally West
(vi) North and North-East Extensions to Nairobi
(vii) A new city at Athi-River
74
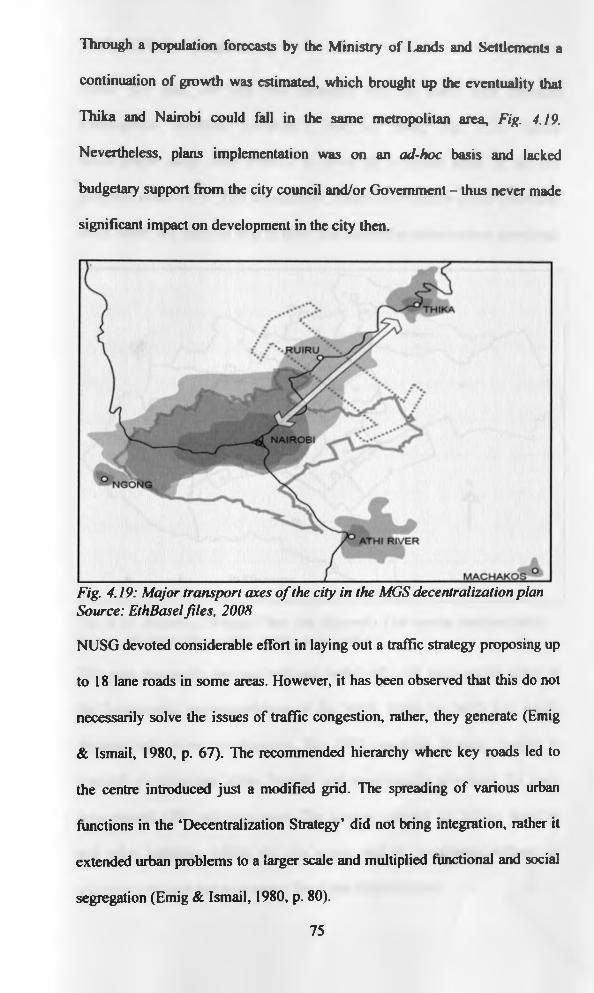
Through a population forecasts by the Ministry of I>ands and Settlements a
continuation of growth was estimated, which brought up the eventuality that
Thika and Nairobi could fall in the same metropolitan area, Fig. 4.19.
Nevertheless, plans implementation was on an ad-hoc basis and lacked
budgetary support from the city council and/or Government - thus never made
significant impact on development in the city then.
Fig. 4.19: Major transport axes o f the city in the MGS decentralization plan Source: EthBasel files, 2008
NUSG devoted considerable effort in laying out a traffic strategy proposing up
to 18 lane roads in some areas. However, it has been observed that this do not
necessarily solve the issues of traffic congestion, rather, they generate (Emig
& Ismail, 1980, p. 67). The recommended hierarchy where key roads led to
the centre introduced just a modified grid. The spreading of various urban
functions in the ‘Decentralization Strategy’ did not bring integration, rather it
extended urban problems to a larger scale and multiplied functional and social
segregation (Emig & Ismail, 1980, p. 80).
75
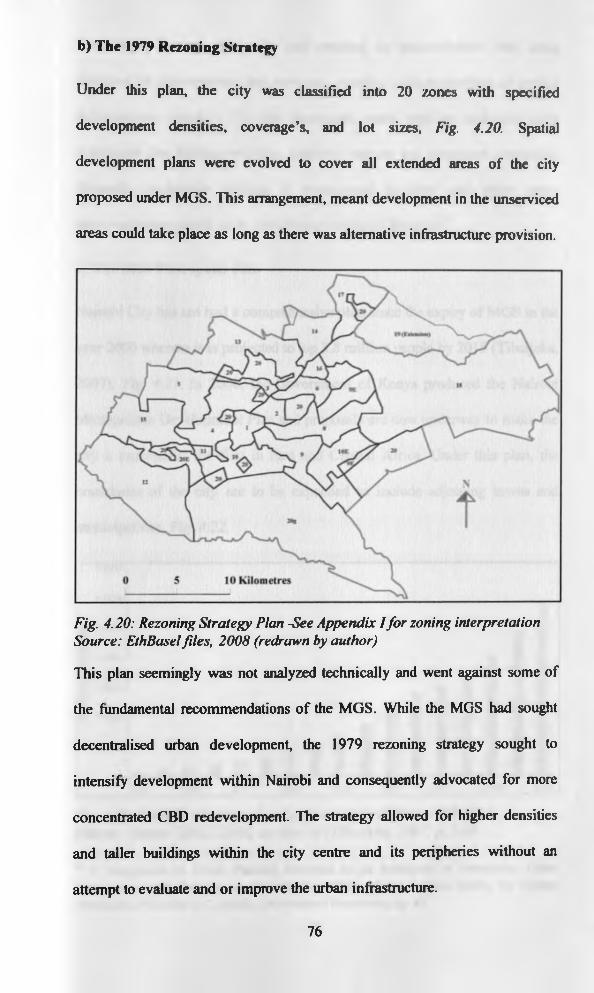
b) The 1979 Rezoning Strategy
Under this plan, the city was classified into 20 zones with specified
development densities, coverage’s, and lot sizes, Fig. 4.20. Spatial
development plans were evolved to cover all extended areas of the city
proposed under MGS. This arrangement, meant development in the unserviced
areas could take place as long as there was alternative infrastructure provision.
Fig. 4.20: Rezoning Strategy Plan -See Appendix I for zoning interpretation Source: EthBasel files, 2008 (redrawn by author)
This plan seemingly was not analyzed technically and went against some of
the fundamental recommendations of the MGS. While the MGS had sought
decentralised urban development, the 1979 rezoning strategy sought to
intensify development within Nairobi and consequently advocated for more
concentrated CBD redevelopment. The strategy allowed for higher densities
and taller buildings within the city centre and its peripheries without an
attempt to evaluate and or improve the urban infrastructure.
76

Restrictions became untenable and resulted to encroachment into areas
designed for infrastructure and services - creating a future problem of getting
infrastructure corridors. To date inadequate water supplies, technologically
inadequate fire fighting services, relatively narrow and congested circulation
channels, inadequate parking & recreational facilities and other urban
inconveniences appear to be the obvious results of this plan25.
c) The 2008 Metropolis Plan
Nairobi City has not had a comprehensive plan since the expiry of MGS in the
year 2000 whereas it is projected to top 3.8 million people by 2015 (Tibaijuka,
2007), Fig. 4.21. In 2008, the Government of Kenya produced the Nairobi
Metropolitan Development Plan and proposals are now underway to make the
city a metropolis: the first in East and Central Africa. Under this plan, the
boundaries of the city are to be expanded to include adjoining towns and
municipalities, Fig. 4.22.
1970 I 960 1990 2000 2007 2015 202S
Fig. 4.21: Nairobi's historical and projected population, 1950-2025 Source: Source: KNBS 2008, as cited by (Tibaijuka, 2007, p. 148)
25 A Reappraisal of Urban Planning Processes as an instrument of Sustainable Urban Development and Management (Nairobi Oct. 1994), United Nations Centre for Human Settlements, Edited by A.C. Mosha, University of Bootswana, pg. 45
77
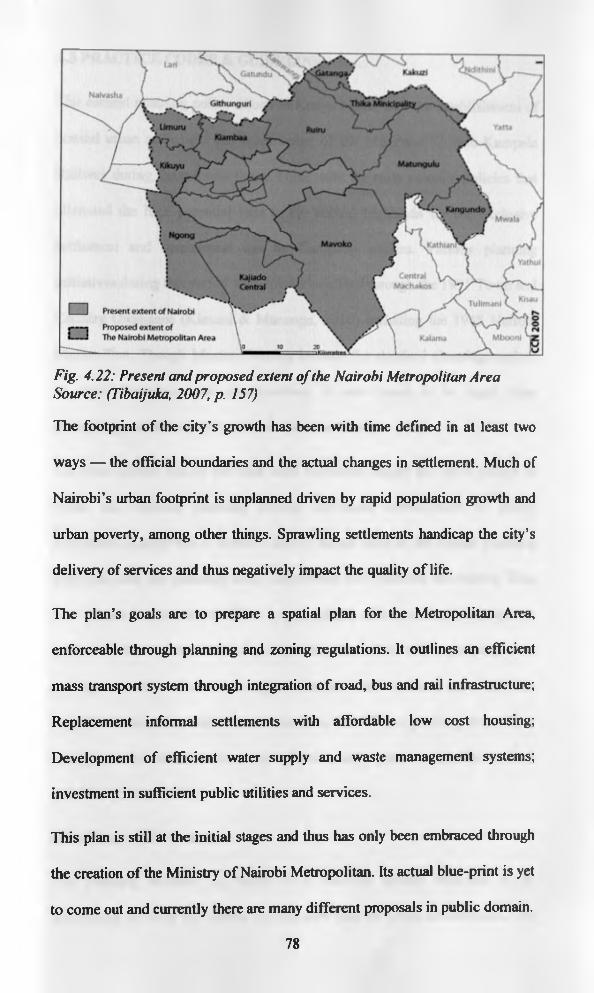
Fig. 4.22: Present and proposed extent o f the Nairobi Metropolitan Area Source: (Tibaijuka, 2007, p. 157)
The footprint of the city’s growth has been with time defined in at least two
ways — the official boundaries and the actual changes in settlement. Much of
Nairobi’s urban footprint is unplanned driven by rapid population growth and
urban poverty, among other things. Sprawling settlements handicap the city’s
delivery of services and thus negatively impact the quality of life.
The plan’s goals are to prepare a spatial plan for the Metropolitan Area,
enforceable through planning and zoning regulations. It outlines an efficient
mass transport system through integration o f road, bus and rail infrastructure;
Replacement informal settlements with affordable low cost housing;
Development of efficient water supply and waste management systems;
investment in sufficient public utilities and services.
This plan is still at the initial stages and thus has only been embraced through
the creation of the Ministry of Nairobi Metropolitan. Its actual blue-print is yet
to come out and currently there are many different proposals in public domain.
78
4 3 PRACTICE CODES & GUIDELINES
rhe earliest planning policy efforts in Kenya began with the establishment of
coastal urban settlement and construction of the Mombasa-Kisumu-Kampala
Railway during the colonial times. There were the early colonial policies that
alienated the high potential land in the central highlands for the exclusive
settlement and commercial use by European settlers. Various planning
initiatives during this period were institutionalized through the 1931 Town and
Country Ordinance (Kimani & Musungu, 2010) including the 1948 Nairobi
Master-Plan. Though Master Planning became the standard planning method
in major townships and municipalities, it was found to be rigid, time
consuming and lacked an implementation framework.
The post colonial era on the other hand witnessed largely the development of
urban and regional planning through deliberate development of policy
documents. Kenya was a British Colony; hence most of the spatial planning
concepts, land use planning tools, instruments and practises are related. This,
it is argued has practically failed to appreciably influence land development
patterns in the rapidly urbanising city with most of the urban planning tools
turning out to be inefficient or inappropriate to local conditions especially due
to institutional, social and economic reasons. In addition, planning institutions
have generally been powerless to influence town growth and development
activities (Olima, 1993).
43.1 Planning Structure
The planning structure in Kenya is a two-tier system reflected in its
functioning between the Central Government and the Local Government. The
79
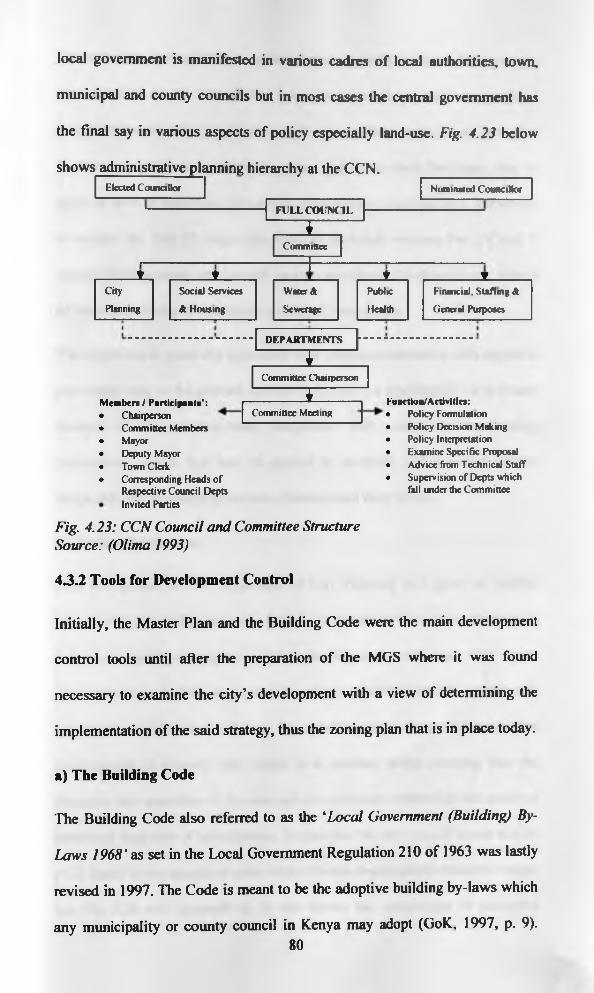
local government is manifested in various cadres of local authorities, town,
municipal and county councils but in most cases the central government has
the final say in various aspects of policy especially land-use. Fig. 4.23 below
shows administrative planning hierarchy at the CCN.Elected Councillor
F U L L C O I IN C H .
— r ~
Nominated Councillor
Committee
_______ t _____ t _____ ____ *___ ▼City Social Services Water & Public Financial, Staffing A
Planning A Housing Sewerage Health General Purposes
D E P A R T M E N T S
l
M em b ers / P a rtic ip a n ts ':Chairperson Committee Members MayorDeputy Mayor Town ClerkCorresponding Heads of Respective Council Depts Invited Parties
Committee Chairperson
iCommittee Meeting
Eu n ctioa /A ct! vi t ie s :Policy Formulation Policy Decision Making Policy Interpretation Examine Specific Proposal Advice from Technical Staff Supervision of Depts which fall under the Committee
Fig. 4.23: CCN Council and Committee Structure Source: (Olima 1993)
43.2 Tools for Development Control
Initially, the Master Plan and the Building Code were the main development
control tools until after the preparation of the MGS where it was found
necessary to examine the city’s development with a view of determining the
implementation of the said strategy, thus the zoning plan that is in place today.
a) The Building Code
The Building Code also referred to as the ‘Local Government (Building) By-
Laws 1968’ as set in the Local Government Regulation 210 of 1963 was lastly
revised in 1997. The Code is meant to be the adoptive building by-laws which
any municipality or county council in Kenya may adopt (GoK, 1997, p. 9).SO
The code has several sections each targeting a particular issue for example;
Part I which is the introduction stipulates the citation and the code of
interpretation regarding application of By-laws -Plans, notices and fees. Part
II sets out regulation regarding the siting and space about buildings, that is:
space in front of buildings, side spaces, accessibility, building lines, waivers as
to heights etc. Part III targets the building materials whereas Part IV and V
targets advertisements and general issues respectively like demolitions, extend
o f canopies, closing of streets and paving of open spaces.
The regulation is generally applicable with undue consideration with regard to
population size or the general context be it a city, a municipality or a county
council. It also creates many loop-holes with many sections bearing
'exemptions clause' that may be granted by councils, and does not address
adequately the relationship between channels and built-forms.
b) Zoning Regulations
This is a product of the Department of City Planning as a guide to Nairobi
City Development Ordinances and Zones as per the 1979 rezoning strategy. It
acts as a guide to aspects of the development ordinances that every
development in the City is required to uphold - be it residential, commercial,
industrial, institutional or religious. Its establishment was meant to ensure that
development is allowed only where it is needed, while ensuring that the
character and amenities o f the area are not adversely affected in the midst of
continued high rate of urbanization. It classifies the city into 20 zones (CCN,
p. 2) based on geographical areas with relevant departmental reference maps;
see Fig 4.20 and Appendix II. It also shows the percentages of permitted
81
Ground Coverage (GC), Plot Ratios (PR) and the type(s) of developments
allowed. A general minimum zone plot size is also stipulated and the general
policy issues elaborated.
Issues pertaining to circulation channels have been conspicuously left out.
Nevertheless, this is the closest that planning has come into addressing the
relationships between building heights and plot coverage. The intention of
these regulations was to curtail inappropriate illegal developments but they are
rarely enforced if not marginally (Kimani & Musungu, 2010). Their
effectiveness is hampered by among others, the lack of capacity to inspect and
implement plans, lack of relevant supportive systems for effective
enforcement and general lack of resources.
Some of the other statutes that have a bearing on the thesis subject matter
include the Government Land Act, Public Health Act, Environment
Management and Coordination Act (EMCA), Roads Act and Way-leaves Act
among others. The design of the street is therefore governed by different
standards implemented by different agencies causing it to lack overall design
objectives.
c) Circulation Channels
Currently, road transport is the predominant mode of transport and carries
about 93% of all cargo and passenger traffic in the country, which is a replica
o f what is experienced in the city (Media, 2011). Roads in Kenya are
classified according to size and purpose for ease in planning, design,
administration and usage as shown in Table 4.3. Currently, almost all urban
roads fall under the unclassified category ‘U \
82
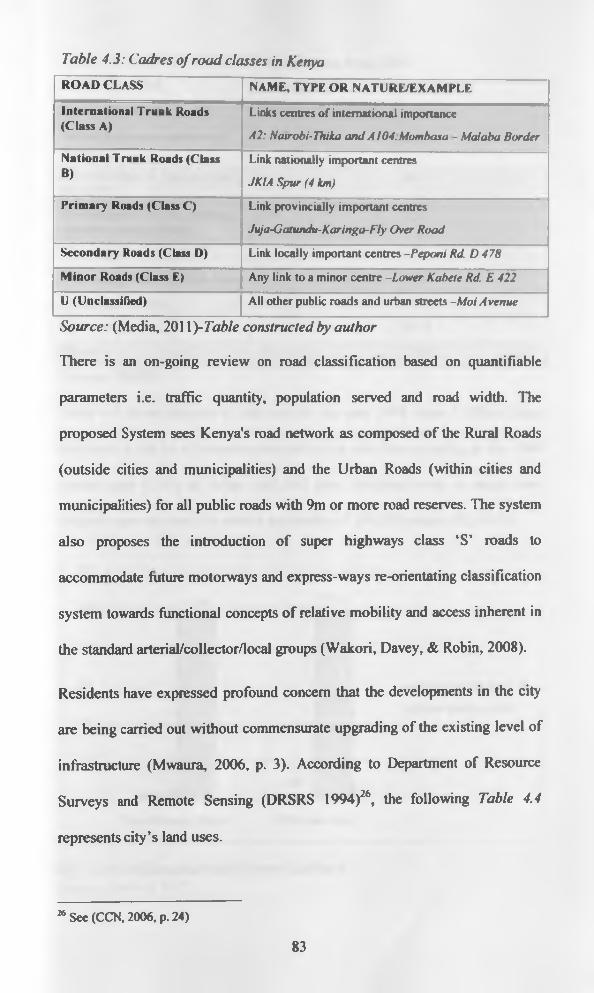
Table 4.3: Cadres o f road classes in KenyaROAD CLASS NAME, TYPE OR NATURE/EXAMPLE
International Trunk Roads(Class A)
Links centres of international importanceA2: Nairobi- Thika and A t 04 .Mombasa - Malabo Border
National Trunk Roads (Class B)
Link nationally important centres JKIA Spur (4 km)
Primary Roads (Class C) Link provincially important centres Juja-G atundu-Karin go- Fly Over Road
Secondary Roads (Class D) Link locally important centres -Peponi Rd. D 478
M inor Roads (Class E) Any link to a minor centre -Lower Kabele Rd. E 422
U (Unclassified) All other public roads and urban streets -Moi Avenue
Source: (Media, 201 YyTable constructed by author
There is an on-going review on road classification based on quantifiable
parameters i.e. traffic quantity, population served and road width. The
proposed System sees Kenya's road network as composed o f the Rural Roads
(outside cities and municipalities) and the Urban Roads (within cities and
municipalities) for all public roads with 9m or more road reserves. The system
also proposes the introduction o f super highways class ‘S’ roads to
accommodate future motorways and express-ways re-orientating classification
system towards functional concepts of relative mobility and access inherent in
the standard arterial/collector/local groups (Wakori, Davey, & Robin, 2008).
Residents have expressed profound concern that the developments in the city
are being carried out without commensurate upgrading of the existing level of
infrastructure (Mwaura, 2006, p. 3). According to Department of Resource
Surveys and Remote Sensing (DRSRS 1994)26, the following Table 4.4
represents city’s land uses.
26 See (CCN, 2006, p. 24)
83
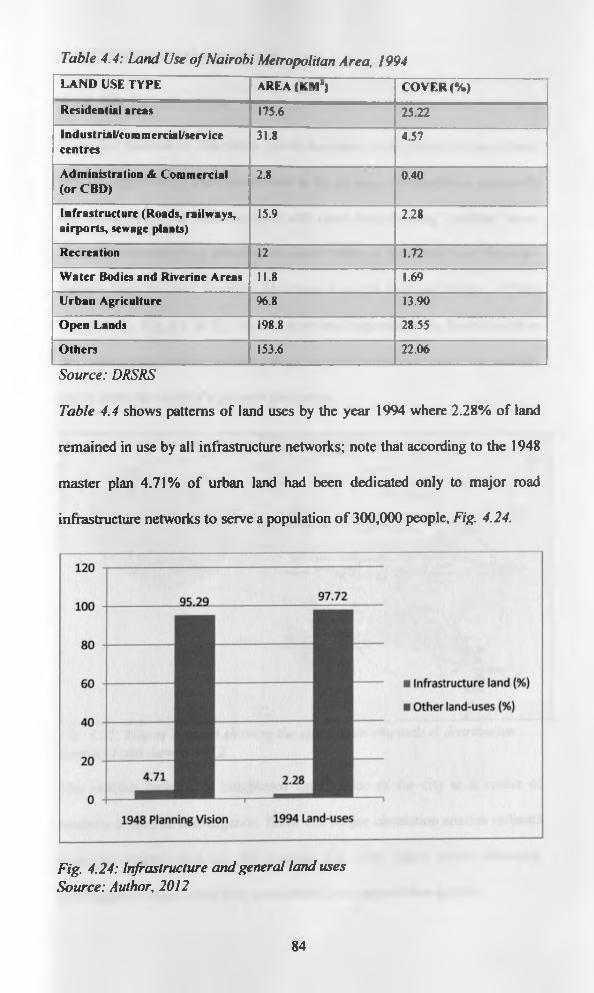
Table 4.4: Land Use o f Nairobi Metropolitan Area, 1994LAND USE TYPE AREA (KM1) COVER (%)
Residential areas 175.6 25.22I n d u s t ria l/co m m e rcia l/se rv ice centres
31.8 4.57
Administration & Commercial (or CBD)
2.8 0.40
Infrastructure (Roads, railways, airports, sewage plants)
15.9 2.28
Recreation 12 1.72
Water Bodies and Riverine Areas 11.8 1.69
Urban Agriculture 96.8 13.90
Open Lands 198.8 28.55
Others 153.6 22.06
Source: DRSRS
Table 4.4 shows patterns of land uses by the year 1994 where 2.28% of land
remained in use by all infrastructure networks; note that according to the 1948
master plan 4.71% of urban land had been dedicated only to major road
infrastructure networks to serve a population o f 300,000 people, Fig. 4.24.
Fig. 4.24: Infrastructure and general land uses Source: Author, 2012
84
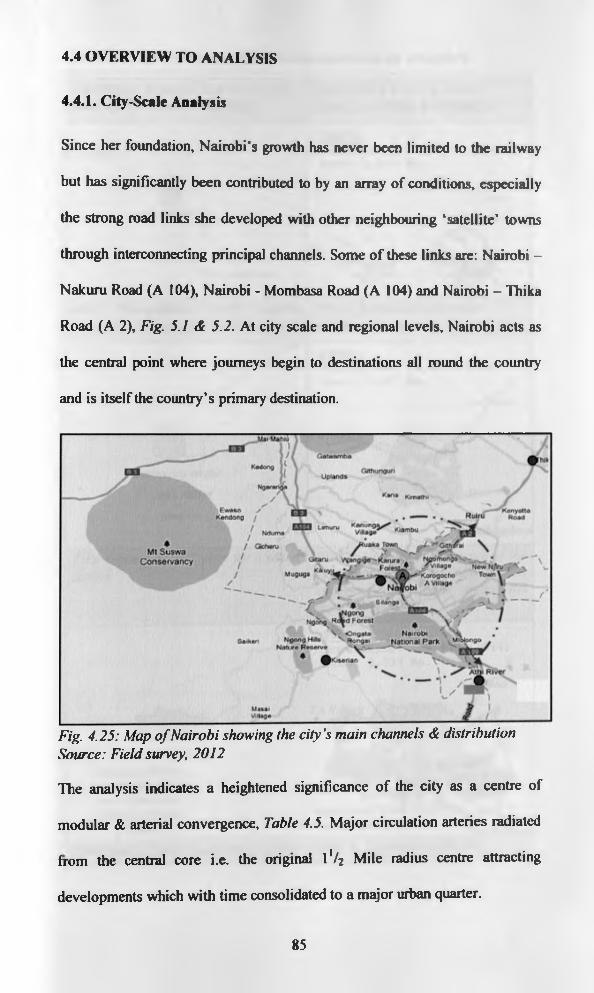
4.4 OVERVIEW TO ANALYSIS
4.4.1. City-Scale Analysis
Since her foundation, Nairobi’s growth has never been limited to the railway
but has significantly been contributed to by an array of conditions, especially
the strong road links she developed with other neighbouring ‘satellite’ towns
through interconnecting principal channels. Some of these links are: Nairobi -
Nakuru Road (A 104), Nairobi - Mombasa Road (A 104) and Nairobi - Thika
Road (A 2), Fig. 5.1 & 5.2. At city scale and regional levels, Nairobi acts as
the central point where journeys begin to destinations all round the country
and is itself the country’s primary destination.
Fig. 4.25: Map o f Nairobi showing the city's main channels & distribution Source: Field survey, 2012
The analysis indicates a heightened significance of the city as a centre of
modular & arterial convergence, Table 4.5. Major circulation arteries radiated
from the central core i.e. the original 1V2 Mile radius centre attracting
developments which with time consolidated to a major urban quarter.
85
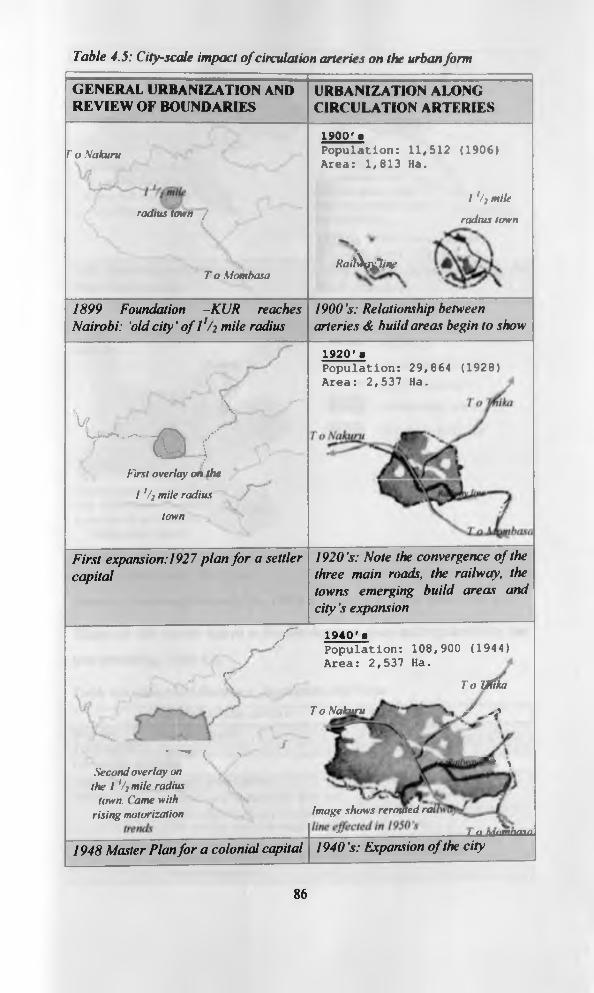
Table 4.5: City-scale impact o f circulation arteries on the urban form
GENERAL URBANIZATION AND REVIEW OF BOUNDARIES
URBANIZATION ALONG CIRCULATION ARTERIES
T o Nakuru1 9 0 0 '•Population: 11,512 (1906) Area: 1,813 Ha.
1 ‘/j mileradius town /
T o Momhasa
radius town
H ai)\i^linr
1899 Foundation -K LJR reaches N airobi: 'o ld c ity ’ o f I 1/ 2 m ile radius
1 9 0 0 ’s: Relationship between arteries & build areas begin to show
1 9 2 0 'bPopulation: 29,864 (1928) Area: 2,537 Ha.
s s f ' ' * * * \ _ yW r ‘
r ~ - © f ' © - /First overlay on the
1 '/j mile radius
town
F irst expansion:1927 p la n f o r a settler ca p ita l
1 9 2 0 ’s: N o te the convergence o f the three m ain roads, the railway, the tow ns em erging bu ild areas an d c i ty ’s expansion
S 1 9 4 0 '8Population: 108,900 (1944) Area: 2,537 Ha.
i O tryTo TjHika
T o Nakuru / ' y/
• - c ,Second overlay on the 1'/: mile radius
M >
town. Came withrising motorization Image shows rerouted rai
M i n Muinuasu
1948 M aster P lan f o r a co lonia l capita l 1 9 4 0 ’s: Expansion o f the c ity
86
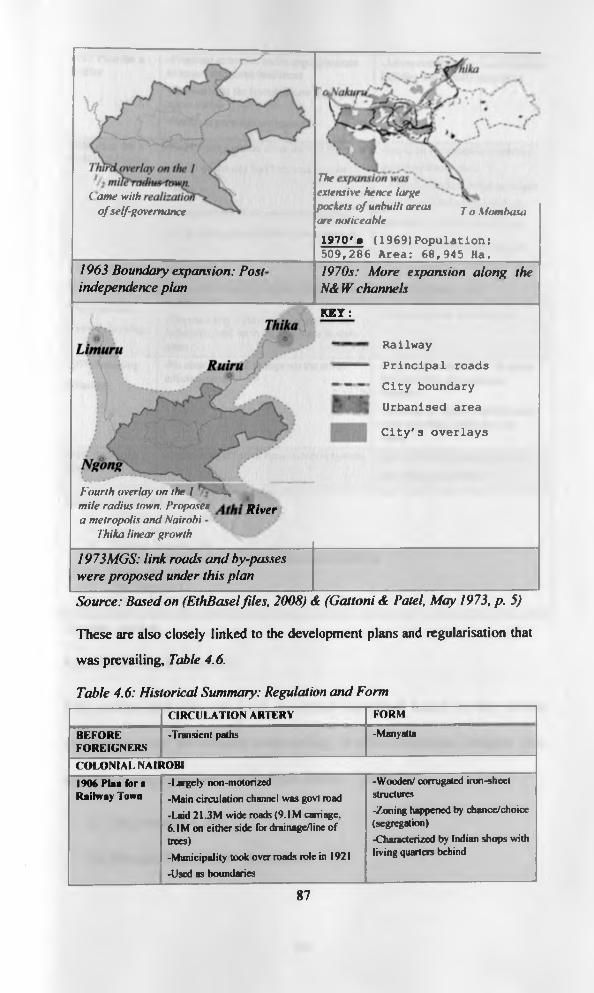
( ame with of self-governance
Theextensive hence large pockets o f unbuilt areas are noticeable T o Mombasa
1963 Boundary expansion: Post independence p lan
1 9 7 0 ' » (1969)Population:509,286 Area: 68,945 Ha._____1970s: M ore expansion a long the N& W channels
K E Y :
RailwayPrincipal roads City boundary Urbanised areaCity's overlays
Fourth overlay on the l —, _mile radius town. Proposes Rjyer a metropolis and Nairobi -
Thika linear growth
1973M GS: link roads a n d by-passes w ere proposed under th is p la n
Source: B ased on (E thB asel files , 2008) & (G atton i & Patel, M ay 1973, p. 5)
These are also closely linked to the development plans and regu lari sat ion that
was prevailing, Table 4.6.
Table 4.6: H istorical Sum m ary: Regulation a n d Form
CIRCULATION ARTERY FORM
BEFOREFOREIGNERS
•Transient paths -Manyatta
COLONIAL NAIROBI1906 Plan fora Railway Town
-largely non-motorized-Main circulation channel was govt mad-Laid 21.3M wide roads (9.1M carriage.6.1M on either side for drainage/line of trees)-Municipality took over roads role in 1921 -Used as boundaries
-Wooden/ corrugated iron-sheet structures-Zoning happened by chance/choice (segregation)-Characterized by Indian shops with living quarters behind
87
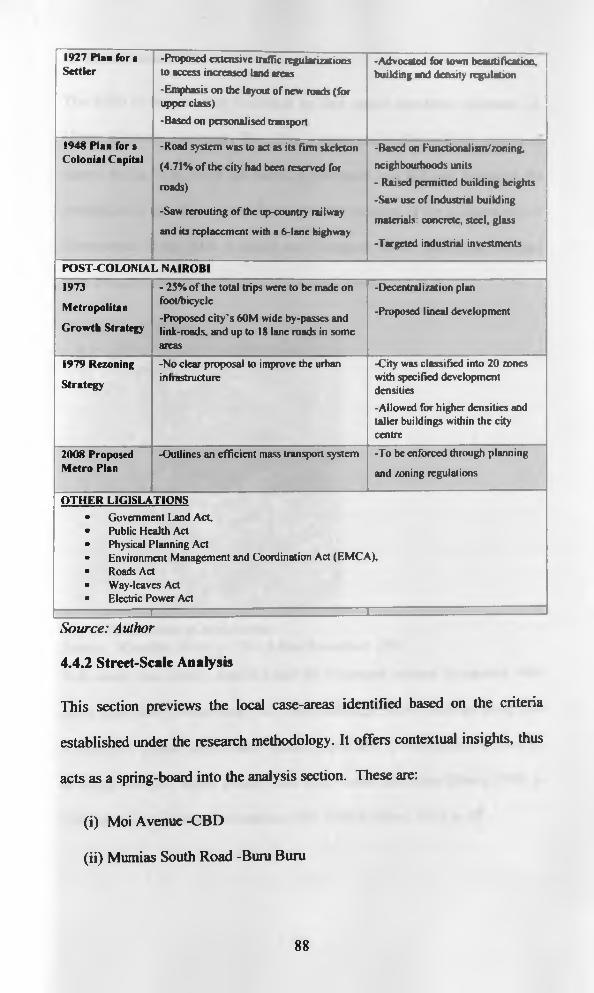
1927 Plan for a Settler
-Proposed extensive traffic regularizations to access increased land areas
-Emphasis on the layout of new roads (for upper class)
-Based on personalised transport
•Advocated for town beautification, building and density regulation
1948 Plan for a Colonial Capital
-Road system was to act as its firm skeleton
(4.71% of the city had been reserved for
roads)
-Saw rerouting of the up-country railway
and its replacement with a 6-lane highway
-Based on functional ism/zoning,
neighbourhoods units
- Raised permitted building heights
•Saw use of Industrial building
materials: concrete, steel, glass
-Targeted industrial investments
POST-COLONIAL NAIROBI
1973
Metropolitan
Growth Strategy
- 25% of the total trips were to be made on foot/bicycle
-Proposed city’s 60M wide by-passcs and link-roads, and up to 18 lane roads in some areas
•Decentralization plan
-Proposed lineal development
1979 Rezoning
Strategy
-No clear proposal to improve the urban infrastructure
-City was classified into 20 zones with specified development densities-Allowed for higher densities and taller buildings within the city centre
2008 Proposed Metro Plan
-Outlines an efficient mass transport system -To be enforced through planning
and zoning regulations
OTHER LIGISLATIONS■ Government Land Act,• Public Health Act■ Physical Planning Act■ Environment Management and Coordination Act (EM CA),■ Roads Act■ Way-leaves Act■ Electric Power Act
1 " I ■Source: Author
4.4.2 Street-Scale Analysis
This section previews the local case-areas identified based on the criteria
established under the research methodology. It offers contextual insights, thus
acts as a spring-board into the analysis section. These are:
(i) Moi Avenue -CBD
(ii) Mumias South Road -Buru Bum
88

a) Moi Avenue -CBD
The CBD of Nairobi City is defined by four major circulation channels i.c.
Uhuru Highway, University Way, Moi Avenue and Haille Sellasie Avenue as
shown in Fig. 4.26. From the outset, a grid street was laid out, fallowing the
orientation of the railway line, Table. 4.7. The crossing of the northern part of
Government Road (Moi Avenue) and Delamere Street (Kenyatta Avenue)
later became the economic centre of the small town.
Fig. 4.26: Location o f Moi AvenueSource: (Kinuthia, 2011, p. 53) - Edited by author, 2012
This centre was slowly densified and the structures became permanent, with
many small two or three storey Art D6co buildings. Many buildings along Moi
Avenue still present colonnaded facades, especially in the northern section up
to Khoja Mosque, which proudly bear their names and dates (Moss, 1999, p.
104) retaining a character evocative of the 1930’s (Moss, 1999, p. 95).
89

Table 4.7 . Railway authorities and train station as an urban engine
a) rowc«o«le of&ccy —»
/ • H r- V -
X ' ' ....^ ....‘
1900: Station Road (later Government The crossing o f the northern part o fRoad, today Moi Avenue) was the first Government Road (Moi Avenue) andconnection between the railway Delamere Road (Kenyatta Avenue)station and the Protectorate Offices formed the economic centre o f the(British administration) small town
Source: EthBasel files, 2008 (Modified by author 2012)
Due to the nearly complete densification of the quarter around Government
Road (Moi Avenue), the town expanded towards the west, Table 4.7. As a
major East West connection, Delamere Avenue (Kenyatta Avenue) became
the commercial and cultural centre of the city, with banks, hotels cinema halls
and retail outlets. The new plots were much larger, laid out for high rise
buildings and circulation arteries fit for motorized transport
In almost all town planning schemes in tropical countries, attention has to be
paid to orientation. It is obvious that for Nairobi correct orientation o f roads
and of the building sites themselves should have been the basis of correct
architectural orientation. Originally, the orientation features of the city were
the railway, the hill and the Nairobi River, putting CBD’s orientation is at
about 26° off the E-W orientation. Designers have now to grapple to protect
facades against the direct impact of the sun through intelligent orientation or
application of sun shading devices, which eventually impact on the urban
90
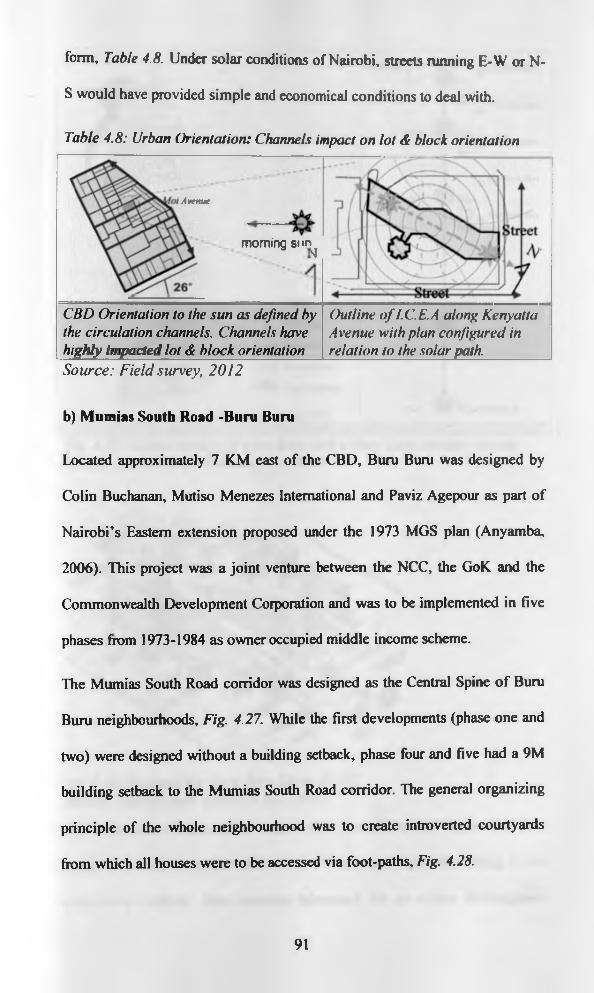
form, Table 4.8. Under solar conditions of Nairobi, streets running E-W or N-
S would have provided simple and economical conditions to deal with.
Table 4.8: Urban Orientation: Channels impact on lot & block orientation
Avenue
morning tnn^
CBD Orientation to the sun as defined by the circulation channels. Channels have highly impacted lot & block orientation
Outline o f I.C.E.A along Kenyatta Avenue with plan configured in relation to the solar path.
Source: Field survey, 2012
b) Mumias South Road -Buru Buru
Located approximately 7 KM east of the CBD, Buru Buru was designed by
Colin Buchanan, Mutiso Menezes International and Paviz Agepour as part of
Nairobi’s Eastern extension proposed under the 1973 MGS plan (Anyamba,
2006). This project was a joint venture between the NCC, the GoK and the
Commonwealth Development Corporation and was to be implemented in five
phases from 1973-1984 as owner occupied middle income scheme.
The Mumias South Road corridor was designed as the Central Spine of Buru
Buru neighbourhoods, Fig. 4.27. While the first developments (phase one and
two) were designed without a building setback, phase four and five had a 9M
building setback to the Mumias South Road corridor. The general organizing
principle of the whole neighbourhood was to create introverted courtyards
from which all houses were to be accessed via foot-paths, Fig. 4.28.
91

Fig. 4.27: Layout concept o f Buru Buru with a Buru Buru services concept Source: Adaptedfrom EthBasel files, 2008
Fig. 4.28: Proposal for Buru Buru Phase I I 1971 Source: Adoptedfrom EthBasel files, 2008
The courts were linked to the central spine via foot-paths, which were also
meant to have commercial facilities and community amenities along it but
were never realized. This omission advocated for an ad-hoc development
92
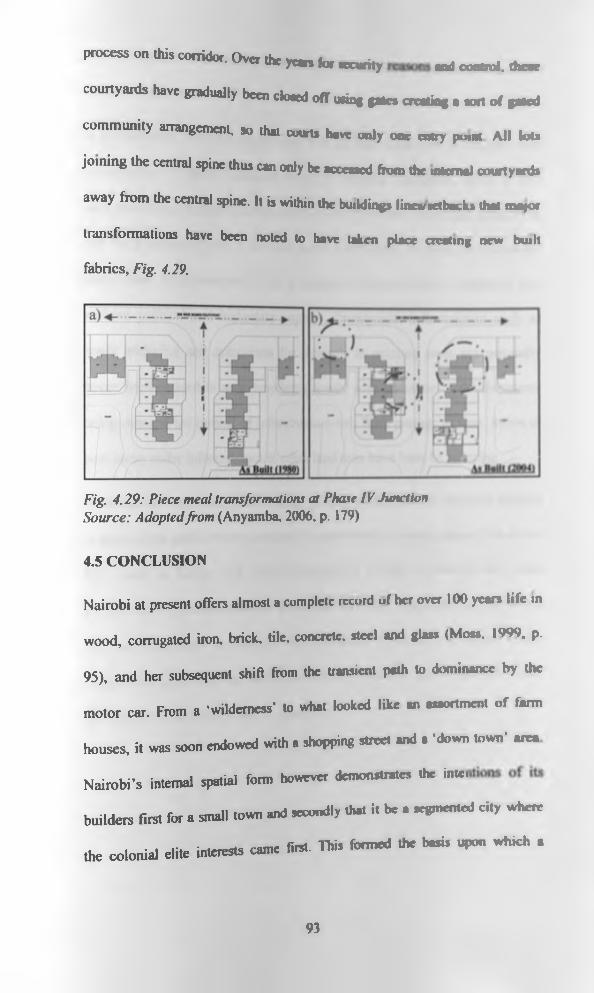
m ) control, th c rprocess on this corridor. Over the y o n lor wearily
courtyards have gradually been ck-ed off t r i a g p * . o a ^ . « , o fg -e d
community arrangement, so that courts have only one entry point All lots
joining the central spine thus can only be accessed from the internal courtyard*
away from the central spine. It is within the buildup Hncviethacks that major
transformations have been noted to have taken plaoe creating new built
fabrics, Fig. 4.29.
Fig. 4.29: Piece meal transformations at Phase IV Junction Source: Adopted from (Anyamba, 2006, p. 179)
4.5 CONCLUSION
Nairobi at present offers almost a complete record of her over 100 yean life in
wood, corrugated iron, brick, tile, concrete, steel and glass (Moss. 1999. p.
95), and her subsequent shift from the hmiianl p*h to dominance by *be
motor car. From a ‘wilderness’ to what looked like an assortment of farm
houses, it was soon endowed with a shopping street «id a ’down town’ area
Nairobi’s internal spatial form however dcm ooM M the ink.
builders first for a small town and secondly M I l H «*"«"•«* city w h «
the colonial elite interns* came first. This fbnned the b -U upon which a
93
skewed system of distribution of land, infrastructure (channels) and other
resources was build.
In post-colonial Nairobi, urban form and for that matter her production and
consumption of space remained basically colonial (Anyamba, 2006, p. 85)
with increasing mismatch between the needs of the ever increasing population
and the provision of public services and infrastructure. Proposed development
plans have been observed to be prescriptive, deterministic, antiquated and
without political and budgetary support. Prerequisite infrastructure such as
roads widening and extensions for example in rezoned areas are generally
never implemented to accommodate growth, with character of developments
being demand-led instead o f infrastructure-led. With passage of time, ratios of
land areas under infrastructure to other land uses have been be reducing.
Planning in Kenya today still retains several similarities to historical British
practice in as much as development is controlled by zoning maps. It is noted
that much as Britain has sought services of CABE to beef-up her code,
Kenyan code remains outdated and bears inherited, inappropriate provisions
that are susceptible to multiple interpretations. Currently, there are many
legislations governing the build-environment, and for that matter the street
causing it to lack overall design objectives.
94

CHAPTER FIVE: FINDINGS & ANALYSISCHAPTER OUTLINE:
5.1 City scale analysis-City’s Planning and Growth Patterns-Impacts of the Changing Character of Arteries on Urban Form -Circulation Arteries and Informality
5.2 Street- scale analysis-Moi Avenue -Mumim South Road
5.1 CITY SCALE ANALYSIS
5.1.0 Introduction
Circulation arteries within the city present varied character reminiscent of their
histories. There are sections for example where roads act as urban edges
delineating two different zones, whereas in others they cut through delineated
zones hence varied levels o f enclosures. Fig. 5.1 & 5.2 shows resultant
character on sections along Thika road, Mombasa road and Lang ata road.
Fig. 5.1: Circulation channels and urban character, sections A,B & ( Source: Field survey, 2012 adapted from (Google, 2012)
95
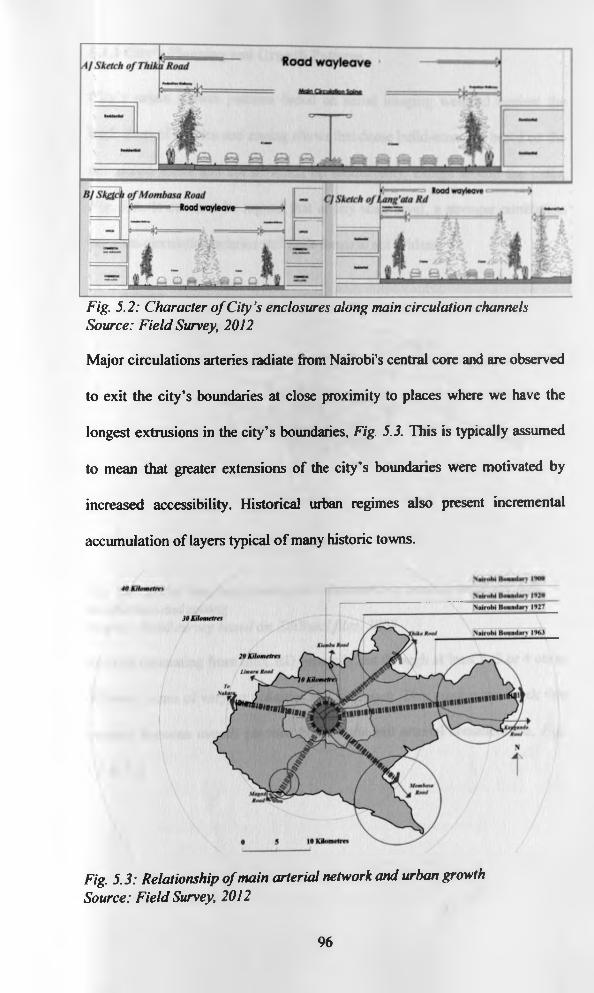
Fig. 5.2: Character o f City’s enclosures along main circulation channels Source: Field Survey, 2012
Major circulations arteries radiate from Nairobi's central core and are observed
to exit the city’s boundaries at close proximity to places where we have the
longest extrusions in the city’s boundaries, Fig. 5.3. This is typically assumed
to mean that greater extensions of the city’s boundaries were motivated by
increased accessibility. Historical urban regimes also present incremental
accumulation of layers typical of many historic towns.
Fig. 5.3: Relationship o f main arterial network and urban growth Source: Field Survey, 2012
96
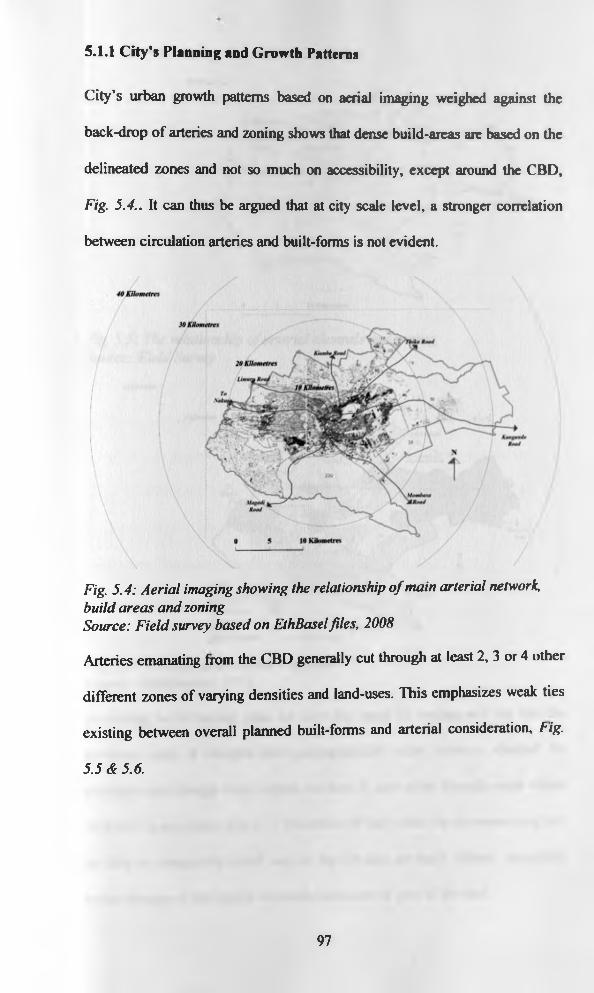
5.1.1 City's Planning and Growth Patterns
City’s urban growth patterns based on aerial imaging weighed against the
back-drop of arteries and zoning shows that dense build-areas are based on the
delineated zones and not so much on accessibility, except around the CBD,
Fig. 5.4.. It can thus be argued that at city scale level, a stronger correlation
between circulation arteries and built-forms is not evident.
Fig. 5.4: Aerial imaging showing the relationship o f main arterial network, build areas and zoningSource: Field survey based on EthBasel files, 2008
Arteries emanating from the CBD generally cut through at least 2, 3 or 4 other
different zones of varying densities and land-uses. This emphasizes weak ties
existing between overall planned built-forms and arterial consideration, big-
5.5 & 5.6.
97
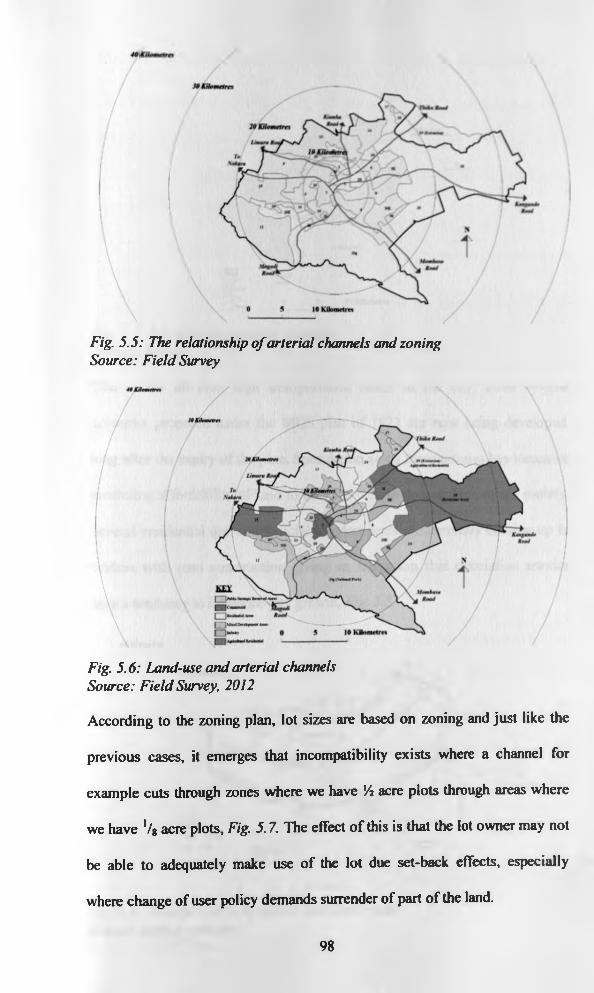
Fig. 5.5: The relationship o f arterial channels and zoning Source: Field Survey
Fig. 5.6: Land-use and arterial channels Source: Field Survey, 2012
According to the zoning plan, lot sizes are based on zoning and just like the
previous cases, it emerges that incompatibility exists where a channel for
example cuts through zones where we have Vi acre plots through areas where
we have % acre plots, Fig. 5.7. The effect of this is that the lot owner may not
be able to adequately make use of the lot due set-back effects, especially
where change of user policy demands surrender of part of the land.
98
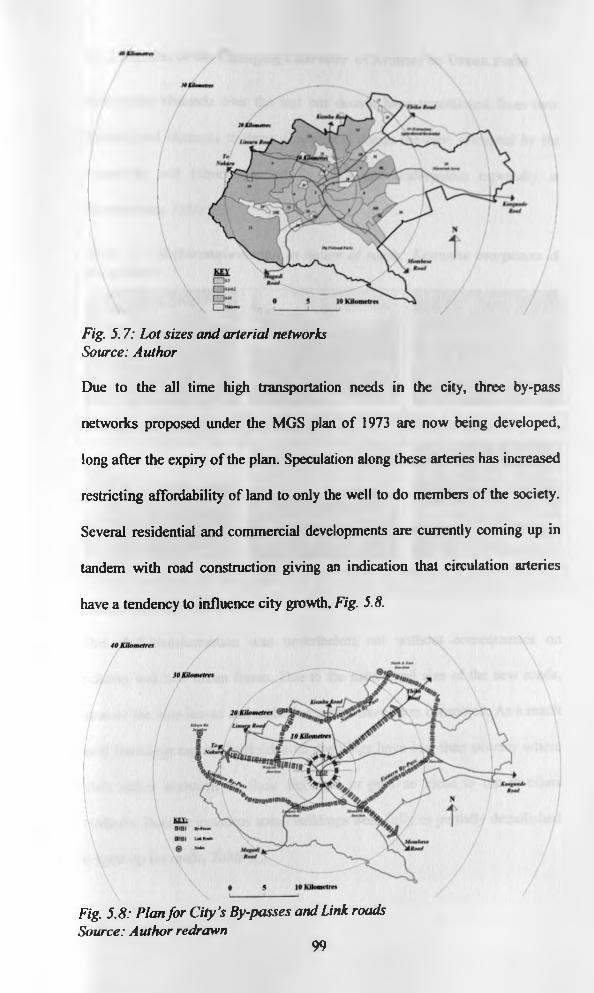
Fig. 5.7: Lot sizes and arterial networks Source: Author
Due to the all time high transportation needs in the city, three by-pass
networks proposed under the MGS plan of 1973 are now being developed,
long after the expiry of the plan. Speculation along these arteries has increased
restricting affordability of land to only the well to do members of the society.
Several residential and commercial developments are currently coming up in
tandem with road construction giving an indication that circulation arteries
have a tendency to influence city growth, Fig. 5.8.
Fig. 5.8: Plan for City’s By-passes and Link roads Source: Author redrawn
99
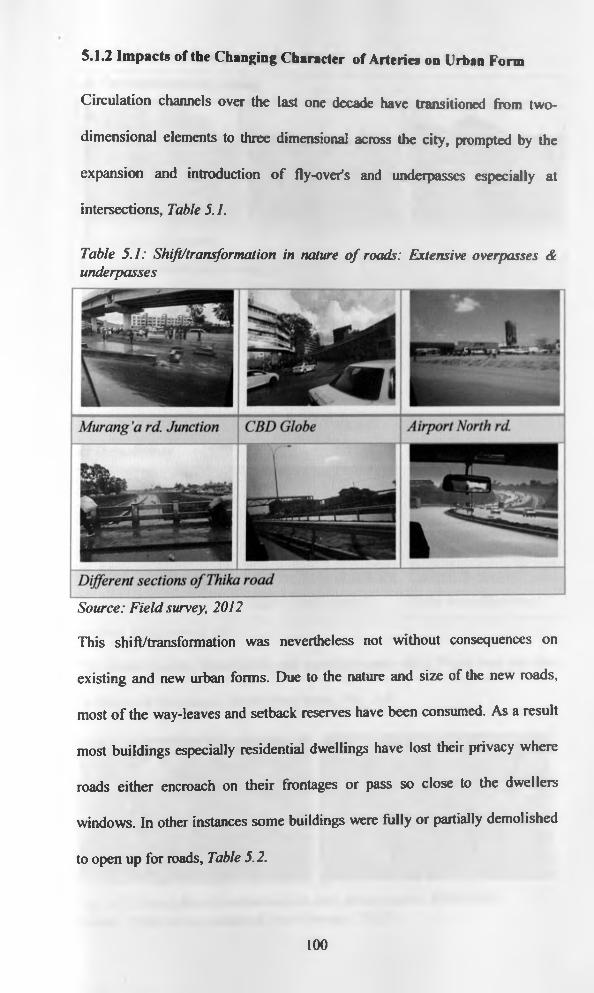
5.1.2 Impacts of the Changing Character of Arteries on Urban Form
Circulation channels over the last one decade have transitioned from two-
dimensional elements to three dimensional across the city, prompted by the
expansion and introduction of fly-over’s and underpasses especially at
intersections, Table 5.1.
Table 5.1: Shift/transformation in nature o f roads: Extensive overpasses & underpasses
Source: Field survey, 2012
This shift/transformation was nevertheless not without consequences on
existing and new urban forms. Due to the nature and size of the new roads,
most o f the way-leaves and setback reserves have been consumed. As a result
most buildings especially residential dwellings have lost their privacy where
roads either encroach on their frontages or pass so close to the dwellers
windows. In other instances some buildings were fully or partially demolished
to open up for roads, Table 5.2.
100
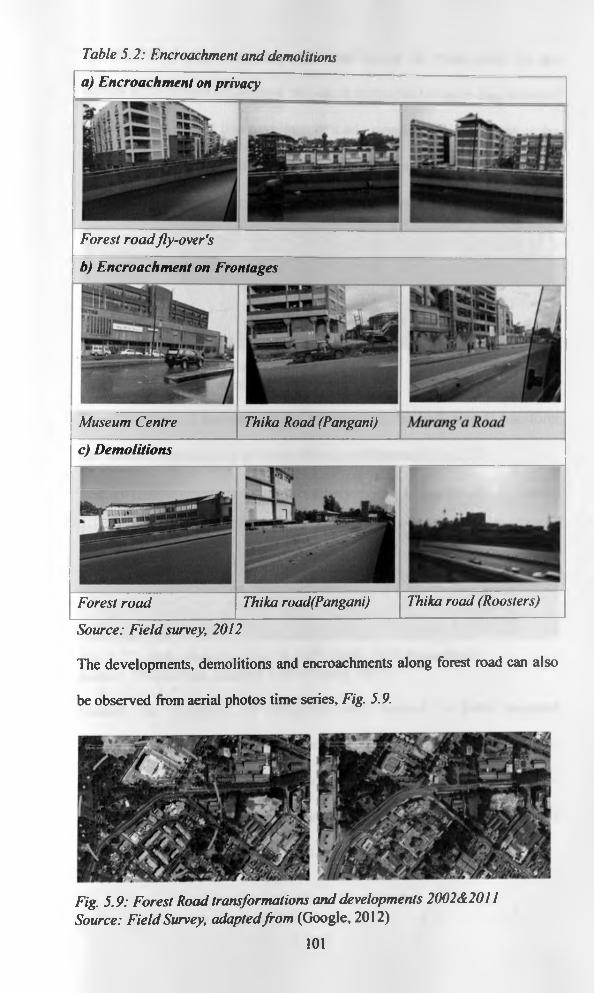
Table 5.2: Encroachment and demolitions
Forest road fly-over's
c) Demolitions
Forest road Thika road(Pangani) Thika road (Roosters)
Source: Field survey, 2012
The developments, demolitions and encroachments along forest road can also
be observed from aerial photos time series, Fig. 5.9.
a) Encroachment on privacy
b) Encroachment on Frontages
Museum Centre Thika Road (Pangani) Murang a Road
Fig. 5.9: Forest Road transformations and developments 2002 &2011 Source: Field Survey, adapted from (Google, 2012)
101
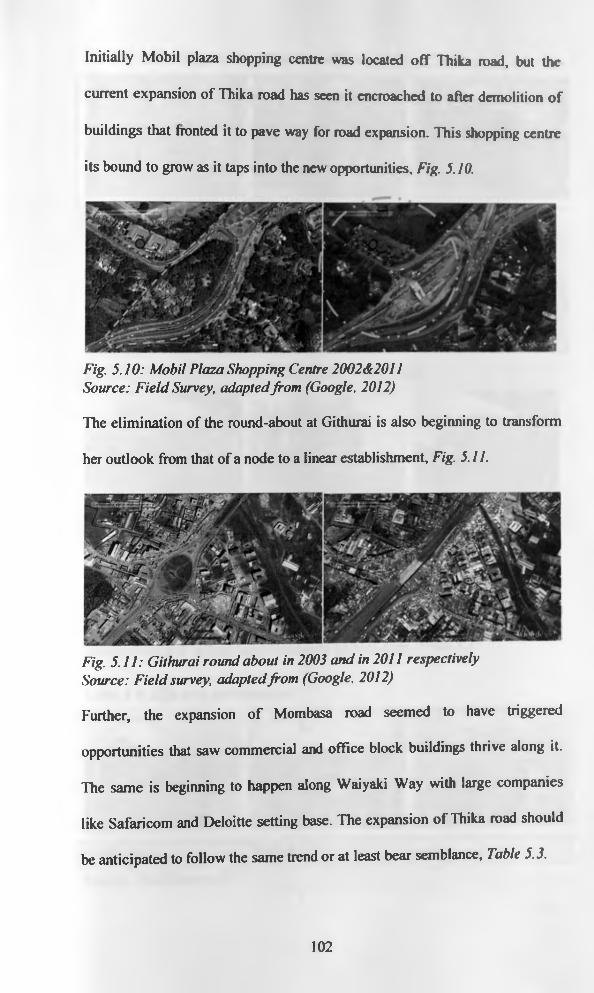
Initially Mobil plaza shopping centre was located off Thika road, but the
current expansion of Thika road has seen it encroached to alter demolition of
buildings that fronted it to pave way for road expansion. This shopping centre
its bound to grow as it taps into the new opportunities. Fig. 5.10.
Fig. 5.10: Mobil Plaza Shopping Centre 2002& 2011 Source: Field Survey, adapted from (Google, 2012)
The elimination of the round-about at Githurai is also beginning to transform
her outlook from that of a node to a linear establishment, Fig. 5.11.
Fig. 5.11: Githurai round about in 2003 and in 2011 respectively Source: Field survey, adapted from (Google, 2012)
Further, the expansion o f Mombasa road seemed to have triggered
opportunities that saw commercial and office block buildings thrive along it.
The same is beginning to happen along Waiyaki Way with large companies
like Safaricom and Deloitte setting base. The expansion of Thika road should
be anticipated to follow the same trend or at least bear semblance, Table 5.3.
102
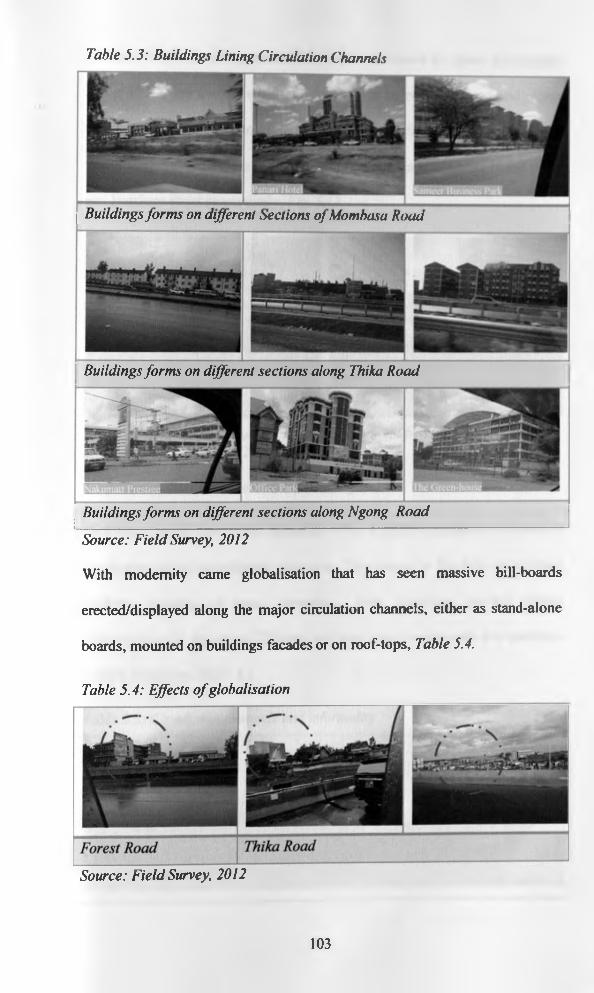
Table 5.3: Buildings Lining Circulation Channels
Buildings forms on different Sections o f Mombasa Road
Buildings forms on different sections along Thika Road
Buildings forms on different sections along Ngong Road
Source: Field Survey, 2012
With modernity came globalisation that has seen massive bill-boards
erected/displayed along the major circulation channels, either as stand-alone
boards, mounted on buildings facades or on roof-tops, Table 5.4.
Table 5.4: Effects o f globalisation
Source: Field Survey, 2012
103
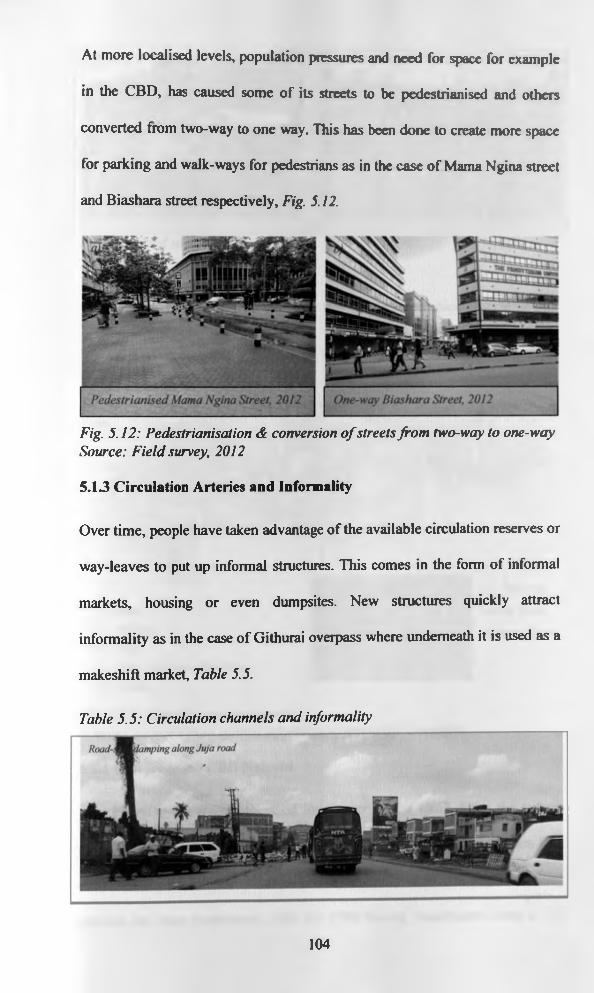
At more localised levels, population pressures and need for space for example
in the CBD, has caused some of its streets to be pedestrianised and others
converted from two-way to one way. This has been done to create more space
for parking and walk-ways for pedestrians as in the case of Mama Ngina street
and Biashara street respectively, Fig. 5.12.
Fig. 5.12: Pedestrianisation & conversion o f streets from two-way to one-way Source: Field survey, 2012
5.13 Circulation Arteries and Informality
Over time, people have taken advantage of the available circulation reserves or
way-leaves to put up informal structures. This comes in the form of informal
markets, housing or even dumpsites. New structures quickly attract
informality as in the case of Githurai overpass where underneath it is used as a
makeshift market, Table 5.5.
Table 5.5: Circulation channels and informality
104
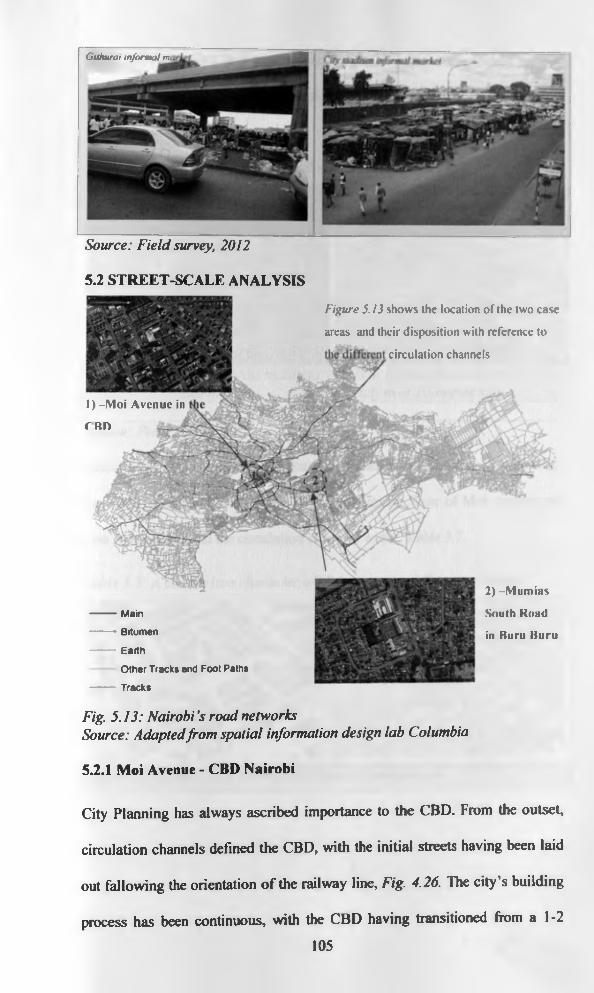
Source: Field survey, 2012
Glihurai inform al me
5.2 STREET-SCALE ANALYSIS
1) -Moi Avenue in ru n
----------- Main
-------- Bitumen
-----------Earth
Other Tracks and Foot Paths
----------Tracks
Figure 5.13 shows the location of the two case areas and their disposition with reference to
circulation channels
2) -Mumias South Road in Buru Buru
Fig. 5.13: Nairobi’s road networksSource: Adapted from spatial information design lab Columbia
5.2.1 Moi Avenue - CBD Nairobi
City Planning has always ascribed importance to the CBD. From the outset,
circulation channels defined the CBD, with the initial streets having been laid
out fallowing the orientation o f the railway line, Fig. 4.26. The city’s building
process has been continuous, with the CBD having transitioned from a 1-2
105
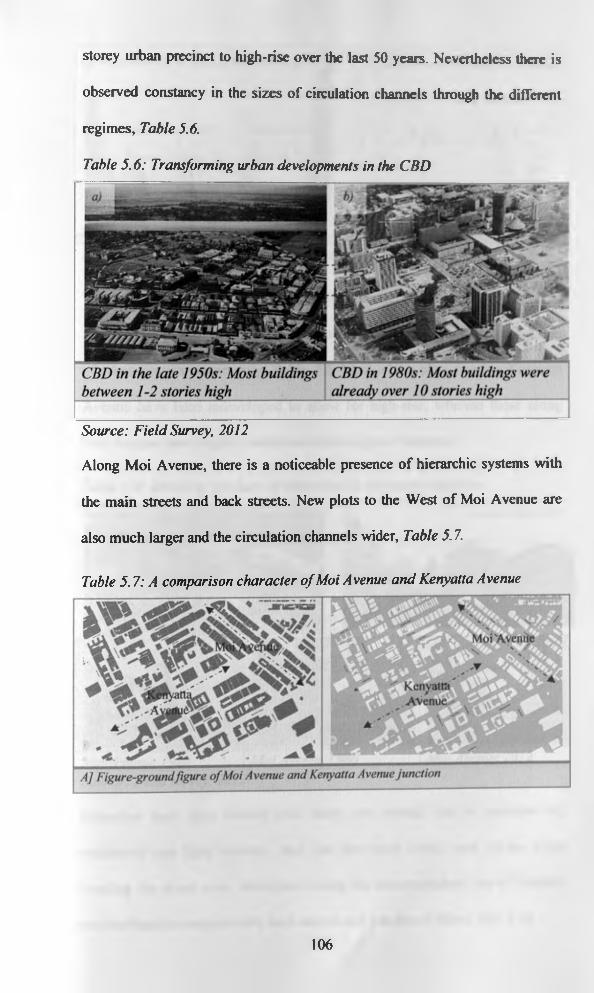
storey urban precinct to high-rise over the last 50 years. Nevertheless there is
observed constancy in the sizes of circulation channels through the different
regimes, Table 5.6.
Table 5.6: Transforming urban developments in the CBD
m
v
*CBD in the late 1950s: Most buildings between 1-2 stories high
CBD in 1980s: Most buildings were already over 10 stories high
Source: Field Survey, 2012
Along Moi Avenue, there is a noticeable presence of hierarchic systems with
the main streets and back streets. New plots to the West of Moi Avenue are
also much larger and the circulation channels wider, Table 5.7.
Table 5 .7: A comparison character o f Moi Avenue and Kenyatta Avenue
106
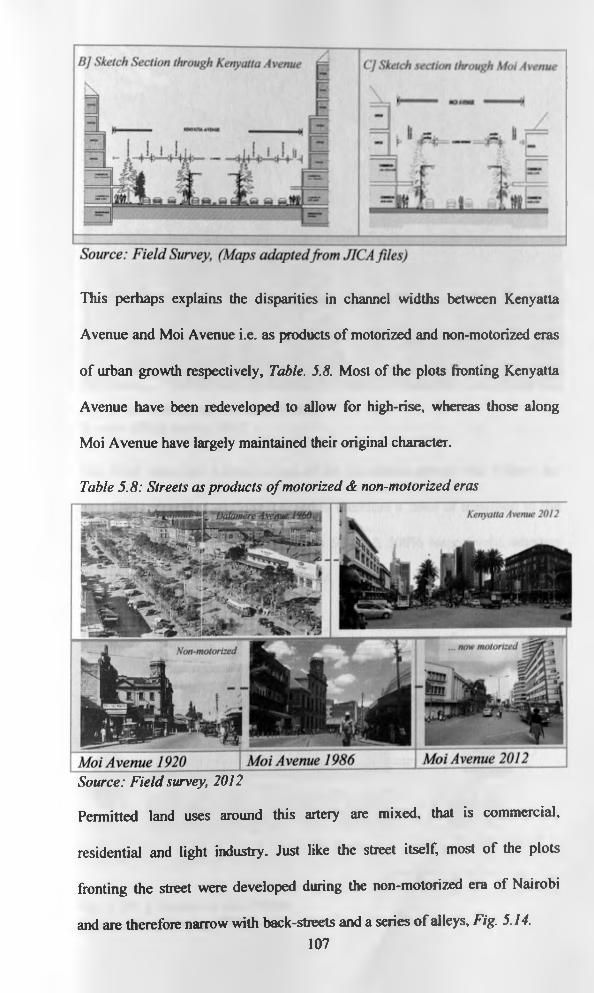
This perhaps explains the disparities in channel widths between Kenyatta
Avenue and Moi Avenue i.e. as products of motorized and non-motorized eras
of urban growth respectively, Table. 5.8. Most of the plots fronting Kenyatta
Avenue have been redeveloped to allow for high-rise, whereas those along
Moi Avenue have largely maintained their original character.
Table 5.8: Streets as products o f motorized & non-motorized eras
Source: Field survey, 2012
Permitted land uses around this artery are mixed, that is commercial,
residential and light industry. Just like the street itself, most of the plots
fronting the street were developed during the non-motorized era of Nairobi
and are therefore narrow with back-streets and a series of alleys, Fig. 5.14.107
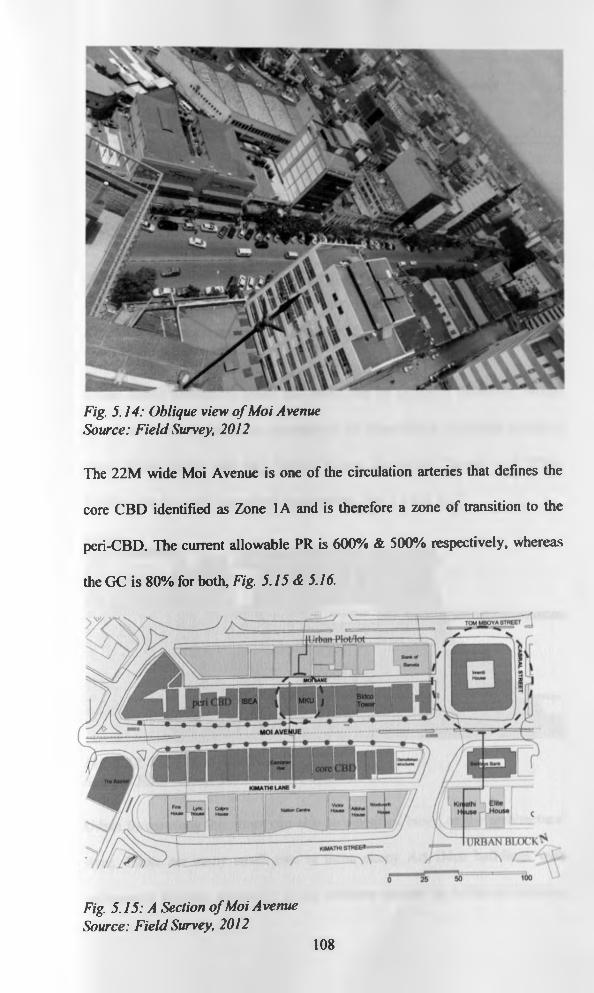
Fig. 5.14: Oblique view o f Moi Avenue Source: Field Survey, 2012
The 22M wide Moi Avenue is one of the circulation arteries that defines the
core CBD identified as Zone 1A and is therefore a zone of transition to the
peri-CBD. The current allowable PR is 600% & 500% respectively, whereas
the GC is 80% for both, Fig. 5.15 & 5.16.
Fig. 5.15: A Section o f Moi Avenue Source: Field Survey, 2012
108
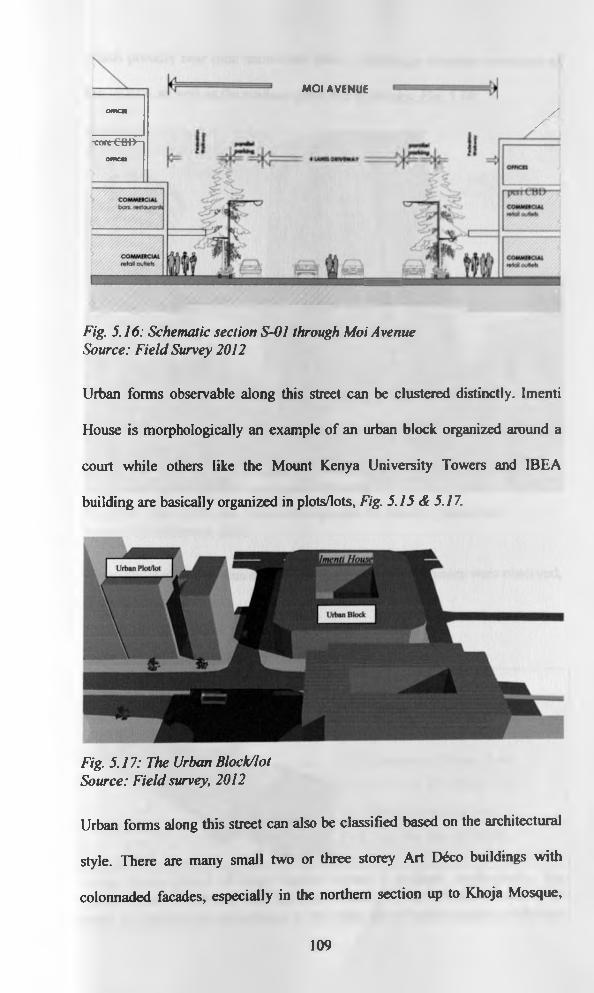
MOI AVENUEom en
core C H I)
omen
//
Fig. 5.16: Schematic section S-01 through Moi Avenue Source: Field Survey 2012
Urban forms observable along this street can be clustered distinctly. Imenti
House is morphologically an example of an urban block organized around a
court while others like the Mount Kenya University Towers and IBEA
building are basically organized in plots/lots, Fig. 5.15 & 5.17.
Fig. 5.17: The Urban Block/lot Source: Field survey, 2012
Urban forms along this street can also be classified based on the architectural
style. There are many small two or three storey Art Dtco buildings with
colonnaded facades, especially in the northern section up to Khoja Mosque,
109
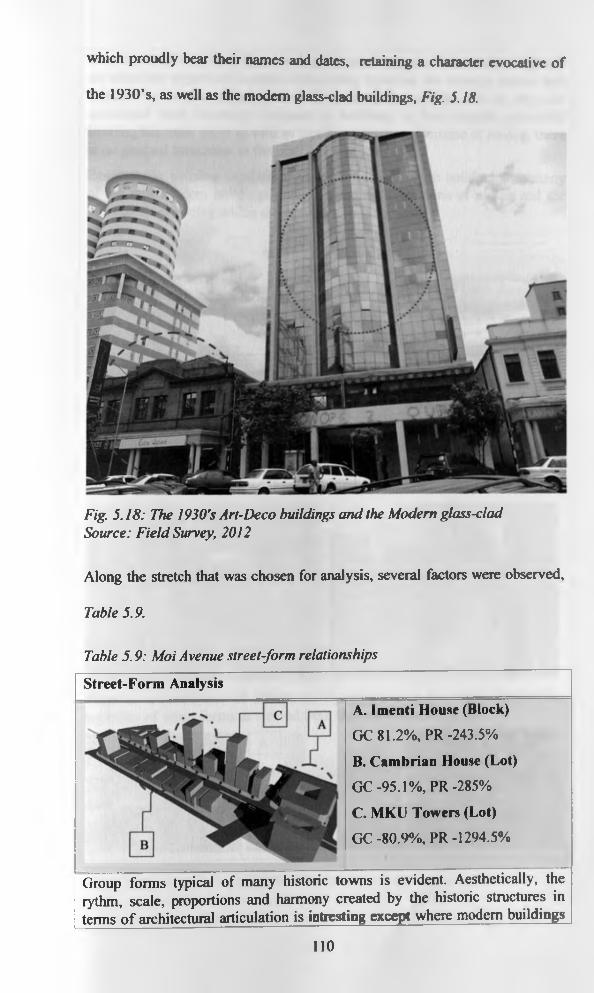
which proudly bear their names and dates, retaining a character evocative of
the 1930’s, as well as the modem glass-clad buildings, Fig. 5.18.
Fig. 5.18: The 1930's Art-Deco buildings and the Modern glass-clad Source: Field Survey, 2012
Along the stretch that was chosen for analysis, several factors were observed,
Table 5.9.
Table 5.9: Moi Avenue street-form relationships
Street-Form Analysis
Group forms typical of many historic towns is evident. Aesthetically, the rythm, scale, proportions and harmony created by the historic structures in terms o f architectural articulation is intresting except where modem buildings
A. Imenti House (Block)
GC 81.2%, PR -243.5%
B. Cambrian House (Lot)
GC -95.1%, PR -285%
C. MKU Towers (Lot)
GC -80.9%, P R -1294.5%
110
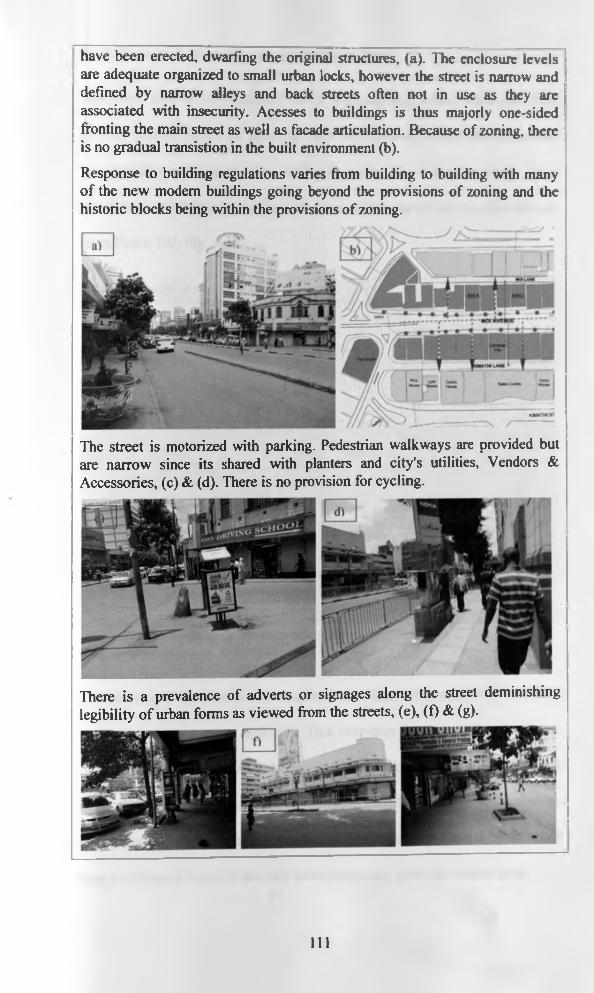
The street is motorized with parking. Pedestrian walkways are provided but are narrow since its shared with planters and city's utilities, Vendors & Accessories, (c) & (d). There is no provision for cycling.
There is a prevalence of adverts or signages along the street deminishing legibility of urban forms as viewed from the streets, (e), (f) & (g).
have been erected, dwarfing the original structures, (a). The enclosure levels are adequate organized to small urban locks, however the street is narrow and defined by narrow alleys and back streets often not in use as they are associated with insecurity. Acesses to buildings is thus majorly one-sided fronting the main street as well as facade articulation. Because of zoning, there is no gradual transistion in the built environment (b).
Response to building regulations varies from building to building with many of the new modem buildings going beyond the provisions of zoning and the historic blocks being within the provisions of zoning.
I l l
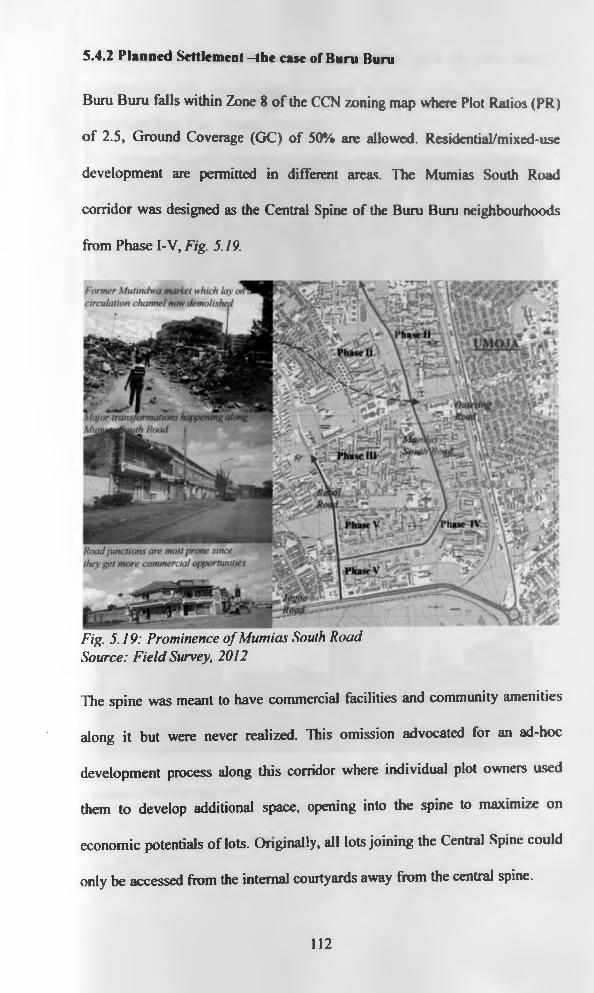
5.4.2 Planned Settlement —the case of Bum Bum
Bum Bum falls within Zone 8 o f the CCN zoning map where Plot Ratios (PR)
o f 2.5, Ground Coverage (GC) of 50% are allowed. Residential/mixed-use
development are permitted in different areas. The Mumias South Road
corridor was designed as the Central Spine of the Bum Bum neighbourhoods
from Phase I-V, Fig. 5.19.
Form er M utindw a market which lay circulation channel now demohshei m»--I ■
\la jo r transform ations happening alongKhummdiauth Road i
Road junctions are most prone since they get m ore com m ercial opportunities
Fig. 5.19: Prominence o f Mumias South Road Source: Field Survey, 2012
The spine was meant to have commercial facilities and community amenities
along it but were never realized. This omission advocated for an ad-hoc
development process along this corridor where individual plot owners used
them to develop additional space, opening into the spine to maximize on
economic potentials of lots. Originally, all lots joining the Central Spine could
only be accessed from the internal courtyards away from the central spine.
112
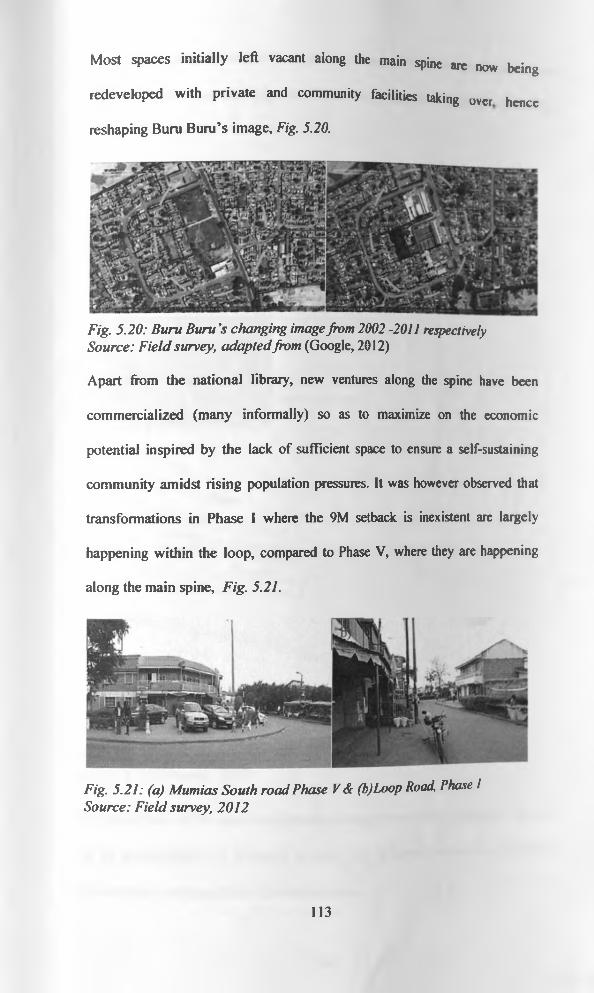
Most spaces initially left vacant along the main spine are now being
redeveloped with private and community facilities taking over hence
reshaping Bum Bum’s image, Fig. 5.20.
Fig. 5.20: Buru Buru’s changing image from 2002 -2011 respectively Source: Field survey, adapted from (Google, 2012)
Apart from the national library, new ventures along the spine have been
commercialized (many informally) so as to maximize on the economic
potential inspired by the lack of sufficient space to ensure a self-sustaining
community amidst rising population pressures. It was however observed that
transformations in Phase I where the 9M setback is inexistent are largely
happening within the loop, compared to Phase V, where they are happening
along the main spine, Fig. 5.21.
Fig. 5.21: (a) Mumias South road Phase V & (b)Loop Road, Phase /Source: Field survey, 2012
113
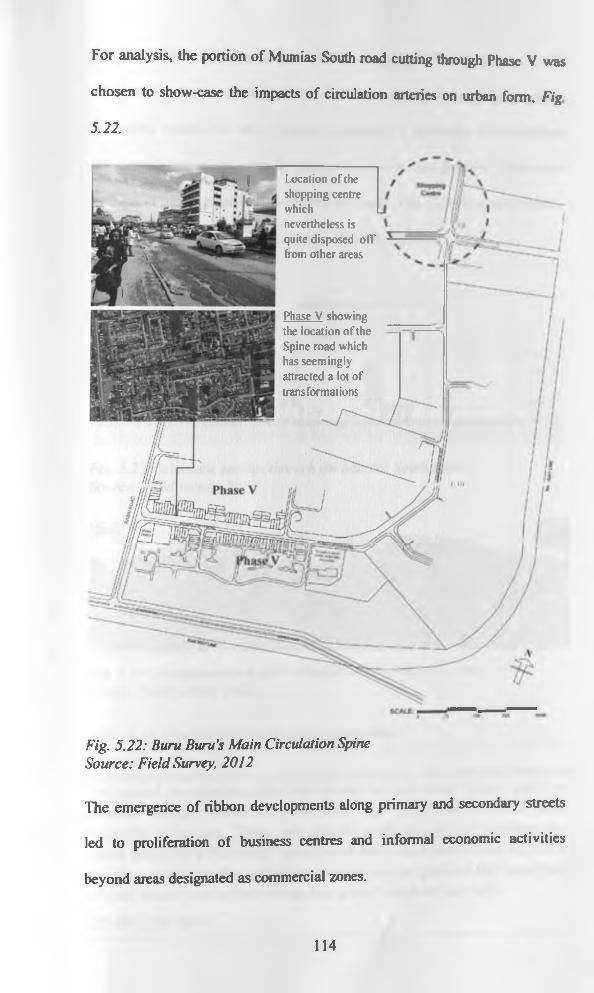
For analysis, the portion of Mumias South road cutting through Phase V was
chosen to show-case the impacts of circulation arteries on urban form. Fig
5.22.
' . ' Location of the shopping centre whichnevertheless is quite disposed off from other areas
Phase V showing the location of the Spine road which has seemingly attracted a lot of transformations
:
Fig. 5.22: Buru Buru’s Main Circulation Spine Source: Field Survey, 2012
The emergence of ribbon developments along primary and secondary streets
led to proliferation of business centres and informal economic activities
beyond areas designated as commercial zones.
114
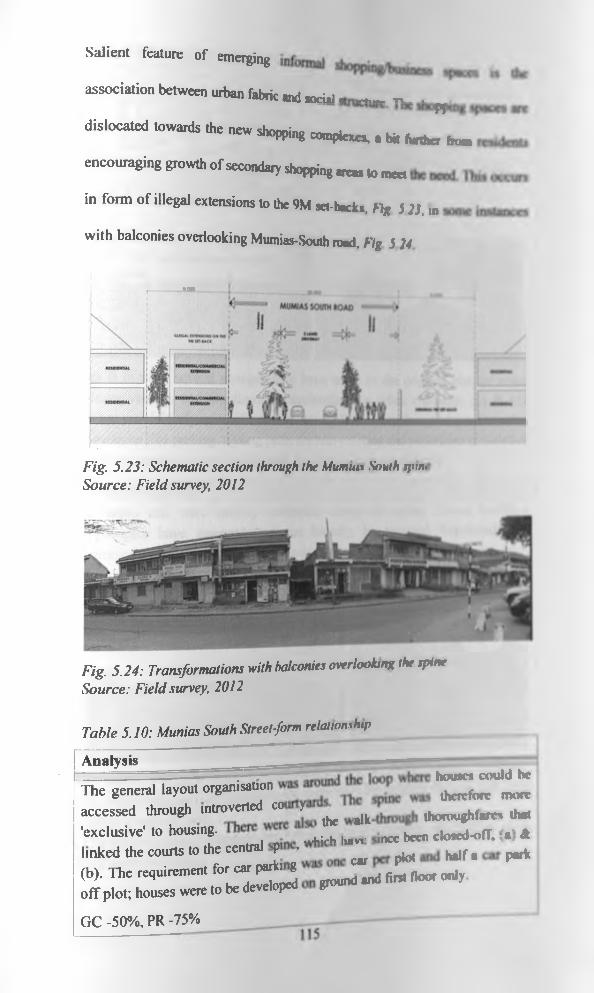
Salient feature of emerging
association between urban fabric and ,^ .1 ----------------- n
dislocated towards the new shoppy co m p te r a bit further frum
encouraging growth of second^ shopping « * » > ■ «
in form of illegal extensions to the 9M set-hacks. h g 5 23. in
with balconies overlooking Mumias-South road, hg 3 24
«IYA
Fig. 5.23: Schematic section through the M um uis South y>m>Source: Field survey, 2012
Fig. 5.24: Transformations with balconies overlooking the splm Source: Field survey, 2012
Table 5.10: Munias South Street form relationship
Analysis
The general layoi^ganisauon 'Z I Z f i laccessed through introverted co y ^ ^ thoroughfare* «l*'exclusive' to housing. ^ luM. irKC been doaed-off. (a) Alinked the courts to the central P • ^ ^ M f , park(b). The requirement for car parkig »nd fint floor onlyoff plot; houses were to be developed ground
GC -50%, PR -75%
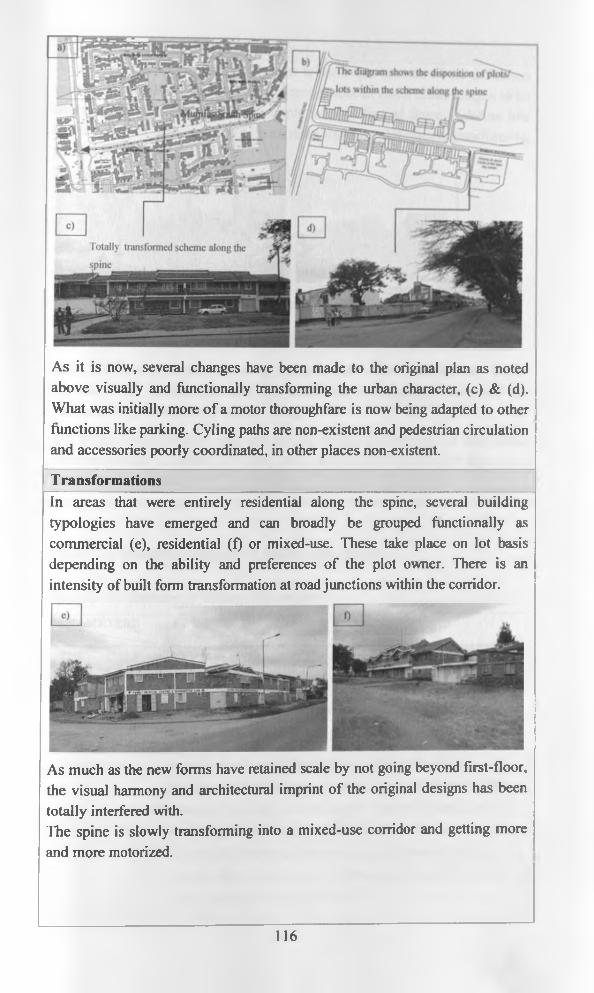
As it is now, several changes have been made to the original plan as noted above visually and functionally transforming the urban character, (c) & (d). What was initially more of a motor thoroughfare is now being adapted to other functions like parking. Cyling paths are non-existent and pedestrian circulation and accessories poorly coordinated, in other places non-existent.
TransformationsIn areas that were entirely residential along the spine, several building typologies have emerged and can broadly be grouped functionally as commercial (e), residential (f) or mixed-use. These take place on lot basis depending on the ability and preferences of the plot owner. There is an intensity of built form transformation at road junctions within the corridor.
As much as the new forms have retained scale by not going beyond first-floor, the visual harmony and architectural imprint of the original designs has been totally interfered with.The spine is slowly transforming into a mixed-use corridor and getting more and more motorized.
116
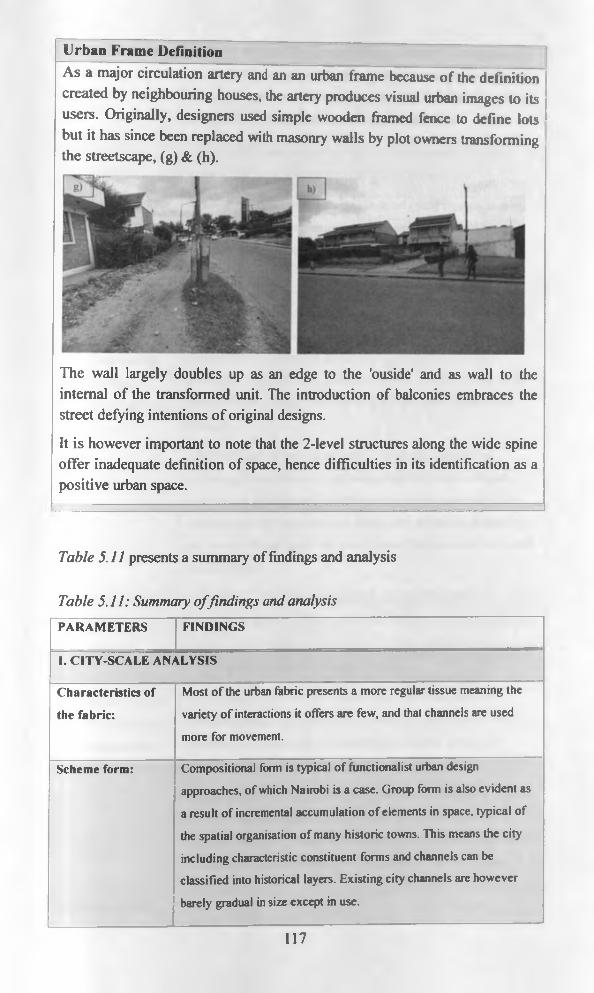
Urban Frame DefinitionAs a major circulation artery and an an urban frame because of the definition created by neighbouring houses, the artery produces visual urban images to its users. Originally, designers used simple wooden framed fence to define lots but it has since been replaced with masonry walls by plot owners transforming the streetscape, (g) & (h).
The wall largely doubles up as an edge to the 'ouside' and as wall to the internal of the transformed unit. The introduction of balconies embraces the street defying intentions of original designs.
It is however important to note that the 2-level structures along the wide spine offer inadequate definition of space, hence difficulties in its identification as a positive urban space.
Table 5.11 presents a summary of findings and analysis
Table 5.11: Summary o f findings and analysis
PARAMETERS FINDINGS
1. CITY-SCALE ANALYSIS
Characteristics of the fabric:
Most of the urban fabric presents a more regular tissue meaning the variety of interactions it offers are few, and that channels are used
more for movement.
Scheme form: Compositional form is typical of functionalist urban design approaches, of which Nairobi is a case. Group form is also evident as a result of incremental accumulation of elements in space, typical of the spatial organisation of many historic towns. This means the city including characteristic constituent forms and channels can be classified into historical layers. Existing city channels are however
barely gradual in size except in use.
117
Channels enclosure levels:
Levels of enclosures vary across the city. As much as high level of
enclosure means spatial definition, narrow channels enhances faster flow. Inadequate levels of enclosure results in difficulties in their perception as positive urban spaces e.g. in Burn Burn
Figure-groundrelationship:
Definition of urban spaces in the city is an intermediary between organic and linear which blurs legibility of space
Spatial hierarchy: There are no clear hierarchies/rank ordered spatial changes in urban form by size, shape or placement with reference to circulation channels meaning depressed legibility.
2. STREET-SCALE ANALYSIS
• Distribution of
channels
• Functionality
• Provision of Urban Services
- Planar distribution channels show the existence of multi-directional and optional spatial order and this is particularly evident in Moi Avenue. This organization favours rich pedestrian movements associated with shopping/commerce which it serves. The size of the street however impairs its accessorization and provision of urban
services
-Mumias South Spine is more linear hence more monotonous, enforcing and insistent since all loops often lead back to the axis. Commercial activities are thus attracted to the axis and more at its intersections with loop channels. Inadequacy of functional diversity and visual richness makes the perception of this axis continuity much
more difficult.
• Orientations and angles of paths:
-Circulation channels are oriented mainly for vehicular traffic. Pedestrian flow in the study areas are impaired via vehicular traffic arrangements. Except for abundance of path intersections along Moi
Avenue paths are generally linear.
• Characteristics of urban blocks
• Imageability:
-Small urban blocks and mix of activities identified along Moi Avenue typologically allow maximization for commercial benefit by generating more street life. Failure by legislation to protect the historic core is slowly causing loss of visual harmony.
-Loop sizes in Burn Burn cannot be appreciated individually because of access and organization. The introduction of commerce along Mumias-South road creates and enhances social attributes lacking in originally vehicular oriented axis. Imageability is however poor.
Source: Author
118
CHAPTER SIX: CONCLUSIONS &
RECOMMENDATIONSCHAPTER OUTLINE:
6.1 Conclusions6.2 Recommendations Areas for further research
6.1 CONCLUSIONS
Nairobi’s current profile of urbanization has been shaped by a multiplicity of
historical/contemporary and functionalist influences within a vibrant capital
system giving it the characteristic group and compositional form as argued by
(Birol, 2004), and as such there is no one way to determine its overall form.
The character o f her constituent parts have varied considerably and are still in
the process of change and readjustment according to the level of prevailing
social segregation, legal interventions and the geographical imprints. Even
though the circulation channels and green-space network are still present in
the city, their function, nature and intensity of use continues to change through
either formal or ‘informal urbanization’, or both. This study was guided by
three main objectives:
The first objective was to investigate if there are any design-based urban
planning strategies considered in the determination of the nature and location
o f circulation channels. As pertains determination of the nature of circulation
arteries, it emerged that the design of the circulation arteries is governed b\
different standards implemented by different state agencies causing them to
lack clear and inclusive design objectives. These agencies largely targets
119
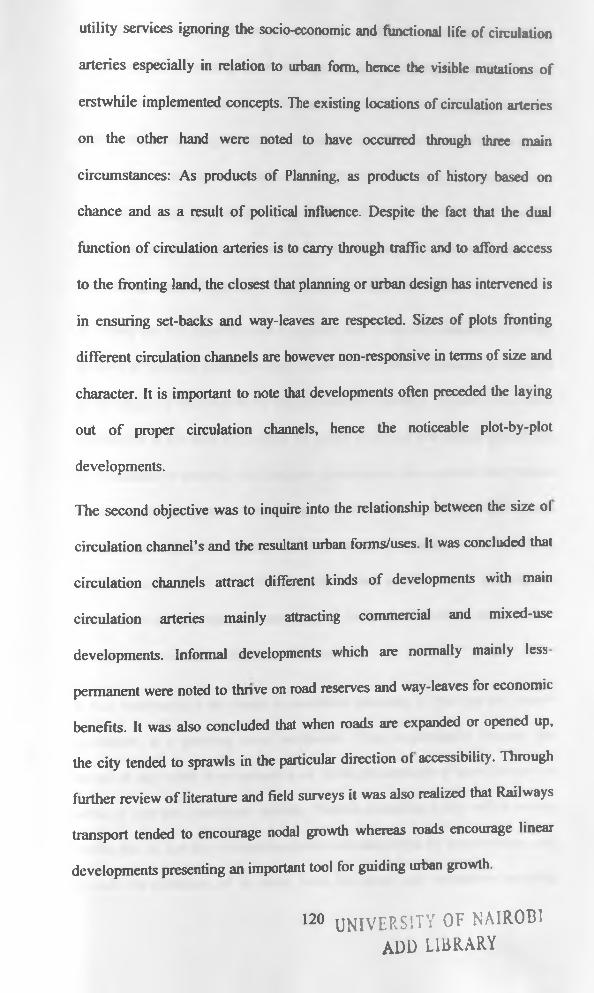
utility services ignoring the socio-economic and functional life of circulation
arteries especially in relation to urban form, hence the visible mutations of
erstwhile implemented concepts. The existing locations of circulation arteries
on the other hand were noted to have occurred through three main
circumstances: As products of Planning, as products of history based on
chance and as a result o f political influence. Despite the fact that the dual
function of circulation arteries is to carry through traffic and to afford access
to the fronting land, the closest that planning or urban design has intervened is
in ensuring set-backs and way-leaves are respected. Sizes of plots fronting
different circulation channels are however non-responsive in terms of size and
character. It is important to note that developments often preceded the laying
out o f proper circulation channels, hence the noticeable plot-by-plot
developments.
The second objective was to inquire into the relationship between the size ol
circulation channel’s and the resultant urban forms/uses. It was concluded that
circulation channels attract different kinds of developments with main
circulation arteries mainly attracting commercial and mixed-use
developments. Informal developments which are normally mainly less-
permanent were noted to thrive on road reserves and way-leaves for economic
benefits. It was also concluded that when roads are expanded or opened up,
the city tended to sprawls in the particular direction ol accessibility. Through
further review of literature and field surveys it was also realized that Railways
transport tended to encourage nodal growth whereas roads encourage linear
developments presenting an important tool for guiding urban growth.
120 UNIVERSITY OF NAIROBI ADD LIBRARY
At street-level, transformations related to commerce were noted to begin
along circulation arteries where their use-capacities had changed as in the case
of ribbon developments along Mumias South Road, in which case it would
seem prudent to suggest options of design typologies that allow for small
enterprises to evolve along the corridor. This would make it more inclusive
and commercial in outlook. Large bill-boards were also found at strategic
points along arteries including on the crest of major buildings, continually
concealing or redefining Architectural and planning ensembles.
The third and last objective was to explore how circulation channels have/may
be used to structure urban precincts. From the different references and findings
of the study, it was concluded that circulation Channels, especially the main
arterials as in the case o f Curitiba are prime locations that present significant
opportunities to intensify and enhance development in a manner that creates
attractive pedestrian environments; contribute to vibrant neighbourhoods; and
create transit-friendly places. This is because transportation planning
emphasizes the need of sound physical layout considering it the primary
determinant of subsequent commitment of land, administration, maintenance
as well as the overall performance of schemes.
It was observed that the desire to coordinate planning of land-use and transit
investment is a growing trend world-over. This is principally because the
layout o f any urban development is an initial determinant of its efficiency in
terms o f cost and functional viability. Nairobi embodies a city with a strong
centre, that is, her key circulation arteries emanate from its dense centre, and
as such the evolution o f its urban form has been path dependent meaning
121
circulation arteries can be used to structure i t However, despite all this
relationships, urban forms have been guided by the general zoning regulations
which do not factor in the size of circulation channels connecting zones to the
overall systems. Geddes argues that towns must cease to spread like expanding
ink-stains and grease spots, but must grow botanically like green leaves set in
alternation with its golden rays. Geddes thus advocates for external forces to
check on sprawl and channels to encourage growth, Fig. 6.1.
Fig. 6.1: Managing sprawl Source: Author
It is also observed that commercial developments coupled with wider channels
often drive buildings up and the height zoning must therefore be sufficiently
generous to permit vertical expansion. High buildings permit land to be used
to the maximum capacity and their size ensures that their architectural quality
is attended to and modem services included. Kenyan built-environment
standards however, have remained Eurocentric with little appreciation of local
contexts.
40 K ilo m ttrn
30 K ilom rtm\attw4n Bmir4hi l « ’
m> -mi
IS M ln m rfm
IMJ
122
6.2 RECOMMENDATIONS
Spaces are products o f planning and designing that reflect functional,
symbolic and aesthetic considerations and as such can be changed both by
modifications to its structures and/or to its activities. Current planning
decisions should involve trade-offs between mobility and accessibility. This
study thus makes the following recommendations in an attempt to ensure that
urban forms are safeguarded, and more so, that the relationships of urban
forms and the circulation channels are enhanced.
6.2.1 Mandate
To avoid multiplicity of functions and creation of bureaucratic procedures as a
result of having too many bodies undertaking roles in the city’s built
environment, there is need to have one city authority with a clear development
control framework to coordinate all functions related to the built environment,
including its budget. This will ensure wholesome growth regulated in the best
interest of the present and the future.
6.2.2 Planning Strategies and Implementation
It is unlikely to deal effectively with issues pertaining to the relationship of
urban forms and circulation arteries without a comprehensive plan. Ibc
Master Plan however should only be a catalyst for further intervention, fhis
thesis proposes a move away from the concept of centrality proposed by the
previous master plans and instead focus on structured plans and sectorial
urban design. It should be noted that circulation channels constitutes the core
of the urban fabric and should be given the emphasis it deserves. flic strong
by traffic, and their relationship to 123
flows and access
residential/office/commercial developments indicate need for arterial oriented
developments in terms o f density and mix of uses. The implications of higher
density development along main circulation arteries include:
• infill development in existing neighbourhoods;
• increased viability of public transit;
• more efficient provision of utilities;
Plots fronting the main channels should also be larger and supported with
incentives/bonuses that ensures rewarding of persons who contribute highly to
the enhancement of the built environments.
Urban design guidelines for development along circulation channels especially
main arterials which can be organized into among others: Streetscapes, Built
Form, Landscape and Environment, Signage (combined with building facades
to minimize free-standing signs), Servicing and Utilities should be constituted.
This should also aid the design of street sections with a ratio of building height
to road corridor width factored in to create a transition in the scale and density
of the built forms. When undertaken, this should allow higher density zoning
along wide channels to be adopted simultaneously with arterial planning, / ig.
6.2.
124

Fig. 6.2: Avenues fo r path-related developments at city-scale level Source: Author, 2012
Mix o f activities should therefore be encouraged supported by contextual/
situational strategic plans that forecasts about 50 years, and which focuses on
paths o f least destruction o f investment. Using serviced land efficiently help
create more compact urban forms and revitalised commercial corridors which
act as catalysts for private investment and development. Since the urban
environment is dynamic, comprehensive spatial inventory should be
undertaken on a regular basis, followed by necessary review building
regulations and development plans.
Table 6.1: Summary o f objectives, findings and recommendations
OBJECTIVE FINDINGS RECOMMENDATION
1. To investigate if
there are any
design-based
urban planning
strategies
considered in the
determination of
Design of built-forms & circulation
channels fall in the domain of different
authorities.
Developments have always generally
preceded the laying out of circulation
channels, with noticeable plot-by-plot
City responsibilities should fall
under the jurisdiction of one
authority for coordination.
There is need to tie-up arterial
planning with localized strategic
plans.
125

the nature and
location of
circulation
channels
developments.
Location of circulation channels arc cither
historical, based on chance or politically
instigated
Sizes of plots fronting the main
circulation channels are non-responsive
and are like any other in terms of size
The urban environment is
dynamic, building regulations
and development plans need to
be reviewed and updated more
frequently.
2. To inquire into
the relationship
between the size
of Circulation
Channel’s and
the resultant
urban forms/uses
Different types of circulation channels
attract different kinds of developments
i.e. main arterials attract commercial
developments.
Railways are noted to encourage nodal
growth whereas roads encourage linear
developments
When roads are expanded or opened up,
the city sprawls due to reduced travel
hours
Informal developments which are
normally temporary or permanent in
nature thrive on road reserves and way-
leaves for economic benefits.
There is need to constitute urban
design guidelines for
development along circulation
channels especially main
arterials.
Mix of activities should be
encouraged supported by
contextual/situational strategic
plans that forecasts about 30
years and focused on paths of
least destruction of investment.
Form which is more permanent
should be given preference over
function
3. To establish how
circulation
channels may be
used to structure
urban precincts.
Planning should emphasize the need for sound physical layout because it is
the primary determinant of subsequent commitment of land, administration,
maintenance as well as the overall performance of schemes.
Circulation Channels, are prime locations that present significant
opportunities to intensify and enhance development in a manner that creates
attractive pedestrian environments; contribute to vibrant neighbourhoods; and
create transit-friendly places.
By allowing it to act as an urban edge and articulating, possibilities for
morphological transformations can happen in a more harmonious way
Urban design guidelines for development along circulation channels
especially main arterials organized into among others: Strectscapcs and
Built-Form, with a ratio of building height to road corridor width factored
should be constituted.
Source: Author
126
AREAS FOR FURTHER RESEARCH
This study has been on the impact of circulation arteries on the urban form.
However, the spaces that lie between buildings even though they are the most
important elements of the city do not exist in a vacuum but are created by the
built fabric as recounted by Jan Gehl. This they do by creating physical and
psychological boundaries which in essence define edges of open spaces,
resulting in definition of spaces in the form of streets, side-walks, alleys and
urban parks. The relationship of the city’s built forms and the spaces which
they create thus becomes virtually important as part of a continuous dynamic
process in terms of the quality of enclosures they create, Fig.6.3. To tap
wholesomely into the mutual built-forms arterial relationship, this thesis
recommends a further research on the counter impacts of urban form on
circulation arteries.
Fig. 6.3: Glare emanating from building's facadeSource: Field survey, 2012 -KEMU Towers glare in CBD Nairobi creating discomfort to pedestrian using side walks
127
BIBLIOGRAPHY
Adam, A. H. (2008). THE INFLUENCE OF CULTURE ON URBAN FORM:
The Case O f The Somali In Eastleigh. Nairobi: B. Arch, thesis (Unpublished).
Anyamba, T. J. (2006). Diverse Informalities: Spatial Transformations in
Nairobi, a Study o f Nairobi Urban Process. PhD Thesis. Oslo, Norway:
Unpublished.
Ayonga, J. N. (2010). Variations in Policies on Urban-RuralRelationd and the
Evolution of Different Patterns of Urban Sprawl in World Cities. The Africa
Habitat Review Journal, 336-346.
Bently, L, McGlynn, S., & Graham, S. (1985). Responsive Environments.
Routledge.
B ird, G. (2004). An Alternative approach for analysis o f Traditional
Shopping Spaces: A Case o f Balikesir. Balikesir: Unpublished.
Burton, E., & Mitchell, L. (2006). Inclusive Urban Design: Streets for Life.
Burlington MA: Architectural Press, an imprint of Elsevier Ltd.
CCN. A Guide o f Nairobi City Development Ordinances and Zones. Nairobi:
CCN -Planning Department.
CCN. (2004). A guide o f Nairobi City Development Ordinances and Zones.
Nairobi: CCN, Department of City Planning.
Cervero, R. (1995). Creating a Linear City with a Surface Metro. Berkeley.
Emig, S., & Ismail, Z. (1980). Notes on Urban Planning o f Nairobi. Royal
Academy o f Fine Arts, School of Architecture, Copenhagen: Unpublished.
Friberg, L. (2000). Innovative Solutions for Public Transport; Curitiba, Brazil.
Uppsala, Sweden: Uppsala University.
Gattoni, G., & Patel, P. (May 1973). Residential Land Utilization: Case Study
-Nairobi, Kenya. Cambridge, MA: MIT.
GoK. (2010). 2009 Population & Housing Census Results. Nairobi: GoK.
GoK. (1997). Building Code. Nairobi: Government Printer -Nairobi.
128
GoK. (2008). Nairobi Metro 2030: A World Class African Metropolis.
Nairobi: GoK.
Google. (2012). Google Maps - 02072. Retrieved February 14,2012, from
http://maps.google.co.ke/maps/place?ftid=Ox 182fl 172d84d49a7:0xf7cfl)254b
297924c&q=NAIROBI&hl=en&gl=ke&ved=0CAwQ-
gswAA&sa=X&ei=dAo6T5_dAd06 AbCwJOz
Hall, P. (2002). Cities o f Tomorrow (3rd Edition). MA, USA: Blackwell
Publishing.
Hillier, B., & Tim, S. (2010). SPACE SYNTAX -STRATEGIC URBAN
DESIGN. City Planning Review | Issue 285 (City Planning Institute o f Japan)
, Special Issue -Future of Urban Space and Humanity.
Hillier, B., Hanson, J., & Peponis, J. (1987). Syntactic Analysis of
Settlements. Architecture & Comfort/Architectural Bahaviour, 217-231.
Hirst, T., & Lamba, D. (1994). The Struggle for Nairobi. Nairobi: Mazingira
Institute.
Imrie, R., & Street, E. (2011). Architectural Design and Regulation. West
Sussex: Wiley-Blackwell.
Jacobs, J. (1961). The Death and Life o f Great American Cities. New York:
Random House.
Karanja, I. W., & Makau, J. (1998). An Inventory o f the Slums in Nairobi.
Nairobi (Pamoja Trust): Matrix Consultants.
Keitany, J. (2006). Towards New Urbanism: Influence o f Street scapes on
Behaviour o f Users. Nairobi: Unpublished Undergraduate Architectural
Thesis.
Kimani, M., & Musungu, T. (2010). Reforming and Restructuring the
Planning and Building Laws and Regulations in Kenya for Sustainable
Development. 46th ISOCARP Congress 2010. Nairobi: Unpublished.
129
Kinuthia, H. M. (2011). CIVIC BUILDINGS EXTERIOR TRANSITION
SPACES: A STUDY OF CITY SQUARE, NAIROBI. Nairobi: Unpublished
(Post-graduate Thesis).
KIPPRA. (2006). Organizing Urban Road Public Transport in Nairobi City.
Nairobi: Unpublished Policy Brief No. 18/2006.
Krier, R. (1979). Urban Space. London: Academy Editions.
Lang, J. (2005). URBAN DESIGN: A TYPOLOGY OF PROCEDURES AND
PRODUCTS. Burlington, MA: Architectural Press.
Loki, E. D. (2009). PASSIVE AND LOW ENERGY BUILDING DESIGN.
Nairobi: Unpublished (Undergraduate Thesis).
Lynch, K. (1984). Good City Form. Cambridge MA: MIT Press.
Lynch, K. (1960). Image o f the City. Cambridge MA: MIT Press.
Media, S. (2011). Road Network Classification. Retrieved 10 27,2011, from
Kenya Roads Board website: http://www.krb.go.ke/index.php/classification
Mitullah, W. (2003). Nairobi Habitat Report. Nairobi.
Moneo, R. (1978). On Typology Oppositions pp. 23-45. Massachusetts: MIT
Press.
Morgan, W. (1967). Nairobi City and Region. Nairobi, London, New York:
Oxford University Press.
Moss, R. (. (1999). Nairobi A to Z; A Complete Guide (4th Edition).
Nairobi.Kampala.Dar es Salaam: Kenway Publications.
Moughtin, C. (2003). URBAN DESIGN: STREET AND SQUARE. Burlington,
MA: Architectural Pres.
Mugenda, O. M., & Mugenda, A. G. (2002). Research Methods: Quantitative
and Qualitative Approaches. Nairobi: Acts Press.
Mwaura, A. M. (2006). Policy Review fo r Zones 3, 4 and 5, Nairobi, Kenya.
Nairobi: Unpublished 42nd ISOCARP Congress Material.
130
Myers, G. A. (2003). Verandahs o f Power: Colonialism and Space in Urban
Africa. Syracuse, New York: Syracuse University Press.
Obateru, R. I. (2008). Planning Super Cities on Community Basis. ITPI
JOURNAL (www.itpi.org.in) , 1-5.
Olima, W. H. (2001). The Dynamics and Implications o f Sustaining Urban
Spatial Segregation in Kenya: Experiences from Nairobi Metropolis. Nairobi:
Lincoln Institute o f Land Policy Conference Paper (Unpublished).
Peponis, J. (. (2002). Space Syntax. Implications (Vol. 04, Issue 12) .
Rabinovitch, J. (1996). Innovative Land Use and Transport Policy, The Case
o f Curitiba (Land Use Policy). (Unpublished).
Rodrigue, J.-P. (. (2011). THE GEOGRAPHY OF TRANSPORT SYSTEMS.
Retrieved November 4,2011, from
http://people.hofstra.edu/geotrans/index.html
Rossi, A. (1984). The Architecture o f the City (Translation o f L architettura
della citta ). Massachusetts and London, UK: Oppositions Book, The MI I
Press.
Sheuya, S. (2004). Housing Transformations and Urban Livelihoods in
Informal Settlements; The Case o f Dar es Salaam, Tanzania (PHD Thesis).
Dortmund, Germany: SPRING Centtre, University of Dortmund.
Thornton White, L., Siberman, L., & Anderson, P. (1948). Nairobi Master
Plan fo r a Colonial Capital: Report Prepared for Nairobi City C ouncil.
London: His Majesty Stationery Office.
Tibaijuka, A. (2007). Nairobi City Development Strategy.Top Priority for 21st
Century Future o f the Kenyan Capital. Nairobi: United Nations Lnvironmental
Program.
Tiwari, R. (1981). The Origin, Growth and Functional Structure of the CBD of
Nairobi. In R. Obudho, Urbanization and Development Planning in Kenya
(pp. 123-146). Nairobi: Kenya Literature Bureau.
Top9u, M. (2012). Historical Evolution of the Built Form. Eighth
International Space Syntax Symposium, (kur. 8251:1-8251:16). Santiago.131

TOPC^U, M. (2012). Historical Evolution of the Built Form. Eighth
International Space Syntax Symposium, (kur. 8251:1 -8251:16). Santiago.
Trancik, R. (1986). Finding the Lost Space. New York.
Wakori, P. M., Davey, N., & Robin, M. (2008). Road Network Classification
Study (Unclassified Road Networks). Nairobi.
Walters, D. (2007). Designing Community: Charrettes, Master Plans and
Form-Based Codes. Oxford, UK: Elsevier Ltd.
Wheeler, N. (h.t.). 151 Sustainable City Management - Case Study o f Curitiba,
Brazil's Ecological capital. Imenukuliwa May 31,2011 kutoka Geo l actsheet:
www.curriculumpress.co.uk
Wikimedia. (2011, November 11). Wikipedia. Retrieved November 12,2011,
from Scramble for Africa: http://en.wikipedia.org/wiki/Partition_(politics)
Yin, R. K. (2002). CASE-STUDY RESEARCH: Design and Methods.
California-New Delhi-UK: SAGE Publications.
132
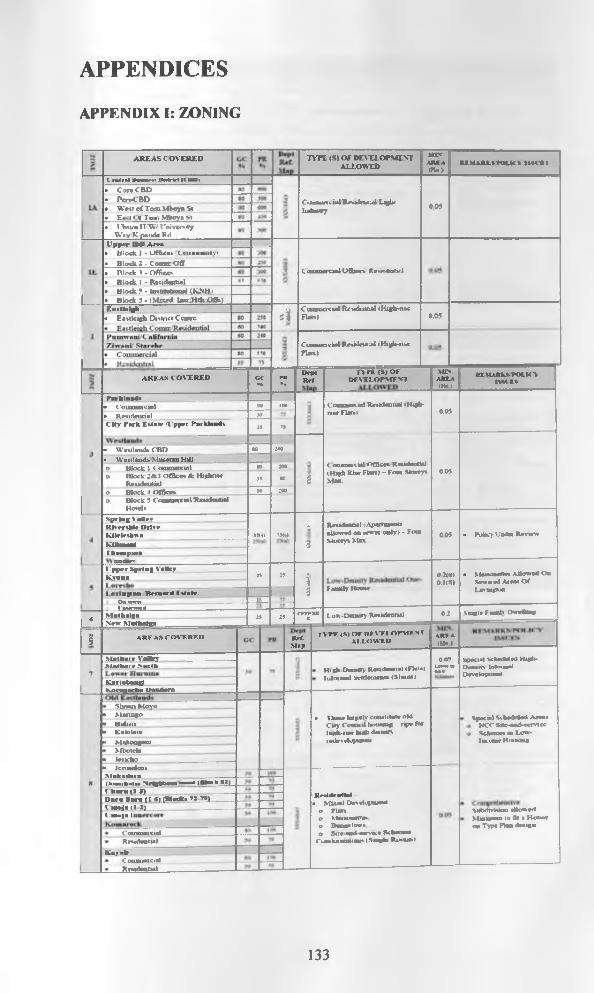
APPENDICES
APPENDIX I: ZONING
AREAS C OVERED
l olral 11— wi IMlW (l HUlCote CBD Pcn-CBDW « < c f T o o l M boya S( E« t < >1 Tod, M boya Stt Th i in i 1 W U n iv e rs ity
Way K paiwle Rtl_______
T1TE (S) OF DEVELOPMENT ALLOWED
C < iu iin ii> l R csalniL al Liglii Industry
MPUfa(H -)
0 05
u t u u i r o u n t w i t
U p p e r H ill A r «B lock 1 - O ffice! ■( < itunui.it'. ■
B lock 2 - C om m O ff
i _
n in c k 1 - Office*B lo ck I - R esidentialB lo ck 5 - institutional (K N H tB lock 5 - (M uted h n c H th O f is )
Comm erciel Offices Kesiceuii/1
E a s tle ig hEastleigh District Ccatrc f t
Com m ercial Residential t H igh-fisc Flats) 0.05
C u u a u n c ia l R rsidcsaial (K igh-riw Flats)
I
A R E A S C O V E R E D GC•»
PR••
DeptRef.
r \ r t <s> o rD EV E L O PM E N T
MTVARIA(Hat
U \lA J tk 9 V O L K Ym w
P a ik l a .d c• Com m ercial 50 100 Commercial Residculial ( High-
0.05• R esitlen ti.l 95 rise Flatst
C H r P a rk E s ta te /U pper P a rk la a d s 95 79
e W estlaialc CBD 80 1*0
• W estlnuds M useum H ill( oilmen s u l O ffices Ressdenlial (H igh Rise Flats) - Font Storeys Max.
o B lock 1 C onunetcuil •0 :oo0 0 5o B lock 2<fc3 Offices & H igbnse
R esidential95 90 3
o B lock -1 O flices 80 :o©o B lock 5 C om m ercial Residential
HotelsS p r in g V aliev
Residential i .Apartments allow ed on sewer only) - Font Storeys Max
KIs e rsk te D rls e 9K ile lesh isa >v»l *5UI 0 0 5 • Policy L’nrtai ReviewK JH m aal 3Thompson
U p p e r S p rin g Valleyo k a ) • N U ito o m ^ A lkm #d O n
SfW finl A i m O fK v u n a 29 29 5?3 Fam ily Hom e
O I(S)1 a s in g te n 'B e rn a rd E sta te Las-ington
Q a m w _________________ —------------ >•-J___ra w rw K ------------------------------------ ---------M a th alga N ew M n th a is a
29 25 CP TPX
XX Low-Density Residential 0T Single f inals Dwelling
1_6I ARE AS rOVFRFD Ref.
Map
n r r <s) o r d h t i orstr n tAIAOWTD ARf A(H»>
M a tb a ie V alleyM a t l u i r .N o rth
K a rlo b a u g l R o ro flo ch e P a n d o ra
High Density Residential (F lan) Informal Settlements (S h am )
0 0* Lem m s a t
special Scheduled High- Pam irs Informal D ese logmen!
• S b a n r i M q jro> __M a n a g e ______> Brtll.111• K aloleiu> Makoogeua> M botcla> Jrik'bo• Jcniwilcni M a k a ila ia Ik .m ih n lm N elght
• These laipelv conatifnSe old C ity Connell hom ing igte foe lu l ti -m r hi ah dm m rs ICll»vlu|AU>UI
Special Scherhiled A reas a NCC sa c -e n d -sc m c c 3 S ehnnrs as Low -
Income H xw um
I tRlork a2)l b a m 113)D a rn D a rn (1-6) (W eeks 72 79) l i m i j a (1 2) l m o ) . I
Cotw neicialResidential
R esiden tia l -• M iam i DesH opiueia
o Flatso Maisonettes o Bnnaelosvs o S ite en d-eerssee Schem es
Col* totuum am (Single Rcanm)
snhrttvtslon iB ow ed M inmitan to fit n H ouee on Type Plan desian
K m s oh*■ C o tu n e tc ia l
Rcsidennaj
133

A R H A S C O V I .K I .D
Main ArrmP i K t o f l a d t U i M Z w
K »i to b a n g t I t M u t h a r e N o r th L f l a d m l r t U
k a i l o b M d L t lo < t« \ti to l
IkptR r f i r r t i s ) o f u r .v r x u r M E > Y
A U .O W E P U M A R k h t O U t % t M t U
N o li o b i \ S r s i M u d m a k a %«,«U, B So«lb C N a i r o b i D tiin Nttirarao H l f k « l r n M a g l« •<-oir< o o iw E a n g a ta Esla«e»
m *DrvelnjwMotwMtucrf l ' n - r*—
• P f 'II >■! * » *
Soialilw aU• " i m i i l t• N g e l 1 & 2
• O nyonka• M asai• I lh iin i< i« n 1 e m• J n u i lu n ) N g ra o\ HI I I I JIM ,«
i lljlHiaIn IFretlsa
I M lia k u l• ' um inaarta l« Rq»uWuiiwI__
R ra a d ra lla l k l a n l D e se ln p tn r tit
A R E A S C O V E R E DDeptR r f
m r (s> o r d c x t l o p m e n tALLOW ED
s p e c ia l sc k rd u lo d A rea (K Pbera
N a tio n a l H ousing C a rp o ra tto a(?<H C) Estairs
AymiyO ly m p ic___Fort Jeaus__
« Katauia Rond
lu foniu l Mixed Deselopmews C o i q n k n w v t D t d a x u l Schamas
K a ro n / L a a g a ta K a ro n
Low Dana) ty l DeveloptnautiOne r am ity Dwelling Ilonaei
c a wK itte n r n R id g e w ay s C .ard o u E v la tr S a fa il Pm k Balozl 1
T ow -O om ity Raaldesitlal <Ona Family DuoUnw Houaol
MINAREA Rl M ARKS p o t l< Y H « M
M K Pla f ta u m c n a e s e p S d to o te
allowed « ilia l u a a a m 1a
020 4
Utadai R o m o Ptapaeanoo
tm lypockets of intensity of desnlopmeuM a p VtBaga M a lta A Aaann.au D * t a a t e c
R o y sam ltu I h o m e M o rn m l
Low-Deoauv Residential (One Fatally Dwelling H caual
Iw em i'e D rtakyaueai in M sound A Row anthai
D a g o ir l t lR lnitaKiaigauuSftmnniW aitiiaka
t t r t n
A pncuIttaaLRcudetaial M ixed a Crap F lan• Mataouenaa• B u n g a lo w s
Aiea M aueaiaa A p iu id tiua l Clan act eiHigh-rise Flats develop
RuihnniniU th in i
A R E A S C O M R I D c c ••
m• ••
Do pi R rf. M a p
TY PE (S) O f D EV E L O PM E N T
M IN .A R IA
.. ----R E M A R K V T O E IC Y
1M C ES
Bubo Dofto 005 lowei if
High Density Resalenlial• to d u itiin l
»<*«>5*»)
wt».i
Resideutial (M ixedResidentialDevelopmenta Residential #5<o)
25(0*H)SU L . 1 sorapsetieirsne
N g u in h a /R a a ra k a /_____________ _____________C ith n r a l 44 * 4 5
laduatnal Zone
a Replete wite
* __ n_50 100 Residential (M ixad
'Blanket appeosrar• C ouunetcial 50 too Rj udcntial
Devdopmcirta Residential 50 TS \ v m n
50 10#a 24)
_. a mK a sa i an l a Agricultural
a Residential M ixed Development
A i n t o pommmi w
• flavw ortt*• 0.05 «a wow• 0 1 to i tm *
um• Iowci into
l an a tu u i by land Iroyuig coanpaiaea and landipm uiaHasi
• C lay C ity w too 1• M w lU 90 :oo
a N jm i boykip In k is ira l nee attract t i e
a R u n c r r r x x company t o r
Spoo la i S c k r t f a l r d A le e O atsldo NatenM R o n id a n AptKttl total
Residential (M ixed
by cay dsmannes a NCC not a t control o f
a ( iitliui.si Kiml>o t .Irse l-vn in*
a W entteni 8 Derelopm anl) a oserw belm taclydepetnkaa o nsen ices o f the c a y• Kabasva Sukan
134

AREAS COVEREDDrpRef.Mar
rvrt (smmD C V E L O fM E X I
ALLOWEDMIN.AREA'Ha i
Public S b l l f t k R n r r r r d A in u (G a z r l t r l )• Slate Home• JK1A Airport• Wibon Auport• Military Site*
o Military Aitbare taatlei^h o DoD Headtjaten o Kahawa Banacka o Lauaata Banacka o Defence College. Kami
________ o Forcer Memorial Homilal_______
Special
20,
Reel ratloaal .And Ferrate• City ta lc• Arboretum• Ngoua FoteM• K anin Foreet
.National Game Park Stadinma
• Mot Sporti Complex. Kaaaram• City Stadium• N yiyo Stadium
C hum Park Central Park C hilli! Gardena
Reaeraea and Huftfunml
Section of the zoning ordinance Source: (CCN, pp. 4-10)
135
APPENDIX II: ESSENTIAL ATTRIBUTES OF FORM-BASED CODES
This summary is adapted and extended from definitions and commentary by
Paul Crawford, in Form based Codes: Implementing Smart Growth,
[California] Local Government Commission (www.lgc.org) and Craig Lewis,
Design-Based Codes (2003) as cited in (Walters, 2007, pp. 245-246).
Form-based zoning codes must possess the following 12 essential
characteristics:
1) Codes must focus on form, not use. Form-based codes de-emphasize
the regulation of density and use in favour of rules for building form.
They recognize that uses change over time but that buildings endure.
2) Form-based codes are organized around spatially defined districts,
neighbourhoods and corridors that manifest particular urban
characteristics.
3) Form-based codes recognize the importance of well-defined and well-
designed public spaces. This generally means that buildings in urban
areas must be built close to the street to achieve this definition and help
create a sense of place. Great attention must be paid to the design ol
the streetscape and the role of buildings in shaping that public realm.
4) As part of this definition of space and place, street level activity must
be stimulated by mixing uses to create different rhythms of pedestrian
activity during the day, the night and the week, and this ambience must
be supported by pedestrian-friendly design of the lower stories of
buildings. Building fa9ades are very important, and the normative
three-part design composition of base, middle and top can provide a
136
useful design vocabulary. Where a contemporary design language is
used for a building, care must still be taken to provide a safe, attractive
and meaningful pedestrian experience at street level with clearly
observable windows and doorways while safeguarding the privacy of
occupants.
5) Streets must be safe, convenient and attractive for pedestrians, cars,
transit and bicyclists.
6) Parking lots must be concealed behind buildings and on-street parking
provided for short-term use and for protecting pedestrian activity on
the sidewalk from fast-moving traffic.
7) Neighbourhoods should be compact, pedestrian-friendly, mixed-use,
and provide a range of housing types. This brings workplaces, shops,
schools, churches and parks into close proximity to housing and
provides housing choices within a community that can meet the needs
of many individuals at different times of their lives, especially with
regard to older adults ‘aging in place’ and maintaining viable lives as
part of the community.
8) Form-based codes are style neutral.
9) Codes must be written in clear and concise language. Design standards
should be tied to measurable purposes and outcomes. For example,
ensuring infill buildings are compatible with their context facilitates
the creation of a convenient, attractive and harmonious community,
and thus draws the ‘essential nexus’ between the regulations and a
valid public purpose.
137
10) The codes must be presented in an easy to read format. Standards
should be clear in their narrative, as they will likely be tested in court
by the interpretation of the text. Graphics, photos and illustrations
should be included in generous quantities, but they should only
supplement the text; they should not supplant it.
11) The codes are produced through a design-focused process of public
participation that assures discussion of urban form and land use issues.
12) The most important tool in successful implementation of a form-based
code is the facilitation of permits. In general, developers are much
more willing to abide by design standard and guidelines if they know
that compliance will ensure a permit. Well-written design regulations
ensure a sense of predictability for both developers and the public.
Despite the details of the form-based code, planning staff and elected officials
continually muddle the process and keep adding subjective requirements to
projects that already meet the code and should be quickly approved. Behaviour
like this brings smart growth and form-based zoning into disrepute.
138
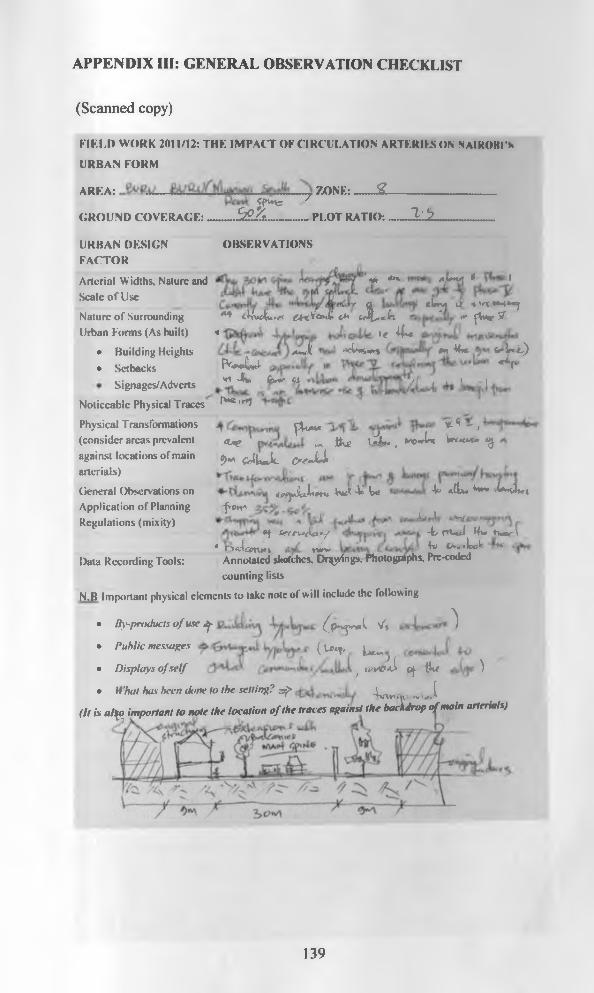
APPENDIX III: GENERAL OBSERVATION CHFXKLIST
(Scanned copy)
FIELD WORK 2011/12: THE IMPACT OF CIRCULATION ARTERIES ON N A IR O B I'S
URBAN FORM
AREA: ZONE:____£Sfnnr 7
GROUND COVERAGE:_____S£.Zt._______PLOT RATIO:-------U z
URBAN DESIGN FACTOR
OBSERVATIONS
Signages/ Adverts
’vi *** ny*u\ t- I
' <1 dLtyt IZ *Vt*M*^6KVo»tC cM i< r*£x «•* fW5*
Arterial Widths, Nature andScale of Use
Nature of Surrounding ^ <UvXu.*e< €*<
Urban Forms (As built) « '* * U
• Building Heights a**X «et**««* ^ -!(* J W l). Setbacks P«Sn J U - V
^ T t e fewk- C l // , , l (
Noticeable Physical Traces P**,'*J
Physical Transformations [ W * *• - ,(consider areas prevalent ^ p ' tt.* I A , . no.rU(consider areas prevalent <l*> ' .« ike ,against locations of main ^ <viUtk 0> e J S arterials)
General Observations on Application of Planning Regulations (mixity)
UyaMc 3
Data Recording Tools:
4#yJcX*M wt 4 U 4 *(L» **"' «U4»rif*"* t , i , ^
®J teeru'Xayf -fc< fvt i f(v ht**- \• r>Ao»nni vwy* k* <a.«Ico ^
Annotated sketches. Dryings, Photographs, Pre-coded
counting lists
N.B Important physical dements to take note of will include the following
• B y-p ro d u cts o f use J f ( p ^ ^ X V* ^
. Public messages ( u ^ ^
• D isp la ys of self ; u’vtf'A c j tk ' )
• What has been done to the setting? ^ 4***, . «**. I(/t is a ty important to note the location o f the traces against the backdrop of main arterials)
139
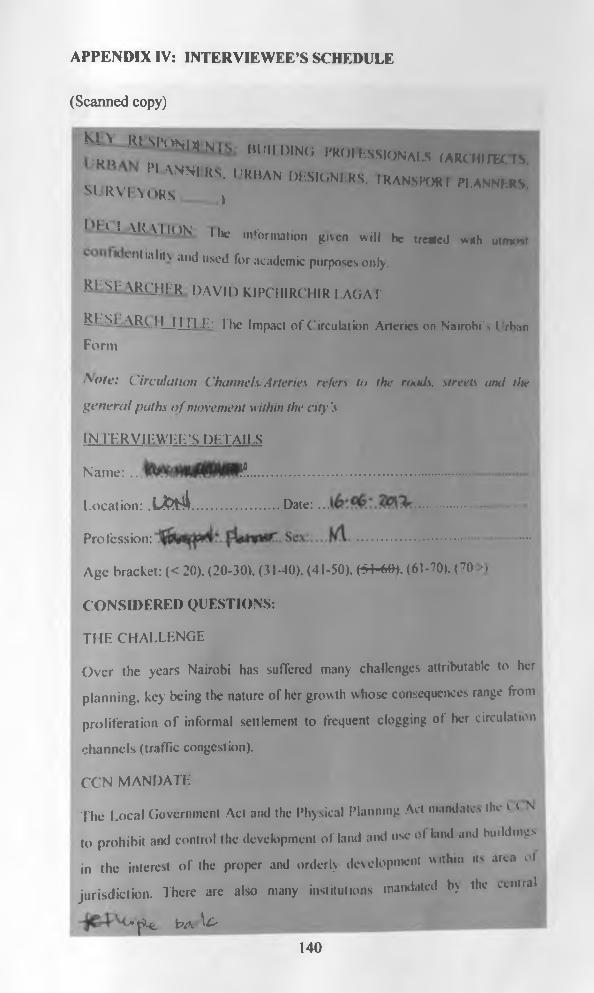
APPENDIX IV: INTERVIEWEE’S SCHEDULE
(Scanned copy)
K E* JU-SPnK|[flfr|Tomm DING PROI ESSIONAI.S (AKCHIfEC IV|Dll . ■ -w . (/
Pl ANN,RS- "KHAN DESIGNERS, IR AN SPO KISURVEYORS
PLANNERS,• )
1 l c l \ I < \ I I ( ) N The information given will be treated with utmmt
1 ^ 'd '^ h u und used for academic purposes only.
HUSU\R(JiER DAVID KIPCHIRCHIR LAGAT
B J i S jA R c H 11TLE: The Impact of Circulation Arteries on Nairobi's Urban
Form
Ao te: Circulation Channels/Arteries refers to the roads, streets and the
general paths o f movement within the city's
I N T E R V IE W E R 'S DETAILS
Name: .. l?.......................................................... *
Location: .C & b l l ............................D ate :... ....................................
Profession: ...........................................................
A g e bracket: (< 20), (20-30), (31-40), (41-50). (-54-60). (61-70). (70 >)
CONSIDERED QUESTIONS:
THE CHALLENGE
O v e r the years Nairobi has suffered many challenges attributable to her
planning, key being the nature of her growth whose consequences range from
proliferation o f informal settlement to frequent clogging of her circulation
channels (traffic congestion).
CCN M A N D A T E
T h e Local Government Act and the Physical Planning Act mandates the c t \
to prohibit and control the development o f land and use cl land and buildings
in the interest o f the proper and orderly development within it' area ot
jurisdiction. There are also many institutions mandated b> the ventral
* J&e. bA ^140
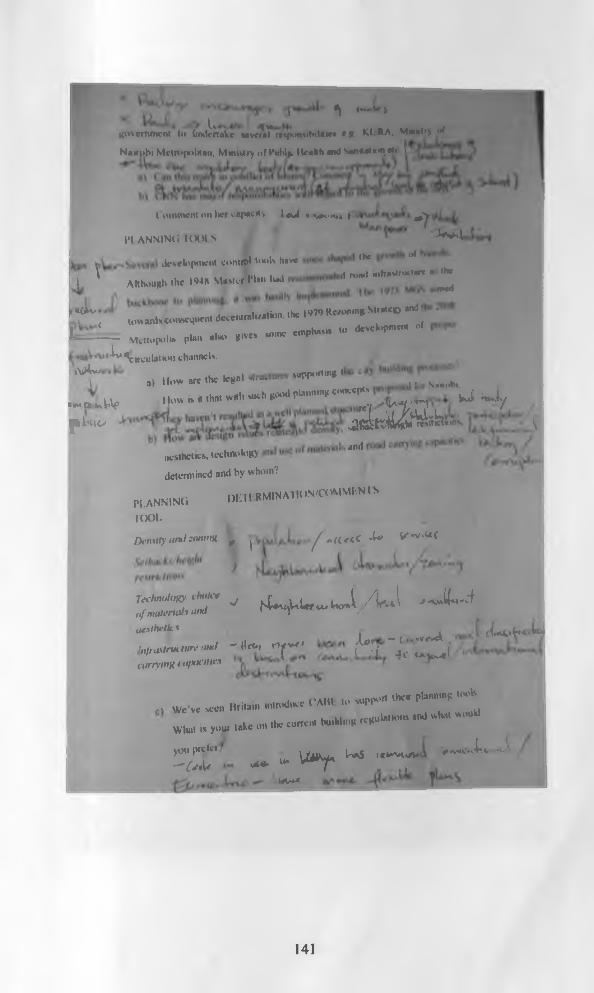
gj t'u'W iL
government to (mdrrtakc vevesaTr*»f*»n\ihila.»* eg K1 M , Maintr) <>l
N a iro b i M e tro p o lita n . M in is try o f P u b lk H ea lth and S a n d e u m . et» i
( o tn m c n l o n lie r c ap ac ity l e v ! i v < u
H A N N IN G KXM S
a a a ( » >
-W4
d c v c k tp tn c n l c n l l t l '•»>!' I » « l lu '*
I ' A „ h « * h f t . , « « M . « , ' F I . M .........- ............................. ‘ 2
' T ' , l o w w l i i o w « P * n.d e v c w ra l i /* * k w .th e I W I W H " " ” 1 'm n iu iso to d ev e lo p m e n t o f
' M.„o,x.l,s ,.ta .to »i*C. "«»• to p l» '“
’‘ " ^ ^ c i r c u l a t i o n channel* .
' ^ m m ....... ..- - - - .......l a ) H o w a re tn c w — ------- ■■ . . . W l ,hl
,w a * l \ e How b H that 'vith *ch good plannmts concept* U ^ S y
? in „ jS fc& sb l- V
:KS,toK, m M W - 4 .determined and by whom?
PUN NIN G l)ETF.RMINATK>N/COMMENTS
t e<C -W V * V '^ f
root.
Density a n d fontutc ^ ^ «rt
X % , ; T " h H u u ^ u i / u l ~ J t ~ *ocslhelks
curtyinn1 -upacUtva
. ___ ___ i tU iK .u.M ra w r* "-! - tU , rjw < h i ~ l t Z Z i
. ... . m u to support »K-ir planning tools .v vve ve seen Britain introduce ( Altl to *»l i
. . . „ „ lhc c u m n l to M in g rcguU lw m »«1 »l»> » « * “What is your tukc on ,nc
/#«V*V’*vil*. -W. '^mptxbr W ^. t vS i«v ha#w- oju * * ^ vmT . . . .
-Urad
141

tl) lh»cx m ovem ent along i iru iU tio n channel* have any influent* n« the
grow th o f the city? (o iiiin e itl on tfir live o f o r iu la ta u t arte*** a*
ptaitnlngelem ent* ^ ^ t p
c ) Mot/ vfcni'tT'uH- si/e* o f pkrt* and nature o f devefc»pw*t» afcuig a ,
Ciuulatron Anertev lie itetcrmined7 1 1
0 Plans have always advocated for /orii n 77s l *iuf&£m ™*' should mixity of uses m the dtfferent /oiw\ he encouraged -f^ K
1N VI SI Ml NT ON ROAD INHRAS1 RIK‘1 URI
Z K t .»» v y -/ * °* rt a decade now the government has invested heavily on txpan*h>n
____of road* leading in and out of the city including opening tip o f by-pa\s«s
l a ) W hat nrc the short term consequences and or impediments to tlm m< sc
. f f V with regard to the growth o f the cay?
^ h) Do you think this will have an impact on the way the city *dl Rf°*
now and in the futureT-^^'^^^uafiCiusM ! ws^r-Li****
c) In your own opinion, w ha tilp ^lh w have been undertaken to
make it more successful?
X w A Y F O K W A R D
Several plainer, Including (W fc»w i»l • » « » ' « “» lilc AAK ',vc'*1pntporad the moving of growth oot of NwoM though
encouragcmwt of growth of .hIki town, and nr Jcvcotr.lw.lnn of
administrative headquarters. ( omntent t .
v - u J L cTt i < r “(il.Nl.RAT ^ X ' *uT\a )-
What can yop « y ,N ,,R ,,M,," ......... ,or ,hc 'X? ?,?. •/•'• £J?SW .ifMhffc • tr 4 » JoUcg.
What ran yop vny k th. main rcatou for the corral. w * in the « y '
Which part, of the city dr. you vnil mo.1 and what h your «rc n c n a -
St......................................................................, 00 you think both the vchfcukr «td pcdcv.mn
l°WSjltcrV iS -
f f f f
p U ^ g 4 t c j U £ u . . .U J £ > e Sw » « •* « *
142