Embed Size (px)
Citation preview
The Impact of China’s WTO Accession on the World Economy Zhi Wang 1
I. Introduction Both China and Taiwan are important players in international trade. By the end of 2000, the volume of China’s exports and imports had reached $249.2 billion and $225.1 billion respectively. It was doubled more than twice in 10 years, much faster than world trade growth as a whole, which only increased 83 percent during the same period. Taiwan’s exports and imports totaled $288.4 billions in 2000. And the total external trade of China, Hong Kong, and Taiwan reached $810 billion in 1999 (after minus $137 billion intra-trade between the three Chinese economies), far exceed the total trade of Japan ($731 billion) and equal to nearly half of that of the United States. Their roles will likely increase as the integration among the three Chinese economies intensifies by the recent unification of Hong Kong and Macao with China and China’s anticipant entry to the World Trade Organization (WTO).
The rapid emergence of China as a world trade power has raised concerns in developed and developing economies alike over its potential impact on the world market. With China’s impending accession to the WTO, the effect of China’s WTO membership on the patterns of world trade and economic growth has also drawn intense interest in both academic and policy discussions. This has led to a substantial and still growing volume of literature in analyzing the potential consequence of the rise of China and its integration into the global trading system. However, most recent studies on China’s WTO accession focus on welfare effects and structural adjustment in China and its major trade partners (Gilbert and Wahl, 2000). Only a limited effort has been made in understanding its role in shaping the future patterns of world trade.
To fulfil their membership requirements at the WTO, both China and Taiwan have to implement
their commitment to adopt broad and deep trade liberalization measures to bring their trade regime consistent with WTO rules. Implementation of these liberalization measures implies a substantial reduction in tariffs and non-tariff barriers across all economic sectors in one of the world's largest and most rapidly expanding markets. Obviously, it will not only change China’s and Taiwan’s resource allocation among their domestic production and export sectors, but will also affect the structure of China’s and Taiwan’s trade with their trade partners. World trade patterns and production in other countries will have to adjust to accommodate such changes. What opportunities will the growing and liberalizing of Chinese markets likely bring to developing and developed countries around the world? What challenges will the rest of the world face as the tremendous low-cost Chinese labor force is integrated into the world economy? How will the increase in the export competitiveness of Chinese products affect world markets? Who will gain? Who will lose? What are the geographical and sectoral distributions of those gains and losses? To answer those questions and better understand the future patterns of global trade into the next century, I used a 17-region, 25-sector recursive dynamic Computable General Equilibrium (CGE) model with import embodied technology transfer to estimate the differences in world trade and economic growth under alternative scenarios of the world trade liberalization with or without China and Taiwan’s participation. The model includes China's and Taiwan’s major trading partners in both developed and developing countries and covers major production and trade activities in the world economy from 1997 to 2010. Simulation results show that although China will gain the most 1 Zhi Wang is an economist at the Economic Research Services, United State Department of Agriculture. Corresponding address: Room 5141, 1800 M Street, N.W. Washington D.C 20036-5831. Tel:(202)694-5242. Fax:(202)694-5793. E-mail: [email protected]. Views expressed in this paper are those of the author and do not represent the opinions of USDA/ERS.
2
from its WTO accession, the rest of the world, especially developed countries and Asian newly industrialized economies, as well as least developed countries, would also benefit due to the expansion of world trade and improvement of their international terms of trade. Only certain developing countries with a endowment structure similar to China, like those in South America and Southeast Asia, may experience keener competition in labor-intensive exports and lower prices for their products. Although the numerical model is quite large (there are more than 30,000 equations in each simulation period), simulation results are followed transparently from the model’s (conceptually straightforward) structure based on basic theory of international trade.
The rest of the paper is organized as follows: Section 2 outlines the basic structure of the model
used in the evaluation. Section 3 describes major assumptions in the baseline calibration and simulation scenario designs. Major simulation results and underlying economic forces shaping those results are presented and discussed in section 4. Section 5 ends the paper with its conclusions and limitations. II Structure of the Model
The model used in this paper is an extension of the CGE models used in the China’s WTO accession study by Wang (1997a, 1997b, 1999) with import embodied technology transfer and trade policy induced TFP growth. It is part of a family of models used widely to analyze the impact of global trade liberalization and structural adjustment programs. It focuses on the real side of the world economy and incorporates considerable detail on sectoral output and real trade flows, both bilateral and global. While not designed to generate short-term macroeconomic forecasts, the model could be linked to a macro economic model including asset flows and generating macro scenarios. Given a macro scenario, however, this model could then be used to determine the resulting real trade flows and sectoral structural adjustments for each region in a recursive dynamic framework. Under assumptions on a likely path of future world economic growth, it generates the pattern of production and trade resulting from world economic adjustment to the shocks specified in the alternative scenarios.
In this study, 17 fully endogenized regions and 25 production sectors in each region are specified to
represent the world economy. The 17 regions are: (1) the United States, (2) Canada, (3) West Europe (4) Japan, (5) Australia and New Zealand, (6) Mexico, (7) Korea, (8) Singapore, (9) Taiwan, (10) Hong Kong, (11) China, (12) South East Asia (ASEAN, includes Malaysia, Thailand, Philippines, Indonesia, and Viet Nam), (13) South Asia (Indian, Bangladesh, Nepal, Pakistan, and Sri Lanka), (14) Latin American MFA restricted countries (Central America and Caribbean, Brazil, Colombia, Peru, Uruguay), (15) Mid-east and South African MFA restrict countries (Turkey, Botswana, rest of south African custom Union, and rest of Middle East), (16) Low income South African countries (Malawi, Mozambique, Tanzania, Zambia, and rest of sub-Saharan Africa) and (17) Rest of the World.
The 25 sectors are: (1) rice, (2) wheat, (3) other grains (4) oilseeds, (5) plant based fiber, (6) other
non-grain crops, (7) livestock, (8) meats and dairy products, (9) processed food, (10) beverage and tobacco, (11) forestry and fishery, (12) mineral products, (13) energy products (14) textile, (15) wearing apparel, (16) leather, shoes and sport goods, (17) other light manufactures, (18) wood and paper products, (19) manufactured intermediates, (20) motor vehicles and parts, (21) other transport equipment, (22) electronic equipment, (23) other machinery, (24) utility, housing and construction, (25) transportation and traded services, a portion of which is allocated to international shipping.
There are six primary factors of production: agricultural land, natural resources, capital, agricultural labor, unskilled-labor, and skilled-labor. Skilled- and unskilled-laborers have basic education in common, but skilled-laborers usually have more advanced training. While the agricultural laborers are
3
those who have little or no education and work only in farm sectors. Natural resources are sector specific, while other primary factors are assumed to be mobile across sectors, but immobile across regions. Land and agricultural laborers are only used in agricultural sectors.
The model is able to capture three types of gains from trade liberalization: 1. The gains from more efficient utilization of production resources, which lead to a one-time
permanent increase in GDP and social welfare; 2. More rapid physical capital accumulation, which compounds the efficiency gain from trade
liberalization; 3. The model incorporates a capital and intermediate goods imports embodied technology transfer
among regions, which links sector specific TFP growth with each region’s imports of capital and technology intensive products. The technology transfer is assumed to flow in one direction -- from more developed regions to less developed regions. Empirical evidences suggest that there is strong positive feedback between trade expansion and productivity growth. Trade liberalization increases the prevalence of technology transfer as trade barriers are reduced. Firms in the liberalized regions will import more capital and technology intensive goods as both investment and intermediate inputs from abroad at cheaper prices. Those goods are usually embodied with advanced technology from other countries, thus stimulating productivity growth for all production factors.
Accumulation patterns for capital stock in the model depend upon depreciation and gross real investment rates, the latter set exogenously based on forecasts from the Oxford world macroeconomic model (Oxford Economic Forecasting, 1999). However, household savings, government surplus (deficit), and foreign capital inflows (foreign savings) are assumed to be perfect substitutes and collectively constitute the source of gross investment in each region. Given the assumption that aggregate real investment is determined as a share of real GDP, changes in the trade balance, which directly affects foreign savings, are assumed to have only a partial effect on aggregate real investment in the region. Instead, they lead to an equilibrium adjustment in the domestic savings rate, which partially offsets the change in foreign savings.
Household savings decisions are endogenous in the model. They represent future consumption goods for the household with zero subsistence quantity (by assuming inter-temporal separable preferences, ELES demand systems). An economy-wide consumer price index is specified as the price of savings and represents the opportunity cost of giving up current consumption in exchange for future consumption (Wang and Kinsey, 1994). Government surplus (deficit) is the difference between government tax revenues and its expenditures, the latter fixed as a percentage of each region’s real GDP based on forecasts from the Oxford model.
Foreign capital inflows or outflows are determined by the accumulation of the balance of trade, which is also fixed as a percentage of GDP in each region based on the Oxford model’s projections except for the United States. The model does not include financial markets and portfolio investment. The trade balance is the only source of foreign savings (either inflow or outflow). There is no explicit specification of Foreign Direct Investment (FDI). However, it is counted by trade flows, because in order to convert FDI into production capital, technology and equipment have to be purchased via domestic or international trade.
Agricultural labor and urban unskilled labor are not substitutable in production functions, but are linked by rural-urban migration flows. These flows are endogenous in the model and are driven by the
4
rural-urban wage differential and structural changes in production and trade. The increase in the skilled labor force is based on the growth in the stock of tertiary educated labor in each region estimated by the World Bank (Ahaja and Filmer, 1995), which provides an indication of changes in the number of those qualified for employment as professional and technical workers. That is, as tertiary education grows, the share of skilled labor force grows correspondingly.
There are an economy-wide and a set of sector specific TFP growth variables for each region in the model. The economy-wide TFP variable is solved endogenously in the baseline calibration to match a pre-specified path of real GDP growth in each region based on forecasts from the Oxford model. Then the economy-wide TFP variable is fixed when alternative scenarios are simulated, in such a case, the growth rate of real GDP and the sector-specific TFP variables that link productivity growth and imports are solved endogenously.
Similar to Hertel et. al (1995), the Multi-Fiber Arrangement (MFA) quota rents are assumed to be captured by exporting countries as export taxes. These export tax rates are adjusted endogenously to equate with quotas. Such a treatment assumes that all quotas are binding constraints at the equilibrium. Consistent with this modeling practice, we divide developing countries subject to MFA quota restrictions into quota binding and non-binding regions2 based on historical trade statistics. Quantity constraints only apply to those regions with binding quotas.
The model is implemented by the General Algebraic Modeling system (GAMS; Brooke, et. al. 1988) and solved in levels. A detailed algebraic specification of the model and the correspondence between sectors in the model, GTAP and ISIC are available upon request. III. Baseline Calibration and Simulations Design
Both China’s and Taiwan’s market accession commitments for WTO membership include a complex package of trade and investment liberalization measures. In this paper, however, only the following five aspects are considered: (1) tariff reduction in both agricultural and manufacturing products (China and Taiwan); (2) elimination of non-tariff barriers in manufacturing sectors (China and Taiwan); (3) reduction of non-tariff barriers in agricultural commodities and liberalization of import quota on agricultural products (China and Taiwan). The accelerated growth of import quota of rice in Taiwan and wheat and plant based fiber in China, and elimination of such quotas in 2005; (4) opening of major service sectors (China); and (5) the phase out of MFA quota on textile and clothing (China and Taiwan). Once China and Taiwan become members of the WTO, their exports in textile and apparel in North America and European markets will be subject to accelerated MFA quota growth from 2001-2004 similar to other developing countries that are WTO members. The remaining quota restriction will be eliminated at the year 2005 according to the Agreement on Textiles and Clothing (ATC)3.
Because both China’s and Taiwan’s market accession commitments to WTO entry will be phased in over a transition period, a baseline from 1998-2010 is established first as Scenario I (the Uruguay Round Case) under a set of assumptions. It generates a reference growth path of the world economy with 2 There are eleven developing regions in the model, nine of them are subject to binding MFA quotas. They
are Korea, Singapore, Taiwan, Hong Kong, China, ASEAN, South Asia, Latin America MFA restricted countries, Mid-east and Africa MFA restricted countries. While Low income Africa countries and rest of the world are modeled as MFA quota non-binding countries.
3 On January 1, 1995, the ATC entered into force and replaced the old Multi Fiber arrangements (MFA). The ATC provides for the elimination of the quotas and the complete integration of textiles and apparel into the WTO regime over a 10-year transition period ending on January 1, 2005. All WTO countries are subject to ATC disciplines, and only WTO members are eligible for ATC benefits.
5
the implementation of the Uruguay Round trade liberalization, but without China’s and Taiwan’s participation. This calibrated “benchmark” will serve as a basis of comparison for counterfactural simulation conducted in Scenario II.
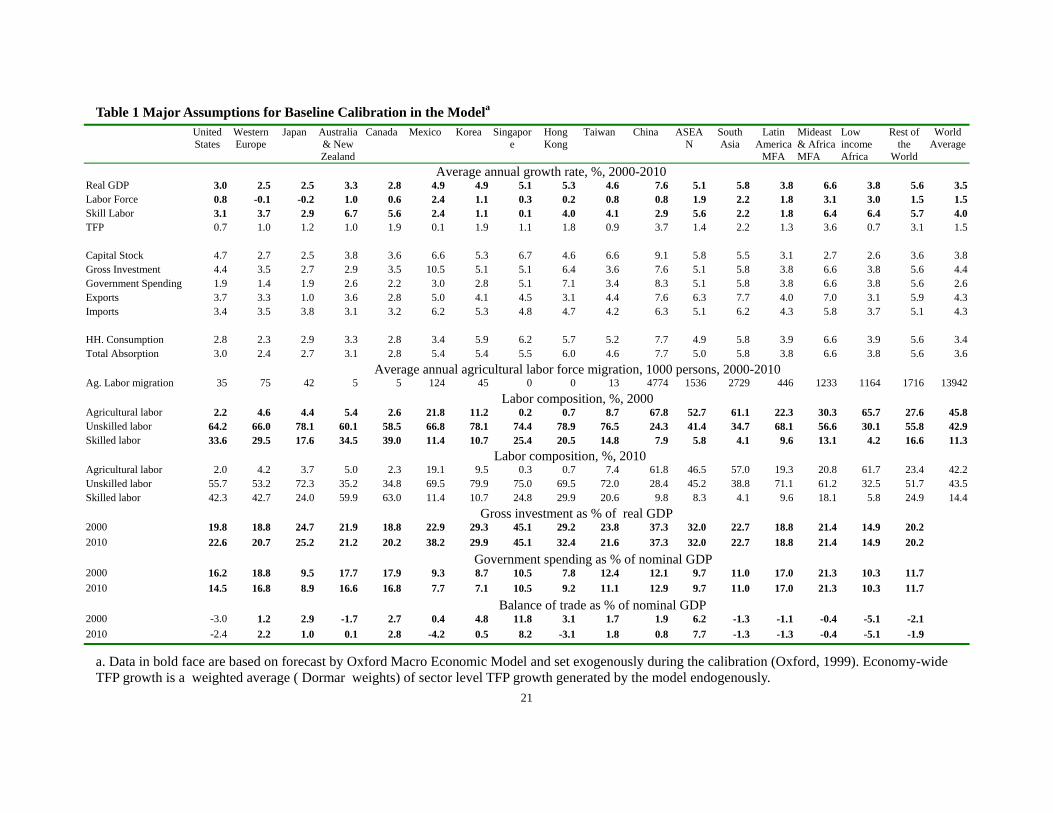
Table 1 summarizes the major macro economic assumptions and results from the baseline calibration. It uses the economy-wide TFP variable in each region as a residual and adjustment mechanism to match the pre-specified real GDP growth rate under assumptions on the three major macro economic variables (gross investment, government spending, and balance of trade) in the model. It incorporates the impact of the recent Asian financial crisis by imposing actual negative GDP growth during 1998-1999 and current account surplus of the affected regions. All the three macro-variables from 2000-2010 are specified as percentages of GDP and are based on forecasts by the Oxford model. China’s imports of wheat and plant-based fiber and Taiwan’s imports of rice are subject to quota control with a 3 percent annual growth rate. Those quotas are also assumed to be binding and a NTB rate adjusted endogenously to clear the market4. Because China and Taiwan are excluded from the WTO under this scenario, their exports in textile and clothing are subjected to a constant growth in MFA quotas and the quantity restriction continues after 2005. All other MFA quota restricted regions are subjected to accelerate quota growth and the termination of the quota system in 2005. The base quota growth rates are calculated from bilateral data provided by the International Textiles and Clothing Bureau in Geneva. The accelerated annual quota growth rate is 25 percent for WTO members during 1998 to 2001, then an additional 27 percent is applied to the last three years of ATC implementation.
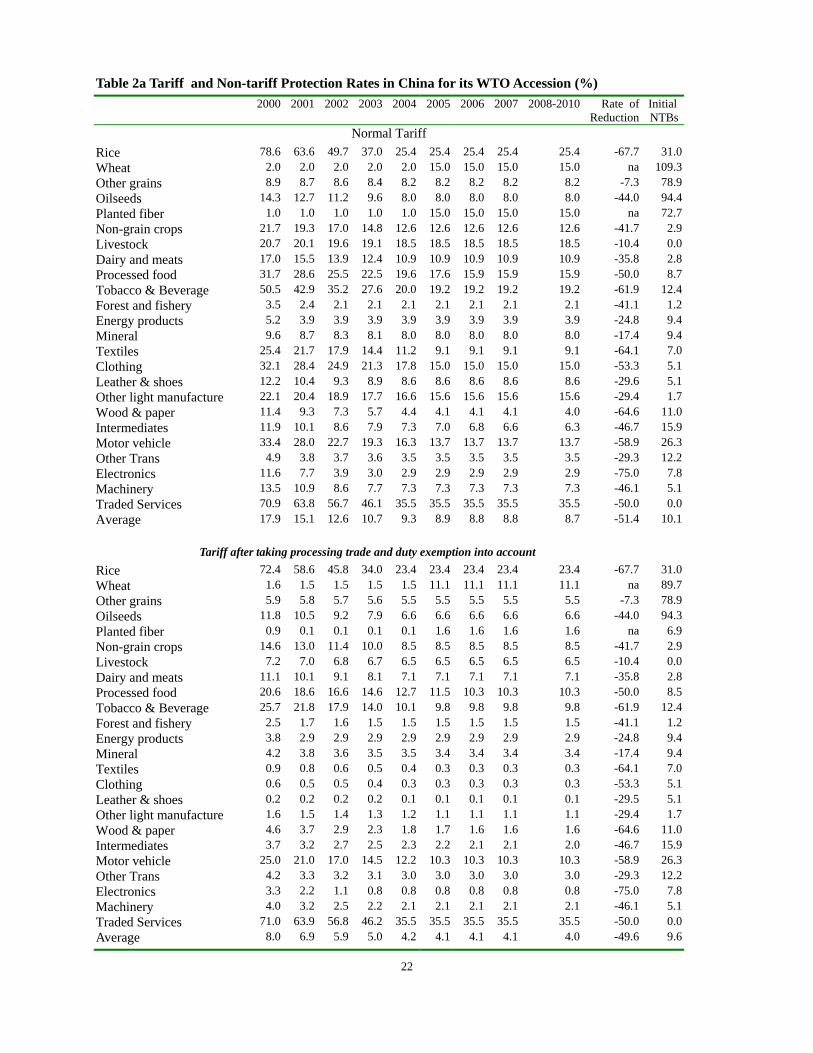
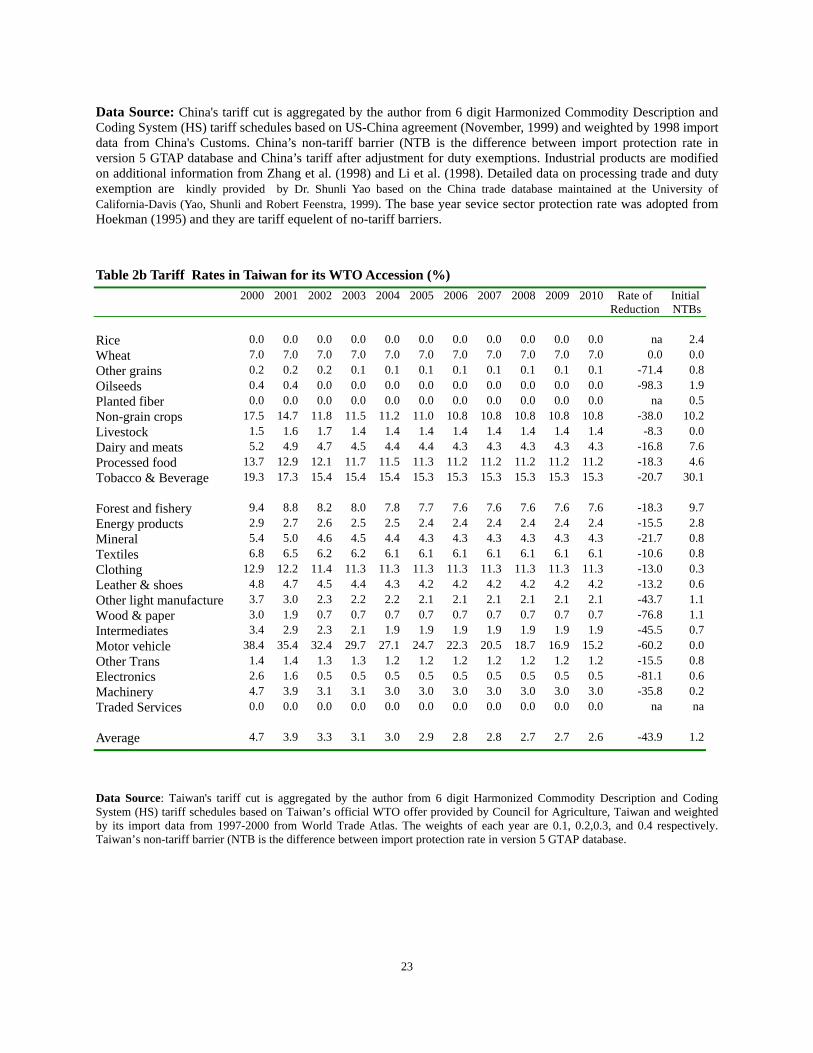
In Scenario II (the Accession Case), all the macro economic assumptions and exogenous growth factors are the same as in Scenario I, but with both China and Taiwan joining the global trade liberalization process. The extent of China's tariff reduction is aggregated from the Harmonized Commodity Description and Coding System (HS) tariff schedules at 6-digit level based on the US-China agreement (November, 1999) and weighted by 1998 import data from China's Customs. The import quotas for wheat and plant fiber is assumed to grow at a 5 percent annual rate and will be eliminated at the year 2005, and replaced by a 15 percent uniform tariff. Taiwan’s tariff reduction is based on Taiwan’s official WTO offer provided by its council of Agriculture. It is also aggregated from the 6-digit HS tariff schedules and weighted by Taiwan’s import data during 1997-2000 from the World Trade Atlas. All non-tariff barriers of manufacturing products in both China and Taiwan are reduced by 20 percent each year from 2001 and set to zero in 2005, while non-tariff barriers of agricultural commodities are reduced 10 percent a year and eliminated to zero in 2010. A 50 percent cut in protection on traded service is also implemented to represent the opening of major service sectors in China’s WTO offer. The base year service sector protection rate in China was adopted from Hoekman (1995). Both China’s and Taiwan’s tariff rates for all sectors each year in the simulation period and China and Taiwan’s initial NTB rates are listed in Table 2a and 2b. Because China and Taiwan become WTO members under this scenario, their exports of textile and apparel are subjected to the same treatment as other developing countries.
It is well known that China’s tariff collection is significantly below its normal tariff level because of a large volume of processed trade and extensive import duty exemptions. By 1998, more than 50 percent of all imports in China were inputs used in production of exports and exempted from tariff collections. It implies that the Chinese economy is more open than it seems and the exiting import restriction has been largely lifted prior to China’s WTO accession. Several studies have shown that without accounting the presence of duty exemptions in China’s trade regime leads to serious overestimate on the impact of China’s WTO entry at both aggregate and sectoral levels (Ianchovichina, Martin and 4 Martin (2001) used China’s average historical import levels from 1961-1997 as a guide, pointed out
wheat imports would be subject to import quotas relatively frequently, maize imports less frequently, and rice imports very infrequently .
6
Fukase 2000, Lejour, 2000). By using 1998 China’s Custom Statistics, I incorporated China’s processing trade and duty exemption pattern by sectors and by import sources into simulation design, which scale down the tariff level by routine specific information. The tariff rates in the lower panel of table 2a are the tariff level that take duty exemption into consideration, which are substantially lower than normal tariff (listed in the up panel of table 2a) and is much closer to China’s actual tariff collect rate at the aggregate level.
For each of the two scenarios, the CGE model generates results regarding the effects on social welfare, terms of trade, the volume of trade, output, consumption, the real wages paid to each factor, and changes in prices and resource allocation. The differences in results generated by the two simulation scenarios provide estimates of the impact of China’s and Taiwan’s accession to the WTO. However, those estimates should be regarded as outcomes from conditional projections rather than as forecasts. In reality, actual trade and output patterns are affected by many more factors than just trade liberalization, such as domestic macroeconomic and income policy changes.
IV. Simulation results
4.1 Basic economic forces shaping results
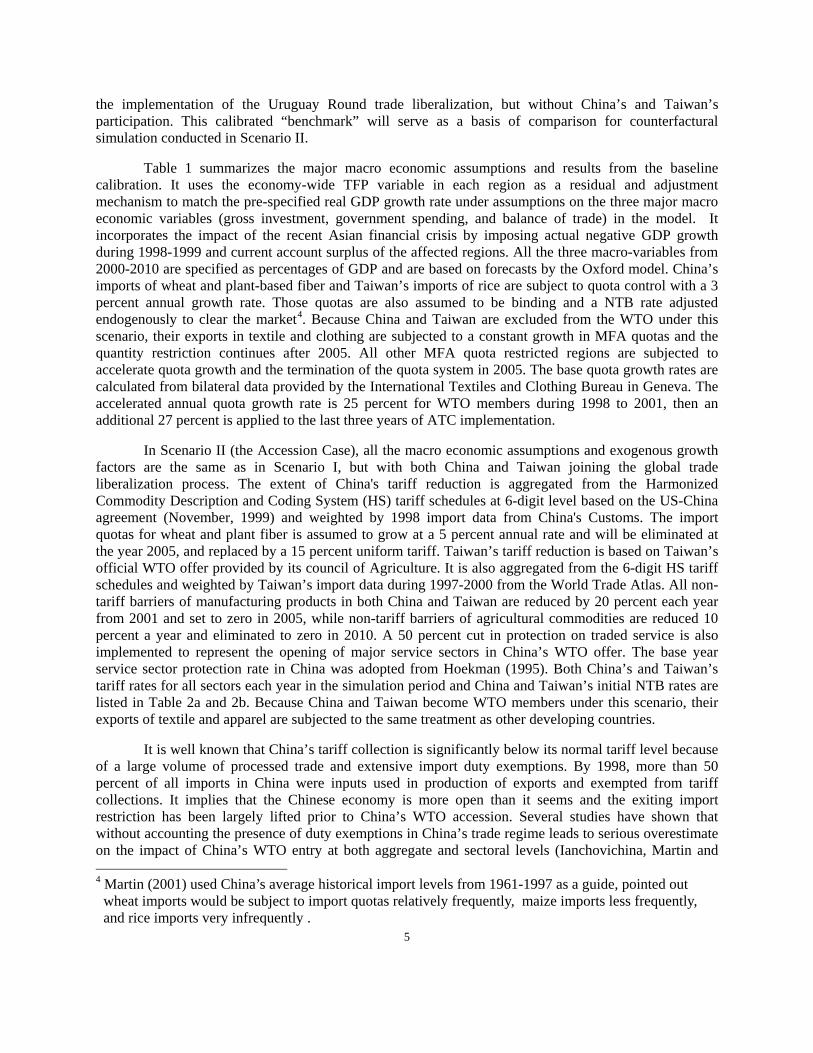
Trade theory suggested that world trade patterns are determined by the relative costs in delivering commodities by trading nations. Although many factors, such as distance, technical efficiency, prices of intermediate inputs, etc., may influence such costs, the relative scarcity of factor endowments is the most basic determinant. A country tends to export commodities that require relatively intensive use of the country's relatively abundant factors of production, and tends to import commodities that use its scarce production factor intensively. In other words, the direction of net trade flows is a function of the relative factor-intensity of production, and the relative factor scarcities among countries. The scarcer the production factors, the higher the cost in production.
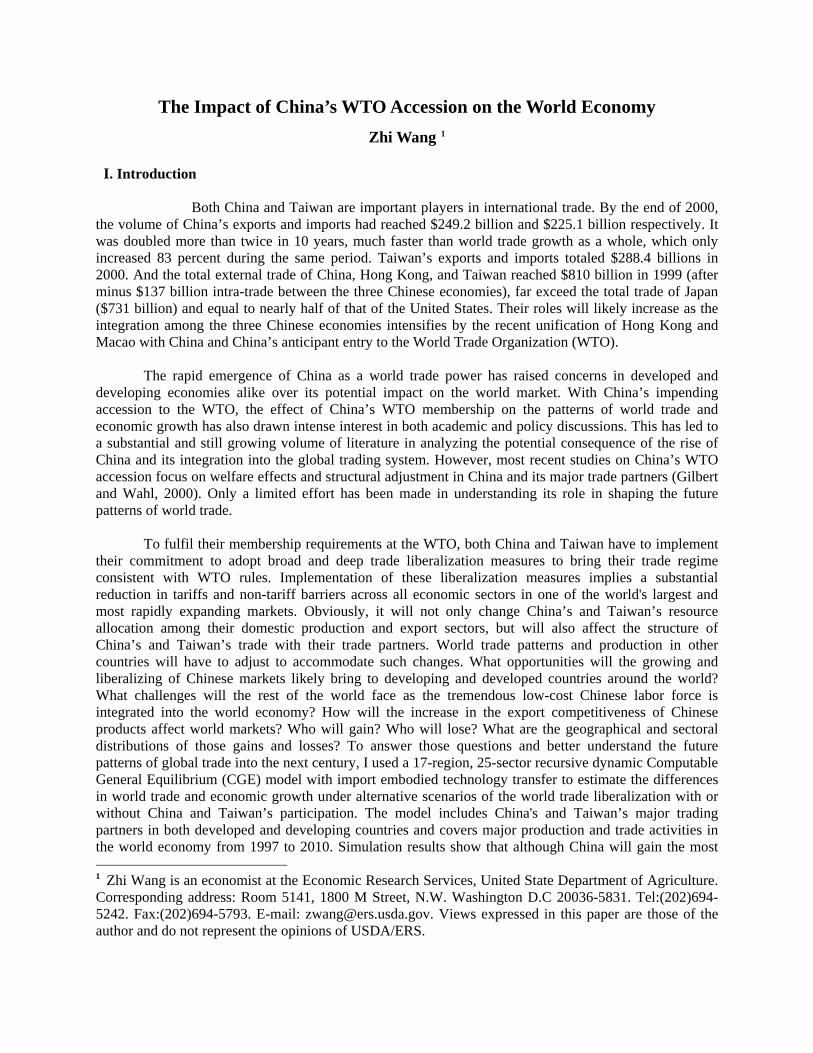
Figure 1 Structure of factor endowments in China and the United States differ greatly, 1997
Land Labor
Capital
China 9%
USA 12.8%
China 26.2%
USA 4.9%S. Asia
19.6%
USA 22.1%
China 2.6%
S. Asia14.1%
WEU 30.4%
Japan 18.5%
other OECD 9.1%
WEU 6.5%
ROW 34.4%
ROW 22%
Other MFA 7.1%
WEU 5.6%
Other MFA 13.8%
ASEAN3.5%
otherOECD 4.7%
ASEAN7.4%
Other MFA 8.3%
Other OECD 4.8%
ROW 10.6%
7
Figure 1 illustrates the relative size of arable land, capital, and labor endowment in major regions
across the world. It shows that the five high-income regions (USA, Western Europe, Japan, Canada, and Australia/New Zealand) account for less than 20 percent of the global labor force, but possess more than 75 percent of the world’s capital stock. In contrast, more than half of the global labor force with about 6 percent of the world’s capital resides in those low-income Asian developing countries (China, ASEAN, and South Asia). Japan, Korea, Taiwan, Singapore, Hong Kong, and China are poorly endowed with arable land relative to labor. Conditions are just the opposite in the United States, Canada, Australia/New Zealand where land is abundant and cheap. Western Europe, Mexico, Caribbean and other MFA restricted countries, ASEAN and South Asia have intermediate amount of arable land per worker between the two extremes.
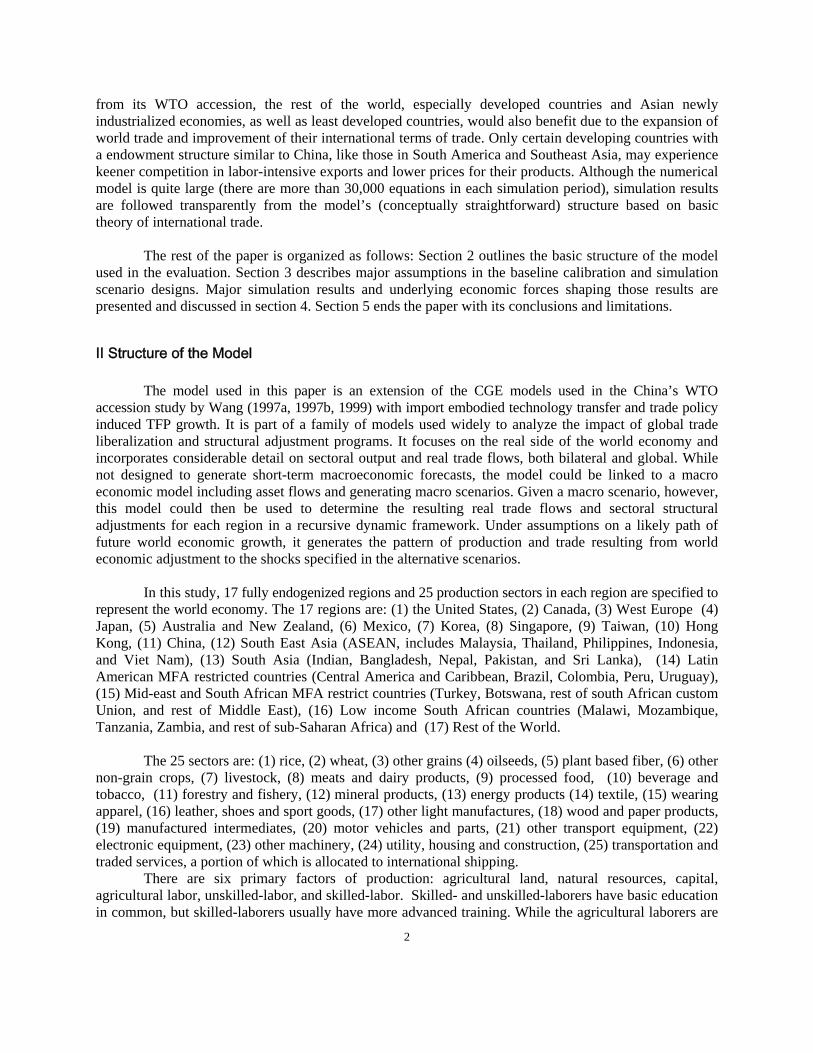
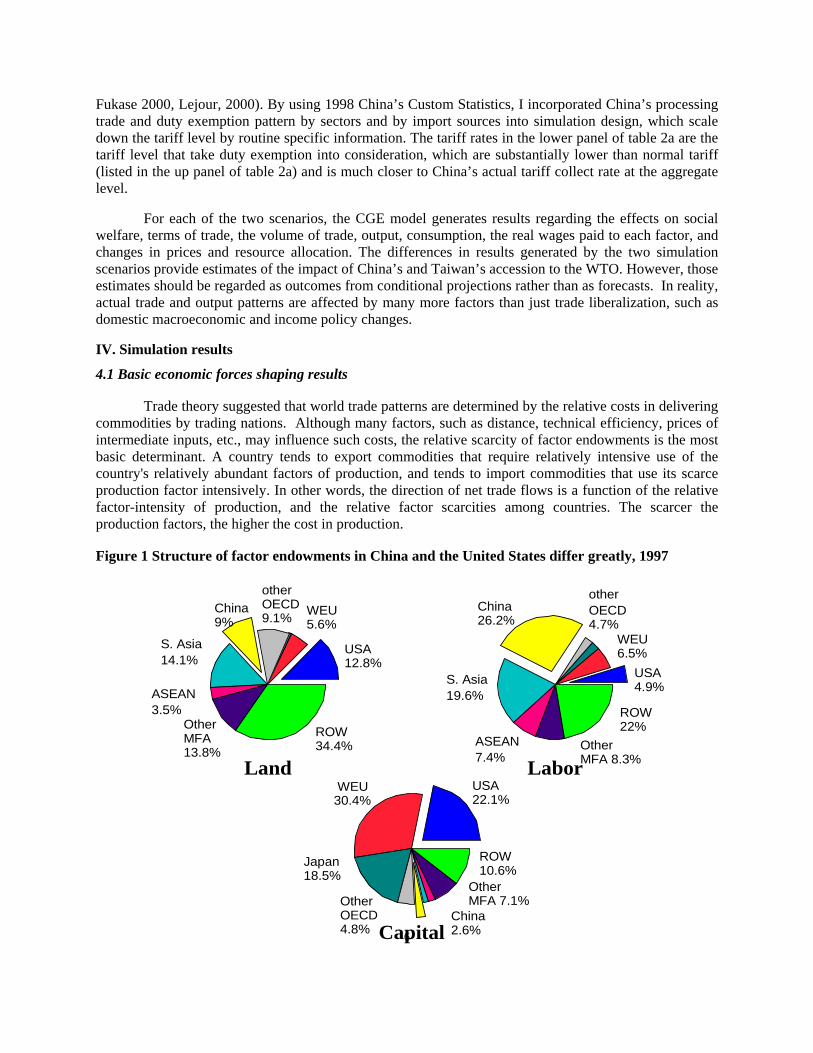
Figure 2 Countries with abundant land tend to export agricultural products, 1997
The relative scarcities of factor endowment in trading nations are quite important for understanding the direction of net trade flows. Figure 2 presents the correspondence between land intensity and direction of net trade flows in four broad categories of food and agricultural products. It shows clearly that the United States, Canada, and Australia/New Zealand as land abundant countries which are net exporters in almost all food and agricultural products, especially those land intensive products such as grains, cotton and oilseeds. It also shows that Japan, Korea, Singapore, Hong Kong, and Taiwan as land scarce economies which are net importers of all food and agricultural products. Western Europe, Mexico and other Latin American MFA restricted countries, ASEAN and South Asia with intermediate land endowments, are net exporters and net importers of different agricultural products. The European countries are net exporters of meat and milk products, and processed food, but net importers of land intensive products. ASEAN, South Asia and other MFA restricted countries are net exporters of non-grain crops, and process food, which is often labor-intensive, but net importers of land-intensive agricultural products.
Net Agricultural Trade
-40 -30 -20 -10 0 10 20 30 Billion of 1997 Dollars
Land-intensive Other Dairy & Meat Proceessed FoodLand Intensity
AUS/NZL
Canada
USA
Other MFA
Mexico
Caribbean
W. Europe
S. Asia
ASEAN
China
Taiwan
Korea
Japan
Hong Kong
Singopare
0 1 2 3 4 5 6Hectares per Worker
8
China also seems consistent with this pattern as its market forces play a more and more important role in determining production and trade driven by its market oriented economic reform. As a land scarce economy, it is a net importer of land intensive agricultural products, but a net exporter of labor-intensive agricultural commodities such as non-grain crops. The on-going domestic economic reform and trade liberalization as China implements its WTO commitment, will reinforce market forces and push China’s agricultural production and trade further away from its current grain self-sufficiency policy in the years to come.
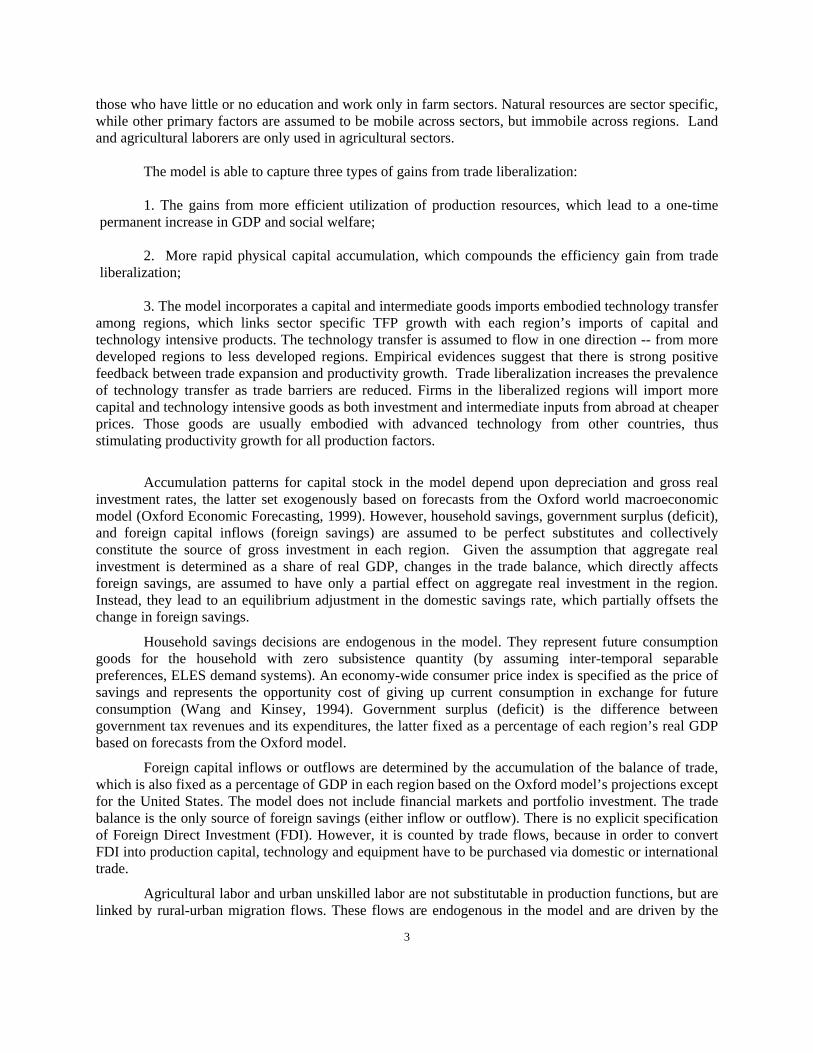
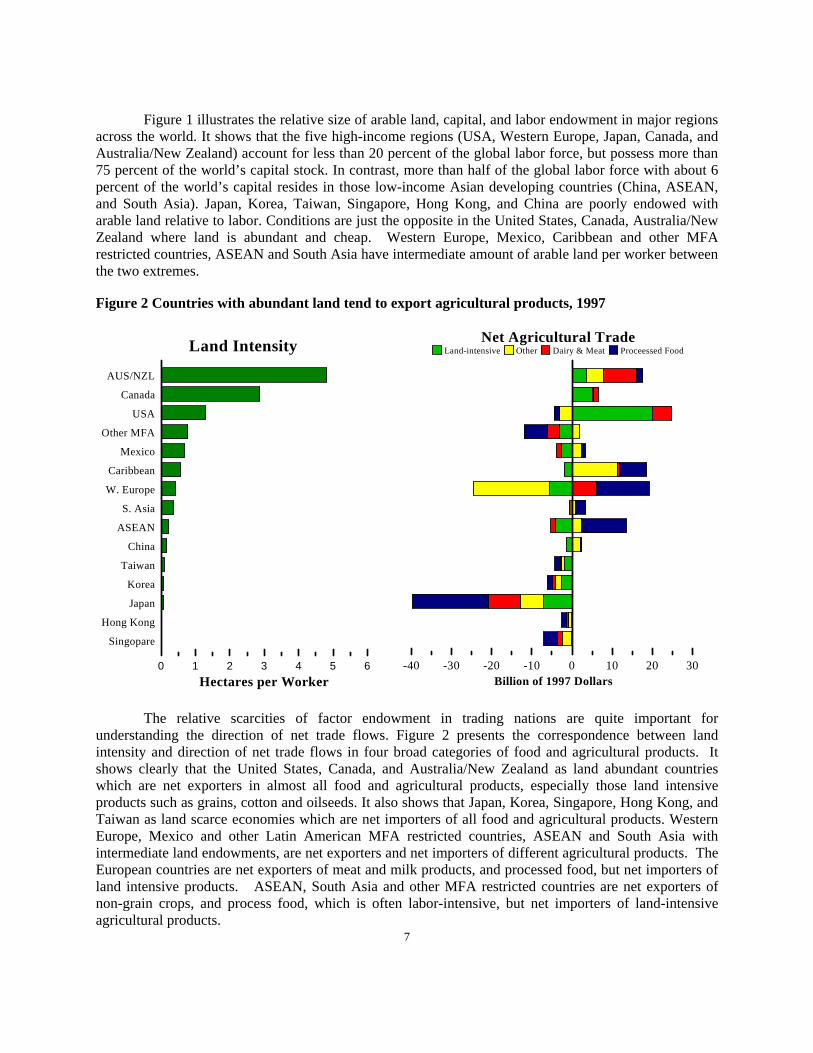
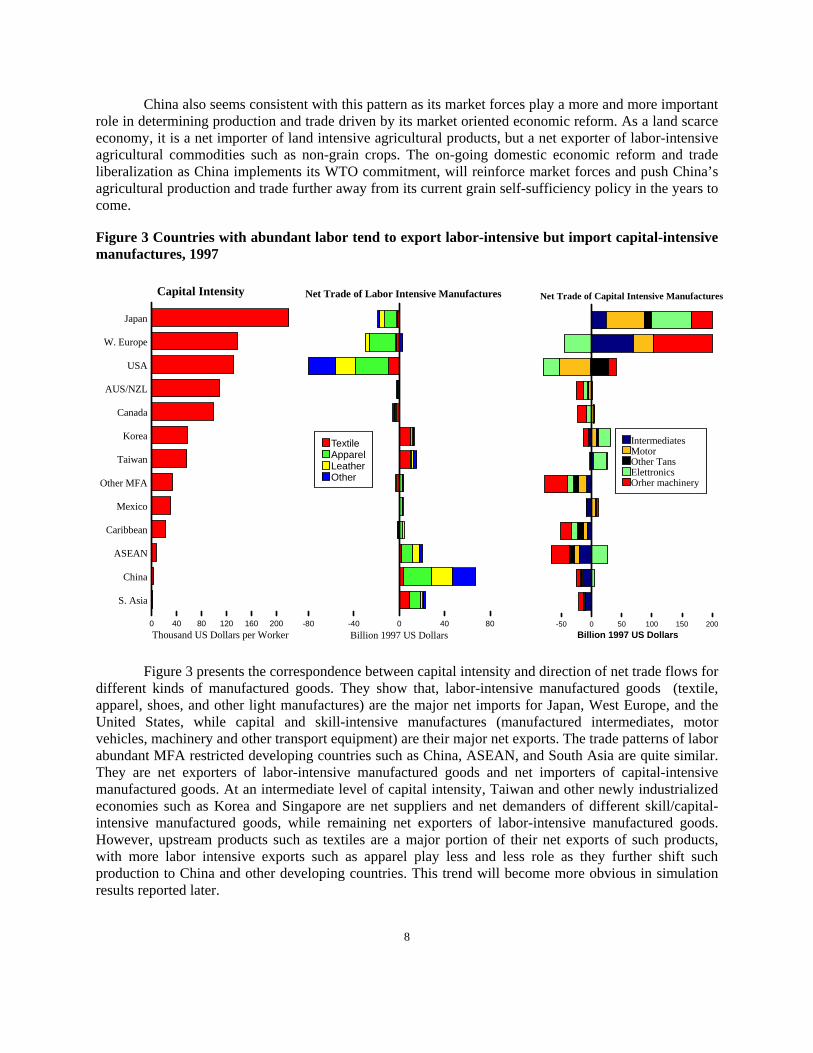
Figure 3 Countries with abundant labor tend to export labor-intensive but import capital-intensive manufactures, 1997
Figure 3 presents the correspondence between capital intensity and direction of net trade flows for different kinds of manufactured goods. They show that, labor-intensive manufactured goods (textile, apparel, shoes, and other light manufactures) are the major net imports for Japan, West Europe, and the United States, while capital and skill-intensive manufactures (manufactured intermediates, motor vehicles, machinery and other transport equipment) are their major net exports. The trade patterns of labor abundant MFA restricted developing countries such as China, ASEAN, and South Asia are quite similar. They are net exporters of labor-intensive manufactured goods and net importers of capital-intensive manufactured goods. At an intermediate level of capital intensity, Taiwan and other newly industrialized economies such as Korea and Singapore are net suppliers and net demanders of different skill/capital-intensive manufactured goods, while remaining net exporters of labor-intensive manufactured goods. However, upstream products such as textiles are a major portion of their net exports of such products, with more labor intensive exports such as apparel play less and less role as they further shift such production to China and other developing countries. This trend will become more obvious in simulation results reported later.
Capital Intensity
Japan
W. Europe
USA
AUS/NZL
Canada
Korea
Taiwan
Other MFA
Mexico
Caribbean
ASEAN
China
S. Asia
0 40 80 120 160 200Thousand US Dollars per Worker
Net Trade of Labor Intensive Manufactures
-80 -40 0 40 80Billion 1997 US Dollars
TextileApparelLeatherOther
Net Trade of Capital Intensive Manufactures
-50 0 50 100 150 200Billion 1997 US Dollars
IntermediatesMotorOther TansElettronicsOrher machinery
9
Numerous studies (Gereffi, 1998) noticed the important role that Asian NIEs have played in the system of global division of labor along a world commodity production chain that spans many economies, with each economy performing certain tasks in which it has a comparative advantage. The developed countries usually provide high-technology software and hardware for the NIEs because of their supper R&D capabilities. In turn, the NIEs provide intermediates and capital goods for their directly invested firms in a developing country because of their manufacturing technology and management expertise, while developing countries produce and export finished goods such as apparel or electronic products to developed countries because their cheap labor and raw materials. Obviously, industrial countries such as the United States and China are generally not competing economically for international trade at their current stage of development because their comparative advantages differ greatly. Their different factor endowment structures and difference in technology development make their trade complementary. Other developing countries compete with each other and with China for exporting labor-intensive goods and electronic products in industrial countries, and to attract FDI from those countries. Similarly, Japan, Western Europe, and the United States compete to meet the demand for technology/capital-intensive goods markets in China and other developing countries, and to benefit from investment opportunities there.
The structure of factor endowments in China, Taiwan and their major trading partners as well as their position in the system of the world division of labor is also the basic economic force shaping the direction of impact of China’s and Taiwan’s WTO entry on the world production and trade. Joining the WTO, especially when industrial countries eliminate restrictions on imports of labor-intensive manufactures such as textile and apparel from China, would further realize China’s comparative advantage in producing such goods and increase its net exports. The expansion of labor-intensive manufactures in China would cause resources to be bid away from farming and drive up demand for agricultural and capital/technology intensive goods. This would increase China’s net agricultural and capital/technology intensive imports and push up world market prices for such products. The opposite impact would occur to most developed economies because of their different endowment structures. Developing countries whose endowment structures are similar to China’s will encounter keener competition in world labor-intensive goods markets and face lower prices for their exports.
The impact of China’s and Taiwan’s WTO accession is also affected by China’s and Taiwan’s current import protection structure and the structure of tariff cut in their WTO offers (which is listed in Table 2a and 2b respectively). The larger the initial distortion, the deeper the tariff cuts in the offers, the greater the induced impact. However, the relative factor scarcity and intensity in production discussed above are the more fundamental force driving the impact and its resulted adjustment pattern in the world economy. Production resources will be released from those previously highly protected industries in China and Taiwan, and draw into sectors where China and Taiwan have comparative advantages, thus enabling them to become a more efficient supplier in world manufacture goods market.
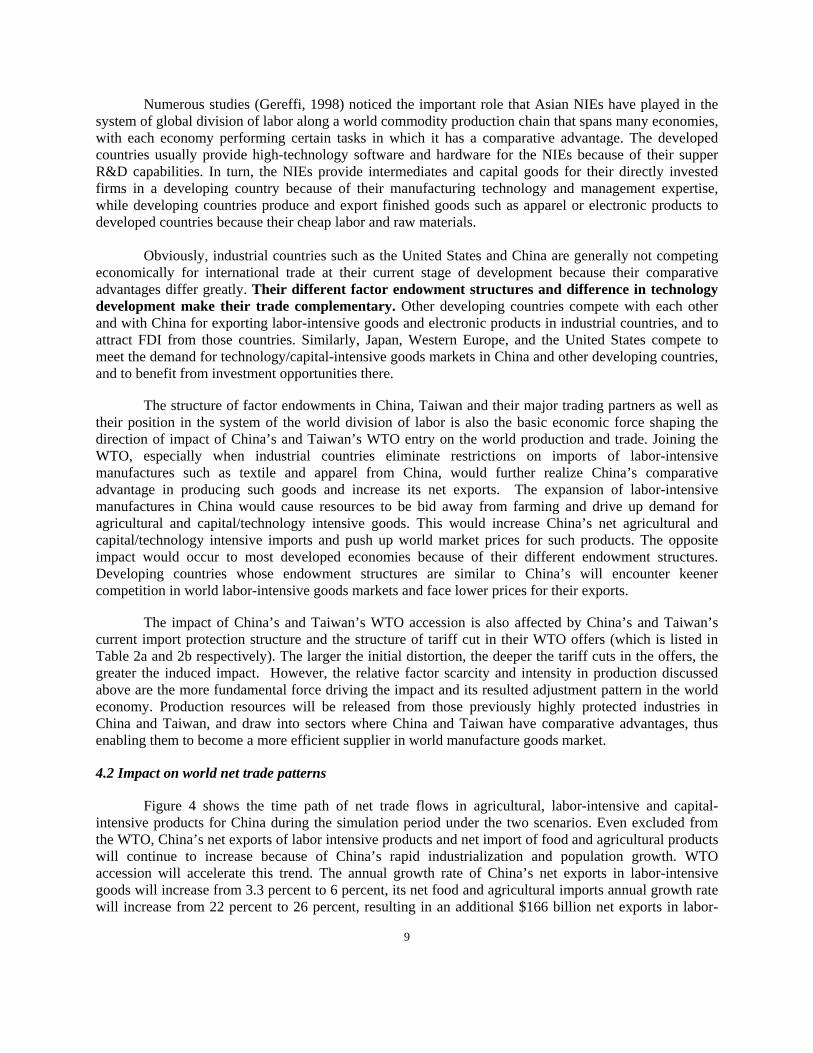
4.2 Impact on world net trade patterns
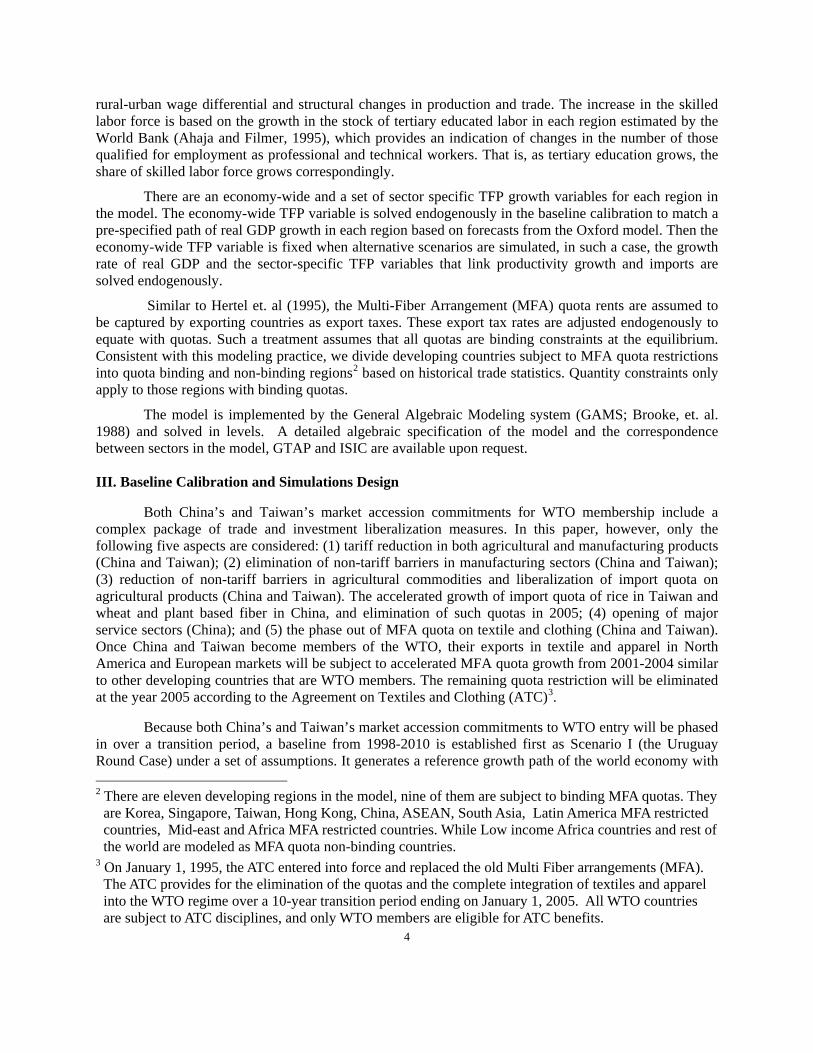
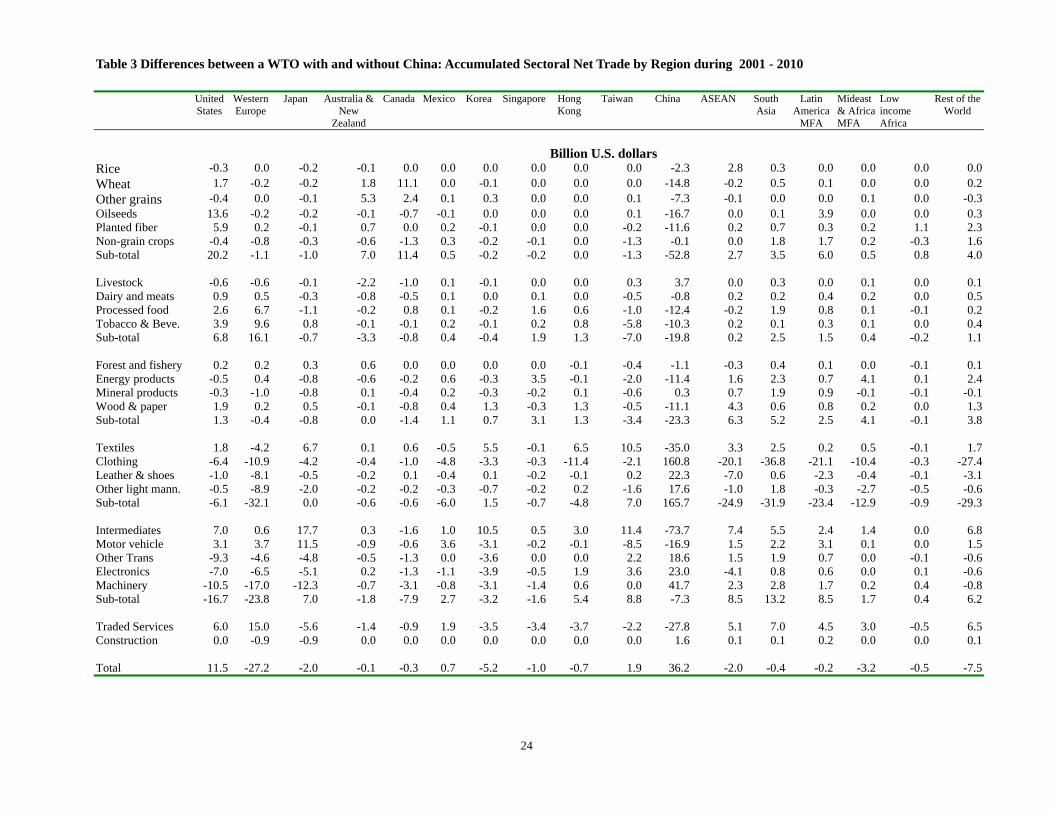
Figure 4 shows the time path of net trade flows in agricultural, labor-intensive and capital-intensive products for China during the simulation period under the two scenarios. Even excluded from the WTO, China’s net exports of labor intensive products and net import of food and agricultural products will continue to increase because of China’s rapid industrialization and population growth. WTO accession will accelerate this trend. The annual growth rate of China’s net exports in labor-intensive goods will increase from 3.3 percent to 6 percent, its net food and agricultural imports annual growth rate will increase from 22 percent to 26 percent, resulting in an additional $166 billion net exports in labor-
10
intensive manufacture and $73 billion additional net imports in food and agricultural products during the 10 year simulation period (Table 3). In the same period, China's net imports in capital- intensive products will increase by 7 billion because its WTO accession (table 3), although there is a general declining trend in China’s net capital-intensive imports over time under both simulation scenarios. It is interesting to note from table 3 that China’s net exports on three categories of finished capital-intensive manufactured goods will increase during the 10-year simulation period. They are electronics ($23 billion), machinery ($42 billion) and other transportation equipment ($19 billion), and those products would replace part of net exports previously from OECD countries. At the same time, China’s net imports on manufactured intermediates will dramatically increase by $74 billion, especially from Japan, United Sates, Taiwan and other Asia NICs. This pattern of net trade changes is consistent with the important character of China’s manufacturing exports: it is dominated by processing trade with high imported contents fueled by FDI inflow. Firms in U.S., Japan and Asian NICs provide China with intermediate and capital goods accompanied with their FDI to China, and China serves as the production and assembling base for those countries and export finished final products to developed country markets. In the earlier stage of China’s economic reform, it is concentrated in the labor-intensive sector and now is happening in the above mentioned three categories of capital intensive products5.
Figure 4 Impact of WTO accession on China's net trade patterns – agricultural, labor and capital intensive products, 2001-2010
Where would those additional net labor-intensive exports from China go and where would those additional net imports in food and agricultural products by China come from? Table 3 shows that part of those increased labor intensive exports from China will go to markets in industrial countries, where import demand increases because of the elimination of MFA quotas, while part of them are substitutes of net exports originally from other MFA restricted developing countries in Asia and Latin America (more than 70 percent). Table 3 also shows that a large part of those increased net import of land-intensive agricultural products to China after it joins the WTO will come from land abundant developed countries 5 Based on China Custom statistics, 93 percent of China’s electronic equipment exports was process exports in 1998, while
the numbers for other machinery and other transport equipment were 71 and 77 percent respectively.
2000 2001 2002 2003 2004 2005 2006 2007 2008 2009 2010
-60
-40
-20
0
20
40
60
80
100
120
Billi
ons
1997
US
Dol
lars
Baseline-Capital Intensive Baseline-Labor Intensive Baseline-Agri.&Food
Accession-Capital Intensive Accession-Labor Intensive Accession-Agri.&Food
11
such as Australia, Canada and the United States, but a significant portion (about a third) of them will come from other developing countries. The major underlying reason is that China’s entry to the WTO diverts exports of labor-intensive products from other developing countries to China. The labor-intensive sectors in those regions cannot attract as many production resources as they could when WTO excludes China and Taiwan because of reduced profitability from lower world prices for their manufacturing exports. Therefore, more factors of production will remain in those countries’ agricultural sectors. At the same time, the increased agricultural import demand from China and Taiwan pushes up world food prices, agricultural exports become relatively profitable and agricultural imports become relative expensive. It results in an expansion of production and exports of agricultural products in those countries (remember most of those countries have an intermediate agricultural land endowment in figure 2, i.e. they have a higher land/labor ratio than China). However, the increase of production in labor-intensive sectors in China also demands more manufactured inputs from the world market, causing the manufacturing sector to expand and agriculture production to decline in Japan, Korea and Taiwan, thus increasing their net import demand for food and agricultural products, as shown in Table 3. Another underlying reason for this disparity other than relative scarcity of agricultural production factors in those countries is that they are in a higher stage of economic development and have the technology to produce what China’s manufacturing sector demands. Because of their lower stage of economic development, most developing countries do not have such capacity or are not able to produce what China’s manufacture sector needs at a competitive cost.
Why does China’s net imports in capital-intensive products show a declining trend over time in both simulation scenarios (figure 4)? It indicates that exports in some capital-intensive products from China are rising and there is an industrial upgrade process going on as China continues to grow and industrialize. There are three fundamental factors that contribute to this trend. First, there are quantitative constraints such as MFA quotas in developed countries’ markets that limit China’s growth potential in producing labor-intensive products and cause China to divert its production resources to other manufacturing activities, including capital-intensive sectors. Second, China was undergoing rapid investment growth and capital accumulation during the last decade. During 1991-2000, China was the largest FDI recipient among developing countries, with over $320 billion FDI inflows. The direct impact is the booming of capital-intensive manufacturing industries. As trade theory points out, an increase in the supply of capital will lead to an increase in the output of the sector which uses capital intensively, and a reduction in the output in other sectors that use other factors intensively (Rybczynski theorem). Finally, as mentioned earlier, China’s manufacturing exports usually contain very high import contents with low value-added rates because the rapid growth of processing trade in recent years, which may exaggerate the extent of industrial upgrade in China’s exports.6 Joining the WTO cannot fundamentally change this trend, because China ultimately will upgrade its industrial structure during its modernization, as most newly industrialized countries are doing now. But as both Figure 4 and Table 3 show, joining the WTO will increase China’s net imports in capital-intensive products about $7 billion over the 10-year simulation period. This is because the expansion of labor-intensive sector will bid productive resources away from capital-intensive production on the one hand, and increase domestic demand for such products on the other hand, causing exports to decline and imports to increase.
6 For example, the largest items of electronics exports in 1995 were radio cassette players and telephone sets. They are produced from imported semi-processed materials and assembled by spare parts from abroad for re-exports. The portion of production process conducted in China was basically labor intensive in nature.
12
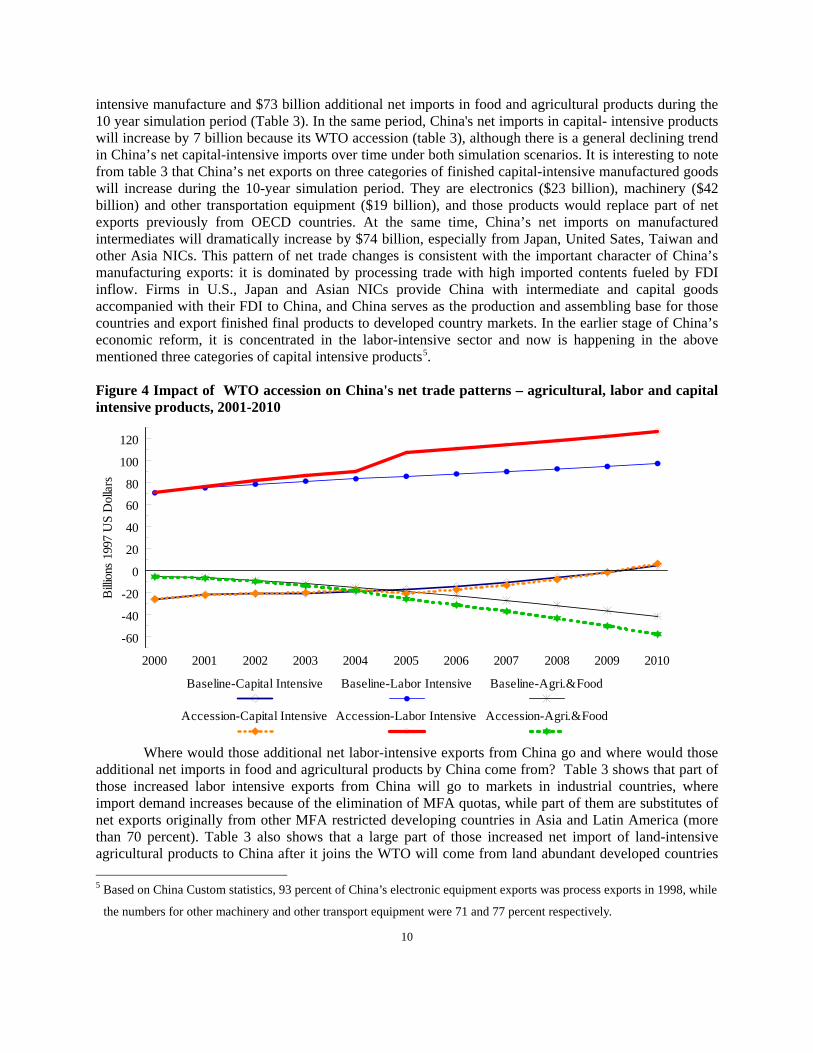
4.3 Aggregate and growth effects
The expansion of trade accelerates economic growth, increases real purchasing power for households. Table 4 summarizes major aggregate economy-wide effects between a WTO with and without China and Taiwan. Admitting China and Taiwan into the WTO will accelerate world economic growth, the average annual growth rate of world real GDP would be 0.02 percentage point higher and the total accumulated world GDP growth would be 0.22 percentage point higher in 2010 than that in the baseline scenario. However, the strongest stimulus to economic growth occurs to China and Taiwan. China's real GDP growth would increase by 0.15 percentage point (0.03 percentage points for Taiwan) a year from 2001 to 2010, and 2.9 percentage points higher (0.5 percentage points higher for Taiwan) in 2010 than the case if they are excluded from WTO. Real GDP growth in all developed countries and most developing countries also increases from China and Taiwan’s WTO accession. Those increases may seem small in annual terms, however, they are notable if accumulated over the whole simulation period. By 2010, real GDP would be 0.21 percent higher in the United States and 0.15 percent higher in West Europe than in the case of a WTO without China and Taiwan. Newly Industrialized Economies such as Singapore, Hong Kong, and Korea that have a closer tie with China and Taiwan will benefit more and grow faster because of China’s and Taiwan’s WTO accession. Certain developing countries that have a endowment and export structure similar to China’s, will be slightly negatively affected, especially those MFA quota restricted countries in ASEAN, South Asia and South America. They have to divert resource from manufacture to food and agricultural products because stronger Chinese competition would reduce their potential export share in the world market. This result, however, may be partially due to the highly aggregate nature of textile and apparel sectors in the model. They are treated as two commodities. In the real economy, there are thousands of types of textile and apparel products. Developing countries that produce and export different types or less substitutable textiles and apparels compared with China will be less effected.
Figure 5 China is the biggest gainer in real purchasing power (real consumption and real investmnt adjusted by real trade balance ), the United States and rest of the world also gain -- Differences between WTO with and without China
2001 2002 2003 2004 2005 2006 2007 2008 2009 2010-20
0
20
40
60
80
100
Bill
ion
of 1
997
US.
Dol
lars
China Taiwan USA W. Europe Japan Other OECDAsia NICs ASEAN & S. Asia Mexico & Latin MFA Other MFA Low income Africa ROW
13
Those gains to economic growth from China's and Taiwan's trade liberalization are mainly generated from three sources that reinforce each other: (1) more efficient allocation of production factors through increased specialization according to each country’s comparative advantage, including the migration of additional agricultural labor to manufacture activities, which increase labor productivity. (2) More rapid physical capital accumulation, so that there will be more physical capital stock available in the economy; which compounds the efficiency gain, and (3) more rapid growth of TFP due to speeding technology transfer via expansion of capital and intermediate goods imports from advanced industrial countries. The additional capital accumulation and TFP growth in each region due to China’s and Taiwan's WTO accession are reported in the first half of Table 4. Since both China and Taiwan adopt dramatic liberalization measures to meet the WTO entry requirement in the simulation exercises, it is expected that they will subject to the largest impact from all the above three sources and gain the most from their WTO membership. For instance, physical capital accumulation in China will be 1.5 percent higher in year 2010 and 5.3 million additional agricultural laborers will become production workers in various manufacturing sectors over the 2001-2010 period if China is admitted into the WTO.
As classical trade theory indicates, removing trade distortions leads to further realization of each region’s comparative advantage, more efficient allocation of production factors, and expansion of trade. This type of efficiency gain is driven by each region’s comparative advantages, resulting in structural adjustment in each regional economy and reshaping world net trade pattern. In addition, there will be a strong positive feedback between trade expansion and productivity growth. As China expands its labor-intensive exports to the world market after joining the WTO, Chinese firms will import more capital and technology intensive goods as both investment and intermediate inputs from industrial counties. Those goods are usually embodied with advanced technology from other countries, thus stimulate productivity growth. The simulation results show that WTO membership will accelerate China’s TFP growth by about 0.12 percentage points a year, and contribute significantly to the additional real GDP growth due to its entry to the WTO over the whole simulation period.
Households in China and its major trade partners would benefit from further realization of each region's comparative advantage in a freer trade environment and faster economic growth. As shown in the second half of table 4 and figure 5, real purchase power measured by Hicksian equivalent variation rises in almost all regions across the world, about $47 billion a year on average for the world as a whole over 2001-2010 period. Similar to other trade liberalization exercises, the liberalizer – China and Taiwan, gain the most. However, the rest of the world also gains substantially, especially industrial countries. For example, the U.S. real purchasing power would increase more than $130 billion during the whole simulation period, and about $24 billion annually after 2010. Only MFA quota restricted developing counties in Asia, South America and Mexico loss slightly because trade will be diverted away from those countries to China after China’s WTO entry as discussed in the previous section.
Generally speaking, developed countries and newly industrialized economies in Asia would benefit relatively more than other developing countries from China’s WTO entry because of their factor endowment and stage of technology development are different from China. Favorable changes in international terms of trade induced by integrating China into the world market are another fundamental factor. As we discussed earlier, joining the WTO and obtaining the benefit of phasing out the MFA will enable China to dramatically increase its production and exports of labor intensive products, thus intensifying competition in the world market. This will in turn reduce export prices in developing countries and import prices in developed countries, the largest final market for such products. The expansion of China’s production and trade in labor intensive manufactures result in higher demand for capital and skill-intensive manufactured goods, thus driving up the world prices for such products, which are major exports from developed and newly industrialized countries. Such a world price movement
14
would improve international terms of trade for developed countries relative to developing countries (as shown in the bottom of table 4), thus enable them to benefit relatively more from China's WTO accession. However, terms of trade may also improve due to China and Taiwan’s WTO entry for those least developing countries whose development stage is behind China. This is because major exports from those countries are primary products, which will face a higher world price because the increased world demand, while the expansion of low-end capital and technology intensive manufacturing products from China and Taiwan to those countries will lower their import prices.
4.4 Impact on world labor--intensive markets and implications for other suppliers of such products
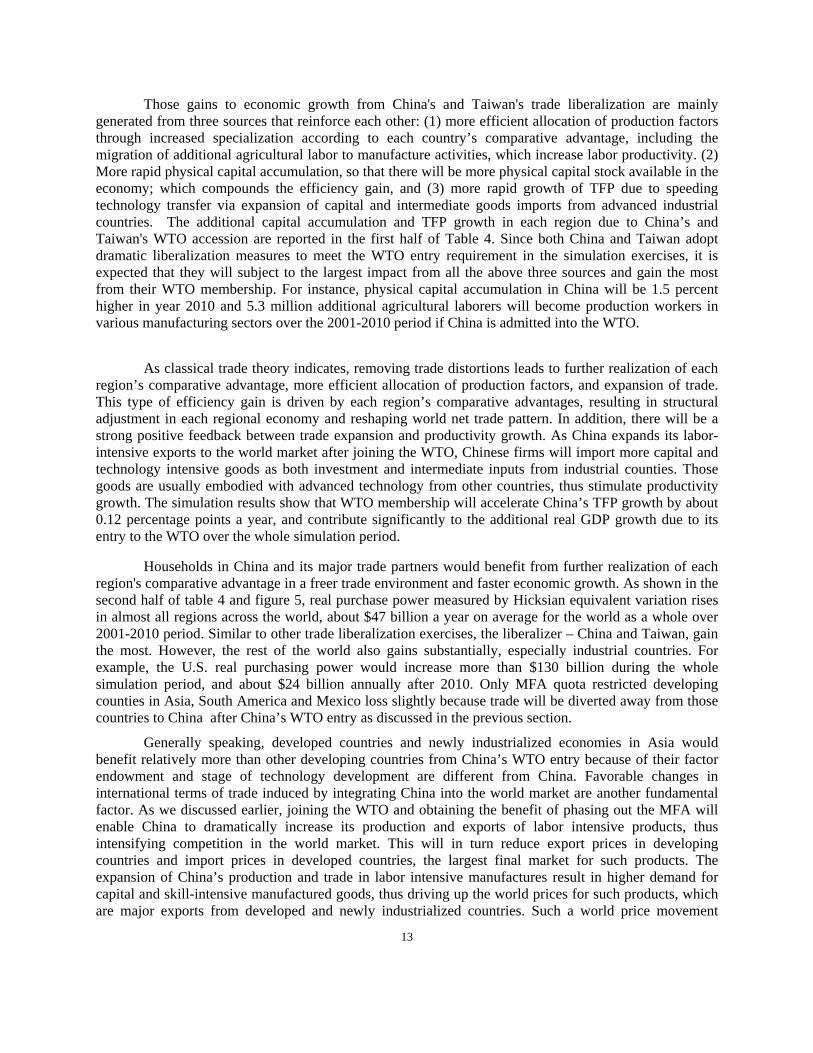
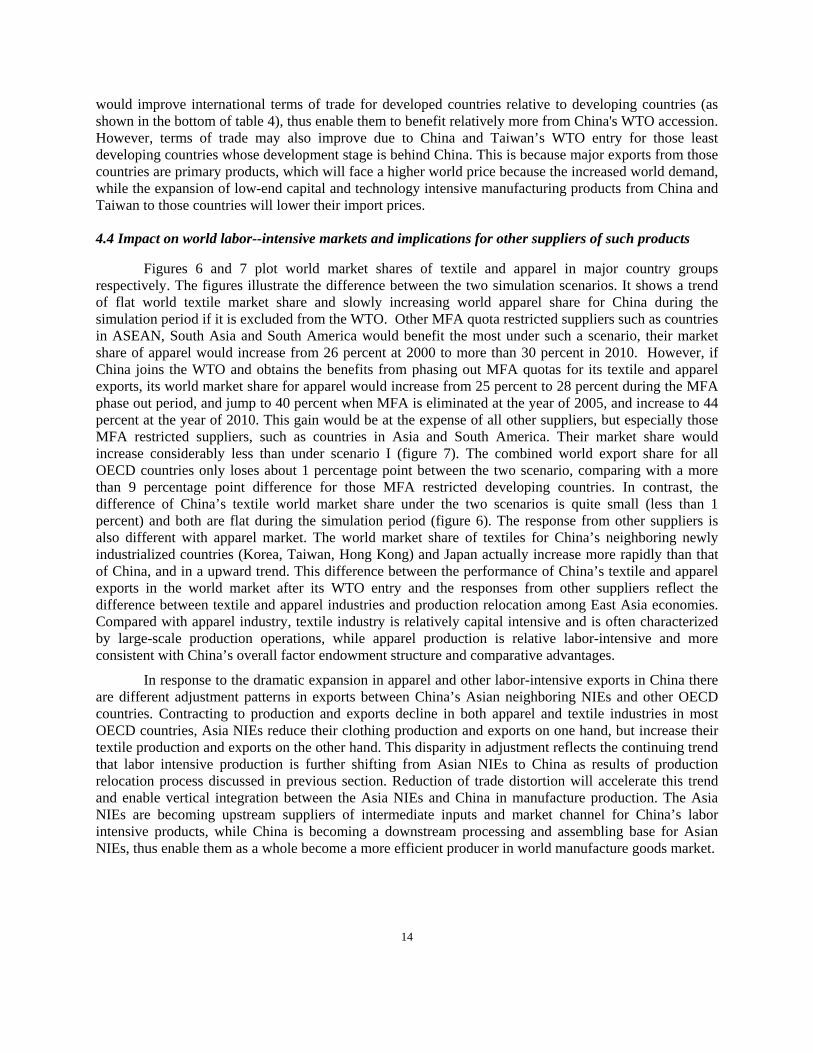
Figures 6 and 7 plot world market shares of textile and apparel in major country groups respectively. The figures illustrate the difference between the two simulation scenarios. It shows a trend of flat world textile market share and slowly increasing world apparel share for China during the simulation period if it is excluded from the WTO. Other MFA quota restricted suppliers such as countries in ASEAN, South Asia and South America would benefit the most under such a scenario, their market share of apparel would increase from 26 percent at 2000 to more than 30 percent in 2010. However, if China joins the WTO and obtains the benefits from phasing out MFA quotas for its textile and apparel exports, its world market share for apparel would increase from 25 percent to 28 percent during the MFA phase out period, and jump to 40 percent when MFA is eliminated at the year of 2005, and increase to 44 percent at the year of 2010. This gain would be at the expense of all other suppliers, but especially those MFA restricted suppliers, such as countries in Asia and South America. Their market share would increase considerably less than under scenario I (figure 7). The combined world export share for all OECD countries only loses about 1 percentage point between the two scenario, comparing with a more than 9 percentage point difference for those MFA restricted developing countries. In contrast, the difference of China’s textile world market share under the two scenarios is quite small (less than 1 percent) and both are flat during the simulation period (figure 6). The response from other suppliers is also different with apparel market. The world market share of textiles for China’s neighboring newly industrialized countries (Korea, Taiwan, Hong Kong) and Japan actually increase more rapidly than that of China, and in a upward trend. This difference between the performance of China’s textile and apparel exports in the world market after its WTO entry and the responses from other suppliers reflect the difference between textile and apparel industries and production relocation among East Asia economies. Compared with apparel industry, textile industry is relatively capital intensive and is often characterized by large-scale production operations, while apparel production is relative labor-intensive and more consistent with China’s overall factor endowment structure and comparative advantages.
In response to the dramatic expansion in apparel and other labor-intensive exports in China there are different adjustment patterns in exports between China’s Asian neighboring NIEs and other OECD countries. Contracting to production and exports decline in both apparel and textile industries in most OECD countries, Asia NIEs reduce their clothing production and exports on one hand, but increase their textile production and exports on the other hand. This disparity in adjustment reflects the continuing trend that labor intensive production is further shifting from Asian NIEs to China as results of production relocation process discussed in previous section. Reduction of trade distortion will accelerate this trend and enable vertical integration between the Asia NIEs and China in manufacture production. The Asia NIEs are becoming upstream suppliers of intermediate inputs and market channel for China’s labor intensive products, while China is becoming a downstream processing and assembling base for Asian NIEs, thus enable them as a whole become a more efficient producer in world manufacture goods market.
15
Figure 6 Changes in share of world textile market between a WTO with or without China , 2000-2010
Figure 7 Changes in share of world apparel market between a WTO with or without China, 2000-2010
2000 2001 2002 2003 2004 2005 2006 2007 2008 2009 20100
5
10
15
20
25
30
35
Shar
e of
Wor
ld E
xpor
ts
Baseline-China Baseline-Japan& ANICs Baseline-Other MFA Baseline-Other developing Baseline- Other OECD
Accession-China Accession-Japan & ANICs Accession-Other MFA Accession-Other Developing Accession- Other OECD
2000 2001 2002 2003 2004 2005 2006 2007 2008 2009 20100
10
20
30
40
50
Shar
e of
Wor
ld E
xpor
ts
Baseline-China Baseline-ANICs Baseline-Asia & S. America MFA Baseline-Other developing Baseline-OECD
Accession-China Accession-ANICs Accession-Asia & S. American MFA Accession-Other Developing Accession-OECD
16
4.6 Impact on China’s imports and implication for major land and capital–intensive product suppliers
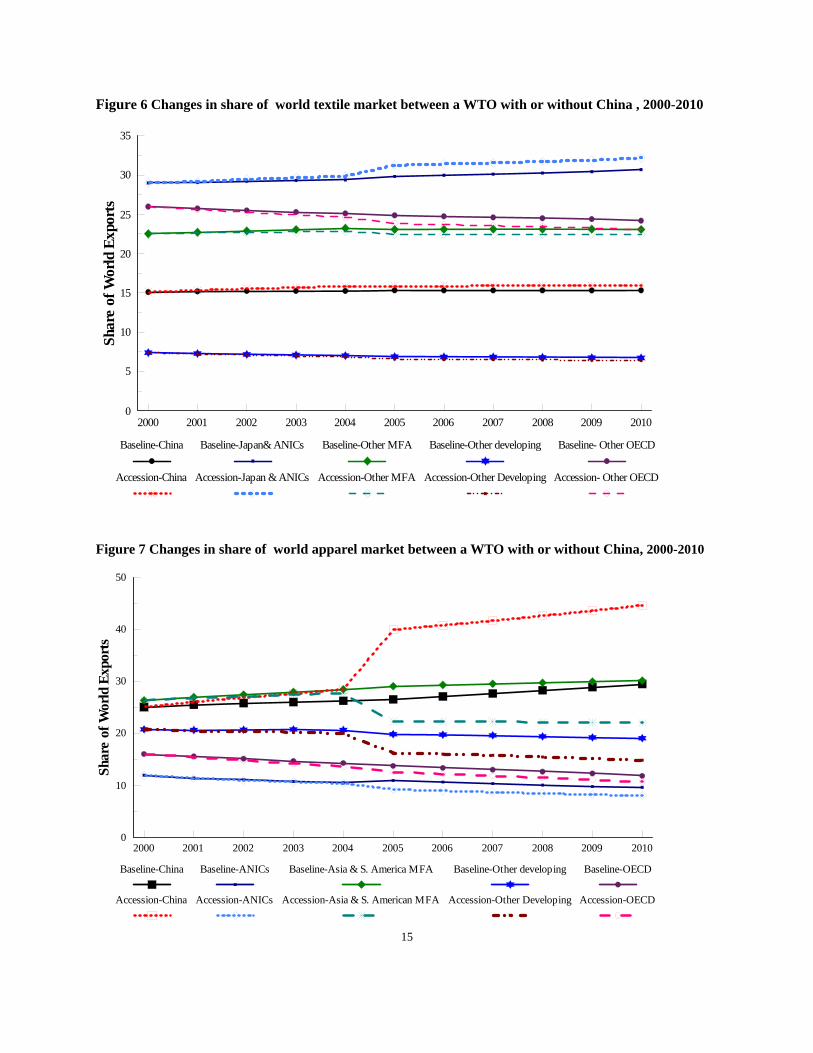
Entering the WTO, China will obtain the benefits from WTO membership such as the MFA quota phase out under the ATC in one hand, but also has to implement its commitment to further open its vast market to all its trade partners in the other hand. The reduction of import protection and expansion of labor-intensive manufacture will stimulate China’s imports, especially in land and capital intensive products. Figure 8 illustrates the difference in China’s real food and agricultural imports between the two scenarios by sectors, time and geographical origin. It shows that if China enter the WTO on the beginning of 2001 and fulfil its major market access commitment to date by 2005, its total imports of food and agricultural products will increase by about 82 billion over the 10-year simulation period. More than 60 percent of those imports are land-intensive products (grains, oilseeds and plant fiber). Only about 10 percent of the total gains by world agricultural product suppliers occur during the first four years, when the quota system on wheat and cotton still in place despite China’s commitment on tariff reduction is concentrated during the first four years. It implies that quantity constraints and non-tariff barriers have more profound impact on agricultural imports than tariffs in China. The geographical distribution of those gains is consistent with the factor endowment structure of those supplier countries. All land abundant major agricultural commodity suppliers (Australia/New Zealand, Canada, and the United States) gain significantly, with about a third of those gains go to the United States alone. While countries with a relatively lower land endowment such as W. Europe mainly benefit from exporting products that are less land-intensive such as processed food and beverages. Developing countries with intermediate endowment of arable land also export more land intensive products to China because labor-intensive manufacturing activities become relative less profitable for them due to China’s WTO entry.
Figure 8 Difference of China’s imports in food and agricultural products between a WTO with or without China, 2001-2010
Because current size of China’s trade is only about 5 percent of world total, the change in China’ exports and imports due to WTO entry will only have a moderate impact on the world market in general.
2001
2002
2003
2004
2005
2006
2007
2008
2009
2010
0 5 10 15
Grains Oilseeds Plant fiber Other cropsLivestock Dairy & meats Processed food Berverage & Tabacco
S. Africa
ASEAN & S. Asia
S. America
ROW
Japan & ANICs
Austrilian
Canada
W. Eroupe
United States
0 5 10 15 20 25 30
Grains Oilseeds Plant fiber Other cropsLivestock Dairy & meats Processed food Berverage & Tabacco
17
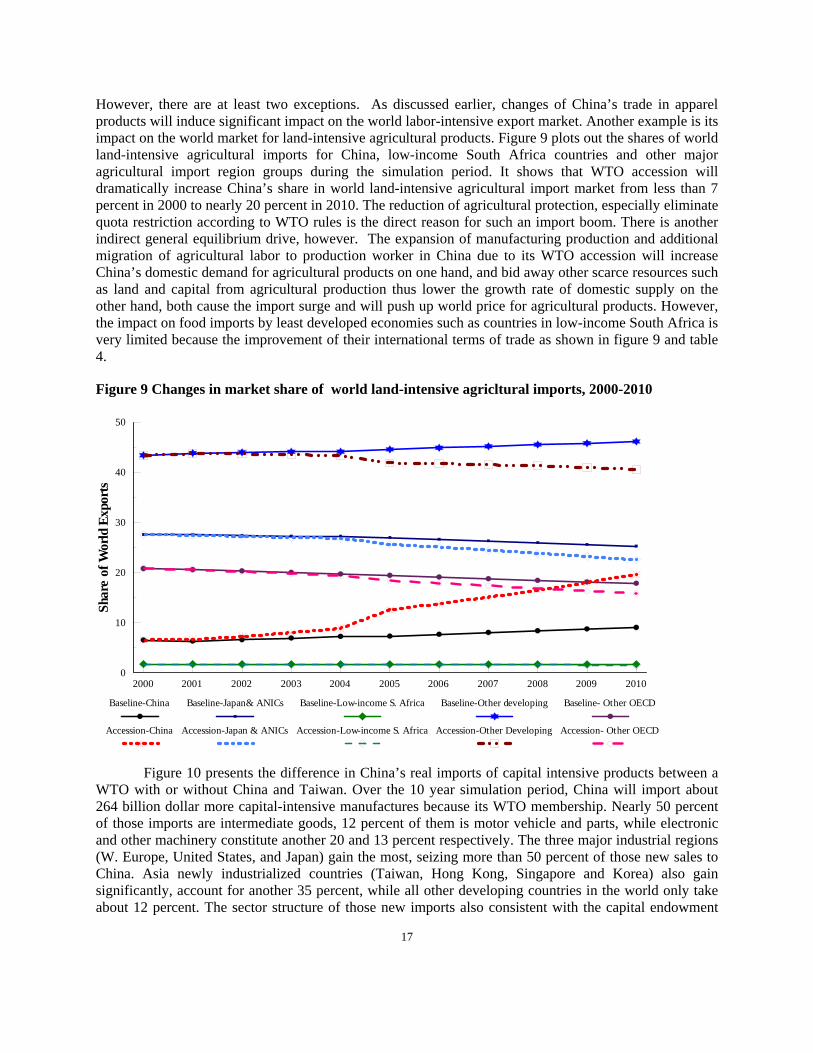
However, there are at least two exceptions. As discussed earlier, changes of China’s trade in apparel products will induce significant impact on the world labor-intensive export market. Another example is its impact on the world market for land-intensive agricultural products. Figure 9 plots out the shares of world land-intensive agricultural imports for China, low-income South Africa countries and other major agricultural import region groups during the simulation period. It shows that WTO accession will dramatically increase China’s share in world land-intensive agricultural import market from less than 7 percent in 2000 to nearly 20 percent in 2010. The reduction of agricultural protection, especially eliminate quota restriction according to WTO rules is the direct reason for such an import boom. There is another indirect general equilibrium drive, however. The expansion of manufacturing production and additional migration of agricultural labor to production worker in China due to its WTO accession will increase China’s domestic demand for agricultural products on one hand, and bid away other scarce resources such as land and capital from agricultural production thus lower the growth rate of domestic supply on the other hand, both cause the import surge and will push up world price for agricultural products. However, the impact on food imports by least developed economies such as countries in low-income South Africa is very limited because the improvement of their international terms of trade as shown in figure 9 and table 4.
Figure 9 Changes in market share of world land-intensive agricltural imports, 2000-2010
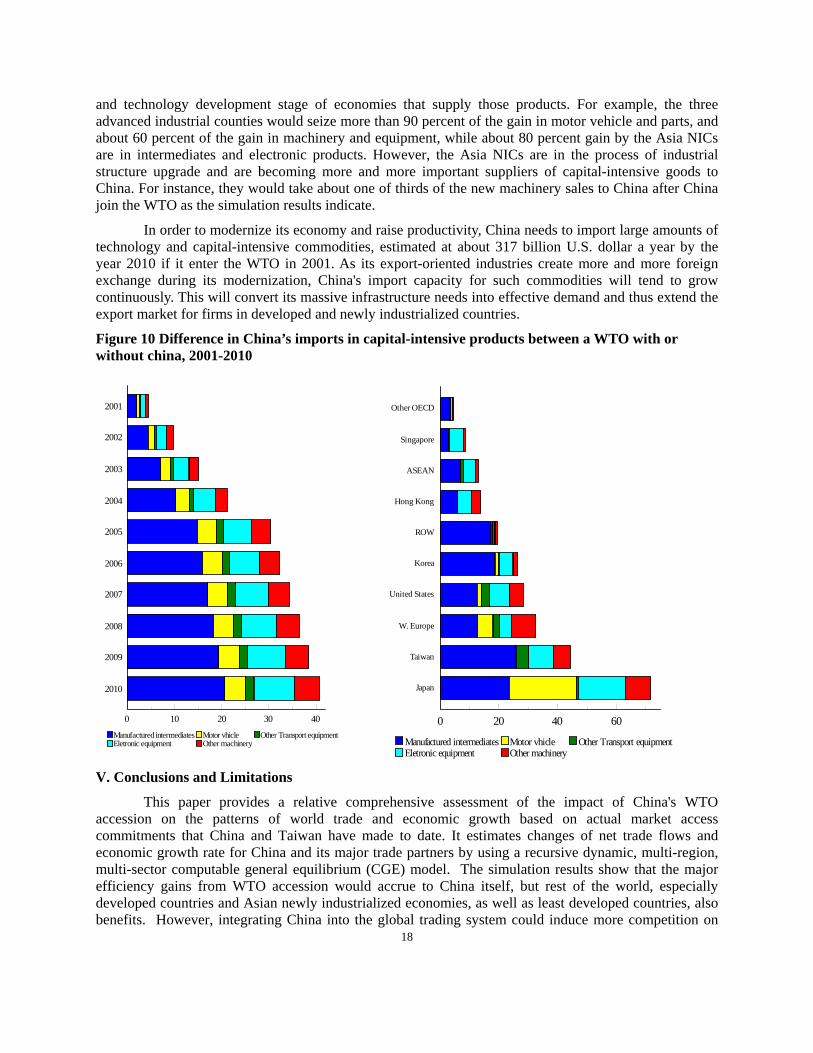
Figure 10 presents the difference in China’s real imports of capital intensive products between a WTO with or without China and Taiwan. Over the 10 year simulation period, China will import about 264 billion dollar more capital-intensive manufactures because its WTO membership. Nearly 50 percent of those imports are intermediate goods, 12 percent of them is motor vehicle and parts, while electronic and other machinery constitute another 20 and 13 percent respectively. The three major industrial regions (W. Europe, United States, and Japan) gain the most, seizing more than 50 percent of those new sales to China. Asia newly industrialized countries (Taiwan, Hong Kong, Singapore and Korea) also gain significantly, account for another 35 percent, while all other developing countries in the world only take about 12 percent. The sector structure of those new imports also consistent with the capital endowment
2000 2001 2002 2003 2004 2005 2006 2007 2008 2009 20100
10
20
30
40
50
Shar
e of
Wor
ld E
xpor
ts
Baseline-China Baseline-Japan& ANICs Baseline-Low-income S. Africa Baseline-Other developing Baseline- Other OECD
Accession-China Accession-Japan & ANICs Accession-Low-income S. Africa Accession-Other Developing Accession- Other OECD
18
and technology development stage of economies that supply those products. For example, the three advanced industrial counties would seize more than 90 percent of the gain in motor vehicle and parts, and about 60 percent of the gain in machinery and equipment, while about 80 percent gain by the Asia NICs are in intermediates and electronic products. However, the Asia NICs are in the process of industrial structure upgrade and are becoming more and more important suppliers of capital-intensive goods to China. For instance, they would take about one of thirds of the new machinery sales to China after China join the WTO as the simulation results indicate.
In order to modernize its economy and raise productivity, China needs to import large amounts of technology and capital-intensive commodities, estimated at about 317 billion U.S. dollar a year by the year 2010 if it enter the WTO in 2001. As its export-oriented industries create more and more foreign exchange during its modernization, China's import capacity for such commodities will tend to grow continuously. This will convert its massive infrastructure needs into effective demand and thus extend the export market for firms in developed and newly industrialized countries.
Figure 10 Difference in China’s imports in capital-intensive products between a WTO with or without china, 2001-2010
V. Conclusions and Limitations
This paper provides a relative comprehensive assessment of the impact of China's WTO accession on the patterns of world trade and economic growth based on actual market access commitments that China and Taiwan have made to date. It estimates changes of net trade flows and economic growth rate for China and its major trade partners by using a recursive dynamic, multi-region, multi-sector computable general equilibrium (CGE) model. The simulation results show that the major efficiency gains from WTO accession would accrue to China itself, but rest of the world, especially developed countries and Asian newly industrialized economies, as well as least developed countries, also benefits. However, integrating China into the global trading system could induce more competition on
2001
2002
2003
2004
2005
2006
2007
2008
2009
2010
0 10 20 30 40
Manufactured intermediates Motor vhicle Other Transport equipmentEletronic equipment Other machinery
Other OECD
Singapore
ASEAN
Hong Kong
ROW
Korea
United States
W. Europe
Taiwan
Japan
0 20 40 60
Manufactured intermediates Motor vhicle Other Transport equipmentEletronic equipment Other machinery
19
labor-intensive products and reduce their prices. The expansion of labor-intensive sectors in China could increase its net imports on agricultural and capital-intensive products, drive up their price, thus improving industrial and land abundant countries’ terms of trade. Some developing countries with a similar endowment structure as China, like those in South America and Southeast Asia, would experience keener competition in labor-intensive exports and lower prices for their products. More production factor will remain in their food and agricultural sectors and increase their net agricultural exports.
The simulation results also show that China's WTO entry will have profound impact on world
labor-intensive export and primary agricultural import market. Its world market share of apparel extends by about 15 percentage points, reduce other countries, especially those MFA restricted countries’ share in the world market. China also increases its land-intensive agricultural imports dramatically, its share in total world imports more than doubled. However, its impact on food import least developed countries is very limited because the expansion of agricultural production worldwide and improvement of international terms of trade for those countries.
The results of this paper provide useful insights in understanding the impact of China’s accession to
the WTO and demonstrate that CGE model can be a valuable tool for trade policy evaluation. However, there are several obvious limitations that need to be mentioned. First, it does not take into account other major aspects of WTO membership, such as reduction of barriers in foreign investment, protection of intellectual property rights, securing market access, enforcement of commitment, and cooperation in dispute settlement. It at best captures only one aspect of the issue at hand. Second, China has not yet finalized all terms of its WTO entry when this analysis was finished. There are still uncertainties in the size of its trade concessions, the time schedule of implementation for each of the liberalization measures, and the length of the phase-in period, especially in regard to quantitative restriction on imports and barriers to service trade. A relatively stylized representation of trade liberalization measures in these areas was adopted in the simulation design. Third, the CGE model used in this paper is a highly stylized simplification of the world economy, and is far from perfect (Wang, 1997a). Finally, there are uncertainties about the size of parameters, such as elasticities of substitution of products from different sources and elastcities between capital goods imports and TFP growth. The actual size of the impact is very sensitive to those key parameters. Therefore, the results reported in this paper need to be interpreted with caution: they can be viewed as indicative but not as precise real outcomes.
20
References
Ahuja, V. and D. Filmer (1995), ‘Educational Attainment in Developing Countries: New Estimates and Projections Disaggregated by Gender’, World Bank Policy Research Working Paper 1489, Washington D.C.
Gilbert, John and Thomas Wahl (2000), ‘Applied General Equilibriun Assessments of Trade liberalization in China’, paper presented at the workshop China’s Accession to the WTO: An Overview of Recent Analyses, CPB Nethelands bureau for Economic Policy Analysis and Chinese Academy of Social Sciences, Beijing, China, October 19-20.
Hoekman Bernard (1995), ‘Assessing the General Agreement on Trade in Services’, in Martin, Will, and Alan Winters (eds), The Uruguay Round and the Developing Economies, World Bank Discussion Paper 307.
Hertel, Thomas, Will Martin, Koji Yanagishima, and Betina Dimaranan (1995) ‘Liberalizing Manufactures Trade in a Changing World Economy’, in Martin, Will and Alan Winters (eds), The Uruguay Round and the Developing Economies, World Bank Discussion Papers 307.
Ianchovichina, Elena, Will Martin and Emiko Fukase “Comparative Study of Trade Liberalization Regimes: The case of China ‘s Accession to the WTO.” Paper presented at the third conference of Global Economic Analysis, Melbourne, Australia, June 20-30, 2000.
Lejour, Arjan, “China and the WTO: the impact on China and the world economy.” Paper presented at the third conference of Global Economic Analysis, Melbourne, Australia, June 20-30, 2000.
Linkins, Linda (1999), ‘ Estimating the Tax Equivalents of U.S. Textile and Apparel Quotas’, Research Note No. 99-08-A, Office of Economics, U.S. International Trade Commission.
Li, Shantong, Zhi Wang, Fan Zhai and Lin Xu (1998) ,‘The Global and Domestic Impact of China joining the World Trade Organization’, Washington Center for China Studies and Development Research Center, the State Council, People’s Republic of China, December.
Martin, will (2001) “Implication of Reform and WTO Accession for China’s Agricultural Trade Policies”, Forthcoming, Journal of Economic Transition.
Oxford Economic Forecasting (1999), The Oxford World Macroeconomic Model, An Overview. Oxford U.K.: Abbey House.
U.S. International Trade Commission (1999), ‘Assessment of the Economic Effects on the United States of China’s Accession to the WTO’, Investigation No. 332-403, Publication 3229.
Wang, Zhi (1997a), ‘The Impact of China and Taiwan Joining the World Trade Organization on US an World Agricultural Trade: A Computable General Equilibrium Analysis’, Technical Bulletin, No. 1858, USDA, Economic Research Service.
Wang, Zhi (1997b), ‘China and Taiwan Access to the World Trade Organization: Implications for U.S. Agriculture and Trade’ Agricultural Economics, 17:239-264.
Wang, Zhi (1999), ‘Impact of China's WTO Entry on Labor Intensive Export Market --A Recursive Dynamic CGE Analysis’, The World Economy, 22(3):379-405, May.
Wang, Zhi and Jean Kinsey (1994). “Consumption and Saving Behavior under Strict and Partial Rationing” China Economic Review - An International Journal, 5: 83-100.
Yao, Shunli and Robert Feenstra, 1999, "China and Hong Kong International Trade Data (For Use at UC Davis)," Institute of Governmental Affairs, UC Davis.
Zhang , Shuguang, Yansheng Zhang and Zhongxin Wan (1998), Measuring the Costs of Protection in China, Institute for International Economics, Washington DC.
21
Table 1 Major Assumptions for Baseline Calibration in the Modela United
States Western Europe
Japan Australia & New Zealand
Canada Mexico Korea Singapore
Hong Kong
Taiwan China ASEAN
South Asia
Latin America
MFA
Mideast & Africa MFA
Low income Africa
Rest of the
World
World Average
Average annual growth rate, %, 2000-2010 Real GDP 3.0 2.5 2.5 3.3 2.8 4.9 4.9 5.1 5.3 4.6 7.6 5.1 5.8 3.8 6.6 3.8 5.6 3.5Labor Force 0.8 -0.1 -0.2 1.0 0.6 2.4 1.1 0.3 0.2 0.8 0.8 1.9 2.2 1.8 3.1 3.0 1.5 1.5Skill Labor 3.1 3.7 2.9 6.7 5.6 2.4 1.1 0.1 4.0 4.1 2.9 5.6 2.2 1.8 6.4 6.4 5.7 4.0TFP 0.7 1.0 1.2 1.0 1.9 0.1 1.9 1.1 1.8 0.9 3.7 1.4 2.2 1.3 3.6 0.7 3.1 1.5
Capital Stock 4.7 2.7 2.5 3.8 3.6 6.6 5.3 6.7 4.6 6.6 9.1 5.8 5.5 3.1 2.7 2.6 3.6 3.8Gross Investment 4.4 3.5 2.7 2.9 3.5 10.5 5.1 5.1 6.4 3.6 7.6 5.1 5.8 3.8 6.6 3.8 5.6 4.4Government Spending 1.9 1.4 1.9 2.6 2.2 3.0 2.8 5.1 7.1 3.4 8.3 5.1 5.8 3.8 6.6 3.8 5.6 2.6Exports 3.7 3.3 1.0 3.6 2.8 5.0 4.1 4.5 3.1 4.4 7.6 6.3 7.7 4.0 7.0 3.1 5.9 4.3Imports 3.4 3.5 3.8 3.1 3.2 6.2 5.3 4.8 4.7 4.2 6.3 5.1 6.2 4.3 5.8 3.7 5.1 4.3
HH. Consumption 2.8 2.3 2.9 3.3 2.8 3.4 5.9 6.2 5.7 5.2 7.7 4.9 5.8 3.9 6.6 3.9 5.6 3.4Total Absorption 3.0 2.4 2.7 3.1 2.8 5.4 5.4 5.5 6.0 4.6 7.7 5.0 5.8 3.8 6.6 3.8 5.6 3.6
Average annual agricultural labor force migration, 1000 persons, 2000-2010 Ag. Labor migration 35 75 42 5 5 124 45 0 0 13 4774 1536 2729 446 1233 1164 1716 13942
Labor composition, %, 2000 Agricultural labor 2.2 4.6 4.4 5.4 2.6 21.8 11.2 0.2 0.7 8.7 67.8 52.7 61.1 22.3 30.3 65.7 27.6 45.8Unskilled labor 64.2 66.0 78.1 60.1 58.5 66.8 78.1 74.4 78.9 76.5 24.3 41.4 34.7 68.1 56.6 30.1 55.8 42.9Skilled labor 33.6 29.5 17.6 34.5 39.0 11.4 10.7 25.4 20.5 14.8 7.9 5.8 4.1 9.6 13.1 4.2 16.6 11.3
Labor composition, %, 2010 Agricultural labor 2.0 4.2 3.7 5.0 2.3 19.1 9.5 0.3 0.7 7.4 61.8 46.5 57.0 19.3 20.8 61.7 23.4 42.2Unskilled labor 55.7 53.2 72.3 35.2 34.8 69.5 79.9 75.0 69.5 72.0 28.4 45.2 38.8 71.1 61.2 32.5 51.7 43.5Skilled labor 42.3 42.7 24.0 59.9 63.0 11.4 10.7 24.8 29.9 20.6 9.8 8.3 4.1 9.6 18.1 5.8 24.9 14.4
Gross investment as % of real GDP 2000 19.8 18.8 24.7 21.9 18.8 22.9 29.3 45.1 29.2 23.8 37.3 32.0 22.7 18.8 21.4 14.9 20.22010 22.6 20.7 25.2 21.2 20.2 38.2 29.9 45.1 32.4 21.6 37.3 32.0 22.7 18.8 21.4 14.9 20.2
Government spending as % of nominal GDP 2000 16.2 18.8 9.5 17.7 17.9 9.3 8.7 10.5 7.8 12.4 12.1 9.7 11.0 17.0 21.3 10.3 11.72010 14.5 16.8 8.9 16.6 16.8 7.7 7.1 10.5 9.2 11.1 12.9 9.7 11.0 17.0 21.3 10.3 11.7
Balance of trade as % of nominal GDP 2000 -3.0 1.2 2.9 -1.7 2.7 0.4 4.8 11.8 3.1 1.7 1.9 6.2 -1.3 -1.1 -0.4 -5.1 -2.12010 -2.4 2.2 1.0 0.1 2.8 -4.2 0.5 8.2 -3.1 1.8 0.8 7.7 -1.3 -1.3 -0.4 -5.1 -1.9
a. Data in bold face are based on forecast by Oxford Macro Economic Model and set exogenously during the calibration (Oxford, 1999). Economy-wide TFP growth is a weighted average ( Dormar weights) of sector level TFP growth generated by the model endogenously.
22
Table 2a Tariff and Non-tariff Protection Rates in China for its WTO Accession (%) 2000 2001 2002 2003 2004 2005 2006 2007 2008-2010 Rate of
Reduction Initial NTBs
Normal Tariff Rice 78.6 63.6 49.7 37.0 25.4 25.4 25.4 25.4 25.4 -67.7 31.0Wheat 2.0 2.0 2.0 2.0 2.0 15.0 15.0 15.0 15.0 na 109.3Other grains 8.9 8.7 8.6 8.4 8.2 8.2 8.2 8.2 8.2 -7.3 78.9Oilseeds 14.3 12.7 11.2 9.6 8.0 8.0 8.0 8.0 8.0 -44.0 94.4Planted fiber 1.0 1.0 1.0 1.0 1.0 15.0 15.0 15.0 15.0 na 72.7Non-grain crops 21.7 19.3 17.0 14.8 12.6 12.6 12.6 12.6 12.6 -41.7 2.9Livestock 20.7 20.1 19.6 19.1 18.5 18.5 18.5 18.5 18.5 -10.4 0.0Dairy and meats 17.0 15.5 13.9 12.4 10.9 10.9 10.9 10.9 10.9 -35.8 2.8Processed food 31.7 28.6 25.5 22.5 19.6 17.6 15.9 15.9 15.9 -50.0 8.7Tobacco & Beverage 50.5 42.9 35.2 27.6 20.0 19.2 19.2 19.2 19.2 -61.9 12.4Forest and fishery 3.5 2.4 2.1 2.1 2.1 2.1 2.1 2.1 2.1 -41.1 1.2Energy products 5.2 3.9 3.9 3.9 3.9 3.9 3.9 3.9 3.9 -24.8 9.4Mineral 9.6 8.7 8.3 8.1 8.0 8.0 8.0 8.0 8.0 -17.4 9.4Textiles 25.4 21.7 17.9 14.4 11.2 9.1 9.1 9.1 9.1 -64.1 7.0Clothing 32.1 28.4 24.9 21.3 17.8 15.0 15.0 15.0 15.0 -53.3 5.1Leather & shoes 12.2 10.4 9.3 8.9 8.6 8.6 8.6 8.6 8.6 -29.6 5.1Other light manufacture 22.1 20.4 18.9 17.7 16.6 15.6 15.6 15.6 15.6 -29.4 1.7Wood & paper 11.4 9.3 7.3 5.7 4.4 4.1 4.1 4.1 4.0 -64.6 11.0Intermediates 11.9 10.1 8.6 7.9 7.3 7.0 6.8 6.6 6.3 -46.7 15.9Motor vehicle 33.4 28.0 22.7 19.3 16.3 13.7 13.7 13.7 13.7 -58.9 26.3Other Trans 4.9 3.8 3.7 3.6 3.5 3.5 3.5 3.5 3.5 -29.3 12.2Electronics 11.6 7.7 3.9 3.0 2.9 2.9 2.9 2.9 2.9 -75.0 7.8Machinery 13.5 10.9 8.6 7.7 7.3 7.3 7.3 7.3 7.3 -46.1 5.1Traded Services 70.9 63.8 56.7 46.1 35.5 35.5 35.5 35.5 35.5 -50.0 0.0Average 17.9 15.1 12.6 10.7 9.3 8.9 8.8 8.8 8.7 -51.4 10.1
Tariff after taking processing trade and duty exemption into account Rice 72.4 58.6 45.8 34.0 23.4 23.4 23.4 23.4 23.4 -67.7 31.0Wheat 1.6 1.5 1.5 1.5 1.5 11.1 11.1 11.1 11.1 na 89.7Other grains 5.9 5.8 5.7 5.6 5.5 5.5 5.5 5.5 5.5 -7.3 78.9Oilseeds 11.8 10.5 9.2 7.9 6.6 6.6 6.6 6.6 6.6 -44.0 94.3Planted fiber 0.9 0.1 0.1 0.1 0.1 1.6 1.6 1.6 1.6 na 6.9Non-grain crops 14.6 13.0 11.4 10.0 8.5 8.5 8.5 8.5 8.5 -41.7 2.9Livestock 7.2 7.0 6.8 6.7 6.5 6.5 6.5 6.5 6.5 -10.4 0.0Dairy and meats 11.1 10.1 9.1 8.1 7.1 7.1 7.1 7.1 7.1 -35.8 2.8Processed food 20.6 18.6 16.6 14.6 12.7 11.5 10.3 10.3 10.3 -50.0 8.5Tobacco & Beverage 25.7 21.8 17.9 14.0 10.1 9.8 9.8 9.8 9.8 -61.9 12.4Forest and fishery 2.5 1.7 1.6 1.5 1.5 1.5 1.5 1.5 1.5 -41.1 1.2Energy products 3.8 2.9 2.9 2.9 2.9 2.9 2.9 2.9 2.9 -24.8 9.4Mineral 4.2 3.8 3.6 3.5 3.5 3.4 3.4 3.4 3.4 -17.4 9.4Textiles 0.9 0.8 0.6 0.5 0.4 0.3 0.3 0.3 0.3 -64.1 7.0Clothing 0.6 0.5 0.5 0.4 0.3 0.3 0.3 0.3 0.3 -53.3 5.1Leather & shoes 0.2 0.2 0.2 0.2 0.1 0.1 0.1 0.1 0.1 -29.5 5.1Other light manufacture 1.6 1.5 1.4 1.3 1.2 1.1 1.1 1.1 1.1 -29.4 1.7Wood & paper 4.6 3.7 2.9 2.3 1.8 1.7 1.6 1.6 1.6 -64.6 11.0Intermediates 3.7 3.2 2.7 2.5 2.3 2.2 2.1 2.1 2.0 -46.7 15.9Motor vehicle 25.0 21.0 17.0 14.5 12.2 10.3 10.3 10.3 10.3 -58.9 26.3Other Trans 4.2 3.3 3.2 3.1 3.0 3.0 3.0 3.0 3.0 -29.3 12.2Electronics 3.3 2.2 1.1 0.8 0.8 0.8 0.8 0.8 0.8 -75.0 7.8Machinery 4.0 3.2 2.5 2.2 2.1 2.1 2.1 2.1 2.1 -46.1 5.1Traded Services 71.0 63.9 56.8 46.2 35.5 35.5 35.5 35.5 35.5 -50.0 0.0Average 8.0 6.9 5.9 5.0 4.2 4.1 4.1 4.1 4.0 -49.6 9.6
23
Data Source: China's tariff cut is aggregated by the author from 6 digit Harmonized Commodity Description and Coding System (HS) tariff schedules based on US-China agreement (November, 1999) and weighted by 1998 import data from China's Customs. China’s non-tariff barrier (NTB is the difference between import protection rate in version 5 GTAP database and China’s tariff after adjustment for duty exemptions. Industrial products are modified on additional information from Zhang et al. (1998) and Li et al. (1998). Detailed data on processing trade and duty exemption are kindly provided by Dr. Shunli Yao based on the China trade database maintained at the University of California-Davis (Yao, Shunli and Robert Feenstra, 1999). The base year sevice sector protection rate was adopted from Hoekman (1995) and they are tariff equelent of no-tariff barriers.
Table 2b Tariff Rates in Taiwan for its WTO Accession (%) 2000 2001 2002 2003 2004 2005 2006 2007 2008 2009 2010 Rate of
ReductionInitial NTBs
Rice 0.0 0.0 0.0 0.0 0.0 0.0 0.0 0.0 0.0 0.0 0.0 na 2.4Wheat 7.0 7.0 7.0 7.0 7.0 7.0 7.0 7.0 7.0 7.0 7.0 0.0 0.0Other grains 0.2 0.2 0.2 0.1 0.1 0.1 0.1 0.1 0.1 0.1 0.1 -71.4 0.8Oilseeds 0.4 0.4 0.0 0.0 0.0 0.0 0.0 0.0 0.0 0.0 0.0 -98.3 1.9Planted fiber 0.0 0.0 0.0 0.0 0.0 0.0 0.0 0.0 0.0 0.0 0.0 na 0.5Non-grain crops 17.5 14.7 11.8 11.5 11.2 11.0 10.8 10.8 10.8 10.8 10.8 -38.0 10.2Livestock 1.5 1.6 1.7 1.4 1.4 1.4 1.4 1.4 1.4 1.4 1.4 -8.3 0.0Dairy and meats 5.2 4.9 4.7 4.5 4.4 4.4 4.3 4.3 4.3 4.3 4.3 -16.8 7.6Processed food 13.7 12.9 12.1 11.7 11.5 11.3 11.2 11.2 11.2 11.2 11.2 -18.3 4.6Tobacco & Beverage 19.3 17.3 15.4 15.4 15.4 15.3 15.3 15.3 15.3 15.3 15.3 -20.7 30.1 Forest and fishery 9.4 8.8 8.2 8.0 7.8 7.7 7.6 7.6 7.6 7.6 7.6 -18.3 9.7Energy products 2.9 2.7 2.6 2.5 2.5 2.4 2.4 2.4 2.4 2.4 2.4 -15.5 2.8Mineral 5.4 5.0 4.6 4.5 4.4 4.3 4.3 4.3 4.3 4.3 4.3 -21.7 0.8Textiles 6.8 6.5 6.2 6.2 6.1 6.1 6.1 6.1 6.1 6.1 6.1 -10.6 0.8Clothing 12.9 12.2 11.4 11.3 11.3 11.3 11.3 11.3 11.3 11.3 11.3 -13.0 0.3Leather & shoes 4.8 4.7 4.5 4.4 4.3 4.2 4.2 4.2 4.2 4.2 4.2 -13.2 0.6Other light manufacture 3.7 3.0 2.3 2.2 2.2 2.1 2.1 2.1 2.1 2.1 2.1 -43.7 1.1Wood & paper 3.0 1.9 0.7 0.7 0.7 0.7 0.7 0.7 0.7 0.7 0.7 -76.8 1.1Intermediates 3.4 2.9 2.3 2.1 1.9 1.9 1.9 1.9 1.9 1.9 1.9 -45.5 0.7Motor vehicle 38.4 35.4 32.4 29.7 27.1 24.7 22.3 20.5 18.7 16.9 15.2 -60.2 0.0Other Trans 1.4 1.4 1.3 1.3 1.2 1.2 1.2 1.2 1.2 1.2 1.2 -15.5 0.8Electronics 2.6 1.6 0.5 0.5 0.5 0.5 0.5 0.5 0.5 0.5 0.5 -81.1 0.6Machinery 4.7 3.9 3.1 3.1 3.0 3.0 3.0 3.0 3.0 3.0 3.0 -35.8 0.2Traded Services 0.0 0.0 0.0 0.0 0.0 0.0 0.0 0.0 0.0 0.0 0.0 na na Average 4.7 3.9 3.3 3.1 3.0 2.9 2.8 2.8 2.7 2.7 2.6 -43.9 1.2
Data Source: Taiwan's tariff cut is aggregated by the author from 6 digit Harmonized Commodity Description and Coding System (HS) tariff schedules based on Taiwan’s official WTO offer provided by Council for Agriculture, Taiwan and weighted by its import data from 1997-2000 from World Trade Atlas. The weights of each year are 0.1, 0.2,0.3, and 0.4 respectively. Taiwan’s non-tariff barrier (NTB is the difference between import protection rate in version 5 GTAP database.
24
Table 3 Differences between a WTO with and without China: Accumulated Sectoral Net Trade by Region during 2001 - 2010 United
States Western Europe
Japan Australia & New
Zealand
Canada Mexico Korea Singapore Hong Kong
Taiwan China ASEAN South Asia
Latin America
MFA
Mideast & Africa MFA
Low income Africa
Rest of the World
Billion U.S. dollars
Rice -0.3 0.0 -0.2 -0.1 0.0 0.0 0.0 0.0 0.0 0.0 -2.3 2.8 0.3 0.0 0.0 0.0 0.0 Wheat 1.7 -0.2 -0.2 1.8 11.1 0.0 -0.1 0.0 0.0 0.0 -14.8 -0.2 0.5 0.1 0.0 0.0 0.2 Other grains -0.4 0.0 -0.1 5.3 2.4 0.1 0.3 0.0 0.0 0.1 -7.3 -0.1 0.0 0.0 0.1 0.0 -0.3 Oilseeds 13.6 -0.2 -0.2 -0.1 -0.7 -0.1 0.0 0.0 0.0 0.1 -16.7 0.0 0.1 3.9 0.0 0.0 0.3 Planted fiber 5.9 0.2 -0.1 0.7 0.0 0.2 -0.1 0.0 0.0 -0.2 -11.6 0.2 0.7 0.3 0.2 1.1 2.3 Non-grain crops -0.4 -0.8 -0.3 -0.6 -1.3 0.3 -0.2 -0.1 0.0 -1.3 -0.1 0.0 1.8 1.7 0.2 -0.3 1.6 Sub-total 20.2 -1.1 -1.0 7.0 11.4 0.5 -0.2 -0.2 0.0 -1.3 -52.8 2.7 3.5 6.0 0.5 0.8 4.0 Livestock -0.6 -0.6 -0.1 -2.2 -1.0 0.1 -0.1 0.0 0.0 0.3 3.7 0.0 0.3 0.0 0.1 0.0 0.1 Dairy and meats 0.9 0.5 -0.3 -0.8 -0.5 0.1 0.0 0.1 0.0 -0.5 -0.8 0.2 0.2 0.4 0.2 0.0 0.5 Processed food 2.6 6.7 -1.1 -0.2 0.8 0.1 -0.2 1.6 0.6 -1.0 -12.4 -0.2 1.9 0.8 0.1 -0.1 0.2 Tobacco & Beve. 3.9 9.6 0.8 -0.1 -0.1 0.2 -0.1 0.2 0.8 -5.8 -10.3 0.2 0.1 0.3 0.1 0.0 0.4 Sub-total 6.8 16.1 -0.7 -3.3 -0.8 0.4 -0.4 1.9 1.3 -7.0 -19.8 0.2 2.5 1.5 0.4 -0.2 1.1 Forest and fishery 0.2 0.2 0.3 0.6 0.0 0.0 0.0 0.0 -0.1 -0.4 -1.1 -0.3 0.4 0.1 0.0 -0.1 0.1 Energy products -0.5 0.4 -0.8 -0.6 -0.2 0.6 -0.3 3.5 -0.1 -2.0 -11.4 1.6 2.3 0.7 4.1 0.1 2.4 Mineral products -0.3 -1.0 -0.8 0.1 -0.4 0.2 -0.3 -0.2 0.1 -0.6 0.3 0.7 1.9 0.9 -0.1 -0.1 -0.1 Wood & paper 1.9 0.2 0.5 -0.1 -0.8 0.4 1.3 -0.3 1.3 -0.5 -11.1 4.3 0.6 0.8 0.2 0.0 1.3 Sub-total 1.3 -0.4 -0.8 0.0 -1.4 1.1 0.7 3.1 1.3 -3.4 -23.3 6.3 5.2 2.5 4.1 -0.1 3.8 Textiles 1.8 -4.2 6.7 0.1 0.6 -0.5 5.5 -0.1 6.5 10.5 -35.0 3.3 2.5 0.2 0.5 -0.1 1.7 Clothing -6.4 -10.9 -4.2 -0.4 -1.0 -4.8 -3.3 -0.3 -11.4 -2.1 160.8 -20.1 -36.8 -21.1 -10.4 -0.3 -27.4 Leather & shoes -1.0 -8.1 -0.5 -0.2 0.1 -0.4 0.1 -0.2 -0.1 0.2 22.3 -7.0 0.6 -2.3 -0.4 -0.1 -3.1 Other light mann. -0.5 -8.9 -2.0 -0.2 -0.2 -0.3 -0.7 -0.2 0.2 -1.6 17.6 -1.0 1.8 -0.3 -2.7 -0.5 -0.6 Sub-total -6.1 -32.1 0.0 -0.6 -0.6 -6.0 1.5 -0.7 -4.8 7.0 165.7 -24.9 -31.9 -23.4 -12.9 -0.9 -29.3 Intermediates 7.0 0.6 17.7 0.3 -1.6 1.0 10.5 0.5 3.0 11.4 -73.7 7.4 5.5 2.4 1.4 0.0 6.8 Motor vehicle 3.1 3.7 11.5 -0.9 -0.6 3.6 -3.1 -0.2 -0.1 -8.5 -16.9 1.5 2.2 3.1 0.1 0.0 1.5 Other Trans -9.3 -4.6 -4.8 -0.5 -1.3 0.0 -3.6 0.0 0.0 2.2 18.6 1.5 1.9 0.7 0.0 -0.1 -0.6 Electronics -7.0 -6.5 -5.1 0.2 -1.3 -1.1 -3.9 -0.5 1.9 3.6 23.0 -4.1 0.8 0.6 0.0 0.1 -0.6 Machinery -10.5 -17.0 -12.3 -0.7 -3.1 -0.8 -3.1 -1.4 0.6 0.0 41.7 2.3 2.8 1.7 0.2 0.4 -0.8 Sub-total -16.7 -23.8 7.0 -1.8 -7.9 2.7 -3.2 -1.6 5.4 8.8 -7.3 8.5 13.2 8.5 1.7 0.4 6.2 Traded Services 6.0 15.0 -5.6 -1.4 -0.9 1.9 -3.5 -3.4 -3.7 -2.2 -27.8 5.1 7.0 4.5 3.0 -0.5 6.5 Construction 0.0 -0.9 -0.9 0.0 0.0 0.0 0.0 0.0 0.0 0.0 1.6 0.1 0.1 0.2 0.0 0.0 0.1 Total 11.5 -27.2 -2.0 -0.1 -0.3 0.7 -5.2 -1.0 -0.7 1.9 36.2 -2.0 -0.4 -0.2 -3.2 -0.5 -7.5
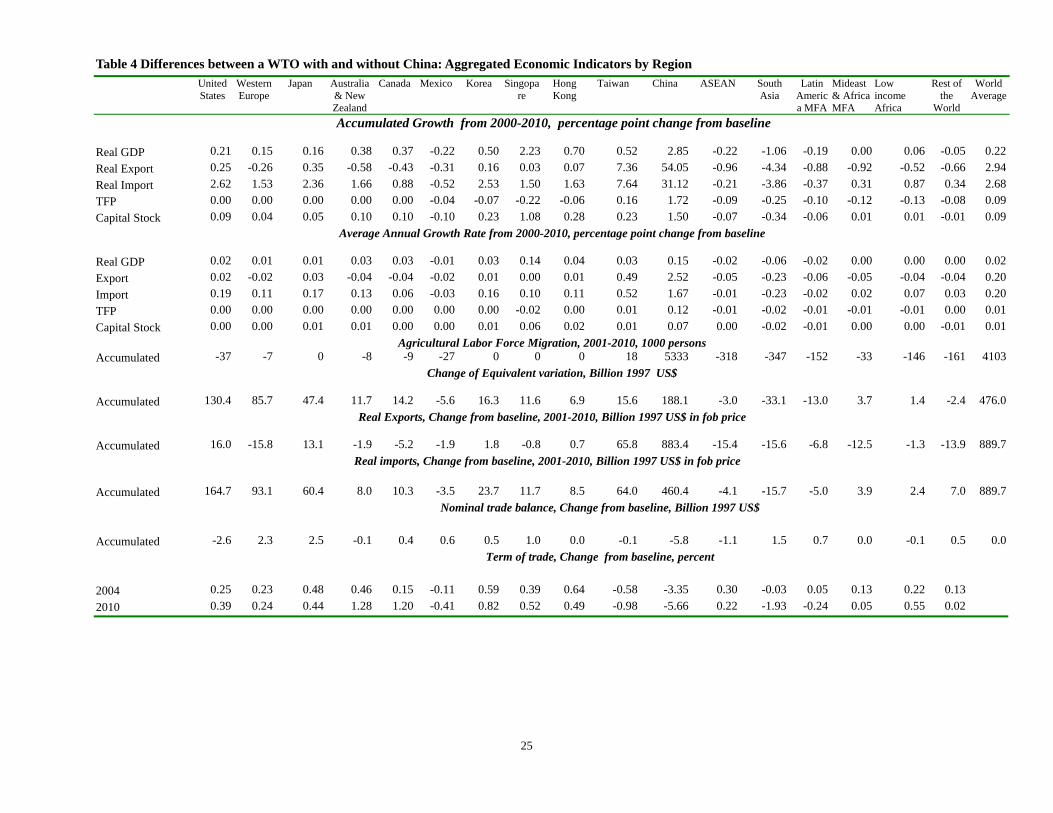
25
Table 4 Differences between a WTO with and without China: Aggregated Economic Indicators by Region United
States Western Europe
Japan Australia & New Zealand
Canada Mexico Korea Singopare
Hong Kong
Taiwan China ASEAN South Asia
Latin America MFA
Mideast & Africa MFA
Low income Africa
Rest of the
World
World Average
Accumulated Growth from 2000-2010, percentage point change from baseline
Real GDP 0.21 0.15 0.16 0.38 0.37 -0.22 0.50 2.23 0.70 0.52 2.85 -0.22 -1.06 -0.19 0.00 0.06 -0.05 0.22 Real Export 0.25 -0.26 0.35 -0.58 -0.43 -0.31 0.16 0.03 0.07 7.36 54.05 -0.96 -4.34 -0.88 -0.92 -0.52 -0.66 2.94 Real Import 2.62 1.53 2.36 1.66 0.88 -0.52 2.53 1.50 1.63 7.64 31.12 -0.21 -3.86 -0.37 0.31 0.87 0.34 2.68 TFP 0.00 0.00 0.00 0.00 0.00 -0.04 -0.07 -0.22 -0.06 0.16 1.72 -0.09 -0.25 -0.10 -0.12 -0.13 -0.08 0.09 Capital Stock 0.09 0.04 0.05 0.10 0.10 -0.10 0.23 1.08 0.28 0.23 1.50 -0.07 -0.34 -0.06 0.01 0.01 -0.01 0.09
Average Annual Growth Rate from 2000-2010, percentage point change from baseline
Real GDP 0.02 0.01 0.01 0.03 0.03 -0.01 0.03 0.14 0.04 0.03 0.15 -0.02 -0.06 -0.02 0.00 0.00 0.00 0.02 Export 0.02 -0.02 0.03 -0.04 -0.04 -0.02 0.01 0.00 0.01 0.49 2.52 -0.05 -0.23 -0.06 -0.05 -0.04 -0.04 0.20 Import 0.19 0.11 0.17 0.13 0.06 -0.03 0.16 0.10 0.11 0.52 1.67 -0.01 -0.23 -0.02 0.02 0.07 0.03 0.20 TFP 0.00 0.00 0.00 0.00 0.00 0.00 0.00 -0.02 0.00 0.01 0.12 -0.01 -0.02 -0.01 -0.01 -0.01 0.00 0.01 Capital Stock 0.00 0.00 0.01 0.01 0.00 0.00 0.01 0.06 0.02 0.01 0.07 0.00 -0.02 -0.01 0.00 0.00 -0.01 0.01
Agricultural Labor Force Migration, 2001-2010, 1000 persons Accumulated -37 -7 0 -8 -9 -27 0 0 0 18 5333 -318 -347 -152 -33 -146 -161 4103
Change of Equivalent variation, Billion 1997 US$ Accumulated 130.4 85.7 47.4 11.7 14.2 -5.6 16.3 11.6 6.9 15.6 188.1 -3.0 -33.1 -13.0 3.7 1.4 -2.4 476.0
Real Exports, Change from baseline, 2001-2010, Billion 1997 US$ in fob price Accumulated 16.0 -15.8 13.1 -1.9 -5.2 -1.9 1.8 -0.8 0.7 65.8 883.4 -15.4 -15.6 -6.8 -12.5 -1.3 -13.9 889.7
Real imports, Change from baseline, 2001-2010, Billion 1997 US$ in fob price Accumulated 164.7 93.1 60.4 8.0 10.3 -3.5 23.7 11.7 8.5 64.0 460.4 -4.1 -15.7 -5.0 3.9 2.4 7.0 889.7 Nominal trade balance, Change from baseline, Billion 1997 US$ Accumulated -2.6 2.3 2.5 -0.1 0.4 0.6 0.5 1.0 0.0 -0.1 -5.8 -1.1 1.5 0.7 0.0 -0.1 0.5 0.0 Term of trade, Change from baseline, percent 2004 0.25 0.23 0.48 0.46 0.15 -0.11 0.59 0.39 0.64 -0.58 -3.35 0.30 -0.03 0.05 0.13 0.22 0.13 2010 0.39 0.24 0.44 1.28 1.20 -0.41 0.82 0.52 0.49 -0.98 -5.66 0.22 -1.93 -0.24 0.05 0.55 0.02


![Accession to the WTO - WHO · © WTO - OMC 2004 Accession to the WTO ... WORLD TRADE ORGANIZATION ... Microsoft PowerPoint - WHOpres.ppt [Read-Only] Author:](https://img.pdfslide.us/doc/110x75/5aea95b97f8b9a90318bd175/accession-to-the-wto-wto-omc-2004-accession-to-the-wto-world-trade-organization.jpg)