Embed Size (px)
Citation preview

David E. Dismukes, Ph.D.
Center for Energy Studies
Louisiana State University
The Impact of Changing Natural Gas Prices on
Renewables and Energy Efficiency
NASUCA Gas Committee Conference Call/Webinar
June 12, 2012
Center for Energy Studies

Energy-Related
Carbon Dioxide
81.2%
Summary and Take Away
2
• New natural gas supply availability is having considerable
impacts on all energy markets today and on longer term,
forward-looking basis.
• Given the prevalence of natural gas at the margin, this impacts
not just retail gas usage, but also power, renewables and
environmental valuations.
• Lower gas commodity will also drive down gas as a share of total
bill and start to move base rate/commodity cost relationships to
longer-run averages.
• If avoided costs (future looking costs) are not re-calibrated to
reflect these market changes, it could result in higher-than-cost
effective energy efficiency and renewable energy being adopted.
Center for Energy Studies
© LSU Center for Energy Studies

Marginal cost – the change in total cost resulting from
an extremely small change in output. Typically
thought of in the short run, although long run marginal
costs can be important for planning purposes.
Avoided costs – the real world estimate of long run
marginal costs where all factors of production (or
inputs such as capital/capacity and other variable
costs) are variable.
Important in long run resource planning evaluation as
well as evaluation of renewable energy resources and
energy efficiency measures.
3
© LSU Center for Energy Studies
Marginal Costs/Avoided Costs
Center for Energy Studies

Energy-Related
Carbon Dioxide
81.2%
Avoided Cost Estimation
4
Avoided cost estimates are often a function of:
1. Future energy costs
2. Future capacity costs
3. Future natural gas commodity costs (LDC)
4. Future environmental costs
5. Future renewable costs
6. Zero dispatch benefits (use/application
varies by state)
Center for Energy Studies
© LSU Center for Energy Studies

Center for Energy Studies
Natural Gas Prices
5 © LSU Center for Energy Studies

$/M
cf
Source: Energy Information Administration, U.S. Department of Energy.
Natural Gas Price Variability
Center for Energy Studies
$0
$2
$4
$6
$8
$10
$12
$14
$16
$18
$20
Jan-97 Jan-99 Jan-01 Jan-03 Jan-05 Jan-07 Jan-09 Jan-11
average for period
2000-2001 heating season
through 2008: $6.24 (standard deviation: $2.39)
since 2009: $4.11 (standard deviation: $0.70)
6 © LSU Center for Energy Studies
The 2001 to 2009 market trend of higher average prices coupled with high
volatility is reversing itself and post 2009 prices are significantly lower.
Average 1997
through 2000: $2.79 (standard deviation: $1.28)

Pe
rce
nt o
f To
tal (%
)
Source: Energy Information Administration, U.S. Department of Energy
Estimated Gas and Non-Gas Costs in U.S. Distribution Rates
Center for Energy Studies
0%
10%
20%
30%
40%
50%
60%
70%
80%
1990 1992 1994 1996 1998 2000 2002 2004 2006 2008 2010
Fuel
Non-Fuel
7 © LSU Center for Energy Studies
The commodity share of total bills are closer to percentages observed in
the 1990s rather than the early 2000s.

Source: Energy Information Administration, U.S. Department of Energy
Domestic Shale Gas Basins and Plays
Center for Energy Studies
8 © LSU Center for Energy Studies
Unlike
conventional
resources,
shale plays
(natural gas,
liquids, and
crudes) are
located
almost
ubiquitously
throughout
the U.S. and
are the
primary
reason for
the decrease
in overall and
regional
natural gas
prices.

Annual Production, Unconventional Resources
Center for Energy Studies
9 © LSU Center for Energy Studies
Bcf/d MMBBl/d
Source: Advanced Resource Intl; presentation to Cheniere Board, March 2011; Cheniere Research
0
1
2
3
4
5
6
7
8
2010 2011E 2012E 2013E 2014E 2015E 2020E
0
0.5
1.0
1.5
2.0
2.5
3.0
3.5
4.0
Includes Eagle Ford, W. Barnett, Bakken Shales;
Granite Wash, Piceance & Uinta Tight Sands
Liquids
Gas
Liquids production from shale plays > 3 million barrels per day by 2020
Associated natural gas > 7 Bcf/d of “costless” supply (or about 2.3 Bcf/d per
every 1.0 MMBbls/d of shale-based liquids production).

Dry
Na
tura
l G
as P
rove
d R
ese
rve
s (
Tcf)
Source: Energy Information Administration, U.S. Department of Energy
Natural Gas Proved Reserves and Production
Center for Energy Studies
-
5
10
15
20
25
30
0
50
100
150
200
250
300
350
1970 1975 1980 1985 1990 1995 2000 2005 2010
Reserves
Production
Ma
rke
ted P
rod
uctio
n (T
cf)
1
0 © LSU Center for Energy Studies
Current U.S. natural gas reserves are approaching record levels not seen
since 1970. Natural gas production is at levels that surpass historic peaks.

Imp
ort
s -
Bcf
Source: Energy Information Administration, U.S. Department of Energy
Natural Gas Imports
Center for Energy Studies P
erc
en
t of T
ota
l U.S
. Su
pp
ly - %
0%
5%
10%
15%
20%
25%
0
500
1,000
1,500
2,000
2,500
3,000
3,500
4,000
4,500
5,000
1990 1992 1994 1996 1998 2000 2002 2004 2006 2008 2010
LNG Imports Pipeline Imports Imports as a Percent of Total Supply
11 © LSU Center for Energy Studies
Natural gas imports, once thought the be the supply remedy for meeting
future gas needs are falling to levels also not seen since the 1990s.

Re
se
rve
s -
Tcf
Source: Energy Information Administration, U.S. Department of Energy
Annual Energy Outlook, Natural Gas Reserves
Center for Energy Studies
200
220
240
260
280
300
320
2010 2015 2020 2025 2030 2035
12 © LSU Center for Energy Studies
Unconventional resources are not a “flash in the pan” and are anticipated to
continue to increase over the next two decades or more.

Basin Competition
Center for Energy Studies
Source: MIT Energy Initiative. 13 © LSU Center for Energy Studies
Natural Gas Uses
China
1,275 Tcf
Australia
396 Tcf
South
Africa
485 Tcf
Argentina
774 Tcf
Brazil
226 Tcf
Mexico
681 Tcf
Canada
388 Tcf
U.S.
862 Tcf
France
180 Tcf
Poland
187 Tcf
Algeria
231 Tcf
Libya
290 Tcf
Close to 6,000 TCF of shale gas opportunities around the world. Coupled with 9,000 Tcf
in conventional suggest a potentially solid resource base for many decades.

(20
10
$/M
MB
TU
)
Source: Energy Information Administration, U.S. Department of Energy
Choosing Most Current Natural Gas Price Forecasts: AEO-2007 to AEO-2012
Center for Energy Studies
0
2
4
6
8
10
12
14
16
1997 2002 2007 2012 2017 2022 2027 2032
Actual Henry Hub AEO-2007 AEO-2008 AEO-2009
AEO-2010 AEO-2011 AEO-2012
14 © LSU Center for Energy Studies
Shale availability has significant impact on future price outlook.
Anticipated price outlook in 2009.
Anticipated price outlook today.

Raymond James
(long-term forecast
of $4.00)
Pritchard
Capital
($4.00)
Raymond
James ($3.25)
AESC 2011 Price
($5.91 in 2015)
Varying Industry Natural Gas Forecasts
Center for Energy Studies
$0.00
$1.00
$2.00
$3.00
$4.00
$5.00
$6.00
Merrill Lynch
(<$2.00)
Deutsche
Bank
($3.50)
Current
Henry Hub
Price1 Pritchard
Capital
($3.30)
Barclay
Capital ($3.05)
Tudor
Pickering
Holt
($3.25)
Pritchard Capital
($5.00 from 2015
onward)
Raymond James
($2.50)
Bank of
America
Merrill
Lynch
($3.30)
AESC 2011
Price ($4.91)
AESC 2011
Price ($5.10)
Note: 1 As of May 31, 2012.
Source: Foster Natural Gas/Oil Report. Barclays Capital analysts: producer expectations of “very weak" gas prices in 2012, yet gas production will still manage
to grow. March 9, 2012; Hargreaves, S. 2012. Heating homes with gas gets cheaper. CNNMoney.com. January 12, 2012; Holland, B. 2012. Pritchard cuts
2012 gas price forecast 25%. Electric Power Daily. January 19, 2012; and Natural Gas Week. Treadmill: little hope seen for corralling burgeoning gas supply.
February 13, 2012 .
2012 2013 2014 and
beyond
15 © LSU Center for Energy Studies

Center for Energy Studies
Natural Gas & Energy Costs
1
6 © LSU Center for Energy Studies

Choosing Most Current Natural Gas Price Forecasts
Center for Energy Studies
• 2011 Avoided Energy Supply
Costs (“AESC”)
– Conducted on behalf of
energy efficiency program
administrators in New
England.
• Assumes that EIA’s AEO 2011
is “too optimistic” regarding
shale gas production and
utilizes “more conservative”
numbers from AEO 2010.
17 © LSU Center for Energy Studies

Source: Avoided Energy Supply Cost, 2011 Report
Effect of Changing Realities on Forecasted Natural Gas Prices
Center for Energy Studies
18 © LSU Center for Energy Studies
$0
$2
$4
$6
$8
$10
$12
2011 2016 2021 2026 2031 2036
AEO 2010 AEO 2012
Original Natural Gas Price Forecast Updated Natural Gas Price Forecast
(20
11
$/M
MB
tu)
AESC uses “high cost” shale outlook (original fcst) and even update
of this shows a wide near-term difference. 2016-2020 prices under
“original forecast’ are as much as 75 percent above AEO baseline.

Source: Avoided Energy Supply Cost, 2011 Report
Changing Forecasted Natural Gas Prices Impact on Electric Price
Center for Energy Studies
19 © LSU Center for Energy Studies
$0
$20
$40
$60
$80
$100
$120
$140
$160
$180
2012 2017 2022 2027 2032 2037
Original On-Peak Electric Price
Updated On-Peak Electric Price (using new Natural Gas Price Forecast)
(20
11
$/M
MB
tu)
Updated forecasts can have a considerable impact on the forecasted avoided
cost. Energy costs often account for a sizable share of overall avoided cost.

Center for Energy Studies
Capacity Prices
2
0 © LSU Center for Energy Studies

Energy-Related
Carbon Dioxide
81.2%
Estimation of Capacity Costs
21
• Future capacity costs are a function of needed capacity.
• The tighter the (capacity) market, the more likely capacity
prices will rise to incent the development of new
capacity.
• Can be incentives to understate capacity requirements
that would/could arise from (1) load growth (2) EPA-
induced retirements (3) below-expected renewable
capacity development.
• Natural gas price decreases drive down an already lower-
capital cost investment, with higher operating
efficiencies and lower emissions. This creates a large
cost differential between natural gas based generation
and all other generation technologies (renewables AND
other fossil/nuclear).
Center for Energy Studies
© LSU Center for Energy Studies

Source: U.S. Department of Energy, Energy Information Administration.
Levelized Cost of Generation
Center for Energy Studies
0 50 100 150 200 250 300 350 400
Hydro
Biomass (Direct)
Offshore Wind
Onshore Wind
Solar PV
Advanced Nuclear
Coal IGCC
Conventional Coal
Combined Cycle (Today's gas ($2.40))
Combined Cycle ($8 gas)
Combined Cycle ($5 gas)
22 © LSU Center for Energy Studies
Lower gas prices move the levelized cost (and capacity cost) of the
development of new, incremental capacity even lower.

U.S. Power Generation – Fuel Mix
Center for Energy Studies
23 © LSU Center for Energy Studies
Coal 51%
Nuclear 20%
Natural Gas 16%
Petroleum 3%
Other 1%
Coal 45%
Natural Gas 24%
Nuclear 19%
Other 1%
Petroleum 1%
Renewables 9% Renewables 10%
2000 2010
Source: Energy Information Administration, U.S. Department of Energy
Over 250,000 MWs of natural gas power generation capacity has been added
over the past decade at the expense of coal and nuclear. Gas will continue to
be the marginal technology for a variety of reasons.

Center for Energy Studies
Electric Industry Environmental Regulations Create Uncertainty for Coal
National Ambient Air Quality Standards (NAAQS) • Sets acceptable levels for six criteria pollutants (carbon monoxide, lead, nitrogen dioxide, particulate matter, ozone, sulfur
dioxide).
• A network of 4,000 State and Local Air Monitoring Stations is used to determine if geographic areas are meeting or
exceeding the NAAQS.
Transport Rule (now CSAPR) [proposed] • Issued to replace the Clean Air Interstate Rule (CAIR) and its predecessor the Clean Air Transport Rule (“CATR”). Requires
31 states (and D.C.) to improve air quality by reducing power plant emissions (SO2 and NOX) that contribute to ozone and
fine particulate pollution in other states (some annual, some on ozone season only).
• By 2014, the rule and other state and EPA actions would reduce power plant SO2 emissions by 80% over 2005 levels.
Power plant NOx emissions would drop by 58%.
Utility Maximum Achievable Control Technology (MACT) [to be proposed] • EPA must set emission limits for hazardous air pollutants. The rule is expected to replace the Clean Air Mercury Rule
(CAMR) and add standards for lead, arsenic, acid gases, dioxins and furans.
Coal Combustion Residuals (CCR) [proposed] • Would establish, for the first time under the Resource Conservation and Recovery Act (RCRA) requirements for the proper
disposal of coal ash generated by coal combustion at electric power plants.
Power Plant Cooling Water Intake Structures Rule • Section 316(b) of the Clean Water Act is intended to address environmental impacts from cooling water intake to and
discharge from power plant cooling systems. Requires that the location, design, construction and capacity of cooling water
intake structures reflect the best technology available for minimizing adverse environmental impact.
24

Center for Energy Studies
Summary of Retirement Studies Related to EPA Rules
Source: Synapse Energy Economics, Inc., “Public Policy Impacts on Transmission Planning, Prepared for Earthjustice”, December 10, 2010; and “Miller, P. A Primer on Pending
Environmental Regulations and their Potential Impacts on Electric System Reliability. Working Draft, JD Northeast States for Coordinated Air Use Management. January 24, 2011.
Study Retired Capacity Regulation Requirements
Scenario 1 - Transport Rule
Scenario 2 - Transport Rule, MACT
Scenario 3 - Transport Rule, MACT,
316(b) Cooling Water, Coal Ash
Scenario 1 - Transport Rule, MACT
Scenario 2 - Transport Rule, MACT,
CWA 316(b)
Transport Rule, MACT, 316(b) Cooling
Water, Coal Ash
Size and existing controls
Transport Rule, MACT
Transport Rule, MACT
Switch to lower sulfur coal, install emission controls, or retire
Transport Rule, MACT
Transport Rule, MACT
In-house model (NEEMS) optimizing costs of existing capacity
and costs of potential new capacity.
Regulated Units - 15-year present value of costs >
replacement power from a CC or CT. Merchant unit -
15-year present value of cost > revenues from energy
and capacity markets.
Cost of retrofitting coal plant compared to cost of new
gas CC
Levelized costs (@2008 CF) after retrofitting each unit for the
environmental regulations compared to the cost of a new gas-
fired unit.
MJ Bradley
(August 2010)30 to 40 GW
FGS + emissions on all coal fired units by 2015Bernstein
Research (October
2010)
51 GW
Brattle Group
(December 2010)
50 to 65 GW by
2020
Credit Suisse
(September 2010)60 GW
Charles River
Associates
(December 2010)
39 GW by 2015
80
Estimated GW of Retired Coal
NERC (October
2010)
47 to 76 GW by
2018 (total fossil fuel
capacity, including oil
and gas)
10
ICF/IEE (May
2010)
25 to 60 GW by
2015
20 30 40 50 60 70
25

Source: NERC 2011 Long-Term Reliability Assessment
Anticipated Planning Reserve Margins
Center for Energy Studies
26 © LSU Center for Energy Studies
0%
5%
10%
15%
20%
25%
30%
35%
40%
45%
50%
2011 2013 2015 2017 2019 2021
ERCOT
FRCC
MISO
MRO-MAPP
NPCC-NE
NPCC-NY
PJM
SERC-E
SERC-N
SERC-SE
SERC-W
SPP
An
ticip
ate
d R
ese
rve
Ma
rgin
(%
)
Most areas of the country are anticipated future reserve
margins blow those typically utilized for planning purposes.

Center for Energy Studies
Changes in Environmental and
Renewable Energy Costs
2
7 © LSU Center for Energy Studies

CO2 Emissions in RGGI States
Center for Energy Studies
28 © LSU Center for Energy Studies
Note: 1 New Jersey was also an original member state but withdrew from the RGGI program in 2011.
Source: RGGI.org
Regional Greenhouse Gas Initiative, Inc. (RGGI, Inc.) is a 501(c)(3) non-profit corporation
created to support development and implementation of the Regional Greenhouse Gas
Initiative (RGGI).
ME
NH
VT
NY MA
CT RI
MD DE
• A cooperative effort among nine states: Connecticut, Delaware, Maine, Maryland,
Massachusetts, New Hampshire, New York, Rhode Island and Vermont.1
• Started in 2008 and was the first market-based regulatory program to reduce GHG
emissions in the U.S.
• Establishes a regional cap on carbon dioxide (CO2) emissions from the
power sector and requires power plants to possess CO2 allowances equal
to their CO2 emissions over each three-year control period..
• The regional CO2 emission cap comprises the sum of each RGGI
participating state’s annual CO2 allowance budget. For the first six years
of the program (2009-2014) the emission cap is 188 million short tons of
CO2 per year. Beginning in 2015, the cap will decrease by 2.5% per year,
such that it will be 10% lower by the end of 2018.
• Recent reports have deemed the program a success and estimate that
the program has already created $1.6 billion in economic value, could
lead to $1.1 billion in ratepayer savings, and states participating in the
program have seen a 20 percent greater reduction in per-capita CO2
emissions than non-RGGI states.

How Does Cap & Trade Work?
29
Simply speaking, sources “long” on credits will trade with
those that are “short.”
20,000
25,000
30,000
35,000
40,000
2009 2010 2011 2012 2013 2014 2015 2016 2017 2018 2019 2020
em
issio
ns -
to
ns
Emissions
exceed
allowance –
Generator A
needs to buy
credits
Emissions are
lower than
allowance –
Generator B can
sell credits
Generator A
Generator B
Allowanc
e
Center for Energy Studies

How Does Cap & Trade Improve Overall Emissions?
30
20,000
25,000
30,000
35,000
40,000
2009 2010 2011 2012 2013 2014 2015 2016 2017 2018 2019 2020
em
issio
ns -
to
ns
Emissions
exceed
allowance –
Shortfall must be
made up from:
(1) credit
purchases
from those
facilities
individually
long ; and/or
(2) capital
investments to
lower emissions
profile.
Framework creates “scarcity” because the initial regulatory “design” is
intentionally “short” in the aggregate. More stringent caps result in more
expensive mitigation costs (higher marginal credit prices), other things
equal.
Center for Energy Studies

CO
2 E
mis
sio
ns (
tho
usa
nd to
ns/M
Wh)
Source: U.S. Environmental Protection Agency, Accessed at: http://camddataandmaps.epa.gov/gdm/.
CO2 Emissions in RGGI States
Center for Energy Studies
0.0
0.2
0.4
0.6
0.8
1.0
1.2
2000 2001 2002 2003 2004 2005 2006 2007 2008 2009 2010 2011*
31 © LSU Center for Energy Studies
RGGI states have seen dramatic decreases in carbon emissions since
2000. Today, the CO2 emissions rate is about 29 percent lower than a
decade ago.

Nu
mb
er
of A
llow
an
ce
s
Source: Regional Greenhouse Gas Initiative, Inc., Accessed at: http://www.rggi.org/market/co2_auctions/results.
RGGI Auction Results, Quantities and Price
Center for Energy Studies
$0.00
$0.50
$1.00
$1.50
$2.00
$2.50
$3.00
$3.50
$4.00
0
5
10
15
20
25
30
35
40
45
50
Quantity Offered Quantity Sold Clearing Price
Cle
arin
g P
rice
($)
32 © LSU Center for Energy Studies
The Regional Greenhouse Gas Initiative is the only existing cap and trade
market for CO2 in North America. Prices have been stable, but recent auctions
have seen falling volumes.
($/t
on
CO
2 E
mitte
d)
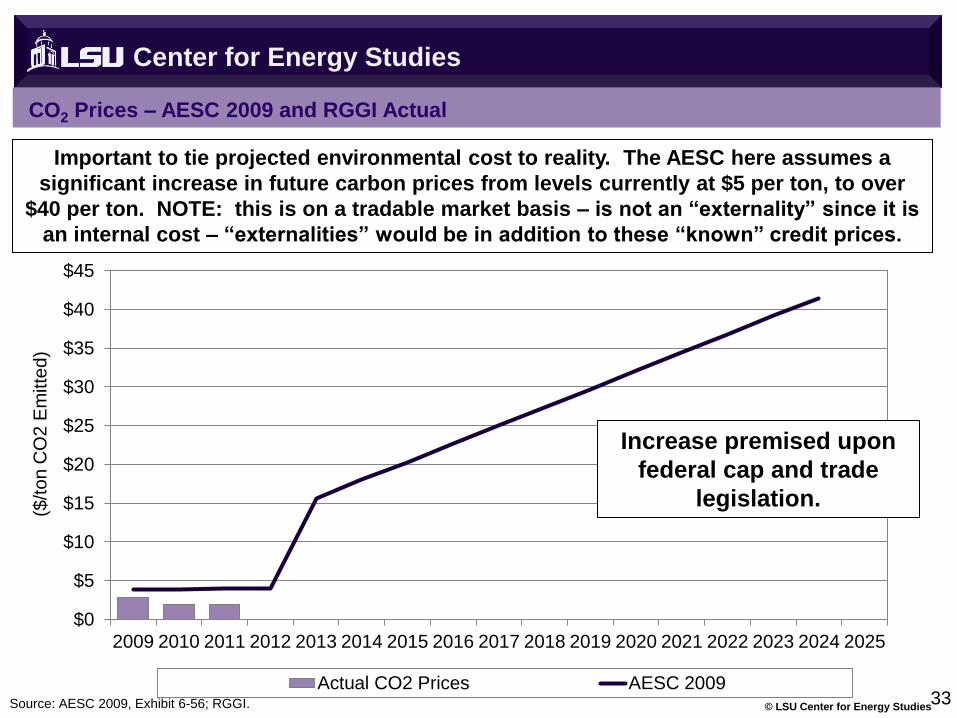
Source: AESC 2009, Exhibit 6-56; RGGI.
CO2 Prices – AESC 2009 and RGGI Actual
Center for Energy Studies
$0
$5
$10
$15
$20
$25
$30
$35
$40
$45
2009 2010 2011 2012 2013 2014 2015 2016 2017 2018 2019 2020 2021 2022 2023 2024 2025
Actual CO2 Prices AESC 200933
© LSU Center for Energy Studies
Important to tie projected environmental cost to reality. The AESC here assumes a
significant increase in future carbon prices from levels currently at $5 per ton, to over
$40 per ton. NOTE: this is on a tradable market basis – is not an “externality” since it is
an internal cost – “externalities” would be in addition to these “known” credit prices.
Increase premised upon
federal cap and trade
legislation.

($/t
on
CO
2 E
mitte
d)
Source: AESC 2009, Exhibit 6-56; AESC 2011, Exhibit 6-57.
CO2 Externality Value – AESC 2009 and AESC 2011
Center for Energy Studies
$0
$5
$10
$15
$20
$25
$30
$35
$40
$45
2009 2010 2011 2012 2013 2014 2015 2016 2017 2018 2019 2020 2021 2022 2023 2024 2025
AESC 2009 AESC 2011
Assumes
emergence of
Federal cap and
trade program.
34 © LSU Center for Energy Studies
Comparing prior to current AESC shows impact and timing of federal carbon regulation
assumptions.
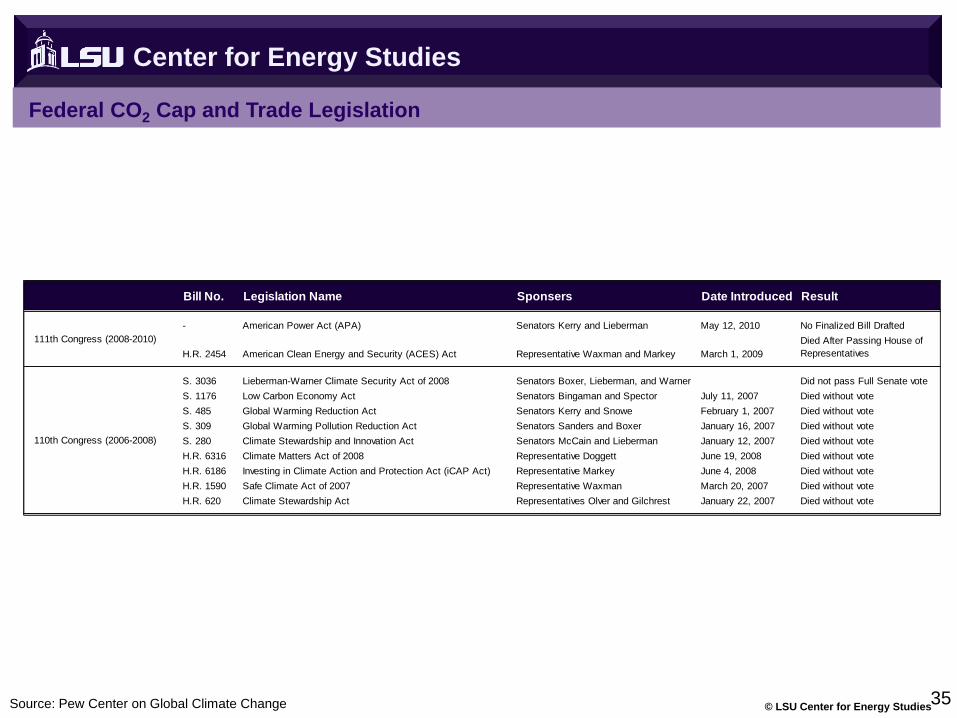
Source: Pew Center on Global Climate Change
Federal CO2 Cap and Trade Legislation
Center for Energy Studies
Bill No. Legislation Name Sponsers Date Introduced Result
- American Power Act (APA) Senators Kerry and Lieberman May 12, 2010 No Finalized Bill Drafted
H.R. 2454 American Clean Energy and Security (ACES) Act Representative Waxman and Markey March 1, 2009
Died After Passing House of
Representatives
S. 3036 Lieberman-Warner Climate Security Act of 2008 Senators Boxer, Lieberman, and Warner Did not pass Full Senate vote
S. 1176 Low Carbon Economy Act Senators Bingaman and Spector July 11, 2007 Died without vote
S. 485 Global Warming Reduction Act Senators Kerry and Snowe February 1, 2007 Died without vote
S. 309 Global Warming Pollution Reduction Act Senators Sanders and Boxer January 16, 2007 Died without vote
S. 280 Climate Stewardship and Innovation Act Senators McCain and Lieberman January 12, 2007 Died without vote
H.R. 6316 Climate Matters Act of 2008 Representative Doggett June 19, 2008 Died without vote
H.R. 6186 Investing in Climate Action and Protection Act (iCAP Act) Representative Markey June 4, 2008 Died without vote
H.R. 1590 Safe Climate Act of 2007 Representative Waxman March 20, 2007 Died without vote
H.R. 620 Climate Stewardship Act Representatives Olver and Gilchrest January 22, 2007 Died without vote
111th Congress (2008-2010)
110th Congress (2006-2008)
35 © LSU Center for Energy Studies

Source: Avoided Energy Supply Cost, 2011 Report
Changing Forecasted Environmental Costs Impact on Electric Price
Center for Energy Studies
36 © LSU Center for Energy Studies
$0
$20
$40
$60
$80
$100
$120
$140
$160
$180
2012 2017 2022 2027 2032 2037
Original On-Peak Electric Price
Updated On-Peak Electric Price (using new Environmental Assumptions)
(20
11
$/M
MB
tu)
Below updates avoided cost estimate for changing outlook for natural gas
prices AND tradable environmental credits. Overall, the impact of tradable
allowances on total costs are not sizable, unless, some additional “externality”
value is added.
Center for Energy Studies
Renewables
3
7 © LSU Center for Energy Studies

Source: PJM-GATS
Cost of Solar Renewable Energy Credits through PJM-GATS
Center for Energy Studies
$0
$100
$200
$300
$400
$500
$600
$700
Jan-10 Apr-10 Jul-10 Oct-10 Jan-11 Apr-11 Jul-11 Oct-11 Jan-12 Apr-12
Delaware District of Columbia Maryland
New Jersey Ohio Pennsylvania
Virgina
$ p
er
So
lar-
RE
C
38 © LSU Center for Energy Studies
Solar energy costs (SRECs) have decreased considerably over the
past year, even in high priced states such as New Jersey.

Cost of Non-Solar Renewable Energy Credits
Center for Energy Studies
39 © LSU Center for Energy Studies
Class 1 RECs have also seen considerable price decreases
although there has been some rebounding in the past year.
Source: Energy Efficiency & Renewable Energy Division, U.S. Department of Energy; Citing Spectron Group
Accessed at: http://apps3.eere.energy.gov/greenpower/markets/certificates.shtml?page=5

Source: Avoided Energy Supply Cost, 2011 Report
Changing Forecasted REC Prices Impact on Electric Price
Center for Energy Studies
40 © LSU Center for Energy Studies
$0
$20
$40
$60
$80
$100
$120
$140
$160
$180
2012 2017 2022 2027 2032 2037
Original On-Peak Electric Price
Updated On-Peak Electric Price (using new REC Price Forecast)
(20
11
$/M
MB
tu)
REC prices are avoidable costs that can be credited to avoided cost
if used for energy efficiency cost effectiveness analysis.

Center for Energy Studies
Conclusion
4
1 © LSU Center for Energy Studies

Source: Avoided Energy Supply Cost, 2011 Report
Effect of Changing Realities on Estimates of Avoided Electrical Prices
Center for Energy Studies
42 © LSU Center for Energy Studies
Estimated Estimated Estimated Estimated
2040 2040 2040 2040
On-Peak Off-Peak On-Peak Off-Peak
Electric Price Electric Price Electric Price Electric Price
($2011/MWh) ($2011/MWh) ($2011/MWh) ($2011/MWh)
Original AESC 2011 Estimate (A) $141 $115 $155 $120
'A' with Natural Gas Price
Forecasts Updated to Reflect
More Recent AEO Projections
(B) $82 $69 $90 $71
'B' Modifided to Reflect Current
Environmental Policy
Understanding
(C) $66 $52 $73 $55
'C' Modifided to Reflect Current
REC Prices(D) $69 $56 $76 $58
Total Effect 'A' to 'D' -51.08% -51.67% -50.83% -51.55%
Winter Summer

Source: Avoided Energy Supply Cost, 2011 Report
Effect of Changing Realities on Estimates of Avoided Electrical Prices
Center for Energy Studies
43 © LSU Center for Energy Studies
$0
$20
$40
$60
$80
$100
$120
$140
$160
$180
2012 2015 2018 2021 2024 2027 2030 2033 2036 2039
Original On-Peak Electric Price Updated On-Peak Electric Price
(20
11
$/M
Wh
)
Updated forecasts can result in differences of up to 50 percent.

Source: Avoided Energy Supply Cost, 2011 Report
Effect of Changing Realities on Estimates of Avoided Electrical Prices
Center for Energy Studies
44 © LSU Center for Energy Studies
$0
$20
$40
$60
$80
$100
$120
$140
2012 2015 2018 2021 2024 2027 2030 2033 2036 2039
Original Off-Peak Electric Price Updated Off-Peak Electric Price
(20
11
$/M
Wh
)
Updated forecasts can result in differences of up to 50 percent.
Center for Energy Studies
Questions, Comments and Discussion
45
www.enrg.lsu.edu