Embed Size (px)
Citation preview

______________________________________________________________________________________ Watkins, Stefan D. 2010. The Impact of Brownfield Reclamation on Surrounding Land Values and Crime.
Volume 12, Papers in Resource Analysis. 18 pp. Saint Mary‟s University of Minnesota University Central
Services Press. Winona, MN. Retrieved (date) http://www.gis. smumn.edu
The Impact of Brownfield Reclamation on Surrounding Land Values and Crime
Stefan D. Watkins
Department of Resource Analysis, Saint Mary’s University of Minnesota, Minneapolis,
MN 55404
Keywords: Brownfield, Reclamation, Parcels, Brownfield Parcel Group (BPG), Control
Parcel Group (CPG), Crime, ArcGIS, SPSS, Paired Sample T-Test, and Correlation
Abstract
How have land values and crime patterns changed near brownfields post reclamation?
This paper used geographic information systems analysis tools and statistical analysis to
measure the change in land values and crime occurrences over time. Land value and crime
data from 2002 were compared to the same geographic areas in 2005 using paired t-test
analyses. Both land value and crime statistics were analyzed on a micro-level and macro-
level level for purpose of comparisons. The goal was to demonstrate whether or not
brownfield sites have a measurable difference compared to control sites that did not
receive brownfield reclamation investment. Steps were taken to select control and
brownfield sites with similar qualities. Three different selection processes determined the
control sites. Land value tests had control sites selected based upon attributes such as land
use type, percent low-income residents, school district, and proximity to each other.
Crime analysis tests had control sites selected based upon proximity alone. A bivariate
correlation analysis was performed to determine if there was a relationship between
dollars spent on cleanup and impact on total crime, property crime, and violent crime in
2005. Post brownfield reclamation shows two of three brown parcel groups near
brownfields increased land values at the same rate as comparable control sites. The
analysis of all former brownfields in Central Minneapolis revealed parcel land values
within 1500 ft of brownfield sites showed a statistically significant decline in land value.
However, post brownfield reclamation, the Central Minneapolis control neighborhoods
showed significant increases in total value and property crime, but the neighborhoods
with brownfield reclamation did not.
Introduction
Governmental agencies and the public
have become increasingly aware of
advantages of cleaning up polluted or
derelict sites known as brownfields. A
George Washington University study
(Deason, Sherk, and Carroll, 2001)
reported, “Every brownfield acre
redeveloped would have required a
minimum of 4.5 acres had the same
project been located in a greenfield
area.” As neighborhoods go through a
lifecycle and into decay, renewed interest
in brownfield reclamation often follows.
In fortunate neighborhoods, high
property demand in heavy urban areas
helps drive private re-investment into
developing and cleaning up brownfield
sites. In areas where private investment
is too risky for property and business
investors, deed tax is levied to
financially support the cleanup of

2
brownfields and encourage private
investment.
Federal, state, and local
government agencies grant funds to
remediate areas of perceived
contaminants or toxic areas. The
Environmental Protection Agency (EPA)
(2009) at the federal level in 2009
funded 2,127 sites across the fifty states
and U.S. Territories (Figure 1).
Figure 1. Number of EPA funded brownfields by
region.
Figure 1 represents only the funded EPA
sites. An even larger number of sites
exist which either received funding from
other sources or went unfunded.
In many counties in the United
States, county commissioners approve
raising the deed tax for the purpose of
brownfield cleanup. With deed tax
collections, financial grants are awarded
to non-profit housing agencies, private
developers, and individuals with
property for the purpose of pollution
investigation and/or removal of the
hazardous materials.
This project explores measurable
impact on land values, total crime,
violent crime, and property crime near
brownfield reclamation areas before and
after investment of public dollars for
cleanup. The financial public investment
spent on brownfield reclamation is
considered highly significant to a wide
variety of stakeholders (Wedding and
Crawford-Brown, 2007). The
stakeholders in brownfield reclamation
processes include taxpayers, legislators,
non-profit organizations, private
industry, academia, multiple government
agencies, and others. Because brownfield
reclamation influences countless aspects
of redevelopment and improvements to a
community, everyone is ultimately
considered a stakeholder in the
reclamation of brownfields.
The stakeholders in this project
were the Hennepin County
Environmental Services (HCES), Aeon –
a non-profit housing organization, the
Minneapolis Police Department, and the
Metropolitan Council. HCES funds the
Environmental Response Fund (ERF)
with levied and appropriated deed tax.
The ERF fund was first awarded in 2001.
HCES‟s criterion for selection of
brownfield sites weights environment as
the highest priority. The goal of the
HCES is to identify the most threatening
brownfield sites to the environment,
water-table, and sewage systems and
assist only with assessment and clean up
cost. In 2001, HCES awarded
$1,539,605 to recipients. The ERF sites
that received reclamation funds ranged in
award value from $25,000 to $90,000.
Some of the money awarded goes to
investigation or the approximation of
quantity, quality, and dollars necessary
to perform cleanup. The sites chosen for
this research received dollars to remove
quantified pollution.
Aeon provides affordable
housing for 3,000 low-income residents
in the Minneapolis and Saint Paul,
Minnesota area. Aeon was awarded a
total of $410,200 in reclamation grants
for 2001 and 2002 combined from
HCES. Aeon targets sites that are
accessible to their clientele financially
and geographically. In some

3
circumstances, the sites Aeon chose
contain known contaminants, making
these sites eligible for Hennepin County
financial assistance.
The Minneapolis Police
Department has a stake in the successful
reclamation of brownfields. According to
De Sousa (2006), homelessness, gangs,
and crime are associated with brownfield
sites. In De Sousa‟s research at Mill
Ruins Park in Minneapolis, an 11.3%
decrease in crime post reclamation of the
brownfield site would seem to indicate
that the police department would be an
interested stakeholder and would support
brownfield reclamation.
The Metropolitan Council,
sanctioned by the Minnesota Legislature,
controls the seven counties comprising
Minneapolis, Saint Paul, and surrounding
suburbs. Each year all seven counties of
the metropolitan region assess parcel
land value data for the Metropolitan
Council. Compilation of tax assessor‟s
data by the Metropolitan Council and
inventory of brownfield distributions and
qualities help the council achieve and
track the comprehensive plan‟s financial
and environmental goals.
Many qualities of a neighborhood
are improved post reclamation.
Environmental, financial, socio-
economic, and livability issues are all
negatively influenced by the presence of
brownfield sites. Each of these negative
aspects draws different interest groups,
corporations, and the public making
brownfield reclamation and research a
major planning and re-development
issue.
Brownfields and Control Sites
Saint Barnabas Apartments, owned by
Aeon, houses young adults between the
ages of 16 and 21 years of age whose
families are unable or unwilling to
provide for them. In the fall of 2001, a
$25,000 investigation to quantify
contaminants revealed asbestos and lead
paint. In spring of 2002, a $65,000 ERF
grant funded the asbestos and lead paint
abatement. Saint Barnabas apartments
have received $7.43 million dollars from
numerous local and state governments
and non-profit agencies for renovations.
Alliance Apartments, the selected
control site to accompany Saint Barnabas
is also owned by Aeon housing. Alliance
Apartments is a housing development for
people recovering from substance abuse
problems. Both sites are zoned
multifamily residential and are located in
the Minneapolis school district with
100% low-income residents. In 2001, the
parcels of land that currently contain the
Stone Arch Apartments were vacant but
contained artifacts from previous
industrial use. In the fall of 2001, a
$90,000 grant from the ERF was
awarded to Wall Development Company
for the purpose of general cleanup of
former industrial activity. Although no
contaminants were recorded on the site,
decades of industrial activity had littered
the site and caused it to be classified as a
brownfield. This classification made the
site eligible for the ERF award. The
accompanying control site to Stone Arch
Apartments was the East West
Apartments. This multifamily apartment
complex is three blocks northeast of the
Stone Arch apartments.
Pine Cliff Apartments owned and
operated by Aeon, houses low-income
residents. Pine Cliff apartments was built
in 1970 and contained asbestos. The Pine
Cliff Apartments (Aeon) received
$80,000 for the abatement of
contaminants. Pine Cliff Apartments
today is a modern residential facility
providing housing for many residents.
The accompanying control site to
Pine Cliff Apartments was the Portland

4
Commons Apartments. This multifamily
apartment is south of Pine Cliff
Apartments and also has at least 25%
low-income residents.
Path to Brownfields and Beyond
Central Minneapolis, like many turn of
the century American cities, has a history
of large scale industrial production and
the associated financial rewards and
environmental consequences. The cycle
of increased industrial output due to new
technology, increased commercial
demand, and resulting pollutants have
left numerous brownfield sites in Central
Minneapolis. Materials such as lead and
asbestos, once thought to be harmless by
American consumers, were found in the
1970‟s to be a threat to public health.
The main objective of this study
was to examine the impact brownfield
reclamation had on parcel land values
that surround brownfields and to assess
changes in crime rates. In this project,
the surrounding brownfield parcel group,
including adjacent or contiguous groups,
will be referred to as a BPG. The control
parcel group, created to make
comparisons to the BPG, will be referred
to as a CPG.
Methods
The three main sets of data for this study
are the HCES brownfield data from fall
of 2001 and spring of 2002, the
Hennepin County parcel data containing
assessed land value, and a crime dataset
with quantities of total, violent, and
property crimes by Minneapolis
neighborhoods. The majority of the data
sources supplied the data in ArcGIS
shapefile format.
The resolution of the brownfield
data provided was detailed to the parcel
level. Each brownfield parcel had
information about the parcel pin number,
name of site applicant, amount of dollars
awarded, address, type of contaminant,
past use, and future use. Most important
to this study, the parcel dataset included
tax assessed land values for
approximately 43,000 parcels in
Hennepin County in the years 2002 and
2005. In research completed by Bacot
and O‟Dell (2006), property value and
brownfield relationships were studied
using data from the county tax
assessment office instead of Multiple
Listing Services, a real-estate data
source, because the assessor‟s dataset
was more complete. The Minneapolis
Police Department provided spreadsheets
of crime types and quantities at the
neighborhood level available to the
public from their website (Minneapolis
Police Department, 2010). According to
the downloaded Adobe “.pdf” files
provided by the Police Department, the
neighborhood crime data is accurate +-
2.5%.
Rational for Site Selection, Temporal
Comparison Scale, Paired t-test
Analysis, and the 1,500 Feet Sample
Radius for Selection of the Statistical
Testing Sample.
One task of this project involved using
ArcGIS for spatial selection,
categorizing, joining tables, and
cartography. The statistical analysis tools
in IBM‟s SPSS statistical software were
used to measure the financial impact of
brownfield reclamation on the BPGs and
CPGs (SPSS, 2010). SPSS offers the
paired two-sample t-test, a comparison of
sample means testing. This test compares
two samples collected from populations
with similar means making this test ideal
for showing significant change in land
value over the years. Microsoft‟s
spreadsheet application Excel and

5
Adobe‟s PDF Suite 2010 were used to
clean, parse, and transcribe crime data.
Microsoft Excel was also employed to
provide descriptive statistics, charts, and
graphs for this project.
Although the parcel data and
brownfield data extend throughout
Hennepin County, sites for paired t-test
analysis were chosen only in Central
Minneapolis. The Minneapolis sites
shared similar attributes that have an
effect on property value, such as
proximity to parks, a single school
district, similar tax policy, and a range of
25% -100% of the residents classified as
„low-income.‟ Four of the six sites are
also owned and operated by the non-
profit housing agency, Aeon. Six
Minneapolis sites, including three
brownfield sites and three control sites
were chosen for statistical analysis of
land value. The control sites were also
selected based on their similarity to the
brownfield sites. By choosing attributes
of the same quality in the control and
brownfield sites, variables were
standardized which allowed for a more
accurate comparison of change in
property values.
From interviewing employees at
HCES and Aeon it was revealed that all
projects started in 2001 and 2002 were
completed in 2005. This time frame was
the rationale for choosing years 2002 and
2005 for sample inputs.
Paired sample t-tests are ideal for
comparing observations from two
samples. A paired sample t-test compares
the means before and after an
intervention or experiment to find if a
statistically significant change occurred
in the samples over time. Each test was
performed on two identical sets of
parcels for each site. Quality measures
were taken by having an ID number tied
to each record in the samples together for
a one to one ratio of comparison.
Other researchers have studied
the gradient effect of brownfield
reclamation over geographic area. De
Sousa, Wu, and Westphal (2009)
performed research measuring the impact
brownfields had on surrounding property
values in Minneapolis between 1997
through 2003. They concluded the
optimal geographic footprint of influence
from brownfield reclamation was a 1500
ft radius with a gain of 4.2% on land
value prices. Another test concluded by
De Sousa et al. (2009) found a
geographic footprint of 2,500 ft radius
only had a 1.8% gain. Considering these
findings, this project used the 1,500 ft
selection radius to geographically collect
samples and statistically test for changes
in property value means adjacent and
contiguous to former brownfields.
Brownfields and Land Value Testing
Three broad groups of paired t-tests were
conducted to examine the impact
brownfield reclamation had on land
values of surrounding parcels in 2002
and 2005. The first group of paired t-
tests includes an examination of three
BPG‟s and three CPG‟s. The second
group of t-tests includes the same six
sites but the geographic footprint of
selected parcels was expanded to a 1500
ft radius around the brownfield and
control sites. The third group of paired t-
tests examines all HCES brownfield sites
in Central Minneapolis for 2001 and
2002 at the same 1500 ft radius sample
area. It should be noted all samples
selected for paired t-test comparisons
had the brownfield parcels removed from
the analysis. Removal of brownfield
parcels from the samples focused the
study on the effect of parcels around
brownfields.
All sample selections collected
from the parcel data included records of

6
a $0 value for the parcel. According to
the Hennepin County Tax Assessors
office, parcels that have a value of $0 are
exempt by the county and may include
federal, state, county, or municipal
property, cemeteries, highway right-of-
ways, and emergency shelters. These
parcels were excluded from statistical
analysis. All control sites were at least
1500 ft from the nearest brownfield site
and shared similar attributes previously
discussed.
Group 1: A Comparison of Adjacent
Parcels of Three Brownfields and Three
Control Sites in 2002 and 2005
The six sites each underwent a spatial
selection in ArcGIS by manually
selecting only the parcels adjacent to the
brownfield site for both 2002 and 2005.
Manual selection was necessary because
adjacent parcels ranged in size
significantly from site to site making it
impossible to use a radial buffer
selection or any other available “select
by location” process. An example of the
selected adjacent parcels is shown in
Figure 2.
Figure 2. Pine Cliff Apartments and selected
adjacent parcels in orange.
Group 2: A Comparison of 1500 ft of
Contiguous Parcels for Three Selected
Brownfields and Three Selected Control
Sites in 2002 and 2005
The process of geographically selecting
relevant parcels in Minneapolis within
1500 ft involved several steps in ArcGIS.
The joining of attributes, based on parcel
ID numbers, kept only matching records
between multiple tables which ensured a
one-to-one ratio for comparison over
time. In ArcGIS, joins performed had
less than 1% of the parcels removed by
using the “keep only matching records”
option. The 2005 land value data was
joined to the 2002 land value data so as
to retain chronological sequence of
attributes for easier identification of
appropriate years for analysis. The
resultant joined attributes table
underwent a spatial selection that
intersected the brownfield layer and
applied a1500 ft buffer to expand the
selection sample. The selection sets table
was exported to dBase table for cleaning
in Excel and analysis in SPSS.
Group 3: A Comparison of 1500 ft of
Contiguous Parcels to All Brownfields
in Central Minneapolis in 2002 and
2005 and all Other Parcels as Control
Selection of samples for the third group
was the same for group two except the
selection was applied to all nine Central
Minneapolis brownfields instead of the
three sites for the previous two test
groups (Figure 3). The BPG selection for
this test was inverted or “switched”
within the attributes table in ArcGIS to
capture all parcels farther than 1,500 feet
from a brownfield in Minneapolis. The
switching of the BPG selection created
the CPG selection and excluded all
parcels within 1500 ft of brownfields.

7
Figure 3. Selection areas for group 3.
Crime Analysis
The Minneapolis Police Department
crime data provided the base inputs for
the crime analysis. Two different
statistical tests showed the change and
relationships between brownfields and
crime quantity and type. The crime data
was prepared in Excel, collected in
ArcGIS, and statistically analyzed in
SPSS. The Minneapolis Police
Department‟s crime data came in an
Adobe “pdf” file format from their
website for the year 2002. Considering
the limitation and scope of this project,
two categories, property and violent
crime, were used to classify the different
types of crime as shown in Table 1.
Table 1. Groupings of police crime data into two
categories for paired t-test analysis.
Violent Crime Homicide, rape, robbery,
assault
Property Crime Burglary, theft, motor vehicle
theft, and arson
The Adobe “.pdf” file format
cannot be imported into spreadsheet
format in Excel or table format in Micro-
soft Word. The data from the Adobe files
were entered for all relevant
neighborhoods in Central Minneapolis.
This parsing and filtering of crime data
into spreadsheets in Excel prior to the
ArcGIS join focused data to five
brownfield composite control areas.
Paired t-tests were conducted for years
2002 and 2005. A bivariate correlation
analysis showed the relationship between
award amount from HCES and the
change in quantity and quality of crimes
between years 2002 and 2005. Because
the crime data published by the
Minneapolis Police Department is at the
neighborhood level and not at the parcel
level, a new method of sample collection
was implemented. The neighborhoods‟
crime data spreadsheet was joined to the
neighborhood data layer in ArcGIS. The
procedure for sample collection of the
control sites involved selecting
neighborhoods from multiple adjacent
neighborhoods that did not possesses any
HCES brownfields. By selecting all
8
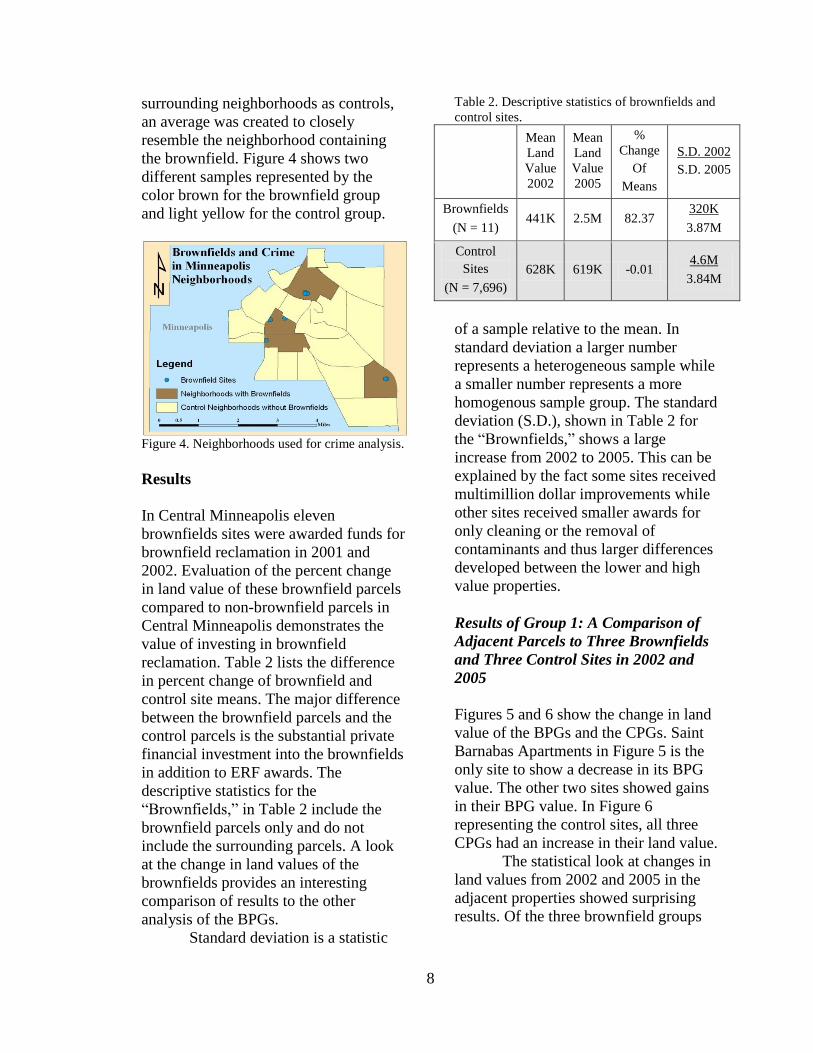
surrounding neighborhoods as controls,
an average was created to closely
resemble the neighborhood containing
the brownfield. Figure 4 shows two
different samples represented by the
color brown for the brownfield group
and light yellow for the control group.
Figure 4. Neighborhoods used for crime analysis.
Results
In Central Minneapolis eleven
brownfields sites were awarded funds for
brownfield reclamation in 2001 and
2002. Evaluation of the percent change
in land value of these brownfield parcels
compared to non-brownfield parcels in
Central Minneapolis demonstrates the
value of investing in brownfield
reclamation. Table 2 lists the difference
in percent change of brownfield and
control site means. The major difference
between the brownfield parcels and the
control parcels is the substantial private
financial investment into the brownfields
in addition to ERF awards. The
descriptive statistics for the
“Brownfields,” in Table 2 include the
brownfield parcels only and do not
include the surrounding parcels. A look
at the change in land values of the
brownfields provides an interesting
comparison of results to the other
analysis of the BPGs.
Standard deviation is a statistic
Table 2. Descriptive statistics of brownfields and
control sites.
Mean
Land
Value
2002
Mean
Land
Value
2005
%
Change
Of
Means
S.D. 2002
S.D. 2005
Brownfields
(N = 11) 441K 2.5M 82.37
320K
3.87M
Control
Sites
(N = 7,696)
628K 619K -0.01 4.6M
3.84M
of a sample relative to the mean. In
standard deviation a larger number
represents a heterogeneous sample while
a smaller number represents a more
homogenous sample group. The standard
deviation (S.D.), shown in Table 2 for
the “Brownfields,” shows a large
increase from 2002 to 2005. This can be
explained by the fact some sites received
multimillion dollar improvements while
other sites received smaller awards for
only cleaning or the removal of
contaminants and thus larger differences
developed between the lower and high
value properties.
Results of Group 1: A Comparison of
Adjacent Parcels to Three Brownfields
and Three Control Sites in 2002 and
2005
Figures 5 and 6 show the change in land
value of the BPGs and the CPGs. Saint
Barnabas Apartments in Figure 5 is the
only site to show a decrease in its BPG
value. The other two sites showed gains
in their BPG value. In Figure 6
representing the control sites, all three
CPGs had an increase in their land value.
The statistical look at changes in
land values from 2002 and 2005 in the
adjacent properties showed surprising
results. Of the three brownfield groups

9
Figure 5. Total value of all adjacent parcels to brownfield sites.
only one site, Stone Arch Apartments,
showed a statistically significant gain in
mean value (Table 3). While only one
BPG showed a statistically significant
increase in mean value, two of the three
control groups showed a statistically
significant increase in their mean values,
the East West Apartments and the
Portland Apartments. In interviews
performed by De Sousa et al. (2009)
many people stated the most apparent
influence on land value would be on the
adjacent parcels to the brownfield.
Contrary to the opinions of the people
Figure 6. Total value of all adjacent parcels to control site.
$0
$1,000,000
$2,000,000
$3,000,000
$4,000,000
$5,000,000
$6,000,000
Stone Arch
Apartments
St. Barnabas
Apartments
Pine Cliff
Apartments
Sums of Parcels' Property Values Adjacent to Brownfields
Brownfield Sites 2002
Brownfield Sites 2005
$0
$1,000,000
$2,000,000
$3,000,000
$4,000,000
$5,000,000
$6,000,000
$7,000,000
Alliance
Apartments
East West
Apartments
Portland
Apartments
Sums of Parcels' Property Values Adjacent to Control Sites
Control Sites 2002
Control Sites 2005

10
Table 3. Descriptive and paired t-test results from analysis of adjacent parcel selection.
Sample
Size
Mean
Land
Value
2002 ($)
Mean
Land
Value
2005 ($)
%
Change
Of
Means
S.D.
2002
($)
S.D.
2005
($)
Sig. (1-tailed)
p-value
Stone Arch
Apartments
(Brownfield)
5 559,780 628,900 10.99% 749,455 816,941 0.04
St. Barnabas
Apartments
(Brownfield)
5 986,480 729,080 -35.30% 133,4941 808,985 0.17
Pine Cliff
Apartments
(Brownfield)
8 187,625 216,400 13.30% 199,015 276,062 0.23
East West
Apartments
(Control Site)
9 569,388 732,777 22.30% 468,231 618,394 0.00
Alliance
Apartments
(Control Site)
7 169,700 190,171 10.76% 137,007 159,662 0.20
Portland
Apartments
(Control Site)
8 115587 183025 36.85% 71082 103,412 0.00
interviewed in the De Sousa et al. study
(2009), the results from this project
showed no significant change to land
values on adjacent BPG‟s. Additional
tests were conducted with larger sample
sizes to search for significance.
Results of Group 2: A Comparison of
1500 ft of Contiguous Parcels of Three
Selected Brownfields and Three
Selected Control Sites in 2002 and 2005
Figures 7 and 8 show change in land
value sums of BPGs and CPGs. The
Saint Barnabas Apartments (Figure 7) is
the only site to show a decrease in its
BPG land value sum, despite the much
larger sample size of 173 parcels instead
of five parcels. The other two sites
showed gains in their BPG land value
sums. In Figure 8, representing the
control sites, all three CPGs had an
increase in their land value sums
between the years 2002 and 2005. When

11
Figure 7. Total value of all contiguous parcels 1500 ft out from brownfield sites.
Figure 8. Total value of all contiguous parcels 1500 ft out from control sites.
$0
$20,000,000
$40,000,000
$60,000,000
$80,000,000
$100,000,000
$120,000,000
$140,000,000
$160,000,000
$180,000,000
Stone Arch
Apartments
St. Barnabas
Apartments
Pine Cliff
Apartments
Sums of Parcels' Property Values 1500 ft Contiguous to Brownfield Sites
Brownfields 2002
Brownfields 2005
$0
$50,000,000
$100,000,000
$150,000,000
$200,000,000
$250,000,000
East West
Apartments
Alliance
Apartments
Portland
Apartments
Sums of Parcels' Property Values 1500 ft Contiguous to Control Sites
Control Sites 2002
Control Sites 2005

12
the sample collection radius of 1500 ft
was applied to the sample collection
process, the number of parcels increases
into the hundreds. In tests of individual
sites within a 1500 ft collection area,
sample parcels were abundant enough to
increase the average sample size to 283
parcels from the average sample of seven
parcels in the adjacent analysis tests.
These larger samples resulted in a
statistically significant increase in means
in five sites except one brownfield site,
Saint Barnabas Apartments as seen in
Table 4.
Results of Group 3: A Comparison of
1500 ft of Contiguous Parcels to All
Brownfields in Central Minneapolis in
2002 and 2005 and all Other Parcels as
the Control Group
Figure 9 shows the change in
land value sums of all BPGs and CPGs.
From 2002 to 2005, the sum BPGs of the
eleven brownfields in Central
Minneapolis decreased in total land
value. In contrast, the control area had an
overall gain in total land value. A look at
all Central Minneapolis BPGs within
1500 ft showed a decrease in average
land value over time as seen in the
percent change of means in Table 5. The
CPG, which encompassed the inverted
selection of the BPG, had a large gain in
mean land value. The BPG showed
statistically significant decrease in means
over years 2002 and 2005 while the
control group showed a statistically
significant increase in means over the
same period.
Table 4. Descriptive and paired t-test results from analysis of 1500 ft radius of contiguous parcel selection.
Sample
Size
Mean
Land
Value
2002 ($)
Mean
Land
Value
2005 ($)
%
Change
Of
Means
S.D.
2002
($)
S.D.
2005
($)
Sig. (1-tailed)
p-value
Stone Arch
Apartments
(Brownfield) 205 550751 690564 20.25% 1087249 1261724 0.02
St. Barnabas
Apartments
(Brownfield) 173 919441 873871 -5.21% 1662652 1463107 0.13
Pine Cliff
Apartments
(Brownfield) 314 289315 369230 21.64% 423002 513450 0.00
East West
Apartments
(Control Site) 431 399510 510132 21.68% 736494 900486 0.00
Alliance
Apartments
(Control Site) 289 401987 475181 15.40% 794914 913804 0.00
Portland
Apartments
(Control Site) 286 265332 348367 23.84% 704307 923074 0.00

13
Figure 9. The sum of all BPGs and the sum of
CPGs between years 2002 and 2005.
Standard Deviation and Brownfields
Universal to all sample groups near
BPGs is the decrease in the standard
deviation in land values. This means post
brownfield investment showed samples
are closer in value to each other with an
overall reduction of outliers within the
sample. The adjacent group, the three
individual sites group, and the group
containing all BPGs showed a decrease
in standard deviation relative to their
control group as seen in Tables 3, 4, and
5.
Results of Crime Analysis: A
Comparison of Central Minneapolis
Neighborhoods’ Crime Levels with and
without Brownfields in 2002 and 2005.
The percent change of total crime,
violent crime, and property crime
increased at a much smaller rate in
neighborhoods where brownfields were
cleaned or abated, while the percent
change in neighborhoods without
brownfields showed a larger increase in
total and property crime (Figure 10).
Table 5. Descriptive and paired t-tests results from the 2002 -2005 analysis of all eleven brownfields in
Central Minneapolis and all Central Minneapolis parcels not within 1500 ft of a brownfield (labeled Control
in table).
Sample
Size
Mean
Land
Value
2002
($)
Mean
Land
Value
2005
($)
%
Change
Of
Means
S.D.
2002
($)
S.D.
2005
($)
Significance
(1-tailed)
p-value
Central
Minneapolis
Brownfield
1,747 1,144,676 1,056,861 -8.31% 7,100,179 5,782,580 0.01
Control
Group
19,716 366,839 417,349 12.10% 2,141,951 1,873,351 0.00
$0
$1,000,000,000
$2,000,000,000
$3,000,000,000
$4,000,000,000
$5,000,000,000
$6,000,000,000
$7,000,000,000
$8,000,000,000
$9,000,000,000
Bro
wnfi
eld
s 2
00
2
Bro
wnd
fiel
ds
20
05
Co
ntr
ol
20
02
Co
ntr
ol
20
05
All Brownfields 1500 ft Radius and
Control

14
Figure 10. Maps showing the number of crimes per neighborhood in 2002 and 2005.
Crime in Central Minneapolis
overall increased across all
neighborhoods. As noted in Table 6, the
rate of crime increase was low enough to
not be of statistical significance in
former Brownfield areas. All
neighborhoods with brownfield
reclamation performed showed no
significant gain in total, property, or
violent crime. In the control group of
neighborhoods, total and property crime
register statistically significant gains in
mean while violent crime did not
increase significantly.
15
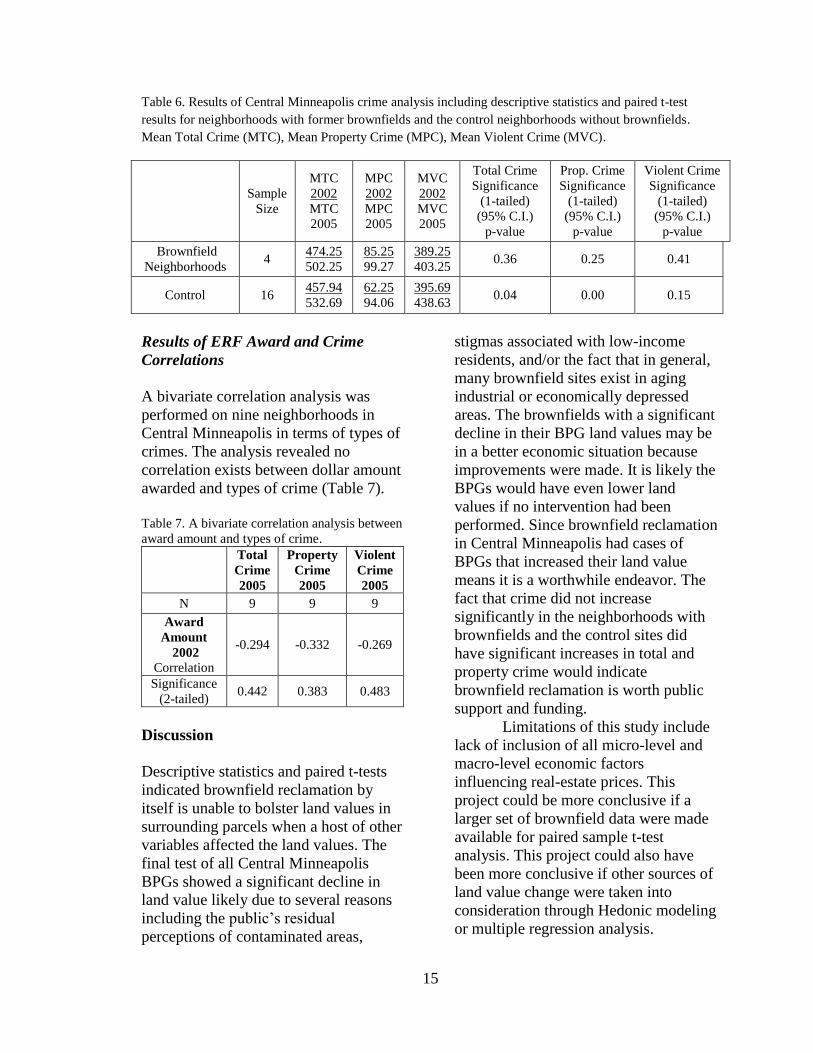
Table 6. Results of Central Minneapolis crime analysis including descriptive statistics and paired t-test
results for neighborhoods with former brownfields and the control neighborhoods without brownfields.
Mean Total Crime (MTC), Mean Property Crime (MPC), Mean Violent Crime (MVC).
Sample
Size
MTC
2002
MTC
2005
MPC
2002
MPC
2005
MVC
2002
MVC
2005
Total Crime
Significance
(1-tailed)
(95% C.I.)
p-value
Prop. Crime
Significance
(1-tailed)
(95% C.I.)
p-value
Violent Crime
Significance
(1-tailed)
(95% C.I.)
p-value
Brownfield
Neighborhoods 4
474.25
502.25
85.25
99.27
389.25
403.25 0.36 0.25 0.41
Control 16 457.94
532.69
62.25
94.06
395.69
438.63 0.04 0.00 0.15
Results of ERF Award and Crime
Correlations
A bivariate correlation analysis was
performed on nine neighborhoods in
Central Minneapolis in terms of types of
crimes. The analysis revealed no
correlation exists between dollar amount
awarded and types of crime (Table 7).
Table 7. A bivariate correlation analysis between
award amount and types of crime.
Total
Crime
2005
Property
Crime
2005
Violent
Crime
2005
N 9 9 9
Award
Amount
2002 Correlation
-0.294 -0.332 -0.269
Significance
(2-tailed) 0.442 0.383 0.483
Discussion
Descriptive statistics and paired t-tests
indicated brownfield reclamation by
itself is unable to bolster land values in
surrounding parcels when a host of other
variables affected the land values. The
final test of all Central Minneapolis
BPGs showed a significant decline in
land value likely due to several reasons
including the public‟s residual
perceptions of contaminated areas,
stigmas associated with low-income
residents, and/or the fact that in general,
many brownfield sites exist in aging
industrial or economically depressed
areas. The brownfields with a significant
decline in their BPG land values may be
in a better economic situation because
improvements were made. It is likely the
BPGs would have even lower land
values if no intervention had been
performed. Since brownfield reclamation
in Central Minneapolis had cases of
BPGs that increased their land value
means it is a worthwhile endeavor. The
fact that crime did not increase
significantly in the neighborhoods with
brownfields and the control sites did
have significant increases in total and
property crime would indicate
brownfield reclamation is worth public
support and funding.
Limitations of this study include
lack of inclusion of all micro-level and
macro-level economic factors
influencing real-estate prices. This
project could be more conclusive if a
larger set of brownfield data were made
available for paired sample t-test
analysis. This project could also have
been more conclusive if other sources of
land value change were taken into
consideration through Hedonic modeling
or multiple regression analysis.

16
While the Hennepin County
parcel dataset provided the most
comprehensive collection of land value
prices, it did not provide actual land
values which are determined from the
sale of real-estate. While the parcel
dataset is based on a tax assessor‟s „best
estimate‟ of land value, it lacks true
values the parcels may have been worth
at the time. After consideration of the
scope of this project, the tax assessor‟s
dataset provided the only comprehensive
collection of approximated land values
for Central Minneapolis and was
therefore used to determine land values.
Between years 2002 and 2005,
total crime, property crime, and violent
crime increased in all neighborhoods
with brownfields and the control
neighborhoods without brownfields. The
difference was the neighborhoods with
brownfield reclamation completed by
2005 had a much lower increase in all
types of crime. Not only was the increase
lower than the control areas but it had no
statistically significance difference in
means as revealed by the paired t-test.
Alternatively, the control areas showed
statistically significant increases in
property crime, violent, and total crime.
This would indicate brownfield
reclamation may have an effect on
keeping crime levels more stable
compared to control areas.
It could be argued a larger
influence on holding crime stable was
not the brownfield reclamation, but
rather the fact three of the four
neighborhoods with redeveloped
brownfields were designated for housing
low-income residents, former drug users,
and homeless young adults. Perhaps
without brownfield reclamation, these
residents may have been more prone to
commit crimes in the area.
Suggestions for Future Studies
Creating a project from a wide variety of
data inputs requires the researcher to
think of creative ways to perform
analysis. To enhance the work performed
for this project, future research might
look at collecting multiple radii
footprints within the parcel layer for
evaluation of means. These different
sized footprints and samples might
reveal the nature of the land value
gradient or distance decay. These
gradients may show if land values
changed in a linear fashion as parcels
move further out from a brownfield or if
they change in a logarithmic pattern. A
study of gradients could also help
identify the point of diminishing returns
from investment into brownfield
reclamation. Furthermore, an analysis of
land value changes on specific zone
types (industrial, commercial, and
residential) post brownfield reclamation
would show the degree of change on
each zone type.
In this project, some of the former
brownfields were transformed into
functional apartment buildings. A study
on the impact of retail businesses from
the new apartment buildings could give
credence to further governmental
brownfield investment in places private
developers refuse to invest. Furthermore,
a study of the number of new businesses
that started after reclamation relative to
similar areas without reclamation
investment could show the absolute
value of governmental brownfield
reclamation.
Conclusion
The focus of this project was on land
value changes for parcels near
brownfields and the change in total
crime, property crime, and violent crime
before and after brownfield reclamation.
It is important to note many other

17
variables besides land value and crime
are affected by brownfield reclamation.
Other intrinsic benefits of brownfield
reclamation include environmental
improvements and equity of resources
amongst classes and racial boundaries.
In this study of Central
Minneapolis, two out of the three
brownfield parcel groups showed a
significant gain in land value; however
the analysis that included all of former
brownfields revealed parcel land values
within 1500 ft of brownfield sites
showed a statistically significant decline
in land value. When considering crime
post brownfield reclamation, the control
areas showed significant increases in
total and property crime, but
neighborhoods with brownfields did not
show a statistically significant difference
in total crime, property crime, and
violent crime.
The results from this project
indicate brownfield reclamation for low-
income housing areas does not
necessarily significantly increase the
land value of surrounding properties or
significantly decrease crime within a
three year period; however the study
results indicate the parcels that surround
brownfields have benefitted and might
have been in worse condition had
reclamation not occurred. At a minimum,
the environmental toll may ultimately
have been more costly without
brownfield reclamation for the
surrounding parcels. Governmental
incentives such as the ERF program
provide an opportunity for private
investment to supplement funding for
reinvestment into economically troubled
areas.
Acknowledgments
The Department of Resource Analysis
staff at Saint Mary‟s University deserves
special thanks for their tireless guidance,
thought provoking questions, and
assistance in data procurement. I would
like to thank Dave Jaeger and Donovan
Koxvold of Hennepin County
Environmental Services for meeting with
me to discuss the project and for
providing crucial data for this project.
The Metropolitan Council for access to
Hennepin County parcel data. I would
like to thank the Congress of the United
States of America for providing the
Freedom of Information Act, making
crime data available for citizens to
scrutinize. I would like to thank James
Atchison, the Hennepin County Tax
Assessor, who helped me understand the
property assessment process. Finally, I
would like to thank David Kadlec and
Kitty Hurly for their support and
constructive comments on my project.
References
Bacot, H., and O‟Dell, C. 2006.
Establishing Indicators to Evaluate
Brownfield Redevelopment. Economic
Development Quarterly 20:142-161.
Deason, J.P., Sherk, G.W., and Carroll,
G. 2001. Public Policies and Private
Decisions Affecting the
Redevelopment of Brownfields: An
Analysis of Critical Factors, Relative
Weights and Areal Differentials.
George Washington University,
Washington D.C. Retrieved January 20,
2010 from http://www.gwu. edu/~eem/
Brownfields/index.htm.
De Sousa, C.A. 2006. Unearthing the
Benefits of Brownfield to Green Space
Projects: An Examination of Project
Use and Quality of Life Impacts. Local
Environment 11:577-600.

18
De Sousa, C.A., Wu, C., and Westpahl,
L.M. 2009. Assessing the Effect of
Publicly Assisted Brownfield
Redevelopment on Surrounding
Property Values. Economic
Development Quarterly 23:95-110.
Environmental Protection Agency. 2009.
Brownfields Grant Factsheet Search.
Washington D.C. Retrieved in October,
2010 from http://cfpub.epa.gov/bf_
factsheets/index.cfm?grant_type_id=10
02&grant_announcement_year=.
Minneapolis Police Department. 2010.
Retrieved July 2010 from http://www.
ci.minneapolis.mn.us/police/crime-
statistics/codefor/statistics.asp.
SPSS. 2010. Retrieved November 2010
from http://www.spss.com/.
Wedding, G.C., and Crawford-Brown, D.
2007. Measuring site level success in
brownfield redevelopments: A focus on
sustainability and breed building.
Journal of Environmental Management
85:483-495.