Embed Size (px)
Citation preview

27
The Impact of Behavioural Factors on
Investment Decision Making and
Performance of CSE Investors
in Eastern Province of Sri Lanka
N Rajeshwaran
Sri Lanka Journal of Economic Research
Volume 8(1) December 2020
SLJER 08.01.02: pp. 27-51 Sri Lanka Forum of
University Economists
DOI: http://doi.org/10.4038/sljer.v8i1.123
Abstract
Objectives of the study are twofold; first, to identify behaviour of CSE investors in
Eastern province of Sri Lanka; second, to examine how behavioural factors impact on
investment performance of CSE investors in the province. The research was conducted
from positivism perspective and deductive reasoning was used as research approach.
Survey strategy was applied to collect data and time horizon was cross sectional.
Proportionate stratified random sampling technique was applied to choose the sample
from the districts. Data were collected via questionnaires from 374 investors of CSE in
the province. Mean, standard deviation, correlation and multiple regression were applied.
Results show that all four behavioural factors and investment performance have fallen to
moderate levels. According to Heuristic variables, investors rely on their skill, knowledge
and previous experience. The investors mostly avoid loss and regret in investment on
stocks as per the Prospect variables. Out of Market variables, the investors carefully
consider the price changes of stocks while moderately analyse the companies’ customer
preference. In line with Herding variable, the investors also follow others’ decision to
invest. Heuristic variables are positively related with investment performance while other
variables namely prospect variables, market variables and Herding variables are
negatively related with investment performance. Recommendations are given to current
and potential investors as well as executives in the stock market for promoting investment
in stock exchange
Keywords: CSE Investors, Eastern Province, Investment Performance, Investors’
Behaviour
N Rajeshwaran Department of Commerce, Eastern University, Sri Lanka.
Email: [email protected] , [email protected] Tel: +94 77 906 0623
https://orcid.org/0000-0001-8056-9093

SLJER Volume 08 Number 01, December 2020
28
INTRODUCTION
Traditional financial theories are classical decision theory, rationality, risk aversion,
model portfolio theory (MPT), the capital asset pricing model (CAPM), and the efficient
market hypothesis (EMH) which is dominant over the several decades (Huang et al.,
2016; Fama, 1970). However, Ackert (2014) found that many of the assumptions and
findings associated with traditional finance theories are not accurate. Therefore,
behavioural finance researchers moved to observe behaviours to develop models that
describe how investors actually reach their decisions (Ackert, 2014). “Behavioural
finance theories, which are based on psychology attempt to understand how emotions and
cognitive errors influence individual investors’ behaviors” (Luong and Ha, 2011). Despite
there are a lot of studies available pertaining to stock market particularly share price
movement, capital structure in Sri Lanka (Menike, 2006; Menike & Prabath, 2014;
Hettiarachchi, & Rajeshwaran, 2016), investors’ behaviour are not clearly studied. A
better understanding of behavioural processes and outcomes are important for financial
planners. Because, an understanding of how investors generally respond to market
movements would help them in devising appropriate asset allocation strategies for clients
(Al-Tamimi, 2006).
Potter in 1971 identified six factors that affect individuals’ investment behaviour. His
results showed dividends, rapid growth and investment for saving purposes, quick profits
through trading, professional investment management and long-term growth that affect
individual investor’s attitudes towards their investment decisions. According to the
survey, those factors are most influential to the investors’ investment decisions. Similarly,
Blume and Friend (1978), using Wharton survey results, provided a comprehensive study
on implications of behavioural finance and found that basic measures of risk undertaken
by individual investors are price and earning volatility. Further, Abu-Nassar and
Rutherford (1996) argued that the annual corporate reports are the most important source
of information to make decisions by the different groups of investors. Menike (2006)
noted that inflation, interest rates, exchange rates are the most influential factors to the
investors to make investment decisions. Sultana and Pardhasaradhi (2012) identified that
following factors: individual eccentricity, wealth maximization, risk minimization, brand
perception, social responsibility, financial expectation, accounting information,
government and media, economic expectation and advocate recommendation, affect the
investors’ decisions in India. Different scholars indicated different influencing factors on
investors’ behaviour in different countries.
Sri Lanka is a different country with regard to culture, political and legal settings
compared to developed nations as well as some developing countries. Therefore, findings
from other countries cannot be applied directly to the Sri Lankan setting. In addition,
there is no accurate information regarding investors’ behaviour in Colombo Stock
Exchange except the study of Kengatharan and Kengatharan (2014). Kengatharan and
The Impact of Behavioural Factors on Investment Decision Making and
Performance of CSE Investors in Eastern Province of Sri Lanka
29
Kengatharan (2014) conducted a study for examining investors’ behaviour in Sri Lanka.
Their sample size was 128 which is not adequately representing the population of the
study and those findings cannot be used to generalize the Sri Lankan setting. Moreover,
their study does not reveal investors behaviour of Eastern province in Sri Lanka. Further,
the study was conducted before 2014. Therefore, it is necessary to re-conduct the study
with adequate sample size representing the population in order to understand the current
phenomenon of investors’ behavior.
Although 797,192 CSE investors exist in Sri Lanka, only 12,589 investors are existing in
Eastern province (Central depository system, 2016). As a preliminary stage the study
focuses on behaviour of investors in Eastern province of Sri Lanka. Because a number of
CSE investors are less in the province compared with other provinces even though there
are a lot of natural resources and investment opportunities available in the province
(Ceylontoday, 2016).
After the end of the civil disturbances, many infrastructure development efforts have been
undertaken in the province, ranging from from roads to electricity tanks refurbishment,
etc. But what is important is to explore the possibility of bringing investment into the
region because it has so much potential and resources available in every sector. In order
to develop the region, it is necessary to boost the investors in the region. But,
unfortunately, not many among the public from the region are involved in investing in
CSE. Therefore, understanding CSE investors’ behaviour is important to promote the
potential investors to invest in the CSE. Consequently, it is expected that such would
enhance capital of the public companies, which, in turn, would facilitate bringing new
investment opportunities in to the region.
This study was conducted to identify the factors that affect investors’ behaviour of
Eastern Province towards investment in CSE and to understand how those factors impact
on investment performance of investors in the province. It provides new insights about
investors’ behavior. Findings of the study helps prospective investors to understand the
share market operations and how it could be safely and profitably invested than investing
in gold or land. As a result, it undoubtedly expands horizons of knowledge regarding the
share market, as well as the country’s economy. In addition, research findings facilitate
security organization to predict the investors’ behaviour and provide more reliable
consultant information to the investors. Therefore, this research is undertaken.
Problem Statement
Capital market plays a vital role to fulfill long term financial requirements of the
company. In addition, the stock market highly contributes to operations of the companies
and national economy (Jaswani, 2008). Nevertheless, individual investment decision
making is imperative to determine share market trends as it impacts on the national
economy (Kengatharan and Kengatharan, 2014).
SLJER Volume 08 Number 01, December 2020
30
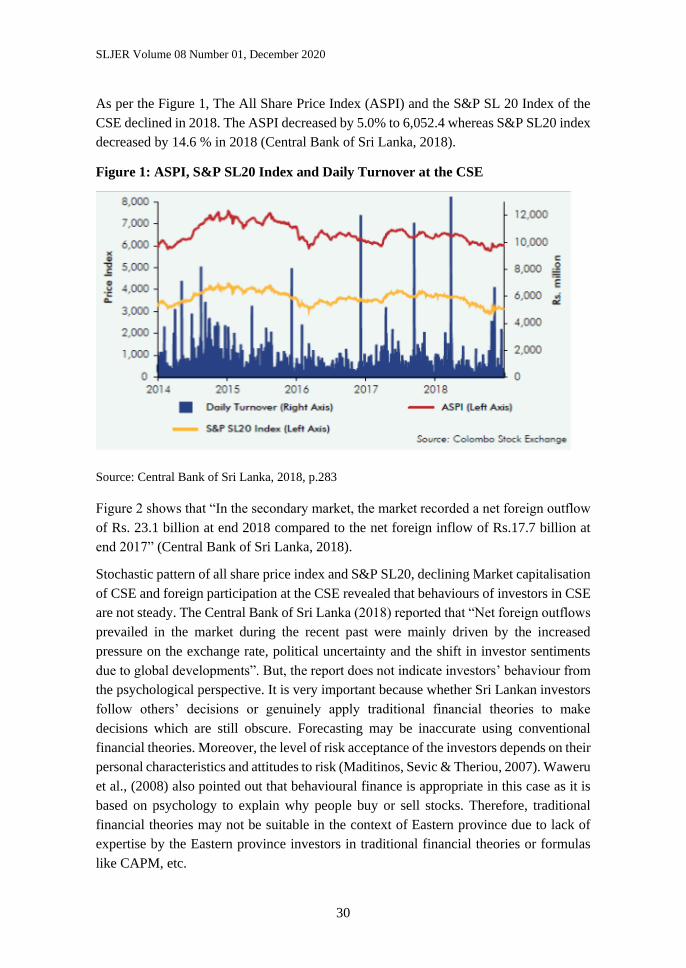
As per the Figure 1, The All Share Price Index (ASPI) and the S&P SL 20 Index of the
CSE declined in 2018. The ASPI decreased by 5.0% to 6,052.4 whereas S&P SL20 index
decreased by 14.6 % in 2018 (Central Bank of Sri Lanka, 2018).
Figure 1: ASPI, S&P SL20 Index and Daily Turnover at the CSE
Source: Central Bank of Sri Lanka, 2018, p.283
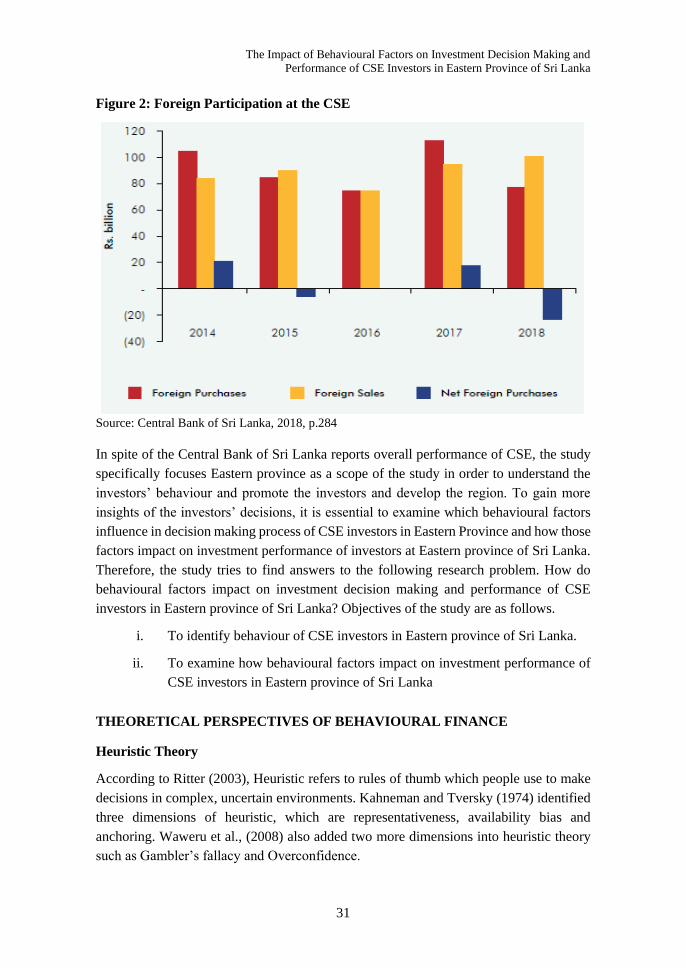
Figure 2 shows that “In the secondary market, the market recorded a net foreign outflow
of Rs. 23.1 billion at end 2018 compared to the net foreign inflow of Rs.17.7 billion at
end 2017” (Central Bank of Sri Lanka, 2018).
Stochastic pattern of all share price index and S&P SL20, declining Market capitalisation
of CSE and foreign participation at the CSE revealed that behaviours of investors in CSE
are not steady. The Central Bank of Sri Lanka (2018) reported that “Net foreign outflows
prevailed in the market during the recent past were mainly driven by the increased
pressure on the exchange rate, political uncertainty and the shift in investor sentiments
due to global developments”. But, the report does not indicate investors’ behaviour from
the psychological perspective. It is very important because whether Sri Lankan investors
follow others’ decisions or genuinely apply traditional financial theories to make
decisions which are still obscure. Forecasting may be inaccurate using conventional
financial theories. Moreover, the level of risk acceptance of the investors depends on their
personal characteristics and attitudes to risk (Maditinos, Sevic & Theriou, 2007). Waweru
et al., (2008) also pointed out that behavioural finance is appropriate in this case as it is
based on psychology to explain why people buy or sell stocks. Therefore, traditional
financial theories may not be suitable in the context of Eastern province due to lack of
expertise by the Eastern province investors in traditional financial theories or formulas
like CAPM, etc.
The Impact of Behavioural Factors on Investment Decision Making and
Performance of CSE Investors in Eastern Province of Sri Lanka
31
Figure 2: Foreign Participation at the CSE
Source: Central Bank of Sri Lanka, 2018, p.284
In spite of the Central Bank of Sri Lanka reports overall performance of CSE, the study
specifically focuses Eastern province as a scope of the study in order to understand the
investors’ behaviour and promote the investors and develop the region. To gain more
insights of the investors’ decisions, it is essential to examine which behavioural factors
influence in decision making process of CSE investors in Eastern Province and how those
factors impact on investment performance of investors at Eastern province of Sri Lanka.
Therefore, the study tries to find answers to the following research problem. How do
behavioural factors impact on investment decision making and performance of CSE
investors in Eastern province of Sri Lanka? Objectives of the study are as follows.
i. To identify behaviour of CSE investors in Eastern province of Sri Lanka.
ii. To examine how behavioural factors impact on investment performance of
CSE investors in Eastern province of Sri Lanka
THEORETICAL PERSPECTIVES OF BEHAVIOURAL FINANCE
Heuristic Theory
According to Ritter (2003), Heuristic refers to rules of thumb which people use to make
decisions in complex, uncertain environments. Kahneman and Tversky (1974) identified
three dimensions of heuristic, which are representativeness, availability bias and
anchoring. Waweru et al., (2008) also added two more dimensions into heuristic theory
such as Gambler’s fallacy and Overconfidence.
SLJER Volume 08 Number 01, December 2020
32
Representativeness indicates to what extent an event is similar to population (Kahneman
and Tversky, 1974). Ritter (2003) posits that representativeness may result in some biases
such as people put too much weight on recent experience and ignore the average long-
term rate. Gambler’s fallacy refers “an individual erroneously believes that the onset of a
certain random event is less likely to happen following an event or a series of events
(Jeyraj, 2013). In the stock market, Gamblers’ fallacy arises when people predict
inaccurately the reverse points which are considered as the end of good (or poor) market
returns (Waweru et al., 2008). Anchoring is a phenomenon used in the situation when
people use some initial values to make estimation, which are biased toward the initial
ones as different starting points yield different estimates (Kahneman & Tversky, 1974).
In the financial market, anchoring arises when a value scale is fixed by recent
observations. Investors always refer to the initial purchase price when selling or
analyzing. Overconfidence happens as people overestimate the reliability of their skills,
knowledge and accuracy of their information, or over optimistic about the future and the
ability to control the situations (Camerer & Lovallo, 1999; Hirshleifer, 2001; Glaser &
Weber, 2007). Availability denotes investors make use of easily available information
excessively (Waweru et al., 2008).
Prospect Theory
Prospect theory assumes that losses and gains are valued differently, thus individuals
make decisions based on perceived gains instead of perceived losses. Losses cause a
greater emotional impact than does an equivalent of gain (Kahneman & Tversky (1979).
Prospect theory explains some states of mind affecting an individual’s decision-making
processes including Regret aversion, Loss aversion and mental accounting (Waweru et
al., 2003).
Regret is an emotion that occurs after people make mistakes. Investors avoid regret by
refusing to sell decreasing shares and willing to sell increasing ones (Fogel & Berry, 2006;
Lehenkari & Perttunen, 2004). Regret aversion is the tendency to avoid actions that could
create discomfort over prior decisions, even though those actions may be in the
individual’s best interest. Loss aversion refers to the difference level of mental penalty
people have from a similar size loss or gain (Barberis & Huang, 2001). There is evidence
showing that people are more distressed at the prospect of losses than they are pleased by
equivalent gains (Barberis & Thaler, 2003). Mental accounting is a term referring to the
process by which people think about and evaluate their financial transactions (Barberis &
Huang, 2001). Mental accounting allows investors to organize their portfolio into separate
accounts (Barberis & Thaler, 2003; Ritter, 2003).
Market Factors
DeBondt and Thaler (1995) state that financial markets can be affected by investors’
behaviors in the way of behavioural finance. Waweru et al., (2008) identifies the factors
The Impact of Behavioural Factors on Investment Decision Making and
Performance of CSE Investors in Eastern Province of Sri Lanka
33
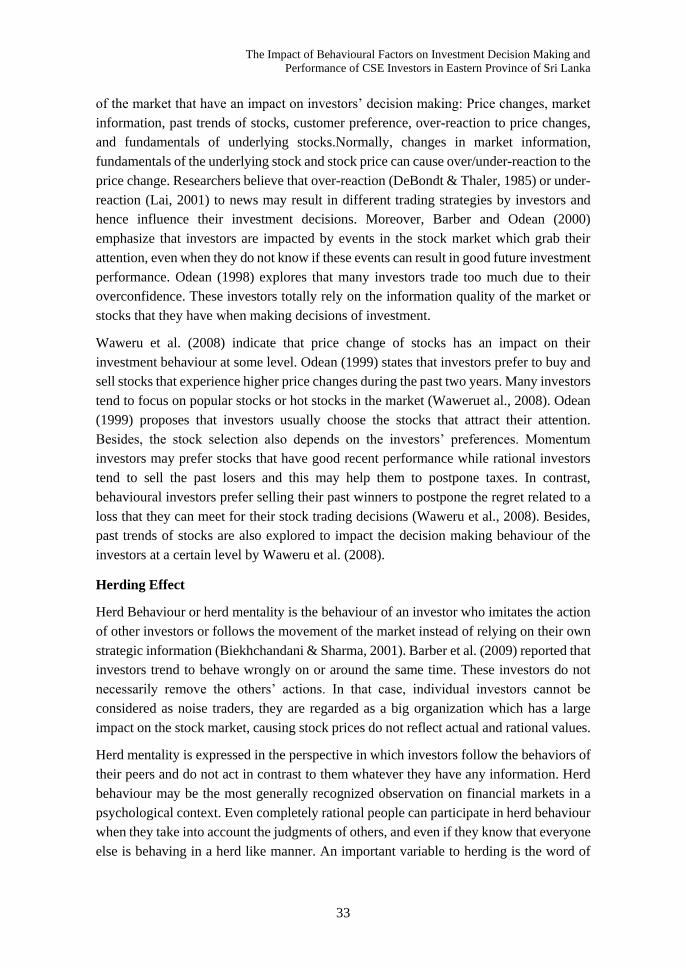
of the market that have an impact on investors’ decision making: Price changes, market
information, past trends of stocks, customer preference, over-reaction to price changes,
and fundamentals of underlying stocks.Normally, changes in market information,
fundamentals of the underlying stock and stock price can cause over/under-reaction to the
price change. Researchers believe that over-reaction (DeBondt & Thaler, 1985) or under-
reaction (Lai, 2001) to news may result in different trading strategies by investors and
hence influence their investment decisions. Moreover, Barber and Odean (2000)
emphasize that investors are impacted by events in the stock market which grab their
attention, even when they do not know if these events can result in good future investment
performance. Odean (1998) explores that many investors trade too much due to their
overconfidence. These investors totally rely on the information quality of the market or
stocks that they have when making decisions of investment.
Waweru et al. (2008) indicate that price change of stocks has an impact on their
investment behaviour at some level. Odean (1999) states that investors prefer to buy and
sell stocks that experience higher price changes during the past two years. Many investors
tend to focus on popular stocks or hot stocks in the market (Waweruet al., 2008). Odean
(1999) proposes that investors usually choose the stocks that attract their attention.
Besides, the stock selection also depends on the investors’ preferences. Momentum
investors may prefer stocks that have good recent performance while rational investors
tend to sell the past losers and this may help them to postpone taxes. In contrast,
behavioural investors prefer selling their past winners to postpone the regret related to a
loss that they can meet for their stock trading decisions (Waweru et al., 2008). Besides,
past trends of stocks are also explored to impact the decision making behaviour of the
investors at a certain level by Waweru et al. (2008).
Herding Effect
Herd Behaviour or herd mentality is the behaviour of an investor who imitates the action
of other investors or follows the movement of the market instead of relying on their own
strategic information (Biekhchandani & Sharma, 2001). Barber et al. (2009) reported that
investors trend to behave wrongly on or around the same time. These investors do not
necessarily remove the others’ actions. In that case, individual investors cannot be
considered as noise traders, they are regarded as a big organization which has a large
impact on the stock market, causing stock prices do not reflect actual and rational values.
Herd mentality is expressed in the perspective in which investors follow the behaviors of
their peers and do not act in contrast to them whatever they have any information. Herd
behaviour may be the most generally recognized observation on financial markets in a
psychological context. Even completely rational people can participate in herd behaviour
when they take into account the judgments of others, and even if they know that everyone
else is behaving in a herd like manner. An important variable to herding is the word of
SLJER Volume 08 Number 01, December 2020
34
mouth. People generally trust friends, relatives and colleagues more than they do the
media. It’s therefore likely that news about a buying opportunity will rapidly spread.
Shiller & Pound (1986) show that even if people read a lot, their attention and actions
appear to be more stimulated by interpersonal communications.
Investment Performance
Previous researches (Lin and Swanson, 2003; Kim and Nofsinger, 2003) objectively
measured Investment performance based on secondary data. However, rate of return on
shares is used to measure Investment performance (Oberlechner and Osler, 2004). But,
return rate is evaluated to measure investment performance via questionnaire with the
combination of objective and subjective perspectives in this research. Objective
viewpoint is focused by comparing real return rate with average market return while
subjective viewpoint is focused by comparing real return rate with the investors’ expected
return rate. As per Luong and Ha (2011) criterion to measure investment performance,
investors’ satisfaction on investment decisions is also used in this study to measure
investment performance.
RESEARCH METHODOLOGY
The research was conducted with the ontological assumption of objectivism as the reality
was existing external to the researchers. Epistemological perspective of the study was
positivism. Quantitative method was applied to understand the phenomenon.
Data Source, Population and Sample
The target population of this study was all the investors drawn from CSE representing
three districts. According to the data collected from Central Depository System (pvt) ltd.,
there were 5,688; 3,766 and 3,135 investors in CSE from the three districts Ampara,
Batticaloa and Trincomalee, respectively. Sample size was determined based on the table
of sample size for a given population size (Krejcie and Morgan, 1970, cited in Sekaran,
2007, p.294). Further, sample size was confirmed by a sample calculator on the web using
95% confidence level and 5% confidence interval (The survey system, 2018).
According to proportionate stratified random sampling technique, 169, 112 and 93 were
taken as a sample in each district Ampara, Batticaloa and Trincomalee, respectively.
Therefore, the total sample size was 374 in three districts. The data were collected through
a structured questionnaire. The respondents were selected based on the list taken from
stock brokers of CSE.
Model Specification
Heuristic theory and Prospect theory are employed to examine the study. In addition to
the above theories Market factors and Herding effect also considered to conduct the study.

The Impact of Behavioural Factors on Investment Decision Making and
Performance of CSE Investors in Eastern Province of Sri Lanka
35
Heuristic Variables, Prospect Variables, Market Variables and Herding Variables are
identified as independent variables and Investment Performance of individual investors
at CSE is considered as dependent variable. Conceptual model of the study is depicted
below in Figure 3.
Figure 3: Conceptual framework of the study
Source: Luong and Ha, 2011; Kengatharan and Kengatharan, 2014
By considering above arguments presented in previous research findings (Luong and Ha,
2011; Kengatharan and Kengatharan, 2014), the alternative hypothesis of the study is
formulated as follows.
H: There is a positive impact of Behavioural factors (Heuristic/ Prospect/ Market/
Herding) on the Investment Performance of CSE investors in Eastern province of Sri
Lanka.
Analytical Tools and Techniques
The collected data are analyzed through SPSS software packages. Descriptive Statistics
(mean, standard deviation) were used to describe respondents’ personal information.
Descriptive statistics were also used to describe the influence level of behavioural
variables on the investment performance of stockholders according to the following
decision rule.
Table 1: Decision Attribute
Range Decision attributes
1.0 < Xm ≤ 2.5 Low level
2.5 < Xm ≤ 3.5 Moderate level
3.5 < Xm ≤ 5.0 High level
Xm = Mean of variables
Behavioral Factors
Heuristic Variables
Prospect Variables
Market Variables
Herding Variables
Investment Performance of
CSE investors in Eastern
Province of Sri Lanka
SLJER Volume 08 Number 01, December 2020
36
Regression model is as follows.
IP=β0 + β1 (HV) + β2 (PV) + β3 (MV) + β4 (HDV) + e
Where:
β0 The Intercept β1 Slope of Heuristic Variables
β2 Slope of Prospect Variables β3 Slope of Market Variables
β4 Slope of Herding Variables HV Heuristic Variables
PV Prospect Variables MV Market Variables
HDV Herding Variables IP Investment Performance
e Error term
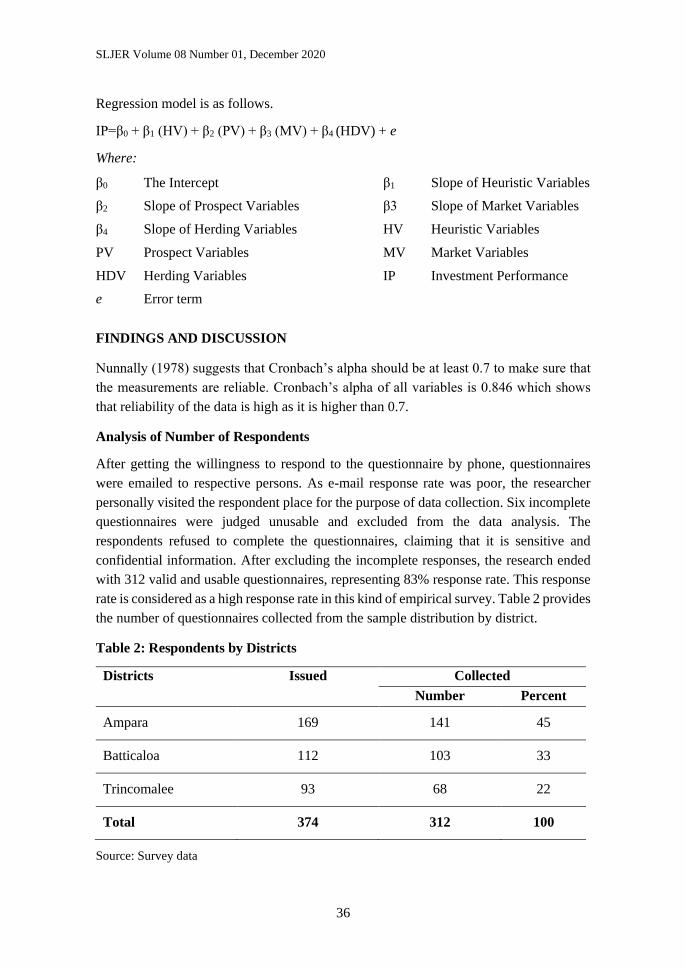
FINDINGS AND DISCUSSION
Nunnally (1978) suggests that Cronbach’s alpha should be at least 0.7 to make sure that
the measurements are reliable. Cronbach’s alpha of all variables is 0.846 which shows
that reliability of the data is high as it is higher than 0.7.
Analysis of Number of Respondents
After getting the willingness to respond to the questionnaire by phone, questionnaires
were emailed to respective persons. As e-mail response rate was poor, the researcher
personally visited the respondent place for the purpose of data collection. Six incomplete
questionnaires were judged unusable and excluded from the data analysis. The
respondents refused to complete the questionnaires, claiming that it is sensitive and
confidential information. After excluding the incomplete responses, the research ended
with 312 valid and usable questionnaires, representing 83% response rate. This response
rate is considered as a high response rate in this kind of empirical survey. Table 2 provides
the number of questionnaires collected from the sample distribution by district.
Table 2: Respondents by Districts
Districts Issued Collected
Number Percent
Ampara 169 141 45
Batticaloa 112 103 33
Trincomalee 93 68 22
Total 374 312 100
Source: Survey data
The Impact of Behavioural Factors on Investment Decision Making and
Performance of CSE Investors in Eastern Province of Sri Lanka
37
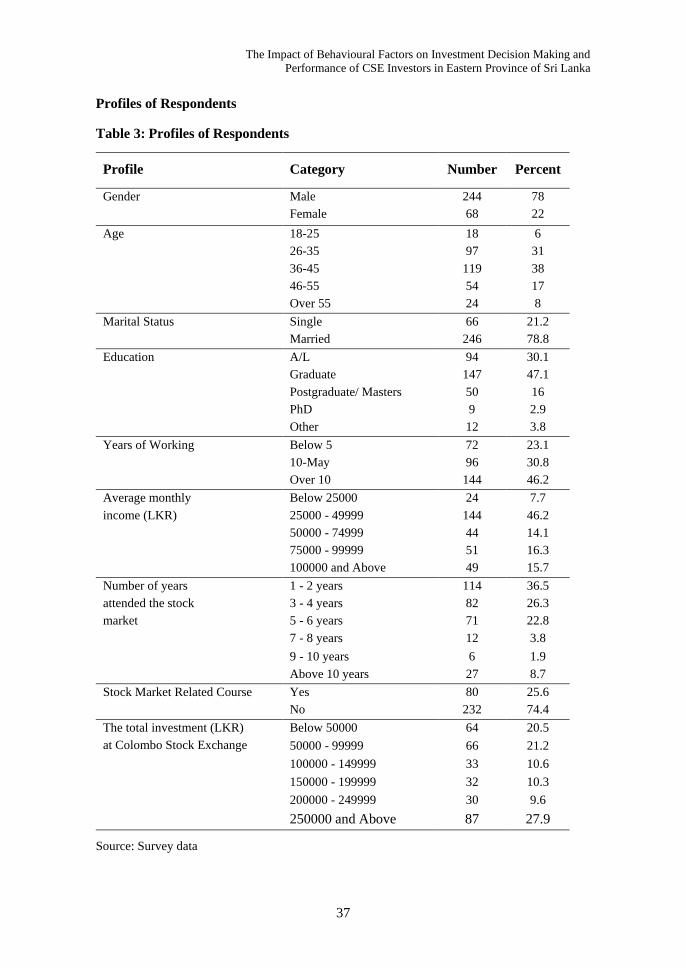
Profiles of Respondents
Table 3: Profiles of Respondents
Profile Category Number Percent
Gender Male 244 78
Female 68 22
Age 18-25 18 6
26-35 97 31
36-45 119 38
46-55 54 17
Over 55 24 8
Marital Status Single 66 21.2
Married 246 78.8
Education A/L 94 30.1
Graduate 147 47.1
Postgraduate/ Masters 50 16
PhD 9 2.9
Other 12 3.8
Years of Working Below 5 72 23.1
10-May 96 30.8
Over 10 144 46.2
Average monthly
income (LKR)
Below 25000 24 7.7
25000 - 49999 144 46.2
50000 - 74999 44 14.1
75000 - 99999 51 16.3
100000 and Above 49 15.7
Number of years
attended the stock
market
1 - 2 years 114 36.5
3 - 4 years 82 26.3
5 - 6 years 71 22.8
7 - 8 years 12 3.8
9 - 10 years 6 1.9
Above 10 years 27 8.7
Stock Market Related Course Yes 80 25.6
No 232 74.4
The total investment (LKR)
at Colombo Stock Exchange
Below 50000 64 20.5
50000 - 99999 66 21.2
100000 - 149999 33 10.6
150000 - 199999 32 10.3
200000 - 249999 30 9.6
250000 and Above 87 27.9
Source: Survey data
SLJER Volume 08 Number 01, December 2020
38
Table 3 provides an overview of respondents’ profiles such as Gender, Age, Marital
Status, Education, and Number of years attended the stock market, etc. Around 78% of
males participated in the survey. Out of the total respondents, about 38% of respondents
are fallen in the category of age 36-45. Most of respondents (66%) are graduate and
postgraduate qualifications while the rest of them do not have academic qualifications.
Most of them are invested in the stock market without following stock market related
courses. It is also noted that approximately 28% of respondents invested Rs. 250,000 and
above in the stock market while 20% of participants invested Rs. 50,000 and below in the
market.
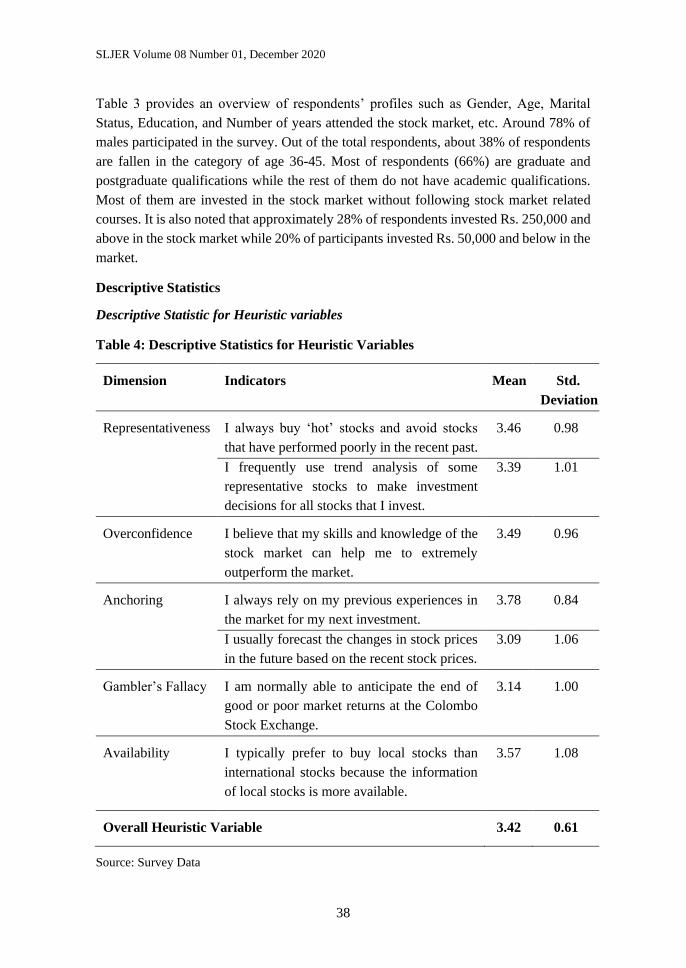
Descriptive Statistics
Descriptive Statistic for Heuristic variables
Table 4: Descriptive Statistics for Heuristic Variables
Dimension Indicators Mean Std.
Deviation
Representativeness I always buy ‘hot’ stocks and avoid stocks
that have performed poorly in the recent past.
3.46 0.98
I frequently use trend analysis of some
representative stocks to make investment
decisions for all stocks that I invest.
3.39 1.01
Overconfidence I believe that my skills and knowledge of the
stock market can help me to extremely
outperform the market.
3.49 0.96
Anchoring I always rely on my previous experiences in
the market for my next investment.
3.78 0.84
I usually forecast the changes in stock prices
in the future based on the recent stock prices.
3.09 1.06
Gambler’s Fallacy I am normally able to anticipate the end of
good or poor market returns at the Colombo
Stock Exchange.
3.14 1.00
Availability I typically prefer to buy local stocks than
international stocks because the information
of local stocks is more available.
3.57 1.08
Overall Heuristic Variable 3.42 0.61
Source: Survey Data
The Impact of Behavioural Factors on Investment Decision Making and
Performance of CSE Investors in Eastern Province of Sri Lanka
39
According to the decision rule, one of the indicators of Anchoring has the highest mean
(Table 4, above). Thus, investors mostly rely on their previous experiences in the market
for their next investment with mean 3.78 and standard deviation 0.84. In terms of
Availability, it is high level. Similarly, overconfidence is approached at a high level
(mean = 3.49). Respondents believe that their skills and knowledge of the stock market
can help them to extremely outperform the market whereas they typically prefer to buy
local stocks than international stocks. Representativeness has the moderate level on the
investment performance. Although they always buy ‘hot’ stocks and avoid stocks that
have performed poorly in the recent past, they are poor in accurately forecasting the
changes in stock prices in the future based on the recent stock prices. Gambler’s fallacy
is the lowest mean value (3.14), which is considered as a moderate level as they are not
smart in anticipating market return.
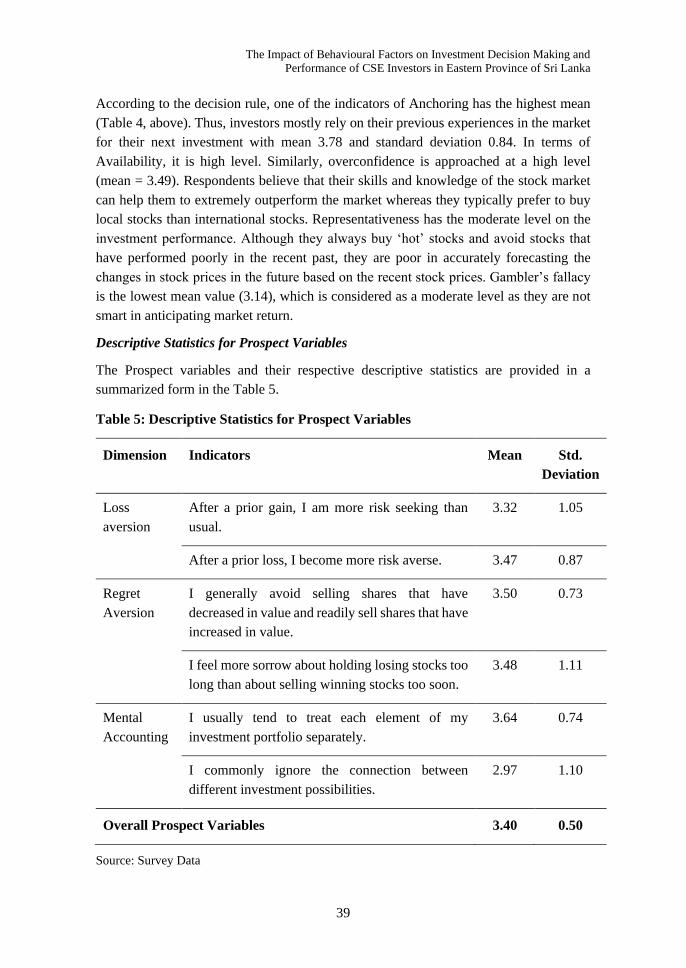
Descriptive Statistics for Prospect Variables
The Prospect variables and their respective descriptive statistics are provided in a
summarized form in the Table 5.
Table 5: Descriptive Statistics for Prospect Variables
Dimension Indicators Mean Std.
Deviation
Loss
aversion
After a prior gain, I am more risk seeking than
usual.
3.32 1.05
After a prior loss, I become more risk averse. 3.47 0.87
Regret
Aversion
I generally avoid selling shares that have
decreased in value and readily sell shares that have
increased in value.
3.50 0.73
I feel more sorrow about holding losing stocks too
long than about selling winning stocks too soon.
3.48 1.11
Mental
Accounting
I usually tend to treat each element of my
investment portfolio separately.
3.64 0.74
I commonly ignore the connection between
different investment possibilities.
2.97 1.10
Overall Prospect Variables 3.40 0.50
Source: Survey Data
SLJER Volume 08 Number 01, December 2020
40
Mental accounting is higher level and highest mean value (3.64) in Prospect variables.
Majority of investors tend to treat each element of their investment portfolio separately.
Moreover, most of them disagreed that they commonly ignore the connection between
different investment possibilities. That is, they agreed to observe the connection among
the investment opportunities within a sector. In addition, the study reveals that generally
avoid selling shares that have decreased in value and readily sell shares that have
increased in value. It indicates that most respondents are Regret aversion on the decision
making of the investors at the CSE due to mean falls about higher level. Although
investors have prior gain, they do not risk seeking more than usual. Further, after prior
loss, they are more risk averse. This phenomenon reveals that the investors are focusing
on loss aversion. However, mean value (3.40) of overall Prospect Variables falls in
moderate level.
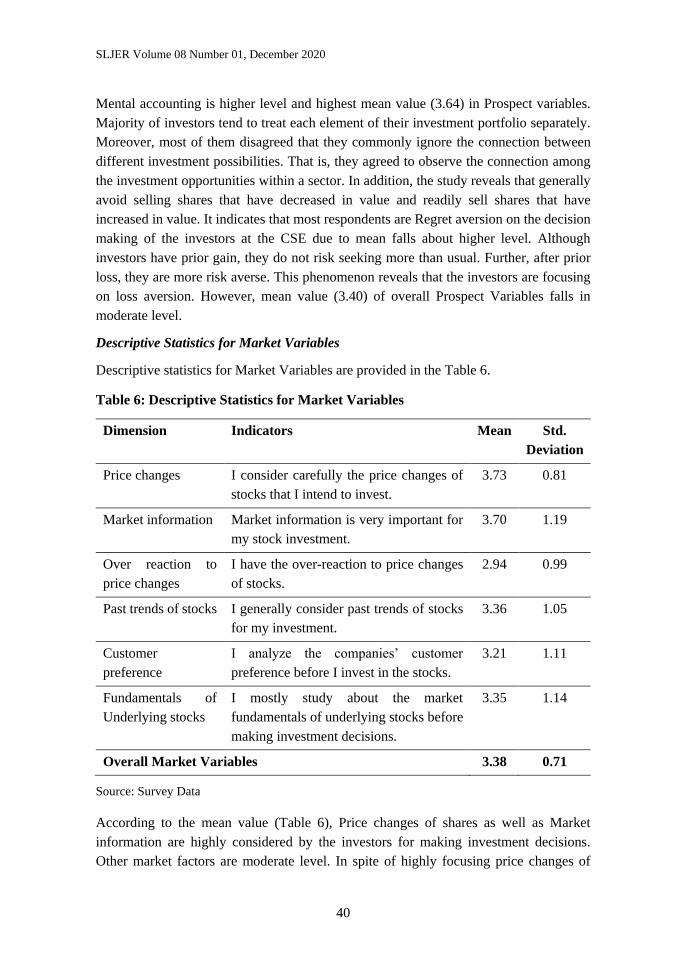
Descriptive Statistics for Market Variables
Descriptive statistics for Market Variables are provided in the Table 6.
Table 6: Descriptive Statistics for Market Variables
Dimension Indicators Mean Std.
Deviation
Price changes I consider carefully the price changes of
stocks that I intend to invest.
3.73 0.81
Market information Market information is very important for
my stock investment.
3.70 1.19
Over reaction to
price changes
I have the over-reaction to price changes
of stocks.
2.94 0.99
Past trends of stocks I generally consider past trends of stocks
for my investment.
3.36 1.05
Customer
preference
I analyze the companies’ customer
preference before I invest in the stocks.
3.21 1.11
Fundamentals of
Underlying stocks
I mostly study about the market
fundamentals of underlying stocks before
making investment decisions.
3.35 1.14
Overall Market Variables 3.38 0.71
Source: Survey Data
According to the mean value (Table 6), Price changes of shares as well as Market
information are highly considered by the investors for making investment decisions.
Other market factors are moderate level. In spite of highly focusing price changes of

The Impact of Behavioural Factors on Investment Decision Making and
Performance of CSE Investors in Eastern Province of Sri Lanka
41
shares (mean 3.73), the respondents are not much overreacting price changes (mean 2.94).
Based on findings of Customer preference, they moderately analyze the companies’
customer preference before they invest in the stocks as mean 3.21 and standard deviation
1.11. This standard deviation shows while few investors highly focus on companies’
customer preference others are not care about the customers’ preference.
Descriptive Statistics for Herding Variables
Level of Herding variables on the investors’ decisions at the CSE is moderate
(mean=2.98) and standard deviation of the variable is 0.83. Mean value of other investors’
decisions of buying and selling stock is the highest among herding variables while speed
of herding is lowest. As per the Table 7, Decisions of other investors are substantially
influenced on investors in Eastern province for making decisions pertaining to buying,
selling and choosing stock types.
Table 7: Descriptive Statistics for Herding Variables
Dimension Indicators Mean Std.
Deviation
Decisions of other
investors: Buying
and Selling
Other investors’ decisions of buying
and selling stocks have always impact
on my investment decisions.
3.16 0.96
Decisions of other
investors: Choice of
stock
Other investors’ decisions of choosing
stock types have always impact on my
investment decisions.
3.07 1.10
Decisions of other
investors: Volume of
stock
Other investors’ decisions of the stock
volume have an impact on my
investment decisions.
2.88 0.97
Decisions of other
investors: Speed of
herding
I usually react quickly to the changes
of other investors’ decisions and follow
their reactions to the stock market.
2.82 0.93
Overall Herding Variables 2.98 0.83
Source: Survey Data
Descriptive Statistics for Investment Performance
Overall mean value of Investment Performance is 3.18, which indicates that investment
performance is moderate level in Eastern province. Nevertheless, there are variations
among the investors about the level of investment performance as standard deviation is
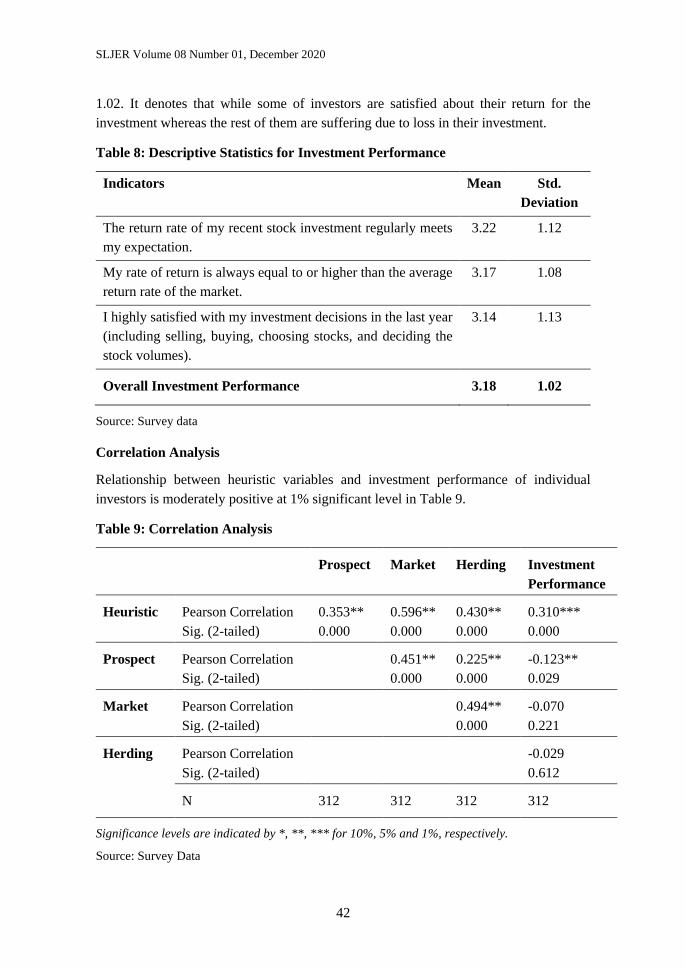
SLJER Volume 08 Number 01, December 2020
42
1.02. It denotes that while some of investors are satisfied about their return for the
investment whereas the rest of them are suffering due to loss in their investment.
Table 8: Descriptive Statistics for Investment Performance
Indicators Mean Std.
Deviation
The return rate of my recent stock investment regularly meets
my expectation.
3.22 1.12
My rate of return is always equal to or higher than the average
return rate of the market.
3.17 1.08
I highly satisfied with my investment decisions in the last year
(including selling, buying, choosing stocks, and deciding the
stock volumes).
3.14 1.13
Overall Investment Performance 3.18 1.02
Source: Survey data
Correlation Analysis
Relationship between heuristic variables and investment performance of individual
investors is moderately positive at 1% significant level in Table 9.
Table 9: Correlation Analysis
Prospect Market Herding Investment
Performance
Heuristic Pearson Correlation 0.353** 0.596** 0.430** 0.310***
Sig. (2-tailed) 0.000 0.000 0.000 0.000
Prospect Pearson Correlation 0.451** 0.225** -0.123**
Sig. (2-tailed) 0.000 0.000 0.029
Market Pearson Correlation 0.494** -0.070
Sig. (2-tailed) 0.000 0.221
Herding Pearson Correlation -0.029
Sig. (2-tailed) 0.612
N 312 312 312 312
Significance levels are indicated by *, **, *** for 10%, 5% and 1%, respectively.
Source: Survey Data
The Impact of Behavioural Factors on Investment Decision Making and
Performance of CSE Investors in Eastern Province of Sri Lanka
43
This shows that their previous experiences gained in the market help them to earn profit
from their investment. Therefore, investors come forward and involve in CSE in order to
become an expert in this field. However, prospect variables are negatively correlated with
investment performance of individual investors at 5% significance level. When the
investors increase the level of Loss Aversion as well as Regret Aversion, return on
investment decreases. Though market and herding variables are negatively associated
with investment performance, the results are not significant.
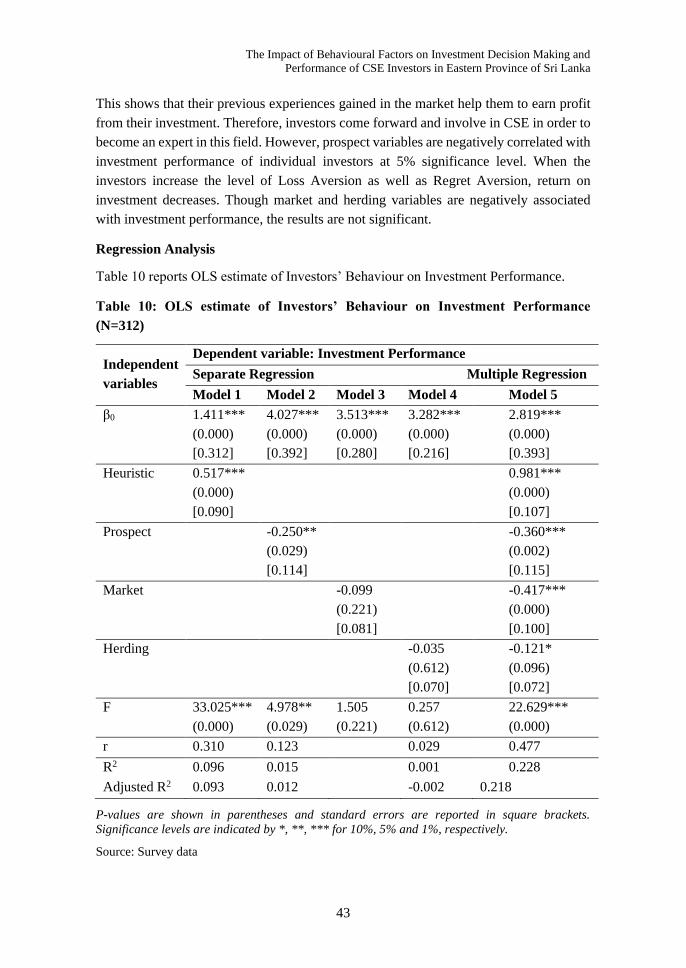
Regression Analysis
Table 10 reports OLS estimate of Investors’ Behaviour on Investment Performance.
Table 10: OLS estimate of Investors’ Behaviour on Investment Performance
(N=312)
Independent
variables
Dependent variable: Investment Performance
Separate Regression Multiple Regression
Model 1 Model 2 Model 3 Model 4 Model 5
β0 1.411***
(0.000)
[0.312]
4.027***
(0.000)
[0.392]
3.513***
(0.000)
[0.280]
3.282***
(0.000)
[0.216]
2.819***
(0.000)
[0.393]
Heuristic 0.517***
(0.000)
[0.090]
0.981***
(0.000)
[0.107]
Prospect -0.250**
(0.029)
[0.114]
-0.360***
(0.002)
[0.115]
Market -0.099
(0.221)
[0.081]
-0.417***
(0.000)
[0.100]
Herding -0.035
(0.612)
[0.070]
-0.121*
(0.096)
[0.072]
F 33.025***
(0.000)
4.978**
(0.029)
1.505
(0.221)
0.257
(0.612)
22.629***
(0.000)
r 0.310 0.123 0.029 0.477
R2 0.096 0.015 0.001 0.228
Adjusted R2 0.093 0.012 -0.002 0.218
P-values are shown in parentheses and standard errors are reported in square brackets.
Significance levels are indicated by *, **, *** for 10%, 5% and 1%, respectively.
Source: Survey data

SLJER Volume 08 Number 01, December 2020
44
There are five models shown in the table. Four simple regressions for each independent
variable from model 1 to 4 and model 5 is multiple regression. Among the independent
variables, only heuristic variables are positively related with the investment performance.
At the same time, other variables are negatively related with investment performance as
per the simple regression. However, only the prospect variable is significant among three
independent variables.
According to multiple regression (model 5), F statistic shows that model is fitness and
determination of coefficient (R2) is 0.228 which indicates that around 23% of variation
of the dependent variable (investment performance of individual investors) can be
explained by the encompassing all independent variables (heuristic variables, prospect
variables, market variables and herding variables). Adjusted R square 21.8% indicates
that it is an adjustment of the R squared that penalizes the addition of extraneous
predictors to the model. The unstandardized constant statistic 2.819 units show that the
model would predict if all of the four independent variables are Zero. The β coefficient
for Heuristic variables is 0.981. This means that on average, if the Heuristic variables go
up by 1 point, Investment performance of individual investors will improve by 0.981
units. The β coefficient for Prospect variables is -0.360. This means that on average, if
the prospect variables go up by 1 point, Investment performance of individual investors
will decrease by 0.360 units. Similarly, the β coefficient for Market variables is -0.417
and the β coefficient for herding variables is -0.121.
Based on Table 10, the equation for the multiple regression line is,
IP = 2.819 + 0.918 (HV) - 0.360 (PV) - 0.417 (MV) - 0.121 (HDV) + e
Hypotheses Testing
According to the results of Pearson correlation analysis between Heuristic variables and
Investment performance, the correlation of coefficient is 0.310, which is significant at 1%
(p=0.000). As per results of multiple regression analysis between two variables, there is
a positive relationship (β=0.918, p=0.000) at significant 1%. Therefore, there is an
evidence to reject H0 and it is concluded that heuristic variables positively impact on
investment performance of CSE investors in the province.
The correlation of coefficient is -0.123 between Prospect variables and Investment
performance at 5% significant. As per results of multiple regression analysis between two
variables, there is a negative relationship (β= -0.360, p=0.002) at significant 1%.
Therefore, it is concluded that there is a negative impact of Prospect variables on
investment performance of CSE investors in the province.
As per Pearson correlation analysis between Market variables and Investment
performance, the correlation of coefficient is -0.070, which is not significant at 5%.
However, multiple regression analysis between two variables shows that there is a
The Impact of Behavioural Factors on Investment Decision Making and
Performance of CSE Investors in Eastern Province of Sri Lanka
45
negative relationship (β= -0.417, p=0.000) at significant 1%. Therefore, there is evidence
to reject H0 and it is concluded that there is a negative impact of Market variables on
investment performance of CSE investors in the province.
Correlation between Herding variables and Investment performance is -0.029, which is
not significant at 5%. As per results of multiple regression analysis between two
variables, there is a negative relationship (β= -0.121, p=0.096) while it is not significant
at 5%. Therefore, there is no statistical evidence to reject H0 and it is concluded that there
is no positive impact of herding variables on investment performance of CSE investors
in Eastern province of Sri Lanka.
Discussion
Heuristics Variables and Investment Performance
Heuristics variables have positive impact on the investment performance, which implies
that Representativeness, Overconfidence, Anchoring, Gamblers fallacy, and Availability
are directly proportional to the investment result. Investment performance is affected by
the predictive skill of investors and this ability cause to define a range for a share price or
company’s income based on the historical trends, resulting in under-reaction to
unexpected changes. Trading of investors was influenced by recent experiences about
price in the market, and whether they use the purchase price of stocks as a reference point
while making trading decisions. Availability Investors make use of easily available
information excessively. In the stock trading area, this bias manifests itself through the
preference of investing in local companies which investors are familiar with or easily
obtain information. This finding strongly supports the studies of Allen and Evans (2005),
Gervais, Simon and Odean (2001) which suggest that people usually believe in their skills
and knowledge to outperform the market.
Prospect Variables and Investment Performance
There is negative impact between prospect variables and investment performance. In
terms of regret aversion which manifests itself by the fact that investors avoid selling
decreasing shares; whereas, they are willing to sell increasing ones. The result shows that
these behaviors affect negatively to investment performance. Regret aversion is common
actions of investors. The reason is that when the stock price is going up, traders want to
realize profit to show their ability. In contrast, when the price is going down, they do not
want to be a loser so they keep the stocks and expect that its trend will reverse.
This explanation is consistent with the argument of Lehenkari & Perttunen (2004), &
Shefrin & Statman (1985). Another reason is that, in decreasing periods, the market
liquidity is very low as buyers want to buy at floor price while sellers want to sell at
ceiling price. Thus, selling losing stock is more difficult than winning ones.

SLJER Volume 08 Number 01, December 2020
46
Regarding loss aversion after a gain, people are more confident about their ability, which
leads to a hasty decision. Previous gain may make them become greedier and seek for
more profits by investing more money. Thus, when unexpected things happen, the loss
will be much higher than usual. In contrast, after a loss, people are certainly depressed.
They become diffident when facing a decision.
They seek as much information as possible and analyze them carefully. They only invest
when they are sure of success. In reality, there is no investment without risk, so without
taking risk investors cannot look for high return. Although, investors should consider
carefully before making decisions, too much carefulness may lead to slow actions, thus
they may miss a good chance for investment and reduce opportunities to achieve high
profits
Market Variables and Investment Performance
Market variables also have negative impact. The finding concurs with the finding of
DeBondt and Thaler (1985) which reveals that changes in market information,
fundamentals of the underlying stock and stock price can cause over/under-reaction to the
price change and highly influence on decision-making behaviour of investors. Similarly,
this finding slightly matches with findings of Luong and Ha (2011) where they find
market variables highly impact on investment performance
Herding Variables and Investment Performance
Herding Variables also have a negative impact on investment performance. Stock market
is lack of reliable information, so herding behaviour is understandable. When many
people re-act the same, a wave is created and anyone who can catch that wave will earn
profits. Individuals can dominate the price of some stocks. Thus, following these
dominants may probably help investors to improve the investment, herding investors try
to be as good as their peers, and non-herding traders seek to be better than competitors
(Lutje, 2009). Therefore, in order to have higher returns, investors may have to consider
the negative and positive impacts of herding carefully before making investment
decisions.
CONCLUSIONS AND IMPLICATION OF THE STUDY
Conclusion
Objective one is to identify four behavioural factors that affect the investment
performance of the Eastern province investors at CSE: Heuristic, Prospect, Market and
Herding variables. Heuristic variables consist of five dimensions and anchoring factor is
high level among those dimensions because investors rely on their skill, knowledge and
previous experience regarding in the market and used to predict investment activities with
the help of their own ability and experience. Prospect variables consist of three

The Impact of Behavioural Factors on Investment Decision Making and
Performance of CSE Investors in Eastern Province of Sri Lanka
47
dimensions namely loss aversion, regret aversion and mental accounting which are
moderate level. It is concluded that Eastern province investors mostly avoid loss and
regret in investment on stocks. They prefer to stay in a safe or comfort zone. Out of six
dimensions of Market variables, price changes factor and market information are high
level. It clearly confirms that Eastern province investors carefully consider the price
changes of stocks that they intend to invest. Based on the finding of customer preference
in the market variables, they moderately analyze the companies’ customer preference
before they invest in the stocks. Herding variable is also a moderate level of investment
performance because Eastern province investors follow others’ decisions and react to
others’ decisions.
Objective two examines how behavioural factors impact on investment performance of
CSE investors in Eastern province of Sri Lanka. It is concluded that around 23% of
variation of the investment performance of Eastern province investors can be explained
by encompassing all independent variables. Heuristic variables are found to have a
positive significant impact on the investment performance than other variables. In
contrast, Prospect, Market and Herding variables negatively impact on the investment
performance of Eastern province investors at Colombo Stock Exchange. However,
finding multiple regression about Herding variables is not significant. It reveals finding
of herding variables cannot be generalized but it is only limited to the selected sample.
Gain on investment is decreased due to sample respondents are considered another
investors’ decision as there is a negative relationship between herding variables and
investment performance. Investors are induced to follow others due to lack of information
regarding the stock market which is reflected in more investors are not completed stock
market related courses. According to findings of prospect variables, when the investors
increase the level of Loss Aversion as well as Regret Aversion, return on investment
decreases. In other words when they take more risk, they can earn more gain.
Recommendations of the Study
It is suggested to follow stock market related courses as investors are induced to follow
others due to lack of information regarding the stock market. Overconfidence is a higher
level in determining their investment performance whereas they are avoiding loss and
regret. Therefore, individual investors at the CSE should be confident to utilize their skills
and knowledge properly to enhance their outcome of investment.
Prospect Variables have a negative impact on investment performance. Moreover, it is
identified that most respondents are Regret aversion on the decision making of the
investors at the CSE. Even though investors have prior gain, they do not seek more risk
than usual in the Eastern Province. Further, after prior loss, they are more risk averse.
SLJER Volume 08 Number 01, December 2020
48
This phenomenon reveals that investors in Eastern Province are focusing on loss aversion.
Therefore, it is recommended that investors should take risk through carefully studying
market variables to earn better results. Further, they have to properly decide the portfolio
of investment from different sectors.
Market variables also negatively influence on investment performance. Therefore,
seminars and courses can be organized to improve knowledge of investors in Eastern
province. It helps not only increase investment of prevailing investors but also attract new
investors. Investors should understand companies’ preference of customers. It will help
them to predict company performance as well as investment performance.
Contribution of the Study
Heuristic and Prospect theories are applied in this study in addition to the market and
herding variables in order to understand the behaviour pattern of CSE investors in Eastern
province of Sri Lanka. It explores the investors’ behaviour through theoretical
perspectives. By achieving the research objective, this research provides investment
behaviour of CSE investors in Eastern province of Sri Lanka. Further, the study explains
how behavioural factors influence on investment performance of CSE investors in
Eastern province of Sri Lanka.
FURTHER LINE OF RESEARCH
It is vital to conduct more research to confirm the findings of this research by covering
investors island wide as well as comparing district wise. Another study could be
conducted to understand how institutional investors as well as foreign investors behave
at the Colombo Stock Exchange. Moreover, comparative study could be undertaken in
Sri Lanka as well as other developed and developing countries in order to explore whether
cultural values impact on investment performance. Finally, it is useful to conduct
behavioural factors of investors in all kinds of securities such as debentures, unit trust,
etc.
REFERENCES
Abu-Nassar, M., & Rutherford B. A. (1996). External users of financial reports in less
developed countries: The case of Jordon. The British Accounting Review, 28(1), 73-87.
Ackert, L. F., (2014). Chapter 2: Traditional and Behavioural Finance. Investor Behavior:
The Psychology of Financial Planning and Investing. H. Kent Baker and Victor Ricciardi,
editors, 25-41. Hoboken, NJ: John Wiley & Sons, Inc., 2014. Retrieved from SSRN:
http://ssrn.com/abstract=2394549

The Impact of Behavioural Factors on Investment Decision Making and
Performance of CSE Investors in Eastern Province of Sri Lanka
49
Barber, B.M. and Odean, T. (2000). Trading is hazardous to your wealth: the common
stock investment performance of individual investors. Journal of Finance, 55(2), 773–
806.
Barberis, N., & Huang, M. (2001). Mental Accounting, Loss Aversion, and Individual
Stock Returns. The Journal of Finance, 56(4), 1247-1292.
Barberis, N., & Thaler, R. (2003). A Survey of Behavioral Finance. Handbook of the
economics of finance, 1B. Financial markets and asset pricing, 1053-1123.
Belsky, G., & Gilovich. (1999). Why smart people make big money mistakes-and How
to correct them: Lesson from the new science of behavioural economics Simon and
Schuster, New York.
Bikhchandani, S. & Sharma, S. (2001). Herd Behavior in Financial Markets, International
Monetary Fund, 47(3), Retrieved from,
https://www.imf.org/External/Pubs/FT/staffp/2001/01/pdf/Bikhchan.pdf
Blume, M., & Friend. (1978). The Changing Role of The Individual Investor.
Camerer, Colin F. and Dan Lovallo. (1999). Overconfidence and Excess Entry: An
Experimental Approach. American Economic Review, 89(1), 306–18.
Central Bank of Sri Lanka. (2018). Financial Sector Performance and System Stability,
Annual Report 2018, Colombo: Central Bank of Sri Lanka
Central Depository System. (2016). CDS participants, Colombo Stock Exchange.
Ceylontoday, (2016-01-24) Invest in East, Retrieved from http://ceylontoday.lk/22-
115997-news-detail-invest-in-east-2016.html
DeBondt, W.F.M., & Thaler, R. (1995). Financial Decision-Making in Markets and
Firms: A Behavioral Perspective. Handbooks in Operations Research and Management
Science, 9(13), 385-410.
Fama, E. F. (1970). Efficient capital markets: A review of theory and empirical work.
Journal of Finance, 25(2), 383-417
Fogel, O., & Berry, T. (2006). The disposition effect and individual investor decisions:
the roles of regret and counterfactual alternatives. Journal of Behavioral Finance, 7(2),
107–116.
Glaser, M. & Weber, M. (2007). Overconfidence and trading volume. The Geneva Risk
and Insurance Review. 32(1), pp. 1-36
SLJER Volume 08 Number 01, December 2020
50
Hettiarachchi, U. S., & Rajeshwaran, N. (2016). The Impact of Dividend Policy on Stock
Price: An Empirical Evidence from Hotels and Travels Companies Listed in Colombo
Stock Exchange. International Conference in Accounting Researchers and Educators.
Retrieved from: http://repository.kln.ac.lk/handle/123456789/16407.
Hirshleifer, D. (2001). Investor psychology and asset pricing. Journal of Finance 56,
pp.1533−1597.
Huang, J.Y; Shieh, J.C.P. and Kao, Y. (2016). Starting points for a new researcher in
behavioral finance. International Journal of Managerial Finance, 12(1) 92-103 Retrieved
from http://dx.doi.org/10.1108/IJMF-05-2015-0111
Jayaraj, S. (2013). The Factor Model for Determining the Individual Investment behavior
in India, IOSR Journal of Economics and Finance, 4(1)
Kahneman, D., & Tversky, A. (1974). Judgment under Uncertainty: Heuristics and
Biases. Science, 85 (4157), 1124-1131
Kahneman, D., & Tversky, A. (1979). Prospect theory: an analysis of decision-making
under risk. Econometrica, 47(2), 263–291.
Kengatharan, L. & Kengatharan, N. (2014). The Influence of Behavioral Factors in
Making Investment Decisions and Performance: Study on Investors of Colombo Stock
Exchange, Sri Lanka. Asian Journal of Finance & Accounting, 6(1), Retrieved from
www.macrothink.org/ajfa.
Kim, K., & Nofsinger, J. (2003). The Behaviour and Performance of Individual Investors
in Japan.
Lai, M. (2001). Are Malaysian investors rational? Journal of Psychology and Financial
Markets, 2(4), 210-215.
Lehenkari, M., & Perttunen, J. (2004). Holding onto the losers: finish evidence. The
Journal of Behavioral Finance, 5(2), 116-126.
Lin, A., & Swanson, P. (2003). The Behavior and Performance of Foreign Investors in
merging Equity Markets: Evidence from Taiwan. International Review of Finance.
Luong, L. P. & Ha, D. T. T. (2011). Behavioral factors influencing individual investors’
decision-making and performance A survey at the Ho Chi Minh Stock Exchange. Master
thesis, Umea University, Sweden.
Lutje, T. (2009). To be good or to be better: asset managers’ attitudes towards herding.
Applied Financial Economics, 19(10), 825–839.

The Impact of Behavioural Factors on Investment Decision Making and
Performance of CSE Investors in Eastern Province of Sri Lanka
51
Maditinos, D. I., Sevic, Z., and Theriou, N. G. (2007). Investors’ behavior in the Athens
Stock Exchange (ASE). Studies in Economics and Finance, 24(1), 32-50.
Menike, L.M.C.S (2006). The Effect of Macroeconomic Variables on Stock Prices in
Emerging Sri Lankan Stock Market. Sabaragamuwa University Journal, 6(1), 50-67
Menike M. G. P. D. & Prabath U. S. (2014). The Impact of Accounting Variables on
Stock Price: Evidence from the Colombo Stock Exchange, Sri Lanka, International
Journal of Business and Management; Vol. 9, No. 5, Published by Canadian Center of
Science and Education
Nagy, R., A. & Obenberger, R., W. (1994). Factors influencing individual investor
behavior. Financial Analyst Journal, 50(4), 63-68.
Nunnally, J. C. (1978). Psychometric theory. New York: McGraw-Hill.
Oberlechner, T. and Osler, C., L. (2004). Overconfidence in currency markets.
Odean, T. (1998). Volume, volatility, price and profit when all trades are above average.
Journal of Finance, 55(2), 773–806.
Odean, T. (1999). Do investors trade too much? American Economic Review, 89(5),
1279-1298.
Ritter, J. R. (2003). Behavioral Finance. Pacific-Basin Finance Journal, 11(4), 429-437.
Rockenbach, B. (2004). The behavioral relevance of mental accounting for the pricing of
financial options. Journal of Economic Behavior and Organization, 53(4), 513–527.
Sekaran, U. (2007). Research Methods for Business: A Skill Building Approach. 4th edn.,
New Delhi: Wiley India (P.) Ltd.
Sultana, S. T. & Pardhasaradhi, S. (2012). An Empirical Analysis of Factors Influencing
Indian Individual Equity Investors’ Decision Making and Behavior. European Journal of
Business and Management. 4(18)
The survey system, (2018). Sample Size Calculator, Retrieved from
http://www.surveysystem.com/sscalc.htm
Waweru, N., M., Munyoki, E., & Uliana, E. (2008). The effects of behavioral factors in
investment decision-making: a survey of institutional investors operating at the Nairobi
Stock Exchange. International Journal of Business and Emerging Ma