Embed Size (px)
Citation preview

The Impact of Bancassurance on Efficiency and Profitability of Banks:
Evidence from the Banking Industry in Taiwan
Jin-Lung Peng
Associate Professor, Department of Risk Management and Insurance
National Chengchi University, Taiwan
Vivian Jeng
Associate Professor, Department of Risk Management and Insurance
National Chengchi University, Taiwan
Jennifer L .Wang
Professor, Department of Risk Management and Insurance
National Chengchi University, Taiwan
Yen-Chih Chen
Ph.D. Candidate, Department of Risk Management and Insurance
National Chengchi University, Taiwan
Jin-Lung Peng: Tel: 886 2 29393091 Ext.77447, E-mail: [email protected]; Vivian Jeng: Tel: +886 2 29393091 Ext.81231, E-mail: [email protected]; Jennifer L. Wang, Tel: +884 2 29393091 Ext.81235, E-mail: [email protected]; and Yen-Chih Chen(the corresponding author): Tel: +886 919 089945, Fax: +886 2 29390344, e-mail: [email protected]. The authors are collocated within the Department of Risk Management and Insurance at the National Chengchi University, Taiwan. Address for correspondence: 64 Zhinan Road, Section 2, Wenshan District, Taipei City, Taiwan 116, ROC.

1
The Impact of Bancassurance on Efficiency and
Profitability of Banks: Evidence from the Banking
Industry in Taiwan
This version: July 10, 2015 ____________________________________________________________________
ABSTRACT
We set out in this study to investigate whether the profitability and efficiency of banks
are improved by bancassurance business. As opposed to the use of dummy variables, as
in the extant literature, we use actual data provided by a unique database on all banks
engaging in bancassurance business in Taiwan between 2004 and 2012 to examine the
impact of the system. We find evidence to show that banks with greater involvement in
bancassurance tend to accrue larger risk-adjusted returns, with our empirical results also
indicating that such greater involvement improves efficiency. Our results provide support
for the notion that bancassurance offers substantial benefits for banks whilst also
increasing shareholder value. Finally, we find that a bancassurance cooperation strategy
has significant impacts on bank performance.
JEL Classification: G21 G22
Keywords: Bancassurance; Banking; Efficiency; Profitability.

2
1. Introduction
The use of banks by insurance companies as an additional distribution channel for their
products is known as ‘bancassurance’. Under the bancassurance business model, the bank
acts as an intermediary, helping an insurance company to reach its target customers so as
to increase its market share, an arrangement which seems to have mutual benefits for both
the banks and insurance companies alike. The benefit for the banks is that they can use
their existing staff to earn fee/non-interest income by delivering insurance services in
addition to their existing tasks (Gonulal, Goulder and Lester, 2012), whilst the insurers
can gain access to new customers through this new distribution channel, thereby
increasing their premium income.
In many countries around the world, Bancassurance has become the most
successful distribution channel within the insurance market, with the penetration rate
of bancassurance business varying in different countries as a result of differences in
their domestic regulatory systems. As shown in Table 1, the proportion of life insurance
premiums arising from bancassurance channels in 2012 was in excess of 60 per cent for
France, Spain and Italy, whilst the market share in Brazil reached a massive 77 per cent,
representing the highest in the world.1
<Table 1 is inserted about here>
1 The bancassurance penetration rates for the various countries are obtained from the Finaccord
Bancassurance database.

3
In Asia, the market share of bancassurance business is close to 50-60 per cent in
countries such as China, South Korea and Hong Kong, with the figure for Taiwan having
reached 53 per cent in 2013, and it is argued bancassurance business will continue to play
an important role in the future (Gonulal et al., 2012). In many respects, banks provide an
ideal channel for the sale of insurance products, particularly in a banking market with
stagnant interest income (Bergendahl, 1995). Banks can generate fee income from
bancassurance business whilst also improving their profitability and efficiency through
more effective use of their existing staff and premises.
The development of the financial markets has stimulated keen competition and
encouraged aggressive banking practices, ultimately narrowing the interest spread and
reducing the banks’ profit margins (Hsiao, Chang, Cianci and Huang, 2010). The
commission benefit from bancassurance business therefore provides an important boost
to bank finances. The ratio between bancassurance commission and total non- interest
income in Taiwan was just 3 per cent in 2004; however, by the end of 2012, it had risen
sharply, to 18 per cent. The changes over the years in the revenue share of bancassurance
business and insurance premiums in Taiwan are illustrated in Figure 1.
<Figure 1 is inserted about here>
Amici, Fiordelisi, Masala, Ricci and Sist (2013) recently examined strategic
alliances and joint ventures between banks and insurance companies, whilst a number

4
of other related studies have analyzed the consolidation within the financial industry
between banking and insurance activities; several of these studies have investigated
banking and insurance ‘merger and acquisition’ (M&A) transactions,2 with the primary
focus in these studies essentially being placed on whether firms involved in such
activities succeed in increasing shareholder value.
Some of the related studies have indicated that insurers can benefit from
bancassurance activities through the synergy that exists in the one-stop service that
bancassurance business offers; as compared to traditional channels, bancassurance
provides insurers with the advantage of lower costs (Benoist, 2002; Fiordelisi and Ricci,
2011). However, whilst insurers are found to benefit from the distribution of insurance
products through banking channels, the impact of bancassurance business on the
performance of banks is still unknown, essentially because of data limitations by the
banks themselves; we aim to fill this gap in the present study.
Our primary aim in this study is to examine the impacts of bancassurance on the
performance of banks in Taiwan using a 2004-2012 dataset on the island’s banking
industry. Our examination of the related impacts uses ‘data envelopment analysis’
(DEA) and involves both profitability and efficiency measures to evaluate the
performance of the banks and calculate the original and risk-adjusted ‘return on assets’
2 Examples include Fields, Fraser and Kolari (2007), Chen and Tan (2011), Dontis‐Charitos, Molyneux
and Staikouras (2011) and Slijkerman, Schoenmaker and de Vries (2013).

5
(ROA) and ‘return on equity’ (ROE). We further examine whether strategies of
diversification or concentration are found to have provided greater benefits for banks
in Taiwan, in terms of their subsequent performance.
Our results are summarized as follows. We find that both the efficiency and
profitability of the banks have been improved by their participation in bancassurance
activities; indeed, the higher the commission ratio earned from bancassurance business,
the higher the performance of the banks. We also find that such performance is improved
by a diversification strategy, which implies that banks will tend to perform better when
they choose to cooperate with more insurance partners.
We make several contributions to the extant literature in the present study, as
follows. Firstly, to the best of our knowledge, our study is the first to carry out an
examination of the direct impact of bancassurance business on the efficiency and
profitability of banks using the revenue share of bancassurance. As far as we can
ascertain, the prior related studies have considered only the indirect effects of
bancassurance activities, relying primarily on the use of mergers with insurance
companies as the main proxy for involvement in bancassurance business.
Secondly, based upon the availability of a unique database, which includes the
premiums and commission earned from bancassurance business for each bank, we are
able to examine numerous efficiency and profitability variables and present more precise

6
evidence on whether bancassurance business has enhanced bank performance. Thirdly,
to the best of our knowledge, our study is also the first to consider the effects of
cooperative bancassurance strategies between banks and insurers.
The remainder of this paper is organized as follows. A review of the extant related
literature on bancassurance is provided in Section 2, followed in Section 3 by a
description of the data, methodology and variables adopted for our study. Regression
analyses are carried out in Section 4, which also includes the presentation of our
empirical results and a subsequent discussion on their impacts. Finally, the conclusions
drawn from this study are presented in Section 5.
2. Literature review
Following the deregulation of financial integration and convergence between banks and
firms in the insurance industry, in an attempt to compensate for their falling interest
spread the banks very quickly began to get involved in bancassurance business by
engaging in the cross-selling of insurance products. Some detailed descriptions of
bancassurance activities have been provided in numerous prior related studies,3 with
some of the earlier studies identifying the significant advantages from becoming
involved in bancassurance business. For example, based upon a cost-benefit analysis
on bancassurance in five European banks, Bergendahl (1995) noted that the benefits
3 See, for example, Bergendahl (1995), Genetay, Molyneux and McGuire (1998), Benoist (2002), Swiss
Re (2007), Fields et al. (2007), Singhal and Singh and (2010) Chang, Peng and Fan (2011).

7
were not confined to improvements in sales margins, since there were also non-
monetary advantages, such as providing customers with a one-stop shop, and customers
demonstrating greater faith in the bank essentially as a result of the provision of
products that satisfy their individual needs; this is achieved by acting on specific
financial information relating to such customers.
In the report published by Swiss Re (2007) it was argued that bancassurance
contributes to the overall efficiency of banks by increasing their productivity and
economies of scope. Singhal and Singh (2010) further concluded that bancassurance
could increase scale economies by utilizing the existing networks of the banks to sell
greater ranges of products, whilst also increasing the overall efficiency and skills of
bank employees as they face the new challenges.
Singhal and Singh (2010) noted that by becoming involved in the sale of insurance
products, the banking industry was able to leverage its infrastructure, operational
expertise and existing customer services to the fullest extent. However, as a result of
data limitations/restrictions, the prior research on bancassurance business has tended to
concentrate more on the wealth or risk effects of mergers between banking and
insurance providers.
In some of the related studies, the focus has been placed on potential increases in
firm value arising from such mergers; for example, from an examination of the merger

8
between Citicorp and Travelers, Carow (2001) identified increases in the stock prices of
both the banks and the life insurance companies, whilst Fields et al. (2007) provided
further evidence on the potential for bidder wealth gains in bancassurance mergers
through an examination of such mergers in the US and other countries. They suggested
that since the bancassurance architectural structure for financial firms offers specific
benefits, it may well become more prominent in the future.
Based upon a further examination of merger deals, Dontis‐Charitos et al. (2011)
also found similar positive results in Canada, Europe and the US, whereas they reported
that the equity returns of Australasian bidders were found to be statistically insignificant
in their study. Chen and Tan (2011) examined the risk and wealth effects on a total of
72 M&As between banks in Europe during the 1989-2004 period; however, after
considering risk effects and changes in risk with respect to market indices, they were
unable to identify any wealth effects.
Although Slijkerman et al. (2013) demonstrated that downside risk can be lowered
through financial conglomeration, the recent study by Filson and Olfati (2014) – which
examined numerous US bank holding company acquisitions between 2001 and 2011 of
investment banking firms, insurance firms and securities brokerages under the Gramm-
Leach-Bliley Act of 1999 – found that whilst diversification created value, it was
associated with higher post-merger risk.

9
A similar recent examination of the efficiency performance of Italian banks with
varying degrees of bancassurance activities, carried out by Fiordelisi and Ricci (2011),
provides an appropriate comparison to the work on efficiency in the present study. They
used ownership links as a proxy for bancassurance activities to test the efficiency effects
on the banks but could find no evidence in support of the involvement by banks in life
insurance business; the focus in their study was, however, on a comparison between
different flexible forms of cooperation, such as cross-selling agreements and non-equity
strategic alliances.
Clearly, despite the increasing importance of bancassurance, there appears to be little
or no direct empirical data on the potential benefits of bancassurance and related sources
of such benefits. Our study therefore aims to fill this gap in the related literature
3. Data and methodology
This section begins with a description of our primary data sources and details on the
construction of the database. We then go on to define the methodology and key variables
for our subsequent analysis, along with the descriptive statistics.
3.1. Data
We adopt a panel dataset for our empirical analysis of the relationship between
bancassurance and performance of banks in Taiwan. Following the announcement of the
Financial Holding Companies Act in 2001, banks and insurers began linking themselves

10
to financial holding companies (FHCs), with many banks starting to engage in
bancassurance business from 2003 onwards; since 2004 to 2012 are the most recent
sample years available, this period provides the focus for our study.
We use a unique bancassurance database compiled by the Taiwan Insurance Institute
(TII) as our primary source of information, since this database provides comprehensive
information on each sample bank, including the premiums and commission earned from
all of their insurer partners. The financial information on our sample banks is obtained
from the Taiwan Economic Journal (TEJ) database, which provides information on areas
such as balance sheets and income statements. The availability of such detailed
information enables us to examine the cooperative strategies between our sample banks
and their insurer partners.
All domestic banks in operation during the 2004-2012 period were included in our
sample;4 60 banks with missing data on the premiums and commission earned from their
insurer partners were excluded, as were 22 banks with negative assets or equity, leaving
us with 235 bank-years observations. A further seven observations were discarded for the
calculation of risk-adjusted returns, since this requires quarterly data. Following this
exclusion process, the final dataset for our profitability regressions comprised of a total
of 228 bank-years observations.
4 Due to their specific characteristics, banks that are classified as industrial banks or branches of foreign
banks are excluded from the sample, as are those on which there was any lack of information.

11
3.2. Methodology
3.2.1. Empirical model
The timing of the removal of business barriers between insurance companies and banks
provides an ideal setting for an empirical exploration of the ways in which such new
business affected the banking industry. Several prior studies have employed an event
study approach to investigate the consequences of the removal of restrictions on
bancassurance for the banks; one such example, Fiordelisi and Ricci (2011), involved an
investigation of the relationship between engagement in bancassurance business by
various banks and the subsequent impacts on efficiency.5
However, in contrast to many of the prior studies, the focus in the present study is
on direct involvement in bancassurance business, using the actual commission from
insurance sales. The empirical specifications for our regression model are:
Performanceit = β0 + β1 Bancit + γ Xit + εit (1)
Performanceit = β0 + β1 Bancit + β2 StrHHIit + γ Xit + εit , (2)
where Performance refers to the measures of performance, which include both the
profitability and efficiency of the banks; Banc is a proxy measuring the extent of a
bank’s involvement in bancassurance business; StrHHI is a proxy for a bancassurance
cooperation strategy; ε is the error term; and X is a vector of other control variables for
5 See Fields et al. (2007), Chen and Tan (2011), Dontis‐Charitos et al. (2011) and Slijkerman et al.
(2013).

12
bank i. Separate estimations are carried out on Equations (1) and (2), with our estimates
on the bancassurance business effects being denoted by β1.
3.2.2. Dependent variables
a. Efficiency measures
There are two major approaches to efficiency estimation in the related literature, a
parametric approach, involving methods such as stochastic frontier analysis, and a
non-parametric approach, involving methods such as data envelopment analysis
(DEA). We decided to use the DEA approach for our evaluation of bank efficiency
in the present study for the following reasons.
Firstly, this methodology has been adopted in many studies within the
banking and insurance literature.6 Secondly, there are some distinct advantages to
this approach, including the avoidance of the possibility of specification error and
the difficulties involved in separating efficiency into different components,
thereby avoiding any erroneous assumptions on the distribution of the error terms
used in the parametric approach. Thirdly, the DEA approach is also found to
perform well with only a small number of observations.
The DEA method includes a total of five measures of efficiency performance,
comprising of ‘technical efficiency’ (TE), ‘allocative efficiency’ (AE), ‘cost
6 See Berger, Hanweck and Humphrey (1987), Casu and Molyneux (2003), Drake, Hall and Simper
(2006), Havrylchyk (2006), Hsiao et al. (2010) Sun and Chang (2011) and Cummins and Weiss (2013).
13
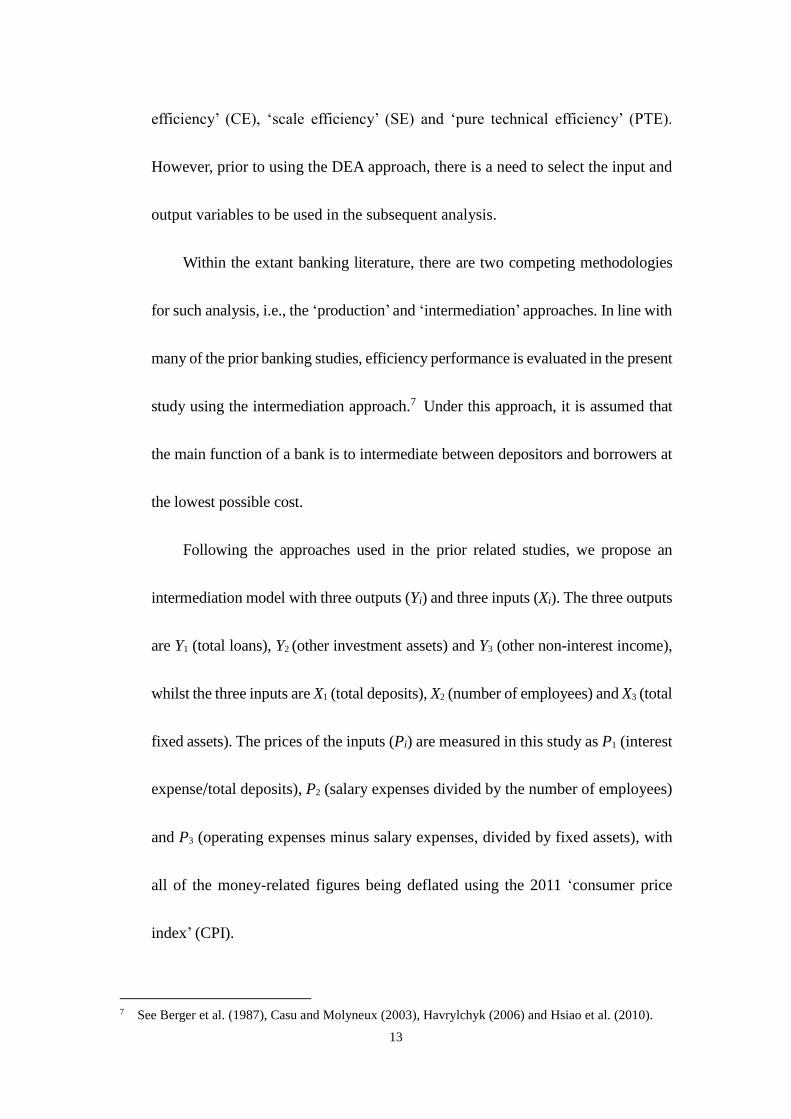
efficiency’ (CE), ‘scale efficiency’ (SE) and ‘pure technical efficiency’ (PTE).
However, prior to using the DEA approach, there is a need to select the input and
output variables to be used in the subsequent analysis.
Within the extant banking literature, there are two competing methodologies
for such analysis, i.e., the ‘production’ and ‘intermediation’ approaches. In line with
many of the prior banking studies, efficiency performance is evaluated in the present
study using the intermediation approach.7 Under this approach, it is assumed that
the main function of a bank is to intermediate between depositors and borrowers at
the lowest possible cost.
Following the approaches used in the prior related studies, we propose an
intermediation model with three outputs (Yi) and three inputs (Xi). The three outputs
are Y1 (total loans), Y2 (other investment assets) and Y3 (other non-interest income),
whilst the three inputs are X1 (total deposits), X2 (number of employees) and X3 (total
fixed assets). The prices of the inputs (Pi) are measured in this study as P1 (interest
expense/total deposits), P2 (salary expenses divided by the number of employees)
and P3 (operating expenses minus salary expenses, divided by fixed assets), with
all of the money-related figures being deflated using the 2011 ‘consumer price
index’ (CPI).
7 See Berger et al. (1987), Casu and Molyneux (2003), Havrylchyk (2006) and Hsiao et al. (2010).
14
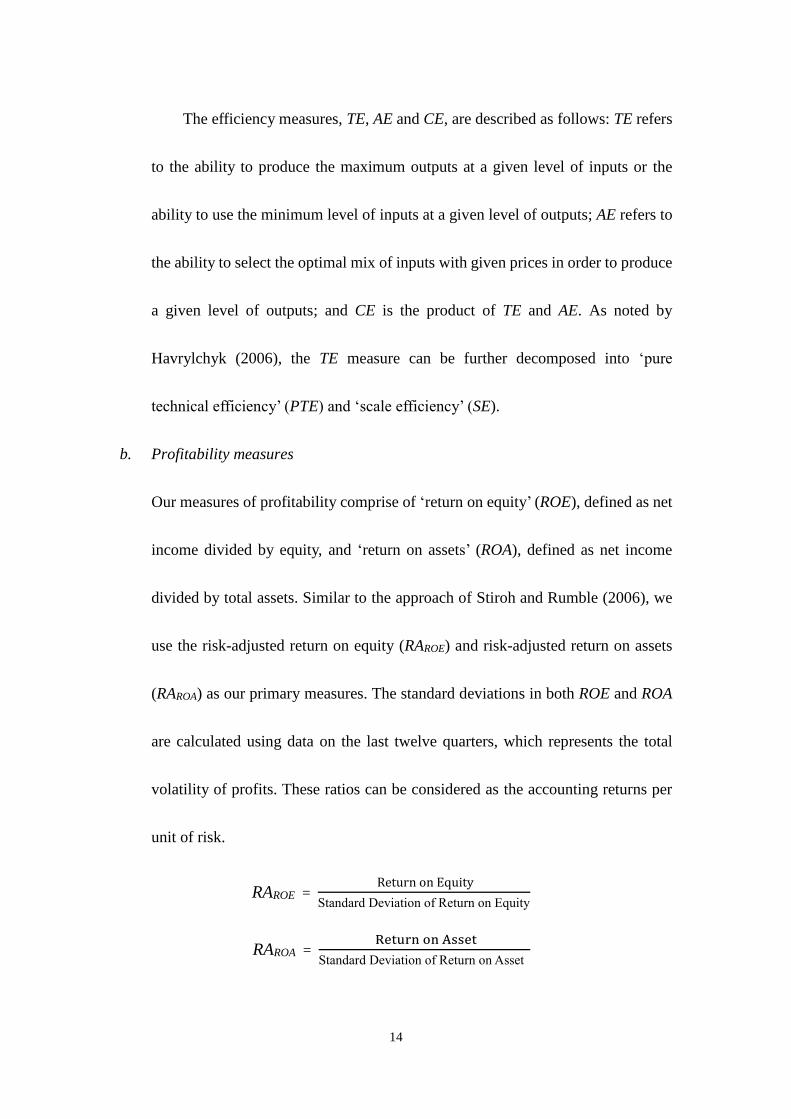
The efficiency measures, TE, AE and CE, are described as follows: TE refers
to the ability to produce the maximum outputs at a given level of inputs or the
ability to use the minimum level of inputs at a given level of outputs; AE refers to
the ability to select the optimal mix of inputs with given prices in order to produce
a given level of outputs; and CE is the product of TE and AE. As noted by
Havrylchyk (2006), the TE measure can be further decomposed into ‘pure
technical efficiency’ (PTE) and ‘scale efficiency’ (SE).
b. Profitability measures
Our measures of profitability comprise of ‘return on equity’ (ROE), defined as net
income divided by equity, and ‘return on assets’ (ROA), defined as net income
divided by total assets. Similar to the approach of Stiroh and Rumble (2006), we
use the risk-adjusted return on equity (RAROE) and risk-adjusted return on assets
(RAROA) as our primary measures. The standard deviations in both ROE and ROA
are calculated using data on the last twelve quarters, which represents the total
volatility of profits. These ratios can be considered as the accounting returns per
unit of risk.
RAROE = Return on Equity
Standard Deviation of Return on Equity
RAROA = Return on Asset
Standard Deviation of Return on Asset

15
c. Bancassurance measures
We follow a similar approach to Stiroh and Rumble (2006) for our measure of non-
interest income activity, measuring the extent of bancassurance activity (Banc) as
the ratio of the commission from insurance sales to the net operating revenue of the
banks, including both interest and non-interest income. The non-interest income of
the banks includes fiduciary income, fees and service charges, trading revenue and
any other sources of non-interest income.
We also use an alternative variable, the ratio of the commission earned from
insurance sales to the non-interest income of banks (Bancnon), as a check for the
robustness of our results, with a higher (lower) value for Banc or Bancnon indicating
that the bank is involved in more (less) bancassurance activities with an insurance
company. Using this breakdown, Banc is measured as:
Banc = Commission Earned From Insurance
Interest and Non-interest Income of the Bank
For our measure of bancassurance cooperation strategies, we use the basic
Herfindahl Index of the total commission of the partner insurers as our proxy
(Str_HHI) since it accounts for variations in the breakdown of commission paid by
different insurance companies. Using this breakdown, our primary measure of the
commission diversification of a bank is:
StrHHI = ΣiSh 2COMi,

16
where ShCOMi is the share of bancassurance commission from insurance company
i, which is defined as:
ShCOMi = Bancassurance Commission from Insurance Company i
Total Bancassurance Commission
where StrHHI measures the degree of concentration with the insurance company in
the bank’s cooperation strategy. A higher (lower) value indicates that the bank
adopts a more (less) concentrated strategy with an insurance company: if StrHHI =
1, this indicates that all of the bank’s commission comes from a single insurance
company (complete concentration), whereas a lower value indicates that
commission comes from more diversified sources.
3.2.3. Control variables
We also select various control variables to account for differences between the sample
banks which could ultimately influence their performance. These firm- specific
variables include: (i) a dummy variable indicating whether or not a bank is listed
(Listing) which is equal to 1 for listed banks, otherwise 0; (ii) the BIS capital adequacy
ratio (BIS) provided by the Central Bank of Taiwan; (iii) the market share of each bank
(Mkt_Share) which is defined as the ratio between a bank’s total loans and the total for
the industry; (iv) a dummy variable indicating whether or not a bank is owned by
government (Gov_Own) which is equal to 1 for banks controlled by government,
otherwise 0; and (v) the equity ratio (Equity/Assets) which is defined as the ratio

17
between the equity and total assets of the bank.8
The descriptive summary statistics on the sample banks are presented in Table 2,
which reports the mean, standard deviation, minimum, maximum and median (50th
percentile). During the 2004-2012 sample period, the mean value of bancassurance
commission to the total income of the banks was 2.1 per cent, whilst the mean value of
such commission to the non-interest income of the banks was 9.6 per cent, with a
standard deviation of 8.0 per cent. Clearly, over time, the banks have become
increasingly dependent on income from insurance sales.
3.3. Estimation Technique
3.3.1. Efficiency estimations
Given that the efficiency score value runs from 0 to 1, the prior studies have often used
Tobit regression models to analyze the relationship between efficiency and
bancassurance involvement (see, for example, Hsiao et al., 2010). Hence, we also
estimate Equations (1) and (2) using Tobit regressions.
In data-censoring applications, the random-effects Tobit model is used to solve the
problem of unobserved heterogeneity. In order to control for such unobserved effects,
time-constant and firm-constant variables, which are designed to reduce the error
variance, are included as the explanatory variables. We apply the random- effects model,
8 We also consider bank size (Size) which is defined as the natural log of total assets, as an alternative
proxy for market share, and find that the results are consistent for the different estimation models.

18
essentially because unconditional fixed-effects estimates are biased and do not provide
a sufficient statistic to allow the fixed effects to be conditioned out of the likelihood.9
The variables on involvement in Bancassurance business are also checked for
endogeneity in the Tobit model.
Equations (1) and (2) are estimated under the Smith-Blundell procedure using the
‘maximum likelihood estimation’ (MLE) method; prior to obtaining the MLE, the null
hypothesis of exogeneity can be tested using the t-statistic, making use of the Smith-
Blundell endogeneity test procedure.10
3.3.2. Estimation of profitability
In order to control for unobserved variables or variables that can change over time, but
not across entities, we use panel data analysis to avoid any biased estimations resulting
from individual heterogeneity under the OLS estimation; this method controls for
unobserved firm differences and aggregate shocks over different years through firm and
year effects. We adopt either a fixed- or random-effects model, depending on the
correlation between the explanatory variables and the error term.
To further correct for the potential problem of endogeneity, we also use the
‘instrumental variable’ (IV) method which provides a general solution to the problem
of an endogenous explanatory variable. We then estimate the result using the ‘two-stage
9 Details are provided in Wooldridge (2002: 538-42). 10 ibid, at pp.530-33).

19
least squares’ (2SLS) method. Based upon the IV approach, along with endogenous
bancassurance participation measures, we use the lagged independent variable of
involvement in bancassurance business as the instrumental variable, thereby satisfying
two key assumptions, non-correlation with the error term and a non-zero coefficient on
the bancassurance participation measures.11 Thus, Banct-1 is defined as the one-year
lagged variable of Banc.
4. Empirical results
Our analysis begins with an examination of the ways in which the level of participation
in bancassurance business affects the efficiency measures of the banks, including their
cost efficiency, allocative efficiency, technical efficiency, pure technical efficiency and
scale efficiency. We then examine whether a cooperative strategy between banks and
insurers affects their efficiency performance. We also use profit measures, such as the
original and risk-adjusted ROE and ROA to examine the impacts of participation in
bancassurance and cooperative strategies.
4.1. Bancassurance and Efficiency
The results of the Tobit regressions on the proxies for the level of involvement in
bancassurance business and the effects on efficiency, as described above, are presented
11 The most common test for endogeneity is the Hauman test, which rejects the null hypothesis that
lagged explanatory variables are exogenous; we therefore employed instrumental variables in order to
correct for such endogeneity. See Wooldridge (2002) for details.

20
in Table 3, which shows that the coefficients on the level of bancassurance business in
the CE, TE and PTE equations are significantly positive at the 1 per cent level, thereby
implying that greater involvement in bancassurance business improves these efficiency
measures. In other words, revenue earned from bancassurance business does result in
an increase in the efficiency performance of the banks.12
<Table 3 is inserted about here>
Our results are consistent with Bergendahl (1995) in which it was noted that by
engaging in the sale of insurance products to their customers, banks represent a one-
stop shop, with a resultant increase in their overall productivity level (Swiss Re, 2007).
In specific terms, our results from the PTE and TE equations imply that banks may
experience improvements in their ability to produce more outputs for a given level of
inputs. Furthermore, involvement in bancassurance business may enhance the skills of
bank employees, ultimately leading to increases in both cost efficiency and technical
efficiency (Singhal and Singh, 2010).
We go on to examine Equation (2) by adding the effects of the cooperative strategy
proxies into the models, with the results being reported in Table 4. Similar to the results
reported in Table 3, Banc is found to be significantly positive in the CE, TE and PTE
equations. Recall that a higher value for the cooperative strategy proxy (StrHHI) implies
12 Since unconditional fixed-effect estimates are biased, we apply the random effects model. See
Wooldridge (2002), pp.538-42.

21
that the bank has a more specialized cooperative strategy with its insurer partner. We
find that StrHHI has a significantly negative coefficient in the SE equation, thereby
indicating that a cooperative strategy with more insurance companies leads to higher
scale efficiency, although the coefficients on the other efficiency measures are not found
to be significant.
<Table 4 is inserted about here>
Within the prior related studies focusing on M&As, no clear evidence has yet been
provided on the involvement of banks in bancassurance business through such deals
(Dontis‐Charitos et al., 2011; Fiordelisi and Ricci, 2011); and indeed, the focus in the
prior related studies has tended to be placed on banks with highly concentrated
cooperative strategies, whilst also being largely based on M&A data or the use of
ownership links as the proxy for the insurance company. Our results suggest that greater
cooperation by banks with insurance companies may be an appropriate strategy for the
bancassurance business model.
4.2. Bancassurance and Profitability
In this section, we focus on two techniques used to analyze the panel data and then go
on to provide our empirical evidence. Depending on whether the unobserved effect is
uncorrelated with the explanatory variables, we use either the fixed- or random-effects
model to analyze the impact of those variables that tend to vary over time. The estimates

22
on Equation (1), using the four performance measures (ROE, ROA, RAROE and RAROA)
as the dependent variables, are presented in Table 5.
<Table 5 is inserted about here>
Since the Hausman test rejects the null hypothesis, we use the fixed-effects model
for ROE, RAROE and RAROA.13 The measure of involvement in bancassurance business
(Banc) is found to have a positive coefficient, which indicates that banks with greater
involvement in bancassurance business are more profitable than other banks. This finding
of a significant impact of bancassurance business on profitability is consistent with the
results reported in the prior studies, such as Bergendahl (1995).
Our results are also found to remain consistent when using measures of risk-
adjusted profitability. As noted earlier, in some of the prior related studies, the wealth and
risk effects for banks were examined using an event study methodology; in two related
examples, Chen and Tan (2011) could find no wealth effects, whilst Filson and Olfati
(2014) found that value creation was actually associated with higher risk. Our results
indicate that bancassurance business does indeed improve the risk-adjusted profitability
of the banks.
As shown in Table 6, when we include the bancassurance strategy variable, the
results on the measure of involvement in bancassurance business (Banc) are still found
13 The Hausman test rejects the null hypothesis of the differences between the coefficients not being
systematic, since the unique errors are found to be correlated with the regressors.

23
to hold. We use the Herfindahl Index of the total commission from the partner insurer
(StrHHI) as our independent variable; however, the data show no significant relationship
between bancassurance strategy (StrHHI) and profitability.
<Table 6 is inserted about here>
4.3. Interaction Regressions
It may be interesting to determine the ways in which the impacts of involvement in
bancassurance business may vary with other aspects of cooperative strategy choices.
Although banks with greater sales of insurance products are likely to be cooperating with
more insurance companies, the above empirical results provide no clear evidence in
support of diversified or concentrated cooperative strategies.
In order to further investigate this issue, an interactive term is included in our
analysis, which is the involvement in bancassurance business variable multiplied by the
bancassurance strategy variable (Banc*StrHHI). The regression estimates on this
interactive term are reported in Tables 7 and 8, from which we can see that, once again,
the benefits of involvement in bancassurance business appear to be significant, although
such benefits can vary with specific diversification strategies.
<Tables 7 and 8 are inserted about here>
The interactions are found to be significant in the PTE and TE regressions, thereby
indicating that the benefits are reduced when the banks cooperate with fewer insurance

24
companies. These findings are consistent with the notion that greater involvement in
bancassurance business leads to more cooperation with insurance companies. When the
strategy interaction terms are included in the profitability regressions, the results are
found to be insignificant.
4.4. Tests for Robustness
We now go on to present robustness checks on the profitability and efficiency
regressions for potential endogeneity and alternative bancassurance variable definitions
(Bancnon). In order to control for the potential causality loop within the model between
the profitability measure and the bancassurance variables, which can give rise to
endogeneity, we also use instrumental variables estimated using the 2SLS approach;
lagged values are therefore used as the control variables in our attempts to correct for
the potential problem of endogeneity.14
Within the data-censoring applications, the Tobit model is adopted for our two-
stage estimations in the present study; this represents the so-called Smith- Blundell
procedure based upon the MLE method. The results on the five efficiency measures,
which are presented in Table 9, are found to be consistent with the Tobit model, with
lower statistical significance.
<Table 9 is inserted about here>
14 Observations of the model are reduced due to the use of lagged values.

25
We subsequently go on to estimate our IV model using the traditional 2SLS
approach, with the estimation results being reported in Table 10. Following the 2SLS
estimations, we carry out the usual tests for endogeneity as suggested in the prior related
works,15 and use the C-statistic based upon ‘generalized method of moments’ (GMM)
estimations.16 The unreported test results reveal that endogeneity is a potential problem.
As we can see from Table 10, the results for each column are found to be consistent
with the initial model.17
<Table 10 is inserted about here>
The results using the alternative bancassurance variable definitions (Bancnon) are
presented in Tables 11 and 12. Using all of the measures of profitability and
bancassurance (Bancnon), the data show highly significant relationships between
profitability performance and involvement in bancassurance business. Bancassurance is
also found to be associated with the TE and PTE proxies. The coefficients on involvement
in bancassurance business are found to be positive and significant, thereby indicating that
an increased reliance on bancassurance revenue is generally associated with higher risk-
adjusted profits.
<Tables 11 and 12 are inserted about here>
15 Durbin (1954), Wu (1974) and Hausman (1978). 16 See Wooldridge (2002: 199-200). 17 As a check for the robustness of our results, we also estimate our model using GMM estimations, and
find that the results (not reported here) are consistent with the 2SLS estimation.

26
5. Conclusions
Our primary aim in this study is to investigate whether bancassurance improves the
profitability and efficiency of banks. The prior studies indicate that bancassurance can
improve bank efficiency, not only through an increase in commission income, but also
through non-monetary benefits, such as increasing the faith of customers in the banks.
However, due to data restrictions, there is insufficient empirical evidence to clearly
identify the overall effect of bancassurance on the banking industry.
To the best of our knowledge, our study is the first to examine the direct impacts
of involvement in bancassurance business on the efficiency and profitability of banks
using the bancassurance revenue share. The evidence presented here reveals that
involvement in bancassurance business has had significantly positive impacts on the
efficiency and profitability of banks, and that it plays an important role in terms of a
non-interest source of income for the banks. These results provide strong support for
the notion that bancassurance offers banks with real benefits, whilst also increasing
value for bank shareholders. Our analysis also sheds further light on the financial
consolidation between banks and insurance companies.
Consistent bancassurance advantages are identified from two sets of results. Firstly,
involvement in bancassurance business is found to have significantly positive effects on
profitability performance, as measured by accounting returns and risk- adjusted returns.

27
Secondly, the evidence shows considerable improvements in efficiency amongst banks
engaging in more bancassurance business. Our DEA approach using financial
intermediaries reveals enhancements in cost efficiency, technical efficiency and pure
technical efficiency. One possible explanation for such efficiency improvements is that
banks may utilize their networks and other fixed costs better, thereby raising their overall
cost efficiency, with resultant improvements in the skills of employees, thereby raising
their technical efficiency.
We also examine the effects of different bancassurance cooperative strategies
between insurers and banks. Interestingly, we find that banks with more diversified
strategies – those banks cooperating with more insurance companies – will enjoy
significantly positive impacts on their efficiency performance, which suggests that a
diversification strategy is better for the banks than a concentration strategy.
Our study contributes to the extant literature by providing new evidence in support
of involvement by banks in bancassurance business. We find that the advantages of
bancassurance exist even after adjusting for risk and efficiency levels. Overall, our
empirical results suggest that bancassurance business can provide banks with higher
profits and efficiency improvements, such that increased cooperation with insurers would
appear to be a viable bancassurance strategy; banks may therefore wish to consider
further flexible forms of cooperation with other insurance companies.

28
References
Amici, A., F. Fiordelisi, F. Masala, O. Ricci and F. Sist (2013), ‘Value Creation in
Banking through Strategic Alliances and Joint Ventures’, Journal of Banking and
Finance, 37(5): 1386-96.
Benoist, G. (2002), ‘Bancassurance: The New Challenges’, Geneva Papers on Risk and
Insurance - Issues and Practice, 27(3): 295-303.
Bergendahl, G. (1995), ‘The Profitability of Bancassurance for European Banks’,
International Journal of Bank Marketing, 13(1): 17-28.
Berger, A.N., G.A. Hanweck and D.B. Humphrey (1987), ‘Competitive Viability in
Banking: Scale, Scope and Product Mix Economies’, Journal of monetary
economics, 20(3): 501-20.
Carow, K.A. (2001), ‘Citicorp-Travelers Group Merger: Challenging the Barriers
between Banking and Insurance’, Journal of Banking and Finance, 25(8): 1553-
71.
Casu, B. and P. Molyneux (2003), ‘A Comparative Study of Efficiency in European
Banking’, Applied Economics, 35(17): 1865-76.
Chang, P.-R., J.-L. Peng and C.K. Fan (2011), ‘A Comparison of Bancassurance and
Traditional Insurer Sales Channels’, Geneva Papers on Risk and Insurance - Issues
and Practice, 36(1): 76-93.
Chen, Z. and J. Tan (2011), ‘Does Bancassurance Add Value for Banks? Evidence from
Mergers and Acquisitions between European Banks and Insurance Companies’,
Research in International Business and Finance, 25(1): 104-12.

29
Cummins, J.D. and M.A. Weiss (2013), ‘Analyzing Firm Performance in the Insurance
Industry using Frontier Efficiency and Productivity Methods’, in G. Dionne (ed.)
(2013), Handbook of Insurance, Springer, pp. 795-861.
Dontis‐Charitos, P., P. Molyneux and S.K. Staikouras (2011), ‘Does the Stock Market
Compensate Banks for Diversifying into the Insurance Business?’, Financial
Markets, Institutions and Instruments, 20(1): 1-28.
Drake, L., M.J.B Hall and R. Simper (2006), ‘The Impact of Macroeconomic and
Regulatory Factors on Bank Efficiency: A Non-parametric Analysis of Hong
Kong’s Banking System’, Journal of Banking and Finance, 30(5): 1443-66.
Fields, P.L, D.R. Fraser and J.W. Kolari (2007), ‘Bidder Returns in Bancassurance
Mergers: Is there Evidence of Synergy?’, Journal of Banking and Finance, 31(12):
646-62.
Filson, D. and S. Olfati (2014), ‘The Impacts of Gramm-Leach-Bliley Bank
Diversification on Value and Risk’, Journal of Banking and Finance, 41: 209-21.
Fiordelisi, F. and O. Ricci (2011), ‘Bancassurance Efficiency Gains: Evidence from the
Italian Banking and Insurance Industries’, European Journal of Finance, 17(9-10):
789-810.
Genetay, N., P. Molyneux and S. McGuire (1998), Bancassurance: Macmillan London.
Gonulal, S.O, N. Goulder and R. Lester (2012), ‘Bancassurance: A Valuable Tool for
Developing Insurance in Emerging Markets’, World Bank, Policy Research
Working Paper, No. 6196.
Havrylchyk, O. (2006), ‘Efficiency of the Polish Bbanking Industry: Foreign versus

30
Domestic Banks’, Journal of Banking and Finance, 30(7): 1975-96.
Hsiao, H.-C., H. Chang, A.M. Cianci and L.-H. Huang (2010), ‘First Financial
Restructuring and Operating Efficiency: Evidence from Taiwanese Commercial
Banks’, Journal of Banking and Finance, 34(7): 1461-71.
Singhal, A.K. and R. Singh (2010), ‘Bancassurance: Leveraging on the Synergy
between the Banking and Insurance Industry’, IUP Journal of Risk and Insurance,
7(1): 28-37.
Slijkerman, J.F., D. Schoenmaker and C.G. de Vries (2013), ‘Systemic Risk and
Diversification across European Banks and Insurers’, Journal of Banking and
Finance, 37(3): 773-85.
Stiroh, K.J. and A. Rumble (2006), ‘The Dark Side of Diversification: The Case of US
Financial Holding Companies’, Journal of Banking and Finance, 30(8): 2131-61.
Sun, L. and T.-P. Chang (2011), ‘A Comprehensive Analysis of the Effects of Risk
Measures on Bank Efficiency: Evidence from Emerging Asian Countries’, Journal
of Banking and Finance, 35(7): 1727-35.
Swiss Re. (2007), ‘Bancassurance: Emerging Trends, Opportunities and Challenges’,
Sigma, 5: 1-39.
Wooldridge, J.M. (2002), Econometric Analysis of Cross Section and Panel Data,
Cambridge, MA: MIT Press.

Table 1 Bancassurance market shares across countriesa
Country Market Share (%)b Country Market Share (%)b
Brazil 77 Poland 43
Spain 65 Indonesia 40
France 60 Chile 35
Italian 60 Malaysia 32
Morocco 60 Thailand 31
South Korea 59 Mexico 28
Taiwan 53 Hungary 20
Hong Kong 50 India 10
China 48
Notes: a The bancassurance market shares are calculated in terms of the premiums coming from all channels within the
life insurance industry. b 2010 data on France, Hong Kong, Indonesia, Italy, Mexico, South Korea and Spain are obtained from the World
Bank Policy Research Working Paper; 2012 data on Brazil, Chile, China, Hungary, India, Malaysia, Morocco, Poland and Thailand are obtained from the Finaccord Global Bancassurance Database; and 2013 data on Taiwan were collected from the Taiwan Insurance Institute.

Table 2 Descriptive summary statistics
Variables Mean S.D. Min. Max. Median No. of Obs.
ROA (%) 0.098 1.007 –6.201 1.874 0.287 228
ROE (%) 0.995 16.445 –115.754 22.313 5.410 228
RAROA (%) 1.266 2.003 –3.431 4.168 1.365 228
RAROE (%) 1.253 1.992 –3.430 4.060 1.443 228
CE 0.634 0.165 0.242 1.000 0.624 235
AE 0.831 0.104 0.461 1.000 0.849 235
TE 0.762 0.166 0.281 1.000 0.773 235
PTE 0.870 0.145 0.300 1.000 0.919 235
SE 0.878 0.125 0.493 1.000 0.914 235
Banc 0.023 0.025 0.000 0.241 0.016 235
Bancnon* 0.099 0.095 0.002 0.881 0.079 235
BIS (%) 11.383 2.269 5.380 29.830 11.160 235
StrHHI 0.417 0.271 0.089 1.000 0.309 235
Mkt_Share 0.031 0.026 0.004 0.107 0.018 235
Equity/Assets 0.060 0.019 0.027 0.218 0.058 235
Gov_Own 0.221 0.416 0.000 1.000 0.000 235
Listing 0.294 0.456 0.000 1.000 0.000 235
Note: * Bancnon, which is an alternative proxy for the Banc variable, is defined as the ratio of bancassurance
commission earned from insurance to the non-interest income of banks.

Table 3 Regression results on bancassurance and bank efficiency
Variables CE AE TE PTE SE
Coeff. Std. Err. Coeff. Std. Err. Coeff. Std. Err. Coeff. Std. Err. Coeff. Std. Err.
Constant 0.501 *** 0.075 0.748 *** 0.047 0.706 *** 0.081 0.955 *** 0.082 0.759 *** 0.061
Banc 1.501 *** 0.492 0.238 0.373 1.755 *** 0.530 1.797 *** 0.537 0.604 0.413
BIS 0.022 *** 0.007 0.008 0.005 0.016 ** 0.008 0.013 * 0.007 0.009 0.006
Mkt_Share 2.765 *** 1.045 1.253 *** 0.473 1.719 1.120 3.557 *** 1.108 –0.781 0.761
Equity/Assets –3.586 *** 0.947 –0.669 0.654 –3.420 *** 1.013 –5.084 *** 1.023 0.325 0.765
Gov_Own –0.002 0.125 –0.098 * 0.057 0.313 ** 0.154 0.733 28.847 0.326 *** 0.105
Listing 0.011 0.055 –0.014 0.024 0.019 0.061 –0.067 0.058 0.063 0.041
Log Likelihood 127.1 186.6 90.66 61.31 140.8
Note: Total observations = 235. *** indicates significance at the 1% level; ** indicates significance at the 5% level; and * indicates significance at the 10% level.

Table 4 Regression results on efficiency, with consideration of cooperation strategy
Variables CE AE TE PTE SE
Coeff. Std. Err. Coeff. Std. Err. Coeff. Std. Err. Coeff. Std. Err. Coeff. Std. Err.
Constant 0.499 *** 0.076 0.735 *** 0.048 0.721 *** 0.082 0.956 *** 0.083 0.782 *** 0.061
Banc 1.513 *** 0.495 0.277 0.372 1.682 *** 0.533 1.787 *** 0.542 0.517 0.412
BIS 0.022 *** 0.007 0.007 0.005 0.017 ** 0.008 0.013 * 0.007 0.010 0.006
StrHHI 0.010 0.053 0.048 0.035 –0.064 0.058 –0.007 0.056 –0.085 ** 0.043
Mkt_Share 2.759 *** 1.048 1.220 ** 0.476 1.783 1.106 3.572 *** 1.113 –0.693 0.752
Equity/Assets –3.607 *** 0.953 –0.726 0.654 –3.308 *** 1.016 –5.067 *** 1.033 0.430 0.761
Gov_Own –0.004 0.125 –0.102 * 0.057 0.323 ** 0.154 0.780 59.109 0.340 *** 0.105
Listing 0.013 0.056 –0.005 0.025 0.007 0.061 –0.069 0.058 0.048 0.041
Log Likelihood 127.1 187.5 91.28 61.32 142.7
Note: Total observations = 235. *** indicates significance at the 1% level; ** indicates significance at the 5% level; and * indicates significance at the 10% level.

Table 5 Regression results on bancassurance and bank profitability
Variables RAROE RAROA ROE ROA
Coeff. Std.Err. Coeff. Std.Err. Coeff. Std.Err. Coeff. Std.Err.
Constant –0.034** 0.015 –0.029* 0.015 –0.338** 0.133 –0.009 * 0.005
Banc 0.482*** 0.075 0.505*** 0.074 2.615*** 0.670 0.159 *** 0.037
BIS 0.001 0.001 0.001 0.001 0.001 0.009 –0.000 0.001
Mkt_Share –0.039 0.309 –0.107 0.307 –2.216 2.760 0.099 ** 0.050
Equity/Assets 0.447*** 0.159 0.430*** 0.157 5.952*** 1.415 0.089 0.066
Gov_Own – – – – – – –0.003 0.006
Listing – – – – – – –0.003 0.003
Hausman test 23.69*** 23.85*** 22.57*** 5.47
R2 0.326 0.335 0.229 0.145
Model Fixed Fixed Fixed Random
Note: Total observations = 228. *** indicates significance at the 1% level; ** indicates significance at the 5%
level; and * indicates significance at the 10% level.

Table 6 Regression results on profitability, with consideration of cooperation strategy
Variables RAROE RAROA ROE ROA
Coeff. Std.Err. Coeff. Std.Err. Coeff. Std.Err. Coeff. Std.Err.
Constant –0.033** 0.015 –0.028* 0.015 –0.325** 0.133 –0.008 0.005
Banc 0.472*** 0.076 0.493*** 0.075 2.458*** 0.676 0.155 *** 0.038
BIS 0.001 0.001 0.001 0.001 0.003 0.009 –0.000 0.001
StrHHI –0.007 0.009 –0.009 0.009 –0.115 0.078 –0.003 0.003
Mkt_Share –0.012 0.311 –0.074 0.308 –1.779 2.768 0.101 ** 0.051
Equity/Assets 0.454*** 0.159 0.439*** 0.157 6.064*** 1.413 0.094 0.067
Gov_Own – – – – – – –0.003 0.006
Listing – – – – – – –0.003 0.003
Hausman test 26.68*** 26.53*** 25.16*** 7.07
R2 0.337 0.338 0.238 0.138
Model Fixed Fixed Fixed Random
Note: Total observations = 228. *** indicates significance at the 1% level; ** indicates significance at the 5%
level; and * indicates significance at the 10% level.

Table 7 Interaction regression results on bancassurance and bank efficiency
Variables CE AE TE PTE SE
Coeff. Std. Err. Coeff. Std. Err. Coeff. Std. Err. Coeff. Std. Err. Coeff. Std. Err.
Constant 0.472 *** 0.078 0.747 *** 0.050 0.681 *** 0.084 0.926 *** 0.084 0.769 *** 0.063
Banc 2.616 *** 0.866 –0.208 0.673 3.522 *** 0.932 3.144 *** 0.965 1.044 0.739
BIS 0.022 *** 0.007 0.007 0.005 0.017 ** 0.008 0.013 * 0.007 0.010 0.006
StrHHI 0.059 0.062 0.026 0.043 0.015 0.066 0.050 0.065 –0.063 0.050
Banc*StrHHI –2.191 1.417 0.977 1.129 –3.597 ** 1.509 –2.755 * 1.608 –1.032 1.202
Mkt_Share 2.995 *** 1.093 1.180 ** 0.476 2.138 * 1.155 3.757 *** 1.125 –0.615 0.765
Equity/Assets –3.741 *** 0.952 –0.689 0.654 –3.527 *** 1.009 –5.146 *** 1.018 0.3885 0.762
Gov_Own –0.021 0.129 –0.099 * 0.057 0.294 * 0.157 0.777 60.225 0.333 *** 0.106
Listing 0.015 0.057 –0.006 0.025 0.011 0.063 –0.067 0.059 0.049 0.041
Log Likelihood 128.3 187.9 904.08 62.72 143.1
Note: Total observations = 235. *** indicates significance at the 1% level; ** indicates significance at the 5% level; and * indicates significance at the 10% level.

Table 8 Interaction regression on profitability
Variables RAROE RAROA ROE ROA
Coeff. Std.Err. Coeff. Std.Err. Coeff. Std.Err. Coeff. Std.Err.
Constant –0.032** 0.015 –0.026* 0.015 –0.318** 0.135 –0.008 0.005
Banc 0.406*** 0.125 0.424*** 0.123 2.174* 1.109 0.179 *** 0.063
BIS 0.001 0.001 0.001 0.001 0.003 0.009 –0.000 0.001
StrHHI –0.010 0.010 –0.012 0.010 –0.127 0.087 –0.002 0.004
Banc*StrHHI 0.140 0.210 0.147 0.208 0.604 1.869 –0.051 0.107
Mkt_Share –0.056 0.319 –0.120 0.316 –1.967 2.835 0.103 ** 0.052
Equity/Assets 0.477*** 0.163 0.464*** 0.162 6.167*** 1.451 0.091 0.068
Gov_Own – – – – – – –0.003 0.006
Listing – – – – – – –0.003 0.003
Hausman test 26.73*** 26.51*** 24.36*** 7.06
R2 0.330 0.340 0.238 0.140
Model Fixed Fixed Fixed Random
Note: Total observations = 228. *** indicates significance at the 1% level; ** indicates significance at the 5%
level; and * indicates significance at the 10% level.
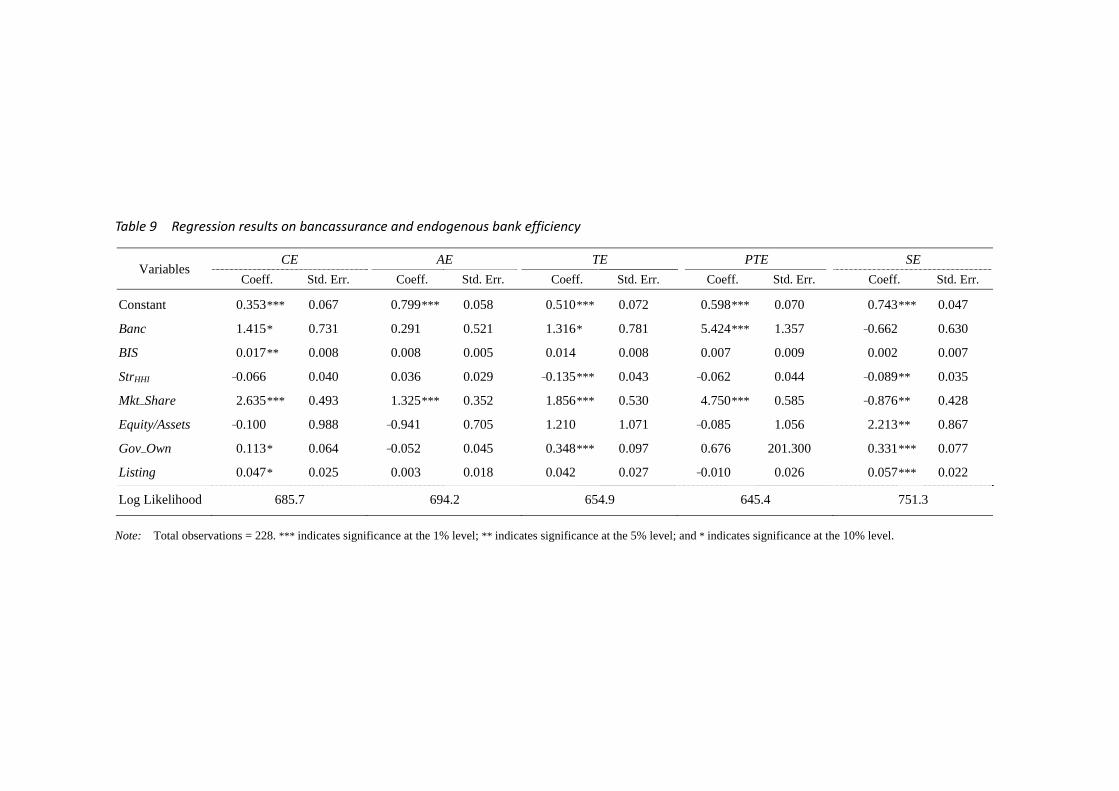
Table 9 Regression results on bancassurance and endogenous bank efficiency
Variables CE AE TE PTE SE
Coeff. Std. Err. Coeff. Std. Err. Coeff. Std. Err. Coeff. Std. Err. Coeff. Std. Err.
Constant 0.353*** 0.067 0.799*** 0.058 0.510*** 0.072 0.598*** 0.070 0.743*** 0.047
Banc 1.415* 0.731 0.291 0.521 1.316* 0.781 5.424*** 1.357 –0.662 0.630
BIS 0.017** 0.008 0.008 0.005 0.014 0.008 0.007 0.009 0.002 0.007
StrHHI –0.066 0.040 0.036 0.029 –0.135*** 0.043 –0.062 0.044 –0.089** 0.035
Mkt_Share 2.635*** 0.493 1.325*** 0.352 1.856*** 0.530 4.750*** 0.585 –0.876** 0.428
Equity/Assets –0.100 0.988 –0.941 0.705 1.210 1.071 –0.085 1.056 2.213** 0.867
Gov_Own 0.113* 0.064 –0.052 0.045 0.348*** 0.097 0.676 201.300 0.331*** 0.077
Listing 0.047* 0.025 0.003 0.018 0.042 0.027 –0.010 0.026 0.057*** 0.022
Log Likelihood 685.7 694.2 654.9 645.4 751.3
Note: Total observations = 228. *** indicates significance at the 1% level; ** indicates significance at the 5% level; and * indicates significance at the 10% level.

Table 10 2SLS Regression results on bancassurance and bank profitability
Variables RAROE RAROA ROE ROA
Coeff. Std.Err. Coeff. Std.Err. Coeff. Std.Err. Coeff. Std.Err.
Constant –0.032*** 0.007 –0.033*** 0.007 –0.014*** 0.004 –0.344 0.068
Banc 0.389*** 0.070 0.374*** 0.070 0.151*** 0.038 1.848 *** 0.678
BIS 0.002** 0.001 0.002*** 0.001 0.001 0.000 0.017 ** 0.008
StrHHI 0.005 0.004 0.006 0.004 0.001 0.002 0.023 0.041
Mkt_Share 0.376*** 0.051 0.365*** 0.052 0.111*** 0.028 2.000 ** 0.501
Equity/Assets –0.032 0.104 –0.024 0.105 0.013 0.057 0.629 1.013
Gov_Own 0.001 0.006 0.002 0.007 –0.002 0.004 –0.032 0.063
Listing 0.002 0.003 0.002 0.003 0.000 0.001 0.016 0.026
R2 0.371 0.365 0.147 0.165
Note: Total observations = 196. *** indicates significance at the 1% level; ** indicates significance at the 5%
level; and * indicates significance at the 10% level.
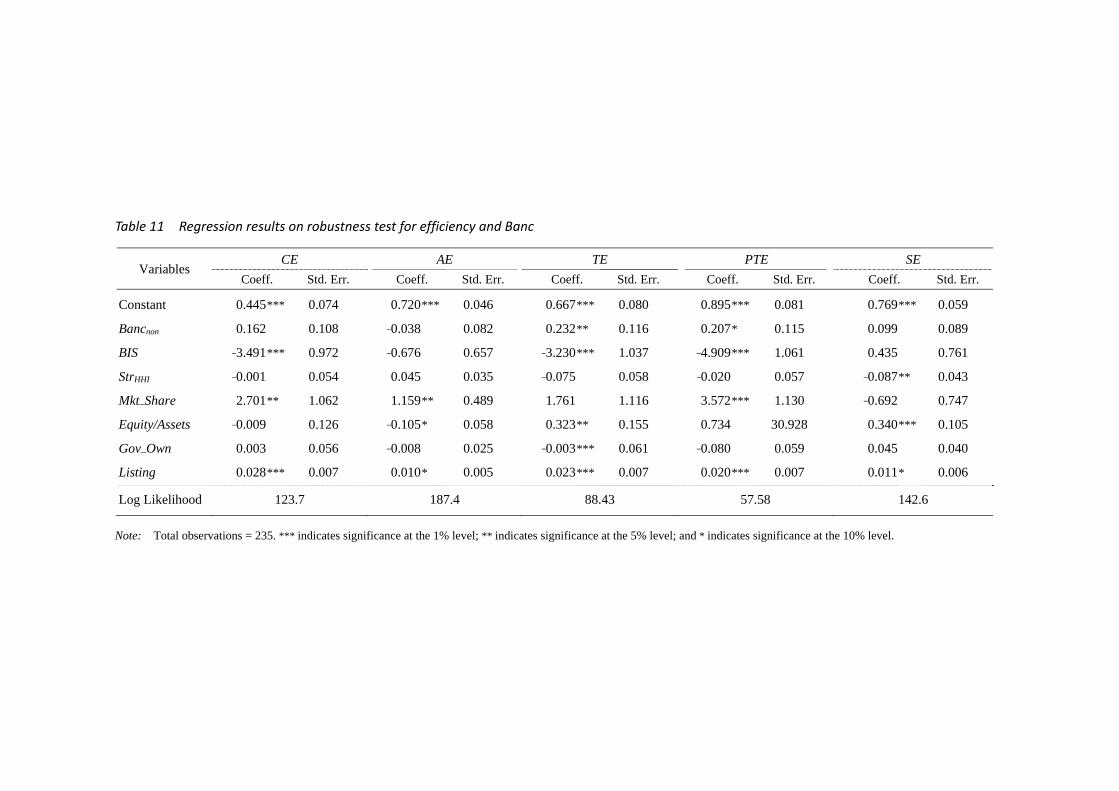
Table 11 Regression results on robustness test for efficiency and Banc
Variables CE AE TE PTE SE
Coeff. Std. Err. Coeff. Std. Err. Coeff. Std. Err. Coeff. Std. Err. Coeff. Std. Err.
Constant 0.445*** 0.074 0.720*** 0.046 0.667*** 0.080 0.895*** 0.081 0.769*** 0.059
Bancnon 0.162 0.108 –0.038 0.082 0.232** 0.116 0.207* 0.115 0.099 0.089
BIS –3.491*** 0.972 –0.676 0.657 –3.230*** 1.037 –4.909*** 1.061 0.435 0.761
StrHHI –0.001 0.054 0.045 0.035 –0.075 0.058 –0.020 0.057 –0.087** 0.043
Mkt_Share 2.701** 1.062 1.159** 0.489 1.761 1.116 3.572*** 1.130 –0.692 0.747
Equity/Assets –0.009 0.126 –0.105* 0.058 0.323** 0.155 0.734 30.928 0.340*** 0.105
Gov_Own 0.003 0.056 –0.008 0.025 –0.003*** 0.061 –0.080 0.059 0.045 0.040
Listing 0.028*** 0.007 0.010* 0.005 0.023*** 0.007 0.020*** 0.007 0.011* 0.006
Log Likelihood 123.7 187.4 88.43 57.58 142.6
Note: Total observations = 235. *** indicates significance at the 1% level; ** indicates significance at the 5% level; and * indicates significance at the 10% level.

Table 12 Regression results on robustness test for profitability and Banc
Variables RAROE RAROA ROE ROA
Coeff. Std.Err. Coeff. Std.Err. Coeff. Std.Err. Coeff. Std.Err.
Constant –0.050*** 0.015 –0.046*** 0.015 –0.421*** 0.131 –0.013 ** 0.005
Banc 0.096*** 0.017 0.099*** 0.017 0.393*** 0.149 0.024 *** 0.009
BIS 0.456** 0.161 0.441*** 0.160 6.043 1.435 0.102 ** 0.069
StrHHI –0.010 0.009 –0.012 0.009 –0.135* 0.078 –0.004 0.004
Mkt_Share 0.083 0.314 0.026 0.312 –1.220 2.803 0.101 * 0.054
Equity/Assets 0.454*** 0.159 0.439*** 0.157 6.064*** 1.413 0.094 0.067
Gov_Own – – – – –0.003 0.006 –0.003 0.006
Listing – – – – –0.004 0.003 –0.004 0.003
Hausman test 19.39*** 20.08*** 28.10*** 6.71
R2 0.313 0.318 0.214 0.097
Model Fixed Fixed Fixed Random
Note: Total observations = 228. *** indicates significance at the 1% level; ** indicates significance at the 5%
level; and * indicates significance at the 10% level.

Table 1 Bancassurance market shares across countriesa
Country Market Share (%)b Country Market Share (%)b
Brazil 77 Poland 43
Spain 65 Indonesia 40
France 60 Chile 35
Italian 60 Malaysia 32
Morocco 60 Thailand 31
South Korea 59 Mexico 28
Taiwan 53 Hungary 20
Hong Kong 50 India 10
China 48
Notes: a The bancassurance market shares are calculated in terms of the premiums coming from all channels within the
life insurance industry. b 2010 data on France, Hong Kong, Indonesia, Italy, Mexico, South Korea and Spain are obtained from the World
Bank Policy Research Working Paper; 2012 data on Brazil, Chile, China, Hungary, India, Malaysia, Morocco, Poland and Thailand are obtained from the Finaccord Global Bancassurance Database; and 2013 data on Taiwan were collected from the Taiwan Insurance Institute.

Table 2 Descriptive summary statistics
Variables Mean S.D. Min. Max. Median No. of Obs.
ROA (%) 0.098 1.007 –6.201 1.874 0.287 228
ROE (%) 0.995 16.445 –115.754 22.313 5.410 228
RAROA (%) 1.266 2.003 –3.431 4.168 1.365 228
RAROE (%) 1.253 1.992 –3.430 4.060 1.443 228
CE 0.634 0.165 0.242 1.000 0.624 235
AE 0.831 0.104 0.461 1.000 0.849 235
TE 0.762 0.166 0.281 1.000 0.773 235
PTE 0.870 0.145 0.300 1.000 0.919 235
SE 0.878 0.125 0.493 1.000 0.914 235
Banc 0.023 0.025 0.000 0.241 0.016 235
Bancnon* 0.099 0.095 0.002 0.881 0.079 235
BIS (%) 11.383 2.269 5.380 29.830 11.160 235
StrHHI 0.417 0.271 0.089 1.000 0.309 235
Mkt_Share 0.031 0.026 0.004 0.107 0.018 235
Equity/Assets 0.060 0.019 0.027 0.218 0.058 235
Gov_Own 0.221 0.416 0.000 1.000 0.000 235
Listing 0.294 0.456 0.000 1.000 0.000 235
Note: * Bancnon, which is an alternative proxy for the Banc variable, is defined as the ratio of bancassurance
commission earned from insurance to the non-interest income of banks.
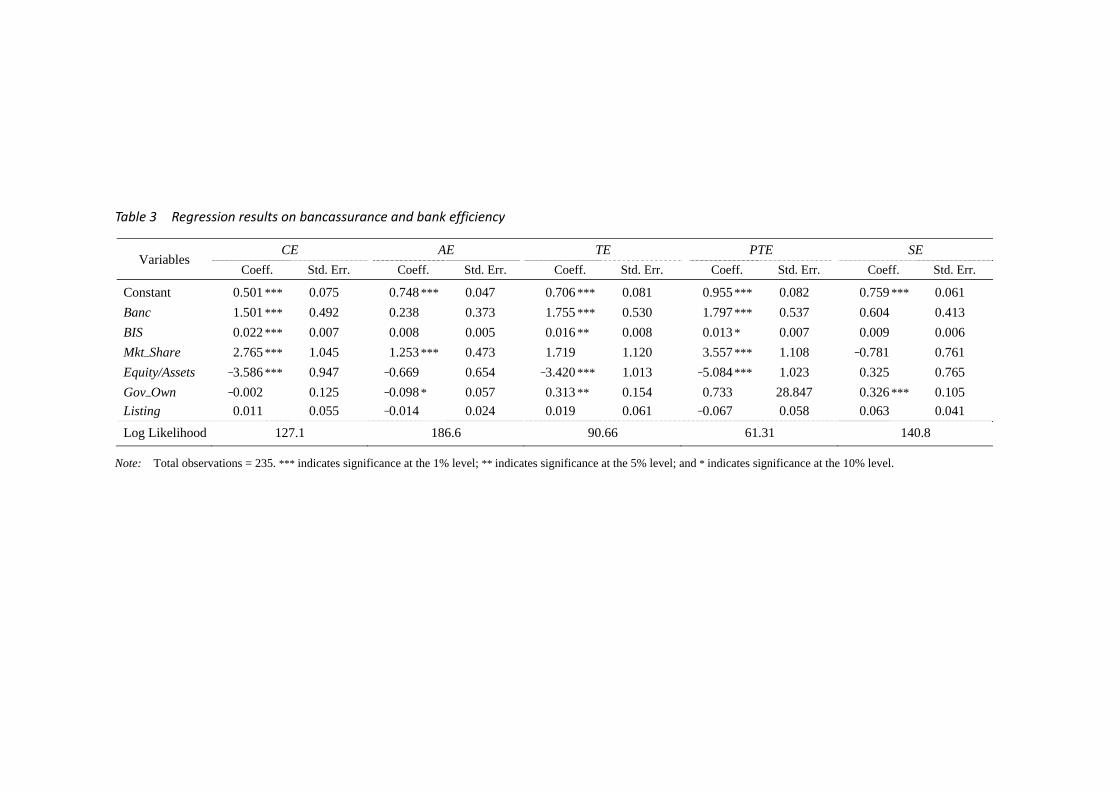
Table 3 Regression results on bancassurance and bank efficiency
Variables CE AE TE PTE SE
Coeff. Std. Err. Coeff. Std. Err. Coeff. Std. Err. Coeff. Std. Err. Coeff. Std. Err.
Constant 0.501 *** 0.075 0.748 *** 0.047 0.706 *** 0.081 0.955 *** 0.082 0.759 *** 0.061
Banc 1.501 *** 0.492 0.238 0.373 1.755 *** 0.530 1.797 *** 0.537 0.604 0.413
BIS 0.022 *** 0.007 0.008 0.005 0.016 ** 0.008 0.013 * 0.007 0.009 0.006
Mkt_Share 2.765 *** 1.045 1.253 *** 0.473 1.719 1.120 3.557 *** 1.108 –0.781 0.761
Equity/Assets –3.586 *** 0.947 –0.669 0.654 –3.420 *** 1.013 –5.084 *** 1.023 0.325 0.765
Gov_Own –0.002 0.125 –0.098 * 0.057 0.313 ** 0.154 0.733 28.847 0.326 *** 0.105
Listing 0.011 0.055 –0.014 0.024 0.019 0.061 –0.067 0.058 0.063 0.041
Log Likelihood 127.1 186.6 90.66 61.31 140.8
Note: Total observations = 235. *** indicates significance at the 1% level; ** indicates significance at the 5% level; and * indicates significance at the 10% level.

Table 4 Regression results on efficiency, with consideration of cooperation strategy
Variables CE AE TE PTE SE
Coeff. Std. Err. Coeff. Std. Err. Coeff. Std. Err. Coeff. Std. Err. Coeff. Std. Err.
Constant 0.499 *** 0.076 0.735 *** 0.048 0.721 *** 0.082 0.956 *** 0.083 0.782 *** 0.061
Banc 1.513 *** 0.495 0.277 0.372 1.682 *** 0.533 1.787 *** 0.542 0.517 0.412
BIS 0.022 *** 0.007 0.007 0.005 0.017 ** 0.008 0.013 * 0.007 0.010 0.006
StrHHI 0.010 0.053 0.048 0.035 –0.064 0.058 –0.007 0.056 –0.085 ** 0.043
Mkt_Share 2.759 *** 1.048 1.220 ** 0.476 1.783 1.106 3.572 *** 1.113 –0.693 0.752
Equity/Assets –3.607 *** 0.953 –0.726 0.654 –3.308 *** 1.016 –5.067 *** 1.033 0.430 0.761
Gov_Own –0.004 0.125 –0.102 * 0.057 0.323 ** 0.154 0.780 59.109 0.340 *** 0.105
Listing 0.013 0.056 –0.005 0.025 0.007 0.061 –0.069 0.058 0.048 0.041
Log Likelihood 127.1 187.5 91.28 61.32 142.7
Note: Total observations = 235. *** indicates significance at the 1% level; ** indicates significance at the 5% level; and * indicates significance at the 10% level.

Table 5 Regression results on bancassurance and bank profitability
Variables RAROE RAROA ROE ROA
Coeff. Std.Err. Coeff. Std.Err. Coeff. Std.Err. Coeff. Std.Err.
Constant –0.034** 0.015 –0.029* 0.015 –0.338** 0.133 –0.009 * 0.005
Banc 0.482*** 0.075 0.505*** 0.074 2.615*** 0.670 0.159 *** 0.037
BIS 0.001 0.001 0.001 0.001 0.001 0.009 –0.000 0.001
Mkt_Share –0.039 0.309 –0.107 0.307 –2.216 2.760 0.099 ** 0.050
Equity/Assets 0.447*** 0.159 0.430*** 0.157 5.952*** 1.415 0.089 0.066
Gov_Own – – – – – – –0.003 0.006
Listing – – – – – – –0.003 0.003
Hausman test 23.69*** 23.85*** 22.57*** 5.47
R2 0.326 0.335 0.229 0.145
Model Fixed Fixed Fixed Random
Note: Total observations = 228. *** indicates significance at the 1% level; ** indicates significance at the 5%
level; and * indicates significance at the 10% level.

Table 6 Regression results on profitability, with consideration of cooperation strategy
Variables RAROE RAROA ROE ROA
Coeff. Std.Err. Coeff. Std.Err. Coeff. Std.Err. Coeff. Std.Err.
Constant –0.033** 0.015 –0.028* 0.015 –0.325** 0.133 –0.008 0.005
Banc 0.472*** 0.076 0.493*** 0.075 2.458*** 0.676 0.155 *** 0.038
BIS 0.001 0.001 0.001 0.001 0.003 0.009 –0.000 0.001
StrHHI –0.007 0.009 –0.009 0.009 –0.115 0.078 –0.003 0.003
Mkt_Share –0.012 0.311 –0.074 0.308 –1.779 2.768 0.101 ** 0.051
Equity/Assets 0.454*** 0.159 0.439*** 0.157 6.064*** 1.413 0.094 0.067
Gov_Own – – – – – – –0.003 0.006
Listing – – – – – – –0.003 0.003
Hausman test 26.68*** 26.53*** 25.16*** 7.07
R2 0.337 0.338 0.238 0.138
Model Fixed Fixed Fixed Random
Note: Total observations = 228. *** indicates significance at the 1% level; ** indicates significance at the 5%
level; and * indicates significance at the 10% level.

Table 7 Interaction regression results on bancassurance and bank efficiency
Variables CE AE TE PTE SE
Coeff. Std. Err. Coeff. Std. Err. Coeff. Std. Err. Coeff. Std. Err. Coeff. Std. Err.
Constant 0.472 *** 0.078 0.747 *** 0.050 0.681 *** 0.084 0.926 *** 0.084 0.769 *** 0.063
Banc 2.616 *** 0.866 –0.208 0.673 3.522 *** 0.932 3.144 *** 0.965 1.044 0.739
BIS 0.022 *** 0.007 0.007 0.005 0.017 ** 0.008 0.013 * 0.007 0.010 0.006
StrHHI 0.059 0.062 0.026 0.043 0.015 0.066 0.050 0.065 –0.063 0.050
Banc*StrHHI –2.191 1.417 0.977 1.129 –3.597 ** 1.509 –2.755 * 1.608 –1.032 1.202
Mkt_Share 2.995 *** 1.093 1.180 ** 0.476 2.138 * 1.155 3.757 *** 1.125 –0.615 0.765
Equity/Assets –3.741 *** 0.952 –0.689 0.654 –3.527 *** 1.009 –5.146 *** 1.018 0.3885 0.762
Gov_Own –0.021 0.129 –0.099 * 0.057 0.294 * 0.157 0.777 60.225 0.333 *** 0.106
Listing 0.015 0.057 –0.006 0.025 0.011 0.063 –0.067 0.059 0.049 0.041
Log Likelihood 128.3 187.9 904.08 62.72 143.1
Note: Total observations = 235. *** indicates significance at the 1% level; ** indicates significance at the 5% level; and * indicates significance at the 10% level.

Table 8 Interaction regression on profitability
Variables RAROE RAROA ROE ROA
Coeff. Std.Err. Coeff. Std.Err. Coeff. Std.Err. Coeff. Std.Err.
Constant –0.032** 0.015 –0.026* 0.015 –0.318** 0.135 –0.008 0.005
Banc 0.406*** 0.125 0.424*** 0.123 2.174* 1.109 0.179 *** 0.063
BIS 0.001 0.001 0.001 0.001 0.003 0.009 –0.000 0.001
StrHHI –0.010 0.010 –0.012 0.010 –0.127 0.087 –0.002 0.004
Banc*StrHHI 0.140 0.210 0.147 0.208 0.604 1.869 –0.051 0.107
Mkt_Share –0.056 0.319 –0.120 0.316 –1.967 2.835 0.103 ** 0.052
Equity/Assets 0.477*** 0.163 0.464*** 0.162 6.167*** 1.451 0.091 0.068
Gov_Own – – – – – – –0.003 0.006
Listing – – – – – – –0.003 0.003
Hausman test 26.73*** 26.51*** 24.36*** 7.06
R2 0.330 0.340 0.238 0.140
Model Fixed Fixed Fixed Random
Note: Total observations = 228. *** indicates significance at the 1% level; ** indicates significance at the 5%
level; and * indicates significance at the 10% level.

Table 9 Regression results on bancassurance and endogenous bank efficiency
Variables CE AE TE PTE SE
Coeff. Std. Err. Coeff. Std. Err. Coeff. Std. Err. Coeff. Std. Err. Coeff. Std. Err.
Constant 0.353*** 0.067 0.799*** 0.058 0.510*** 0.072 0.598*** 0.070 0.743*** 0.047
Banc 1.415* 0.731 0.291 0.521 1.316* 0.781 5.424*** 1.357 –0.662 0.630
BIS 0.017** 0.008 0.008 0.005 0.014 0.008 0.007 0.009 0.002 0.007
StrHHI –0.066 0.040 0.036 0.029 –0.135*** 0.043 –0.062 0.044 –0.089** 0.035
Mkt_Share 2.635*** 0.493 1.325*** 0.352 1.856*** 0.530 4.750*** 0.585 –0.876** 0.428
Equity/Assets –0.100 0.988 –0.941 0.705 1.210 1.071 –0.085 1.056 2.213** 0.867
Gov_Own 0.113* 0.064 –0.052 0.045 0.348*** 0.097 0.676 201.300 0.331*** 0.077
Listing 0.047* 0.025 0.003 0.018 0.042 0.027 –0.010 0.026 0.057*** 0.022
Log Likelihood 685.7 694.2 654.9 645.4 751.3
Note: Total observations = 228. *** indicates significance at the 1% level; ** indicates significance at the 5% level; and * indicates significance at the 10% level.

Table 10 2SLS Regression results on bancassurance and bank profitability
Variables RAROE RAROA ROE ROA
Coeff. Std.Err. Coeff. Std.Err. Coeff. Std.Err. Coeff. Std.Err.
Constant –0.032*** 0.007 –0.033*** 0.007 –0.014*** 0.004 –0.344 0.068
Banc 0.389*** 0.070 0.374*** 0.070 0.151*** 0.038 1.848 *** 0.678
BIS 0.002** 0.001 0.002*** 0.001 0.001 0.000 0.017 ** 0.008
StrHHI 0.005 0.004 0.006 0.004 0.001 0.002 0.023 0.041
Mkt_Share 0.376*** 0.051 0.365*** 0.052 0.111*** 0.028 2.000 ** 0.501
Equity/Assets –0.032 0.104 –0.024 0.105 0.013 0.057 0.629 1.013
Gov_Own 0.001 0.006 0.002 0.007 –0.002 0.004 –0.032 0.063
Listing 0.002 0.003 0.002 0.003 0.000 0.001 0.016 0.026
R2 0.371 0.365 0.147 0.165
Note: Total observations = 196. *** indicates significance at the 1% level; ** indicates significance at the 5%
level; and * indicates significance at the 10% level.

Table 11 Regression results on robustness test for efficiency and Banc
Variables CE AE TE PTE SE
Coeff. Std. Err. Coeff. Std. Err. Coeff. Std. Err. Coeff. Std. Err. Coeff. Std. Err.
Constant 0.445*** 0.074 0.720*** 0.046 0.667*** 0.080 0.895*** 0.081 0.769*** 0.059
Bancnon 0.162 0.108 –0.038 0.082 0.232** 0.116 0.207* 0.115 0.099 0.089
BIS –3.491*** 0.972 –0.676 0.657 –3.230*** 1.037 –4.909*** 1.061 0.435 0.761
StrHHI –0.001 0.054 0.045 0.035 –0.075 0.058 –0.020 0.057 –0.087** 0.043
Mkt_Share 2.701** 1.062 1.159** 0.489 1.761 1.116 3.572*** 1.130 –0.692 0.747
Equity/Assets –0.009 0.126 –0.105* 0.058 0.323** 0.155 0.734 30.928 0.340*** 0.105
Gov_Own 0.003 0.056 –0.008 0.025 –0.003*** 0.061 –0.080 0.059 0.045 0.040
Listing 0.028*** 0.007 0.010* 0.005 0.023*** 0.007 0.020*** 0.007 0.011* 0.006
Log Likelihood 123.7 187.4 88.43 57.58 142.6
Note: Total observations = 235. *** indicates significance at the 1% level; ** indicates significance at the 5% level; and * indicates significance at the 10% level.

Table 12 Regression results on robustness test for profitability and Banc
Variables RAROE RAROA ROE ROA
Coeff. Std.Err. Coeff. Std.Err. Coeff. Std.Err. Coeff. Std.Err.
Constant –0.050*** 0.015 –0.046*** 0.015 –0.421*** 0.131 –0.013 ** 0.005
Banc 0.096*** 0.017 0.099*** 0.017 0.393*** 0.149 0.024 *** 0.009
BIS 0.456** 0.161 0.441*** 0.160 6.043 1.435 0.102 ** 0.069
StrHHI –0.010 0.009 –0.012 0.009 –0.135* 0.078 –0.004 0.004
Mkt_Share 0.083 0.314 0.026 0.312 –1.220 2.803 0.101 * 0.054
Equity/Assets 0.454*** 0.159 0.439*** 0.157 6.064*** 1.413 0.094 0.067
Gov_Own – – – – –0.003 0.006 –0.003 0.006
Listing – – – – –0.004 0.003 –0.004 0.003
Hausman test 19.39*** 20.08*** 28.10*** 6.71
R2 0.313 0.318 0.214 0.097
Model Fixed Fixed Fixed Random
Note: Total observations = 228. *** indicates significance at the 1% level; ** indicates significance at the 5%
level; and * indicates significance at the 10% level.