Embed Size (px)
Citation preview
PERPUSTAKAAN UMP
1111111111111111111111111111111 0000092730
THE IMPACT OF AGRICULTURAL ACTIVITY TOWARDS WATER QUALITY IN TASIK CHINI
NASIHAH SAKINAH BINTI ZAINUDI
Report submitted in partial fulfillment of the requirements for the award of the degree of Bachelor of Civil Engineering
Faculty of Civil Engineering and Earth Resources UNIVERSITI MALAYSIA PAHANG
JUNE 2013
vi
ABSTRACT
A study on the impact of agricultural activity towards water quality in Tasik Chini was conducted at six sampling stations which were at Laut Gumum, Laut Jerangking, Laut Melai, LAut Kenawar, Laut Pulai Balai/PLKN, and Tasik Chini Resort. A total of thirteen water quality parameters were analyzed including in situ test and laboratory analysis. All the parameters were analyzed and measured according to Department of Environment Water Quality Index and National Water Quality Standard (NWQS) for Malaysia. The physical, chemical and biological variables were temperature, turbidity, total suspended solid (TSS), dissolved oxygen (DO), pH, biological oxygen demand (BUD), chemical oxygen demand, electrical conductivity (EC), ammoniacal nitrogen (NI 3-N), nitrate (NO), phosphate (PO 3 ), total coliform, and Escherichia coli (E.Coli). The result show that water quality at Tasik Chini is Class II based on WQI, which means, Tasik Chini is suitable for recreational activity and body contact is allowed, however basic treatment required for water supply. Based on NWQS, electrical conductivity (EC), total suspended solid (TSS), ammoniacal nitrogen (NI 3-N), and nitrate are Class I. Parameter for turbidity, phosphate, biochemical oxygen demand (BUD), and chemical oxygen demand (COD) under Class II. pH and dissolved Oxygen under Class III. Human activities at surrounding area near Tasik Chini affected water quality there. Agricultural activity, such as palm oil plantation at Kampung Gumum, and rubber plantation at Tanjong Jerangking indeed affects water quality in Tasik Chini and if these situation continued, may have caused environmental degradation at Tasik Chini hence may lead algal bloom in lakes.
vii
ABSTRAK
Kajian mengenai kesan pertanian terhadap kualiti air di Tasik Chini telah dijalankan di enam stesen persampelan iaitu, di Laut Gumum, Laut Jerangking, Laut Melai, Laut Kenawar, Laut Pulau Balai/PLKN dan Resort Tasik Chini. Sebanyak tiga belas parameter telah di analisis iaitu parameter untuk ujian di lokasi serta eksperimen di makmal. Semua parameter telah dianalisis berdasarkan Indeks Kualiti Air, Jabatan Alam Sekitar dan Standard Kualiti Air Negara. Antara parameter fizikal, kimia dan biologi yang diuji adalah suhu, kekeruhan pepejal terampai (TSS), oksigen terlarut (DO), pH, permintaan oksigen biokimia (BOD), permintaan oksigen kimia (COD), kekonduksian elektrik (BC), nitrogen ammonia (NI 3-N), nitrat (NO), fosfat (PO3), jumlah koliform, dan Escherichia coli (E.Coli). Kajian telah menunjukkan bahawa Tasik Chini adalah Kelas II berdasarkan WQL Dengan itu, Tasik Chini sesuai untuk aktiviti rekreasi dan sentuhan air terhadap kulit adalah dibenarkan. Walaubagaimanapn, rawatan asas perlu dilakukan untuk bekalan air. Berdasarkan NWQS, kekonduksian elektrik (BC), jumlah pepejal terampai (TSS), nitrohen ammonia (NH 3 -N), dan nitrat (NO) adalah Kelas I. Untuk parameter kekeruhan, fosfat (PO 3 ), permintaan oksigen biokimia (BOD), clan permintaan oksigen kimia (COD) adalah Kelas II. Bagi parameter pH dan oksigen terlarut adalah Kelas III. Aktiviti - aktiviti di sekitar kawasan Tasik Chini menjejaskan kualiti air di sana. Aktiviti pertanian seperti di ladang kelapa sawit yang terdapat di Kampung Gumum serta aktiviti pertanian ladang getah di Tanjong Jerangkirig merupakan salah faktor yang menyebabkan terjejasnya kualiti air di Tasik Chini, clan jika keadaan mi berterusan mungkin boleh menyebabkan kemerosotan alam sekitar di Tasik Chini yang mana boleh menyebabkan terjadinya alga bloom di dalam tasik,
TABLE OF CONTENTS
Page TITLE i
SUPERVISOR'S DECLARATION ii
STUDENT'S DECLARATION iii
DEDICATION iv
ACKNOWLEDGEMENTS v
ABSTRACT vi
ABSTRAK vii
TABLE OF CONTENTS viii
LIST OF TABLES xiii
LIST OF FIGURE xiv
LIST OF ABBREVIATIONS xvi
CHAPTER 1 INTRODUCTION
1.1 Background of Study 1
1.2 Problem Statement 2
1.3 Research Objective 2
1.4 Scope of Study 3
1.5 Expected Outcome 3
1.6 Conclusion 3
CHAPTER 2 LITERATURE REVIEW
2.1 Introduction 4
2.2 Surface Water
4
2.2.1 Lake
5 2.2.2 TasikChini
5
viii
ix
2.3 Pollution of Lake 6
2.3.1 Point Source Pollution 6 2.3.2 Non Point Source Pollution 6 2.33 Agricultural Run-Off 7 2.3.4 Pollution at Tasik Chini 7
2.4 Water Quality 8
2.4.1 Physical Parameter 8
2.4.1.1 Temperature 8 2.4.1.2 Turbidity 9 2.4.1.3 Total Suspended Solids (TSS) 9
2.4.2 Chemical Parameter 10
2.4.2.1 pH 10 2.4.2.2 Electrical Conductivity (EC) 11 2.4.2.3 Dissolved Oxygen 11 2,4.2.4 Biochemical Oxygen Demand (BOD) 11 2.4.2.5 Chemical Oxygen Demand (COD) 12 2.4.2.6 Nitrogen as Ammoniacal Nitrogen 12 2.4.2.7 Nitrogen as Nitrate 13 2.4.2.8 Phosphorus 13
2.4.3 Biological Parameter 14
2.4.3.1 Total Coliform 14 2.4.3.2 Escherichia Coli (E.Coli) 14
2.5 Water Quality Standard 14
2.5.1 Department Of Environment, Water Quality Standard 15 (DOE- WQI)
2.5.2 National Water Quality Standard (NWQS) 15
2.6 Conclusion 16
CHAPTER 3 METHODOLOGY
3.1 Introduction 17
3.2 Methodology Flow Chart 17
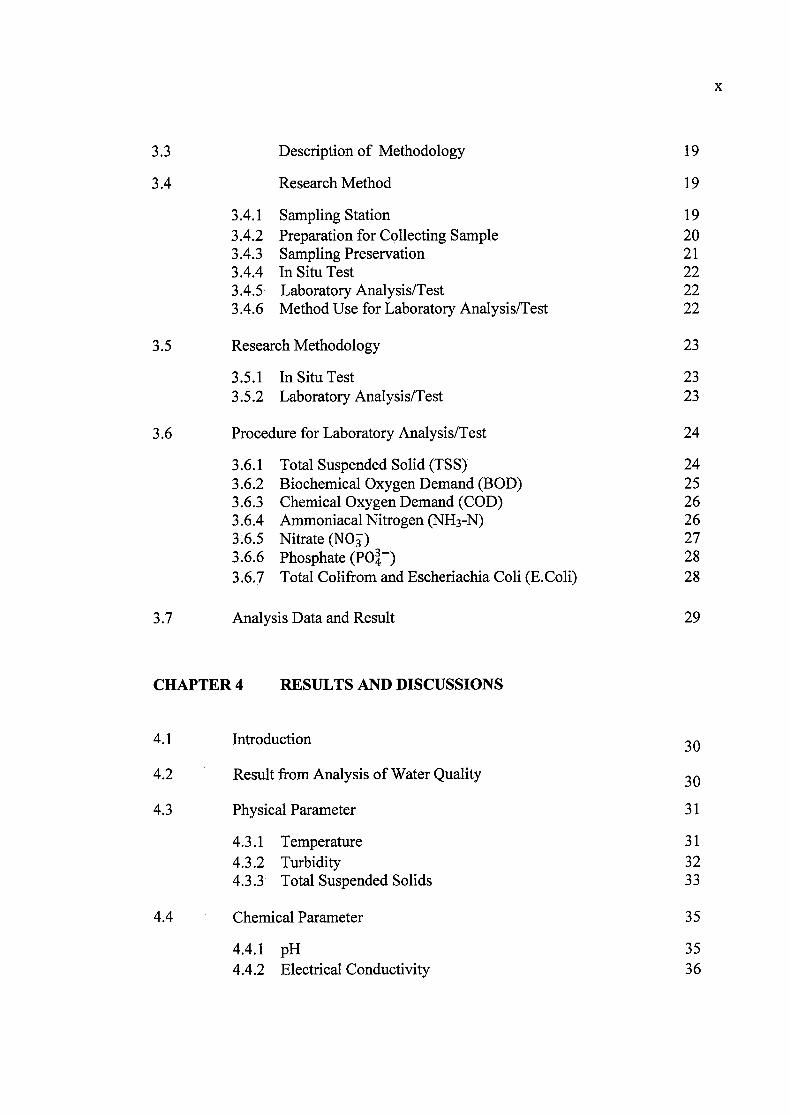
3.3 Description of Methodology 19
3.4 Research Method 19
3.4.1 Sampling Station 19 3.4.2 Preparation for Collecting Sample 20 3.4.3 Sampling Preservation 21 3.4.4 In Situ Test 22 3.4.5 Laboratory Analysis/Test 22 3.4.6 Method Use for Laboratory Analysis/Test 22
3.5 Research Methodology 23
3.5.1 In Situ Test 23 3.5.2 Laboratory Analysis/Test 23
3.6 Procedure for Laboratory Analysis/Test 24
3.6.1 Total Suspended Solid (TSS) 24 3.6.2 Biochemical Oxygen Demand (BOD) 25 3.6.3 Chemical Oxygen Demand (COD) 26 3.6.4 Ammoniacal Nitrogen (NI 3-N) 26 3.6.5 Nitrate (NO) 27 3.6.6 Phosphate (POr) 28 3.6.7 Total Colifrom and Escheriachia Coli (E.Coli) 28
3.7 Analysis Data and Result 29
CHAPTER 4 RESULTS AND DISCUSSIONS
4.1 Introduction 30
4.2 Result from Analysis of Water Quality 30
4.3 Physical Parameter 31
4.3.1 Temperature 31 4.3.2 Turbidity 32 4.3.3 Total Suspended Solids 33
4.4 Chemical Parameter 35
4.4.1 pH 35 4.4.2 Electrical Conductivity 36
x
xi
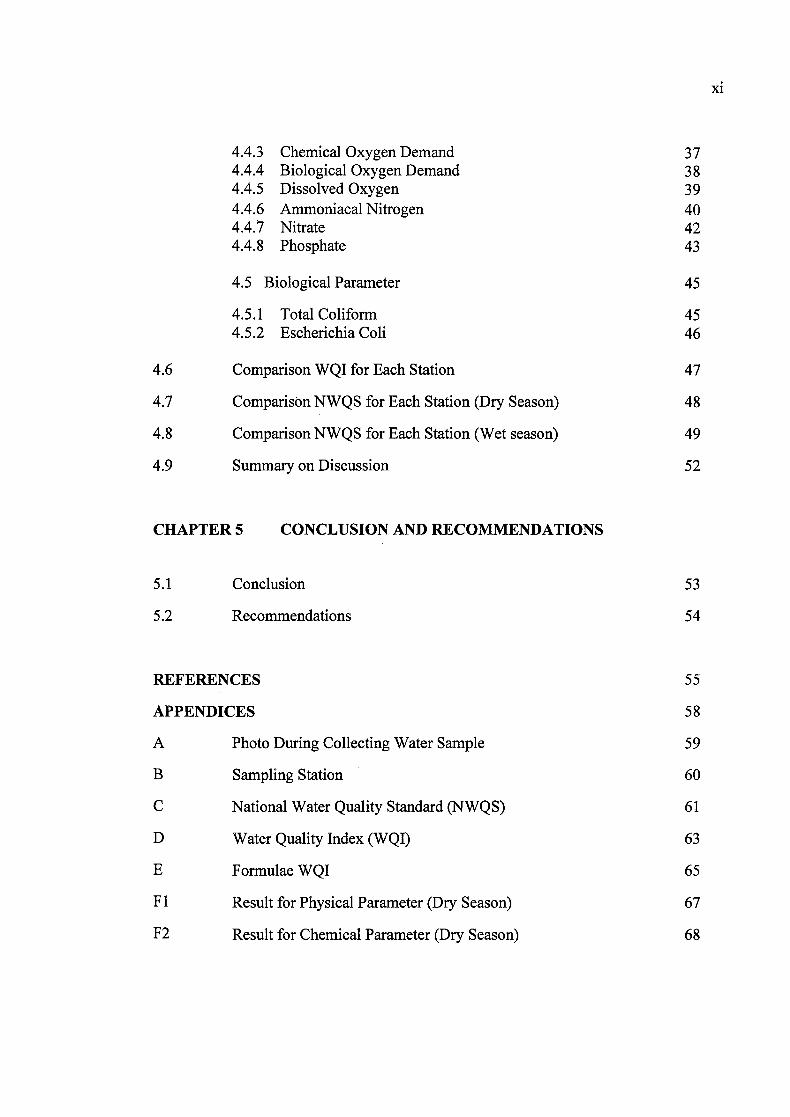
4.4.3 Chemical Oxygen Demand 37 4.4.4 Biological Oxygen Demand 38 4.4.5 Dissolved Oxygen 39 4.4.6 Ammoniacal Nitrogen 40 4.4.7 Nitrate 42 4.4.8 Phosphate 43
4.5 Biological Parameter 45
4.5.1 Total Coliform 45 4.5.2 Escherichia Coli 46
4.6 Comparison WQI for Each Station 47
4.7 Comparison NWQS for Each Station (Dry Season) 48
4.8 Comparison NWQS for Each Station (Wet season) 49
4.9 Summary on Discussion 52
CHAPTER 5 CONCLUSION AND RECOMMENDATIONS
5.1 Conclusion 53
5.2 Recommendations 54
REFERENCES 55
APPENDICES 58
A Photo During Collecting Water Sample 59
B Sampling Station 60
C National Water Quality Standard (NWQS) 61
D Water Quality Index (WQI) 63
E Formulae WQI 65
Fl Result for Physical Parameter (Dry Season) 67
F2 Result for Chemical Parameter (Dry Season) 68
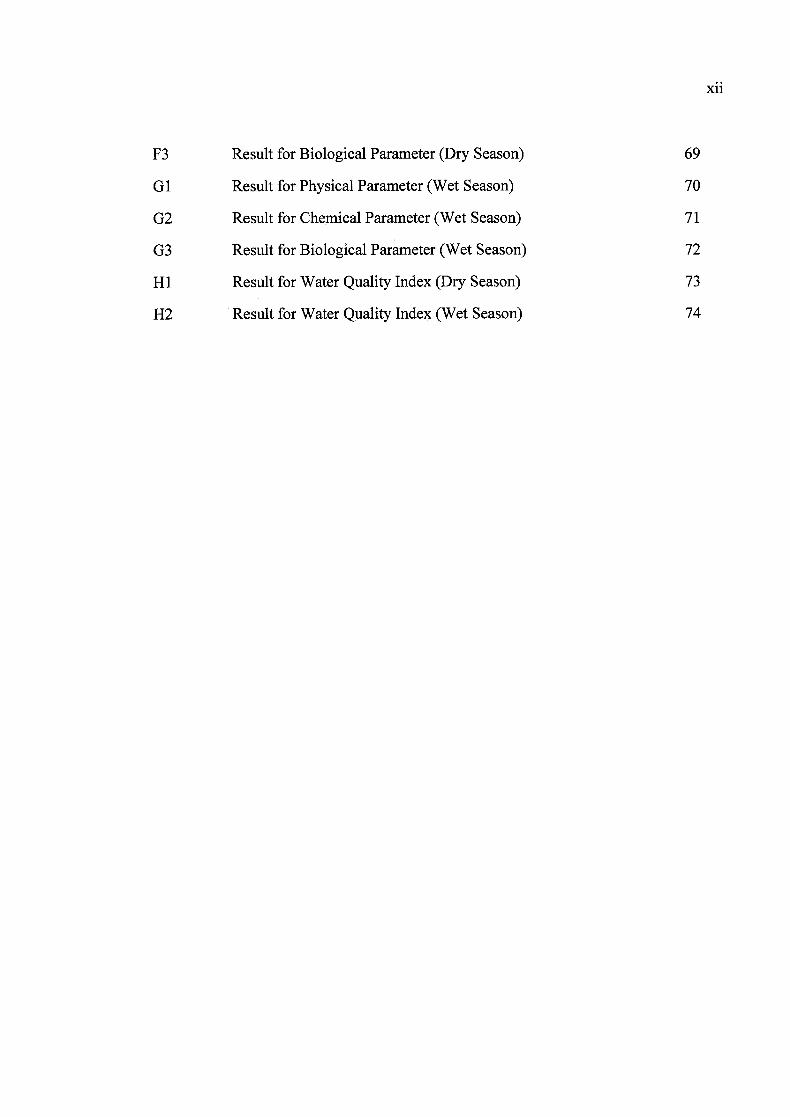
F3 Result for Biological Parameter (Dry Season) 69
Gi Result for Physical Parameter (Wet Season) 70
G2 Result for Chemical Parameter (Wet Season) 71
G3 Result for Biological Parameter (Wet Season) 72
Hi Result for Water Quality Index (Dry Season) 73
H2 Result for Water Quality Index (Wet Season) 74
xli
xlii
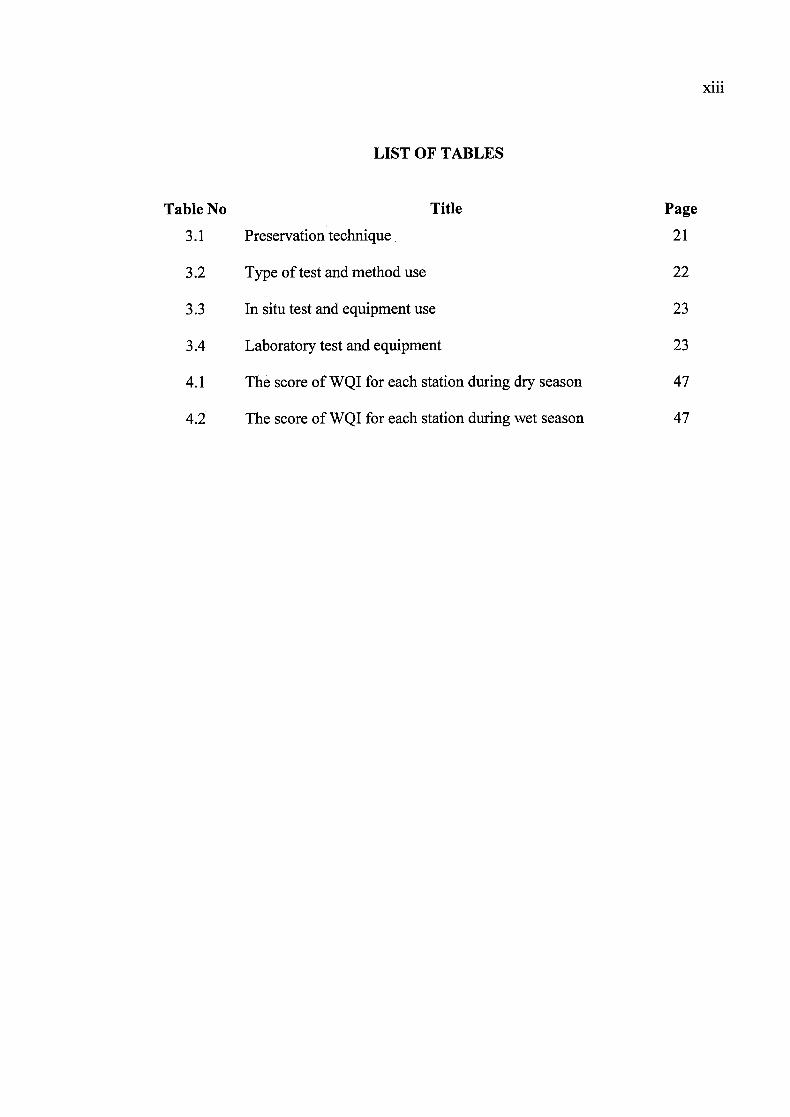
LIST OF TABLES
Table No Title Page
3.1 Preservation technique . 21
3.2 Type of test and method use 22
3.3 In situ test and equipment use 23
3.4 Laboratory test and equipment
23
4.1 The score of WQI for each station during dry season 47
4.2 The score of WQI for each station during wet season 47
LIST OF FIGURES
Figure No Title Page
3.1 Methodology flowchart 17
3.2 Sampling station 20
4.1 Comparison between temperatures (°C) for each station during 31 wet and dry season
4.2 Comparison between turbidity for each sampling station 32 during wet and dry season
4.3 Comparison between total suspended solid (TSS) for each 33 sampling station during wet and dry season
4.4 Comparison between pH for each sampling station during wet 35 and dry season
4.5 Comparison between electrical conductivity (BC) for each 34 sampling station during wet and dry season
4.6 Comparison between chemical oxygen demand (COD) for 37 each sampling station during wet and dry season
4.7 Comparison between biochemical oxygen demand (BOD) for 38 each sampling station during wet and dry season
4.8 Comparison between dissolved oxygen (DO) for each 39 sampling station during wet and dry season
4.9 Comparison between ammoniacal nitrogen concentrations for 40 each sampling station during wet and dry season
4.10 Comparison between nitrate concentrations for each sampling 42 station during dry and wet season
4.11 Comparison between phosphate concentrations for each 43 sampling station during wet and dry season
4.12 Comparison between total coliform for each sampling station 45 during wet and dry season
xiv
xv
4.13 Comparison between Escherichia coli for each sampling 46 station during wet and dry season
4.14 Classification of all stations based on NWQS (dry season) 49
4.15 Classification of all stations based on NWQS (wet season) 50
LIST OF ABBREVIATIONS
AN Ammoniacal Nitrogen
APHA American Public Health Association
BUD Biochemical Oxygen Demand
COD Chemical Oxygen Demand
DO Dissolved Oxygen
DOE Department of Environment
TSS Total Suspended Solids
EC Electrical Conductivity
E.Coli Escherichia Coli
NWQS National Water Quality Standard
NH3-N Ammoniacal Nitrogen
NO3 Nitrate
mg/L Milligram per litre
MPN Most Probable Number
NTU Nephelometric Turbidity Units
Phosphate
ts/cm Microsiemens per centimetre
USEPA Unites States Environmental Protection Agency
WQI Water Quality Index
xvi
CHAPTER 1
INTRODUCTION
1.1 BACKGROUND OF STUDY
Water is very important to human daily life. People used water for cleansing,
washing, bathing and so on. River, lake and other freshwater resources also provide
electrical power generation, for recreational activities, fisheries, and others. However,
the most important is the quality of water which had been used for all those activities.
Water quality may refer to physical, chemical and biological characteristic of water.
According to USEPA, (2002), "A water quality standard is defined as the designated
beneficial uses of a waters segment and the water quality criteria necessary to support
those uses". Based on this statement, may conclude that, the low quality of the water
will give negatives impact to the human life even to the environment as well.
Water quality in lake is about the degradation of natural processes of
eutrophication. Social development will accelerate the eutrophication process,
(Tchobanoglous, G., & Schroeder, E.D., 1985, p.383). Eutrophication is the increases of
nutrients concentrations. According to Nixon's study as cited in National Estuarine
Research Reserve System (NERRS), defined eutrophication is an increase in the rate of
supply organic matter in ecosystem. Human activities increase the rate of nutrient input
through point sources pollution (i.e. untreated sewage) and non point sources
pollution(i.e, fertilizers run-off from agriculture) as well (Smoll, J.P., 2008, p.183).
Agricultural activity, may used and applied pesticides, herbicides, and fertilizers. The
application of fertilizers and pesticide may produce dissolved nutrient in surface run off
1
which is nitrogen and phosphorus. These nutrients may change and reduced the water
quality in lake.
1.2 PROBLEM OF STATEMENT
According to the previous research, by Ari Kurnia (2010), there is palm oil
plantation and rubber plantation under the monitoring and management by Rubber
Industry Smaliholders Development Authority (RISDA). About 600 acres field of palm
oil is cultivated at Kanipung Gumum which is located at south east of Tasik Chini. In
addition, Federal Land Development Activity (FELDA) also sponsored oil plantation at
Kampung Gumum. Other than Kampung Gumum, Transperancy International-Malaysia
(TI-M) (2011) has stated that, there is also oil palm plantation at Jemberau. As the result,
the agricultural activities near Tasik Chini will cause agricultural run-off into Tasik
Chini which will polluted the lake.
Agricultural runoff consists of fertilizers, pesticides and domestic discards which
will affects the quality of water and aquatic life (Seh Datul Ridzuan et al, 2009).
Excessive of nitrogen and phosphorus in the lake will accelerate the eutrophication of
lake (John P. Smol, 2008, p.180). Eutrophication process of lakes is depends on the
water quality of the lake (Tschobannoglous, G., & Schroeder, E. D., 1985, p. 383).
Therefore, it is important that a study is conducted to assess the water quality in Tasik
Chini due to agricultural activity.
1.3 RESEARCH OBJECTIVE
The objectives of study are:
i. To classify water quality in Tasik Chini based on the Water Quality Index (WQI)
and National Water Quality Standard (NWQS),
ii. To determine the effect of agricultural activities toward water quality at Tasik
Chini.
1.4 SCOPE OF STUDY
The scope of study on this research is based on the agricultural activity near
Tasik Chini. Agricultural activity near Tasik Chini caused of agricultural runoff which
may affected water quality in Tasik Chini. This research is conducted on September
2012 until June 2013. Study area is at Tasik Chini. There are two type of tests are
conducted which are in situ test and laboratory test. There are 8 laboratory tests that
conducted which are biological oxygen demand (BOD) test, chemical oxygen demand
(COD) test, total suspended solid (TSS) test, ammoniacal nitrogen test, phosphate test,
nitrate test, total coliform test and E.coli test. For in situ test, 5 tests are conducted which
are, temperature, pH, electrical conductivity, dissolved oxygen and turbidity.
1.5 EXPECTED OUTCOME
i. The data and result will be useful for water quality research project.
ii. Water quality in Tasik Chini was determined.
1.6 CONCLUSION
As a conclusion, water quality in Tasik Chini due to agricultural activity is
determined by Water Quality Index (WQI) and National Water Quality Standard
(NWQS). Agricultural activity near Tasik Chini is one of the factors that contributed
pollution in Tasik Chini.
CHAPTER 2
LITERATURE REVIEW
2.1 INTRODUCTION
Water is very important for living things, which includes human life, flora and
fauna. According to John P.S. (2008), "Water and life are intricately linked. Water
makes up about 70% of our bodies. More than half of the world's species of plants and
animals live in water, and even our terrestrial-derived food is totally depends on and
often large composed by water".
According to Tchobanoglous, G., & Schroeder, E.D. (1985), "A plentiful supply
of water is clearly one of the most important factors in the development of modern
societies. Availability of water for cleansing is directly related to the control or
elimination of disease. The convenience of water available at home improves the quality
of life". This quotation shows the important of water in life. However, water quality
cannot be ignored because water quality is a measurement how safe the water is,
2.2 SURFACE WATER
Surface water is water above land surface. (Chin, D. A., 2006, p.l).Surface water
body is potential to receive pollutant from many sources. Characteristics of surface
water are change with time and space. Mineral pick up from surface runoff, silt and
debris are carried by surface water, will increased the concentration of impurities in
water, these, will caused, muddy or turbid streams. Stagnant water, or slow moving
4
5
areas changing the aesthetic characteristics by plants and algae grow. Most of waste will
discharged towards surface water. Thus, caused major impact on water quality and add
greatly to the spectrum of impurities. (Tschobannoglous, G., & Schroeder, B. D., 1985,
p.45).
2.2.1 Lake
The study of lake is a study of limnology. Large reservoir of water in which
currents are driven primarily by wind is called lakes. The other factor of distribution of
lake is bathymetry, density distribution, and inflow and outflow characteristics. Seepage
lakes are lakes that intersect the ground-water table and interact significantly with
ground-water table fluctuates. Drainage lakes are lakes fed primarily by inflowing
streams. Lakes and reservoirs differ from river and stream in several ways. Lakes
receive discharged organic matter large enough to cause serious oxygen depletion, lakes
have significantly longer retention times than river and lastly, the principal of water
quality gradients are in vertical direction rather than in longitudinal direction, (Chin, D.
A., 2006, p. 192-193). There are two types of lakes, natural lakes and man-made lakes.
2.2.2 Tasik Chini
Tasik Chini is the study area for this research. Tasik Chini is a second largest
natural lake which located at near Pahang River in Central Pahang, Malaysia. (Othman
et al, 2006).This lake may categorize as the wetlands. Tasik Chini wetland acts as
natural sponges to absorb floodwater and help to avoid flood damage. Tasik Chini is
located in the east of Peninsular Malaysia in state of Pahang. The lake contains of 12
'seas' which recognized as 'Laut' by the local community there. The 12 'seas' are,
Gumum, Pulau Balai, Cenahan, Tanjung Jerangking, Genting Teratai, Mempitih,
Kenawar, Serodong, Melai, Batu Busuk, Labuh and Jemberau, Tasik Chini is drained by
Chini River. The water from Pahang River will flow into Tasik Chini during the high
monsoon season.
2.3 POLLUTION OF LAKE
Water pollution means contamination of water or has changed in physical,
chemical or biological properties of water bodies. There are point sources pollution and
non point sources for pollutants in water. In addition pollution of lakes including the
eutrophication process in lake influence by other factors. Lakes can be classified to 4
classes; oligotrophic lake, mesotrophic lake, eutrophic lake, and hypereutrophic lake.
Oligotrophic lake can be described as high clarity, low algal concentrations.
Mesotrophic lakes are intermediate between oligotrophic lake and eutrophic lake.
Mesotrophic lakes are suitable for recreational activity. Eutrophic lakes have abundant
supply of nutrients and have high concentration of algal. Lake at this class, will produce
unpleasant tastes and odors because have large mats of floating algae. Hypereutrophic
lakes can be categorized as extremely eutrophic, with intense algal blooms and high
algal productivity. At this stage, the lake is extensive dense weed beds, also the lake
depth is shallow with accumulated organic sediment, (Chin, D. A., 2006, p.199).
2.3.1 Point Source Pollution
Point sources pollution means any wastewater discharged directly towards water
bodies for example, discharge pipes, where they can be easily measure. (Purohit, S. S.,
& Agrawal, A. K., 2004, p.23). Point sources means any discernible, confined and
discrete conveyance, well discrete fissure, container rolling stock, concentrated animal
feeding operation, or vessel or other floating craft, from which pollutants are or may
discharged, (Purohit, S. S., & Agrawal, A. K., 2004, p. 25).
2.3.2 Non Point Source Pollution
Non-point sources pollution, hard to identify, measure and control than point
sources pollution. Non point sources pollution also known as diffuse source pollution,
which come from human activities for which pollutants have no obvious point of entry
receiving watercourses.(Purohit, S. S., & Agrawal, A. K., 2004, p.23). Other than that,
7
non point source pollutants, irrespective sources, transported through the surface runoff
by rainwater or melting snow. The impact of these pollutants range from simple
nuisance substances to severe ecological impacts involve of fish, birds, mammals, and
on human health.
2.3.3 Agricultural Run-Off
Agricultural run-off is categorized as the non-point source pollution. These
pollutants are transported through soil by rainwater and snow. Agricultural run-off
consists of nitrogen and phosphorus. Run-off of nutrients especially Phosphorus will
lead to eutrophication and change taste and odor of the water. Aquatic life will kill in the
lake because of deoxygenation of water. In addition run-off of pesticides leads to
contamination of lake. Other than that, it will cause ecological system dysfunctional by
the loss of top predators due to growth inhibition and failure of reproduction.
Ploughing /Tillage will cause turbidity and sediments. These sediments contain
of phosphorus and pesticides adsorbed to sediment particles. These factors make
siltation at river beds and the aquatic life loss their habitat. Manure spreading is one of
the fertilizers activities. It will cause contaminated of water by pathogens, metals,
phosphorus and nitrogen which will lead to eutrophication (Purohit, S. S., & Agrawal,
A. K., 2004, p.52).
2.3.4 Pollution at Tasik Chini
According to Suhaimi Othman, Ahmad, Mushfirah, & Lim, E. C.'(2008)., Tasik
Chini is classified as the mesotrophic lake based on the study about water quality at
Tasik Chini by Ainon, Ratuah, Mimi, Affendi, (2006) which was conducted at 1999,
have found that the lake water was contaminated by total coliform and faecal coliform
which contaminated the water, therefore, the lake water is not suitable and not safe for
drinking.
8
Recently, Tasik Chini had covered by an aquatic weed call 'cat tail' or Cabomba
Furcata. In many years, the lake surface is covered by the famous lotus flower which is
Nelumba Nucifera. Tasik Chini condition was worsened by the plantation of the palm oil
near the Tasik Chini, (Habibah, Hamzah, & Mushfirah, 2010). The development of
agricultural near Tasik Chini, caused some pollution to the lake. Agriculture activities,
release nitrate and phosphate in the lake due to the used of fertilizers on the palm oil
plantation. The replacement of primary forest to oil plantation and rubber plantation
caused changes in hydrology, also, phenomenon of eutrophication, sedimentation and
pollution
2.4 WATER QUALITY
There are several parameters on water quality measurement which are physical,
chemical and biological parameters. Based on Chin, D. A., (2006), "The
interrelationships between the physical, chemical, and biological measures are complex,
and alterations in the physical and or chemical condition generally results in changes in
biological condition".
Analytical procedures have been developed that quantitatively measure these
parameters, (Peavy et al., 1985, p.1 1). Water quality parameters for lake, are measured
according to Malaysia Department of Environment Water Quality Index (DOE-WQI)
also, will classified by using National Water Quality Standard, Malaysia (INWQS),
(Othman et al, 2006).
2.4.1 Physical parameter
Physical parameter may define as characteristics of water which respond to the
senses of sight, touch, taste or smell, (Peavy et al., 1985, p.14). According to Chin D.A.,
2006, stated that, physical parameter which may affected the quality of aquatic life that
related to flow conditions, substrate characteristics, stream habitat, riparian habitat and
thermal pollution.
2.4.1.1 Temperature
Temperature is physical water quality parameter. Temperature is one of the most
important parameters in natural surface water system. Most chemical reactions that
occur in natural system is effect by temperature (Peavy et al, 1985, p.22). According to
the previous study by Barzani Gasim et al., 2006, the temperature at Tasik Chini during
wet and dry season was normal according to the climates. Other than that, temperature
did not show a big difference for both seasons.
2.4.1.2 Turbidity
Turbidity is a test for water clarity, (Tschobanoglous G. and Shroeder E.D.,
1985, p.56). Usually water clarity is disturbing by the suspended solid and plankton that
are suspended in water column. Low levels of turbidity may indicate a healthy, well
functioning ecosystem, with balance of food chain in an ecosystem. However, high
levels of turbidity, gives problem towards the ecosystem. The turbidity may block the
light needed by submerged aquatic plant. In addition, turbidity may raise the temperature
of water bodies above normal condition because of the suspended particles have absorbs
the heat from sunlight. As a result, turbidity may affect the dissolved oxygen in water.
According to the study by Bazani Gasim et al., 2007, the mean turbidity at Tasik
Chini was 16.41 NTU.Turbidity in wet season is higher than in dry season. Water is
acceptable for domestic use when the turbidity is within 5-25 NTU. This is according to
National Water Quality Standard (NWQS) for Malaysia. However, Ministry of health
has set the threshold level of turbidity for raw water is 1000 NTU. (Barzani Gasim et al.,
2007).
2.4.1.3 Total suspended solid (TSS)
Total suspended solid or TTS is to test the suitability of water for public,
industrial and agricultural uses, and TSS is physical characteristics of water,
(Tschobanoglous G. and Shroeder E.D., 1985, p.58). Suspended solid is important
indicator of water quality. Increase of total suspended solid directly reduced dissolved
oxygen content in water, hence reducing the ability of a water body to support life.
Study shows that, TSS values were higher during wet and dry season in Tasik
Chini. The maximum threshold levels for Malaysian rivers according to National Water
Quality Standard (NWQS) between 25 to 50 mg F 1 Meanwhile, the threshold level by
National Water Quality Standard (NWQS) for supporting aquatic life in fresh water is
150 mg 1-1 . (Barzani Gassim et al., 2007).
2.4.2 Chemical Parameter
Chemical parameter may refer as the capability of solvent in water. Chemical
parameters include, total dissolved solid, alkalinity, hardness, fluorides, metals,
organics, and nutrients, (Peavy et al., 1985, p.23). As stated in Water-Quality
Engineering Systems, by Chin D.A., 2006, chemical parameter is related to chemical
compounds or combinations of compounds which considered toxicity to human and
aquatic life, or have potential to occur in water environment at harmful levels.
2.4.2.1 pH
The pH of water is defined as the negative log of the hydrogen-ion activity,
(Chin D.A., 2006, p.48).
pH= -log i o [Hi
ph is one of the most important chemical factor for aquatic life. If the surface
water is too acidic or too alkaline will disrupts the aquatic life cycle. pH scale is from 1
to 14. A solution with pH less than 7 has more H+ activity it is considered as acidic.
Meanwhile, pH more than 7 has more OH- and considered as alkaline. According to
study conducted by Barzani Gasim et al, 2007, showed that, pH values were higher
11
during wet season than dry season. For Malaysia Rivers, the threshold level by National
Water Quality Standard (NWQS) is 5.00-9.00.
2.4.2.2 Electrical conductivity (EC)
Electrical conductivity is the ability of the solution to conduct electrical current.
The ion in water is transport the electrical current. Increases of the conductivity, the ions
concentration are increase, (Tschobanoglous G. and Shroeder E.D., 1985, p.91). Other
that EC is an alternative way to measure the presence of inorganic dissolved solid such
as, chloride, nitrate, sulphate, phosphate, sodium, calcium, magnesium and iron. These
substances will increase the conductivity of a *ater body. Inorganic dissolved solid are
important to aquatic life, however, the excessive of these content will harm the aquatic
life also decrease the DO level in water body.
2.4.2.3 Dissolved Oxygen (DO)
Dissolved oxygen (DO) is the amount of molecular oxygen dissolved in water
and one of the most parameter which affects the health of aquatic ecosystem, (Chin
D.A., 2006, p.29). According to the study by Mir Sujaul Islam et al., 2012, the DO
values were low during rainy season which is from September to December 2006. The
main factors that influent the value of DO were photosynthetic activities, seasonal
variables and the decomposition of organic matter,
2.4.2.4 Biochemical Oxygen Demand (BOD)
BOD is the amounts of oxygen require to biochemically oxidize by organic
matter in presence of water (Chin D.A., 2006, p.33). The BOD readings, tells about how
much the oxygen being consumed. BOD levels during dry season were higher
compared to wet season. This is due to the large volume of fresh water which diluted the
organic matter in surface water which caused the BOD values decreased during the dry
season. Most organic matter is biodegradable. The BOD values are usually measures of
12
the oxygen required for carbonaceous oxidation of a non specific mixture of organic
compound rather than of pure compounds, (Tschobannoglous, G., & Schroeder, E. D.,
1985, p.107). Due to the study of Said et al, 2008, the Maong River is heavily polluted
by organic matters where high biological oxygen demand (BOD) levels because of the
land use and activities of the area. The National Water Quality Standards has set the
threshold level for Malaysia surface water is 6 mg/L.
2.4.2.5 Chemical Oxygen Demand (COD)
COD is the amount of oxygen consumed when the substance in water is oxidized
by a strong chemical oxidant (Chin D.A., 2006, p.37).The National Water Quality
Standard (NWQS) has set the threshold level of COD for surface water in Malaysia is
50.00 mg/L. According to previous study by Mir Sujaul Islam et al., 2012, COD level at
Tasik Chini was suitable for the support aquatic life as well as for other purpose. The
value of COD will increase as the pollution load increased.
2.4.2.6 Nitrogen as Ammoniacal Nitrogen
Presence of ammoniacal nitrogen in surface water may give harm towards the
aquatic life and to human life indeed. Because, the ammonia (NH) contains highly
toxic nature and normally ammonia is discharged from industrial waste, municipal and
agricultural waste water in large volume. Based on the previous study, by Mir Sujaul et
al., 2012, the highest concentration of NH3-N was during wet season which was 0.58
mg/L and the lowest value was 0.110 mg/L during dry season. On wet season, the
Pahang River water backflow to Tasik Chini which caused more NH3-N thus
stimulating water quality changes in lakes. The maximum threshold level according to
National Water Quality Standard (NWQS) for Malaysia surface water is 0.90 mg/L in
order to support aquatic life.