Embed Size (px)
Citation preview
1
THE IMPACT OF AFFIRMATIVE ACTION ON THE
EMPLOYMENT OF MINORITIES AND WOMEN
OVER THREE DECADES: 1973-2003
Fidan Ana Kurtulus
University of Massachusetts Amherst
and
Harvard Law School
This version: June 26, 2012
ABSTRACT
What role has affirmative action played in the growth of minority and female
employment in U.S. firms? This paper analyzes this issue by comparing the employment of
minorities and women at firms holding federal contracts and therefore mandated to implement
affirmative action, and non-contracting firms, over the course of three decades spanning 1973-
2003. It constitutes the first study to comprehensively document the long-term impact of
affirmative action in federal contracting on the U.S. employment landscape. The study uses a
new panel dataset of over 100,000 large private-sector firms across all industries and regions
obtained from the U.S. Equal Employment Opportunity Commission, and exploits rich variation
across firms in the timing of federal contracting to identify affirmative action effects. The
paper’s key results indicate that the primary beneficiaries of affirmative action in federal
contracting over 1973-2003 were black and Native American women and men. Analysis of the
dynamics of workforce composition around the time of contracting reveals that a large part of the
effect of affirmative action on increasing protected group shares occurred within the first four
years of gaining a contract, and that these increased shares persisted even after a firm was no
longer a federal contractor. The paper also uncovers important results on how the impact of
affirmative action evolved over 1973-2003, in particular that the fastest growth in the
employment shares of minorities and women at federal contractors relative to non-contracting
firms occurred during the 1970s and early 1980s, decelerating substantially in ensuing years.
Keywords: Affirmative Action in the Labor Market, Gender, Race, Workforce Composition
JEL Classifications: J15, J16, J21, J7, K31, N32, N42, M51
2
1. Introduction
The primary goal of affirmative action legislation is to increase minority and female
representation across American workplaces. However, the dearth of comprehensive data
conducive to analyzing the effects of affirmative action in employment on the U.S. labor force
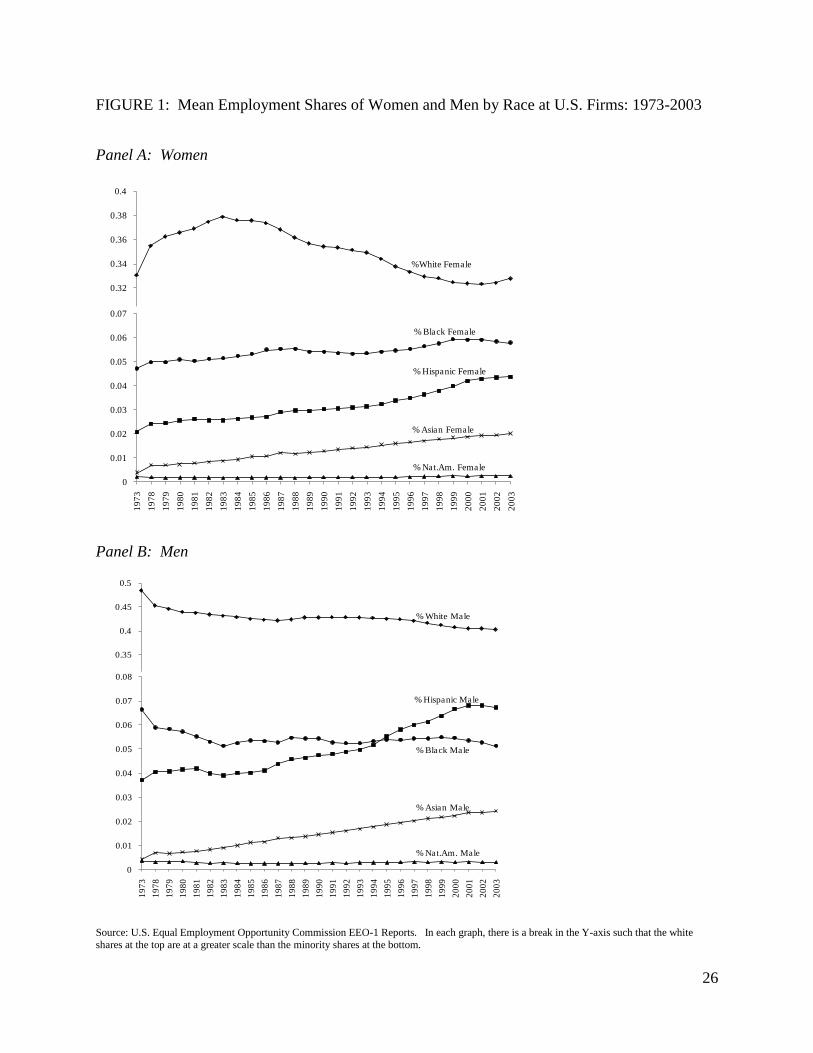
has made it difficult to determine the extent of these effects. Long term trends show that
minority and female shares of employment in large U.S. firms have been rising since the 1960s
(Figure 1). For example, from 1973 to 2003 the employment share increased from 4.7 to 5.8
percent for black women, from 2.1 to 4.4 percent for Hispanic women, and from 3.7 to 6.7
percent for Hispanic men.1 What role has affirmative action played in the employment growth of
minorities and women in U.S. firms over the last decades? Using a new large national dataset
obtained from the U.S. Equal Employment Opportunity Commission (EEOC), this paper
analyzes this question by comparing the employment of minorities and women at firms holding
federal contracts and therefore mandated to implement affirmative action, and non-contracting
firms, over the three decades spanning 1973 to 2003. 2
The paper exploits rich variation across
firms during these decades in the timing of federal contracting to identify affirmative action
effects, and constitutes the first study to comprehensively document the long-term impact of
affirmative action in contracting on the U.S. employment landscape.
A major way in which this analysis advances the previous literature is that it identifies
affirmative action effects from longitudinal variation in the timing of federal contracting across
firms over time, which alleviates selection issues that have plagued this area of research in the
past. The research design controls for numerous sources of heterogeneity in panel regressions
that threaten the identification of affirmative action effects, including time- varying observed
firm heterogeneity, time-invariant unobserved firm heterogeneity, and industry-specific, region-
specific, and economy-wide trends that may additionally affect the employment growth of
minorities and women within firms. Furthermore, dynamic event study analysis around the time
of contract gain allows the examination of possible anticipatory effects and selection into federal
contractor status. Finally, analysis of the dynamics of employment around end of contract
1 These figures are based on EEOC data, and Current Population Survey figures on employment shares by race and
gender also reflect these trends. 2 In a companion paper (Kurtulus, 2011), I examine the role affirmative action has played in the occupational
advancement of minorities and women from low-wage unskilled occupations into high-wage skilled ones.
3
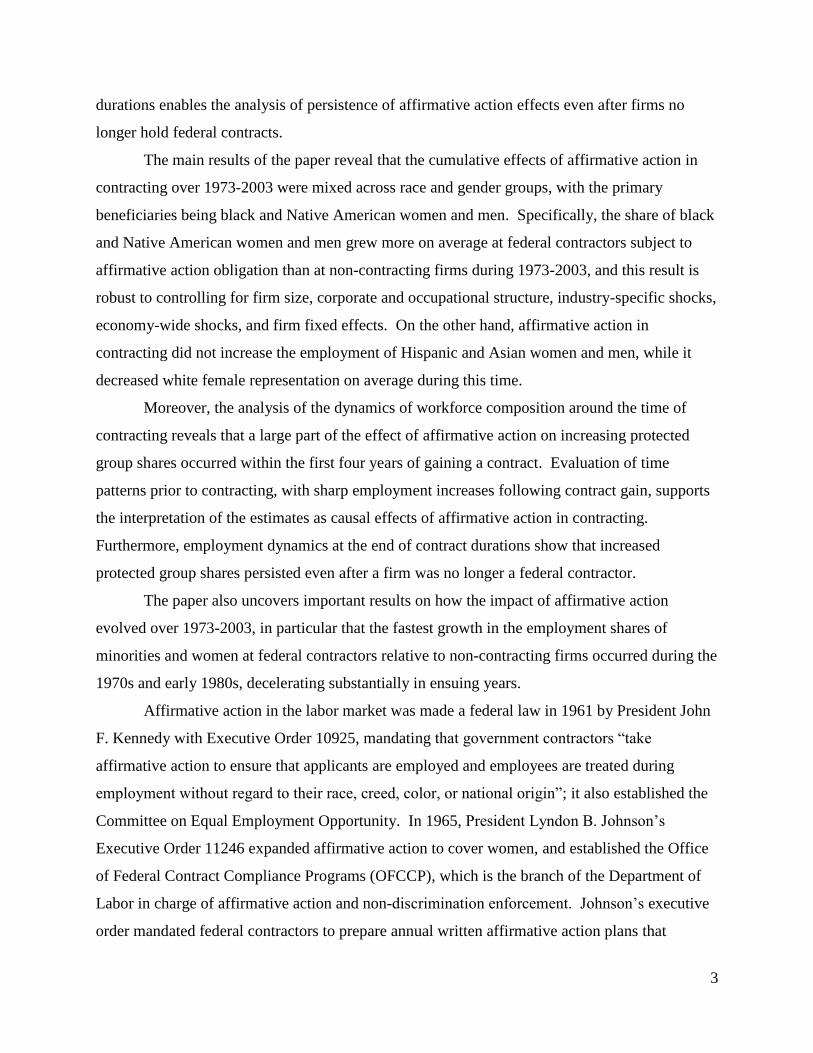
durations enables the analysis of persistence of affirmative action effects even after firms no
longer hold federal contracts.
The main results of the paper reveal that the cumulative effects of affirmative action in
contracting over 1973-2003 were mixed across race and gender groups, with the primary
beneficiaries being black and Native American women and men. Specifically, the share of black
and Native American women and men grew more on average at federal contractors subject to
affirmative action obligation than at non-contracting firms during 1973-2003, and this result is
robust to controlling for firm size, corporate and occupational structure, industry-specific shocks,
economy-wide shocks, and firm fixed effects. On the other hand, affirmative action in
contracting did not increase the employment of Hispanic and Asian women and men, while it
decreased white female representation on average during this time.
Moreover, the analysis of the dynamics of workforce composition around the time of
contracting reveals that a large part of the effect of affirmative action on increasing protected
group shares occurred within the first four years of gaining a contract. Evaluation of time
patterns prior to contracting, with sharp employment increases following contract gain, supports
the interpretation of the estimates as causal effects of affirmative action in contracting.
Furthermore, employment dynamics at the end of contract durations show that increased
protected group shares persisted even after a firm was no longer a federal contractor.
The paper also uncovers important results on how the impact of affirmative action
evolved over 1973-2003, in particular that the fastest growth in the employment shares of
minorities and women at federal contractors relative to non-contracting firms occurred during the
1970s and early 1980s, decelerating substantially in ensuing years.
Affirmative action in the labor market was made a federal law in 1961 by President John
F. Kennedy with Executive Order 10925, mandating that government contractors “take
affirmative action to ensure that applicants are employed and employees are treated during
employment without regard to their race, creed, color, or national origin”; it also established the
Committee on Equal Employment Opportunity. In 1965, President Lyndon B. Johnson’s
Executive Order 11246 expanded affirmative action to cover women, and established the Office
of Federal Contract Compliance Programs (OFCCP), which is the branch of the Department of
Labor in charge of affirmative action and non-discrimination enforcement. Johnson’s executive
order mandated federal contractors to prepare annual written affirmative action plans that

4
identify the under-utilization of women and minorities relative to their representation in the labor
market from which they are recruited and develop goals and timetables for their hiring.
Furthermore, it stipulated that contractors are subject to compliance reviews by the OFCCP, and
specified penalties for non-compliance ranging from revocation of current government contracts
to suspension of the right to bid on future contracts.3
During the initial years of the civil rights movement, minorities and women did benefit
from affirmative action. In early seminal research using data from the EEOC, Ashenfelter and
Heckman (1976), Goldstein and Smith (1976), and Smith and Welch (1984) found a positive
affirmative action effect of federal contractor status on increasing the employment of black
males from 1966 to 1970, from 1970 to 1972, and from 1970 to 1980, respectively, Heckman
and Wolpin (1976) found a similar result in their analysis of firms in the Chicago metropolitan
area for the period 1970-1973, and Leonard (1984a, 1984b, 1986) found that affirmative action
led to faster growth in the employment of minorities and women from 1974 to 1980.4,5
The
current paper updates and considerably expands our knowledge about the employment effects of
affirmative action since these early studies, something which has not been possible until now due
to the unavailability of appropriate data. This is also the first study to provide a breakdown of
affirmative action effects for Hispanics, Asians and Native Americans individually.
There was a dramatic reversal in federal support for affirmative action in the 1980s. In
1981, the OFCCP came under new leadership that was neither committed to the organization nor
to affirmative action. In 1982, a fervent opponent of affirmative action, Clarence Thomas, was
appointed to head the EEOC.6 During the presidency of Ronald Reagan a serious effort was
made to rescind Executive Order 11246 and when that failed, steps were taken to weaken
affirmative action enforcement. During the Reagan years, the OFCCP rarely issued sanctions for
non-compliance and the number of employment discrimination lawsuits plummeted (Donahue
3 The OFCCP Federal Contract Compliance Manual, which provides guidelines for affirmative action and equal
employment opportunity implementation, states that the geographic area used to determine labor availability of
protected groups may vary from local to nationwide as the skill level required for the job increases (U.S. Department
of Labor, 1998, Chapter 2, Section G). 4 Brown (1982) provides a critical review of some of these early studies.
5 A related study specific to police officers, McCrary (2007), examined the effect of court-ordered racial hiring
quotas imposed on 314 municipal police departments following discrimination lawsuits during 1960-1999, finding a
positive effect on black new hires. 6 Clarence Thomas later became the second African American appointed to the U.S. Supreme Court, an appointment
that was made by President Bush in 1991, succeeding Thurgood Marshall who had been the first African American
Supreme Court Justice and had been appointed by President Johnson in 1965.

5
and Siegelman, 1991, Leonard 1990, Leonard, 1996, Anderson, 1996)7. Enforcement activity
increased a bit in 1989 when President George H.W. Bush took office, and accelerated with the
inauguration of President Bill Clinton in 1993.8
In recent years, there have been efforts to rescind affirmative action at the state level,
with California prohibiting affirmative action in public employment in 1996, Washington in
1998, Michigan in 2006, Nebraska in 2008, Arizona in 2010, and legislation is pending in
several other states, and the future of affirmative action in the United States is uncertain.
Rhetoric abounds on both sides of the affirmative action debate with little hard evidence brought
to bear to inform policy discussions. As Blau and Winkler (2005) put it, “After four decades, we
are still debating how much impact affirmative action can and should have on opportunities and
outcomes at work…. in all the controversy and rancor, there is one question that is less often
asked and even less frequently answered: Does affirmative action in employment actually
work?”
This study is the first to present comprehensive evidence on the implications of
affirmative action on the employment growth of minorities and women based on a large national
panel dataset uniquely suited for the analysis of this topic containing detailed information on
both federal contractors bound by affirmative action obligation and non-contracting firms across
all industries and regions of the U.S. A further contribution of this study is that it is the first to
present evidence on how the effect of affirmative action has evolved over three decades spanning
political administrations with drastically different views about affirmative action, allowing us to
assess the long-term impact of affirmative action on the employment of minorities and women.
The EEOC firm reports have only recently become available to scientific researchers for the first
time since the early 1980s, and with over 100,000 firms over thirty-one years these data
constitute the largest and longest available panel of U.S. firms with information on gender and
race composition. The paper’s research design exploits variation in the timing of contracting to
identify the causal impact of affirmative action in federal contracting on increasing minority and
female representation at U.S. firms, and is able to control for numerous sources of heterogeneity
7 From 1979 to 1985, EEOC staff was reduced by 20 percent, while real expenditures were held virtually constant;
and the OFCCP reduced its employment by 10 percent and its budget by 20 percent. A stark example of the
consequences of the reductions in OFCCP staffing, budget, and enforcement power during this time was the case of
the Los Alamos National Laboratories in New Mexico where an OFCCP review that should have taken sixty days
ended up taking five years to complete (U.S. House of Representatives Committee on Education and Labor, 1987). 8 See Holzer and Neumark (2000) for a detailed review of affirmative action legislation and enforcement since the
1960s.
6
in panel regressions that threaten the identification of the effect of affirmative action, including
time-varying observed firm heterogeneity, time-invariant unobserved firm heterogeneity, and
industry-specific, region-specific, and economy-wide trends that may additionally affect the
employment growth of minorities and women.
2. Data
The source of the firm-level data is the confidential annual EEO-1 Employer Information
Reports for 1973 and each year in 1978 through 2003 that have been collected by the U.S. Equal
Employment Opportunity Commission as mandated by Title VII of the U.S. Civil Rights Act of
1964. These reports summarize the occupation, race and gender composition of employees at all
U.S. private-sector firms with at least 100 employees and private-sector federal contractors with
at least 50 employees.9,10
This dataset is exceptional for several reasons. First, it contains
records on over 100,000 firms over 1973-2003. Second, it is longitudinal, allowing me to follow
firms over time and thereby enabling me to use panel regression methods to control for
unobserved attributes of firms that may be correlated with female and minority representation
and derive sharper econometric estimates of the effect of affirmative action. EEO-1 reports have
only recently become available to scientific researchers and I have gained access to these data
through use of an Inter-Government Personnel Act Agreement with the Equal Employment
Opportunity Commission.
EEO-1 reports contain employment counts at each firm by gender of five race or ethnic
groups: White, Black, Hispanic, Asian or Pacific Islander, Native American or Alaskan Native,
across nine occupational categories: Managers and Officers, Professionals, Technicians, Sales
Workers, Office and Clerical Workers, Craft Workers, Operatives, Laborers, and Service
Workers. In their reports, firms are instructed not to include temporary or casual employees
hired for a specified period of time or for the duration of a specified job but to include leased
employees as well as both part-time and full-time employees. Robinson et. al. (2005) compare
employment covered in the EEO-1 data to employment estimates from the U.S. Bureau of Labor
9 The 1974-1977 EEO-1 records were unavailable from the U.S. Equal Employment Opportunity Commission.
10 EEO-1 reporting requirements prior to 1983 were for firms with at least 50 employees and federal contractors
with at least 25 employees to submit records. As a robustness check, I estimated the baseline regressions restricting
the pre-1983 sample to firms with at least 100 employees and federal contractors with at least 50 employees to
match the post-1983 EEO-1 reporting requirements and the results matched those reported in the paper very closely.
I also estimated the baseline regressions limiting the sample to firms with at least 100 employees and the results
were also very similar to the reported results.
7
Statistics and report EEO-1 coverage to typically be between 40 and 50 percent of all U.S.
private-sector employment, with higher proportions in industries comprised of larger firms such
as manufacturing and transportation. In addition, EEO-1 reports contain information on the
firm’s industry, geographic location, whether or not the firm is a federal contractor, and whether
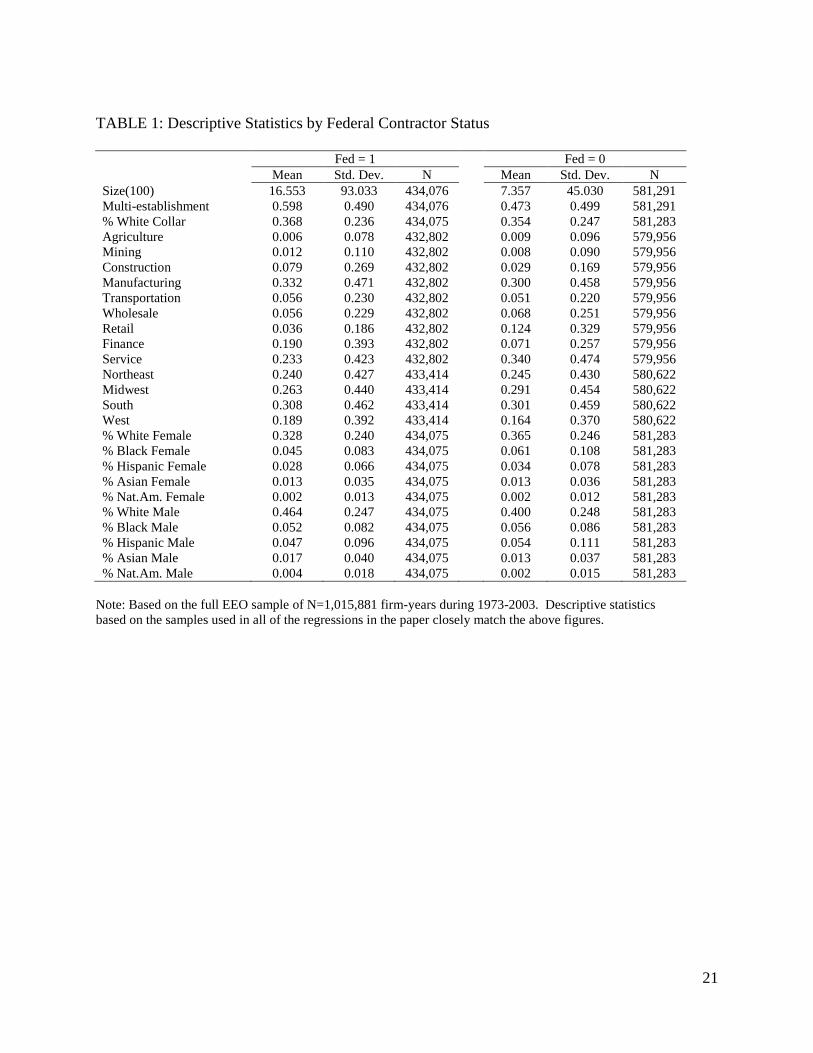
or not the firm is a multi-establishment organization. Table 1 displays summary statistics for the
variables I use in my empirical analysis.
3. Empirical Strategy
In my empirical analysis, the key explanatory variable is federal contractor status. About
43 percent of firms in the analysis sample are contractors (Table 1). Federal contractors are
required by law to implement affirmative action and are subject to compliance reviews by the
Office of Federal Contract Compliance, with penalties for noncompliance ranging from
revocation of current government contracts to suspension of the right to bid on future contracts.
My empirical approach is thus to investigate the relationship between firm federal contractor
status and changes in female and minority shares of employment to study the impact of
affirmative action. 11
Using contracting status to understand the effects of affirmative action was
also the approach taken in the earlier studies that used EEO-1 records (Ashenfelter and Heckman
1976, Heckman and Wolpin 1976, Goldstein and Smith 1976, Smith and Welch 1984, Leonard
1984a, 1984b, 1986).12
11
Another element that would have enriched the analysis but which I do not have data on is which contracting firms
underwent formal OFCCP compliance reviews. However, it has been argued that the threat of enforcement can
actually have a larger effect than enforcement action (Heckman and Wolpin 1976, Leonard 1985, Leonard 1996). In
addition, survey evidence shows that fear of litigation or debarment from government contracting is a strong
deterrent against violation of affirmative action laws even in the absence of OFCCP reviews (Badgett, 1995).
Therefore, I believe that the examination of the link between federal contractor status and firm workforce
composition will largely account for the impact of affirmative action on advancing the employment of minorities
and women. 12
The unit of analysis in these earlier studies was an establishment, while in mine the unit of analysis is a firm.
However, since the entity being awarded a government contract is the firm and not individual establishments within
the firm, there is no variation at the establishment level within a given firm in my main explanatory variable, and so
the firm is the more appropriate unit of analysis for the purposes of the current study. Another way in which my
methodology differs from these early studies is that I control for firm fixed effects, industry-specific, region-specific
and economy-wide shocks. I take a longitudinal approach in my regressions, observing firms in each year, while the
early studies used cross-sectional methods to examine employment changes either between two periods in time,
1974 and 1980 in the case of Leonard (1984a, 1986), 1966 and 1970 in the case of Ashenfelter and Heckman (1976),
1970 and 1972 in the case of Goldstein and Smith (1976), or each year during 1970-1973 in the case of Heckman
and Wolpin (1976) and every four years during 1966-1980 in the case of Smith and Welch (1984).

8
I estimate fixed effects regressions of the relationship between firm federal contractor
status and the shares of women and men of different races. Identification of the federal
contractor effects comes from variation in a given firm’s race and gender composition as the
firm’s contractor status changes.13
During the sample period of 1973-2003, a firm was observed
for 8.1 years on average. Approximately 8 percent of non-contractors switched to being
contractors the following year, and around 10 percent of contractors became non-contractors the
following year. Federal contractors held their contractor status for 5.9 years on average.
The estimating equation is:
The dependent variable %(g)i,t is the percentage of workers at firm i belonging to demographic
group g in year t, where the demographic groups to be examined are g={White Female, Black
Female, Hispanic Female, Asian American or Pacific Islander Female, Native American or
Alaskan Native Female, White Male, Black Male, Hispanic Male, Asian American or Pacific
Islander Male, Native American or Alaskan Native Male}. The key independent variable, Fedi,t,
is a dummy variable equaling 1 if firm i is a federal contractor in year t. My main interest is in
estimating α, or the coefficient on Fedi,t, which measures the total change in the share of
demographic group g associated with becoming a federal contractor on average during 1973-
2003. Xi,t is a vector that includes a constant term and several time-varying firm controls,
including firm size in year t, whether the firm is a multi-establishment organization in year t, and
the percentage of workers at the firm in year t who are in white collar non-clerical occupations;
i is a firm fixed effect; t is a year fixed effect; Industryi represents interactions between
industry dummies and year dummies; and Regioni represents interactions between Census
region dummies and year dummies.
My goal is to estimate the effect of federal contractor status on the race and gender
composition at the firm net of economy-wide and firm-specific factors that may also be
influencing the evolution of firm diversity. I include firm fixed effects in Equation 1 to control
for time-invariant unobserved firm attributes which may influence changes in the firm’s share of
minorities and women. I also include year fixed effects to control for any economy-wide shocks
13
I also include firms that are never contractors in the analysis sample as these firms help identify the other
coefficients in the regression model. The regression results are robust, however, to excluding never contractors, as
explained later in the empirical results section.
9
and general trends affecting the share of minorities and women symmetrically across all firms.
Additionally, there may be factors influencing the share of women and minorities that vary
within the firm, the firm’s industry, and the firm’s geographic region over time which could bias
my estimates of the relationship between contractor status and female and minority
representation if such factors do not change at a national level and get picked up by the year
fixed effects. Therefore, I would additionally like to control for such firm-specific, industry-
specific, and region-specific factors that may also be increasing the firm’s share of women and
minorities over time. One way to do this would be to include firm-specific time trends in
Equation 1, but this is not feasible given the large number of firms in my sample. Instead, I
include interactions of industry dummies with year dummies (Industryi ) to account for
industry-specific shocks to female and minority representation. For instance, many firms in a
particular industry may react to a high-profile gender discrimination lawsuit brought against a
similar firm by increasing the share of women over a period of time; incorporating industry-year
dummies allows me to control for such phenomena, resulting in more accurate estimates of the
influence of federal contractor status net of any industry trends toward higher levels of gender
and race diversity. Similarly I also incorporate interactions of region dummies with year
dummies (Regioni ) to account for region-specific changes in available female and minority
labor pools that firms face and thus influence the extent to which firms can implement
affirmative action hiring.
Even after controlling for firm fixed effects, year fixed effects, region-specific time
effects, and industry-specific time effects, there may still remain differences across firms in
factors such as management practices that vary over time and that influence the evolution of
minority and female representation at the firm, biasing the estimates of the effect of affirmative
action on minority and female representation. To reduce this potential source of bias, Equation 1
also includes controls for a set of observable time-varying firm characteristics that are likely to
be correlated with unobservable factors like management practices and that may influence the
effect of contractor status on the share of protected groups at the firm. For example, large firms
are more likely to have formalized personnel policies and recruitment programs that may reduce
barriers to the hiring of women and minorities, so one might expect larger firms to have better
10
affirmative action track-records.14
As well, one might expect contractor status to be positively
correlated with firm size. In this case a positive revealed relationship between contractor status
and growth in female and minority employment shares might be spurious, picking up the
correlation between protected group share and firm size. Equation 1 therefore includes controls
for firm size and whether the firm is a multi-establishment organization. It also controls for the
proportion of white-collar non-clerical employees at the firm since firms with occupational
structures that draw more heavily from the white-collar non-clerical workforce may exhibit
smaller growth in female and minority representation because women and minorities are under-
represented in the high-skill labor markets from which these firms hire.15
4. Empirical Findings
4.a. Main Results
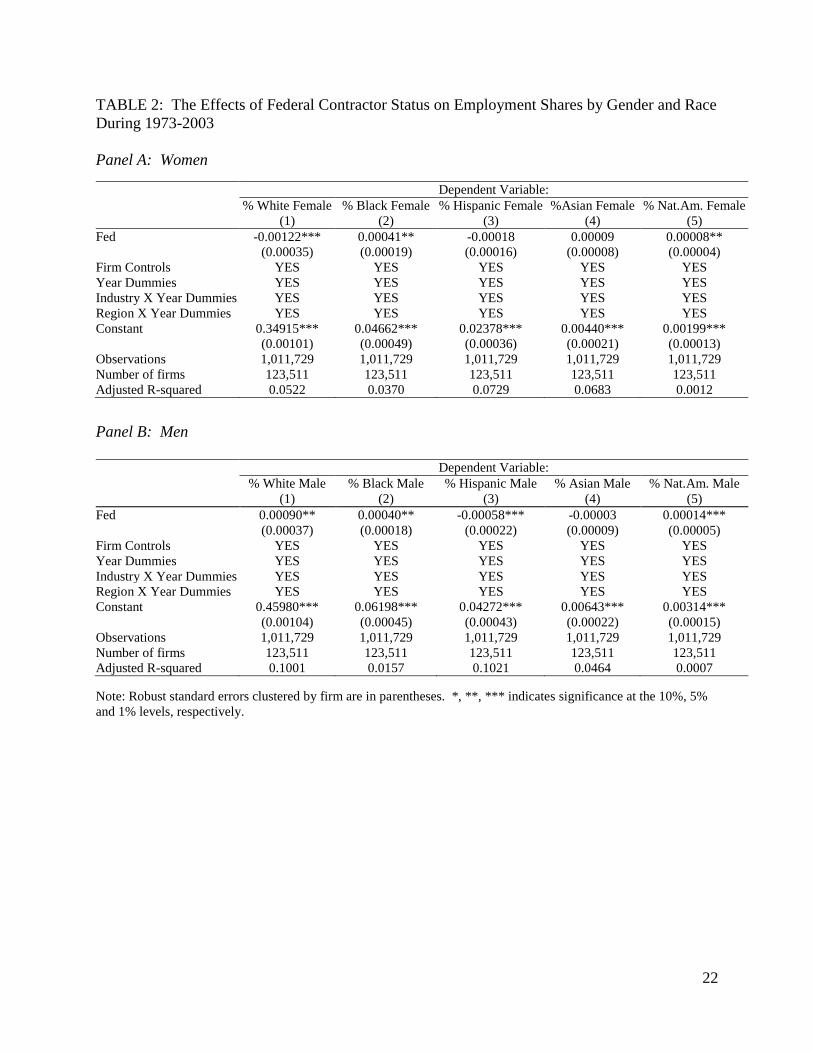
Table 2 presents the total cumulative effect of affirmative action on the employment of
women and men of different races during 1973-2003. Focusing on the coefficient estimates that
are statistically significant, we see that the primary beneficiaries of affirmative action over these
three decades were black and Native American women and men. In particular, becoming a
federal contractor was associated with a 0.041 percentage point increase on average in the share
of black women at firms and a 0.008 percentage point increase in the share of Native American
women. As shown in Figure 1, the mean employment shares in 1973 of black women and
Native American women were 4.706 percent and 0.206 percent, respectively, so the implied
contribution of affirmative action in federal contracting to these groups was to increase their
employment shares by 0.871 percent for black women and 3.883 percent for Native American
women. Affirmative action also increased black men’s employment share by 0.04 percentage
points and Native American men’s share by 0.014 percentage points, on average. Given that in
1973 black and Native American men comprised 6.636 percent and 0.353 percent of
employment, affirmative action amounted to a 0.603 percent and 3.966 percent increase in the
shares of black and Native American men, on average.
Table 2 further reveals that affirmative action increased the employment of black and
Native American women and men at the expense of white women -- becoming a federal
14
A number of past studies have found a positive relationship between employer size and the rate of black and
female employment since the 1970s, including Holzer (1998) and Carrington, McCue and Pierce (2000). 15
See the Appendix for detailed variable definitions.
11
contractor resulted in a 0.122 percentage point decrease in the employment share of white
women on average during 1973-2003. Although this result is contrary to apriori expectation, in
that affirmative action legislation is intended to increase female representation including that of
white females, it is in fact consistent with the limited amount of previous evidence that exists
from the 1970s: while reporting large gains for black women and men, Leonard (1984) had
found much smaller gains for white women; Goldstein and Smith (1976) had found that
affirmative action increased black male employment and reduced white female employment. A
possible reason for why affirmative action has not benefited white women is that firms may
demonstrate a greater propensity for affirmative action implementation along both race and
gender lines (e.g. hiring a black female) rather than along only gender (hiring a white female),
especially in the presence of constraints on the number of employees they are able to hire.
Another finding in Table 2 that is contrary to apriori expectation is that becoming a federal
contractor was associated with a 0.09 percentage point increase in the share of white men on
average during 1973-2003.16
However, in a companion paper (Kurtulus, 2011), I show that
contractor status was associated with growth in white men’s representation only in managerial
occupations during 1973-2003, which is what drives this trend.17
Finally, affirmative action did
not increase the employment of Hispanic and Asian women and men by a statistically discernible
amount over 1973-2003.18
4.b. Inferring Causality From The Timing of Federal Contracting
The estimates discussed in the previous section pertain to the average effects of
affirmative action over the three decades under study, but do not provide a sense of the dynamics
of a firm’s employment response to becoming a federal contractor, to which I now turn. One
may argue that the positive relationship between federal contractor status and protected group
representation found earlier reflects selection rather than contractor response to affirmative
16
The early study by Goldstein and Smith (1976) had also found that the relative share of white men increased at
contractors. 17
Gaining a federal contract brings with it greater need for managerial oversight and an expansion of the firm’s
managerial workforce, which firms are more likely to fill with white male managers given their greater labor market
availability compared to minority and female mangers. 18
As a robustness check, I also estimated Equation 1 limiting the estimation sample to firms that were ever
contractors (i.e., excluding firms that never held a federal contract during the 31 years under study); the estimates
and statistical significance on the Fed coefficients were nearly identical to those reported in Table 2, indicating that
selection into contractor status is not a source of bias in the results reported in Table 2. These additional results are
available from the author.
12
action obligation, i.e., that it may be that firms which had high minority and female
representation in the first place were more likely to be awarded government contracts than those
which were not as diverse. In response to this concern, first it is important to note that
government contract bidding and selection procedures do not solicit information on workforce
race and gender composition of prospective contractors, using highest technical merit and lowest
bid price among candidates as the primary selection criteria (U.S. General Services
Administration, 2005). Furthermore, changes in employment around the actual time of gaining
contractor status provide important evidence on the direction of causality between contractor
status and employment by evaluating trends prior to the contract gain: Is it firms that are
increasing their minority and female representation that are awarded a federal contract? i.e., is
there reverse causality in the relation between federal contractor status and employment gains for
protected groups? Dynamics around the time of gaining a federal contract also provide evidence
on how long affirmative action takes to change the employment landscape of a firm: How
quickly does minority and female employment change after a firm becomes a federal contractor
and does this impact accelerate or stabilize? Identification of the dynamic response to becoming
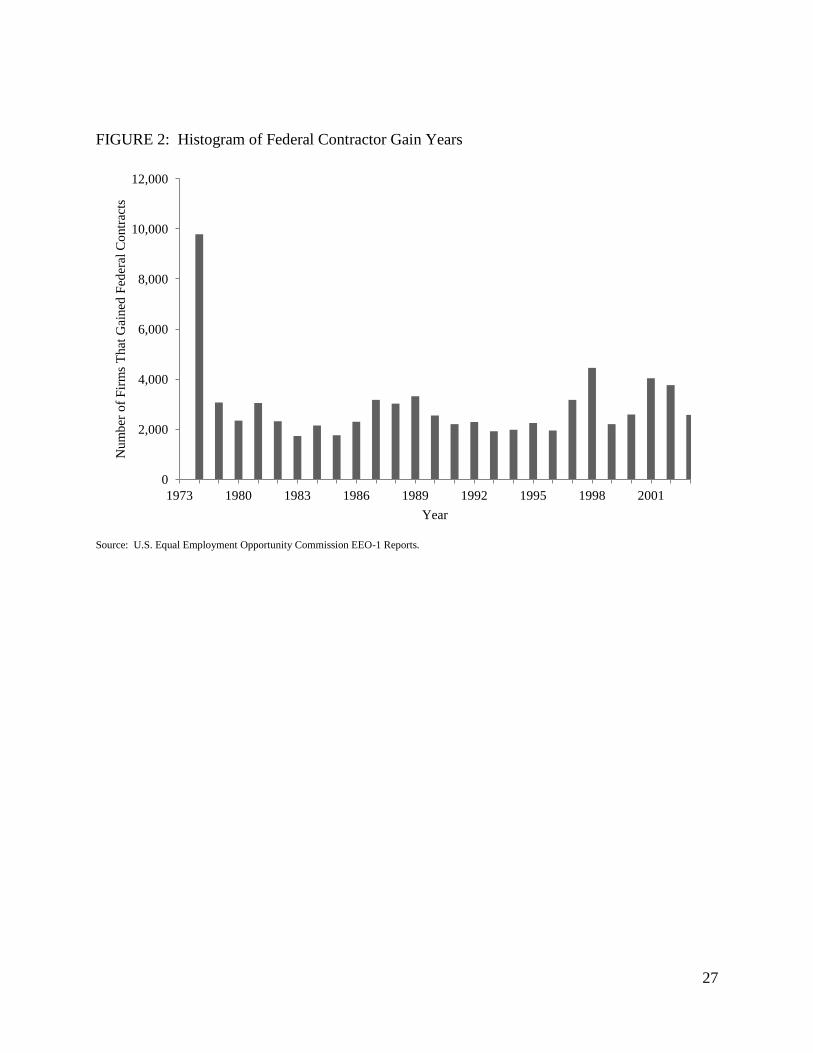
a federal contractor is feasible since different firms become contractors at different times. Figure
2, which illustrates the histogram of contract gain years among firms that became contractors
during my analysis period, demonstrates that there is rich heterogeneity in the timing of contract
gain across firms.
To explore these factors, I use a dynamic specification that replaces the federal contractor
status indicator in Equation 1 with leads and lags of contract gain. Specifically, the following
model is estimated for each gender-race group in turn:
(2)
where Fedi,t+2 and Fedi,t+1 are dummy variables equaling one in only the two years or year prior
to contract gain, and the coefficients on these indicate whether the pre-post federal contract
results presented in the previous section (Equation 1) are consistent with a causal interpretation.
In particular, a causal interpretation would be supported by coefficient estimates that are
statistically significantly negative or not statistically significant. Fedi,t0 is a dummy variable
equaling one only in the year of contract gain, and Fedi,t-1 – Fedi,t-3 indicate one, two and three
years after contract gain; these four dynamic variables capture the transitory effects of contract
gain. Fedi,t-4 forward is a variable equaling one in every year beginning with the fourth year after

13
contract gain for the duration of contracting, and captures the long-term effects of contract gain.
The specification thus allows us to identify whether there are anticipatory effects, and whether
the largest impacts of affirmative action occur in the short run or long run. The remaining
variables in the model are identical to those in Equation 1.19
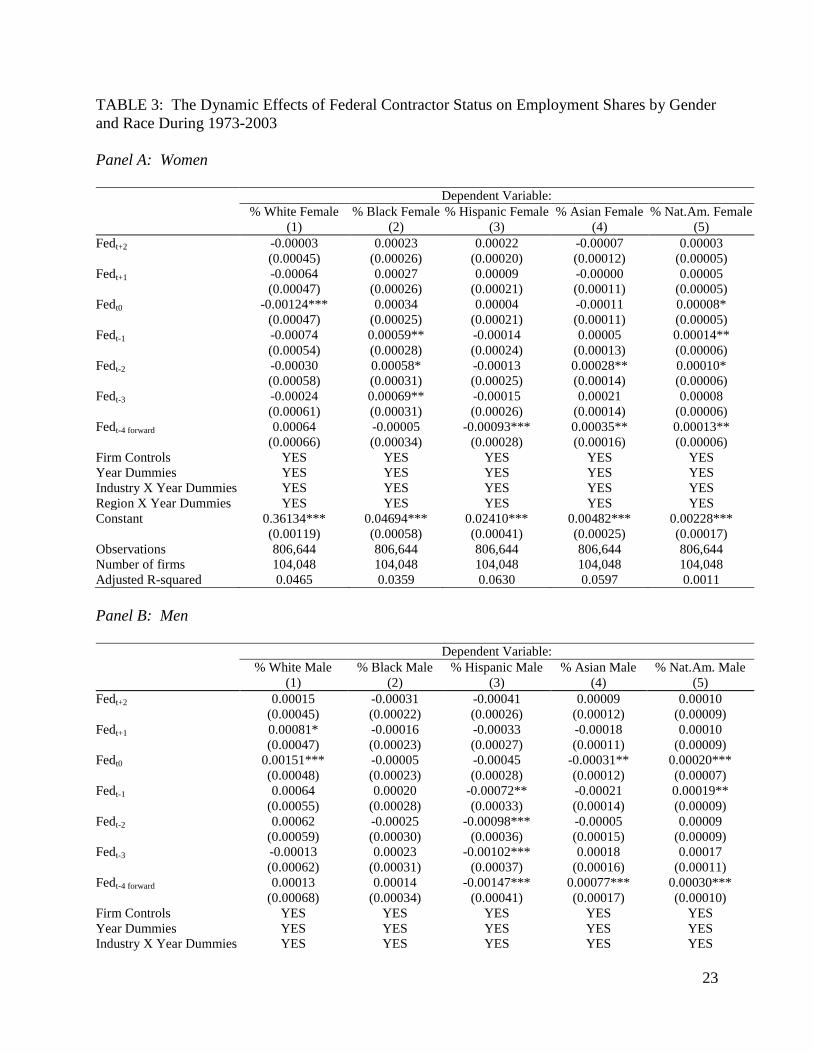
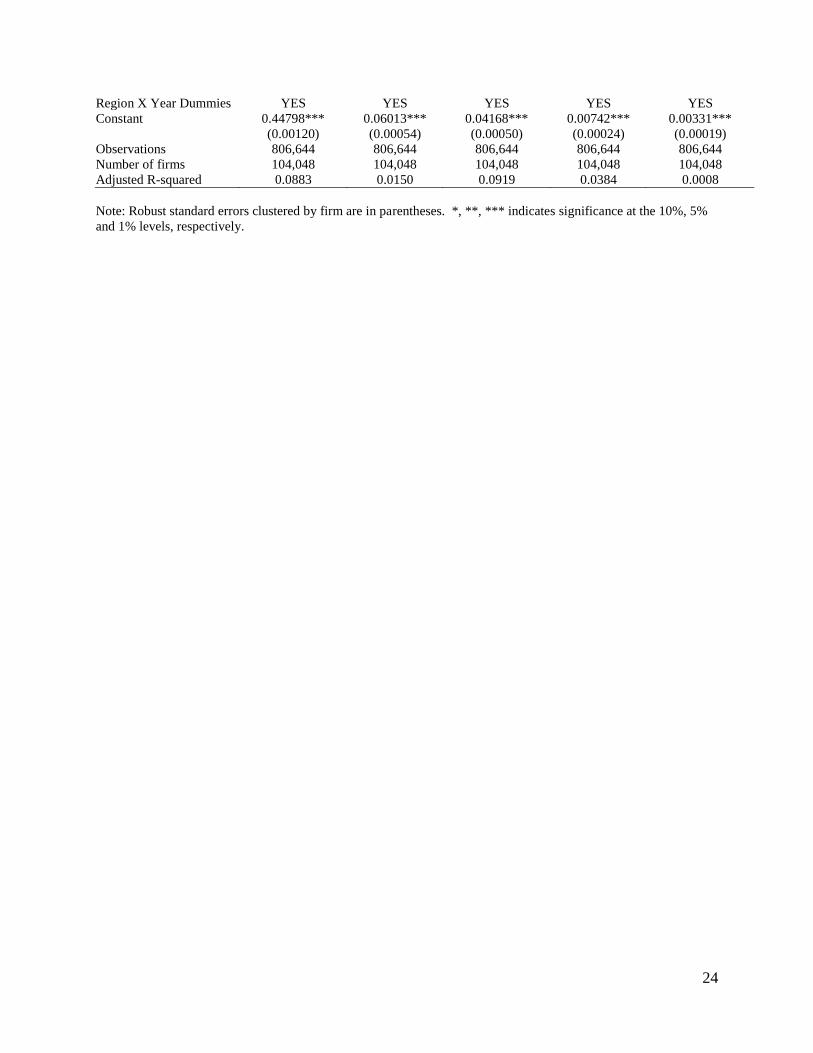
Table 3 provides estimates from this dynamic model. Nearly all the coefficients on
contractor leads (Fedi,t+2 and Fedi,t+1 ) are not statistically significant at conventional levels,
indicating little evidence of reverse causality in the relation between federal contract status and
employment gains for protected groups. Put differently, affirmative action appears to work not
by selection of firms with good records of protected group employment into contractor status,
but rather by inducing contractors to employ more minorities and women. In the first years of
becoming a federal contractor there are increases in the employment of black women, Native
American women and Native American men (i.e., three of the four demographic groups that
were found to have experienced a positive average benefit from affirmative action in Section
4.a), which is indicated by the positive and statistically significant coefficients on the contractor
gain lags. For example, after one year of getting a contract, firms increase their share of black
women by 0.059 percentage points, and this increment holds ground after two years and grows
slightly after three years of becoming a contractor. The first years of contracting also increase
Native American female and male employment shares. The affirmative action effect for black
women dissipates after the fourth year after becoming a contractor, as indicated by the fact that
the coefficient on the four year forward lag is not statistically significant at conventional levels.
On the other hand, the impact of affirmative action is more of a long-term phenomenon for
Native American women and men, as well as Asian women and men, as indicated by the positive
and statistically significant coefficients on the four year forward lags for these groups.20
4.c. Persistence of Affirmative Action After Loss of Federal Contractor Status
19
I have also explored regression models with windows of different lengths around the time of contracting; these
yielded very similar results to those reported here. 20
The sample of firms driving the identification of the coefficients on the indicators of the years following contract
gain gets smaller the greater the time elapsed since contract gain. For this reason, I also estimated Equation 2 using
a “long sample” of firms who held their contracts for five continuous years or more. The resulting estimates, which
are not reported here but are available from the author, were qualitatively very similar to those reported in Table 3,
and some of the coefficients were larger in magnitude but also had had larger standard errors due to the restricted
sample size.

14
Do gains in protected group employment revert once a firm loses its contract, or is there
persistence in minority and female representation even after the firm is no longer a federal
contractor? Affirmative action in federal contracting can have a persistent impact if, for
example, greater exposure to minorities and women eliminates negative stereotypes and reduces
taste-based discrimination by firms (Charles and Guryan 2008, Coate and Loury 1993). There
can also be long-lasting network and role model effects (Kurtulus and Tomaskovic-Devey 2009,
Athey, Zemsky and Avery 2000, Cornell and Welch 1996). To explore the presence of such
persistence, I augment Equation 1 with indicators for one and two periods following the loss of
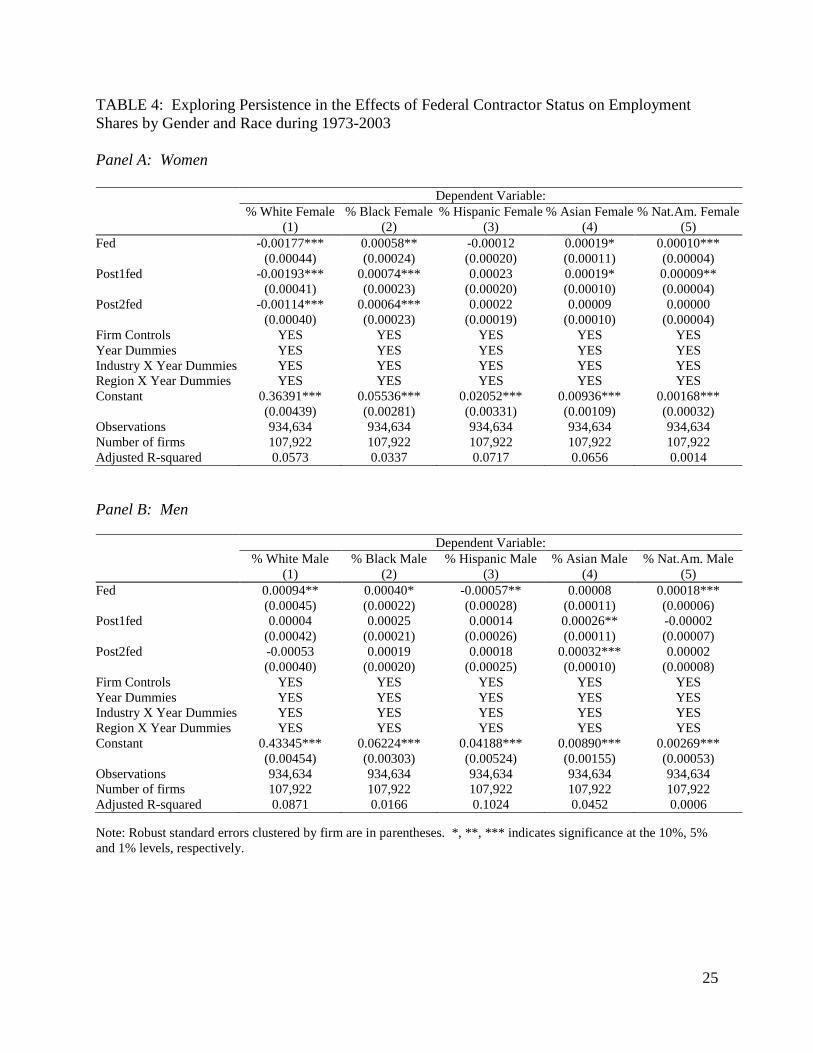
contractor status (Post1fed and Post2fed). In the case of all of the protected groups that were
found to have experienced a positive average benefit from affirmative action in the baseline
results of Section 4.a, we can now see in Table 4 that the estimated coefficients on the post-
contract variables are either not statistically significant indicating that firms do not reduce their
protected group shares once they are no longer contractors (black men and Native American
men), or the estimates are actually statistically significantly positive indicating the firms continue
to diversify even after their federal contract has ended (black women and Native American
women).
4.d. Evolution of Affirmative Action Effects over 1973-2003
The previous sections presented evidence on the total effects of affirmative action over
the thirty-one years spanning 1973-2003, but also of interest is the evolution of affirmative action
effects during those years. To study how the effects of affirmative action evolved, I estimate a
specification that replaces the federal contractor indicator with interactions of each of the
year dummies ( with
The coefficients on the interactions measure the average difference between federal
contractors and non-contractors in demographic group shares each year, i.e., the marginal effect
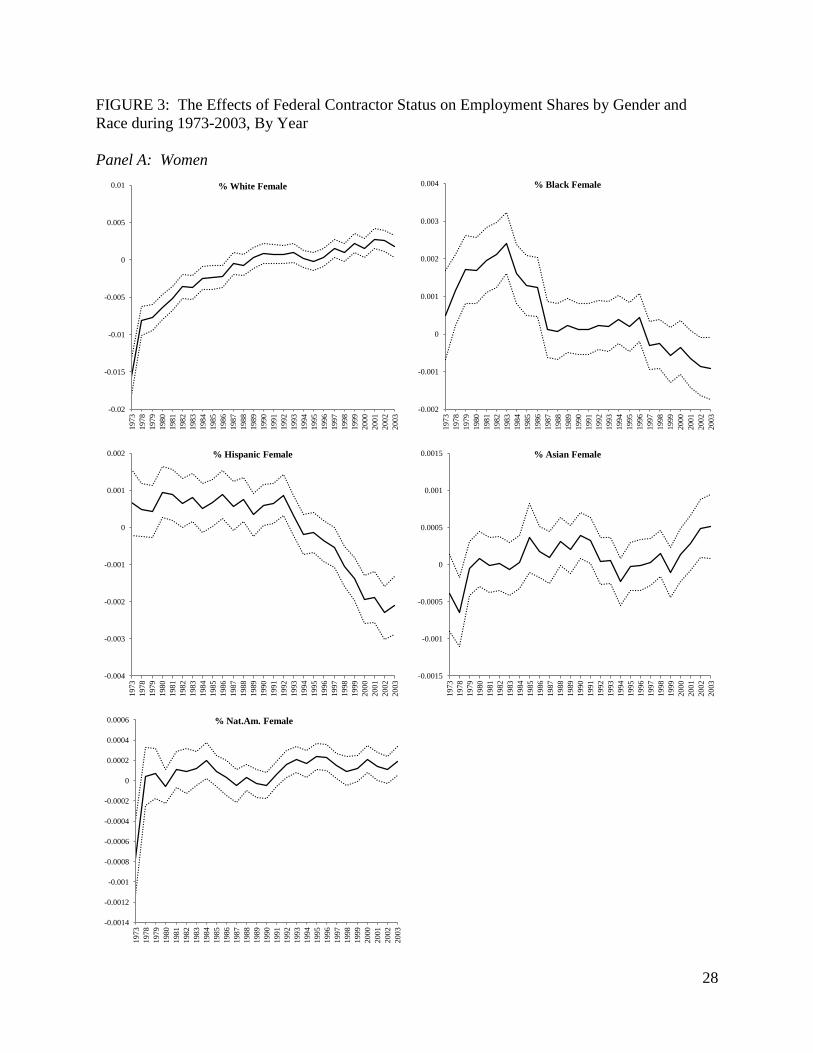
of federal contractor status in each year. I plot the estimated coefficients on the
interactions over 1973-2003 to illustrate the evolution of the effects of federal contractor status in
Figure 3 for each demographic group in turn, where the solid lines denote the coefficient
15
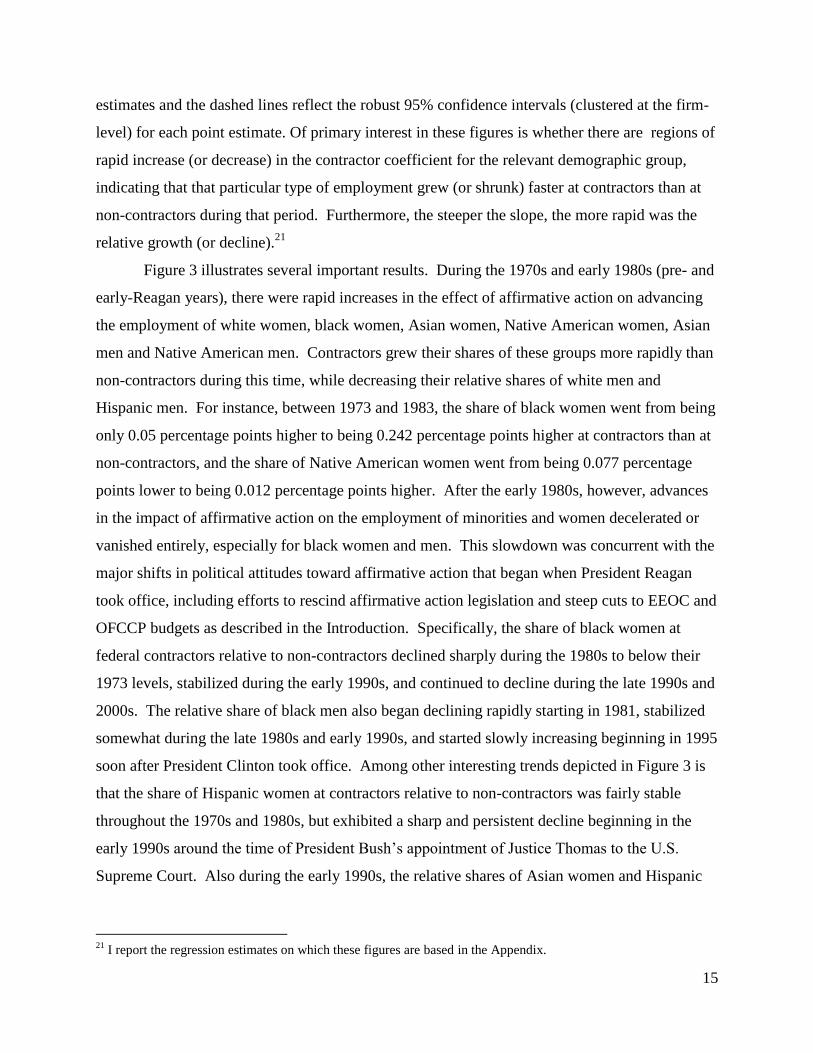
estimates and the dashed lines reflect the robust 95% confidence intervals (clustered at the firm-
level) for each point estimate. Of primary interest in these figures is whether there are regions of
rapid increase (or decrease) in the contractor coefficient for the relevant demographic group,
indicating that that particular type of employment grew (or shrunk) faster at contractors than at
non-contractors during that period. Furthermore, the steeper the slope, the more rapid was the
relative growth (or decline).21
Figure 3 illustrates several important results. During the 1970s and early 1980s (pre- and
early-Reagan years), there were rapid increases in the effect of affirmative action on advancing
the employment of white women, black women, Asian women, Native American women, Asian
men and Native American men. Contractors grew their shares of these groups more rapidly than
non-contractors during this time, while decreasing their relative shares of white men and
Hispanic men. For instance, between 1973 and 1983, the share of black women went from being
only 0.05 percentage points higher to being 0.242 percentage points higher at contractors than at
non-contractors, and the share of Native American women went from being 0.077 percentage
points lower to being 0.012 percentage points higher. After the early 1980s, however, advances
in the impact of affirmative action on the employment of minorities and women decelerated or
vanished entirely, especially for black women and men. This slowdown was concurrent with the
major shifts in political attitudes toward affirmative action that began when President Reagan
took office, including efforts to rescind affirmative action legislation and steep cuts to EEOC and
OFCCP budgets as described in the Introduction. Specifically, the share of black women at
federal contractors relative to non-contractors declined sharply during the 1980s to below their
1973 levels, stabilized during the early 1990s, and continued to decline during the late 1990s and
2000s. The relative share of black men also began declining rapidly starting in 1981, stabilized
somewhat during the late 1980s and early 1990s, and started slowly increasing beginning in 1995
soon after President Clinton took office. Among other interesting trends depicted in Figure 3 is
that the share of Hispanic women at contractors relative to non-contractors was fairly stable
throughout the 1970s and 1980s, but exhibited a sharp and persistent decline beginning in the
early 1990s around the time of President Bush’s appointment of Justice Thomas to the U.S.
Supreme Court. Also during the early 1990s, the relative shares of Asian women and Hispanic
21
I report the regression estimates on which these figures are based in the Appendix.

16
men shrunk, while those of Native American women and white men grew. Finally, the federal
contractor premium increased for Asian men throughout 1973-2003.
5. Conclusion
Using a new panel of over 100,000 large private-sector firms across all industries and
regions from the U.S. Equal Employment Opportunity Commission, this study quantifies the
long-term impact of affirmative action in federal contracting during the three decades spanning
1973-2003.
The paper’s key findings reveal that the cumulative effects of affirmative action over
1973-2003 were mixed across race and gender groups, with the primary beneficiaries being black
and Native American women and men. Specifically, the share of black and Native American
women and men grew more on average at federal contactors subject to affirmative action
obligation than at non-contracting firms during 1973-2003. In particular, becoming a federal
contractor increased black women’s employment share by 0.041 percentage points on average
(or by 0.871 percent), and increased Native American women’s share by 0.008 percentage points
(or by 3.883 percent). Becoming a federal contractor also increased black men’s and Native
American men’s employment shares by 0.04 and 0.014 percentage points respectively (or by
0.603 percent and 3.966 percent). These represent a substantial contribution of affirmative
action to the growth of protected group employment in the U.S. workforce over the three decades
under study. On the other hand, affirmative action did not increase the employment of Hispanic
and Asian women and men by a statistically discernible amount over 1973-2003, and was
associated with a decline in the employment share of white women on average. Analysis of the
dynamics of employment around the time of contracting indicates that selection was not driving
these results, that a large part of the effect of affirmative action on increasing protected group
shares occurred within the first four years of becoming a contractor, and that contractors
maintained these increased shares even after they no longer held a federal contract. The paper
additionally uncovers important results on how the impact of affirmative action evolved over the
three decades under study, in particular that the fastest growth in the employment shares of
minorities and women at federal contractors relative to non-contracting firms occurred during the
1970s and early 1980s, decelerating substantially during the Reagan era—this illustrates the
17
sensitivity of affirmative action effects to political attitudes towards affirmative action and
underscores the importance of strong government commitment.
There continues to be heated debate over affirmative action in the labor market. Several
states have prohibited affirmative action in public employment in recent years, and the future of
affirmative action in the United States is uncertain. Rhetoric abounds on both sides of the
affirmative action debate with little hard evidence brought to bear to inform policy discussions.
This study has presented large-sample evidence with detailed controls showing that
representation of particular female and minority groups did in fact increase more on average at
federal contractors subject to affirmative action obligation during 1973-2003. It has also
presented evidence of long-term affirmative action effects that persist even after firms no longer
hold federal contracts. Overall, the study suggests that government policy has contributed to
increasing diversity at U.S. workplaces.
18
References
Anderson, Bernard. 1996. “The Ebb and Flow of Enforcing Executive Order 11246”. American
Economic Review Papers and Proceedings, Vol. 86, No. 2 (May), pp. 298-301.
Ashenfelter, Orley and James Heckman. 1976. “Measuring the Effect of an Anti-discrimination
Program”. In Orley Ashenfelter and James Blum (eds.), Evaluating the Labor Market Effects of
Social Programs. Princeton, NJ: Princeton University, Industrial Relations Section.
Athey, Susan, Christopher Avery, and Peter Zemsky. 2000. “Mentoring and Diversity”.
American Economic Review, Vol. 90, No. 4, pp. 765-786.
Badgett, M.V. Lee. 1995. “Affirmative Action in a Changing Legal and Economic
Environment”. Industrial Relations, Vol. 34, No. 4, pp. 489-506.
Blau, Francine D. and Anne Winkler. 2005. “Does Affirmative Action Work?” Regional Review.
The Federal Reserve Bank of Boston, Q1, pp. 38-40.
Brown, Charles. 1982. “The Federal Attack on Labor Market Discrimination: The Mouse that
Roared?”. In Ronald Ehrenberg (ed.), Research in Labor Economics, Vol. 5. New York: JAI
Press, pp. 33-68.
Carrington, William J, Kristin McCue, Brooks Pierce. 2000. “Using Establishment Size to
Measure the Impact of Title VII and Affirmative Action”. Journal of Human Resources, Vol. 35,
No. 3 (Summer), pp. 503-523.
Charles, Kerwin Kofi, and Jonathan Guryan. 2008. “Prejudice and Wages: An Empirical
Assessment of Becker’s The Economics of Discrimination”. Journal of Political Economy, Vol.
116, No. 5, (Oct.), pp. 773-809.
Coate, Stephen, and Glenn Loury. 1992. “Will Affirmative-Action Policies Eliminate Negative
Stereotypes?”. American Economic Review, Vol. 83, No. 5, pp. 1220-1240.
Cornell, Bradford, and Ivo Welch. 1996. “Culture, Information, and Screening Discrimination”.
American Economic Review, Vol. 104, No. 3, pp. 542-571.
Donahue, John, and Peter Siegelman. 1991. “The Changing Nature of Employment
Discrimination Litigation”. Stanford Law Review, Vol. 43, pp. 483-1033.
Goldstein, Morris and Robert S. Smith. 1976. “The Estimated Impact of the Anti-discriminatin
Program Aimed at Federal Contractors”. Industrial and Labor Relations Review, Vol. 29, No. 4
(July), pp. 524-543.
Heckman, James J., and Kenneth I. Wolpin. 1976. “Does the Contract Compliance Program
Work? An Analysis of Chicago Data”. Industrial and Labor Relations Review, Vol. 29, No. 4
(July), pp. 544-564.
19
Holzer, Harry J. 1998. “Why Do Small Establishments Hire Fewer Blacks Than Large Ones?”.
Journal of Human Resources, No. 33, Vol. 4 (Fall), pp. 896-914.
Holzer, Harry J. and David Neumark. 2000. “Assessing Affirmative Action”. Journal of
Economic Literature, Vol. 38, No. 3 (Sep.), pp. 483-568.
Kurtulus, Fidan Ana, and Donald Tomaskovic-Devey. 2009. “Do Women Top Managers Help
Women Advance? A Panel Study Using EEO-1 Records”. University of Massachusetts Amherst
Working Paper.
Kurtulus, Fidan Ana. 2011. “Affirmative Action and the Occupational Advancement of
Minorities and Women During 1973-2003”. University of Massachusetts Amherst Working
Paper.
Leonard, Jonathan S. 1984a. “The Impact of Affirmative Action on Employment”. Journal of
Labor Economics, Vol. 2, No. 4 (Oct.), pp. 439-463.
Leonard, Jonathan S. 1984b. “Anti-Discrimination or Reverse Discrimination: The Impact of
Changing Demographics, Title VII and Affirmative Action on Productivity”. Journal of Human
Resources, Vol. 19 (Spring), pp. 145-174.
Leonard, Jonathan S. 1985. “What Promises Are Worth: The Impact of Affirmative Action
Goals”. Journal of Human Resources, Vol. 20, No. 1 (Winter), pp. 3-20.
Leonard, Jonathan S. 1986. “The Effectiveness of Equal Employment Law and Affirmative
Action Regulation”. In R.G. Ehrenberg (ed.), Research in Labor Economics, Vol. 8, pp. 318-
350, Greenwich, CT: JAI Press.
Leonard, Jonathan S. 1990. “The Impact of Affirmative Action Regulation and Equal
Employment Law on Black Employment”. Journal of Economic Perspectives, Vol. 4, No. 4
(Fall), pp. 47-63.
Leonard, Jonathan S. 1996. “Wage Disparities and Affirmative Action in the 1980s”. American
Economic Review Papers and Proceedings, Vol. 86, No. 2 (May), pp. 285-289.
McCrary, Justin. 2007. “The Effect of Court-Ordered Quotas on the Composition and Quality
of Police”. American Economic Review, Vol. 97, No. 1 (March), pp. 318-353.
Robinson, Corre L., Tiffany Taylor, Donald Tomaskovic-Devey, Catherine Zimmer, and
Matthew Irwin. 2005. “Studying Race or Ethnic and Sex Segregation at the Establishment Level:
Methodological Issues and Substantive Opportunities Using EEO-1 Reports”. Work and
Occupations, pp. 325-338.
Smith, James and Finis Welch. 1984. “Affirmative Action and Labor Markets”. Journal of Labor
Economics, Vol. 2, No.2 (April), pp. 269-301.
20
U.S. Department of Labor, Employment Standards Administration, Office of Federal Contract
Compliance Programs. 1998. Federal Contract Compliance Manual,
www.dol.gov/ofccp/regs/compliance/fccm/fccmanul.htm (Accessed April 6th, 2010).
U.S. General Services Administration. 2005. Federal Acquisition Regulation,
https://www.acquisition.gov/far/ (Accessed April 6th
, 2010).
U.S. House of Representatives Committee on Education and Labor. 1987. A Report on the
Investigation of the Civil Rights Enforcement Activities of the Office of Federal Contract
Compliance Programs, U.S. Department of Labor. U.S. House of Representatives Serial No.
100-R (October), Washington, D.C.: U.S. Government Printing Office.
21
TABLE 1: Descriptive Statistics by Federal Contractor Status
Fed = 1
Fed = 0
Mean Std. Dev. N
Mean Std. Dev. N
Size(100) 16.553 93.033 434,076
7.357 45.030 581,291
Multi-establishment 0.598 0.490 434,076
0.473 0.499 581,291
% White Collar 0.368 0.236 434,075
0.354 0.247 581,283
Agriculture 0.006 0.078 432,802
0.009 0.096 579,956
Mining 0.012 0.110 432,802
0.008 0.090 579,956
Construction 0.079 0.269 432,802
0.029 0.169 579,956
Manufacturing 0.332 0.471 432,802
0.300 0.458 579,956
Transportation 0.056 0.230 432,802
0.051 0.220 579,956
Wholesale 0.056 0.229 432,802
0.068 0.251 579,956
Retail 0.036 0.186 432,802
0.124 0.329 579,956
Finance 0.190 0.393 432,802
0.071 0.257 579,956
Service 0.233 0.423 432,802
0.340 0.474 579,956
Northeast 0.240 0.427 433,414
0.245 0.430 580,622
Midwest 0.263 0.440 433,414
0.291 0.454 580,622
South 0.308 0.462 433,414
0.301 0.459 580,622
West 0.189 0.392 433,414
0.164 0.370 580,622
% White Female 0.328 0.240 434,075
0.365 0.246 581,283
% Black Female 0.045 0.083 434,075
0.061 0.108 581,283
% Hispanic Female 0.028 0.066 434,075
0.034 0.078 581,283
% Asian Female 0.013 0.035 434,075
0.013 0.036 581,283
% Nat.Am. Female 0.002 0.013 434,075
0.002 0.012 581,283
% White Male 0.464 0.247 434,075
0.400 0.248 581,283
% Black Male 0.052 0.082 434,075
0.056 0.086 581,283
% Hispanic Male 0.047 0.096 434,075
0.054 0.111 581,283
% Asian Male 0.017 0.040 434,075
0.013 0.037 581,283
% Nat.Am. Male 0.004 0.018 434,075
0.002 0.015 581,283
Note: Based on the full EEO sample of N=1,015,881 firm-years during 1973-2003. Descriptive statistics
based on the samples used in all of the regressions in the paper closely match the above figures.
22
TABLE 2: The Effects of Federal Contractor Status on Employment Shares by Gender and Race
During 1973-2003
Panel A: Women
Dependent Variable:
% White Female % Black Female % Hispanic Female %Asian Female % Nat.Am. Female
(1) (2) (3) (4) (5)
Fed -0.00122*** 0.00041** -0.00018 0.00009 0.00008**
(0.00035) (0.00019) (0.00016) (0.00008) (0.00004)
Firm Controls YES YES YES YES YES
Year Dummies YES YES YES YES YES
Industry X Year Dummies YES YES YES YES YES
Region X Year Dummies YES YES YES YES YES
Constant 0.34915*** 0.04662*** 0.02378*** 0.00440*** 0.00199***
(0.00101) (0.00049) (0.00036) (0.00021) (0.00013)
Observations 1,011,729 1,011,729 1,011,729 1,011,729 1,011,729
Number of firms 123,511 123,511 123,511 123,511 123,511
Adjusted R-squared 0.0522 0.0370 0.0729 0.0683 0.0012
Panel B: Men
Dependent Variable:
% White Male % Black Male % Hispanic Male % Asian Male % Nat.Am. Male
(1) (2) (3) (4) (5)
Fed 0.00090** 0.00040** -0.00058*** -0.00003 0.00014***
(0.00037) (0.00018) (0.00022) (0.00009) (0.00005)
Firm Controls YES YES YES YES YES
Year Dummies YES YES YES YES YES
Industry X Year Dummies YES YES YES YES YES
Region X Year Dummies YES YES YES YES YES
Constant 0.45980*** 0.06198*** 0.04272*** 0.00643*** 0.00314***
(0.00104) (0.00045) (0.00043) (0.00022) (0.00015)
Observations 1,011,729 1,011,729 1,011,729 1,011,729 1,011,729
Number of firms 123,511 123,511 123,511 123,511 123,511
Adjusted R-squared 0.1001 0.0157 0.1021 0.0464 0.0007
Note: Robust standard errors clustered by firm are in parentheses. *, **, *** indicates significance at the 10%, 5%
and 1% levels, respectively.
23
TABLE 3: The Dynamic Effects of Federal Contractor Status on Employment Shares by Gender
and Race During 1973-2003
Panel A: Women
Dependent Variable:
% White Female % Black Female % Hispanic Female % Asian Female % Nat.Am. Female
(1) (2) (3) (4) (5)
Fedt+2 -0.00003 0.00023 0.00022 -0.00007 0.00003
(0.00045) (0.00026) (0.00020) (0.00012) (0.00005)
Fedt+1 -0.00064 0.00027 0.00009 -0.00000 0.00005
(0.00047) (0.00026) (0.00021) (0.00011) (0.00005)
Fedt0 -0.00124*** 0.00034 0.00004 -0.00011 0.00008*
(0.00047) (0.00025) (0.00021) (0.00011) (0.00005)
Fedt-1 -0.00074 0.00059** -0.00014 0.00005 0.00014**
(0.00054) (0.00028) (0.00024) (0.00013) (0.00006)
Fedt-2 -0.00030 0.00058* -0.00013 0.00028** 0.00010*
(0.00058) (0.00031) (0.00025) (0.00014) (0.00006)
Fedt-3 -0.00024 0.00069** -0.00015 0.00021 0.00008
(0.00061) (0.00031) (0.00026) (0.00014) (0.00006)
Fedt-4 forward 0.00064 -0.00005 -0.00093*** 0.00035** 0.00013**
(0.00066) (0.00034) (0.00028) (0.00016) (0.00006)
Firm Controls YES YES YES YES YES
Year Dummies YES YES YES YES YES
Industry X Year Dummies YES YES YES YES YES
Region X Year Dummies YES YES YES YES YES
Constant 0.36134*** 0.04694*** 0.02410*** 0.00482*** 0.00228***
(0.00119) (0.00058) (0.00041) (0.00025) (0.00017)
Observations 806,644 806,644 806,644 806,644 806,644
Number of firms 104,048 104,048 104,048 104,048 104,048
Adjusted R-squared 0.0465 0.0359 0.0630 0.0597 0.0011
Panel B: Men
Dependent Variable:
% White Male % Black Male % Hispanic Male % Asian Male % Nat.Am. Male
(1) (2) (3) (4) (5)
Fedt+2 0.00015 -0.00031 -0.00041 0.00009 0.00010
(0.00045) (0.00022) (0.00026) (0.00012) (0.00009)
Fedt+1 0.00081* -0.00016 -0.00033 -0.00018 0.00010
(0.00047) (0.00023) (0.00027) (0.00011) (0.00009)
Fedt0 0.00151*** -0.00005 -0.00045 -0.00031** 0.00020***
(0.00048) (0.00023) (0.00028) (0.00012) (0.00007)
Fedt-1 0.00064 0.00020 -0.00072** -0.00021 0.00019**
(0.00055) (0.00028) (0.00033) (0.00014) (0.00009)
Fedt-2 0.00062 -0.00025 -0.00098*** -0.00005 0.00009
(0.00059) (0.00030) (0.00036) (0.00015) (0.00009)
Fedt-3 -0.00013 0.00023 -0.00102*** 0.00018 0.00017
(0.00062) (0.00031) (0.00037) (0.00016) (0.00011)
Fedt-4 forward 0.00013 0.00014 -0.00147*** 0.00077*** 0.00030***
(0.00068) (0.00034) (0.00041) (0.00017) (0.00010)
Firm Controls YES YES YES YES YES
Year Dummies YES YES YES YES YES
Industry X Year Dummies YES YES YES YES YES
24
Region X Year Dummies YES YES YES YES YES
Constant 0.44798*** 0.06013*** 0.04168*** 0.00742*** 0.00331***
(0.00120) (0.00054) (0.00050) (0.00024) (0.00019)
Observations 806,644 806,644 806,644 806,644 806,644
Number of firms 104,048 104,048 104,048 104,048 104,048
Adjusted R-squared 0.0883 0.0150 0.0919 0.0384 0.0008
Note: Robust standard errors clustered by firm are in parentheses. *, **, *** indicates significance at the 10%, 5%
and 1% levels, respectively.
25
TABLE 4: Exploring Persistence in the Effects of Federal Contractor Status on Employment
Shares by Gender and Race during 1973-2003
Panel A: Women
Dependent Variable:
% White Female % Black Female % Hispanic Female % Asian Female % Nat.Am. Female
(1) (2) (3) (4) (5)
Fed -0.00177*** 0.00058** -0.00012 0.00019* 0.00010***
(0.00044) (0.00024) (0.00020) (0.00011) (0.00004)
Post1fed -0.00193*** 0.00074*** 0.00023 0.00019* 0.00009**
(0.00041) (0.00023) (0.00020) (0.00010) (0.00004)
Post2fed -0.00114*** 0.00064*** 0.00022 0.00009 0.00000
(0.00040) (0.00023) (0.00019) (0.00010) (0.00004)
Firm Controls YES YES YES YES YES
Year Dummies YES YES YES YES YES
Industry X Year Dummies YES YES YES YES YES
Region X Year Dummies YES YES YES YES YES
Constant 0.36391*** 0.05536*** 0.02052*** 0.00936*** 0.00168***
(0.00439) (0.00281) (0.00331) (0.00109) (0.00032)
Observations 934,634 934,634 934,634 934,634 934,634
Number of firms 107,922 107,922 107,922 107,922 107,922
Adjusted R-squared 0.0573 0.0337 0.0717 0.0656 0.0014
Panel B: Men
Dependent Variable:
% White Male % Black Male % Hispanic Male % Asian Male % Nat.Am. Male
(1) (2) (3) (4) (5)
Fed 0.00094** 0.00040* -0.00057** 0.00008 0.00018***
(0.00045) (0.00022) (0.00028) (0.00011) (0.00006)
Post1fed 0.00004 0.00025 0.00014 0.00026** -0.00002
(0.00042) (0.00021) (0.00026) (0.00011) (0.00007)
Post2fed -0.00053 0.00019 0.00018 0.00032*** 0.00002
(0.00040) (0.00020) (0.00025) (0.00010) (0.00008)
Firm Controls YES YES YES YES YES
Year Dummies YES YES YES YES YES
Industry X Year Dummies YES YES YES YES YES
Region X Year Dummies YES YES YES YES YES
Constant 0.43345*** 0.06224*** 0.04188*** 0.00890*** 0.00269***
(0.00454) (0.00303) (0.00524) (0.00155) (0.00053)
Observations 934,634 934,634 934,634 934,634 934,634
Number of firms 107,922 107,922 107,922 107,922 107,922
Adjusted R-squared 0.0871 0.0166 0.1024 0.0452 0.0006
Note: Robust standard errors clustered by firm are in parentheses. *, **, *** indicates significance at the 10%, 5%
and 1% levels, respectively.
26
FIGURE 1: Mean Employment Shares of Women and Men by Race at U.S. Firms: 1973-2003
Panel A: Women
Panel B: Men
Source: U.S. Equal Employment Opportunity Commission EEO-1 Reports. In each graph, there is a break in the Y-axis such that the white
shares at the top are at a greater scale than the minority shares at the bottom.
0.2
0.22
0.24
0.26
0.28
0.3
0.32
0.34
0.36
0.38
0.4
% White Female
%White Female
0
0.01
0.02
0.03
0.04
0.05
0.06
0.07
19
73
19
78
19
79
19
80
19
81
19
82
19
83
19
84
19
85
19
86
19
87
19
88
19
89
19
90
19
91
19
92
19
93
19
94
19
95
19
96
19
97
19
98
19
99
20
00
20
01
20
02
20
03
% Black Female
% Hispanic Female
% Nat.Am. Female
% Asian Female
0.2
0.25
0.3
0.35
0.4
0.45
0.5
% White Male
0
0.01
0.02
0.03
0.04
0.05
0.06
0.07
0.08
19
73
19
78
19
79
19
80
19
81
19
82
19
83
19
84
19
85
19
86
19
87
19
88
19
89
19
90
19
91
19
92
19
93
19
94
19
95
19
96
19
97
19
98
19
99
20
00
20
01
20
02
20
03
% Hispanic Male
% Black Male
% Asian Male
% Nat.Am. Male
27
FIGURE 2: Histogram of Federal Contractor Gain Years
Source: U.S. Equal Employment Opportunity Commission EEO-1 Reports.
0
2,000
4,000
6,000
8,000
10,000
12,000
1973 1980 1983 1986 1989 1992 1995 1998 2001
Num
ber
of
Fir
ms
That
Gai
ned
Fed
eral
Co
ntr
acts
Year
28
FIGURE 3: The Effects of Federal Contractor Status on Employment Shares by Gender and
Race during 1973-2003, By Year
Panel A: Women
-0.02
-0.015
-0.01
-0.005
0
0.005
0.01
1973
1978
1979
1980
1981
1982
1983
1984
1985
1986
1987
1988
1989
1990
1991
1992
1993
1994
1995
1996
1997
1998
1999
2000
2001
2002
2003
% White Female
-0.002
-0.001
0
0.001
0.002
0.003
0.004
1973
1978
1979
1980
1981
1982
1983
1984
1985
1986
1987
1988
1989
1990
1991
1992
1993
1994
1995
1996
1997
1998
1999
2000
2001
2002
2003
% Black Female
-0.004
-0.003
-0.002
-0.001
0
0.001
0.002
1973
1978
1979
1980
1981
1982
1983
1984
1985
1986
1987
1988
1989
1990
1991
1992
1993
1994
1995
1996
1997
1998
1999
2000
2001
2002
2003
% Hispanic Female
-0.0015
-0.001
-0.0005
0
0.0005
0.001
0.0015 1973
1978
1979
1980
1981
1982
1983
1984
1985
1986
1987
1988
1989
1990
1991
1992
1993
1994
1995
1996
1997
1998
1999
2000
2001
2002
2003
% Asian Female
-0.0014
-0.0012
-0.001
-0.0008
-0.0006
-0.0004
-0.0002
0
0.0002
0.0004
0.0006
1973
1978
1979
1980
1981
1982
1983
1984
1985
1986
1987
1988
1989
1990
1991
1992
1993
1994
1995
1996
1997
1998
1999
2000
2001
2002
2003
% Nat.Am. Female
29
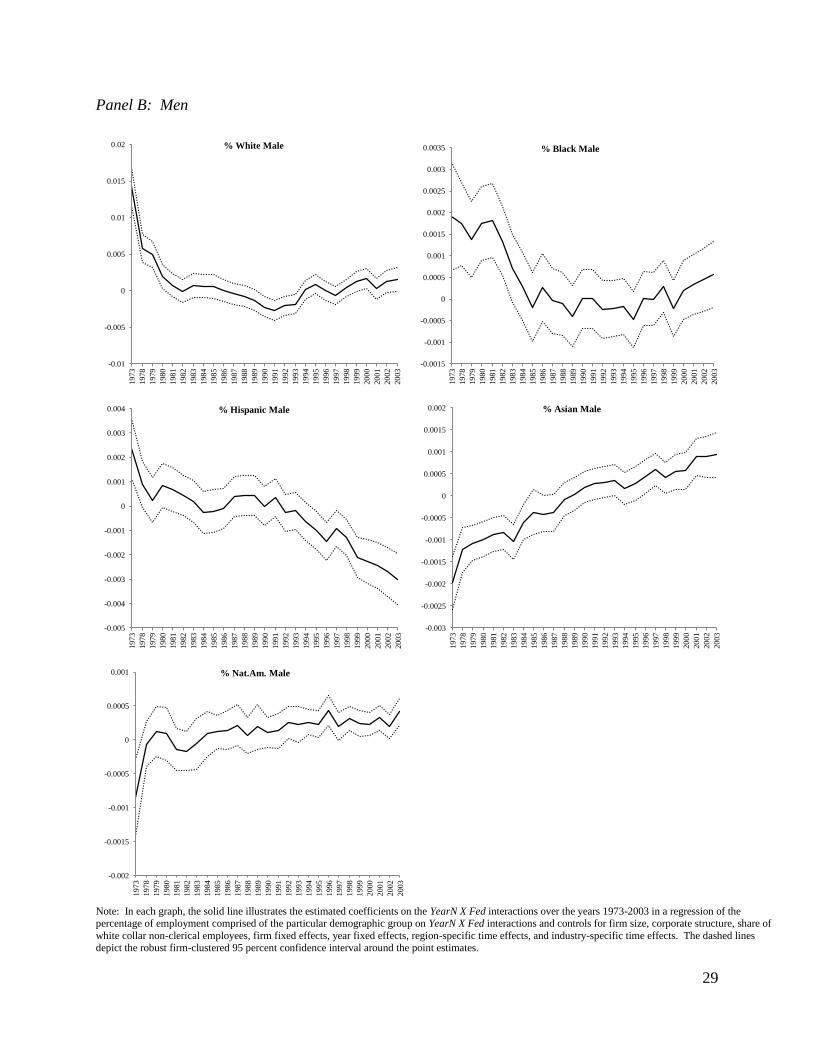
Panel B: Men
Note: In each graph, the solid line illustrates the estimated coefficients on the YearN X Fed interactions over the years 1973-2003 in a regression of the percentage of employment comprised of the particular demographic group on YearN X Fed interactions and controls for firm size, corporate structure, share of
white collar non-clerical employees, firm fixed effects, year fixed effects, region-specific time effects, and industry-specific time effects. The dashed lines depict the robust firm-clustered 95 percent confidence interval around the point estimates.
-0.01
-0.005
0
0.005
0.01
0.015
0.02
1973
1978
1979
1980
1981
1982
1983
1984
1985
1986
1987
1988
1989
1990
1991
1992
1993
1994
1995
1996
1997
1998
1999
2000
2001
2002
2003
% White Male
-0.0015
-0.001
-0.0005
0
0.0005
0.001
0.0015
0.002
0.0025
0.003
0.0035
1973
1978
1979
1980
1981
1982
1983
1984
1985
1986
1987
1988
1989
1990
1991
1992
1993
1994
1995
1996
1997
1998
1999
2000
2001
2002
2003
% Black Male
-0.005
-0.004
-0.003
-0.002
-0.001
0
0.001
0.002
0.003
0.004
1973
1978
1979
1980
1981
1982
1983
1984
1985
1986
1987
1988
1989
1990
1991
1992
1993
1994
1995
1996
1997
1998
1999
2000
2001
2002
2003
% Hispanic Male
-0.003
-0.0025
-0.002
-0.0015
-0.001
-0.0005
0
0.0005
0.001
0.0015
0.002
1973
1978
1979
1980
1981
1982
1983
1984
1985
1986
1987
1988
1989
1990
1991
1992
1993
1994
1995
1996
1997
1998
1999
2000
2001
2002
2003
% Asian Male
-0.002
-0.0015
-0.001
-0.0005
0
0.0005
0.001
1973
1978
1979
1980
1981
1982
1983
1984
1985
1986
1987
1988
1989
1990
1991
1992
1993
1994
1995
1996
1997
1998
1999
2000
2001
2002
2003
% Nat.Am. Male
30
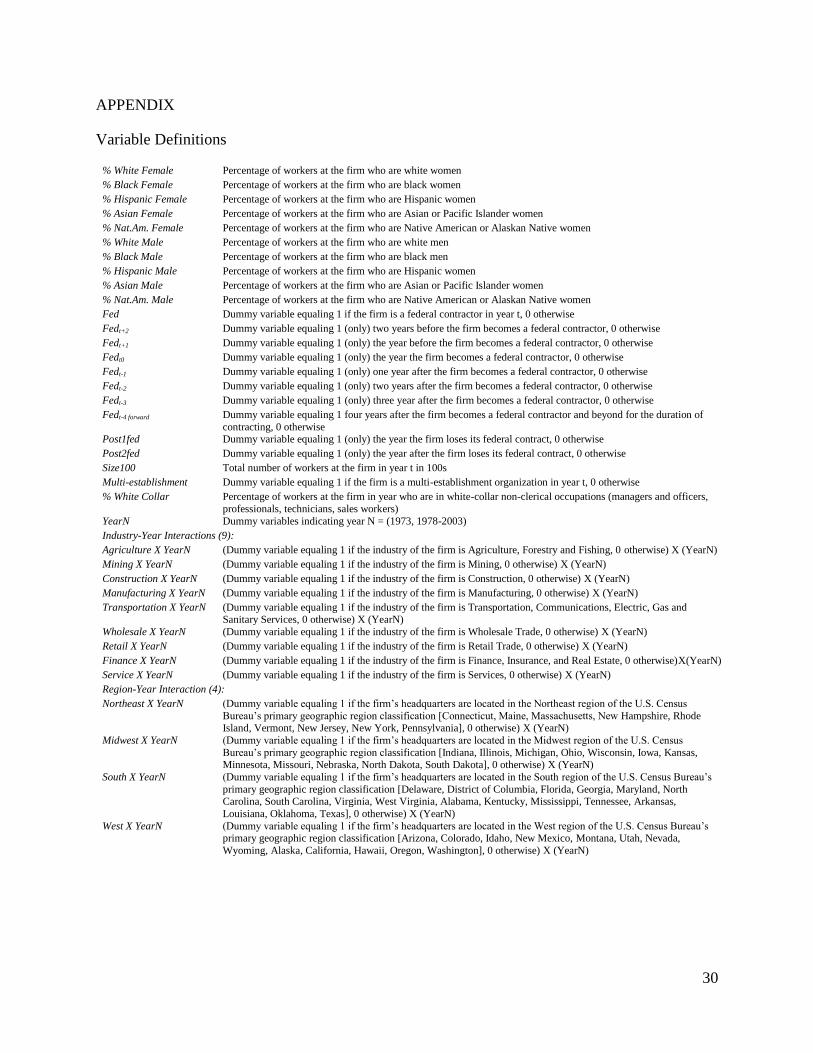
APPENDIX
Variable Definitions
% White Female Percentage of workers at the firm who are white women
% Black Female Percentage of workers at the firm who are black women
% Hispanic Female Percentage of workers at the firm who are Hispanic women
% Asian Female Percentage of workers at the firm who are Asian or Pacific Islander women
% Nat.Am. Female Percentage of workers at the firm who are Native American or Alaskan Native women
% White Male Percentage of workers at the firm who are white men
% Black Male Percentage of workers at the firm who are black men
% Hispanic Male Percentage of workers at the firm who are Hispanic women
% Asian Male Percentage of workers at the firm who are Asian or Pacific Islander women
% Nat.Am. Male Percentage of workers at the firm who are Native American or Alaskan Native women
Fed Dummy variable equaling 1 if the firm is a federal contractor in year t, 0 otherwise
Fedt+2 Dummy variable equaling 1 (only) two years before the firm becomes a federal contractor, 0 otherwise
Fedt+1 Dummy variable equaling 1 (only) the year before the firm becomes a federal contractor, 0 otherwise
Fedt0 Dummy variable equaling 1 (only) the year the firm becomes a federal contractor, 0 otherwise
Fedt-1 Dummy variable equaling 1 (only) one year after the firm becomes a federal contractor, 0 otherwise
Fedt-2 Dummy variable equaling 1 (only) two years after the firm becomes a federal contractor, 0 otherwise
Fedt-3 Dummy variable equaling 1 (only) three year after the firm becomes a federal contractor, 0 otherwise
Fedt-4 forward Dummy variable equaling 1 four years after the firm becomes a federal contractor and beyond for the duration of
contracting, 0 otherwise Post1fed Dummy variable equaling 1 (only) the year the firm loses its federal contract, 0 otherwise
Post2fed Dummy variable equaling 1 (only) the year after the firm loses its federal contract, 0 otherwise
Size100 Total number of workers at the firm in year t in 100s
Multi-establishment Dummy variable equaling 1 if the firm is a multi-establishment organization in year t, 0 otherwise
% White Collar Percentage of workers at the firm in year who are in white-collar non-clerical occupations (managers and officers,
professionals, technicians, sales workers)
YearN Dummy variables indicating year N = (1973, 1978-2003)
Industry-Year Interactions (9):
Agriculture X YearN (Dummy variable equaling 1 if the industry of the firm is Agriculture, Forestry and Fishing, 0 otherwise) X (YearN)
Mining X YearN (Dummy variable equaling 1 if the industry of the firm is Mining, 0 otherwise) X (YearN)
Construction X YearN (Dummy variable equaling 1 if the industry of the firm is Construction, 0 otherwise) X (YearN)
Manufacturing X YearN (Dummy variable equaling 1 if the industry of the firm is Manufacturing, 0 otherwise) X (YearN)
Transportation X YearN (Dummy variable equaling 1 if the industry of the firm is Transportation, Communications, Electric, Gas and Sanitary Services, 0 otherwise) X (YearN)
Wholesale X YearN (Dummy variable equaling 1 if the industry of the firm is Wholesale Trade, 0 otherwise) X (YearN)
Retail X YearN (Dummy variable equaling 1 if the industry of the firm is Retail Trade, 0 otherwise) X (YearN)
Finance X YearN (Dummy variable equaling 1 if the industry of the firm is Finance, Insurance, and Real Estate, 0 otherwise)X(YearN)
Service X YearN (Dummy variable equaling 1 if the industry of the firm is Services, 0 otherwise) X (YearN)
Region-Year Interaction (4):
Northeast X YearN (Dummy variable equaling 1 if the firm’s headquarters are located in the Northeast region of the U.S. Census
Bureau’s primary geographic region classification [Connecticut, Maine, Massachusetts, New Hampshire, Rhode Island, Vermont, New Jersey, New York, Pennsylvania], 0 otherwise) X (YearN)
Midwest X YearN (Dummy variable equaling 1 if the firm’s headquarters are located in the Midwest region of the U.S. Census
Bureau’s primary geographic region classification [Indiana, Illinois, Michigan, Ohio, Wisconsin, Iowa, Kansas, Minnesota, Missouri, Nebraska, North Dakota, South Dakota], 0 otherwise) X (YearN)
South X YearN (Dummy variable equaling 1 if the firm’s headquarters are located in the South region of the U.S. Census Bureau’s
primary geographic region classification [Delaware, District of Columbia, Florida, Georgia, Maryland, North Carolina, South Carolina, Virginia, West Virginia, Alabama, Kentucky, Mississippi, Tennessee, Arkansas,
Louisiana, Oklahoma, Texas], 0 otherwise) X (YearN)
West X YearN (Dummy variable equaling 1 if the firm’s headquarters are located in the West region of the U.S. Census Bureau’s primary geographic region classification [Arizona, Colorado, Idaho, New Mexico, Montana, Utah, Nevada,
Wyoming, Alaska, California, Hawaii, Oregon, Washington], 0 otherwise) X (YearN)
31
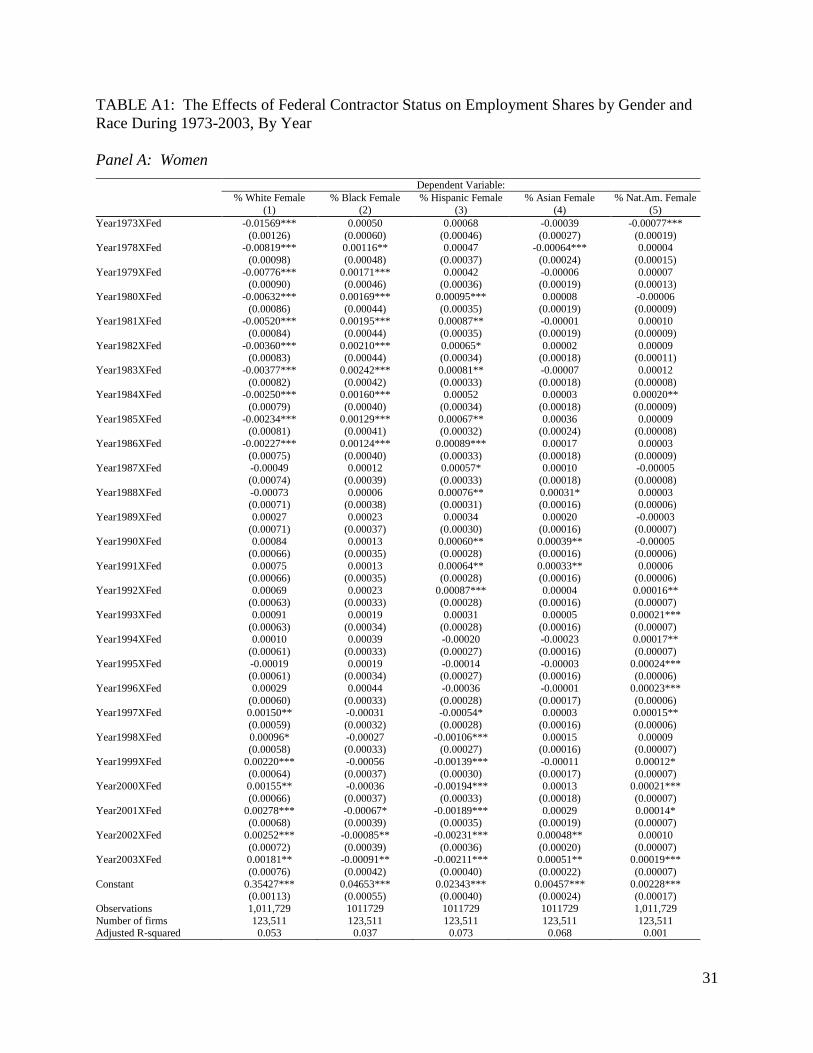
TABLE A1: The Effects of Federal Contractor Status on Employment Shares by Gender and
Race During 1973-2003, By Year
Panel A: Women
Dependent Variable:
% White Female % Black Female % Hispanic Female % Asian Female % Nat.Am. Female
(1) (2) (3) (4) (5)
Year1973XFed -0.01569*** 0.00050 0.00068 -0.00039 -0.00077***
(0.00126) (0.00060) (0.00046) (0.00027) (0.00019) Year1978XFed -0.00819*** 0.00116** 0.00047 -0.00064*** 0.00004
(0.00098) (0.00048) (0.00037) (0.00024) (0.00015)
Year1979XFed -0.00776*** 0.00171*** 0.00042 -0.00006 0.00007 (0.00090) (0.00046) (0.00036) (0.00019) (0.00013)
Year1980XFed -0.00632*** 0.00169*** 0.00095*** 0.00008 -0.00006
(0.00086) (0.00044) (0.00035) (0.00019) (0.00009) Year1981XFed -0.00520*** 0.00195*** 0.00087** -0.00001 0.00010
(0.00084) (0.00044) (0.00035) (0.00019) (0.00009)
Year1982XFed -0.00360*** 0.00210*** 0.00065* 0.00002 0.00009 (0.00083) (0.00044) (0.00034) (0.00018) (0.00011)
Year1983XFed -0.00377*** 0.00242*** 0.00081** -0.00007 0.00012
(0.00082) (0.00042) (0.00033) (0.00018) (0.00008) Year1984XFed -0.00250*** 0.00160*** 0.00052 0.00003 0.00020**
(0.00079) (0.00040) (0.00034) (0.00018) (0.00009)
Year1985XFed -0.00234*** 0.00129*** 0.00067** 0.00036 0.00009 (0.00081) (0.00041) (0.00032) (0.00024) (0.00008)
Year1986XFed -0.00227*** 0.00124*** 0.00089*** 0.00017 0.00003
(0.00075) (0.00040) (0.00033) (0.00018) (0.00009) Year1987XFed -0.00049 0.00012 0.00057* 0.00010 -0.00005
(0.00074) (0.00039) (0.00033) (0.00018) (0.00008)
Year1988XFed -0.00073 0.00006 0.00076** 0.00031* 0.00003 (0.00071) (0.00038) (0.00031) (0.00016) (0.00006)
Year1989XFed 0.00027 0.00023 0.00034 0.00020 -0.00003
(0.00071) (0.00037) (0.00030) (0.00016) (0.00007) Year1990XFed 0.00084 0.00013 0.00060** 0.00039** -0.00005
(0.00066) (0.00035) (0.00028) (0.00016) (0.00006)
Year1991XFed 0.00075 0.00013 0.00064** 0.00033** 0.00006
(0.00066) (0.00035) (0.00028) (0.00016) (0.00006)
Year1992XFed 0.00069 0.00023 0.00087*** 0.00004 0.00016** (0.00063) (0.00033) (0.00028) (0.00016) (0.00007)
Year1993XFed 0.00091 0.00019 0.00031 0.00005 0.00021***
(0.00063) (0.00034) (0.00028) (0.00016) (0.00007) Year1994XFed 0.00010 0.00039 -0.00020 -0.00023 0.00017**
(0.00061) (0.00033) (0.00027) (0.00016) (0.00007)
Year1995XFed -0.00019 0.00019 -0.00014 -0.00003 0.00024*** (0.00061) (0.00034) (0.00027) (0.00016) (0.00006)
Year1996XFed 0.00029 0.00044 -0.00036 -0.00001 0.00023***
(0.00060) (0.00033) (0.00028) (0.00017) (0.00006) Year1997XFed 0.00150** -0.00031 -0.00054* 0.00003 0.00015**
(0.00059) (0.00032) (0.00028) (0.00016) (0.00006)
Year1998XFed 0.00096* -0.00027 -0.00106*** 0.00015 0.00009 (0.00058) (0.00033) (0.00027) (0.00016) (0.00007)
Year1999XFed 0.00220*** -0.00056 -0.00139*** -0.00011 0.00012*
(0.00064) (0.00037) (0.00030) (0.00017) (0.00007) Year2000XFed 0.00155** -0.00036 -0.00194*** 0.00013 0.00021***
(0.00066) (0.00037) (0.00033) (0.00018) (0.00007)
Year2001XFed 0.00278*** -0.00067* -0.00189*** 0.00029 0.00014* (0.00068) (0.00039) (0.00035) (0.00019) (0.00007)
Year2002XFed 0.00252*** -0.00085** -0.00231*** 0.00048** 0.00010
(0.00072) (0.00039) (0.00036) (0.00020) (0.00007) Year2003XFed 0.00181** -0.00091** -0.00211*** 0.00051** 0.00019***
(0.00076) (0.00042) (0.00040) (0.00022) (0.00007)
Constant 0.35427*** 0.04653*** 0.02343*** 0.00457*** 0.00228*** (0.00113) (0.00055) (0.00040) (0.00024) (0.00017)
Observations 1,011,729 1011729 1011729 1011729 1,011,729
Number of firms 123,511 123,511 123,511 123,511 123,511 Adjusted R-squared 0.053 0.037 0.073 0.068 0.001
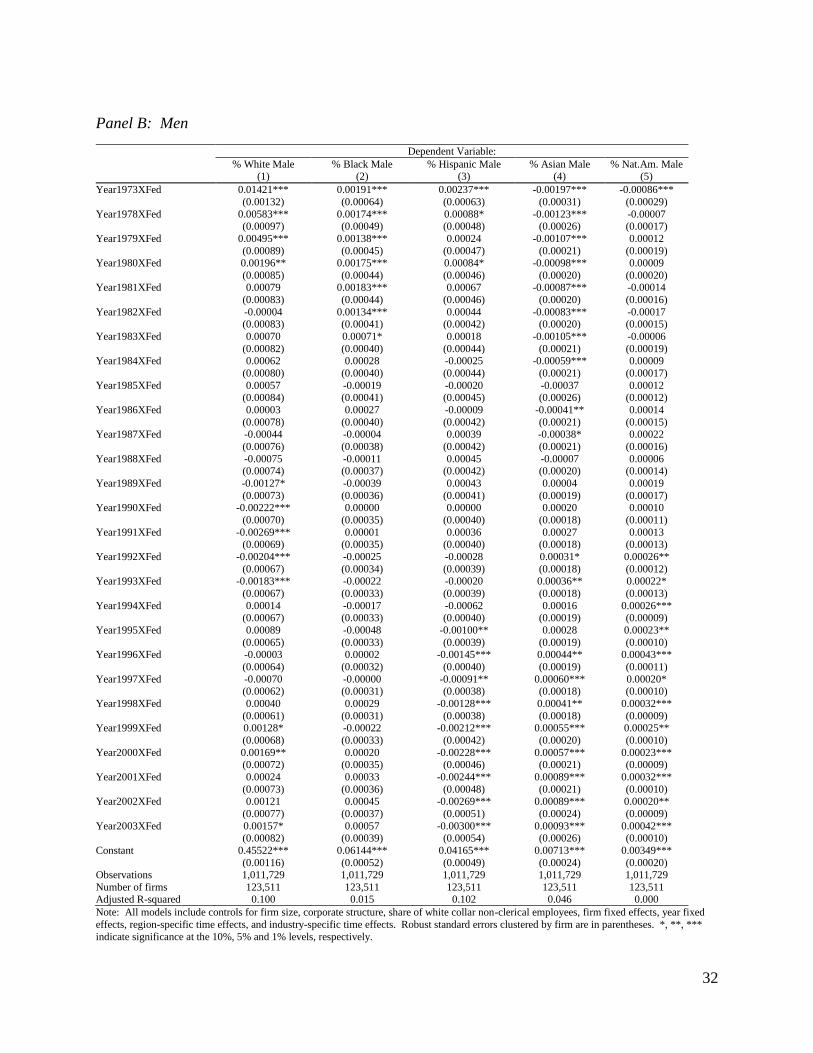
32
Panel B: Men
Dependent Variable:
% White Male % Black Male % Hispanic Male % Asian Male % Nat.Am. Male (1) (2) (3) (4) (5)
Year1973XFed 0.01421*** 0.00191*** 0.00237*** -0.00197*** -0.00086***
(0.00132) (0.00064) (0.00063) (0.00031) (0.00029)
Year1978XFed 0.00583*** 0.00174*** 0.00088* -0.00123*** -0.00007 (0.00097) (0.00049) (0.00048) (0.00026) (0.00017)
Year1979XFed 0.00495*** 0.00138*** 0.00024 -0.00107*** 0.00012
(0.00089) (0.00045) (0.00047) (0.00021) (0.00019) Year1980XFed 0.00196** 0.00175*** 0.00084* -0.00098*** 0.00009
(0.00085) (0.00044) (0.00046) (0.00020) (0.00020) Year1981XFed 0.00079 0.00183*** 0.00067 -0.00087*** -0.00014
(0.00083) (0.00044) (0.00046) (0.00020) (0.00016)
Year1982XFed -0.00004 0.00134*** 0.00044 -0.00083*** -0.00017 (0.00083) (0.00041) (0.00042) (0.00020) (0.00015)
Year1983XFed 0.00070 0.00071* 0.00018 -0.00105*** -0.00006
(0.00082) (0.00040) (0.00044) (0.00021) (0.00019) Year1984XFed 0.00062 0.00028 -0.00025 -0.00059*** 0.00009
(0.00080) (0.00040) (0.00044) (0.00021) (0.00017)
Year1985XFed 0.00057 -0.00019 -0.00020 -0.00037 0.00012 (0.00084) (0.00041) (0.00045) (0.00026) (0.00012)
Year1986XFed 0.00003 0.00027 -0.00009 -0.00041** 0.00014
(0.00078) (0.00040) (0.00042) (0.00021) (0.00015) Year1987XFed -0.00044 -0.00004 0.00039 -0.00038* 0.00022
(0.00076) (0.00038) (0.00042) (0.00021) (0.00016)
Year1988XFed -0.00075 -0.00011 0.00045 -0.00007 0.00006 (0.00074) (0.00037) (0.00042) (0.00020) (0.00014)
Year1989XFed -0.00127* -0.00039 0.00043 0.00004 0.00019
(0.00073) (0.00036) (0.00041) (0.00019) (0.00017) Year1990XFed -0.00222*** 0.00000 0.00000 0.00020 0.00010
(0.00070) (0.00035) (0.00040) (0.00018) (0.00011)
Year1991XFed -0.00269*** 0.00001 0.00036 0.00027 0.00013 (0.00069) (0.00035) (0.00040) (0.00018) (0.00013)
Year1992XFed -0.00204*** -0.00025 -0.00028 0.00031* 0.00026**
(0.00067) (0.00034) (0.00039) (0.00018) (0.00012)
Year1993XFed -0.00183*** -0.00022 -0.00020 0.00036** 0.00022*
(0.00067) (0.00033) (0.00039) (0.00018) (0.00013)
Year1994XFed 0.00014 -0.00017 -0.00062 0.00016 0.00026*** (0.00067) (0.00033) (0.00040) (0.00019) (0.00009)
Year1995XFed 0.00089 -0.00048 -0.00100** 0.00028 0.00023**
(0.00065) (0.00033) (0.00039) (0.00019) (0.00010) Year1996XFed -0.00003 0.00002 -0.00145*** 0.00044** 0.00043***
(0.00064) (0.00032) (0.00040) (0.00019) (0.00011)
Year1997XFed -0.00070 -0.00000 -0.00091** 0.00060*** 0.00020* (0.00062) (0.00031) (0.00038) (0.00018) (0.00010)
Year1998XFed 0.00040 0.00029 -0.00128*** 0.00041** 0.00032***
(0.00061) (0.00031) (0.00038) (0.00018) (0.00009) Year1999XFed 0.00128* -0.00022 -0.00212*** 0.00055*** 0.00025**
(0.00068) (0.00033) (0.00042) (0.00020) (0.00010)
Year2000XFed 0.00169** 0.00020 -0.00228*** 0.00057*** 0.00023*** (0.00072) (0.00035) (0.00046) (0.00021) (0.00009)
Year2001XFed 0.00024 0.00033 -0.00244*** 0.00089*** 0.00032***
(0.00073) (0.00036) (0.00048) (0.00021) (0.00010) Year2002XFed 0.00121 0.00045 -0.00269*** 0.00089*** 0.00020**
(0.00077) (0.00037) (0.00051) (0.00024) (0.00009)
Year2003XFed 0.00157* 0.00057 -0.00300*** 0.00093*** 0.00042*** (0.00082) (0.00039) (0.00054) (0.00026) (0.00010)
Constant 0.45522*** 0.06144*** 0.04165*** 0.00713*** 0.00349***
(0.00116) (0.00052) (0.00049) (0.00024) (0.00020) Observations 1,011,729 1,011,729 1,011,729 1,011,729 1,011,729
Number of firms 123,511 123,511 123,511 123,511 123,511 Adjusted R-squared 0.100 0.015 0.102 0.046 0.000
Note: All models include controls for firm size, corporate structure, share of white collar non-clerical employees, firm fixed effects, year fixed
effects, region-specific time effects, and industry-specific time effects. Robust standard errors clustered by firm are in parentheses. *, **, ***
indicate significance at the 10%, 5% and 1% levels, respectively.