Embed Size (px)
Citation preview
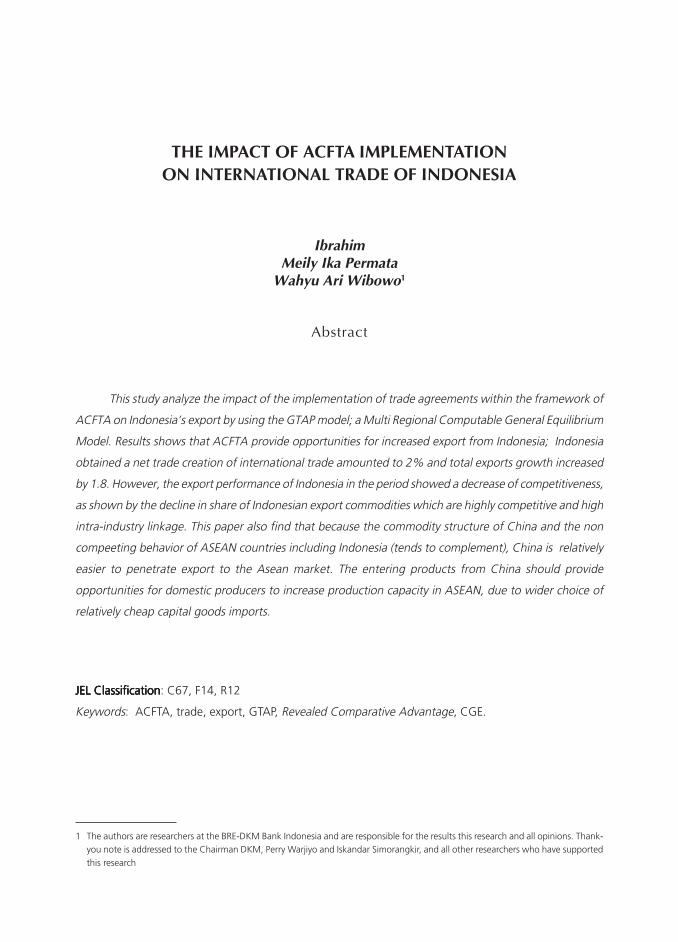
23The Impact of ACFTA Implementation on International Trade of Indonesia
THE IMPACT OF ACFTA IMPLEMENTATIONON INTERNATIONAL TRADE OF INDONESIA
IbrahimMeily Ika Permata
Wahyu Ari Wibowo1
This study analyze the impact of the implementation of trade agreements within the framework of
ACFTA on Indonesia»s export by using the GTAP model; a Multi Regional Computable General Equilibrium
Model. Results shows that ACFTA provide opportunities for increased export from Indonesia; Indonesia
obtained a net trade creation of international trade amounted to 2% and total exports growth increased
by 1.8. However, the export performance of Indonesia in the period showed a decrease of competitiveness,
as shown by the decline in share of Indonesian export commodities which are highly competitive and high
intra-industry linkage. This paper also find that because the commodity structure of China and the non
compeeting behavior of ASEAN countries including Indonesia (tends to complement), China is relatively
easier to penetrate export to the Asean market. The entering products from China should provide
opportunities for domestic producers to increase production capacity in ASEAN, due to wider choice of
relatively cheap capital goods imports.
JEL ClassificationJEL ClassificationJEL ClassificationJEL ClassificationJEL Classification: C67, F14, R12
Keywords: ACFTA, trade, export, GTAP, Revealed Comparative Advantage, CGE.
1 The authors are researchers at the BRE-DKM Bank Indonesia and are responsible for the results this research and all opinions. Thank-you note is addressed to the Chairman DKM, Perry Warjiyo and Iskandar Simorangkir, and all other researchers who have supportedthis research
Abstract
24 Bulletin of Monetary, Economics and Banking, July 2010
1. INTRODUCTION
The development of international trade leads to more liberal forms of trade that are
accompanied by various forms of bilateral, regional and multilateral cooperation. One of the
main objectives of international trade agreements is to reduce or eliminate trade barriers.
Liberalization of world trade, with the pattern of international cooperation, provide a positive
implication on the growth of world economy. The value of world trade grew more than twice
the growth in gross domestic product (GDP) of real world (Krueger, 1999).
In the mid-1980s, preferential trading arrangements (PTA), developed as a complement
to international cooperation. In contrast to international cooperation, PTA involves two or more
countries. Based on the theory of PTA, as described by Kemp (1964) and Vanek (1965), the
impact of two or more countries that make up a custom unions (common external tariff) is the
growing prosperity of the countries that joined the union and it does not cause any decline on
the welfare of countries outside the union. This is proved in a study by Ohyama (1972) and
Kemp and Wan (1976). Rather than setting a common external tariff, a more developed pattern
of PTA is the elimination of intra-trade barriers or more familiar known as the free trade agreement
(FTA). Some FTAs that have been running are the North American Free Trade Area (NAFTA), the
European Economic Area (EEA), the African Free Trade Zone (AFTZ) and the South Asia Free
Trade Agreement (SAFTA).
Likewise with Indonesia which has agreed on trade cooperation both bilaterally, regionally
and internationally. Although Indonesia»s involvement in these various trade cooperation causes
a challenge to domestic products, the goal of these agreements are provide positive impact to
the economy of the countries involved and to economy of Indonesia in particular.
Related to the regional area, Indonesia joined the ASEAN Free Trade Area (AFTA) which
was signed on January 28, 1992. In its development, the cooperation extended to involve
other countries including China, known as the ACFTA. In particular, the involvement of Indonesia
in ACFTA need for further observed. This is related to many factors such as the readiness of
domestic products to encounter the rush of imported goods from China and the ASEAN market
that is potentially reduced for domestic products. Many literatures and existing studies have
widely reviewed the impact of ACFTA by various dimensions and analysis tools. This research is
expected to become one of the complementary study on the impact of ACFTA with new added
value. Thus, information associated with the study of ACFTA market trading will be more
complete.
The objective of this paper are (i) To contribute to the study of external sector, particularly
the international trade of Indonesia, (ii) To provide an understanding of Indonesia»s trade structure,
25The Impact of ACFTA Implementation on International Trade of Indonesia
especially within the scope of the ASEAN-China region, (iii) To measure the impact of the
implementation of ACFTA towards, on generally, the member countries in terms of agreements
on international trade, and for Indonesia in particular, and (iv) To map the opportunities and
challenges presented by the characteristics of Indonesian exports. Many opportunities are
associated with the opening of Chinese markets for export commodities of Indonesia. Yet
challenges also emerge with China competing in the ASEAN market.
The impact of ACFTA trade on the Indonesian economy covers many aspects that can be
further development of analysis such as GDP, employment, investment, inflation and international
trade. To provide added value on the existing ACFTA topics, this study will focus on ACFTA
impact on Indonesia»s exports. Analysis of various indicators of performance and characteristics
of Indonesian exports are specifically addressed to ACFTA market coverage.
In terms of analysis tool, we will only review the results of GTAP model that are related to
the trading impact of Indonesia»s export, especially with trading partner countries of ACFTA
region. Based on the results of the GTAP model, further analysis will be carried out either by
using analytical tools for international trade indicators such as the RCA, IIT, IES, IEO.
The second part of this paper will describe the empirical ground and literature review on
trade and economic balance, the third part covers the methodology, the fourth section discusses
the results and interim analysis, while conclusions and implications will wrap the paper.
II. EMPIRICAL GROUND AND LITERATURE REVIEW
II.1. The Basic Model of International Trade
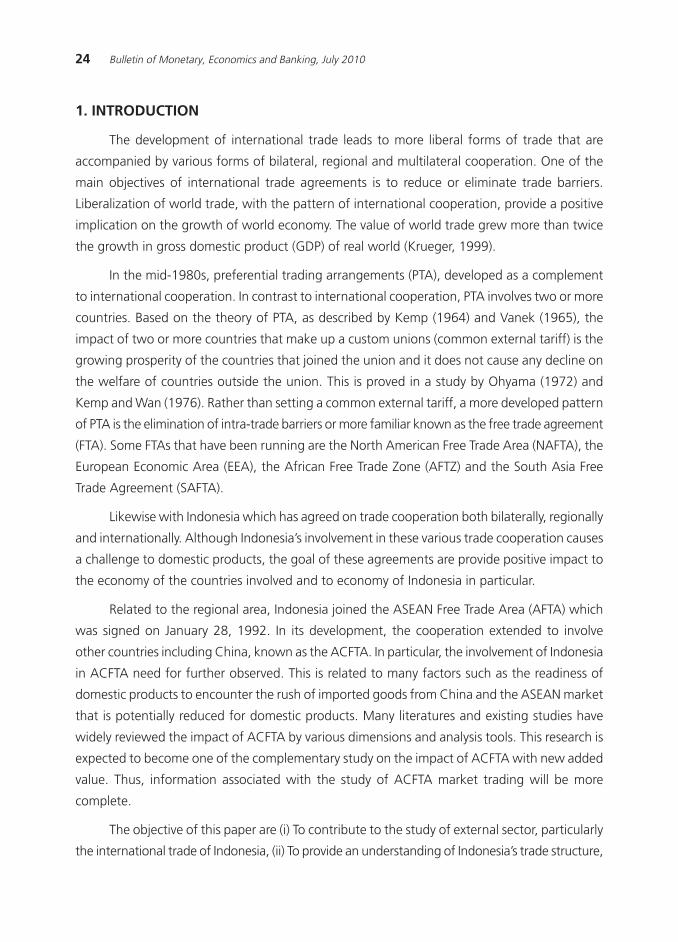
The economy of a country is an aggregation of the behavior of each individual. The
balance of goods in one country can be explained based on the interaction of profit maximization
behavior of producers and utility maximization of consumers. In a closed economy (autarky), in
equilibrium (point A), the composition of goods and prices of goods is the result of the interaction
mechanism of aggregate demand and aggregate supply in the country (Figure III.1).
Aggregate supply is strongly influenced by the available factors of production (endowment)
and the level of productivity, represented by the production and technology function. In the
other hand the aggregate demand curve is strongly influenced by the level of consumer utility
(U) and available consumption baskets. The level of production, consumption and the level of
consumer utility depend on the endowment and type of products available in the economy.
Manufacturers only have the option to produce a collection of specific types of product and try
to maximize profits based on the available endowment and production function. On the other
26 Bulletin of Monetary, Economics and Banking, July 2010
hand, consumers can only maximize utility by consuming a combination of product types
manufactured domestically and indirectly, the level of utility will be very limited.
Endowment differences between countries, as well as different levels of production and
technology and the types of products cause large variations in the type of product produced
between countries. And differences in tastes and individual utility level among countries will
imply on a high demand of variation of consumption basket desired by consumers within the
region. In a broader scope and in line with the era of globalization, the economy is no longer
limited to the scope of a country but it has evolved and crossed the border. The corporates»
profit maximization and consumers» utility maximization are no longer limited in national scope
but as well as inter-nations scope.
In the open economy equilibrium model, there are opportunities to maximize the profits
by expanding into foreign markets and by producing goods exceeding the domestic demand.
On the other hand, consumers also have the opportunity to maximize utility by consuming a
certain product types exceeding the domestic supply or by consuming a more diverse product
types, not just limited to the types of products within the country. Both of the above mentioned
will eventually drive the exchange of goods between countries.
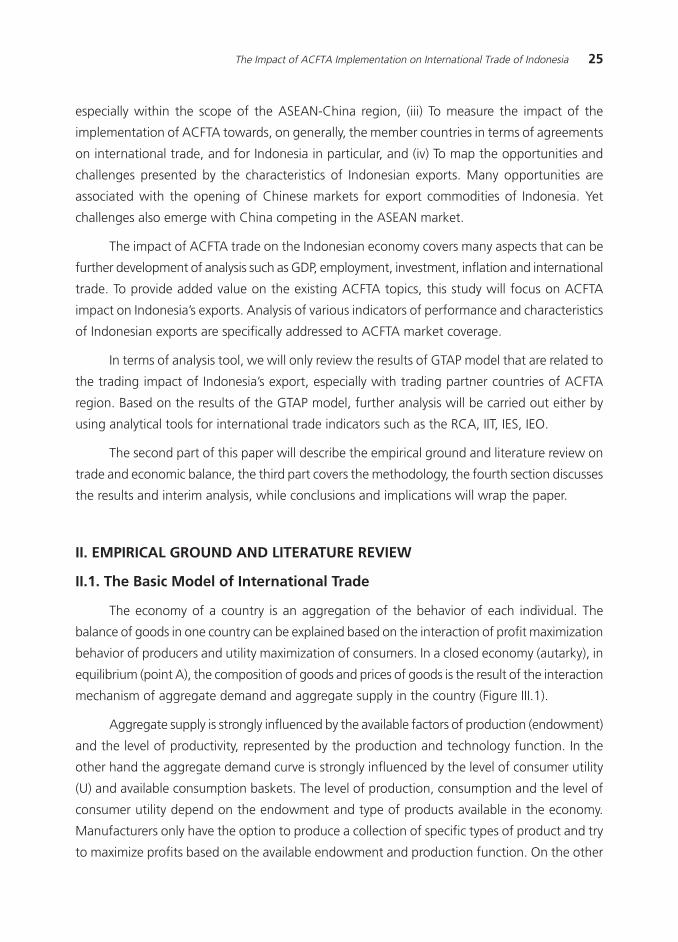
The results from the interaction of individuals in a certain country with individuals in
other country will lead to the exchange of goods, services, and factors, which is commonly
known as international trade, that caused a shift in the balance of the beginning (point A)
toward the balance on the basis of international trade (point C) (Figure III.2). Excess demand for
product x (xc-xp) can be met by imports from other countries so that consumers can choose a
basket of consumption that generate a higher level of utility, which is point C. The production
Figure III.1: The Equilibrium Modelof Closed Economy (Autarky)
Source : Markusen et al, International Trade and Evidence
A
Y
ap
aU
X
Y
X
27The Impact of ACFTA Implementation on International Trade of Indonesia
of product y that exceeds domestic demand is a surplus and will be exported in international
market. In other words, international trade is the exchange of goods, services and factors that
occur between countries or one that has passed the national/international boundaries.
Theoretically at least there are 5 advantages from trade. The first advantage is the benefits
from the exchange. By trading, a country can produce a product exceeds its domestic demand
and export the surplus (excess supply) on international markets that will eventually expand the
market and increase profitability. On the other hand, excess demand for a product can be met
by imports from other countries so that consumers can choose a basket of consumption that
generates a higher level of utility.
The second advantage is the benefits of the specialization. By trading, a country can be
more focused on one type of product which they can produce with a relatively high level of
efficiency. While the need for a product that can not be efficiently produced domestically can
be met by importing these products from other countries.
The third advantage, that can be gained from trade, is associated with the diversity of
individual preferences. The existence of trade provides more choices of products to consumers
which will assist in the fulfillment and even can raise the level of consumer utility.
The fourth advantage is associated with diversity of endowment owned by a country. By
trading, a country that prior trading did not have any or very limited access to any type of
product, will have the demand fulfilled. The fifth advantage that might be achieved is the
transfer of modern technology. With international trade, a country will have the opportunity to
learn a more efficient and modern production techniques.
Figure III.2:The Equilibrium Model of Open Economy
Source : Markusen et al, International Trade and Evidence
Q
X
Y
C
Y
*p
X
pY
cY
pX cX
28 Bulletin of Monetary, Economics and Banking, July 2010
The literatures state that a country will tend to export a product that is abundant
domestically or in other words will tend to export a product that excess supply. On the other
hand, the Ricardian model predicts that a country will focus the production on the type of
product that has the highest comparative advantage.
Heckscher-Ohlin theorem states that a country will tend to export commodities that intensively
use the abundant factor of production. For example, a country with abundant labor but with a
limited level of capital will tend to export products that are labor intensive and will tend to import
products that are capital intensive. Differences in the production function of a country will also
contribute to determine the direction of the country»s trade. A country that can produce relatively
more efficiently in a type of product will tend to become exporter of this products.
In fact, free trade does not literally take place freely. Barriers to trading can take the form
of tariff and non-tariff. Tariff setting has influence over the balance of output and prices. Such
constraints may lead to higher prices resulting in reduced demand for goods from abroad,
according to the demand-supply mechanism.
As an illustration, the increase in import tariffs may cause the price of imported goods
become relatively more expensive and reduce demand for the goods. This provides an incentive
for domestic production of goods. On the other hand, export subsidies cause the price of
domestically produced goods to become relatively cheaper and will increase the demand from
overseas markets.
II.2. The Theories of International Trade Coorporation
With the liberalization of trade in both international and regional scope, trade barriers
can be reduced and even be eliminated. Regional economic integration is a process where
several economies in the region agreed to remove barriers and ease the traffic flow of goods,
services, capital and labor. Reduction or even elimination of tariff and non tariff barriers will
accelerate regional economic integration as the traffic of goods, services, capital and labor
getting smoother.
Regional free trade or arrangement is expected to generate efficiencies and improve
welfare. It cannot be denied that trade arrangement would also increase competition among
the members. But if it is addressed wisely, there are benefits that can be gained among others,
which are the increasing specialization and the increased trade. With the comparative advantage
of each country, each country can focus on the production of goods that have a comparative
advantage that will trigger reallocation of production factors. In the end it will create a balance
of lower prices and greater output that will provide greater prosperity to the countries involved.
29The Impact of ACFTA Implementation on International Trade of Indonesia
Many studies conclude that free trade has a positive impact for the countries involved. In
addition to improving welfare (Kindleberger and Lindert, 1978), free trade will also increase the
quantity and efficiency of world trade (Hadi, 2003; Stephenson, 1994). Urata and Kiyota (2003)
found that the FTA in East Asia provide a positive influence on the economy. Exports with high
competitiveness will increase. The study of Saktyanu et al. (2007) showed that a decrease of
export subsidies in developed countries have an impact on increasing agricultural production
of Indonesia. In contrast to the results of most studies that generally state the positive impacts,
Haryadi et al. (2008) show that trade liberalization, by removing all trade barriers, causes a
reducing impact at the GDP of Indonesia and Australia-New Zealand.
One indicator to measure the impact of international trade arrangement is to look at the
occurrence of trade diversion and trade creation (Vinerian, 1950; Krueger, 1990). The positive
effects of trade creation is the occurrence of trade due to the shift of consumption of domestic
products which are high-cost to imported products from abroad which are low-cost (Vinerian,
1950); in other words the trade is increased among intra-country trade partners. However,
along with the difference in tariffs applied to partners and non-partners, it will change the
direction of trading trend, and impose negative effects of trade diversion, which refers to the
replacement of imported products that are low-cost from non-member countries with imported
products that are high-cost from partner countries (Vinerian, 1950). In other words there is a
decline of trade with the non-partner countries. Trade diversion would reduce the welfare
effects due to changes in supply orientation to a source that is relatively more expensive.
Benefits of free trade or regional cooperation are very much determined by one of the
more dominant effect. The overall effect can be positive, negative or neutral, it depends on the
size of the magnitude of trade creation and trade diversion. Free trade or the PTA would be
very advantageous if the impact on trade creation is greater than the impact on trade diversion.
Studies conducted by Lee and Shin (2006) confirmed that RTA will increase the trade between
its members. However, there was no significant decrease in trade between the RTA of members
and non-members countries. Even in some of the RTAs, trade among member and non-members
countries have increased. Despite the trade creation and trade diversion, RTA gives an overall
positive impact on trade.
II.3. Agreements on ASEAN China Free Trade Area (ACFTA)
Trade between ASEAN countries and China continues to show improvement from year
to year. For ASEAN countries, China is a major trading partners as an export destination. The
average share of exports to China by ASEAN countries from 2001-2008 varies but generally
30 Bulletin of Monetary, Economics and Banking, July 2010
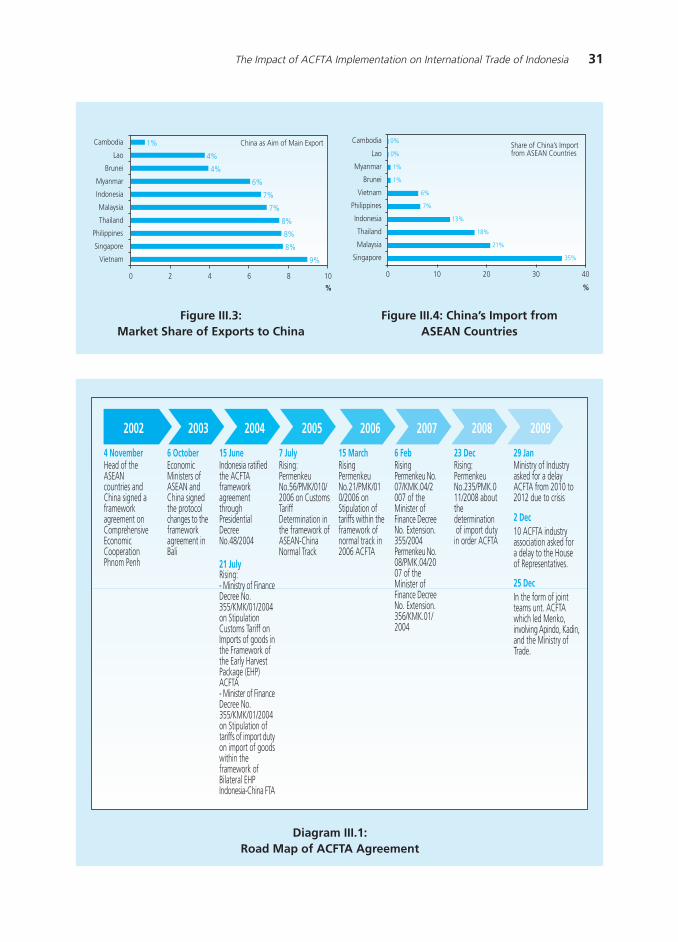
quite high. Vietnam as a country that puts China as a major trading partner with the highest
share of 9%, while the Indonesian share of exports to China is recorded at 7% (Figure III.3). For
China, ASEAN countries became an important trading partner especially for the supply of raw
materials. The share of China»s imports from Singapore recorded 35% of total imports from
ASEAN or the highest market share among other Asean countries (Figure III.4). The share of
imports of goods from Indonesia is amounted to 13% of total imports from ASEAN. Trade
between ASEAN and China have a tendency to continue to rise which show the relative
importance of ASEAN-China trade for both sides. Thus, the potential gains from removing
trade barriers between ASEAN-China region will be relatively large.
The awareness on how important the role of each party, will raise the consciousness to
pioneer an agreement of economic cooperation. On November 4, 2002, an agreement of
cooperation framework emerged which is often called the ≈Framework Agreement on
Comprehensive Economic Cooperation∆. Within the framework, it was agreed that the free
trade formation for goods would take place in 2004, the service sector in 2007, and investment
in 2009. In terms of readiness for ASEAN, the free trade also applies gradually. Free trade will
be commenced in 2010 between China and ASEAN-6 which includes Indonesia, Singapore,
Thailand, Malaysia, Philippines, and Brunei. While in 2015, it will apply to China with ASEAN-
4: Cambodia, Vietnam, Laos, and Myanmar. Several issues related to the development of ACFTA,
especially in Indonesia, are shown in Diagram III.1.
From literature studies, among others by Park et al (2008), that analyzed the advantages
and prospects of ACFTA and revealed that ACFTA, which consists of 11 economies with a quite
large total population and GDP; it is possible for ACFTA to become an effective regional economic
cooperation. Relatively large intra-region tariff level is also the potential to increase trade creation.
Although China and ASEAN have sought to liberalize commerce, in fact, the level of tariffs and
barriers between them was still quite high, allowing the trade creation to take place. China
imposes tariffs on average by 9.4% for goods from ASEAN. In contrast, ASEAN nations imposed
tariffs on goods from China in average of 2.3%.
But it can not be denied that along the opportunities, there are the challenges with the
enactment of ACFTA. The biggest challenge is the raising product competition. Fear of inability
to compete in domestic market against the rushing flow of imported products from China and
the fear of inability to penetrate China»s wide open-potential market, is a challenge which, if
managed wisely, can turn into a potential opportunity. Yue (2004) takes the increase in intra-
industry trade in machinery and electrical equipment as an example of the impact of increased
trade ACFTA that considered quite successful. There are numerous studies that have considered
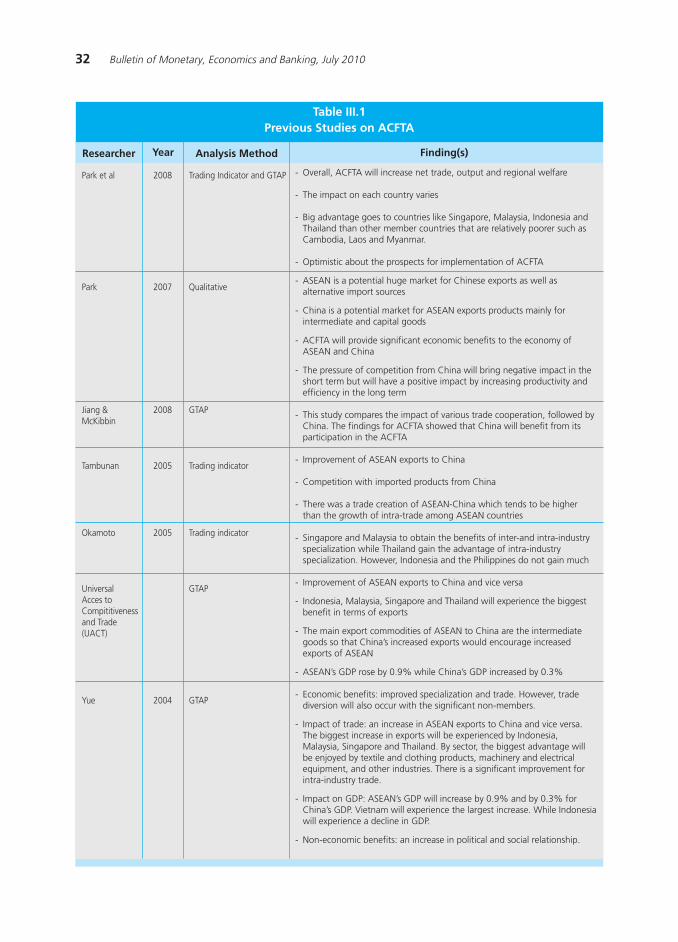
the impact of ACFTA trade, as shown in Table III.1.
31The Impact of ACFTA Implementation on International Trade of Indonesia
Figure III.3:Market Share of Exports to China
Figure III.4: China»s Import fromASEAN Countries
Diagram III.1:Road Map of ACFTA Agreement
9%
8%
8%
8%
7%
7%
6%
4%
4%
1%
0 2 4 6 8 10
%
Vietnam
Singapore
Philippines
Thailand
Malaysia
Indonesia
Myanmar
Brunei
Lao
Cambodia China as Aim of Main Export
Singapore
Malaysia
Thailand
Indonesia
Philippines
Vietnam
Brunei
Myanmar
Lao
Cambodia
35%
21%
18%
13%
7%
6%
1%
1%
0%
0%
0 10 20 30 40
%
Share of China»s Importfrom ASEAN Countries
Head of theASEANcountries andChina signed aframeworkagreement onComprehensiveEconomicCooperationPhnom Penh
4 NovemberEconomicMinisters ofASEAN andChina signedthe protocolchanges to theframeworkagreement inBali
6 OctoberIndonesia ratifiedthe ACFTAframeworkagreementthroughPresidentialDecreeNo.48/2004
15 June
Rising:- Ministry of FinanceDecree No.355/KMK/01/2004on StipulationCustoms Tariff onImports of goods inthe Framework ofthe Early HarvestPackage (EHP)ACFTA- Minister of FinanceDecree No.355/KMK/01/2004on Stipulation oftariffs of import dutyon import of goodswithin theframework ofBilateral EHPIndonesia-China FTA
21 July
Rising:PermenkeuNo.56/PMK/010/2006 on CustomsTariffDetermination inthe framework ofASEAN-ChinaNormal Track
7 JulyRisingPermenkeuNo.21/PMK/010/2006 onStipulation oftariffs within theframework ofnormal track in2006 ACFTA
15 MarchRisingPermenkeu No.07/KMK.04/2007 of theMinister ofFinance DecreeNo. Extension.355/2004Permenkeu No.08/PMK.04/2007 of theMinister ofFinance DecreeNo. Extension.356/KMK.01/2004
6 FebRising:PermenkeuNo.235/PMK.011/2008 aboutthedetermination of import dutyin order ACFTA
23 DecMinistry of Industryasked for a delayACFTA from 2010 to2012 due to crisis
29 Jan
10 ACFTA industryassociation asked fora delay to the Houseof Representatives.
2 Dec
In the form of jointteams unt. ACFTAwhich led Menko,involving Apindo, Kadin,and the Ministry ofTrade.
25 Dec
2002 2003 2004 2005 2006 2007 2008 2009
32 Bulletin of Monetary, Economics and Banking, July 2010
Table III.1Previous Studies on ACFTA
- Overall, ACFTA will increase net trade, output and regional welfare
- The impact on each country varies
- Big advantage goes to countries like Singapore, Malaysia, Indonesia andThailand than other member countries that are relatively poorer such asCambodia, Laos and Myanmar.
- Optimistic about the prospects for implementation of ACFTA
- ASEAN is a potential huge market for Chinese exports as well asalternative import sources
- China is a potential market for ASEAN exports products mainly forintermediate and capital goods
- ACFTA will provide significant economic benefits to the economy ofASEAN and China
- The pressure of competition from China will bring negative impact in theshort term but will have a positive impact by increasing productivity andefficiency in the long term
- This study compares the impact of various trade cooperation, followed byChina. The findings for ACFTA showed that China will benefit from itsparticipation in the ACFTA
- Improvement of ASEAN exports to China
- Competition with imported products from China
- There was a trade creation of ASEAN-China which tends to be higherthan the growth of intra-trade among ASEAN countries
- Singapore and Malaysia to obtain the benefits of inter-and intra-industryspecialization while Thailand gain the advantage of intra-industryspecialization. However, Indonesia and the Philippines do not gain much
- Improvement of ASEAN exports to China and vice versa
- Indonesia, Malaysia, Singapore and Thailand will experience the biggestbenefit in terms of exports
- The main export commodities of ASEAN to China are the intermediategoods so that China»s increased exports would encourage increasedexports of ASEAN
- ASEAN»s GDP rose by 0.9% while China»s GDP increased by 0.3%
- Economic benefits: improved specialization and trade. However, tradediversion will also occur with the significant non-members.
- Impact of trade: an increase in ASEAN exports to China and vice versa.The biggest increase in exports will be experienced by Indonesia,Malaysia, Singapore and Thailand. By sector, the biggest advantage willbe enjoyed by textile and clothing products, machinery and electricalequipment, and other industries. There is a significant improvement forintra-industry trade.
- Impact on GDP: ASEAN»s GDP will increase by 0.9% and by 0.3% forChina»s GDP. Vietnam will experience the largest increase. While Indonesiawill experience a decline in GDP.
- Non-economic benefits: an increase in political and social relationship.
Researcher Finding(s)Analysis Method
Park et al 2008 Trading Indicator and GTAP
Park 2007 Qualitative
Jiang & 2008 GTAPMcKibbin
Tambunan 2005 Trading indicator
Okamoto 2005 Trading indicator
Universal GTAPAcces toCompititivenessand Trade(UACT)
Yue 2004 GTAP
Year
33The Impact of ACFTA Implementation on International Trade of Indonesia
III. METHODOLOGY
III.1. Computable General Equilibrium Model
There are several approaches in the study of world trade, which two of the classifications
are the general equilibrium and partial models. General equilibrium theory explains the linkages
of the entire market mechanism as a system that interacts simultaniously. If the market, in the
equilibrium condition, changes or if there is any partial interference on the market, then there
will be adjustments in the relevant market and other markets. One model that is often used in
various studies is the General Trade Analysis Project (GTAP), a Computable General Equlibrium
(CGE) model developed by Purdue University.
CGE model is often used for the industrial, trade and fiscal sector2 . In this model,
production factors market conditions and market of production output are in equilibrium. The
primary basis of the CGE model is an understanding on how the economy works and then the
usage of the data in accordance with the developed model.
In this GTAP model, the economy is assumed to be in general equilibrium state, where all
agents in the economy do not have the ability to influence prices or act as a price taker, so the
price, that is entirely formed, is the interaction between demand and supply. Implicitly this
assumes that every market is in the perfect competition (competitive) condition and this approach
is widely referred as the Walrasian General Equilibrium
The general equilibrium in the CGE model is reflected in nominal terms (quantity multiplied
by price) that represent the flow of funds, either accompanied by the flow of goods (transaction)
or not (transfer). The CGE model consists of equations representing the balance of the entire
market, from the input markets to output markets for the whole sectors that are analyzed. The
CGE model also explicitly models the rational behavior of economic agents like producers who
tend to maximize their profits, households who maximize the satisfaction (utility) and other
economic agents. Included in this CGE model is the specification of the specification that is
related with the flow of funds between agencies, and other equations that define the formation
of price and quantity. Overall, the CGE model is a set of mathematical equations that can be
solved simultaneously.
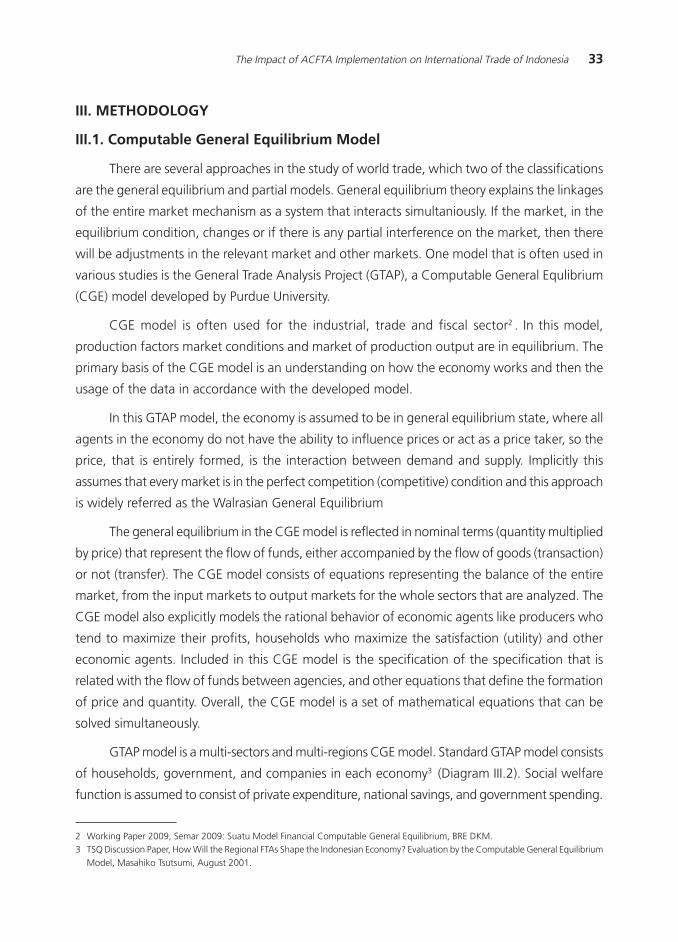
GTAP model is a multi-sectors and multi-regions CGE model. Standard GTAP model consists
of households, government, and companies in each economy3 (Diagram III.2). Social welfare
function is assumed to consist of private expenditure, national savings, and government spending.
2 Working Paper 2009, Semar 2009: Suatu Model Financial Computable General Equilibrium, BRE DKM.3 TSQ Discussion Paper, How Will the Regional FTAs Shape the Indonesian Economy? Evaluation by the Computable General Equilibrium
Model, Masahiko Tsutsumi, August 2001.
34 Bulletin of Monetary, Economics and Banking, July 2010
Savings is considered as a proxy of the delayed consumption. Under the regional income
constraint, principal agents are to maximize their welfare.
Like the other CGE models. the GTAP standard model provides the specification of various
theories and the behaviour of agents, explicitly in the form of mathematical equation. Selection
of functional form refers to two main things, (i) the suitability of the theory, and (ii) empirical
facts, and (iii) the need for research. One form of the function (henceforth we refer as nesting),
which is often used, is a Cob-Douglas function where the parameter that indicates the proportion
of the forming components assumed to be fixed. If the relative price of a commodity changes,
the user √ let say for consumption - will also experience changes to maintain the nominal
proportion in accordance with the amount of the which was previously determined (relative
share).
Diagram III.2:Agen Blocks in GTAP Model
Consumption expenditure consists of a variety of tradable commodities in the model.
The households determine their demands for each commodity based on three factors: relative
price, minimum consumption, and income level. This demand system called the Constant
Difference elasticity (CDE). On the other hand, government spending on individual commodities
is still formulized under the Cob-Douglas function.
Commodities are produced by both domestic and foreign producers. Both party then
later combined in a bundle of commodities which is a composite of domestic and import
Source: A Graphical Exposition of GTAP Model, Brockmeier, 1996
World / ROW
PrivateHousehold
Producent
Government
RegionalHousehold
Global Saving
VIPAVIGA
TAXES
SAVE
TAXES
PRIVEXP GOVEXP
XTAX TAXES
VDPA
NETINV
VOAMTAX
VDGA
VIFAVDFA
VXMD
35The Impact of ACFTA Implementation on International Trade of Indonesia
products. In the GTAP model, the composition of both products follows the Constant Elasticity
Substitute (CES) function. This import-domestic demand system is proposed by Armington
(1969) that allows the modeler to change elasticity of substitution between domestic and
import products depend on the experiments.
The companies are assumed to maximize their revenues. In the process of production,
labor, capital, land form the composite of primary input to follow the form of the CES nesting,
thus allowing the substitution of the three primary inputs. This is consistent with the theory
and empirical facts in which a sector can switch from labor-intensive to capital-intensive or
otherwise.
The composite of primary input is then combined with the intermediate input within the
nesting that takes form as a Leontief function. These specifications are clearly required to
maintain the complementarity between primary inputs with the intermediate inputs as it is
difficult to imagine if labor can be replaced, let say, by cooking oil in the production process in
hotels and restaurants sector, for example. Land is immobile while the labor and capital are
mobile within the industry. In this standard model of GTAP, the international mobility of
endowments is not allowed.
Saving in each country is carried out (collected) by a fiction institution, that is, global
banks and is allocated as a source of finance for investment. How to connect a savings to
investment depends on the theories and the empirical facts that can be altered based on the
purpose of the research.
In general, any question proposed in a research must be translated into a simulation
model. This simulation setting is critical and one of the important components is the closure,
which is the division of variables to be placed as an endogenous or exogenous variables. This
closure greatly affect the interest and the simulation results, one of them is to restrict whether
the dimension of this simulation is short-term (one of which is marked by the fixed sectored
capital) or long term.
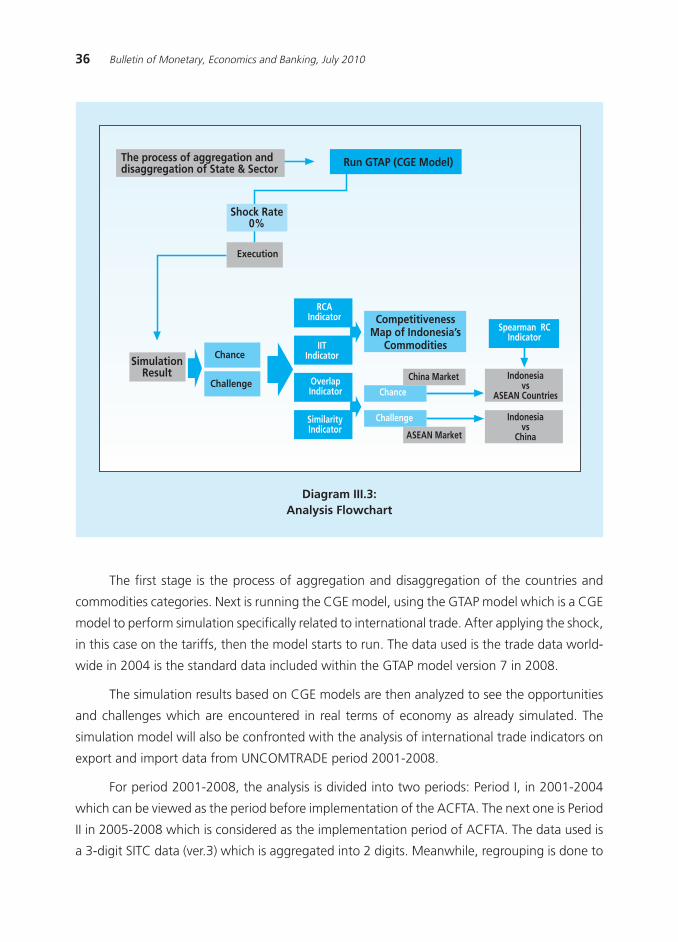
III.2. Analysis Flow
This research aims to measure the impact of international trade ACFTA for Indonesia and
how they impact on Indonesia»s export commodities. Related to this, described in this section is
the analysis flow performed as shown in Diagram III.3.
36 Bulletin of Monetary, Economics and Banking, July 2010
Diagram III.3:Analysis Flowchart
The first stage is the process of aggregation and disaggregation of the countries and
commodities categories. Next is running the CGE model, using the GTAP model which is a CGE
model to perform simulation specifically related to international trade. After applying the shock,
in this case on the tariffs, then the model starts to run. The data used is the trade data world-
wide in 2004 is the standard data included within the GTAP model version 7 in 2008.
The simulation results based on CGE models are then analyzed to see the opportunities
and challenges which are encountered in real terms of economy as already simulated. The
simulation model will also be confronted with the analysis of international trade indicators on
export and import data from UNCOMTRADE period 2001-2008.
For period 2001-2008, the analysis is divided into two periods: Period I, in 2001-2004
which can be viewed as the period before implementation of the ACFTA. The next one is Period
II in 2005-2008 which is considered as the implementation period of ACFTA. The data used is
a 3-digit SITC data (ver.3) which is aggregated into 2 digits. Meanwhile, regrouping is done to
SimulationResult
Chance
Challenge
The process of aggregation anddisaggregation of State & Sector Run GTAP (CGE Model)
Shock Rate0%
Execution
RCAIndicator
IITIndicator
OverlapIndicator
SimilarityIndicator
CompetitivenessMap of Indonesia»s
Commodities
Chance
Challenge
China Market
ASEAN Market
Indonesiavs
ASEAN Countries
Indonesiavs
China
Spearman RCIndicator
37The Impact of ACFTA Implementation on International Trade of Indonesia
equilize the commodity code between GTAP version with the version of SITC to achieve
compability of these two tools. Conversion from SITC commodity groups to the GTAP is using
primary reference presented in the GTAP website.
III.3. Setting of GTAP Model Simulation
Generally, closures that are used in the simulation follow the standard GTAP closure,
which are:4
1. Price and quantity variable of tradable commodities across countries that are not included
in the category of endowment commodities, are treated as endogenous variable.
2. Revenue from each region is endogenous.
3. All policy variables, productivity (technical changes) and populations are treated as exogenous
In simulating the impact of ACFTA implementation on international trade of ASEAN in
general and Indonesia in particular, particularly related to exports, the shocks applied are:
1. The tariffs applicable between the ASEAN countries with China is 0% (not applicable).
2. ACFTA member countries still impose tariffs on the non ACFTA member (rest of the world,
ROW).
3. Vice versa, ROW charges against members of ACFTA
III.4. Correlation Test on International Trading Indicator
Based on the previous GTAP model simulation results, to view the competitiveness map
of Indonesia and the challenges and opportunities encountered as the result of the establishment
of a forum for international trade, ACFTA, for international trade in Indonesia, the analysis is
resumed by using several trading indicators: (i) Revealed Comparative Advantage (RCA), ( ii)
Intra-Industry Trade (IIT), (iii) Index of Export Overlap (IEO), and (iv) Index of Export similarities
(IES).
Indicators of international trade are used to provide clarification and additional information
on the findings by GTAP. The trade indicators also complement the results of research because
they can provide information on the performance of Indonesia»s export commodities in greater
detail.
On the RCA indicators, we conducted Spearman»s rank correlation coefficient (SRC) which
is a statistical measure of non-parametric and can be calculated by the following formula:
4 The setting of this simulation is available by the author.
38 Bulletin of Monetary, Economics and Banking, July 2010
This test is needed to see if there are similarities on competitiveness rankings of the two
countries in pairs that were observed. Signs of the SRC indicate the direction of the relationship
between independent variable X and dependent variable Y. The value of SRC is between 0 and
1 that when X and Y perfectly monotonically related, then the SRC will be 1.
A. Revealed Comparative Advantage (RCA)
To see the competitiveness of export products, the indicator used is the Revealed
Comparative Advantage (RCA) indicator where if RCA> 1, it indicates the existence of
comparative advantage.
RCA = (Xij / Xj) / (Xi
w / X
w)
where:
Xij = exports of commodity i of country j
Xj = total exports of country j
Xiw = world exports of commodity i
Xw = total world exports
B. Intra Industry Trade (IIT)
To see the flow of international trade we use the indicator of Intra-Industry Trade, or also
often called the Grubel-Lloyd index (IIT). Based on the formula, the indicator is in a value
between 0 and 1. IIT that is approaching 0 reflects trade flows that are inter-industry, while if IIT
is approaching 1, it indicates that trade flows are intra-industry. In general, this indicator explains
that, a commodity of a country tends to have be related in the chain of international trade if
value is close to 1. This can be illustrated with export and import trade of a country for
manufacturing industry in the same group of goods (usually refers to groups of goods according
to SITC). A country can export electronic components and at the same time import of electronic
articles. On the other hand, for the trade of certain commodities such as natural resource-
based commodities such as oil and gas, a country tends to act as an exporter and do limited or
no import at all. If this happens then, the value of oil and gas commodity IIT is close to 0, or that
the trade is inter-industry.
(III.1)Σi i i
i i i i
ρ( (( (
) )) )
x x y y
Σi x x y y 22=
Σ
39The Impact of ACFTA Implementation on International Trade of Indonesia
To measure the IIT level, then the Grubel and Llyod is used as follow:
(III.2)
Where:
X(i,j,t) is the export value of commodity i of country j in year t
M(i,j,t) is the import value of commodity i of country j in year t
The calculation here is using 3 digit-SITC data classification of commodity i which is then
aggregated into 2 digits. In the GLI calculation there is a tendency that the more detailed data
of commodities, the smaller the value of GLI will become. Referring to previous studies, this
research also uses 2 digits considering that it is sufficient to identify the IIT process in ACFTA
countries
C. Index of Export Overlap (IEO)
To measure the level of each ASEAN country competition with China in trade ACFTA and
also the level of competition among ASEAN countries in utilizing the export opportunity to
China, the index of export overlap (IEO) is used. The equation of overlapping index is expressed
by this equation:
GLI ( j,t ) =Σi X ( i, j, t )( + M ( i, j, t ) − X ( i, j, t ) M ( i, j, t )−
Σi X ( i, j, t )( M ( i, j, t )− )
IEO ( j1, j
2, t ) = 100 x Σ min (X (i, j
1, t), X (i, j
2, t) /
t tΣ X ( i, j
1, t )
IEO size is used to measure the level of competition which is indicated by the export share
that overlap between total export of the two economies. The greater the overlap area (area b)
indicates a greater competition between the two countries. The index ranged from 100 which
means the full overlap and 0 which means no overlap.
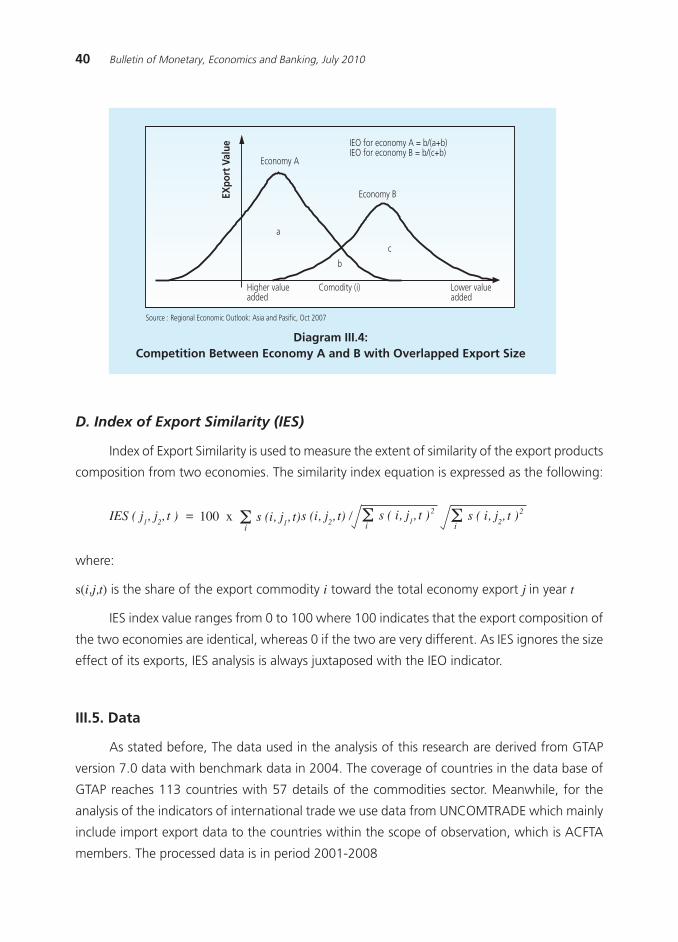
40 Bulletin of Monetary, Economics and Banking, July 2010
Diagram III.4:Competition Between Economy A and B with Overlapped Export Size
D. Index of Export Similarity (IES)
Index of Export Similarity is used to measure the extent of similarity of the export products
composition from two economies. The similarity index equation is expressed as the following:
where:
s(i,j,t) is the share of the export commodity i toward the total economy export j in year t
IES index value ranges from 0 to 100 where 100 indicates that the export composition of
the two economies are identical, whereas 0 if the two are very different. As IES ignores the size
effect of its exports, IES analysis is always juxtaposed with the IEO indicator.
III.5. Data
As stated before, The data used in the analysis of this research are derived from GTAP
version 7.0 data with benchmark data in 2004. The coverage of countries in the data base of
GTAP reaches 113 countries with 57 details of the commodities sector. Meanwhile, for the
analysis of the indicators of international trade we use data from UNCOMTRADE which mainly
include import export data to the countries within the scope of observation, which is ACFTA
members. The processed data is in period 2001-2008
Source : Regional Economic Outlook: Asia and Pasific, Oct 2007
a
b
c
Economy A
Economy BEXpo
rt V
alue
Comodity (i)
IEO for economy A = b/(a+b)IEO for economy B = b/(c+b)
Lower valueadded
Higher valueadded
IES ( j1, j
2, t ) = 100 x Σ s (i, j
1, t)s (i, j
2, t) /
i iΣ s ( i, j
1, t )2
iΣ s ( i, j
2, t )2
41The Impact of ACFTA Implementation on International Trade of Indonesia
IV. RESULT AND ANALYSIS
Results of the simulation generated from the GTAP model includes a variety of indicators
that may be developed further. But even so, this research is more focused on the analysis of
export commodities of ACFTA member, especially Indonesia. In general there are two parts of
focus on the analysis. The first part is to see the effects of shocks giveb to the member countries
of ACFTA, while the second part leads to the quantitative impact of trade by commodity details.
The result of the first part of the analysis is to see how the balance between the impact of trade
direction and trade creation as a result of the implementation of the FTA.
IV.1. Calculation Result with GTAP Model
Various literature studies provide a general picture of the impact of trade between member
countries in a trading arrangement which tend to increase. But the trade with the non-member
countries will decline. Analysis of trade effects in a trade group is often known by the analysis
of trade creation and trade diversion. We can see the impact entirely, by comparing the magnitude
of each of the two trading effects. If the trade creation impact is larger, in general the trade
agreements benefit the members. And vice versa if the trade creation impact is lower, then the
trade agreements do not benefit the members overall
Though it was found that the impact of trade creation is more prominent than trade
divertion, we need a further observation in general to see, whether positive results are enjoyed
equally by member countries or not. Likewise, the details of export commodities which have
increased need to be further explored of whether a generic commodity, in general, is in control
by all or a certain group of member country
The increase in trade volume among ACFTA member is mainly caused by the introduction
of the Chinese market and the enactment of a lower tariff. Thus, the occurrence of trade
diversion which was originally addressed to the non-ACFTA trading partners shifts toward the
fellow members of the ACFTA. This process of change can be in analogy with the existence of
a nominal amount of funds held by economic agents (countries) that can be spent with more
goods as a result of declining prices. Importer preferences also change in the face of dynamics
of changes in import prices as a result of tariff reduction. If the reduction in import tariffs
causes the price to be cheaper than the price of goods originating from non-member countries
(assuming the quality of goods are the same), then a decline in trade with non-member country
or trade divertion will take place
42 Bulletin of Monetary, Economics and Banking, July 2010
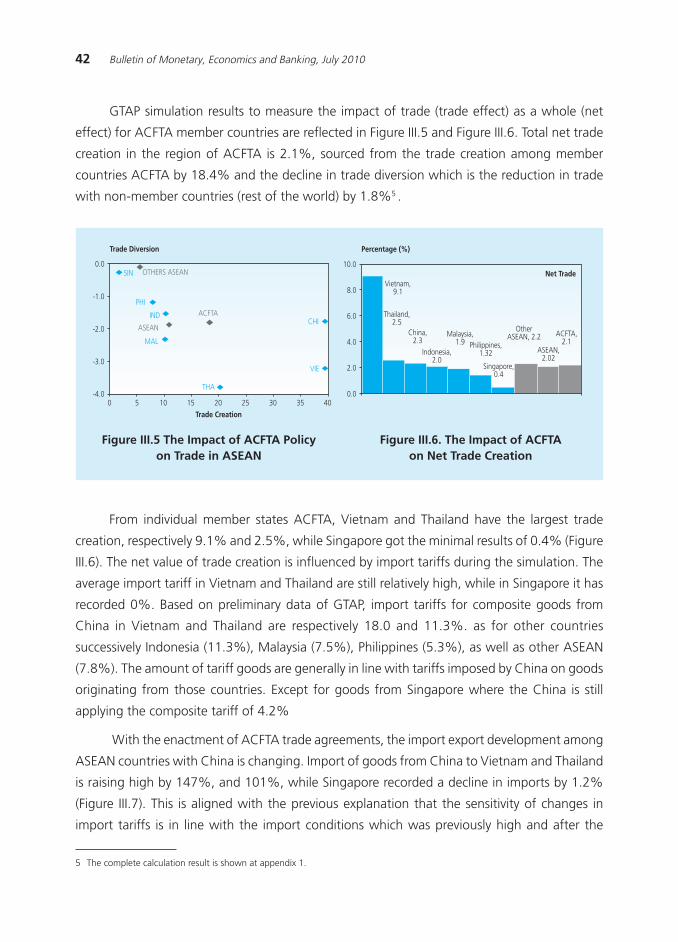
GTAP simulation results to measure the impact of trade (trade effect) as a whole (net
effect) for ACFTA member countries are reflected in Figure III.5 and Figure III.6. Total net trade
creation in the region of ACFTA is 2.1%, sourced from the trade creation among member
countries ACFTA by 18.4% and the decline in trade diversion which is the reduction in trade
with non-member countries (rest of the world) by 1.8%5 .
Figure III.5 The Impact of ACFTA Policyon Trade in ASEAN
Figure III.6. The Impact of ACFTAon Net Trade Creation
From individual member states ACFTA, Vietnam and Thailand have the largest trade
creation, respectively 9.1% and 2.5%, while Singapore got the minimal results of 0.4% (Figure
III.6). The net value of trade creation is influenced by import tariffs during the simulation. The
average import tariff in Vietnam and Thailand are still relatively high, while in Singapore it has
recorded 0%. Based on preliminary data of GTAP, import tariffs for composite goods from
China in Vietnam and Thailand are respectively 18.0 and 11.3%. as for other countries
successively Indonesia (11.3%), Malaysia (7.5%), Philippines (5.3%), as well as other ASEAN
(7.8%). The amount of tariff goods are generally in line with tariffs imposed by China on goods
originating from those countries. Except for goods from Singapore where the China is still
applying the composite tariff of 4.2%
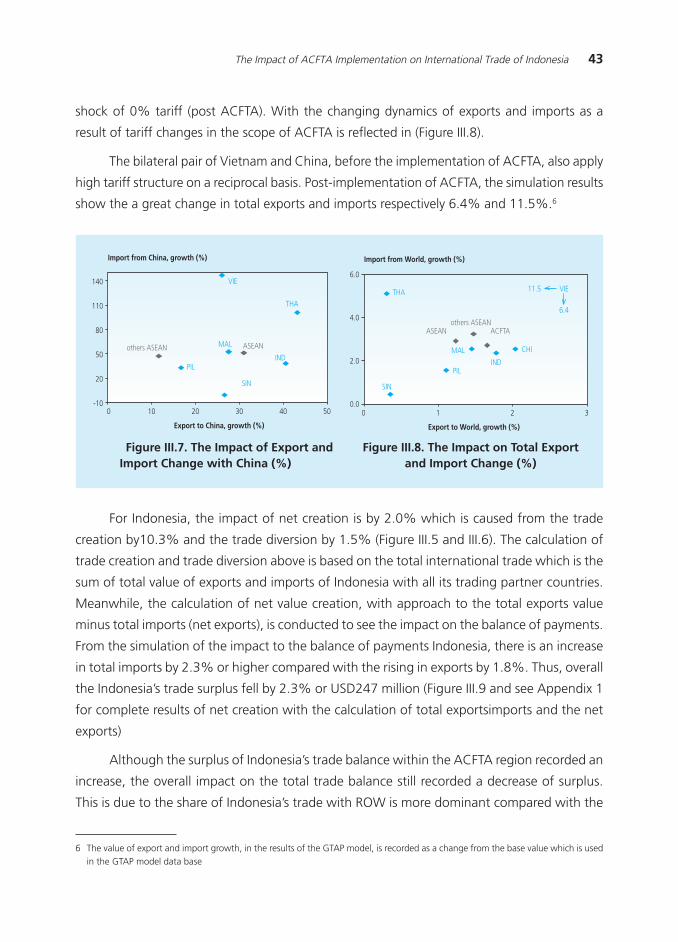
With the enactment of ACFTA trade agreements, the import export development among
ASEAN countries with China is changing. Import of goods from China to Vietnam and Thailand
is raising high by 147%, and 101%, while Singapore recorded a decline in imports by 1.2%
(Figure III.7). This is aligned with the previous explanation that the sensitivity of changes in
import tariffs is in line with the import conditions which was previously high and after the
5 The complete calculation result is shown at appendix 1.
Trade Creation
Trade Diversion
-4.0
-3.0
-2.0
-1.0
0.0
0 5 10 15 20 25 30 35 40
SIN
PHI
IND
THA
MAL
CHI
VIE
ASEAN
OTHERS ASEAN
ACFTA
Net Trade
Percentage (%)
0.0
2.0
4.0
6.0
8.0
10.0
Vietnam,9.1
Thailand,2.5
China,2.3
Indonesia,2.0
Malaysia,1.9 Philippines,
1.32
Singapore,0.4
OtherASEAN, 2.2
ASEAN,2.02
ACFTA,2.1
43The Impact of ACFTA Implementation on International Trade of Indonesia
shock of 0% tariff (post ACFTA). With the changing dynamics of exports and imports as a
result of tariff changes in the scope of ACFTA is reflected in (Figure III.8).
The bilateral pair of Vietnam and China, before the implementation of ACFTA, also apply
high tariff structure on a reciprocal basis. Post-implementation of ACFTA, the simulation results
show the a great change in total exports and imports respectively 6.4% and 11.5%.6
6 The value of export and import growth, in the results of the GTAP model, is recorded as a change from the base value which is usedin the GTAP model data base
Figure III.7. The Impact of Export andImport Change with China (%)
Figure III.8. The Impact on Total Exportand Import Change (%)
For Indonesia, the impact of net creation is by 2.0% which is caused from the trade
creation by10.3% and the trade diversion by 1.5% (Figure III.5 and III.6). The calculation of
trade creation and trade diversion above is based on the total international trade which is the
sum of total value of exports and imports of Indonesia with all its trading partner countries.
Meanwhile, the calculation of net value creation, with approach to the total exports value
minus total imports (net exports), is conducted to see the impact on the balance of payments.
From the simulation of the impact to the balance of payments Indonesia, there is an increase
in total imports by 2.3% or higher compared with the rising in exports by 1.8%. Thus, overall
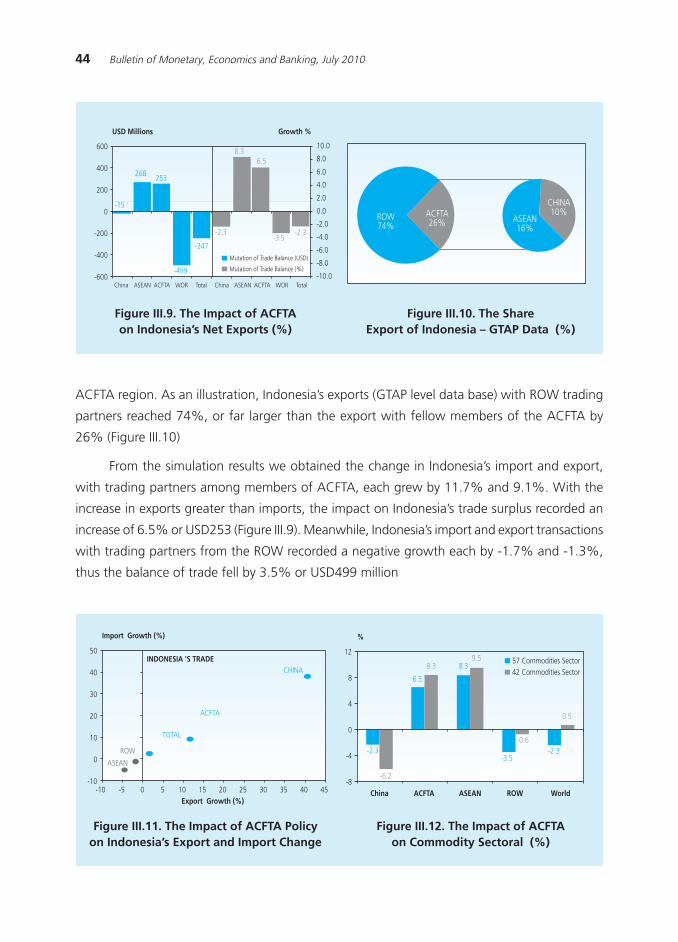
the Indonesia»s trade surplus fell by 2.3% or USD247 million (Figure III.9 and see Appendix 1
for complete results of net creation with the calculation of total exportsimports and the net
exports)
Although the surplus of Indonesia»s trade balance within the ACFTA region recorded an
increase, the overall impact on the total trade balance still recorded a decrease of surplus.
This is due to the share of Indonesia»s trade with ROW is more dominant compared with the
Export to China, growth (%)
Import from China, growth (%)
-10
20
50
80
110
140
ASEANothers ASEAN
SIN
PILIND
THA
MAL
VIE
0 10 20 30 40 50
Export to World, growth (%)
0.0
2.0
4.0
6.0
Import from World, growth (%)
0 1 2 3
ASEANothers ASEAN
ACFTA
SIN
PILIND
THA
MAL CHI
VIE11.5
6.4
44 Bulletin of Monetary, Economics and Banking, July 2010
Figure III.11. The Impact of ACFTA Policyon Indonesia»s Export and Import Change
Figure III.12. The Impact of ACFTAon Commodity Sectoral (%)
ROW
ASEAN
Export Growth (%)
INDONESIA 'S TRADE
-10
0
10
20
30
40
50
-10 -5 0 5 10 15 20 25 30 35 40 45
Import Growth (%)
TOTAL
CHINA
ACFTA
%
-8
-4
0
4
8
12
China ACFTA ASEAN ROW World
-2.3
6.5
8.3
-3.5-2.3
-6.2
8.39.5
-0.6
0.5
57 Commodities Sector42 Commodities Sector
Figure III.9. The Impact of ACFTAon Indonesia»s Net Exports (%)
Figure III.10. The ShareExport of Indonesia √ GTAP Data (%)
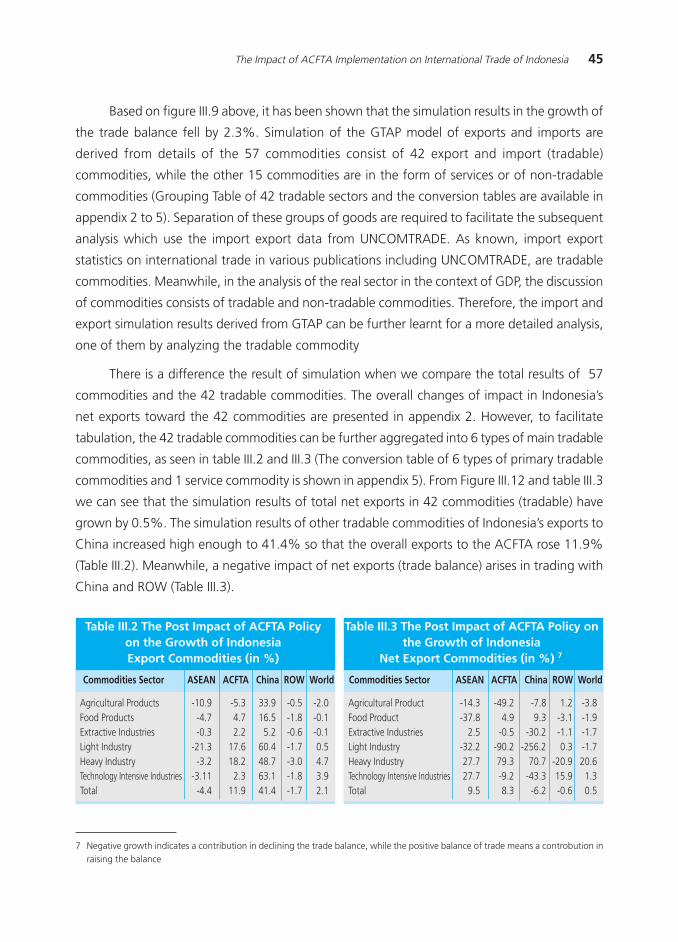
ACFTA region. As an illustration, Indonesia»s exports (GTAP level data base) with ROW trading
partners reached 74%, or far larger than the export with fellow members of the ACFTA by
26% (Figure III.10)
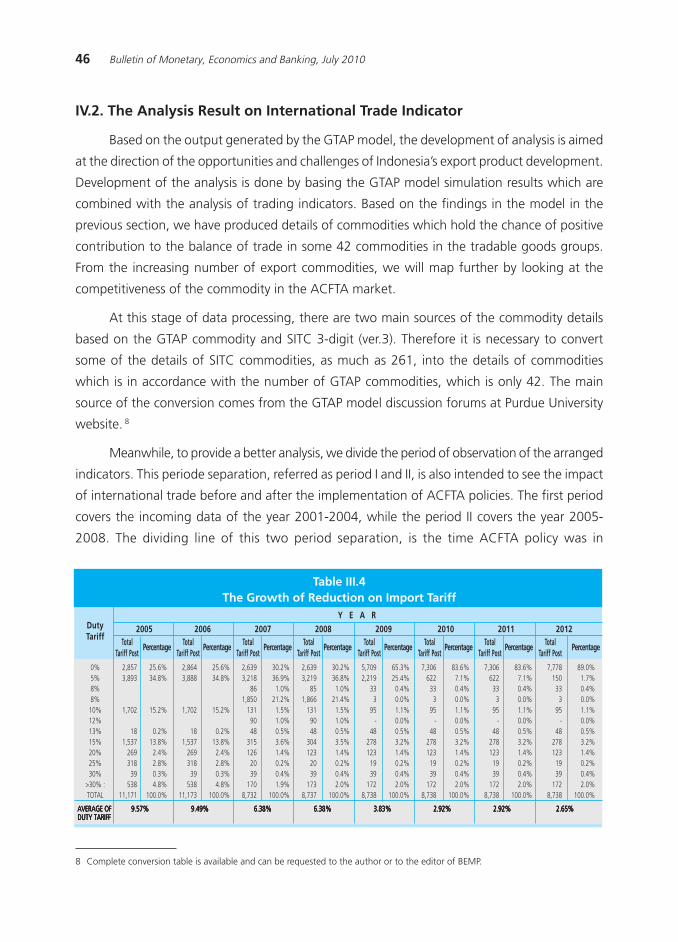
From the simulation results we obtained the change in Indonesia»s import and export,
with trading partners among members of ACFTA, each grew by 11.7% and 9.1%. With the
increase in exports greater than imports, the impact on Indonesia»s trade surplus recorded an
increase of 6.5% or USD253 (Figure III.9). Meanwhile, Indonesia»s import and export transactions
with trading partners from the ROW recorded a negative growth each by -1.7% and -1.3%,
thus the balance of trade fell by 3.5% or USD499 million
USD Millions Growth %
-600
-400
-200
0
200
400
600
Mutation of Trade Balance (USD)
Mutation of Trade Balance (%)-10.0
-8.0
-6.0
-4.0
-2.0
0.0
2.0
4.0
6.0
8.0
10.0
-15
268 253
-499
-247
-2.3
8.36.5
-3.5-2.3
China ASEAN ACFTA WOR Total China ASEAN ACFTA WOR Total
ASEAN16%
CHINA10%ACFTA
26%ROW74%
45The Impact of ACFTA Implementation on International Trade of Indonesia
Based on figure III.9 above, it has been shown that the simulation results in the growth of
the trade balance fell by 2.3%. Simulation of the GTAP model of exports and imports are
derived from details of the 57 commodities consist of 42 export and import (tradable)
commodities, while the other 15 commodities are in the form of services or of non-tradable
commodities (Grouping Table of 42 tradable sectors and the conversion tables are available in
appendix 2 to 5). Separation of these groups of goods are required to facilitate the subsequent
analysis which use the import export data from UNCOMTRADE. As known, import export
statistics on international trade in various publications including UNCOMTRADE, are tradable
commodities. Meanwhile, in the analysis of the real sector in the context of GDP, the discussion
of commodities consists of tradable and non-tradable commodities. Therefore, the import and
export simulation results derived from GTAP can be further learnt for a more detailed analysis,
one of them by analyzing the tradable commodity
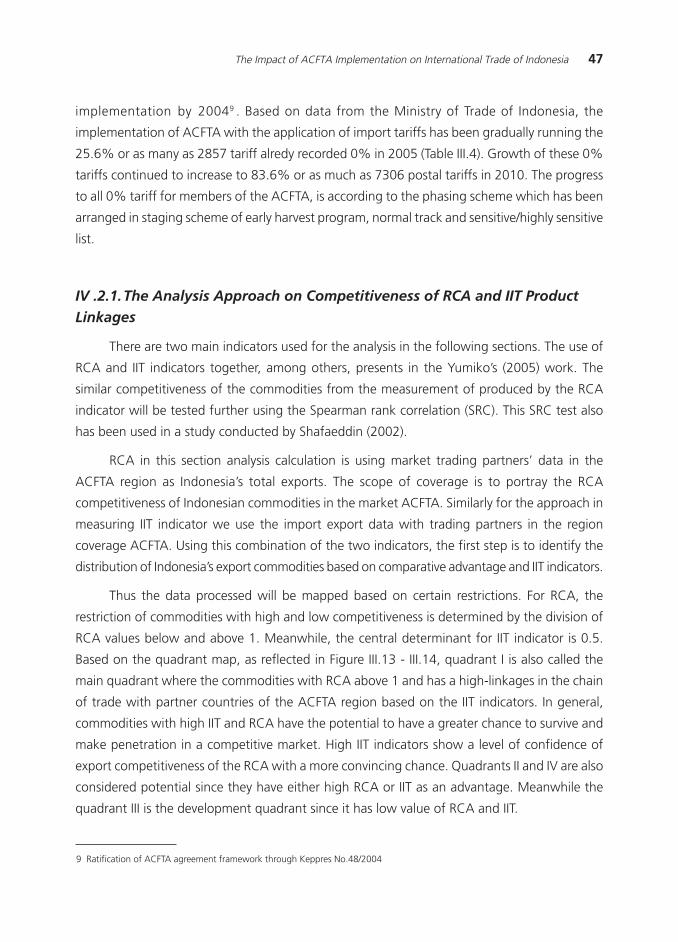
There is a difference the result of simulation when we compare the total results of 57
commodities and the 42 tradable commodities. The overall changes of impact in Indonesia»s
net exports toward the 42 commodities are presented in appendix 2. However, to facilitate
tabulation, the 42 tradable commodities can be further aggregated into 6 types of main tradable
commodities, as seen in table III.2 and III.3 (The conversion table of 6 types of primary tradable
commodities and 1 service commodity is shown in appendix 5). From Figure III.12 and table III.3
we can see that the simulation results of total net exports in 42 commodities (tradable) have
grown by 0.5%. The simulation results of other tradable commodities of Indonesia»s exports to
China increased high enough to 41.4% so that the overall exports to the ACFTA rose 11.9%
(Table III.2). Meanwhile, a negative impact of net exports (trade balance) arises in trading with
China and ROW (Table III.3).
Table III.2 The Post Impact of ACFTA Policyon the Growth of IndonesiaExport Commodities (in %)
Commodities Sector ASEAN ACFTA China ROW World
Agricultural Products -10.9 -5.3 33.9 -0.5 -2.0Food Products -4.7 4.7 16.5 -1.8 -0.1Extractive Industries -0.3 2.2 5.2 -0.6 -0.1Light Industry -21.3 17.6 60.4 -1.7 0.5Heavy Industry -3.2 18.2 48.7 -3.0 4.7Technology Intensive Industries -3.11 2.3 63.1 -1.8 3.9Total -4.4 11.9 41.4 -1.7 2.1
Table III.3 The Post Impact of ACFTA Policy onthe Growth of Indonesia
Net Export Commodities (in %) 7
Commodities Sector ASEAN ACFTA China ROW World
Agricultural Product -14.3 -49.2 -7.8 1.2 -3.8Food Product -37.8 4.9 9.3 -3.1 -1.9Extractive Industries 2.5 -0.5 -30.2 -1.1 -1.7Light Industry -32.2 -90.2 -256.2 0.3 -1.7Heavy Industry 27.7 79.3 70.7 -20.9 20.6Technology Intensive Industries 27.7 -9.2 -43.3 15.9 1.3Total 9.5 8.3 -6.2 -0.6 0.5
7 Negative growth indicates a contribution in declining the trade balance, while the positive balance of trade means a controbution inraising the balance
46 Bulletin of Monetary, Economics and Banking, July 2010
Table III.4The Growth of Reduction on Import Tariff
DutyTariff
Y E A R
0% 2,857 25.6% 2,864 25.6% 2,639 30.2% 2,639 30.2% 5,709 65.3% 7,306 83.6% 7,306 83.6% 7,778 89.0%5% 3,893 34.8% 3,888 34.8% 3,218 36.9% 3,219 36.8% 2,219 25.4% 622 7.1% 622 7.1% 150 1.7%8% 86 1.0% 85 1.0% 33 0.4% 33 0.4% 33 0.4% 33 0.4%8% 1,850 21.2% 1,866 21.4% 3 0.0% 3 0.0% 3 0.0% 3 0.0%
10% 1,702 15.2% 1,702 15.2% 131 1.5% 131 1.5% 95 1.1% 95 1.1% 95 1.1% 95 1.1%12% 90 1.0% 90 1.0% - 0.0% - 0.0% - 0.0% - 0.0%13% 18 0.2% 18 0.2% 48 0.5% 48 0.5% 48 0.5% 48 0.5% 48 0.5% 48 0.5%15% 1,537 13.8% 1,537 13.8% 315 3.6% 304 3.5% 278 3.2% 278 3.2% 278 3.2% 278 3.2%20% 269 2.4% 269 2.4% 126 1.4% 123 1.4% 123 1.4% 123 1.4% 123 1.4% 123 1.4%25% 318 2.8% 318 2.8% 20 0.2% 20 0.2% 19 0.2% 19 0.2% 19 0.2% 19 0.2%30% 39 0.3% 39 0.3% 39 0.4% 39 0.4% 39 0.4% 39 0.4% 39 0.4% 39 0.4%
>30% : 538 4.8% 538 4.8% 170 1.9% 173 2.0% 172 2.0% 172 2.0% 172 2.0% 172 2.0%TOTAL 11,171 100.0% 11,173 100.0% 8,732 100.0% 8,737 100.0% 8,738 100.0% 8,738 100.0% 8,738 100.0% 8,738 100.0%
2005 2006 2007 2008 2009 2010 2011 2012Total
Tariff PostPercentage Total
Tariff PostPercentage Total
Tariff PostPercentage Total
Tariff PostPercentage Total
Tariff PostPercentage Total
Tariff PostPercentage Total
Tariff PostPercentage Total
Tariff PostPercentage
AVERAGE OFAVERAGE OFAVERAGE OFAVERAGE OFAVERAGE OF 9.57%9.57%9.57%9.57%9.57% 9.49%9.49%9.49%9.49%9.49% 6.38%6.38%6.38%6.38%6.38% 6.38%6.38%6.38%6.38%6.38% 3.83%3.83%3.83%3.83%3.83% 2.92%2.92%2.92%2.92%2.92% 2.92%2.92%2.92%2.92%2.92% 2.65%2.65%2.65%2.65%2.65% DUTY TARIFF DUTY TARIFF DUTY TARIFF DUTY TARIFF DUTY TARIFF
IV.2. The Analysis Result on International Trade Indicator
Based on the output generated by the GTAP model, the development of analysis is aimed
at the direction of the opportunities and challenges of Indonesia»s export product development.
Development of the analysis is done by basing the GTAP model simulation results which are
combined with the analysis of trading indicators. Based on the findings in the model in the
previous section, we have produced details of commodities which hold the chance of positive
contribution to the balance of trade in some 42 commodities in the tradable goods groups.
From the increasing number of export commodities, we will map further by looking at the
competitiveness of the commodity in the ACFTA market.
At this stage of data processing, there are two main sources of the commodity details
based on the GTAP commodity and SITC 3-digit (ver.3). Therefore it is necessary to convert
some of the details of SITC commodities, as much as 261, into the details of commodities
which is in accordance with the number of GTAP commodities, which is only 42. The main
source of the conversion comes from the GTAP model discussion forums at Purdue University
website. 8
Meanwhile, to provide a better analysis, we divide the period of observation of the arranged
indicators. This periode separation, referred as period I and II, is also intended to see the impact
of international trade before and after the implementation of ACFTA policies. The first period
covers the incoming data of the year 2001-2004, while the period II covers the year 2005-
2008. The dividing line of this two period separation, is the time ACFTA policy was in
8 Complete conversion table is available and can be requested to the author or to the editor of BEMP.
47The Impact of ACFTA Implementation on International Trade of Indonesia
implementation by 20049 . Based on data from the Ministry of Trade of Indonesia, the
implementation of ACFTA with the application of import tariffs has been gradually running the
25.6% or as many as 2857 tariff alredy recorded 0% in 2005 (Table III.4). Growth of these 0%
tariffs continued to increase to 83.6% or as much as 7306 postal tariffs in 2010. The progress
to all 0% tariff for members of the ACFTA, is according to the phasing scheme which has been
arranged in staging scheme of early harvest program, normal track and sensitive/highly sensitive
list.
IV .2.1.The Analysis Approach on Competitiveness of RCA and IIT ProductLinkages
There are two main indicators used for the analysis in the following sections. The use of
RCA and IIT indicators together, among others, presents in the Yumiko»s (2005) work. The
similar competitiveness of the commodities from the measurement of produced by the RCA
indicator will be tested further using the Spearman rank correlation (SRC). This SRC test also
has been used in a study conducted by Shafaeddin (2002).
RCA in this section analysis calculation is using market trading partners» data in the
ACFTA region as Indonesia»s total exports. The scope of coverage is to portray the RCA
competitiveness of Indonesian commodities in the market ACFTA. Similarly for the approach in
measuring IIT indicator we use the import export data with trading partners in the region
coverage ACFTA. Using this combination of the two indicators, the first step is to identify the
distribution of Indonesia»s export commodities based on comparative advantage and IIT indicators.
Thus the data processed will be mapped based on certain restrictions. For RCA, the
restriction of commodities with high and low competitiveness is determined by the division of
RCA values below and above 1. Meanwhile, the central determinant for IIT indicator is 0.5.
Based on the quadrant map, as reflected in Figure III.13 - III.14, quadrant I is also called the
main quadrant where the commodities with RCA above 1 and has a high-linkages in the chain
of trade with partner countries of the ACFTA region based on the IIT indicators. In general,
commodities with high IIT and RCA have the potential to have a greater chance to survive and
make penetration in a competitive market. High IIT indicators show a level of confidence of
export competitiveness of the RCA with a more convincing chance. Quadrants II and IV are also
considered potential since they have either high RCA or IIT as an advantage. Meanwhile the
quadrant III is the development quadrant since it has low value of RCA and IIT.
9 Ratification of ACFTA agreement framework through Keppres No.48/2004
48 Bulletin of Monetary, Economics and Banking, July 2010
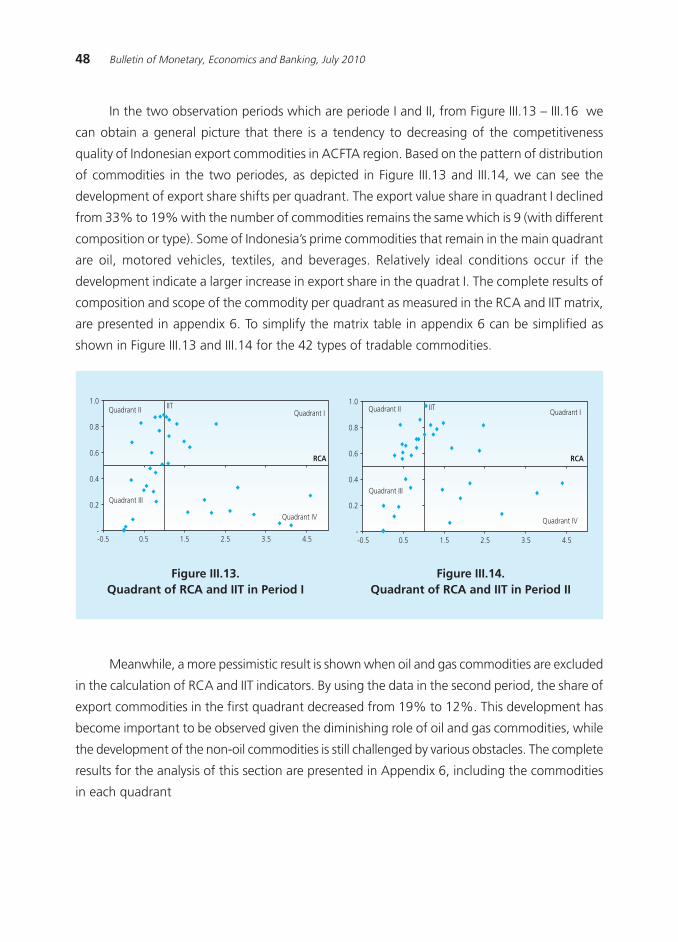
In the two observation periods which are periode I and II, from Figure III.13 √ III.16 we
can obtain a general picture that there is a tendency to decreasing of the competitiveness
quality of Indonesian export commodities in ACFTA region. Based on the pattern of distribution
of commodities in the two periodes, as depicted in Figure III.13 and III.14, we can see the
development of export share shifts per quadrant. The export value share in quadrant I declined
from 33% to 19% with the number of commodities remains the same which is 9 (with different
composition or type). Some of Indonesia»s prime commodities that remain in the main quadrant
are oil, motored vehicles, textiles, and beverages. Relatively ideal conditions occur if the
development indicate a larger increase in export share in the quadrat I. The complete results of
composition and scope of the commodity per quadrant as measured in the RCA and IIT matrix,
are presented in appendix 6. To simplify the matrix table in appendix 6 can be simplified as
shown in Figure III.13 and III.14 for the 42 types of tradable commodities.
Figure III.13.Quadrant of RCA and IIT in Period I
Figure III.14.Quadrant of RCA and IIT in Period II
Quadrant IV
Quadrant II
Quadrant III
IIT
RCA
Quadrant I
-0.5 0.5 1.5 2.5 3.5 4.5-
0.2
0.4
0.6
0.8
1.0
Quadrant IV
Quadrant II
Quadrant III
Quadrant I
-0.5 0.5 1.5 2.5 3.5 4.5-
0.2
0.4
0.6
0.8
1.0IIT
RCA
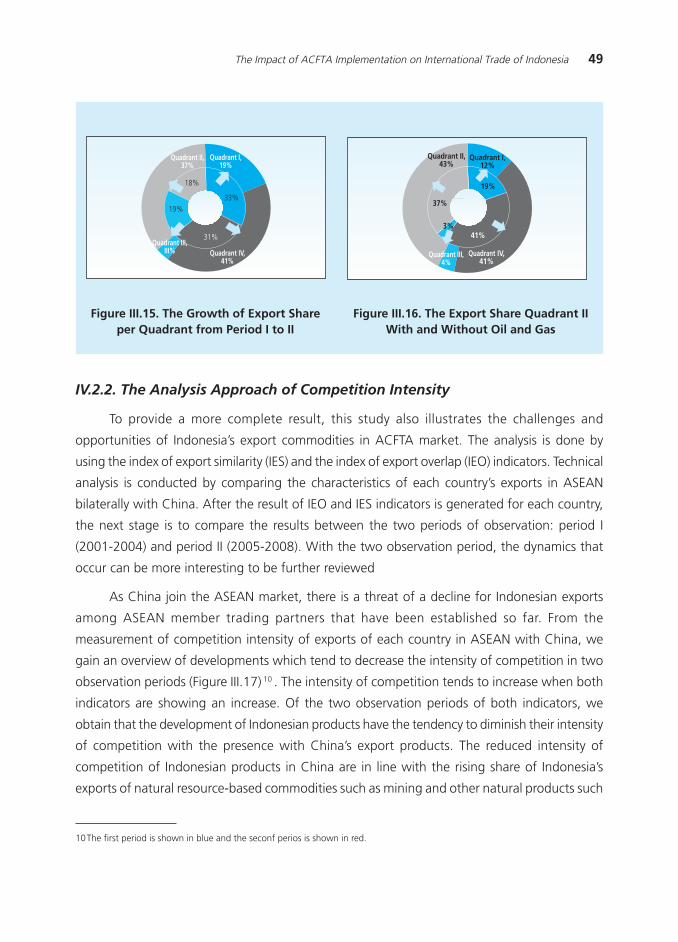
Meanwhile, a more pessimistic result is shown when oil and gas commodities are excluded
in the calculation of RCA and IIT indicators. By using the data in the second period, the share of
export commodities in the first quadrant decreased from 19% to 12%. This development has
become important to be observed given the diminishing role of oil and gas commodities, while
the development of the non-oil commodities is still challenged by various obstacles. The complete
results for the analysis of this section are presented in Appendix 6, including the commodities
in each quadrant
49The Impact of ACFTA Implementation on International Trade of Indonesia
Figure III.15. The Growth of Export Shareper Quadrant from Period I to II
Figure III.16. The Export Share Quadrant IIWith and Without Oil and Gas
IV.2.2. The Analysis Approach of Competition Intensity
To provide a more complete result, this study also illustrates the challenges and
opportunities of Indonesia»s export commodities in ACFTA market. The analysis is done by
using the index of export similarity (IES) and the index of export overlap (IEO) indicators. Technical
analysis is conducted by comparing the characteristics of each country»s exports in ASEAN
bilaterally with China. After the result of IEO and IES indicators is generated for each country,
the next stage is to compare the results between the two periods of observation: period I
(2001-2004) and period II (2005-2008). With the two observation period, the dynamics that
occur can be more interesting to be further reviewed
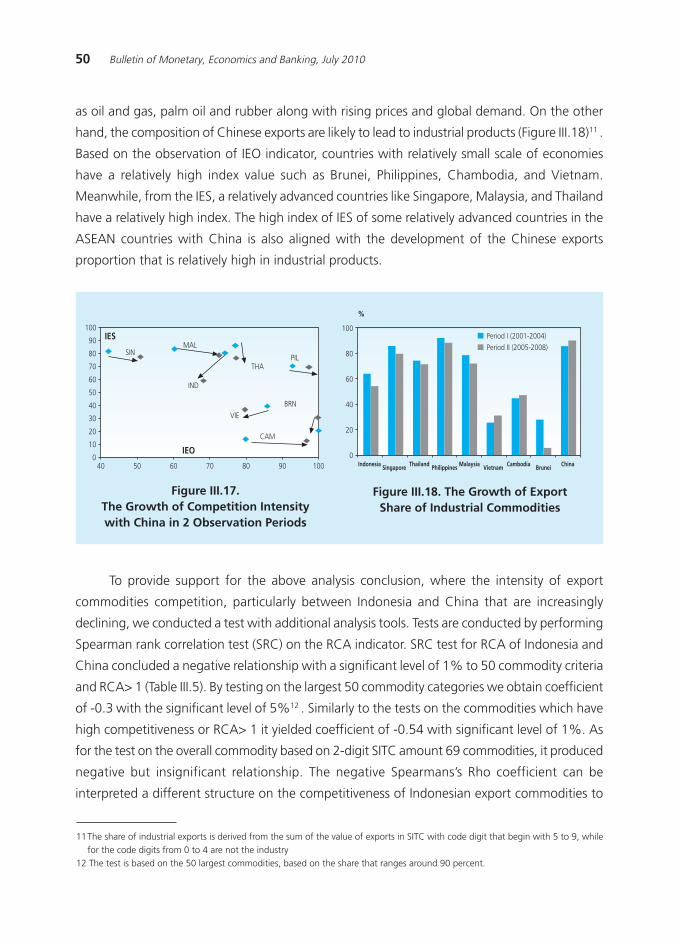
As China join the ASEAN market, there is a threat of a decline for Indonesian exports
among ASEAN member trading partners that have been established so far. From the
measurement of competition intensity of exports of each country in ASEAN with China, we
gain an overview of developments which tend to decrease the intensity of competition in two
observation periods (Figure III.17) 10 . The intensity of competition tends to increase when both
indicators are showing an increase. Of the two observation periods of both indicators, we
obtain that the development of Indonesian products have the tendency to diminish their intensity
of competition with the presence with China»s export products. The reduced intensity of
competition of Indonesian products in China are in line with the rising share of Indonesia»s
exports of natural resource-based commodities such as mining and other natural products such
33%
31%
19%
18%
Quadrant I,19%
Quadrant IV,41%
Quadrant III,III%
Quadrant II,37%
19%
41%
37%
Quadrant I,12%
Quadrant IV,41%
Quadrant III,4%
Quadrant II,43%
3%
10The first period is shown in blue and the seconf perios is shown in red.
50 Bulletin of Monetary, Economics and Banking, July 2010
as oil and gas, palm oil and rubber along with rising prices and global demand. On the other
hand, the composition of Chinese exports are likely to lead to industrial products (Figure III.18)11 .
Based on the observation of IEO indicator, countries with relatively small scale of economies
have a relatively high index value such as Brunei, Philippines, Chambodia, and Vietnam.
Meanwhile, from the IES, a relatively advanced countries like Singapore, Malaysia, and Thailand
have a relatively high index. The high index of IES of some relatively advanced countries in the
ASEAN countries with China is also aligned with the development of the Chinese exports
proportion that is relatively high in industrial products.
Figure III.17.The Growth of Competition Intensitywith China in 2 Observation Periods
Figure III.18. The Growth of ExportShare of Industrial Commodities
11The share of industrial exports is derived from the sum of the value of exports in SITC with code digit that begin with 5 to 9, whilefor the code digits from 0 to 4 are not the industry
12 The test is based on the 50 largest commodities, based on the share that ranges around 90 percent.
0
10
20
30
40
50
60
70
80
90
100
40 50 60 70 80 90 100
IES
IND
BRN
CAM
MAL
PILSIN
THA
VIE
IEO
%
0
20
40
60
80
100Period I (2001-2004)
Period II (2005-2008)
Indonesia Singapore Thailand Philippines Malaysia Vietnam Cambodia Brunei China
To provide support for the above analysis conclusion, where the intensity of export
commodities competition, particularly between Indonesia and China that are increasingly
declining, we conducted a test with additional analysis tools. Tests are conducted by performing
Spearman rank correlation test (SRC) on the RCA indicator. SRC test for RCA of Indonesia and
China concluded a negative relationship with a significant level of 1% to 50 commodity criteria
and RCA> 1 (Table III.5). By testing on the largest 50 commodity categories we obtain coefficient
of -0.3 with the significant level of 5%12 . Similarly to the tests on the commodities which have
high competitiveness or RCA> 1 it yielded coefficient of -0.54 with significant level of 1%. As
for the test on the overall commodity based on 2-digit SITC amount 69 commodities, it produced
negative but insignificant relationship. The negative Spearmans»s Rho coefficient can be
interpreted a different structure on the competitiveness of Indonesian export commodities to
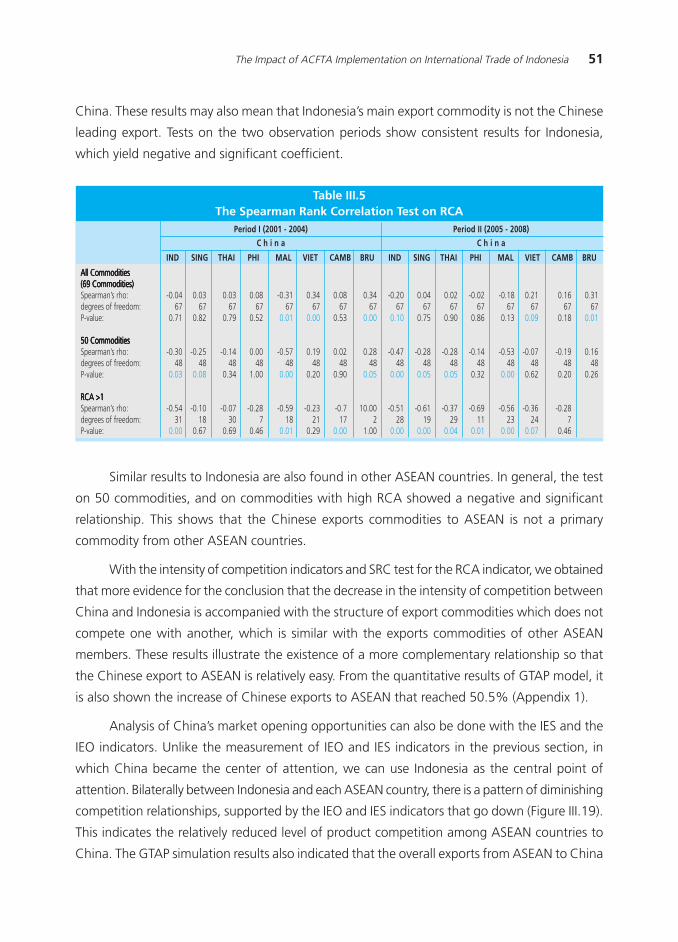
51The Impact of ACFTA Implementation on International Trade of Indonesia
China. These results may also mean that Indonesia»s main export commodity is not the Chinese
leading export. Tests on the two observation periods show consistent results for Indonesia,
which yield negative and significant coefficient.
Table III.5The Spearman Rank Correlation Test on RCA
Period I (2001 - 2004)
All CommoditiesAll CommoditiesAll CommoditiesAll CommoditiesAll Commodities(69 Commodities)(69 Commodities)(69 Commodities)(69 Commodities)(69 Commodities)Spearman»s rho: -0.04 0.03 0.03 0.08 -0.31 0.34 0.08 0.34 -0.20 0.04 0.02 -0.02 -0.18 0.21 0.16 0.31degrees of freedom: 67 67 67 67 67 67 67 67 67 67 67 67 67 67 67 67P-value: 0.71 0.82 0.79 0.52 0.01 0.00 0.53 0.00 0.10 0.75 0.90 0.86 0.13 0.09 0.18 0.01
50 Commodities50 Commodities50 Commodities50 Commodities50 CommoditiesSpearman»s rho: -0.30 -0.25 -0.14 0.00 -0.57 0.19 0.02 0.28 -0.47 -0.28 -0.28 -0.14 -0.53 -0.07 -0.19 0.16degrees of freedom: 48 48 48 48 48 48 48 48 48 48 48 48 48 48 48 48P-value: 0.03 0.08 0.34 1.00 0.00 0.20 0.90 0.05 0.00 0.05 0.05 0.32 0.00 0.62 0.20 0.26
RCA >1RCA >1RCA >1RCA >1RCA >1Spearman»s rho: -0.54 -0.10 -0.07 -0.28 -0.59 -0.23 -0.7 10.00 -0.51 -0.61 -0.37 -0.69 -0.56 -0.36 -0.28degrees of freedom: 31 18 30 7 18 21 17 2 28 19 29 11 23 24 7P-value: 0.00 0.67 0.69 0.46 0.01 0.29 0.00 1.00 0.00 0.00 0.04 0.01 0.00 0.07 0.46
Period II (2005 - 2008)
C h i n a C h i n a
IND SING THAI PHI MAL VIET CAMB BRU IND SING THAI PHI MAL VIET CAMB BRU
Similar results to Indonesia are also found in other ASEAN countries. In general, the test
on 50 commodities, and on commodities with high RCA showed a negative and significant
relationship. This shows that the Chinese exports commodities to ASEAN is not a primary
commodity from other ASEAN countries.
With the intensity of competition indicators and SRC test for the RCA indicator, we obtained
that more evidence for the conclusion that the decrease in the intensity of competition between
China and Indonesia is accompanied with the structure of export commodities which does not
compete one with another, which is similar with the exports commodities of other ASEAN
members. These results illustrate the existence of a more complementary relationship so that
the Chinese export to ASEAN is relatively easy. From the quantitative results of GTAP model, it
is also shown the increase of Chinese exports to ASEAN that reached 50.5% (Appendix 1).
Analysis of China»s market opening opportunities can also be done with the IES and the
IEO indicators. Unlike the measurement of IEO and IES indicators in the previous section, in
which China became the center of attention, we can use Indonesia as the central point of
attention. Bilaterally between Indonesia and each ASEAN country, there is a pattern of diminishing
competition relationships, supported by the IEO and IES indicators that go down (Figure III.19).
This indicates the relatively reduced level of product competition among ASEAN countries to
China. The GTAP simulation results also indicated that the overall exports from ASEAN to China
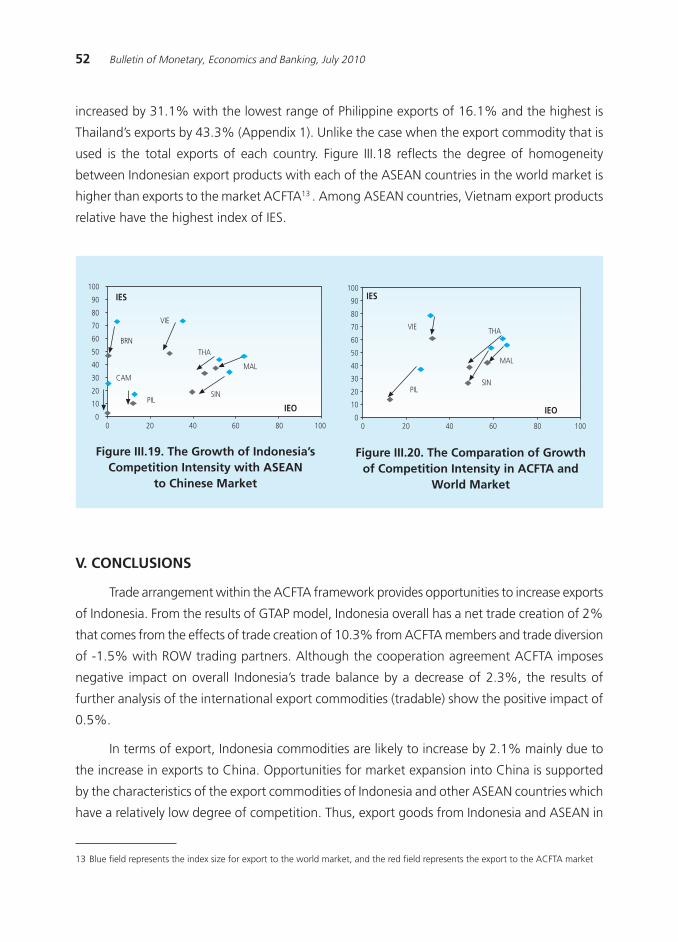
52 Bulletin of Monetary, Economics and Banking, July 2010
increased by 31.1% with the lowest range of Philippine exports of 16.1% and the highest is
Thailand»s exports by 43.3% (Appendix 1). Unlike the case when the export commodity that is
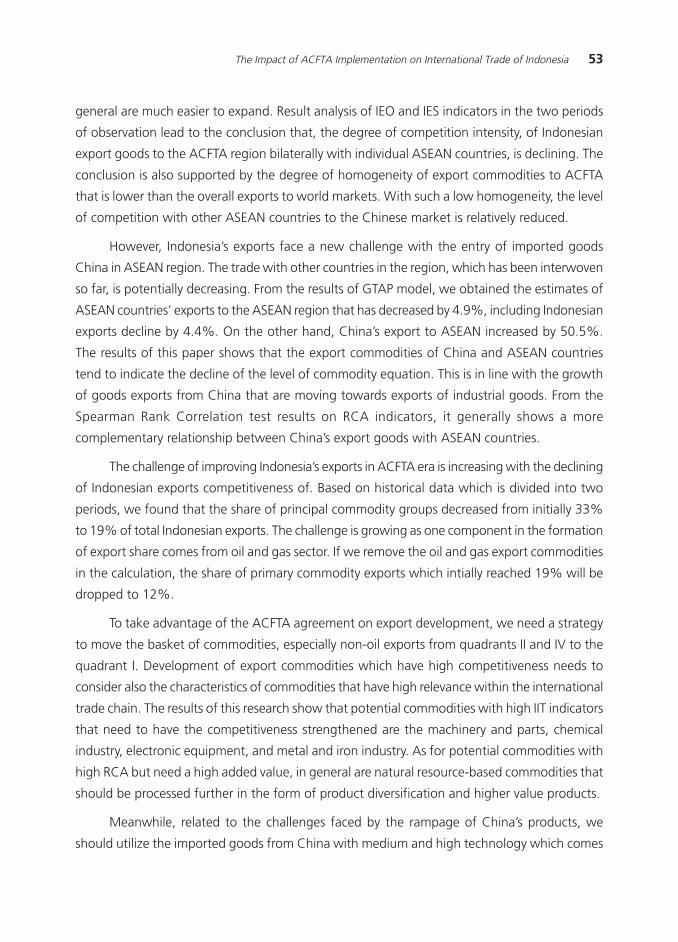
used is the total exports of each country. Figure III.18 reflects the degree of homogeneity
between Indonesian export products with each of the ASEAN countries in the world market is
higher than exports to the market ACFTA13 . Among ASEAN countries, Vietnam export products
relative have the highest index of IES.
13 Blue field represents the index size for export to the world market, and the red field represents the export to the ACFTA market
Figure III.19. The Growth of Indonesia»sCompetition Intensity with ASEAN
to Chinese Market
Figure III.20. The Comparation of Growthof Competition Intensity in ACFTA and
World Market
IES
BRN
CAMMAL
PILSIN
THA
VIE
IEO0
10
20
30
40
50
60
70
80
90
100
0 20 40 60 80 1000
10
20
30
40
50
60
70
80
90
100
0 20 40 60 80 100
IES
MAL
PILSIN
THAVIE
IEO
V. CONCLUSIONS
Trade arrangement within the ACFTA framework provides opportunities to increase exports
of Indonesia. From the results of GTAP model, Indonesia overall has a net trade creation of 2%
that comes from the effects of trade creation of 10.3% from ACFTA members and trade diversion
of -1.5% with ROW trading partners. Although the cooperation agreement ACFTA imposes
negative impact on overall Indonesia»s trade balance by a decrease of 2.3%, the results of
further analysis of the international export commodities (tradable) show the positive impact of
0.5%.
In terms of export, Indonesia commodities are likely to increase by 2.1% mainly due to
the increase in exports to China. Opportunities for market expansion into China is supported
by the characteristics of the export commodities of Indonesia and other ASEAN countries which
have a relatively low degree of competition. Thus, export goods from Indonesia and ASEAN in
53The Impact of ACFTA Implementation on International Trade of Indonesia
general are much easier to expand. Result analysis of IEO and IES indicators in the two periods
of observation lead to the conclusion that, the degree of competition intensity, of Indonesian
export goods to the ACFTA region bilaterally with individual ASEAN countries, is declining. The
conclusion is also supported by the degree of homogeneity of export commodities to ACFTA
that is lower than the overall exports to world markets. With such a low homogeneity, the level
of competition with other ASEAN countries to the Chinese market is relatively reduced.
However, Indonesia»s exports face a new challenge with the entry of imported goods
China in ASEAN region. The trade with other countries in the region, which has been interwoven
so far, is potentially decreasing. From the results of GTAP model, we obtained the estimates of
ASEAN countries» exports to the ASEAN region that has decreased by 4.9%, including Indonesian
exports decline by 4.4%. On the other hand, China»s export to ASEAN increased by 50.5%.
The results of this paper shows that the export commodities of China and ASEAN countries
tend to indicate the decline of the level of commodity equation. This is in line with the growth
of goods exports from China that are moving towards exports of industrial goods. From the
Spearman Rank Correlation test results on RCA indicators, it generally shows a more
complementary relationship between China»s export goods with ASEAN countries.
The challenge of improving Indonesia»s exports in ACFTA era is increasing with the declining
of Indonesian exports competitiveness of. Based on historical data which is divided into two
periods, we found that the share of principal commodity groups decreased from initially 33%
to 19% of total Indonesian exports. The challenge is growing as one component in the formation
of export share comes from oil and gas sector. If we remove the oil and gas export commodities
in the calculation, the share of primary commodity exports which intially reached 19% will be
dropped to 12%.
To take advantage of the ACFTA agreement on export development, we need a strategy
to move the basket of commodities, especially non-oil exports from quadrants II and IV to the
quadrant I. Development of export commodities which have high competitiveness needs to
consider also the characteristics of commodities that have high relevance within the international
trade chain. The results of this research show that potential commodities with high IIT indicators
that need to have the competitiveness strengthened are the machinery and parts, chemical
industry, electronic equipment, and metal and iron industry. As for potential commodities with
high RCA but need a high added value, in general are natural resource-based commodities that
should be processed further in the form of product diversification and higher value products.
Meanwhile, related to the challenges faced by the rampage of China»s products, we
should utilize the imported goods from China with medium and high technology which comes
54 Bulletin of Monetary, Economics and Banking, July 2010
from countries outside the region. Thus, we can provide a broader option for producers to
invest in machinery and equipment with a range of goods from China with more competitive
price. Furthermore, we expected that the direction from ACFTA cooperation can improve welfare
in the region and particularly for Indonesia.
55The Impact of ACFTA Implementation on International Trade of Indonesia
Deardorff, V. A. (1995). ≈Determinants of Bilateral Trade: Does Gravity Work in a Neoclassic
World?∆ NBER Working Paper No. 5377.
Endy Tjahjono, M. Barik Bathaluddin, dan Justina Adamanti (2009): ≈ Semar 2009: Suatu Model
Financial Computable General Equilibrium∆. WP/ / 2009 (Desember 2009).
Frankel, Jeffrey (1997): ≈Regional Trading Blocs in The World Economic System,∆ NBER Working
Paper Series 4050.
Haryadi, Rina Oktaviani, Mangara Tambunan dan Noer Azam Achsani. ≈Dampak Penghapusan
Hambatan Perdagangan Sektor Pertanian Terhadap Kinerja Ekonomi Negara Maju dan
Berkembang∆. April 2008.
IMF (2007): World Economic Financial Surveys: Regional Economic Outlook Asia and Pacific.
Oct 2007.
Joseph F. Francois, Luis Rivera dan Hugo Rojas-Romagosa. ≈Economic perspectives for Central
America after CAFTA. A GTAP-based analysis∆, February 2008.
Kemp, Murray C., and Henry Y.Jr.Wan. (1976). ≈An Elementary Proposition Concerning the
Formation of Customs Unions.∆Journal of International Economics 6 (1976): 95-97.
Kemp, Murray, C. (1964): The Pure Theory of International Trade. Prentice-Hall, Englewood
Cliffs, N.J., 176-177.
Krueger, Anne O (1999). ≈Trade creation and Trade Diversion under NAFTA∆. National Bureau
of Economic Research, WP 7429.
Ohyama, M. (1972). ≈Trade and Welfare in General Equilibrium∆. Keio Economic Studies 9, 37-
73.
Okamoto, Yumiko (2005). ≈ASEAN, China, and India: Are they more competitive or
complementary to each other?∆.
Saktyanu K. Dermoredjo, Wahida, dan Budiman Hutabarat; Analisis Dampak Penurunan Subsidi
Ekspor Negara Maju terhadap Produksi Pertanian Indonesia. Desember 2007.
Sanchez, Manuel dan Karp, Nathaniel (2000). ≈NAFTA»s Economic Effects on Mexico∆. NBER.
Shujiro Urata dan Kozo Kiyota; The impacts of an East Asia FTA on Foreign Trade in East Asia.
Desember 2003.
Thomas W. Hertel, Global Trade Analysis, Modeling dan Applications, Cambridge University
Press 1997.
REFERENCES
56 Bulletin of Monetary, Economics and Banking, July 2010
Tsutsumi, Masahiko (2001): ≈How Will the Regional FTAs Shape the Indonesian Economy?
Evaluation by the Computable General Equilibrium Model∆. TSQ Discussion Paper 2001/02-
No. 2. (August 2001).
Tubagus Feridhanusetyawan, Yose Rizal Damuri; Economic Crisis and Trade Liberalization: A
CGE Analysis On The Forestry Sector. February 2004.
Vanek, Jaroslav (1965). General Equilibrium of International Discrimination: The Case of Customs
Unions. Cambridge, MA: Harvard University Press.
Viner, Jacob (1950). The Customs Union Issue, Carnegie Endowment for International Peace,
New York.