Embed Size (px)
Citation preview
The Impact of a Dynamic Geometry-Centered
Teacher Professional Development Program
Zhonghong Jiang, Alexander White, M. Alejandra Sorto, & Alana Rosenwasser
Texas State University
This study investigated the impact of a dynamic geometry-centered teacher professional development
program on high school geometry teachers’ change and their students’ geometry learning. 64 geometry
teachers were randomly assigned to two groups. The teachers in the experimental group participated in a
one-week summer institute followed by six half-day workshop sessions during the school year, in which
they studied the critical features of the dynamic geometry (DG) approach and the DG-oriented teaching
strategies they were expected to use in their classrooms. The classroom observation data and the teachers'
responses to the implementation questionnaires revealed that most teachers in the DG group were faithful
to the instructional approach assigned to them. Teachers in the experimental group scored higher in a
conjecturing-proving test than did teachers in the control group, but the difference was not significant. The
students of teachers in the experimental group significantly outperformed the students of teachers in the
control group in a geometry achievement test.
Dynamic geometry (DG) is an active, exploratory study of geometry carried out with the aid
of interactive computer software, which has been available since the early 1990’s. The major DG
software packages include the Geometers’ Sketchpad (Jackiw, 2001), Cabri Geometry (Laborde
& Bellmain, 2005) and Geogebra (Hohenwarter, 2001). DG environments provide students with
experimental and modeling tools that allow them to investigate geometric phenomena (CCSSI,
2010). With its main features such as dragging and measuring, DG software can be used to help
students to engage in both constructive and deductive geometry (Schoenfeld, 1983) as they build,
test and verify conjectures using easily constructible models.
2
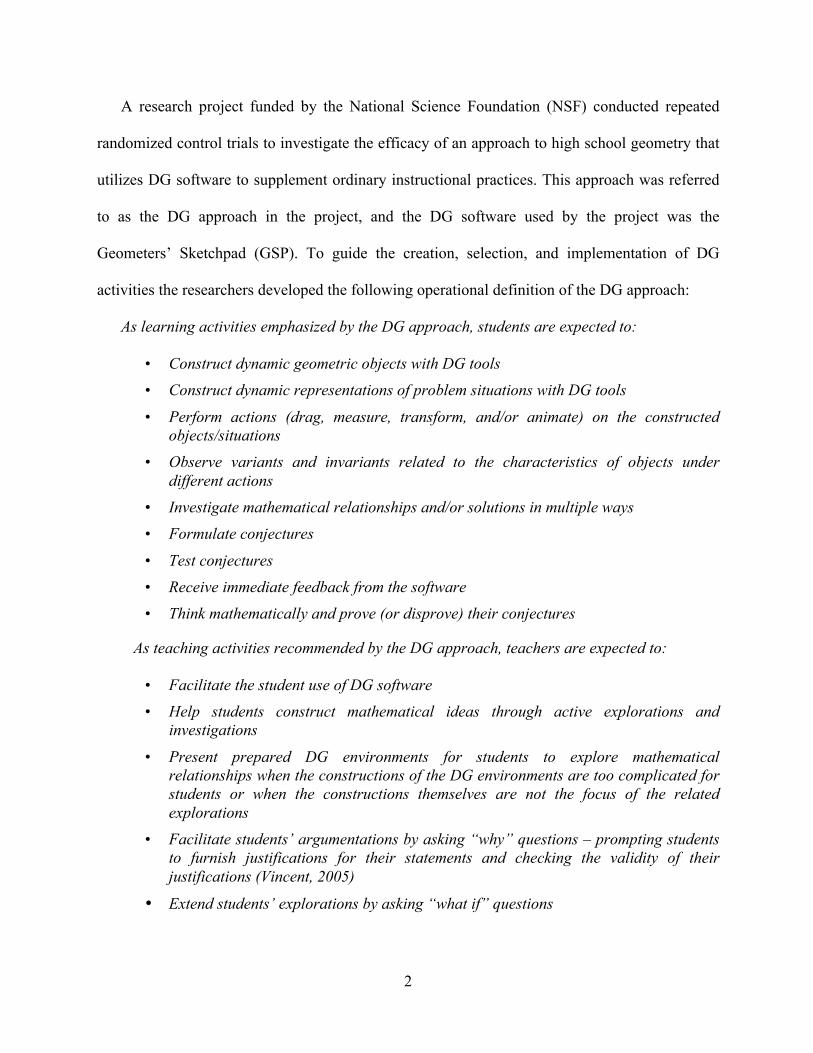
A research project funded by the National Science Foundation (NSF) conducted repeated
randomized control trials to investigate the efficacy of an approach to high school geometry that
utilizes DG software to supplement ordinary instructional practices. This approach was referred
to as the DG approach in the project, and the DG software used by the project was the
Geometers’ Sketchpad (GSP). To guide the creation, selection, and implementation of DG
activities the researchers developed the following operational definition of the DG approach:
As learning activities emphasized by the DG approach, students are expected to:
• Construct dynamic geometric objects with DG tools
• Construct dynamic representations of problem situations with DG tools
• Perform actions (drag, measure, transform, and/or animate) on the constructed objects/situations
• Observe variants and invariants related to the characteristics of objects under different actions
• Investigate mathematical relationships and/or solutions in multiple ways
• Formulate conjectures
• Test conjectures
• Receive immediate feedback from the software
• Think mathematically and prove (or disprove) their conjectures
As teaching activities recommended by the DG approach, teachers are expected to:
• Facilitate the student use of DG software
• Help students construct mathematical ideas through active explorations and investigations
• Present prepared DG environments for students to explore mathematical relationships when the constructions of the DG environments are too complicated for students or when the constructions themselves are not the focus of the related explorations
• Facilitate students’ argumentations by asking “why” questions – prompting students to furnish justifications for their statements and checking the validity of their justifications (Vincent, 2005)
• Extend students’ explorations by asking “what if” questions
3
Based on the operational definition of the DG approach, our basic hypothesis is that use of
DG software to engage students in constructing mathematical ideas through experimentation,
observation, data recording, conjecturing, conjecture testing, and proof results in better geometry
learning experiences for most students.
This paper is to report a study conducted during the second year of the project, whose
purpose was to examine the impact of the professional development designed for and offered to
the teachers in the experimental group. The study built upon related research studies on
mathematics teachers’ professional development (e.g., Carpenter et al., 1989), including those
concentrating on technology-centered (and especially DG-centered) professional development
(Stols et al., 2008; Meng & Sam, 2011).
THEORETICAL FRAMEWORK AND RESEARCH QUESTIONS
An integrative framework (Olive & Makar, 2009) drawing from Constructivism,
Instrumentation Theory and Semiotic Mediation was used to guide the study. Within this
framework, as teachers and students interact with, and in, DG environments these interactions
with the technology tool influence the next acts by each person, and continue in an interplay
between the tool and user. For example, as students "drag" an object and observe outcomes from
that act, the user (teacher or student) adjusts her or his thinking, which in turn influences the next
interaction with the tool. Because DG tools allows users to adjust their sketches and the
relationships within them, users are transforming the tool, their use of the tool, and their
thinking.
This study addresses the following research questions:
1) Did teachers in the experimental group develop stronger conjecturing and proving
abilities than did teachers in the control group?
4
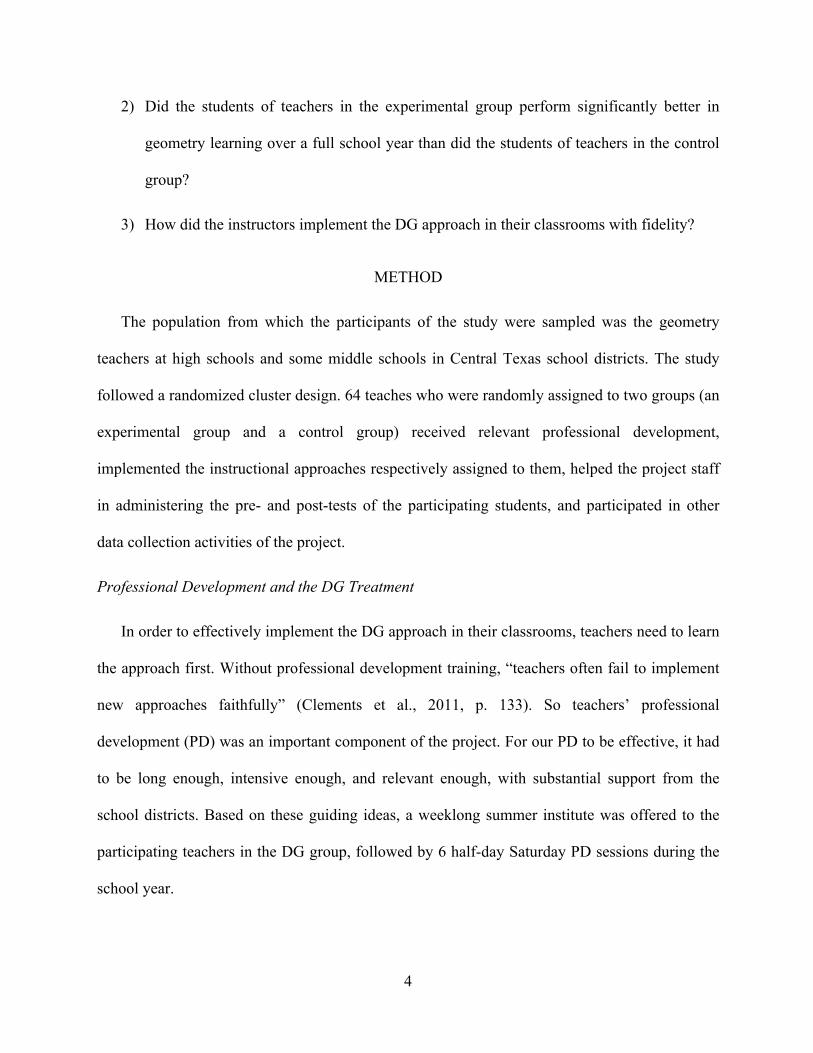
2) Did the students of teachers in the experimental group perform significantly better in
geometry learning over a full school year than did the students of teachers in the control
group?
3) How did the instructors implement the DG approach in their classrooms with fidelity?
METHOD
The population from which the participants of the study were sampled was the geometry
teachers at high schools and some middle schools in Central Texas school districts. The study
followed a randomized cluster design. 64 teaches who were randomly assigned to two groups (an
experimental group and a control group) received relevant professional development,
implemented the instructional approaches respectively assigned to them, helped the project staff
in administering the pre- and post-tests of the participating students, and participated in other
data collection activities of the project.
Professional Development and the DG Treatment
In order to effectively implement the DG approach in their classrooms, teachers need to learn
the approach first. Without professional development training, “teachers often fail to implement
new approaches faithfully” (Clements et al., 2011, p. 133). So teachers’ professional
development (PD) was an important component of the project. For our PD to be effective, it had
to be long enough, intensive enough, and relevant enough, with substantial support from the
school districts. Based on these guiding ideas, a weeklong summer institute was offered to the
participating teachers in the DG group, followed by 6 half-day Saturday PD sessions during the
school year.
5
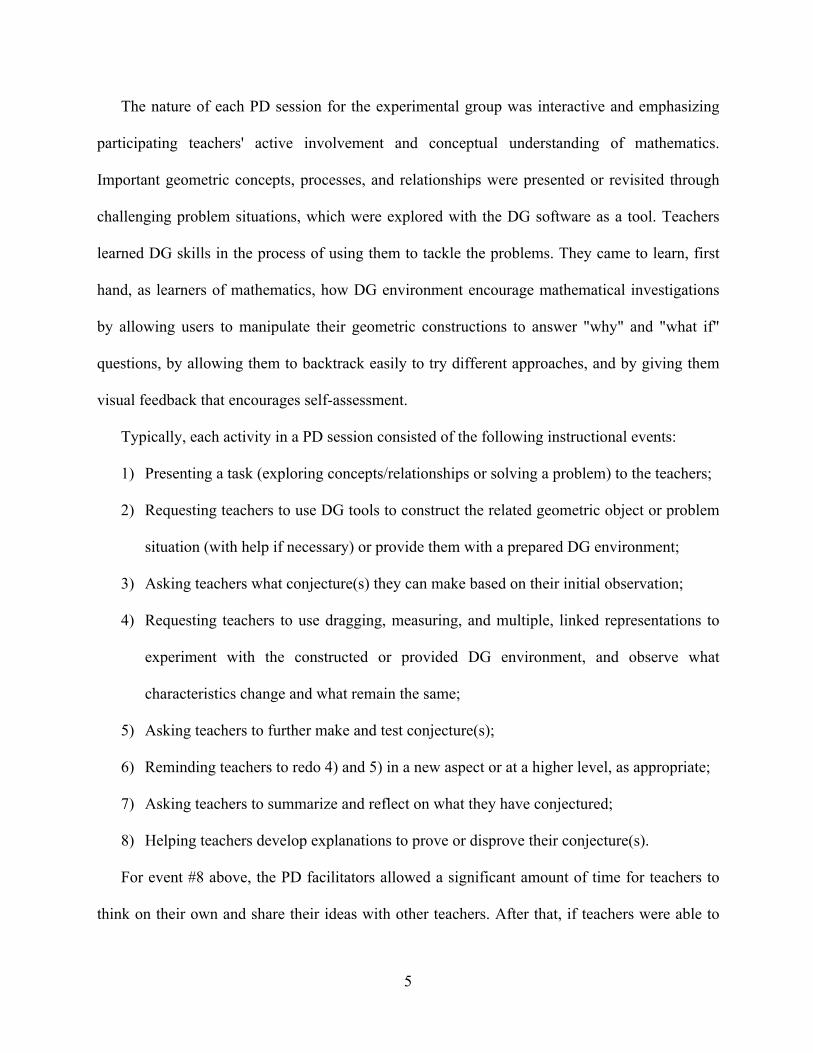
The nature of each PD session for the experimental group was interactive and emphasizing
participating teachers' active involvement and conceptual understanding of mathematics.
Important geometric concepts, processes, and relationships were presented or revisited through
challenging problem situations, which were explored with the DG software as a tool. Teachers
learned DG skills in the process of using them to tackle the problems. They came to learn, first
hand, as learners of mathematics, how DG environment encourage mathematical investigations
by allowing users to manipulate their geometric constructions to answer "why" and "what if"
questions, by allowing them to backtrack easily to try different approaches, and by giving them
visual feedback that encourages self-assessment.
Typically, each activity in a PD session consisted of the following instructional events:
1) Presenting a task (exploring concepts/relationships or solving a problem) to the teachers;
2) Requesting teachers to use DG tools to construct the related geometric object or problem
situation (with help if necessary) or provide them with a prepared DG environment;
3) Asking teachers what conjecture(s) they can make based on their initial observation;
4) Requesting teachers to use dragging, measuring, and multiple, linked representations to
experiment with the constructed or provided DG environment, and observe what
characteristics change and what remain the same;
5) Asking teachers to further make and test conjecture(s);
6) Reminding teachers to redo 4) and 5) in a new aspect or at a higher level, as appropriate;
7) Asking teachers to summarize and reflect on what they have conjectured;
8) Helping teachers develop explanations to prove or disprove their conjecture(s).
For event #8 above, the PD facilitators allowed a significant amount of time for teachers to
think on their own and share their ideas with other teachers. After that, if teachers were able to
6
construct their own proofs, they were encouraged to present the proofs to the large group for a
discussion. For teachers who experienced difficulties, a problem solving strategy – Using
Subproblems – was applied to help them. The task of proving a conjecture was scaffolded as a
series of subproblems (presented as questions) organized in a logical order. As the teachers
finished solving all subproblems, the goal of developing a proof was achieved.
As an example, let’s consider proving the conjecture that the three perpendicular bisectors of
any triangle intersect at a single point. It might be better to consider one perpendicular bisector
first. Therefore, teachers were first asked to solve the following subproblem: Make a conjecture
about the property of the perpendicular bisector of a segment, and prove your conjecture. With
the dynamic moving and measurement features of the software and their knowledge of triangle
congruence, it was relatively easy for teachers to solve this subproblem. Similarly, they were
able to relatively easily solve the second subproblem: What is the converse statement of the
property of the perpendicular bisector of a segment, and prove it. With these two subproblems
solved, it became more straightforward for the teachers to solve the third subproblem: Construct
any two perpendicular bisectors of a triangle, and prove their intersection point being on the
third perpendicular bisector of the triangle. After combining the solutions of all three
subproblems, the original conjecture was successfully proved.
In each PD lesson, teachers either worked individually in front of a computer or worked in
pairs (or small groups). In either case, the facilitators encouraged teachers to share ideas and help
each other. The facilitators circulated, observed (to monitor the progress), asked questions, and
provided necessary help as teachers were working. At the time when a large group discussion
was needed, the facilitators initiated it in a timely manner. During the whole session, assessment
was an integral part of instruction that informed and guided the facilitators as they made training
7
decisions.
In terms of content, the summer part of the PD sessions concentrated on the most important
topics of high school geometry such as triangle congruence and similarity, properties of special
quadrilaterals, properties of circles, and geometric transformations, while the school year follow-
up sessions aligned with the scoop and sequence determined by the participating school districts.
The PD facilitators’ action of leading the teachers to conduct investigations modeled what
teachers were expected to do with students in their classrooms. To further help teachers to
consider changes in their instructional strategies, in the relation between them and their students,
and in how they facilitate student learning, mathematical explorations were always followed by
discussions on questions such as “How will you teach this content in your classrooms using DG
software?” and “How will you lead your students in conjecturing and proving using DG
software?” The PD facilitators realized the importance of teachers learning from each other and
sharing ideas. Therefore, teachers were encouraged to give presentations on their important
insights of DG implementation and successful stories, or to describe problems they anticipated
with other teachers offering suggestions to address the concern. Teachers also worked in groups
of 3 or 4 to prepare lesson plans to share with the entire group.
The control group
The teachers in the control group taught geometry as they had done before. They also
participated in a PD workshop, in which the same mathematical content covered in the DG group
PD sessions was introduced to them in a non-DG environment. The PD facilitators used an
approach that most teachers were currently using – a lecture based, though activity based
instructional methodology – to conduct their training, mainly lecturing, heavily relying on the
textbook, and participants’ problem solving exercises without using technology tools. The
8
amount of instructional time spent on this regular workshop was the same as that for the DG
group PD training. The purpose of holding this non-DG workshop was to address a confounding
variable. With this comparable amount of professional development, if differences appeared on
the project’s measures between the experimental and control groups, we would be able to rule
out the possibility that the mathematics content presented in the DG group PD sessions could
account for them rather than the interactive DG learning environment.
MEASURES AND DATA ANALYSIS
A measure for teachers’ conjecturing-proving knowledge
A conjecturing-proving test was developed by the project team to measure teacher
knowledge. After a series of intensive work (a thorough literature review, construct
development, item development, Advisory Board members’ review, pilot-testing, several round
of revision, etc.), a version of the test consisting of 26 multiple-choice items and two free-
response proofs was produced. The instrument was administered to the teacher participants as
both a pre-test and a post-test at the PD Summer Institute.
Teachers’ implementation fidelity and classroom observations
The DG approach involves using dynamic software intensively in classroom teaching to
facilitate students’ geometric learning. The critical features of the DG approach include using the
dynamic visualization to foster students’ conjecturing spirit, their habit of testing conjectures,
focusing on relationships, and explaining what is observed, their logical reasoning desire and
abilities, as well as their conjecturing-investigating-proving oriented learning style in exploring
problem situations. To determine how to capture these critical features of the DG approach, two
measures of implementation fidelity (the DG Implementation Questionnaire and the Geometry
9
Teaching Observation Protocol [GTOP]) were developed. The DG Implementation
Questionnaire was adapted from a teacher questionnaire developed by the University of Chicago
researchers (Dr. Jeanne Century and her colleagues) in an NSF funded project, based on the
critical features of the DG approach. The final version of the DG Implementation Questionnaire
contains six multiple-choice items and ten open-response questions, which was administered to
the teachers in the experimental group six times across the school year. A different version of the
questionnaire was administered to the control group teachers (also six times) to examine how
they teach geometry without using dynamic technology. The GTOP was adapted from the
Reformed Teaching Observation Protocol (Sawada, et al., 2002), also built on the critical
features of the DG approach. Consisting of 25 items in four sections (Description of intended
dynamic geometry lesson, Description of implemented dynamic geometry lesson, Assessment of
quality of teaching, Assessment of engagement and discourse), the GTOP was administered to 16
participating teachers in both of the two groups (eight selected from each group). Each teacher
was observed four or five times across the school year. For the control group teachers, the GTOP
was a sub-scale of the GTOP for the experimental group teachers. The items removed for the
control group were items in the implementation aspect that were related to the use of software
functions (dragging, dynamic measuring, etc.).
Student level measures
The instruments used for measuring students’ geometry knowledge and skills were: (1) (for
the pre-test) Entering Geometry Test (ENT) used by Usiskin (1981) and his colleagues at
University of Chicago; and (2) (for the post-test) Exiting Geometry Test (XGT). XGT was
developed by selecting items from California Standards Tests – Geometry (CSTG). The final
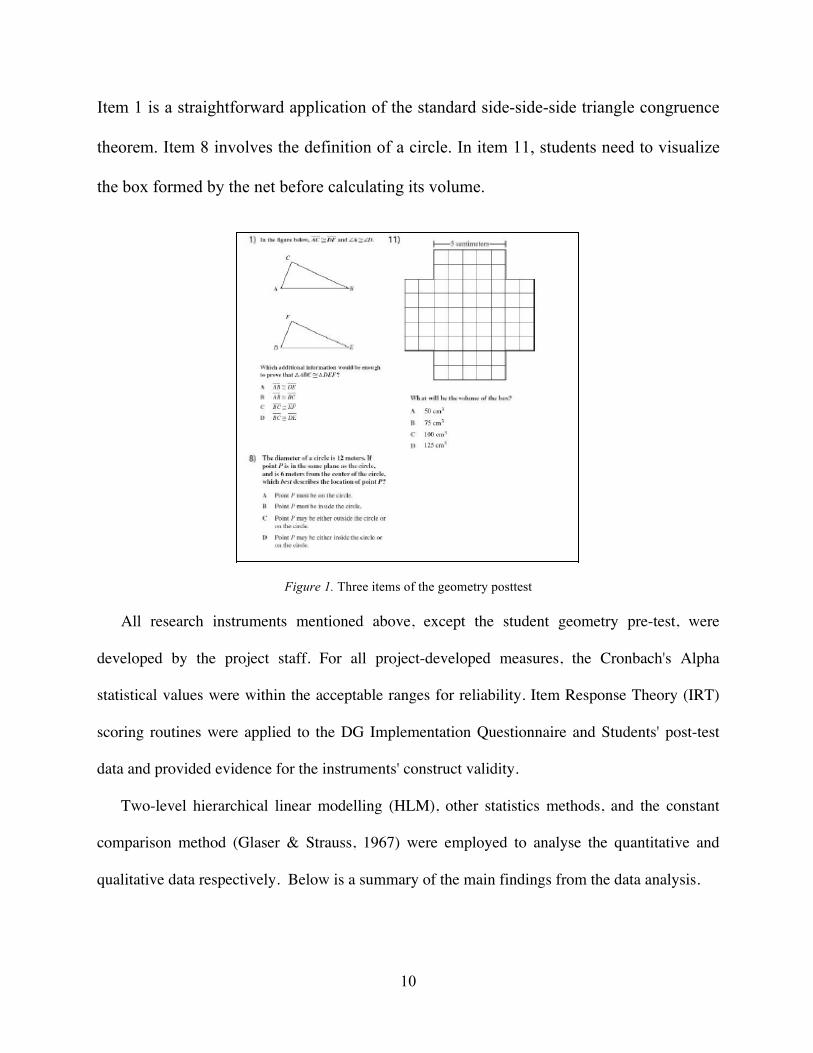
version for XGT has 25 multiple-choice items. Figure 1 shows three examples of the items.
10
Item 1 is a straightforward application of the standard side-side-side triangle congruence
theorem. Item 8 involves the definition of a circle. In item 11, students need to visualize
the box formed by the net before calculating its volume.
Figure 1. Three items of the geometry posttest
All research instruments mentioned above, except the student geometry pre-test, were
developed by the project staff. For all project-developed measures, the Cronbach's Alpha
statistical values were within the acceptable ranges for reliability. Item Response Theory (IRT)
scoring routines were applied to the DG Implementation Questionnaire and Students' post-test
data and provided evidence for the instruments' construct validity.
Two-level hierarchical linear modelling (HLM), other statistics methods, and the constant
comparison method (Glaser & Strauss, 1967) were employed to analyse the quantitative and
qualitative data respectively. Below is a summary of the main findings from the data analysis.
11
RESULTS
Findings from the Conjecturing and Proving Test
This instrument was administered to project participating teachers at the beginning and end
of the weeklong Summer PD Institute. A statistic for overall competence on the instrument was
calculated by adding the number of correct multiple-choice responses with points from free-
response items. Teachers averaged 20.49 on the pre-test and 21.86 on the post-test with an
average gain of 1.37. A paired-sample t-test showed that this gain was statistically significant (p
= .003). This suggests that the professional development had an effect on teachers’ capabilities.
The average gain was greater for the experimental group (1.56) than the control group (1.18).
This difference was not statistically significant (p =.670).
Findings from the Classroom Observations
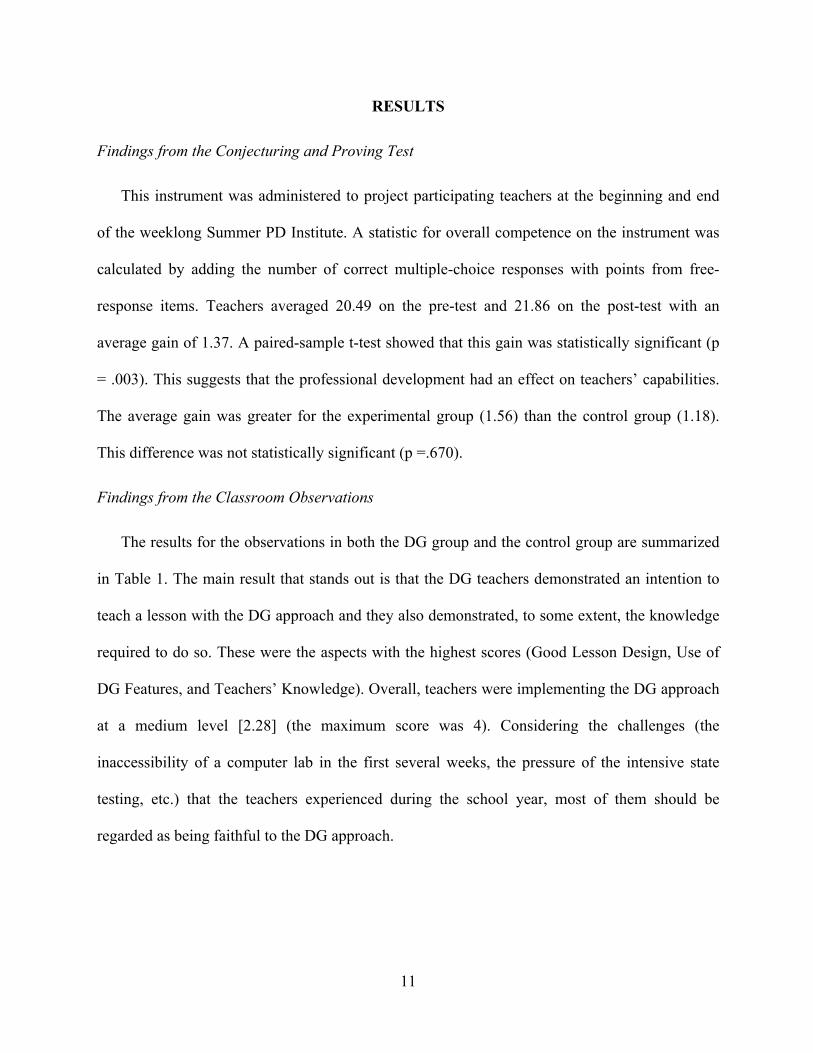
The results for the observations in both the DG group and the control group are summarized
in Table 1. The main result that stands out is that the DG teachers demonstrated an intention to
teach a lesson with the DG approach and they also demonstrated, to some extent, the knowledge
required to do so. These were the aspects with the highest scores (Good Lesson Design, Use of
DG Features, and Teachers’ Knowledge). Overall, teachers were implementing the DG approach
at a medium level [2.28] (the maximum score was 4). Considering the challenges (the
inaccessibility of a computer lab in the first several weeks, the pressure of the intensive state
testing, etc.) that the teachers experienced during the school year, most of them should be
regarded as being faithful to the DG approach.
12
Table 1 Comparison between DG and control groups
Table 1 also shows the comparison between the results for the two groups. The p-values
tested the significance of the treatment effect and were obtained using a mixed effect ANOVA.
As expected, the results showed that the control group did not use dynamic features of the
approach to teaching geometry. Further, the intended lessons for the DG group were significantly
better designed than the control group. In particular, lesson plans for the DG group had in
general appropriate objectives and they were designed to move students from initial conjecture,
to investigation, to more thoughtful conjecture, to verification and proof. Although teachers in
the DG group and teachers in the control group did not differ significantly in other aspects, the
GTOP scores of the DG teachers in these aspects are all higher than those of the control teachers.
(More thorough analysis of the classroom observation data is ongoing.)
Findings from the Implementation Questionnaire
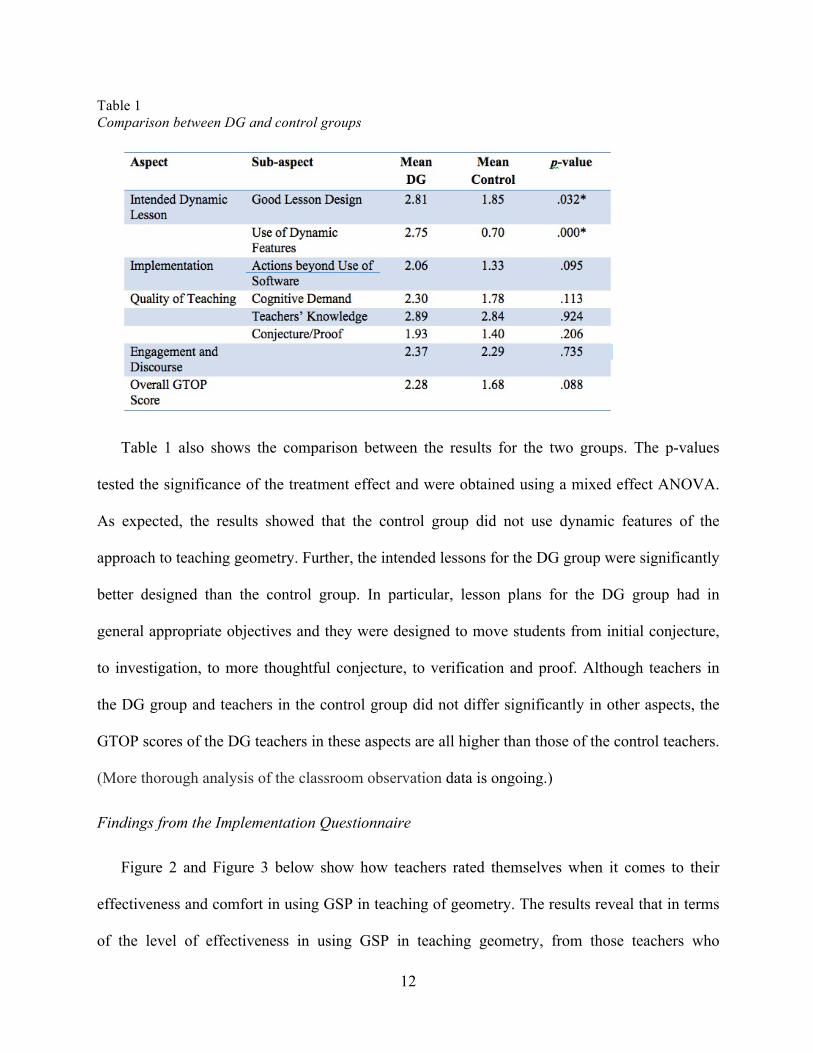
Figure 2 and Figure 3 below show how teachers rated themselves when it comes to their
effectiveness and comfort in using GSP in teaching of geometry. The results reveal that in terms
of the level of effectiveness in using GSP in teaching geometry, from those teachers who
13
completed the questionnaire (total of 31), 29% of the teachers were at the high level, 61% of the
teachers were at the middle level, and 10% of the teachers were at the low level. In addition, it
seems that more teachers felt more comfortable than effective in using GSP in teaching. Only
one teacher did not feel comfortable using GSP in teaching of geometry. An overwhelming
majority of teachers (97%) felt very comfortable or somewhat comfortable in using GSP in
teaching. 22 teachers felt as effective as they felt comfortable in using GSP in teaching of
geometry.
Figure 2. Effectiveness in using GSP Figure 3. Level of comfort in using GSP
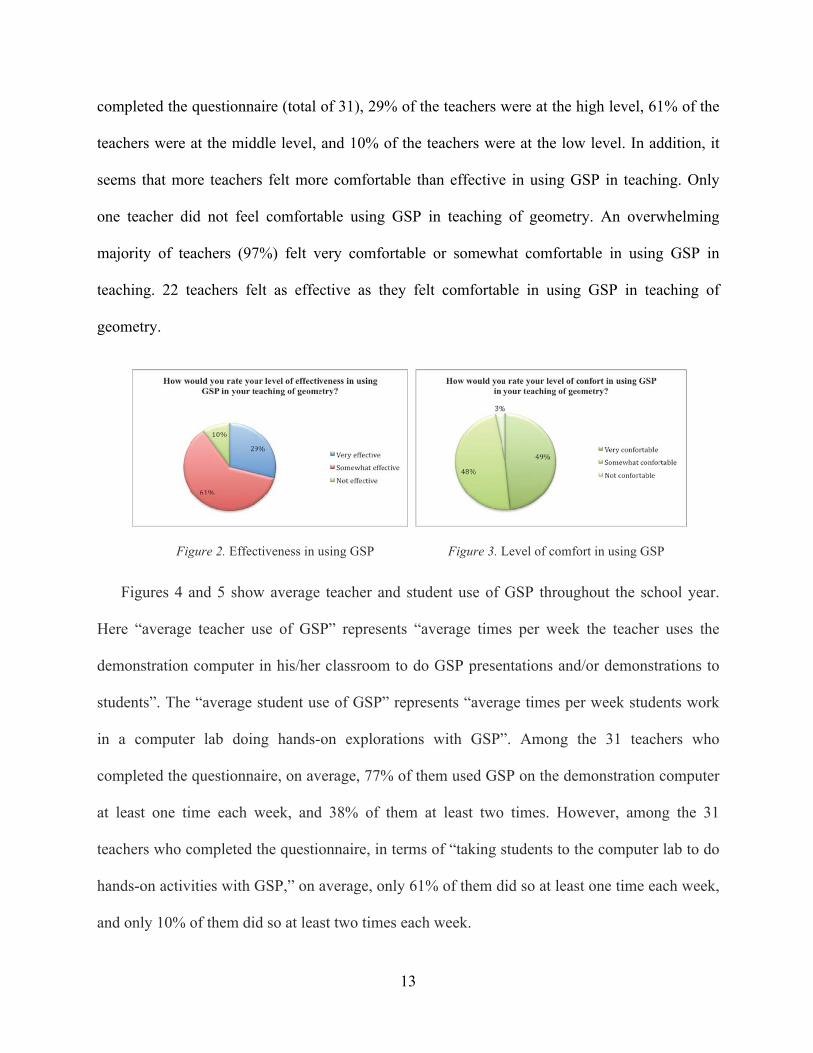
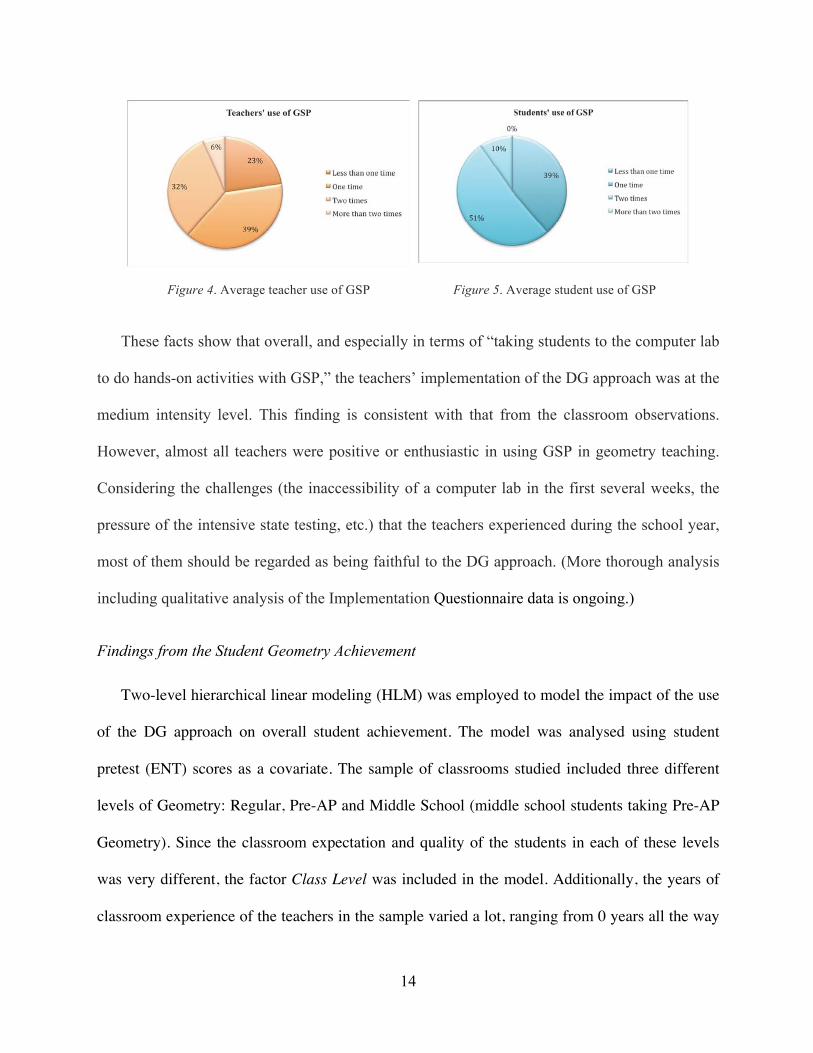
Figures 4 and 5 show average teacher and student use of GSP throughout the school year.
Here “average teacher use of GSP” represents “average times per week the teacher uses the
demonstration computer in his/her classroom to do GSP presentations and/or demonstrations to
students”. The “average student use of GSP” represents “average times per week students work
in a computer lab doing hands-on explorations with GSP”. Among the 31 teachers who
completed the questionnaire, on average, 77% of them used GSP on the demonstration computer
at least one time each week, and 38% of them at least two times. However, among the 31
teachers who completed the questionnaire, in terms of “taking students to the computer lab to do
hands-on activities with GSP,” on average, only 61% of them did so at least one time each week,
and only 10% of them did so at least two times each week.
14
Figure 4. Average teacher use of GSP Figure 5. Average student use of GSP
These facts show that overall, and especially in terms of “taking students to the computer lab
to do hands-on activities with GSP,” the teachers’ implementation of the DG approach was at the
medium intensity level. This finding is consistent with that from the classroom observations.
However, almost all teachers were positive or enthusiastic in using GSP in geometry teaching.
Considering the challenges (the inaccessibility of a computer lab in the first several weeks, the
pressure of the intensive state testing, etc.) that the teachers experienced during the school year,
most of them should be regarded as being faithful to the DG approach. (More thorough analysis
including qualitative analysis of the Implementation Questionnaire data is ongoing.)
Findings from the Student Geometry Achievement
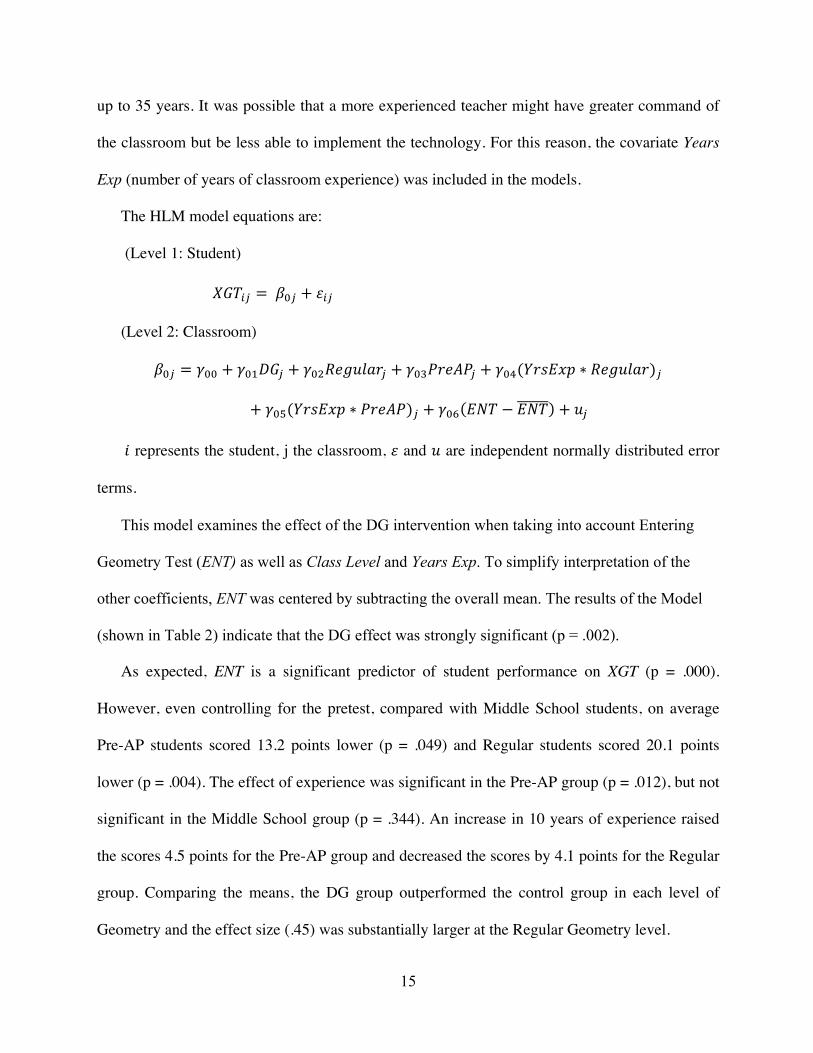
Two-level hierarchical linear modeling (HLM) was employed to model the impact of the use
of the DG approach on overall student achievement. The model was analysed using student
pretest (ENT) scores as a covariate. The sample of classrooms studied included three different
levels of Geometry: Regular, Pre-AP and Middle School (middle school students taking Pre-AP
Geometry). Since the classroom expectation and quality of the students in each of these levels
was very different, the factor Class Level was included in the model. Additionally, the years of
classroom experience of the teachers in the sample varied a lot, ranging from 0 years all the way
15
up to 35 years. It was possible that a more experienced teacher might have greater command of
the classroom but be less able to implement the technology. For this reason, the covariate Years
Exp (number of years of classroom experience) was included in the models.
The HLM model equations are:
(Level 1: Student)
𝑋𝐺𝑇!" = 𝛽!! + 𝜀!"
(Level 2: Classroom)
𝛽!! = 𝛾!! + 𝛾!"𝐷𝐺! + 𝛾!"𝑅𝑒𝑔𝑢𝑙𝑎𝑟! + 𝛾!"𝑃𝑟𝑒𝐴𝑃! + 𝛾!"(𝑌𝑟𝑠𝐸𝑥𝑝 ∗ 𝑅𝑒𝑔𝑢𝑙𝑎𝑟)!
+ 𝛾!"(𝑌𝑟𝑠𝐸𝑥𝑝 ∗ 𝑃𝑟𝑒𝐴𝑃)! + 𝛾!" 𝐸𝑁𝑇 − 𝐸𝑁𝑇 + 𝑢!
𝑖 represents the student, j the classroom, 𝜀 and 𝑢 are independent normally distributed error
terms.
This model examines the effect of the DG intervention when taking into account Entering
Geometry Test (ENT) as well as Class Level and Years Exp. To simplify interpretation of the
other coefficients, ENT was centered by subtracting the overall mean. The results of the Model
(shown in Table 2) indicate that the DG effect was strongly significant (p = .002).
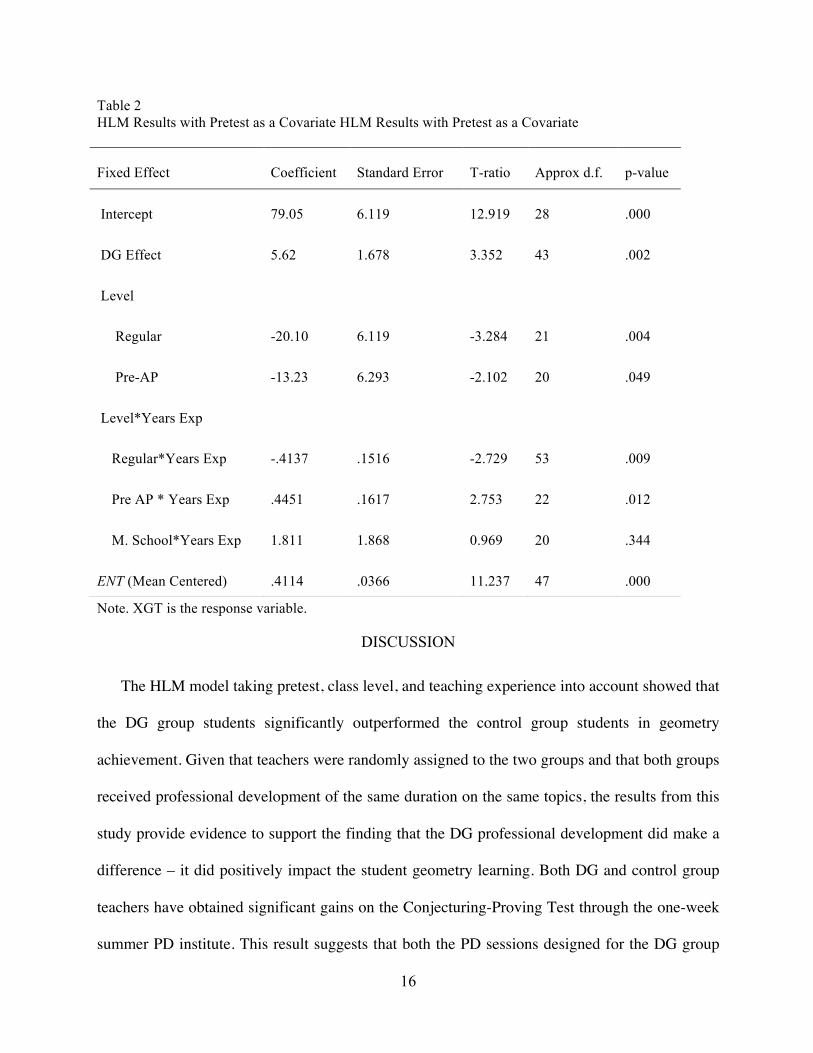
As expected, ENT is a significant predictor of student performance on XGT (p = .000).
However, even controlling for the pretest, compared with Middle School students, on average
Pre-AP students scored 13.2 points lower (p = .049) and Regular students scored 20.1 points
lower (p = .004). The effect of experience was significant in the Pre-AP group (p = .012), but not
significant in the Middle School group (p = .344). An increase in 10 years of experience raised
the scores 4.5 points for the Pre-AP group and decreased the scores by 4.1 points for the Regular
group. Comparing the means, the DG group outperformed the control group in each level of
Geometry and the effect size (.45) was substantially larger at the Regular Geometry level.
16
Table 2 HLM Results with Pretest as a Covariate HLM Results with Pretest as a Covariate
Note. XGT is the response variable.
DISCUSSION
The HLM model taking pretest, class level, and teaching experience into account showed that
the DG group students significantly outperformed the control group students in geometry
achievement. Given that teachers were randomly assigned to the two groups and that both groups
received professional development of the same duration on the same topics, the results from this
study provide evidence to support the finding that the DG professional development did make a
difference – it did positively impact the student geometry learning. Both DG and control group
teachers have obtained significant gains on the Conjecturing-Proving Test through the one-week
summer PD institute. This result suggests that both the PD sessions designed for the DG group
Fixed Effect Coefficient Standard Error T-ratio Approx d.f. p-value
Intercept 79.05 6.119 12.919 28 .000
DG Effect 5.62 1.678 3.352 43 .002
Level
Regular -20.10 6.119 -3.284 21 .004
Pre-AP -13.23 6.293 -2.102 20 .049
Level*Years Exp
Regular*Years Exp -.4137 .1516 -2.729 53 .009
Pre AP * Years Exp .4451 .1617 2.753 22 .012
M. School*Years Exp 1.811 1.868 0.969 20 .344
ENT (Mean Centered) .4114 .0366 11.237 47 .000
17
and those designed for the control group had an effect on teachers’ conjecturing and proving.
Although the DG and control teachers did not differ significantly on their mean gain scores, the
DG teachers’ mean gain score was still 32% higher than that of the control teachers. The
classroom observation data revealed that lesson plans that the DG group teachers prepared were
significantly better designed than the control group, aiming at facilitating students’ conjecturing
and proving abilities. The teacher GTOP scores (overall and in each sub-scale) consistently
favored the DG group although most of the differences were not statistically significant.
In summary, the results of this study suggest that the DG professional development offered to
the participating teachers has had a significant positive effect on the teachers’ change on both
mathematics conjecturing-proving knowledge and teaching strategies. The teachers, in turn,
helped their students achieve better geometry learning. This can be illustrated by the following
comment made by one of the participating teachers: “From the DG technology professional
development I have gained new teaching strategies to engage my geometry students. I have
found by using these learned strategies that my students are able to make their own conjectures
about the figures they construct using the Geometer’s Sketchpad. Many students are both
kinesthetic and visual learners; I am able to reach these students with the dynamic-ness of
constructing using technology.”
REFERENCES
Carpenter, T., Fennema, E., Peterson, P., Chiang, C., & Loef, M. (1989). Using Knowledge of
Children's Mathematics Thinking in Classroom Teaching: An Experimental
Study. American Educational Research Journal, 26, 499-531.
18
Clements, D. H., Sarama, J., Spitler, M. E., Lange, A. A., & Wolfe, C. B. (2011). Mathematics
learned by young children in an intervention based on learning trajectories: A large-scale
cluster randomized trial. Journal for Research in Mathematics Education, 42, 127-166.
Common Core State Standards Initiative (CCSSI). (2010). Common core state standards for
mathematics. Washington, DC: National Governors Association Center for Best Practices
and the Council of Chief State School Officers.
Glaser, B. G., & Strauss, A. L. (1967). Discovery of grounded theory: Strategies for qualitative
research. Chicago: Aldine.
Hohenwarter, M. (2001). GeoGebra (4.2.3.0 ed.) http://www.geogebra.org/cms/en/
Meng, C & Sam, L. (2011). Encourage the innovative use of Geometer’s Sketchpad through
lesson study. Creative Education. 2, 236-243.
Olive, J. & Makar, K. (2009). Mathematical knowledge and practices resulting from access to
digital technologies. In C. Hoyles & J-B. Lagrange (Eds.), Mathematics Education and
Technology: Rethinking the Terrain, 133-178. The Netherlands: Springer.
Sawada, D., Piburn, M. D., Judson, E., Turley, J., Falconer, K., Benford, R., & Bloom, I. (2002).
Measuring reform practices in science and mathematics classrooms: The reformed teaching
observation protocol. School Science and Mathematics, 102, 245-253.
Schoenfeld, A. (1983). Problem solving in the mathematics curriculum: A report,
recommendations, and an annotated bibliography. Washington, D.C.: Mathematical
Association of America.
Stols, G., Mji, A. & Wessels, D. (2008). The potential of Teacher Professional Development
with Geometer’s Sketchpad. Pythagoras, 68, 15-21.
Usiskin, Z. (1982). Van Hiele levels and achievement in secondary school geometry (Final report
19
of the Cognitive Development and Achievement in Secondary School Geometry Project).
Chicago: University of Chicago, Department of Education.
Vincent, J. (2005). Interactive geometry software and mechanical linkages: Scaffolding students’
deductive reasoning. Chapter in W. Masalski, National Council of Teachers of Mathematics
2005 Yearbook.
ACKNOWLEDGMENTS
This material is based upon work supported by the National Science Foundation under Grant No.
0918744. Any opinions, findings and conclusions or recommendations expressed in this material
are those of the authors and do not necessarily reflect the views of the National Science
Foundation.
We would like to thank Sharon Strickland and Ewelina McBroom for their contribution to data
collection and analysis.