Embed Size (px)
Citation preview
DI
SC
US
SI
ON
P
AP
ER
S
ER
IE
S
Forschungsinstitut zur Zukunft der ArbeitInstitute for the Study of Labor
The Impact of 9/11 and the London Bombings on the Employment and Earnings of U.K. Muslims
IZA DP No. 4763
February 2010
Faisal RabbyWilliam M. Rodgers III
The Impact of 9/11 and the London Bombings on the Employment and
Earnings of U.K. Muslims
Faisal Rabby Missouri State University
and IZA
William M. Rodgers III Rutgers University
and National Poverty Center
Discussion Paper No. 4763 February 2010
IZA
P.O. Box 7240 53072 Bonn
Germany
Phone: +49-228-3894-0 Fax: +49-228-3894-180
E-mail: [email protected]
Any opinions expressed here are those of the author(s) and not those of IZA. Research published in this series may include views on policy, but the institute itself takes no institutional policy positions. The Institute for the Study of Labor (IZA) in Bonn is a local and virtual international research center and a place of communication between science, politics and business. IZA is an independent nonprofit organization supported by Deutsche Post Foundation. The center is associated with the University of Bonn and offers a stimulating research environment through its international network, workshops and conferences, data service, project support, research visits and doctoral program. IZA engages in (i) original and internationally competitive research in all fields of labor economics, (ii) development of policy concepts, and (iii) dissemination of research results and concepts to the interested public. IZA Discussion Papers often represent preliminary work and are circulated to encourage discussion. Citation of such a paper should account for its provisional character. A revised version may be available directly from the author.
IZA Discussion Paper No. 4763 February 2010
ABSTRACT
The Impact of 9/11 and the London Bombings on the Employment and Earnings of U.K. Muslims*
Using a difference-in-differences framework, this paper estimates the impact that Britain’s July 2005 bombings had on the labor market outcomes of UK residents who are either Muslim by religious affiliation or whose nativity profiles are similar to the terrorists. We find a 10 percentage point decrease in the employment of very young Muslim men relative to non-Muslim immigrants after the London bombings. The drop in employment is accompanied by consistent declines in real earnings and hours worked. A weak association between the 9-11 terrorist attacks and a drop in the employment of very young male immigrants from Muslim-majority countries is also found. The terrorist events had little impact on the employment of older men. JEL Classification: J15, J23, J61, J71 Keywords: Muslim, ethnic minority, minorities, 9/11, employment, London bombings Corresponding author: Faisal Rabby Department of Economics Missouri State University 901 S National Avenue, Strong 371 Springfield, MO 65897 USA E-mail: [email protected]
* An earlier version of this paper was presented at the meetings of the Southern Economic Association, November 2008. We thank Anne Piehl, John Landon-Lane and Ira Gang for helpful comments and suggestions on an earlier version of this paper.
2
I. Introduction
The 9-11 terrorists attacks, the March 2004 Madrid bombings, and the July 2005 London
bombings (the bombings on 7th
July and the attempted bombings on July 21st will be called the
―July bombings‖ hereafter) served as a catalyst for an upsurge in anger and animosity toward
Arabs and Muslims living in the United Kingdom.1 These events triggered an increase in
discrimination that existed prior to 9-11 and the July Bombings.
The source of the pre-existing discrimination has been attributed to the resilient nature of
Muslim religious identity, the slow pace of assimilation into the rest of British society, and the
weaker soft skills (e.g., language) of Muslims. For example, Shields and Price (2003) find that
even after accounting for differences in job-related characteristics, across the various ethnic
minority migrant groups, Pakistani and Bangladeshi migrants are less successful in the labor
market. This may be due to lower labor demand, especially for Pakistani and Bangladeshi
women.
Ameli et al. (2004) find from a pre 9-11 nationwide survey of 1,200 Muslims that
Muslim women reported far greater discrimination than Muslim men (IHRC 1999, 2000). After
9/11, the gender difference in reported discrimination narrowed to 2 percentage points (men (78
percent and women 80 percent). The targeting by police and security services of Muslim men
appears to explain the narrowing. However, approximately 80 percent of employed Muslims
reported incidences of discrimination in the workplace. Similar anti-Muslim responses occurred
in the Netherlands and Denmark.2
There have been three studies that estimate the impact of the terrorist events‘ on the labor
market outcomes of British Muslims. The evidence suggests no deterioration in the earnings and
employment of Muslims can be attributed to the terrorist events. Braakmann (2007a) estimates
3
difference-in-differences models using data from the British Labor force survey (LFS) to identify
9-11‘s impacts, the beginning of the US involvement in Iraq, the Madrid train, and London
bombings on the labor market outcomes of 16 to 64 year old UK Arab and Muslim men.
Braakman finds that the terrorist attacks had no impact on the real wages, hours worked, and
employment probabilities of Arab men. Braakmann (2007b) studies the effects of 9/11 on the re-
employment prospects of unemployed Arabs living in Germany, and also finds no change in
employment prospects.
Aslund and Rooth (2005) report that after 9/11, Swedish public attitude towards certain
minorities changed. However, their analysis of detailed unemployment exit data on the entire
Swedish working-age population reveals little evidence of relative changes in the unemployment
exit or entry of the eight Muslim-looking minority groups. They conclude that employers behave
rationally and do not respond to changes in attitudes toward immigrants as a group.
This paper revisits the following questions. Did UK labor market outcomes become
worse for Muslims and immigrants from Muslim-majority countries after 9/11 and after the July
bombings? We revisit this question because we suspect that estimates based on the general or
working age population mask the adverse impact that Muslim men who fit the age profile of the
terrorists faced.
Using the British LFS and a difference-in-differences (DD) methodology, we find that 9-
11 was associated with a relative decrease in the employment of 16 to 25 year old immigrant
men from Muslim-majority countries or men who are Muslims by religious affiliation compared
to other immigrants. A 10 percentage point decrease in the employment of very young Muslim
men relative to non-Muslim immigrants occurred shortly after the London bombings. The drop
in employment is accompanied by consistent declines in real earnings and hours worked. A weak
4
association between the 9-11 terrorist attacks and a drop in the employment of very young male
immigrants from Muslim-majority countries is also found. The terrorist events had little impact
on the employment of older men.
III. Methods
Our central method is difference-in-differences, where we compare the change in the
employment-population ratio, hours worked per week, and real weekly earnings of a target group
to that of a comparison group.3 Thus, we attempt to remove the impact that labor supply, labor
demand and institutional factors have on target group outcomes.4
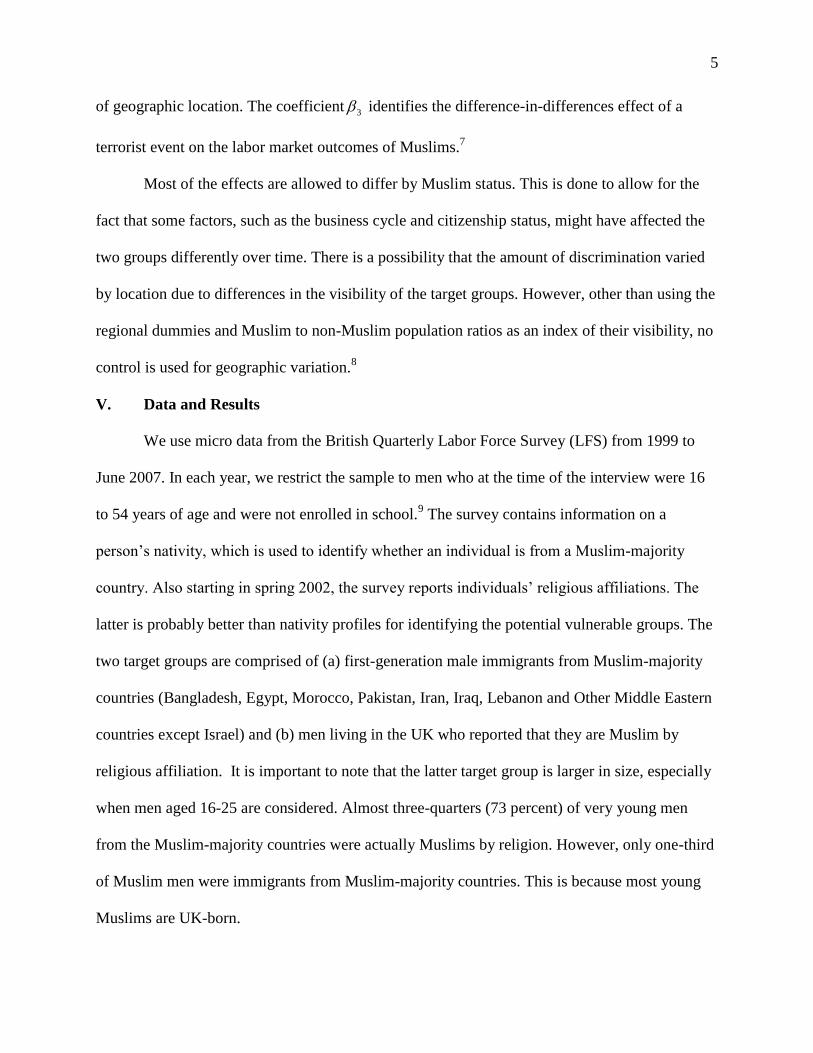
More formally, outcomes for the ith person are described as follows:
,uTrendβ)Muslim*(Regionβ
Regionβ)Muslim*(Quarterβ Quarter β)Muslim*(ZβZβ
)Muslim*(XβXβ)Muslim*(Afterβ MuslimβAfterββY
irtt12irtr11
r10irtt98irtrt7rt6
irtirt5irt4irtt3irt2t10irt
(1)
where irtY denotes the labor market outcome of person i in region r at time t, tAfter denotes a
dummy variable that equals one if the observation comes from any month after a terrorist event
(e.g., September 2001 or July 2005), and zero otherwise, and irtX denotes a vector of individual
characteristics that include potential experience, educational attainment, race and ethnicity,
marital status, length of stay in the UK, and UK citizenship status. In our earnings equations,
irtX contains occupation and industry variables.5
The term rtZ represents quarterly regional unemployment rates, and tQuarter contains a
series of dummy variables that denote the interview quarter to capture seasonality, and tTrend is
as a cubic function of time (starting from 1 for January 1999) to control for unmeasured, time-
varying influences.6 The term Regionr denotes dummy variables that capture differential effects
5
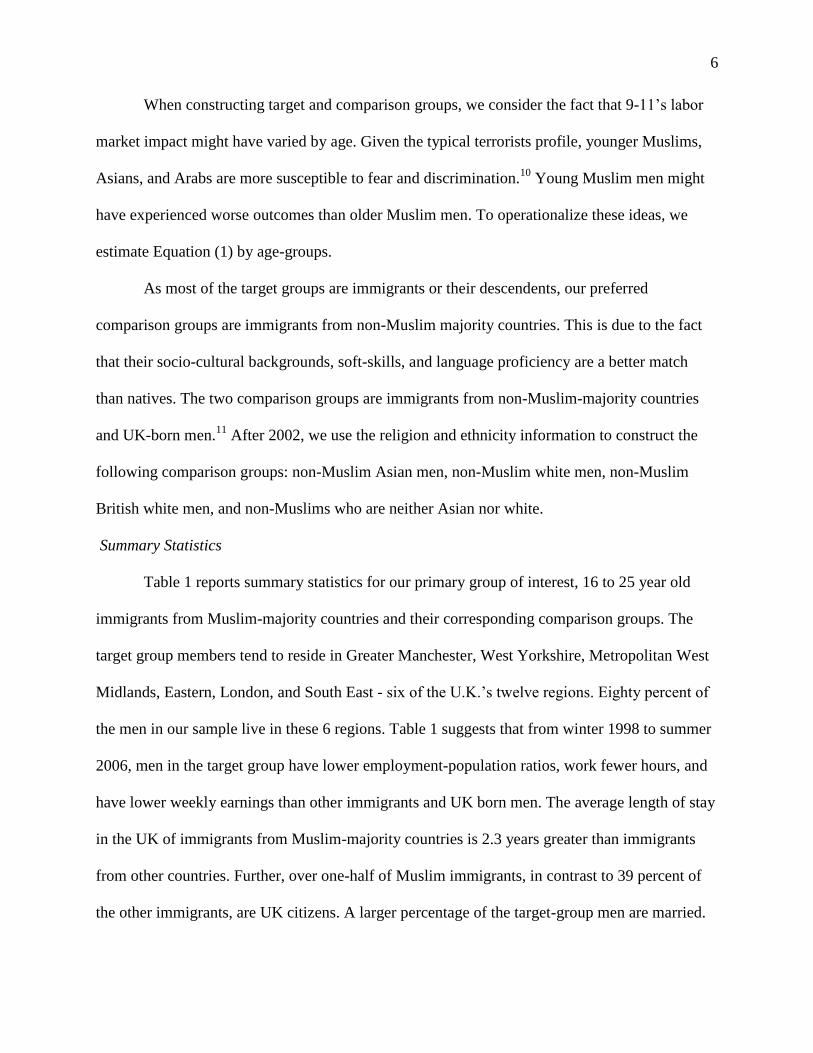
of geographic location. The coefficient 3 identifies the difference-in-differences effect of a
terrorist event on the labor market outcomes of Muslims.7
Most of the effects are allowed to differ by Muslim status. This is done to allow for the
fact that some factors, such as the business cycle and citizenship status, might have affected the
two groups differently over time. There is a possibility that the amount of discrimination varied
by location due to differences in the visibility of the target groups. However, other than using the
regional dummies and Muslim to non-Muslim population ratios as an index of their visibility, no
control is used for geographic variation.8
V. Data and Results
We use micro data from the British Quarterly Labor Force Survey (LFS) from 1999 to
June 2007. In each year, we restrict the sample to men who at the time of the interview were 16
to 54 years of age and were not enrolled in school.9 The survey contains information on a
person‘s nativity, which is used to identify whether an individual is from a Muslim-majority
country. Also starting in spring 2002, the survey reports individuals‘ religious affiliations. The
latter is probably better than nativity profiles for identifying the potential vulnerable groups. The
two target groups are comprised of (a) first-generation male immigrants from Muslim-majority
countries (Bangladesh, Egypt, Morocco, Pakistan, Iran, Iraq, Lebanon and Other Middle Eastern
countries except Israel) and (b) men living in the UK who reported that they are Muslim by
religious affiliation. It is important to note that the latter target group is larger in size, especially
when men aged 16-25 are considered. Almost three-quarters (73 percent) of very young men
from the Muslim-majority countries were actually Muslims by religion. However, only one-third
of Muslim men were immigrants from Muslim-majority countries. This is because most young
Muslims are UK-born.
6
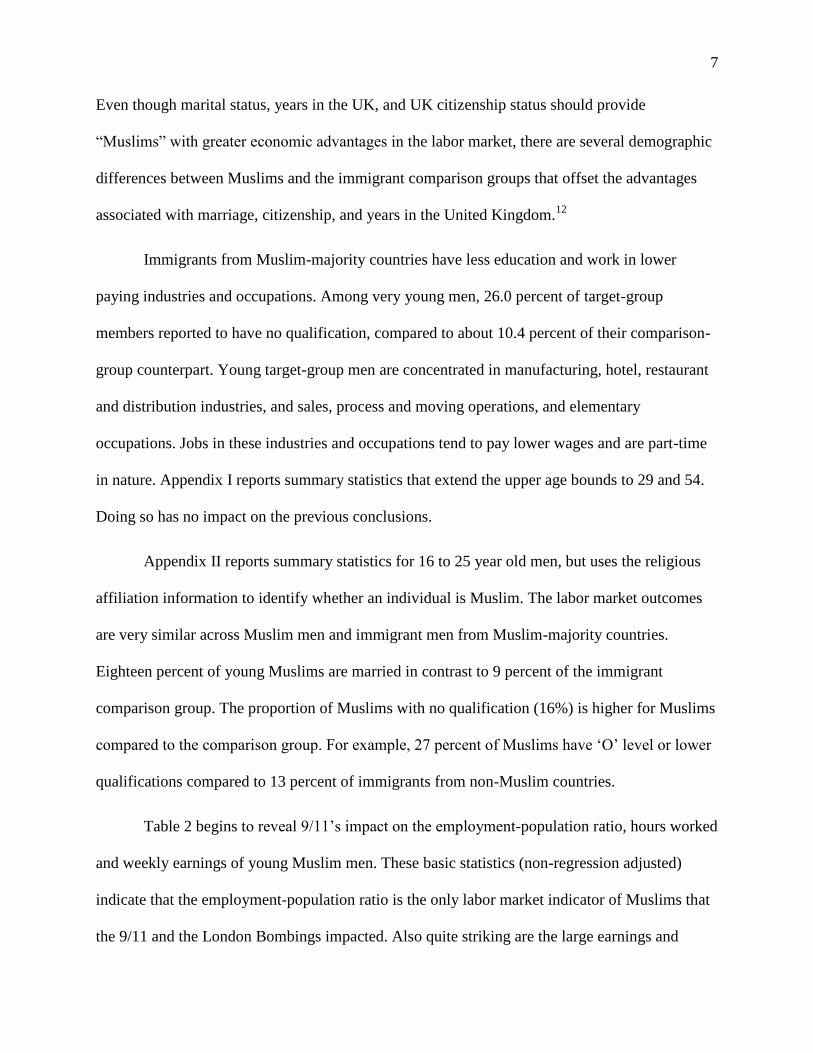
When constructing target and comparison groups, we consider the fact that 9-11‘s labor
market impact might have varied by age. Given the typical terrorists profile, younger Muslims,
Asians, and Arabs are more susceptible to fear and discrimination.10
Young Muslim men might
have experienced worse outcomes than older Muslim men. To operationalize these ideas, we
estimate Equation (1) by age-groups.
As most of the target groups are immigrants or their descendents, our preferred
comparison groups are immigrants from non-Muslim majority countries. This is due to the fact
that their socio-cultural backgrounds, soft-skills, and language proficiency are a better match
than natives. The two comparison groups are immigrants from non-Muslim-majority countries
and UK-born men.11
After 2002, we use the religion and ethnicity information to construct the
following comparison groups: non-Muslim Asian men, non-Muslim white men, non-Muslim
British white men, and non-Muslims who are neither Asian nor white.
Summary Statistics
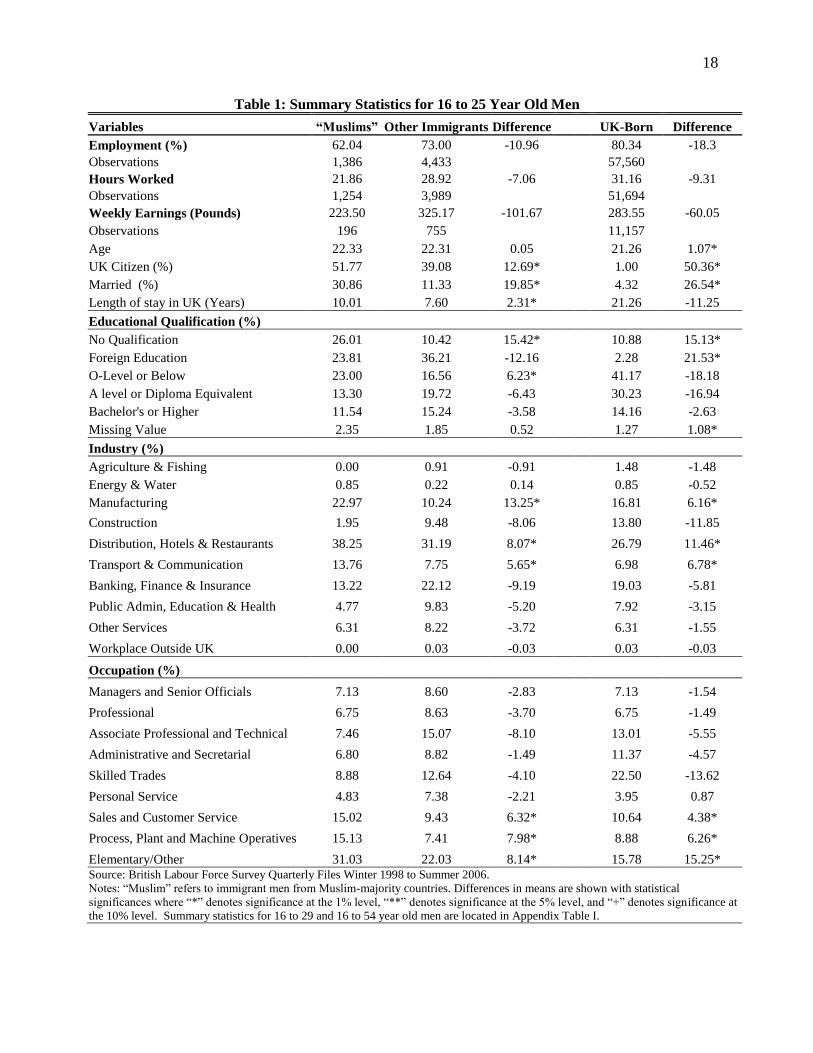
Table 1 reports summary statistics for our primary group of interest, 16 to 25 year old
immigrants from Muslim-majority countries and their corresponding comparison groups. The
target group members tend to reside in Greater Manchester, West Yorkshire, Metropolitan West
Midlands, Eastern, London, and South East - six of the U.K.‘s twelve regions. Eighty percent of
the men in our sample live in these 6 regions. Table 1 suggests that from winter 1998 to summer
2006, men in the target group have lower employment-population ratios, work fewer hours, and
have lower weekly earnings than other immigrants and UK born men. The average length of stay
in the UK of immigrants from Muslim-majority countries is 2.3 years greater than immigrants
from other countries. Further, over one-half of Muslim immigrants, in contrast to 39 percent of
the other immigrants, are UK citizens. A larger percentage of the target-group men are married.
7
Even though marital status, years in the UK, and UK citizenship status should provide
―Muslims‖ with greater economic advantages in the labor market, there are several demographic
differences between Muslims and the immigrant comparison groups that offset the advantages
associated with marriage, citizenship, and years in the United Kingdom.12
Immigrants from Muslim-majority countries have less education and work in lower
paying industries and occupations. Among very young men, 26.0 percent of target-group
members reported to have no qualification, compared to about 10.4 percent of their comparison-
group counterpart. Young target-group men are concentrated in manufacturing, hotel, restaurant
and distribution industries, and sales, process and moving operations, and elementary
occupations. Jobs in these industries and occupations tend to pay lower wages and are part-time
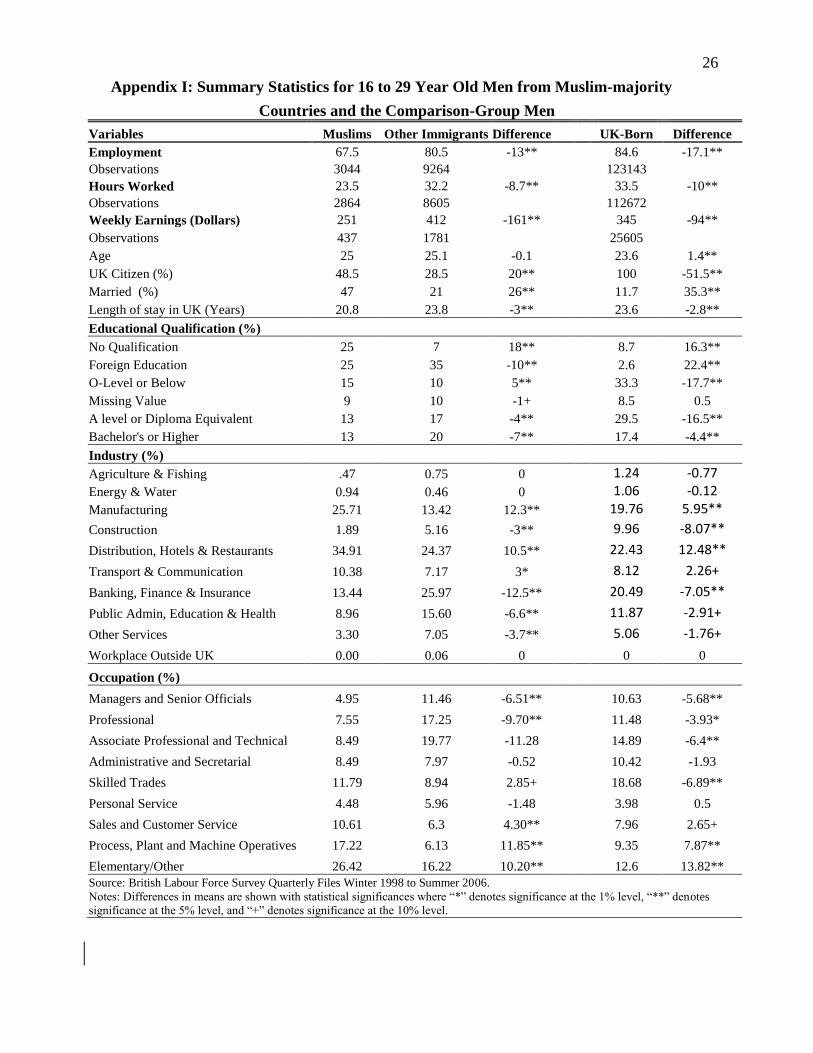
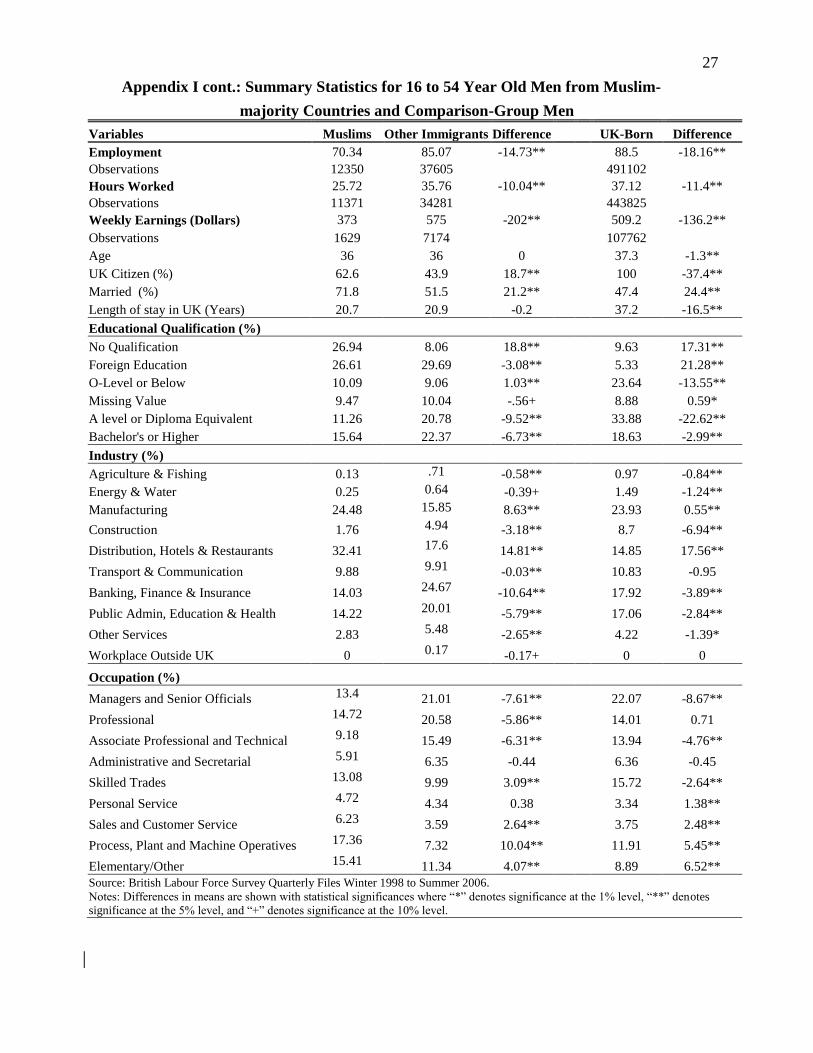
in nature. Appendix I reports summary statistics that extend the upper age bounds to 29 and 54.
Doing so has no impact on the previous conclusions.
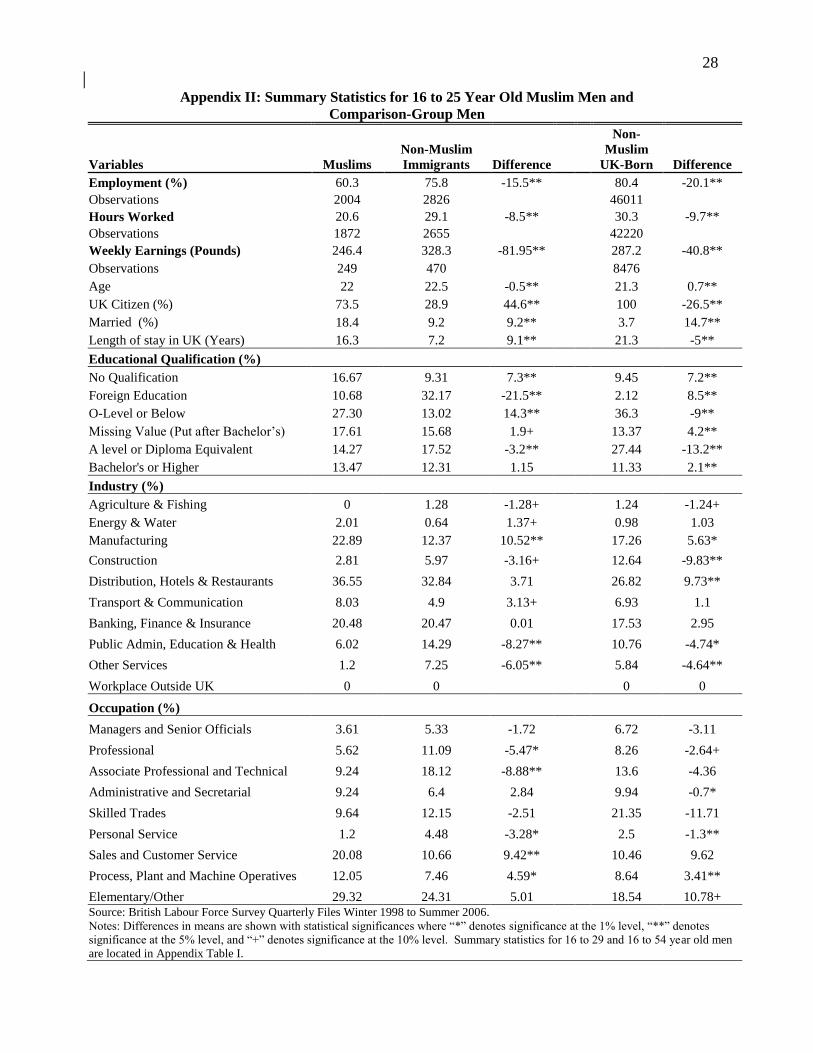
Appendix II reports summary statistics for 16 to 25 year old men, but uses the religious
affiliation information to identify whether an individual is Muslim. The labor market outcomes
are very similar across Muslim men and immigrant men from Muslim-majority countries.
Eighteen percent of young Muslims are married in contrast to 9 percent of the immigrant
comparison group. The proportion of Muslims with no qualification (16%) is higher for Muslims
compared to the comparison group. For example, 27 percent of Muslims have ‗O‘ level or lower
qualifications compared to 13 percent of immigrants from non-Muslim countries.
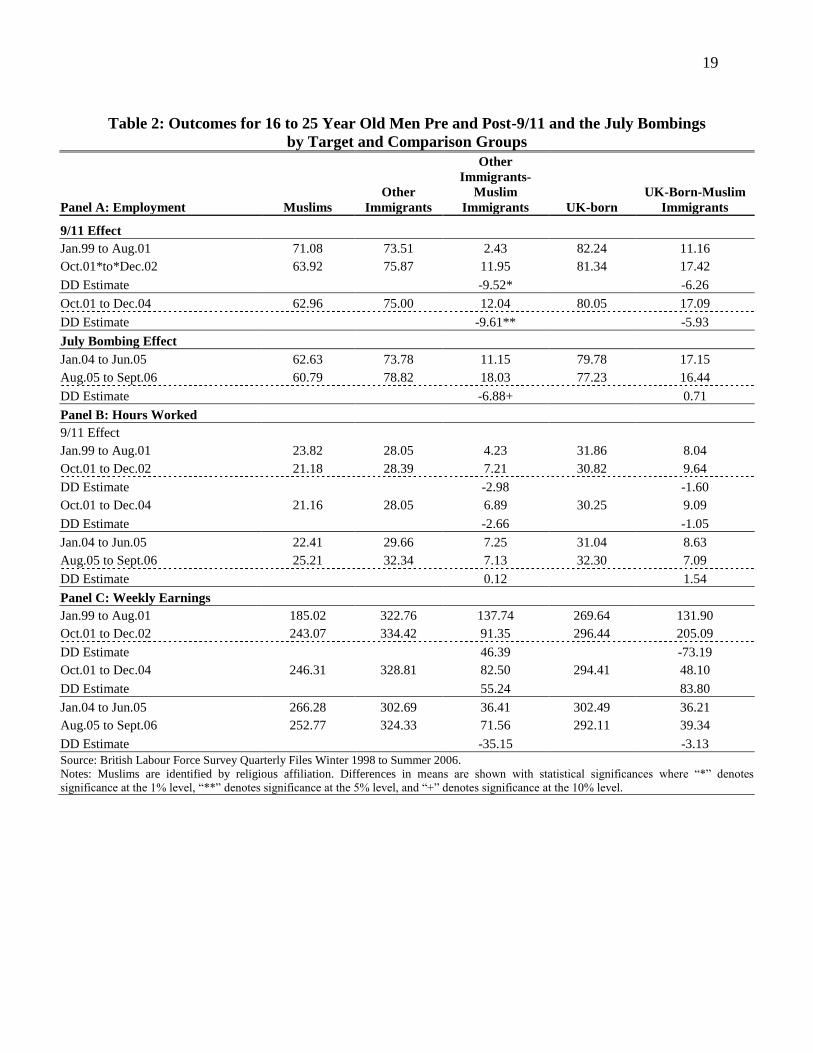
Table 2 begins to reveal 9/11‘s impact on the employment-population ratio, hours worked
and weekly earnings of young Muslim men. These basic statistics (non-regression adjusted)
indicate that the employment-population ratio is the only labor market indicator of Muslims that
the 9/11 and the London Bombings impacted. Also quite striking are the large earnings and
8
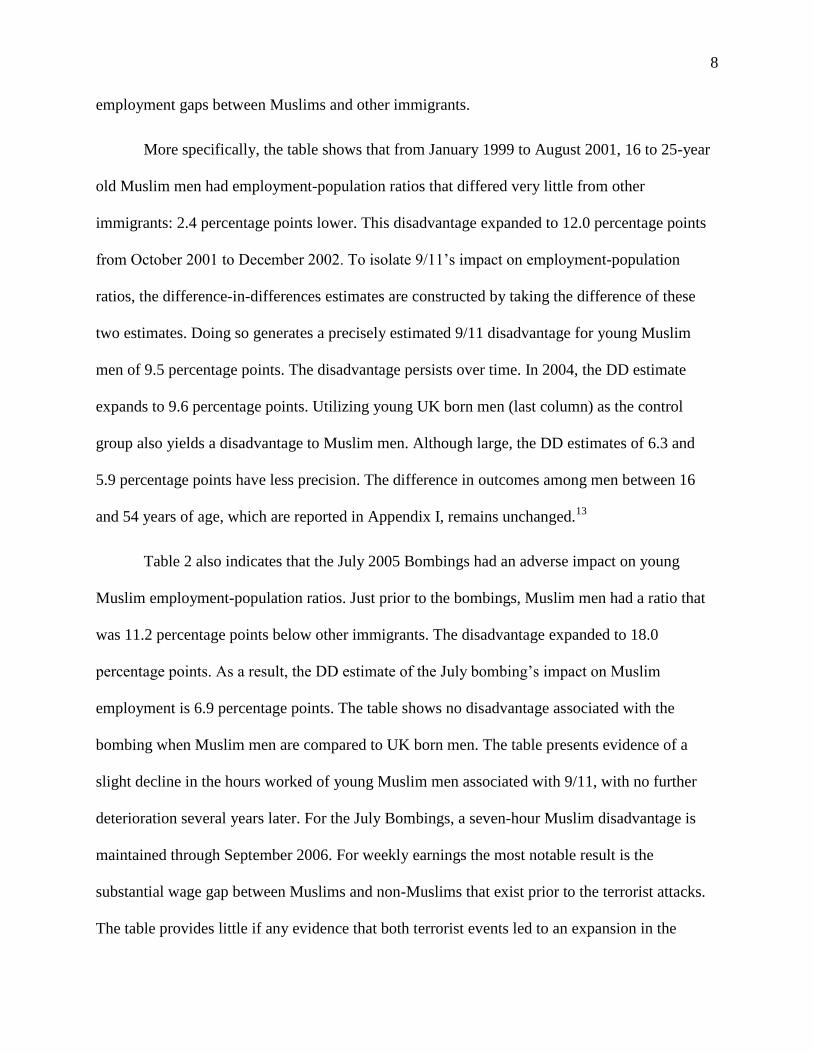
employment gaps between Muslims and other immigrants.
More specifically, the table shows that from January 1999 to August 2001, 16 to 25-year
old Muslim men had employment-population ratios that differed very little from other
immigrants: 2.4 percentage points lower. This disadvantage expanded to 12.0 percentage points
from October 2001 to December 2002. To isolate 9/11‘s impact on employment-population
ratios, the difference-in-differences estimates are constructed by taking the difference of these
two estimates. Doing so generates a precisely estimated 9/11 disadvantage for young Muslim
men of 9.5 percentage points. The disadvantage persists over time. In 2004, the DD estimate
expands to 9.6 percentage points. Utilizing young UK born men (last column) as the control
group also yields a disadvantage to Muslim men. Although large, the DD estimates of 6.3 and
5.9 percentage points have less precision. The difference in outcomes among men between 16
and 54 years of age, which are reported in Appendix I, remains unchanged.13
Table 2 also indicates that the July 2005 Bombings had an adverse impact on young
Muslim employment-population ratios. Just prior to the bombings, Muslim men had a ratio that
was 11.2 percentage points below other immigrants. The disadvantage expanded to 18.0
percentage points. As a result, the DD estimate of the July bombing‘s impact on Muslim
employment is 6.9 percentage points. The table shows no disadvantage associated with the
bombing when Muslim men are compared to UK born men. The table presents evidence of a
slight decline in the hours worked of young Muslim men associated with 9/11, with no further
deterioration several years later. For the July Bombings, a seven-hour Muslim disadvantage is
maintained through September 2006. For weekly earnings the most notable result is the
substantial wage gap between Muslims and non-Muslims that exist prior to the terrorist attacks.
The table provides little if any evidence that both terrorist events led to an expansion in the

9
earnings gap between Muslim and other immigrants, and Muslims and UK born men.
Regression Results
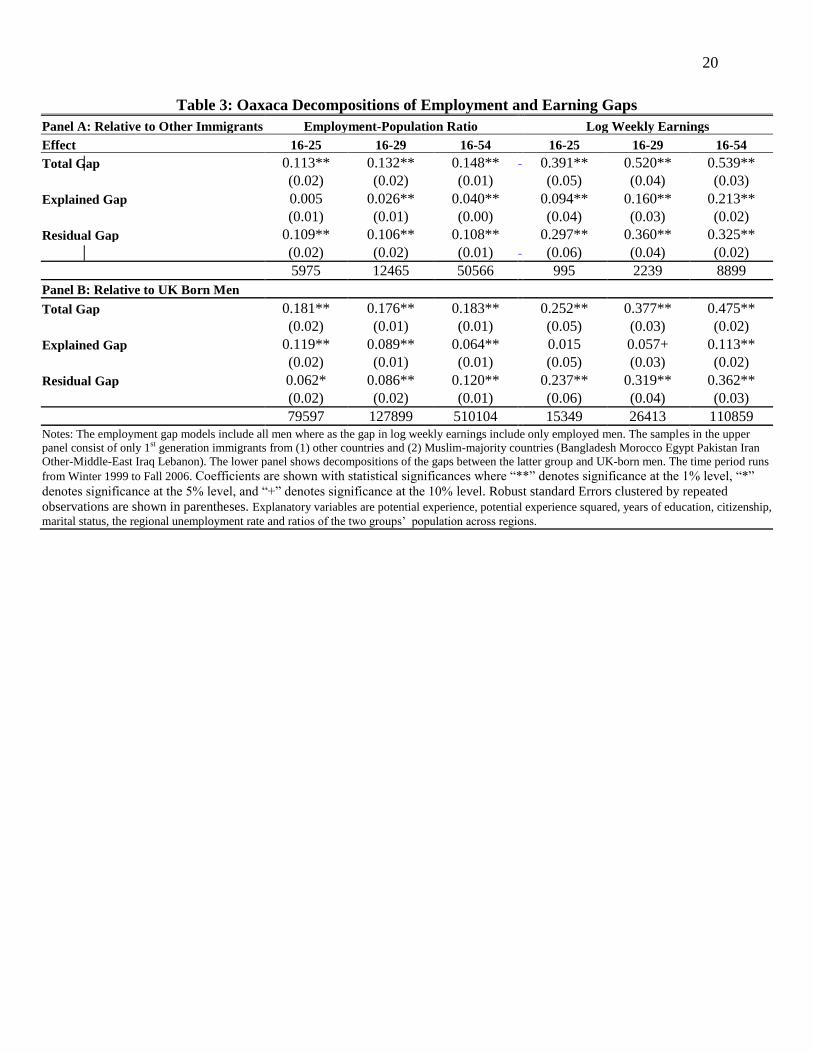
Before presenting the difference-in-differences estimates, we identify the sources of the
large employment and earnings gaps between Muslims and other immigrants. To do this, we
construct Oaxaca-Blinder decompositions of the employment and earning gaps between Muslims
and other immigrants (UK born). The gaps are quite sizeable across age groups, which suggest
that even older men might be susceptible to employment and earnings losses due to the terrorist
events.
The decompositions in Table 3 indicate that from 1999 to 2006, the employment of
immigrants from Muslim countries is 11.3 to 14.8 percentage points lower than other
immigrants. Approximately, 10 percentage points or 70 to 95 percent of this difference is
unexplained.14
For weekly earnings, a 39 to 54 percent gap exists, out of which 30 to 35
percentage points are not explained by differences in education, potential experience, length of
stay in the UK, citizenship, marital status, and regional labor market conditions. Panel B
compares the employment and earnings of Muslim men to UK Born men. Large Muslim
disadvantages persist across age for employment and earnings. Muslim employment is 17.6 to
18.3 percent lower than UK Born men. Only 6.2 to 8.6 percentage points of the gap remains
unexplained. The earnings gaps range from 25.2 to 47.5 percent. Here, less of the gap is
explained. Education, potential experience, length of stay in the UK, citizenship, marital status,
and regional labor market conditions explain 1.5 to 11.3 percentage points of the gaps that range
from 25.2 to 47.5 percent.
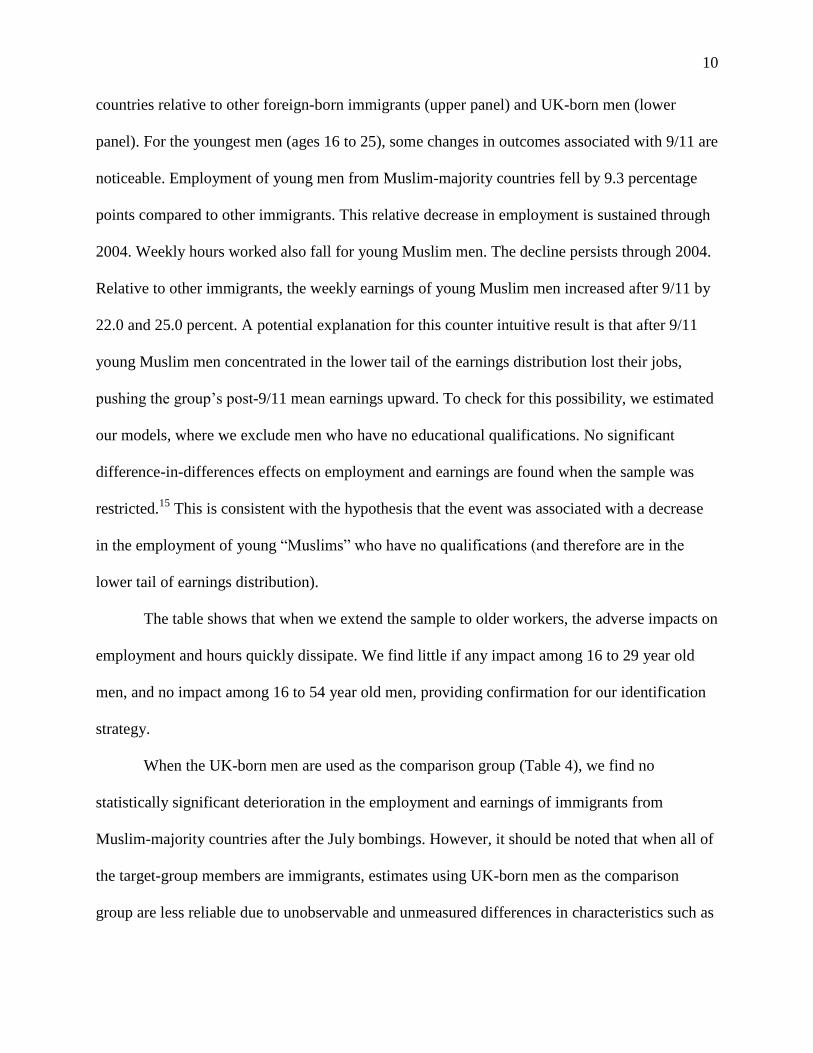
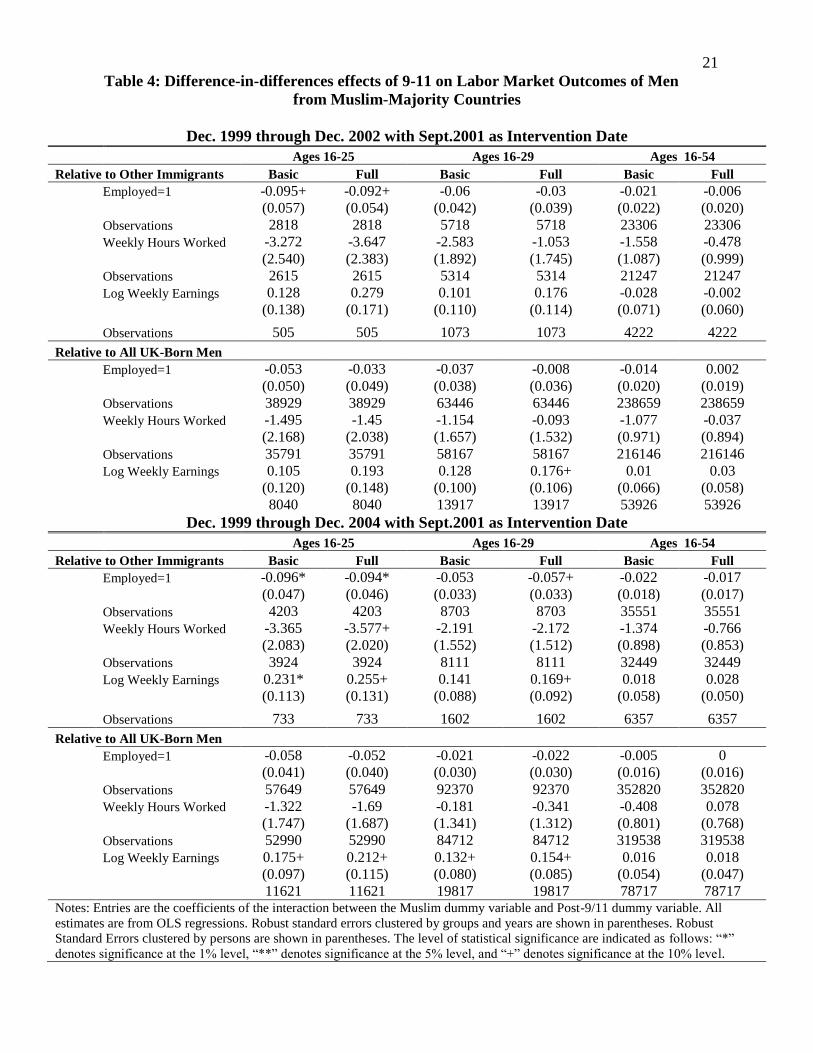
Table 4 reports regression-adjusted difference-in-differences effects of 9/11 and the July
bombings on the employment, hours worked, and earnings of immigrants from Muslim-majority
10
countries relative to other foreign-born immigrants (upper panel) and UK-born men (lower
panel). For the youngest men (ages 16 to 25), some changes in outcomes associated with 9/11 are
noticeable. Employment of young men from Muslim-majority countries fell by 9.3 percentage
points compared to other immigrants. This relative decrease in employment is sustained through
2004. Weekly hours worked also fall for young Muslim men. The decline persists through 2004.
Relative to other immigrants, the weekly earnings of young Muslim men increased after 9/11 by
22.0 and 25.0 percent. A potential explanation for this counter intuitive result is that after 9/11
young Muslim men concentrated in the lower tail of the earnings distribution lost their jobs,
pushing the group‘s post-9/11 mean earnings upward. To check for this possibility, we estimated
our models, where we exclude men who have no educational qualifications. No significant
difference-in-differences effects on employment and earnings are found when the sample was
restricted.15
This is consistent with the hypothesis that the event was associated with a decrease
in the employment of young ―Muslims‖ who have no qualifications (and therefore are in the
lower tail of earnings distribution).
The table shows that when we extend the sample to older workers, the adverse impacts on
employment and hours quickly dissipate. We find little if any impact among 16 to 29 year old
men, and no impact among 16 to 54 year old men, providing confirmation for our identification
strategy.
When the UK-born men are used as the comparison group (Table 4), we find no
statistically significant deterioration in the employment and earnings of immigrants from
Muslim-majority countries after the July bombings. However, it should be noted that when all of
the target-group members are immigrants, estimates using UK-born men as the comparison
group are less reliable due to unobservable and unmeasured differences in characteristics such as
11
language proficiency and other ―soft‖ skills for which we do not have measures. The second
comparison group includes both white Muslims and 2nd
generation immigrants from Muslim-
majority countries causing a potential downward bias in our estimate. News reports published
after 9/11 indicate that white Muslims as well as the 2nd
generation Muslim immigrants
experienced animosity after the terrorist events.16
Besides, there are fewer explanatory variables
in the regressions that use the UK-born men as the comparison group. Measures for citizenship
and length of stay are excluded to avoid multi-collinearity when all UK-born men are used as the
comparison group.
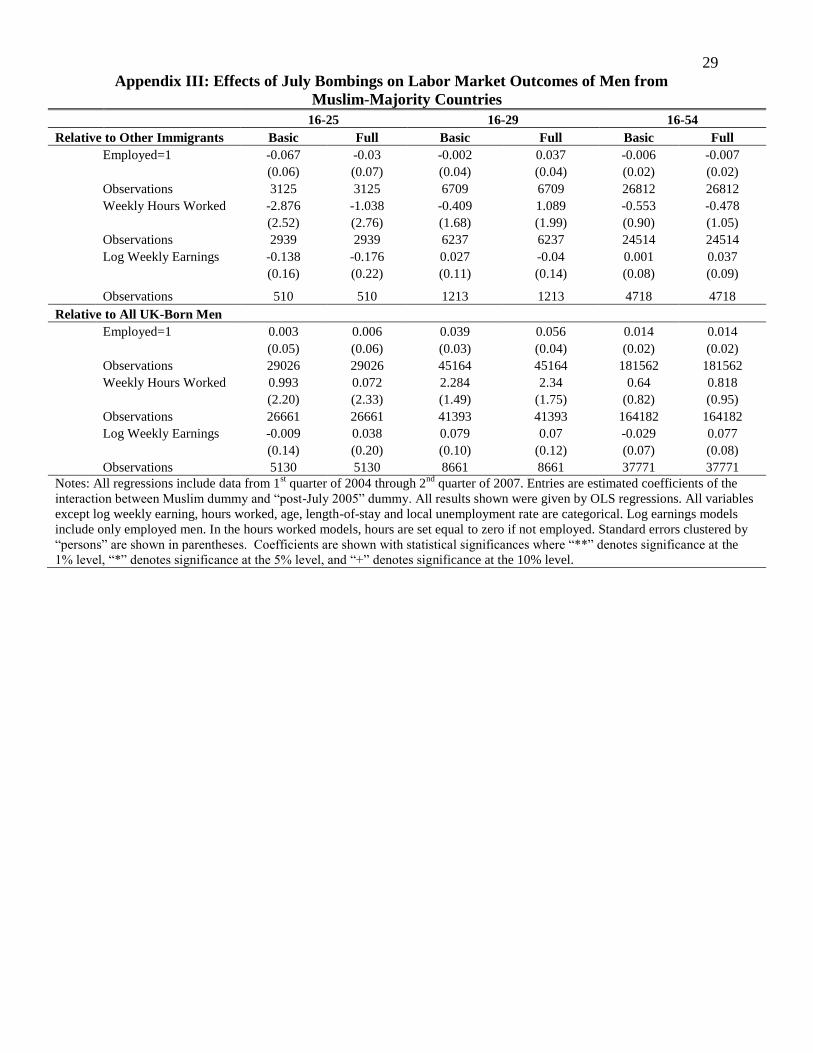
The July bombings did not have any impact on the labor market outcomes of immigrants
from Muslim-majority countries. Appendix III shows that there was no statistically significant
association between the July bombings and the labor market outcomes of immigrants from
Muslim-majority countries compared to other immigrants or UK-natives.
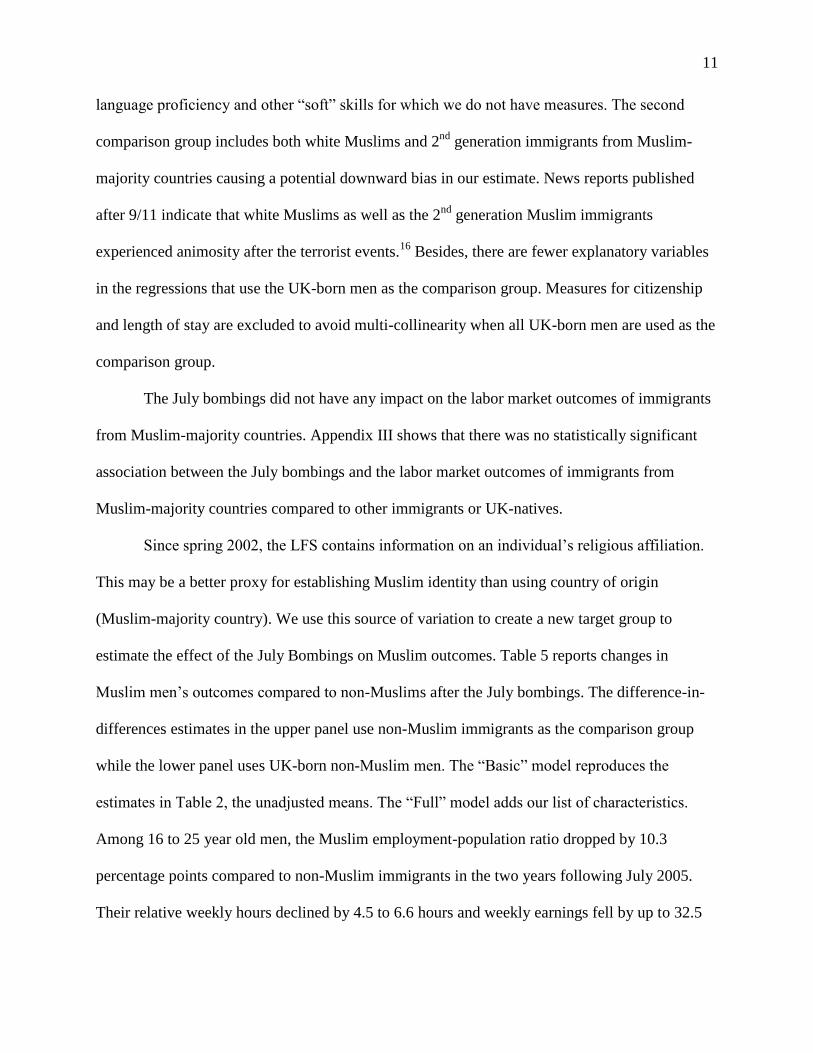
Since spring 2002, the LFS contains information on an individual‘s religious affiliation.
This may be a better proxy for establishing Muslim identity than using country of origin
(Muslim-majority country). We use this source of variation to create a new target group to
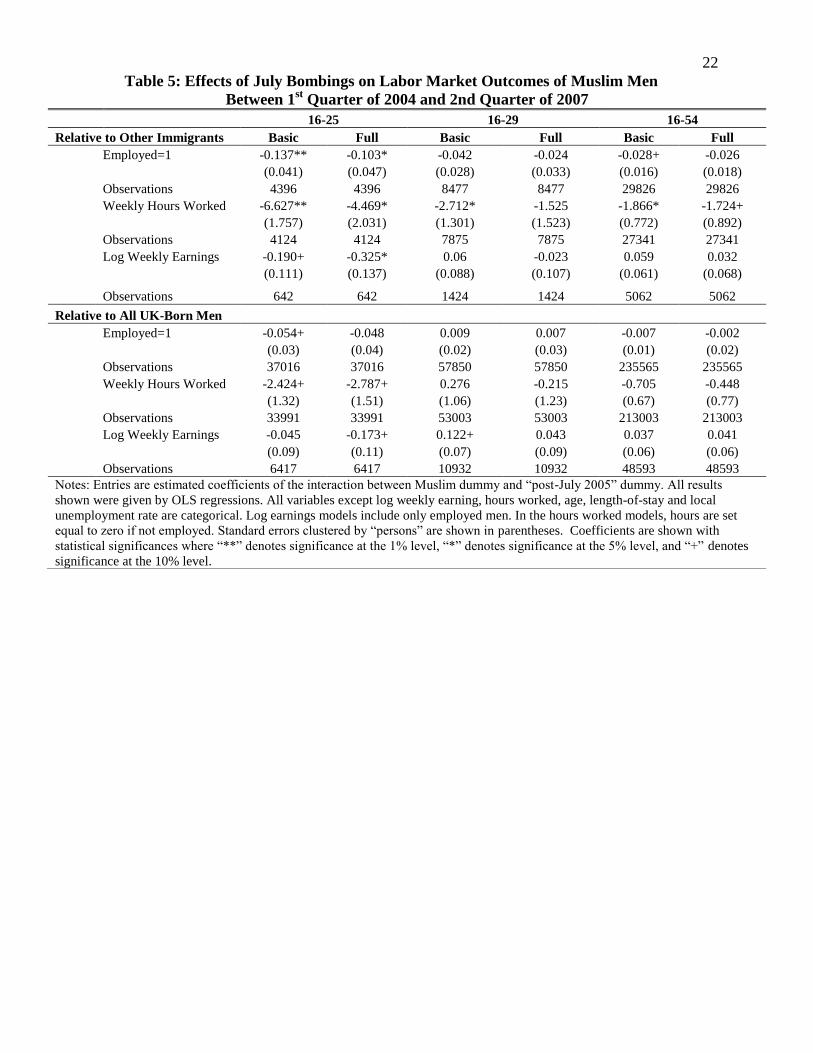
estimate the effect of the July Bombings on Muslim outcomes. Table 5 reports changes in
Muslim men‘s outcomes compared to non-Muslims after the July bombings. The difference-in-
differences estimates in the upper panel use non-Muslim immigrants as the comparison group
while the lower panel uses UK-born non-Muslim men. The ―Basic‖ model reproduces the
estimates in Table 2, the unadjusted means. The ―Full‖ model adds our list of characteristics.
Among 16 to 25 year old men, the Muslim employment-population ratio dropped by 10.3
percentage points compared to non-Muslim immigrants in the two years following July 2005.
Their relative weekly hours declined by 4.5 to 6.6 hours and weekly earnings fell by up to 32.5
12
percent. The relative decline in hours is consistent with the decrease in employment-population
ratio.
As we increase the upper bound on age from 25 to 29 and then to 54, the DD estimates
for the employment-population ratio and earnings of young Muslim men either dampen or
become insignificant. Small reductions in weekly hours worked remain at older ages. We find
very little difference in outcomes of Muslim men and all UK-born men, consistent with our view
that we are unable to fully capture the hetereogeneity in the sample when native-born men are
used for comparison.
VI. Robustness of Results
Our findings that the employment of very young ―Muslim‖ men deteriorated after both
terrorist events can be questioned on several grounds. First, during the post-9/11 years, the
relative decline in the employment-population ratio of some groups of young ―Muslims‖ was
accompanied by a relative increase in their average earnings. Second, the validity of comparison
groups can always be questioned.
We address the first critique by estimating the earnings regression with a restricted
sample. To ensure that our identification strategy is capturing the terrorist event‘s impacts on
labor market outcomes, we use pseudo-intervention dates in the DD estimation. To address
concern about the comparability of the target and control groups, we explore whether our results
are sensitive to the use additional comparison groups.
As mentioned earlier, there was a 22.0 to 25.0 percentage-point relative increase in the
weekly earnings of young men from Muslim-majority countries increased after 9/11. However,
we find no significant difference-in-differences effects on employment and earnings when we
restrict the sample to men without higher education.17
This is consistent with the hypothesis that
13
9/11 was associated with a decrease in employment of mainly those young ―Muslims‖ who have
low qualifications and therefore are in the lower tail of earnings distribution.18
Findings from using Different Intervention Dates
As an identification check, we incorrectly specify the timing of the 9/11 attacks and
bombings. To do this, we estimate the difference-in-differences models with pseudo intervention
dates. Using a range of dates from 2003 to 2007, we find that the most statistically significant
decrease in young Muslim employment occurred after June 2005, the time of the London
bombings. The employment-population ratio of young Muslims in the post-March 2005 and the
post-June 2005 data fell by 11 percentage points, with the estimate being significant at 5 percent
level.
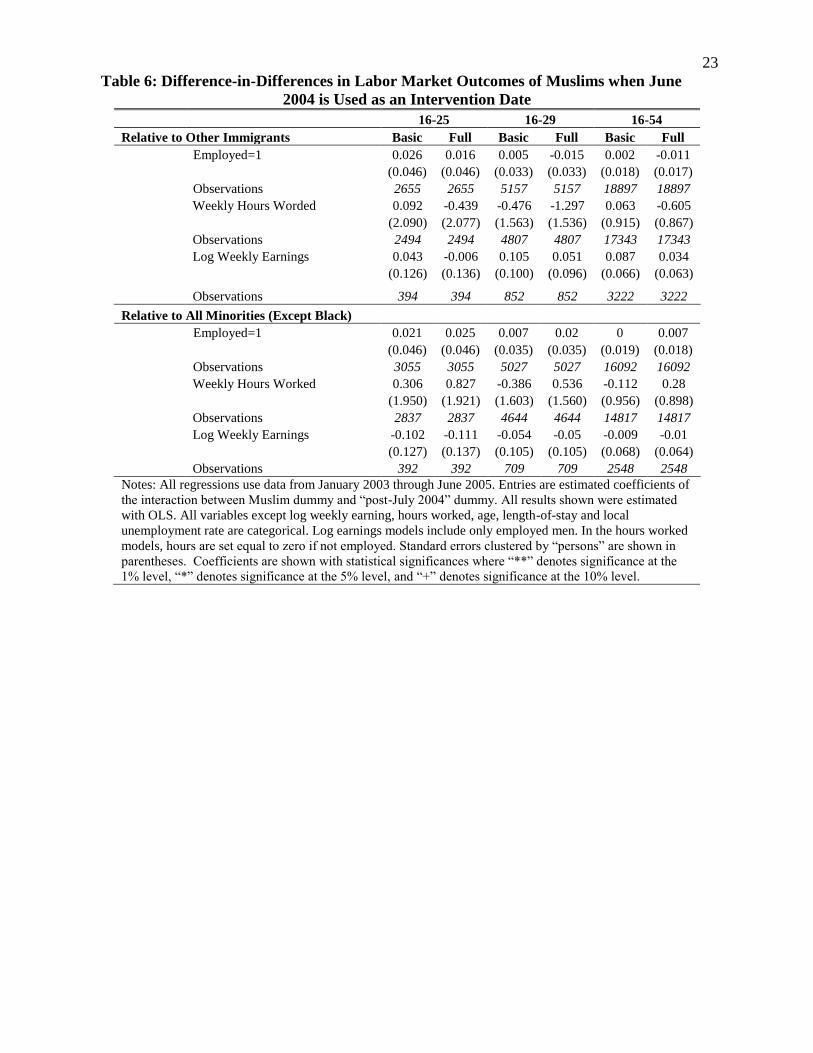
Table 6 reports the difference-in-differences estimates for young Muslims using June
2004 as the intervention date. The regressions are based on data from January 2003 through June
2005. The upper panel compares Muslims to non-Muslim immigrants and the lower panel
compares Muslims to non-Muslim minority men who are neither white nor black. As
hypothesized, all of the coefficients are small and none are measured with precision. Table 7
shows difference-in-differences estimates for the employment-ratio using a range of intervention
dates between years 1999 and 2004. Several of these intervention dates, including 9-11, are
associated with statistically significant decrease in employment of men from Muslim-majority
countries. This indicates a lack of robustness of our previous finding on 9-11‘s effect on the
employment of young men from Muslim-majority countries.
Tables 8 and 9 present evidence that supports the robustness of our earlier results for
young UK men who are Muslim by religious affiliation. Using a range of dates between 2003
and 2007, we find that the most statistically significant relative decrease in the employment of
14
young Muslims occurred after June 2005. Table 8 shows approximately an 11 percentage point
drop (significant at 5% level) in the employment of young Muslims in the post-March 2005 and
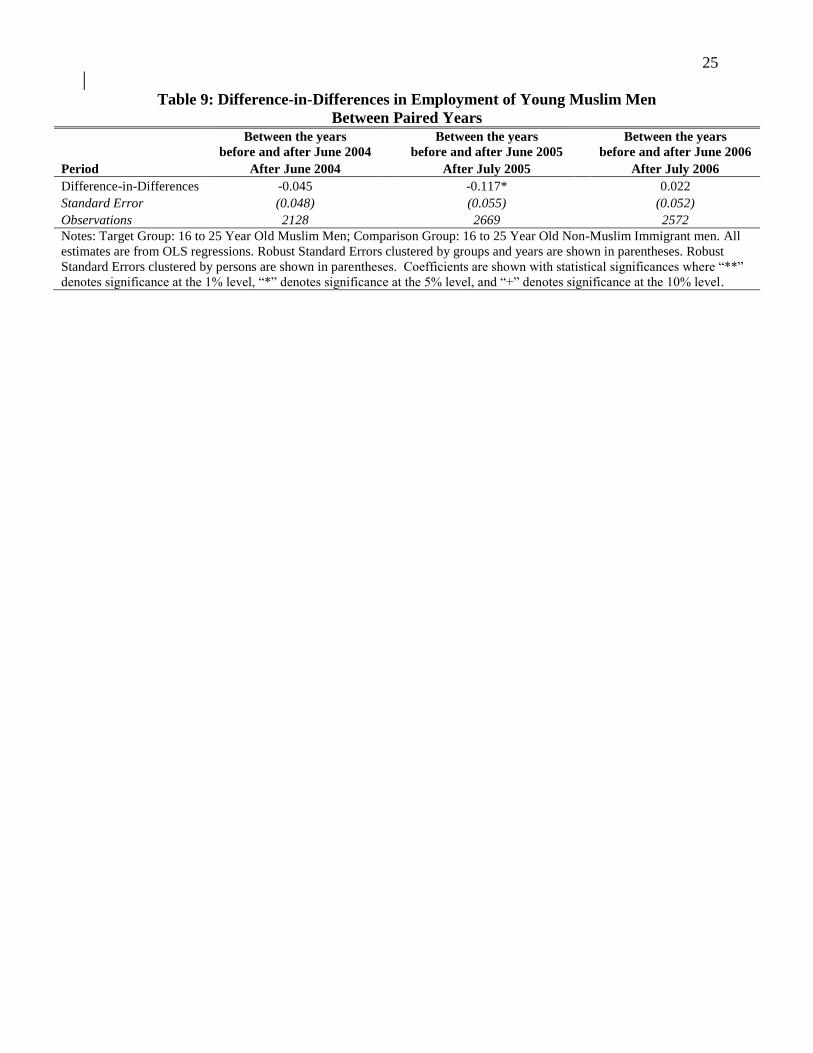
the post-June 2005 data. Table 9 reports difference-in-differences estimates for three windows of
time. Each window contains 24 consecutive months starting from July and ending in June and
the 12th
month is used as the intervention date for estimating difference-in-differences in the
employment of young Muslims. By selecting time-spans and intervention dates in such a way,
we potentially keep the seasonal effects similar across the pre- and the post-event months. One
would also expect the business cycle movement to be moderate in a 24-month window. The
difference-in-differences effect is statistically significant only for the July 2005 model (column
2, Table 9). A statistically significant 11 percentage-point decrease in Muslim occurred. These
results are consistent with our earlier findings that the erosion in the outcomes associated with
9/11 and the July bombings were short-lived.
VII. Summary and Conclusions
This paper estimates the impacts of the 9-11 terrorist attacks and the London bombings
on the employment-population ratio, hours worked, and earnings of UK minority men who fit
Muslim stereotypes. Using a natural experiment framework, we find a decrease in the
employment-population ratio of 16 to 25 year-old Muslim men after the July bombings relative
to their non-Muslim counterparts. There is little persistence over time in the disadvantage‘s
growth. Similar to previous research, we find no decline among older Muslim men.
Our findings are consistent with the hypothesis of an emergence in discrimination against
minorities that fit societal stereotypes of young Muslims. Furthermore, the fear of discrimination
made it harder for young minority workers to join and remain in the labor market. We have
found that after the July bombings young men who are Muslim by religious affiliation
15
experienced declines in their employment whereas young men who are immigrants from
Muslim-majority countries did not experience this decrease.
Even though we only find that very young Muslims are affected by the terrorist attacks,
the result has important implications for the future. Today, the average age of UK‘s Muslim men
is approximately 28 years—13 years less than the national average. Over one third of UK
Pakistanis and Bangladeshis are under 16, the youngest age cohort in the country. Given the very
different age profiles of ethnic minorities and UK natives, a significant part of the future growth
in the working age population between 1999 and 2009 is forecast to come from these minorities,
and it is evident that the youngest age cohort of Muslim workers are far from well-integrated in
the UK labor market. 19
The slower Muslim integration and assimilation into British society might have mutually
reinforced the impact that the terrorist events had on their labor market outcomes. Given the
faster growth in the population of young UK minority workers, future terrorist activities may
affect these groups more widely. To minimize these potential impacts, there must be a greater
focus on reducing the persistent employment and earnings gaps that predated the 9/11 and
London Bombings.
16
References
Allen, Christopher, and Nielsen S. Jorgen. May 2002. "Summary Rport on Islamophobia
in the EU after 11 September 2001." European Monitoring Centre on Racism and
Xenophobia. Available at:
http://eumc.europa.eu/eumc/material/pub/anti-islam/Synthesis-report_en.pdf
Ameli, Saied, Manzur Elahi and Arzu Merali. 2004. ―Social Discrimination: Across the
Muslim Divide.‖ Islamic Human Rights Commission, UK.
http://www.ihrc.org.uk/file/1903718287_content.pdf
Aslund, Olof, and Dan-Olof Rooth. 2005. ―Shifts in attitudes and labor market discrimination:
Swedish experiences after 9-11.‖ Journal of Population Economics, 18 (4): 602-629
Bisin, Alberto, Eleonora Patacchini, Thierry Verdier, and Zenou Yves. August 2007. ―Are
Muslim Immigrants Different in Terms of Cultural Integration?‖ IZA Discussion Paper
No. 3006.
Braakmann, Nils. December 2007. ―Islamistic Terror, the War on Iraq and the Job Prospects of
Arab Men in Britain: Does a Country‘s Direct Involvement matter? University of
Lüneburg Working Paper Series in Economics, No. 70.
http://www.leuphana.de/fileadmin/user_upload/Forschungseinrichtungen/ifvwl/Working
Papers/wp_70_Upload.pdf
Braakmann, Nils. January 2007. ―The impact of September 11th, 2001 on the job prospects of
foreigners With Arab background - Evidence from German labor market data.‖
University of Lüneburg Working Paper Series in Economics No. 37.
http://www.leuphana.de/fileadmin/user_upload/Forschungseinrichtungen/ifvwl/Working
Papers/wp_37_Upload.pdf
European Monitoring Centre on Racism and Xenophobia (EUMC). December 2001. ―Anti
Islamic Reactions in EU after Terrorist Acts against USA.‖ A collection of Country
Reports form RAXEN National Focal Points (NFPs) – 12th September to 31st December,
2001.
http://eumc.europa.eu/eumc/index.php?fuseaction=content.dsp_cat_content&catid=3fb3
8ad3e22bb&contentid=3fb4f8d82d72a
European Monitoring Centre on Racism and Xenophobia (EUMC). November 2005.
―The Impact of 7 July 2005 London Bomb Attacks on Muslim Communities in the EU‖.
Available at:
http://eumc.europa.eu/eumc/index.php?fuseaction=content.dsp_cat_content&catid=43c6
8c15f216d
The Guardian, 08/12/01, ―Britain has a proof record for its treatment of Muslims‖
Huber, P. J. 1967. ―The behavior of maximum likelihood estimates under non-standard

17
conditions.‖ Proceedings of the Fifth Berkeley Symposium on Mathematical Statistics
and Probability 1:221-233.
Shields,Michael, A. Price, and Stephen Wheatley. 2003. ―The Labour Market Outcomes and
Psychological Well-being of Ethnic Minority Migrants in Britain.‖ UK, Home Office
Online Report
http://www.homeoffice.gov.uk/rds/pdfs2/rdsolr0703.pdf
18
Table 1: Summary Statistics for 16 to 25 Year Old Men
Variables “Muslims” Other Immigrants Difference UK-Born Difference
Employment (%) 62.04 73.00 -10.96 80.34 -18.3
Observations 1,386 4,433 57,560
Hours Worked 21.86 28.92 -7.06 31.16 -9.31
Observations 1,254 3,989 51,694
Weekly Earnings (Pounds) 223.50 325.17 -101.67 283.55 -60.05
Observations 196 755 11,157
Age 22.33 22.31 0.05 21.26 1.07*
UK Citizen (%) 51.77 39.08 12.69* 1.00 50.36*
Married (%) 30.86 11.33 19.85* 4.32 26.54*
Length of stay in UK (Years) 10.01 7.60 2.31* 21.26 -11.25
Educational Qualification (%)
No Qualification 26.01 10.42 15.42* 10.88 15.13*
Foreign Education 23.81 36.21 -12.16 2.28 21.53*
O-Level or Below 23.00 16.56 6.23* 41.17 -18.18
A level or Diploma Equivalent 13.30 19.72 -6.43 30.23 -16.94
Bachelor's or Higher 11.54 15.24 -3.58 14.16 -2.63
Missing Value 2.35 1.85 0.52 1.27 1.08*
Industry (%)
Agriculture & Fishing 0.00 0.91 -0.91 1.48 -1.48
Energy & Water 0.85 0.22 0.14 0.85 -0.52
Manufacturing 22.97 10.24 13.25* 16.81 6.16*
Construction 1.95 9.48 -8.06 13.80 -11.85
Distribution, Hotels & Restaurants 38.25 31.19 8.07* 26.79 11.46*
Transport & Communication 13.76 7.75 5.65* 6.98 6.78*
Banking, Finance & Insurance 13.22 22.12 -9.19 19.03 -5.81
Public Admin, Education & Health 4.77 9.83 -5.20 7.92 -3.15
Other Services 6.31 8.22 -3.72 6.31 -1.55
Workplace Outside UK 0.00 0.03 -0.03 0.03 -0.03
Occupation (%)
Managers and Senior Officials 7.13 8.60 -2.83 7.13 -1.54
Professional 6.75 8.63 -3.70 6.75 -1.49
Associate Professional and Technical 7.46 15.07 -8.10 13.01 -5.55
Administrative and Secretarial 6.80 8.82 -1.49 11.37 -4.57
Skilled Trades 8.88 12.64 -4.10 22.50 -13.62
Personal Service 4.83 7.38 -2.21 3.95 0.87
Sales and Customer Service 15.02 9.43 6.32* 10.64 4.38*
Process, Plant and Machine Operatives 15.13 7.41 7.98* 8.88 6.26*
Elementary/Other 31.03 22.03 8.14* 15.78 15.25* Source: British Labour Force Survey Quarterly Files Winter 1998 to Summer 2006.
Notes: ―Muslim‖ refers to immigrant men from Muslim-majority countries. Differences in means are shown with statistical
significances where ―*‖ denotes significance at the 1% level, ―**‖ denotes significance at the 5% level, and ―+‖ denotes significance at
the 10% level. Summary statistics for 16 to 29 and 16 to 54 year old men are located in Appendix Table I.
19
Table 2: Outcomes for 16 to 25 Year Old Men Pre and Post-9/11 and the July Bombings
by Target and Comparison Groups
Panel A: Employment Muslims
Other
Immigrants
Other
Immigrants-
Muslim
Immigrants UK-born
UK-Born-Muslim
Immigrants
9/11 Effect
Jan.99 to Aug.01 71.08 73.51 2.43 82.24 11.16
Oct.01*to*Dec.02 63.92 75.87 11.95 81.34 17.42
DD Estimate -9.52* -6.26
Oct.01 to Dec.04 62.96 75.00 12.04 80.05 17.09
DD Estimate -9.61** -5.93
July Bombing Effect
Jan.04 to Jun.05 62.63 73.78 11.15 79.78 17.15
Aug.05 to Sept.06 60.79 78.82 18.03 77.23 16.44
DD Estimate -6.88+ 0.71
Panel B: Hours Worked
9/11 Effect
Jan.99 to Aug.01 23.82 28.05 4.23 31.86 8.04
Oct.01 to Dec.02 21.18 28.39 7.21 30.82 9.64
DD Estimate -2.98 -1.60
Oct.01 to Dec.04 21.16 28.05 6.89 30.25 9.09
DD Estimate -2.66 -1.05
Jan.04 to Jun.05 22.41 29.66 7.25 31.04 8.63
Aug.05 to Sept.06 25.21 32.34 7.13 32.30 7.09
DD Estimate 0.12 1.54
Panel C: Weekly Earnings
Jan.99 to Aug.01 185.02 322.76 137.74 269.64 131.90
Oct.01 to Dec.02 243.07 334.42 91.35 296.44 205.09
DD Estimate 46.39 -73.19
Oct.01 to Dec.04 246.31 328.81 82.50 294.41 48.10
DD Estimate 55.24 83.80
Jan.04 to Jun.05 266.28 302.69 36.41 302.49 36.21
Aug.05 to Sept.06 252.77 324.33 71.56 292.11 39.34
DD Estimate -35.15 -3.13
Source: British Labour Force Survey Quarterly Files Winter 1998 to Summer 2006.
Notes: Muslims are identified by religious affiliation. Differences in means are shown with statistical significances where ―*‖ denotes
significance at the 1% level, ―**‖ denotes significance at the 5% level, and ―+‖ denotes significance at the 10% level.
20
Table 3: Oaxaca Decompositions of Employment and Earning Gaps
Panel A: Relative to Other Immigrants Employment-Population Ratio Log Weekly Earnings
Effect 16-25 16-29 16-54 16-25 16-29 16-54
Total Gap 0.113** 0.132** 0.148** 0.391** 0.520** 0.539**
(0.02) (0.02) (0.01) (0.05) (0.04) (0.03)
Explained Gap 0.005 0.026** 0.040** 0.094** 0.160** 0.213**
(0.01) (0.01) (0.00) (0.04) (0.03) (0.02)
Residual Gap 0.109** 0.106** 0.108** 0.297** 0.360** 0.325**
(0.02) (0.02) (0.01) (0.06) (0.04) (0.02)
5975 12465 50566 995 2239 8899
Panel B: Relative to UK Born Men
Total Gap 0.181** 0.176** 0.183** 0.252** 0.377** 0.475**
(0.02) (0.01) (0.01) (0.05) (0.03) (0.02)
Explained Gap 0.119** 0.089** 0.064** 0.015 0.057+ 0.113**
(0.02) (0.01) (0.01) (0.05) (0.03) (0.02)
Residual Gap 0.062* 0.086** 0.120** 0.237** 0.319** 0.362**
(0.02) (0.02) (0.01) (0.06) (0.04) (0.03)
79597 127899 510104 15349 26413 110859
Notes: The employment gap models include all men where as the gap in log weekly earnings include only employed men. The samples in the upper
panel consist of only 1st generation immigrants from (1) other countries and (2) Muslim-majority countries (Bangladesh Morocco Egypt Pakistan Iran
Other-Middle-East Iraq Lebanon). The lower panel shows decompositions of the gaps between the latter group and UK-born men. The time period runs
from Winter 1999 to Fall 2006. Coefficients are shown with statistical significances where ―**‖ denotes significance at the 1% level, ―*‖
denotes significance at the 5% level, and ―+‖ denotes significance at the 10% level. Robust standard Errors clustered by repeated
observations are shown in parentheses. Explanatory variables are potential experience, potential experience squared, years of education, citizenship,
marital status, the regional unemployment rate and ratios of the two groups‘ population across regions.
21
Table 4: Difference-in-differences effects of 9-11 on Labor Market Outcomes of Men
from Muslim-Majority Countries
Dec. 1999 through Dec. 2002 with Sept.2001 as Intervention Date
Dec. 1999 through Dec. 2004 with Sept.2001 as Intervention Date
Ages 16-25 Ages 16-29 Ages 16-54
Relative to Other Immigrants Basic Full Basic Full Basic Full
Employed=1 -0.095+ -0.092+ -0.06 -0.03 -0.021 -0.006
(0.057) (0.054) (0.042) (0.039) (0.022) (0.020)
Observations 2818 2818 5718 5718 23306 23306
Weekly Hours Worked -3.272 -3.647 -2.583 -1.053 -1.558 -0.478
(2.540) (2.383) (1.892) (1.745) (1.087) (0.999)
Observations 2615 2615 5314 5314 21247 21247
Log Weekly Earnings 0.128 0.279 0.101 0.176 -0.028 -0.002
(0.138) (0.171) (0.110) (0.114) (0.071) (0.060)
Observations 505 505 1073 1073 4222 4222
Relative to All UK-Born Men
Employed=1 -0.053 -0.033 -0.037 -0.008 -0.014 0.002
(0.050) (0.049) (0.038) (0.036) (0.020) (0.019)
Observations 38929 38929 63446 63446 238659 238659
Weekly Hours Worked -1.495 -1.45 -1.154 -0.093 -1.077 -0.037
(2.168) (2.038) (1.657) (1.532) (0.971) (0.894)
Observations 35791 35791 58167 58167 216146 216146
Log Weekly Earnings 0.105 0.193 0.128 0.176+ 0.01 0.03
(0.120) (0.148) (0.100) (0.106) (0.066) (0.058)
8040 8040 13917 13917 53926 53926
Ages 16-25 Ages 16-29 Ages 16-54
Relative to Other Immigrants Basic Full Basic Full Basic Full
Employed=1 -0.096* -0.094* -0.053 -0.057+ -0.022 -0.017
(0.047) (0.046) (0.033) (0.033) (0.018) (0.017)
Observations 4203 4203 8703 8703 35551 35551
Weekly Hours Worked -3.365 -3.577+ -2.191 -2.172 -1.374 -0.766
(2.083) (2.020) (1.552) (1.512) (0.898) (0.853)
Observations 3924 3924 8111 8111 32449 32449
Log Weekly Earnings 0.231* 0.255+ 0.141 0.169+ 0.018 0.028
(0.113) (0.131) (0.088) (0.092) (0.058) (0.050)
Observations 733 733 1602 1602 6357 6357
Relative to All UK-Born Men
Employed=1 -0.058 -0.052 -0.021 -0.022 -0.005 0
(0.041) (0.040) (0.030) (0.030) (0.016) (0.016)
Observations 57649 57649 92370 92370 352820 352820
Weekly Hours Worked -1.322 -1.69 -0.181 -0.341 -0.408 0.078
(1.747) (1.687) (1.341) (1.312) (0.801) (0.768)
Observations 52990 52990 84712 84712 319538 319538
Log Weekly Earnings 0.175+ 0.212+ 0.132+ 0.154+ 0.016 0.018
(0.097) (0.115) (0.080) (0.085) (0.054) (0.047)
11621 11621 19817 19817 78717 78717
Notes: Entries are the coefficients of the interaction between the Muslim dummy variable and Post-9/11 dummy variable. All
estimates are from OLS regressions. Robust standard errors clustered by groups and years are shown in parentheses. Robust
Standard Errors clustered by persons are shown in parentheses. The level of statistical significance are indicated as follows: ―*‖
denotes significance at the 1% level, ―**‖ denotes significance at the 5% level, and ―+‖ denotes significance at the 10% level.
22
Table 5: Effects of July Bombings on Labor Market Outcomes of Muslim Men
Between 1st Quarter of 2004 and 2nd Quarter of 2007
16-25 16-29 16-54
Relative to Other Immigrants Basic Full Basic Full Basic Full
Employed=1 -0.137** -0.103* -0.042 -0.024 -0.028+ -0.026
(0.041) (0.047) (0.028) (0.033) (0.016) (0.018)
Observations 4396 4396 8477 8477 29826 29826
Weekly Hours Worked -6.627** -4.469* -2.712* -1.525 -1.866* -1.724+
(1.757) (2.031) (1.301) (1.523) (0.772) (0.892)
Observations 4124 4124 7875 7875 27341 27341
Log Weekly Earnings -0.190+ -0.325* 0.06 -0.023 0.059 0.032
(0.111) (0.137) (0.088) (0.107) (0.061) (0.068)
Observations 642 642 1424 1424 5062 5062
Relative to All UK-Born Men
Employed=1 -0.054+ -0.048 0.009 0.007 -0.007 -0.002
(0.03) (0.04) (0.02) (0.03) (0.01) (0.02)
Observations 37016 37016 57850 57850 235565 235565
Weekly Hours Worked -2.424+ -2.787+ 0.276 -0.215 -0.705 -0.448
(1.32) (1.51) (1.06) (1.23) (0.67) (0.77)
Observations 33991 33991 53003 53003 213003 213003
Log Weekly Earnings -0.045 -0.173+ 0.122+ 0.043 0.037 0.041
(0.09) (0.11) (0.07) (0.09) (0.06) (0.06)
Observations 6417 6417 10932 10932 48593 48593
Notes: Entries are estimated coefficients of the interaction between Muslim dummy and ―post-July 2005‖ dummy. All results
shown were given by OLS regressions. All variables except log weekly earning, hours worked, age, length-of-stay and local
unemployment rate are categorical. Log earnings models include only employed men. In the hours worked models, hours are set
equal to zero if not employed. Standard errors clustered by ―persons‖ are shown in parentheses. Coefficients are shown with
statistical significances where ―**‖ denotes significance at the 1% level, ―*‖ denotes significance at the 5% level, and ―+‖ denotes
significance at the 10% level.
23
Table 6: Difference-in-Differences in Labor Market Outcomes of Muslims when June
2004 is Used as an Intervention Date
16-25 16-29 16-54
Relative to Other Immigrants Basic Full Basic Full Basic Full
Employed=1 0.026 0.016 0.005 -0.015 0.002 -0.011
(0.046) (0.046) (0.033) (0.033) (0.018) (0.017)
Observations 2655 2655 5157 5157 18897 18897
Weekly Hours Worded 0.092 -0.439 -0.476 -1.297 0.063 -0.605
(2.090) (2.077) (1.563) (1.536) (0.915) (0.867)
Observations 2494 2494 4807 4807 17343 17343
Log Weekly Earnings 0.043 -0.006 0.105 0.051 0.087 0.034
(0.126) (0.136) (0.100) (0.096) (0.066) (0.063)
Observations 394 394 852 852 3222 3222
Relative to All Minorities (Except Black)
Employed=1 0.021 0.025 0.007 0.02 0 0.007
(0.046) (0.046) (0.035) (0.035) (0.019) (0.018)
Observations 3055 3055 5027 5027 16092 16092
Weekly Hours Worked 0.306 0.827 -0.386 0.536 -0.112 0.28
(1.950) (1.921) (1.603) (1.560) (0.956) (0.898)
Observations 2837 2837 4644 4644 14817 14817
Log Weekly Earnings -0.102 -0.111 -0.054 -0.05 -0.009 -0.01
(0.127) (0.137) (0.105) (0.105) (0.068) (0.064)
Observations 392 392 709 709 2548 2548
Notes: All regressions use data from January 2003 through June 2005. Entries are estimated coefficients of
the interaction between Muslim dummy and ―post-July 2004‖ dummy. All results shown were estimated
with OLS. All variables except log weekly earning, hours worked, age, length-of-stay and local
unemployment rate are categorical. Log earnings models include only employed men. In the hours worked
models, hours are set equal to zero if not employed. Standard errors clustered by ―persons‖ are shown in
parentheses. Coefficients are shown with statistical significances where ―**‖ denotes significance at the
1% level, ―*‖ denotes significance at the 5% level, and ―+‖ denotes significance at the 10% level.

24
Table 7: Difference-in-differences Effects on Employment
of Young Men from Muslim-majority Countries
Dates D-D Estimate
Sept.1999 -0.146*
Dec.1999 -0.161**
Mar.2000 -0.183**
Jun.2000 -0.190**
Sept.2000 -0.153**
Dec.2000 -0.126*
Mar.2001 -0.102*
Jun.2001 -0.088+
Sept.2001 -0.086+
Dec.2001 -0.102*
Mar.2002 -0.083+
Jun.2002 -0.060
Sept.2002 -0.068
Dec.2002 -0.053
Mar.2003 -0.060
Notes: Each regression includes 4,282 observations between
1999 and 2004. All estimates are from OLS regressions.
Robust Standard Errors clustered by groups and years are
shown in parentheses. Robust Standard Errors clustered by
persons are shown in parentheses. Coefficients are shown
with statistical significances where ―**‖ denotes significance
at the 1% level, ―*‖ denotes significance at the 5% level, and
―+‖ denotes significance at the 10% level.
Table 8: DD Effects on Employment of Young Muslim Men
Date D-D Estimate
Jun-04 -0.049
Sep-04 -0.089+
Dec-04 -0.090+
Mar-05 -0.119*
Jun-05 -0.111*
Sep-05 -0.098*
Dec-05 -0.074+
Mar-06 -0.009
Jun-06 -0.010
Notes: Each regression uses 4233 observations between Spring 2003 and Autumn
2007. All estimates are from OLS regressions. Robust Standard Errors clustered
by groups and years are shown in parentheses. Robust Standard Errors clustered
by persons are shown in parentheses. Coefficients are shown with statistical
significances where ―**‖ denotes significance at the 1% level, ―*‖ denotes
significance at the 5% level, and ―+‖ denotes significance at the 10% level.
.
25
Table 9: Difference-in-Differences in Employment of Young Muslim Men
Between Paired Years
Between the years
before and after June 2004
Between the years
before and after June 2005
Between the years
before and after June 2006
Period After June 2004 After July 2005 After July 2006
Difference-in-Differences -0.045 -0.117* 0.022
Standard Error (0.048) (0.055) (0.052)
Observations 2128 2669 2572
Notes: Target Group: 16 to 25 Year Old Muslim Men; Comparison Group: 16 to 25 Year Old Non-Muslim Immigrant men. All
estimates are from OLS regressions. Robust Standard Errors clustered by groups and years are shown in parentheses. Robust
Standard Errors clustered by persons are shown in parentheses. Coefficients are shown with statistical significances where ―**‖
denotes significance at the 1% level, ―*‖ denotes significance at the 5% level, and ―+‖ denotes significance at the 10% level.
26
Appendix I: Summary Statistics for 16 to 29 Year Old Men from Muslim-majority
Countries and the Comparison-Group Men
Variables Muslims Other Immigrants Difference UK-Born Difference
Employment 67.5 80.5 -13** 84.6 -17.1**
Observations 3044 9264 123143
Hours Worked 23.5 32.2 -8.7** 33.5 -10**
Observations 2864 8605 112672
Weekly Earnings (Dollars) 251 412 -161** 345 -94**
Observations 437 1781 25605
Age 25 25.1 -0.1 23.6 1.4**
UK Citizen (%) 48.5 28.5 20** 100 -51.5**
Married (%) 47 21 26** 11.7 35.3**
Length of stay in UK (Years) 20.8 23.8 -3** 23.6 -2.8**
Educational Qualification (%)
No Qualification 25 7 18** 8.7 16.3**
Foreign Education 25 35 -10** 2.6 22.4**
O-Level or Below 15 10 5** 33.3 -17.7**
Missing Value 9 10 -1+ 8.5 0.5
A level or Diploma Equivalent 13 17 -4** 29.5 -16.5**
Bachelor's or Higher 13 20 -7** 17.4 -4.4**
Industry (%)
Agriculture & Fishing .47 0.75 0 1.24 -0.77
Energy & Water 0.94 0.46 0 1.06 -0.12
Manufacturing 25.71 13.42 12.3** 19.76 5.95**
Construction 1.89 5.16 -3** 9.96 -8.07**
Distribution, Hotels & Restaurants 34.91 24.37 10.5** 22.43 12.48**
Transport & Communication 10.38 7.17 3* 8.12 2.26+
Banking, Finance & Insurance 13.44 25.97 -12.5** 20.49 -7.05**
Public Admin, Education & Health 8.96 15.60 -6.6** 11.87 -2.91+
Other Services 3.30 7.05 -3.7** 5.06 -1.76+
Workplace Outside UK 0.00 0.06 0 0 0
Occupation (%)
Managers and Senior Officials 4.95 11.46 -6.51** 10.63 -5.68**
Professional 7.55 17.25 -9.70** 11.48 -3.93*
Associate Professional and Technical 8.49 19.77 -11.28 14.89 -6.4**
Administrative and Secretarial 8.49 7.97 -0.52 10.42 -1.93
Skilled Trades 11.79 8.94 2.85+ 18.68 -6.89**
Personal Service 4.48 5.96 -1.48 3.98 0.5
Sales and Customer Service 10.61 6.3 4.30** 7.96 2.65+
Process, Plant and Machine Operatives 17.22 6.13 11.85** 9.35 7.87**
Elementary/Other 26.42 16.22 10.20** 12.6 13.82**
Source: British Labour Force Survey Quarterly Files Winter 1998 to Summer 2006.
Notes: Differences in means are shown with statistical significances where ―*‖ denotes significance at the 1% level, ―**‖ denotes
significance at the 5% level, and ―+‖ denotes significance at the 10% level.
27
Appendix I cont.: Summary Statistics for 16 to 54 Year Old Men from Muslim-
majority Countries and Comparison-Group Men
Variables Muslims Other Immigrants Difference UK-Born Difference
Employment 70.34 85.07 -14.73** 88.5 -18.16**
Observations 12350 37605 491102
Hours Worked 25.72 35.76 -10.04** 37.12 -11.4**
Observations 11371 34281 443825
Weekly Earnings (Dollars) 373 575 -202** 509.2 -136.2**
Observations 1629 7174 107762
Age 36 36 0 37.3 -1.3**
UK Citizen (%) 62.6 43.9 18.7** 100 -37.4**
Married (%) 71.8 51.5 21.2** 47.4 24.4**
Length of stay in UK (Years) 20.7 20.9 -0.2 37.2 -16.5**
Educational Qualification (%)
No Qualification 26.94 8.06 18.8** 9.63 17.31**
Foreign Education 26.61 29.69 -3.08** 5.33 21.28**
O-Level or Below 10.09 9.06 1.03** 23.64 -13.55**
Missing Value 9.47 10.04 -.56+ 8.88 0.59*
A level or Diploma Equivalent 11.26 20.78 -9.52** 33.88 -22.62**
Bachelor's or Higher 15.64 22.37 -6.73** 18.63 -2.99**
Industry (%)
Agriculture & Fishing 0.13 .71 -0.58** 0.97 -0.84**
Energy & Water 0.25 0.64 -0.39+ 1.49 -1.24**
Manufacturing 24.48 15.85 8.63** 23.93 0.55**
Construction 1.76 4.94 -3.18** 8.7 -6.94**
Distribution, Hotels & Restaurants 32.41 17.6 14.81** 14.85 17.56**
Transport & Communication 9.88 9.91 -0.03** 10.83 -0.95
Banking, Finance & Insurance 14.03 24.67 -10.64** 17.92 -3.89**
Public Admin, Education & Health 14.22 20.01 -5.79** 17.06 -2.84**
Other Services 2.83 5.48 -2.65** 4.22 -1.39*
Workplace Outside UK 0 0.17 -0.17+ 0 0
Occupation (%)
Managers and Senior Officials 13.4 21.01 -7.61** 22.07 -8.67**
Professional 14.72 20.58 -5.86** 14.01 0.71
Associate Professional and Technical 9.18 15.49 -6.31** 13.94 -4.76**
Administrative and Secretarial 5.91 6.35 -0.44 6.36 -0.45
Skilled Trades 13.08 9.99 3.09** 15.72 -2.64**
Personal Service 4.72 4.34 0.38 3.34 1.38**
Sales and Customer Service 6.23 3.59 2.64** 3.75 2.48**
Process, Plant and Machine Operatives 17.36 7.32 10.04** 11.91 5.45**
Elementary/Other 15.41 11.34 4.07** 8.89 6.52**
Source: British Labour Force Survey Quarterly Files Winter 1998 to Summer 2006.
Notes: Differences in means are shown with statistical significances where ―*‖ denotes significance at the 1% level, ―**‖ denotes
significance at the 5% level, and ―+‖ denotes significance at the 10% level.
28
Appendix II: Summary Statistics for 16 to 25 Year Old Muslim Men and
Comparison-Group Men
Variables Muslims
Non-Muslim
Immigrants Difference
Non-
Muslim
UK-Born Difference
Employment (%) 60.3 75.8 -15.5** 80.4 -20.1**
Observations 2004 2826 46011
Hours Worked 20.6 29.1 -8.5** 30.3 -9.7**
Observations 1872 2655 42220
Weekly Earnings (Pounds) 246.4 328.3 -81.95** 287.2 -40.8**
Observations 249 470 8476
Age 22 22.5 -0.5** 21.3 0.7**
UK Citizen (%) 73.5 28.9 44.6** 100 -26.5**
Married (%) 18.4 9.2 9.2** 3.7 14.7**
Length of stay in UK (Years) 16.3 7.2 9.1** 21.3 -5**
Educational Qualification (%)
No Qualification 16.67 9.31 7.3** 9.45 7.2**
Foreign Education 10.68 32.17 -21.5** 2.12 8.5**
O-Level or Below 27.30 13.02 14.3** 36.3 -9**
Missing Value (Put after Bachelor‘s) 17.61 15.68 1.9+ 13.37 4.2**
A level or Diploma Equivalent 14.27 17.52 -3.2** 27.44 -13.2**
Bachelor's or Higher 13.47 12.31 1.15 11.33 2.1**
Industry (%)
Agriculture & Fishing 0 1.28 -1.28+ 1.24 -1.24+
Energy & Water 2.01 0.64 1.37+ 0.98 1.03
Manufacturing 22.89 12.37 10.52** 17.26 5.63*
Construction 2.81 5.97 -3.16+ 12.64 -9.83**
Distribution, Hotels & Restaurants 36.55 32.84 3.71 26.82 9.73**
Transport & Communication 8.03 4.9 3.13+ 6.93 1.1
Banking, Finance & Insurance 20.48 20.47 0.01 17.53 2.95
Public Admin, Education & Health 6.02 14.29 -8.27** 10.76 -4.74*
Other Services 1.2 7.25 -6.05** 5.84 -4.64**
Workplace Outside UK 0 0 0 0
Occupation (%)
Managers and Senior Officials 3.61 5.33 -1.72 6.72 -3.11
Professional 5.62 11.09 -5.47* 8.26 -2.64+
Associate Professional and Technical 9.24 18.12 -8.88** 13.6 -4.36
Administrative and Secretarial 9.24 6.4 2.84 9.94 -0.7*
Skilled Trades 9.64 12.15 -2.51 21.35 -11.71
Personal Service 1.2 4.48 -3.28* 2.5 -1.3**
Sales and Customer Service 20.08 10.66 9.42** 10.46 9.62
Process, Plant and Machine Operatives 12.05 7.46 4.59* 8.64 3.41**
Elementary/Other 29.32 24.31 5.01 18.54 10.78+ Source: British Labour Force Survey Quarterly Files Winter 1998 to Summer 2006.
Notes: Differences in means are shown with statistical significances where ―*‖ denotes significance at the 1% level, ―**‖ denotes
significance at the 5% level, and ―+‖ denotes significance at the 10% level. Summary statistics for 16 to 29 and 16 to 54 year old men
are located in Appendix Table I.
29
Appendix III: Effects of July Bombings on Labor Market Outcomes of Men from
Muslim-Majority Countries
16-25 16-29 16-54
Relative to Other Immigrants Basic Full Basic Full Basic Full
Employed=1 -0.067 -0.03 -0.002 0.037 -0.006 -0.007
(0.06) (0.07) (0.04) (0.04) (0.02) (0.02)
Observations 3125 3125 6709 6709 26812 26812
Weekly Hours Worked -2.876 -1.038 -0.409 1.089 -0.553 -0.478
(2.52) (2.76) (1.68) (1.99) (0.90) (1.05)
Observations 2939 2939 6237 6237 24514 24514
Log Weekly Earnings -0.138 -0.176 0.027 -0.04 0.001 0.037
(0.16) (0.22) (0.11) (0.14) (0.08) (0.09)
Observations 510 510 1213 1213 4718 4718
Relative to All UK-Born Men
Employed=1 0.003 0.006 0.039 0.056 0.014 0.014
(0.05) (0.06) (0.03) (0.04) (0.02) (0.02)
Observations 29026 29026 45164 45164 181562 181562
Weekly Hours Worked 0.993 0.072 2.284 2.34 0.64 0.818
(2.20) (2.33) (1.49) (1.75) (0.82) (0.95)
Observations 26661 26661 41393 41393 164182 164182
Log Weekly Earnings -0.009 0.038 0.079 0.07 -0.029 0.077
(0.14) (0.20) (0.10) (0.12) (0.07) (0.08)
Observations 5130 5130 8661 8661 37771 37771
Notes: All regressions include data from 1st quarter of 2004 through 2
nd quarter of 2007. Entries are estimated coefficients of the
interaction between Muslim dummy and ―post-July 2005‖ dummy. All results shown were given by OLS regressions. All variables
except log weekly earning, hours worked, age, length-of-stay and local unemployment rate are categorical. Log earnings models
include only employed men. In the hours worked models, hours are set equal to zero if not employed. Standard errors clustered by
―persons‖ are shown in parentheses. Coefficients are shown with statistical significances where ―**‖ denotes significance at the
1% level, ―*‖ denotes significance at the 5% level, and ―+‖ denotes significance at the 10% level.
30
ENDNOTES
1 A comprehensive record of the impacts of the European terrorists events can be found in reports of the European
Monitoring Center on Racism and Xenophobia (EUMC) (May 2002, November 2005).
2 In the Netherlands and Denmark, many Islamic websites were inundated with hate speech and the amount of anti-
Muslim text messages increased dramatically after 9/11. A number of opinion polls confirmed that the Danish
majority believed that 9/11 had made them become more negative towards Muslims, where the vast majority of the
population felt that Muslims should be made to take lessons in Danish democratic values. Denmark had national
elections coinciding with the aftermath of 9/11 and animosity towards Muslims seemed to be visible in the political
sphere too. Changes in attitude towards Muslims and a resulting trend of hostility were identified in the Danish
workplaces too. Series of opinion polls in the Netherlands indicate that a large part the population was in favor of
the deportation of Muslims whilst others were keen to see asylum seekers from Muslim backgrounds being refused
entry to the country. Another poll declared the Dutch population's belief that Islam presented them with a very real
threat. The killing of the author of a documentary about Muslim immigrants by a Dutch-Moroccan (November
2004) Muslim added to the perceived danger.
3 Kaestner et al. (2007) regress ―earnings‖ for employed individuals. For their ―hours-worked‖ regressions, they
include all individuals setting hours equal to zero for men who were not employed. We do the same in the OLS
regressions but for the quantile earning regressions, we include all men assigning log of earnings equal to zero if not
employed. This is done to avoid the sample selection bias occurring in the mean regression.
4 The recession that began in March 2001 is potentially one such confounding factor. Estimation of the pre- and
post-9/11 changes in outcome using only the target-group (i.e. Mislims) sample may generate a negative coefficient
simply because of the business-cycle downturn.
5 To control for industry of work, 9 major industry dummy variables were used. To control for occupations we
constructed ten major occupation groups. However, we use ―percentage of group members working in the respective
occupation‖ to control for occupational variations instead of using occupation dummies. Exclusion of this variable
does not significantly affect the difference in differences effect.
6 We follow the specifications of Kaestner et al. (2004) here. We find coefficients of the time-trend variables always
negligible and statistically insignificant. Models with month dummy variables yielded similar results.
7 In the case of probit, the interaction effect is estimated by taking the average of difference-in-differences of the
predicted probabilities.
8 Kaestner et al. allowed the effect of September 11
th to differ according to an index of hate crime/discrimination
against Arabs and Muslims. They used three measures of September 11th related hate crime or discrimination:
number of hate crime/discrimination incidents reported in a state; number of hate crime/discrimination incidents per
Arab population in a state; and number of hate crime/discrimination incidents per state population. While the first
two capture the risk of discrimination Arabs and Muslims face in a state, the third is an indicator of the prevalence
of prejudice among the non-Arab population. Prior to October 2001, value of hate-crime index was assumed to be
zero in all states8. They estimated the results using all three indices and found the effects of all of them to be
statistically insignificant. Due to the insignificant effects and the limited nature of the data, we do not include the
indices in the analyses.
9 Unlike in the US sample, we drop men between age 55 and 64 from the UK sample for two reasons. First, unlike
in the US, about 90 percent of the target group members are below 55 in the UK. Second, about half of the
―Muslims‖ over the age 54 in the UK are out of labor force in contrast to less than one-third of the comparison-
group members. Questionnaires in the US and the UK surveys are similar and the data collection methods are
comparable making it possible to use the same method to analyze both data sets.
10
There has been no study on whether the 1st generation immigrants were affected more than the 2
nd-generation
immigrants. Anti-terrorism laws and programs targeted primarily those 1st generation immigrants who are not US
citizens, especially those who are not residing or working legally in the US. A fraction of the 1st generation
immigrants in the CPS datasets should be illegal immigrants. Demographic research suggests that at least a fraction
of the illegal immigrants are in the CPS since the number of immigrants enumerated by the survey (and by the

31
decennial Census, upon which the CPS weights are based) exceeds estimates of the number of the foreign-born
legally present in the U.S.
11
Until Spring 2002, the UK data does not identify men who are Muslim by religious affiliation (i.e., target group
B). Therefore, a small fraction of comparison group 2 would include UK-born Muslims.
12
Consistent with the literature, we find that marriage, years in the UK, and UK citizenship is associated with higher
earnings and employment.
13
The outcomes before and after 9/11 for ―Muslims‖ age 16-54 in the UK are available upon request.
14
The lower educational attainment of Muslims (compared to other immigrants) explains the largest portion of the
employment gap. However, over 90% of the total gap remains unexplained.
15
Results available from the authors on request.
16
―Rise in Muslim Discrimination‖, BBC news, 16 December 2004.
http://news.bbc.co.uk/2/hi/uk_news/4102389.stm
17
Results available from the authors on request.
18
We also explored estimating median regressions that include the unemployed as having zero earnings. This was
not feasible because more than fifty percent of the sample reported zero earnings.
19
EUMAP – EU Monitoring and Advocacy Program – Aspirations and Reality: British Muslims and the Labour
Market.