Embed Size (px)
Citation preview
THE IMMEDIATE RESPONSE TO THE JAVA TSUNAMI:
PERCEPTIONS OF THE AFFECTED
INTRODUCTION
METHODOLOGY
KEY FINDINGS
RECOMMENDATIONS
APPENDIX: TABLES AND GRAPHS
This report was prepared by Desiree Bliss and Jennifer Campbell for Fritz Institute. Theresearch was conducted by TNS India and TNS Indonesia under the supervision ofDr. Vimala Ramalingam. Fritz Institute would like to thank Dr. Daniel Pallin ofthe Harvard Humanitarian Initiative for his work on the survey instrument.
Copyright ©2007 Fritz Institutewww.fritzinstitute.org
TABLE OF CONTENTS
2
3
4
8
10
The Immediate Response to the Java Tsunami:Perceptions of the Affected 2
I NTRODUCT ION
On July 17, 2006 at 3:24pm, a 7.2 magnitude earthquake struck off of the Indonesian coast.Twenty minutes later the earthquake triggered a tsunami along a 110-mile stretch of Java's
southern coast. Waves more than six feet high reached as far as two kilometers inland, destroyingscores of houses, restaurants and hotels. According to the National Disaster ManagementCoordinating Board of Indonesia (BAKORNAS), the tsunami resulted in 637 deaths as well as 167missing, 543 injured, and 50,756 displaced members of the community.
Despite having received bulletins from both the PacificTsunami Warning Center in Hawaii and the JapanMeteorological Agency twenty minutes before the firstwave struck, Indonesian government officials reported-ly did not publicize the emergency in hopes of avoid-ing any unnecessary panic. Although warnings wereeventually issued via text messages to district headsand mayors approximately seven minutes before thetsunami, the window of time was too short for thoseleaders to alert local communities.1
Indonesia lies on the “Pacific Ring of Fire”, the mostseismically active area of the world, frequented byearthquakes and volcanic eruptions. According to theUS Geological Survey, the country of Indonesia ishome to the greatest number of earthquakes world-wide. The majority of seismic activity in the area takesplace under the ocean where the tectonic plates collide,sometimes generating a tsunami.
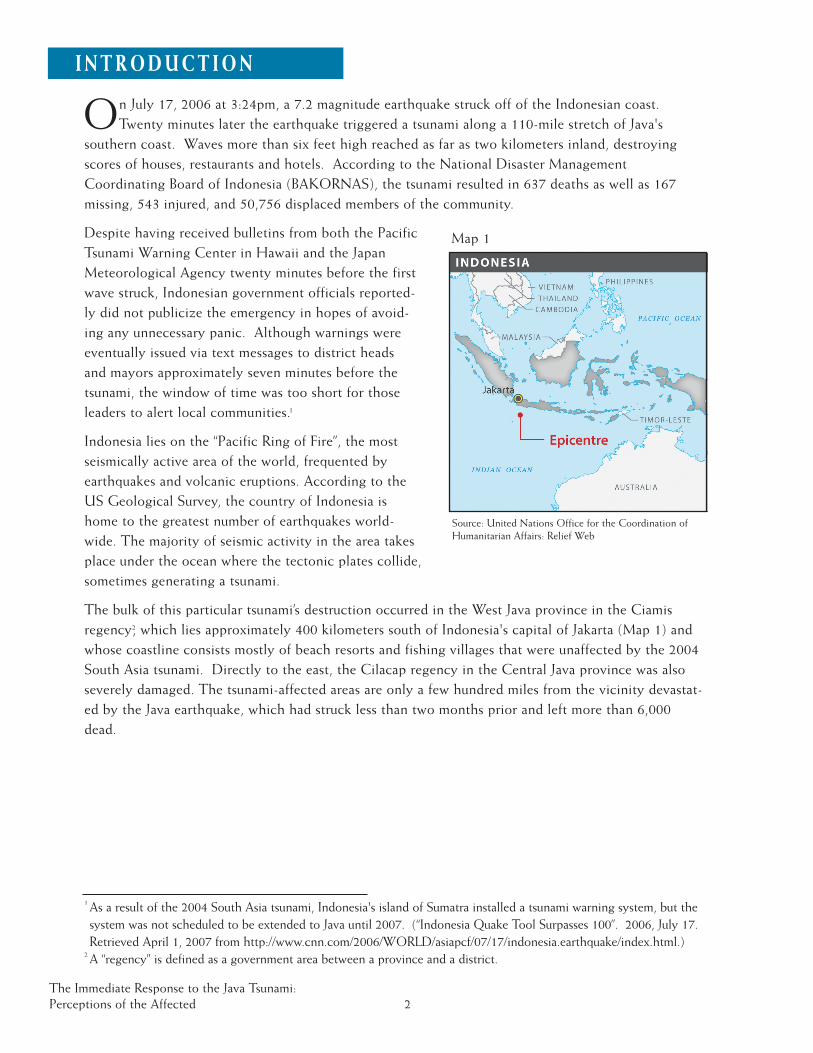
The bulk of this particular tsunami’s destruction occurred in the West Java province in the Ciamisregency2, which lies approximately 400 kilometers south of Indonesia's capital of Jakarta (Map 1) andwhose coastline consists mostly of beach resorts and fishing villages that were unaffected by the 2004South Asia tsunami. Directly to the east, the Cilacap regency in the Central Java province was alsoseverely damaged. The tsunami-affected areas are only a few hundred miles from the vicinity devastat-ed by the Java earthquake, which had struck less than two months prior and left more than 6,000dead.
1As a result of the 2004 South Asia tsunami, Indonesia's island of Sumatra installed a tsunami warning system, but thesystem was not scheduled to be extended to Java until 2007. (“Indonesia Quake Tool Surpasses 100”. 2006, July 17.Retrieved April 1, 2007 from http://www.cnn.com/2006/WORLD/asiapcf/07/17/indonesia.earthquake/index.html.)
2A “regency” is defined as a government area between a province and a district.
Source: United Nations Office for the Coordination ofHumanitarian Affairs: Relief Web
Map 1
Continuing our investigations of the perceptions and opinions of people affected by natural disas-ters worldwide, Fritz Institute and its research partner, TNS Indonesia, surveyed more than one
hundred people affected by the Java tsunami.3 As trained research teams were already on the island toassess the humanitarian impact of the May 2006 earthquake, the research was able to commence withinone week of the occurrence of the tsunami. The timing provided the researchers a unique opportunity toimmediately tap into the perceptions of assistance provided by various relief actors. Replicating theapproach of previous surveys, respondents were asked about the damage and loss suffered, perceptionsof aid needed and aid received, providers of aid, and their satisfaction with the timeliness and adequa-cy of the assistance. Where possible, five-point Likert scales were used.
The sample was comprised of 123 individual respondents, each representing households from twenty-four villages in the two regencies most impacted by the Java tsunami, Cilacap and Ciamis. Withineach regency two districts were identified to participate in the research: Binangun and Adipala inCilacap and Pangandaran and Sidamulih/Parigi in Ciamis. The sample size in each district was deter-mined according to the extent of the population affected by the disaster, covering both urban andrural areas, and the respondents were identified using a random selection procedure.
Data was collected through face-to-face interviews in the local language by teams of trained inter-viewers from the area using a structured questionnaire. The survey respondents represented both maleand female adult household members for whom the mean age of the respondents was 40.8 years (SeeTable 1). All the respondents were Muslim and the literacy level among the respondents surveyed washigh, with 89% reporting that they could read and write. Over half of the sample reported having afamily member suffer injury or death as a result of the tsunami (See Table 2).
Prior to the disaster, the main sources of income for survey respondents in the affected areas werefarming and plantation labor, petty trade, and fishing and allied activities. About 37% of the surveyrespondents were engaged in farming activities, 20% as farm or plantation laborers on others' landsand another 17% in the cultivation of their own land. Forty-five percent (45%) of the affected house-holds surveyed had a monthly family income of below 700,000 Indonesian Rupiah (approximately $78USD). Exploring the types of housing structure inhabited by respondents prior to the disaster showsthat nearly two-thirds (64%) lived in houses or apartments constructed of wood, brick, cement, orother permanent materials, while the remaining households resided primarily in semi-permanent struc-tures built from earth or stones.
The Immediate Response to the Java Tsunami:Perceptions of the Affected 3
3 Previous beneficiary research reports include studies on the 2004 South Asia tsunami, the 2005 Pakistan earthquake, andHurricane Katrina, all of which can be found on Fritz Institute's website athttp://www.fritzinstitute.org/prgHumanitarianImpact.htm
METHODOLOGY
1. The Local Government was the Predominant First Responder
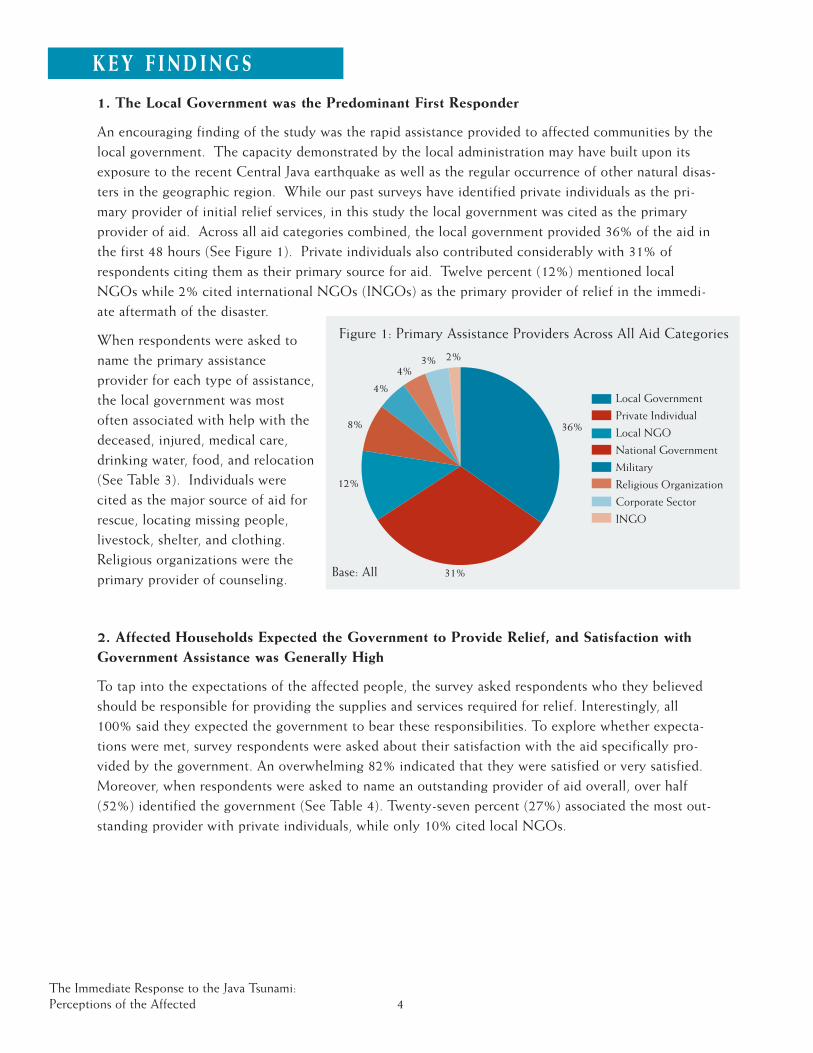
An encouraging finding of the study was the rapid assistance provided to affected communities by thelocal government. The capacity demonstrated by the local administration may have built upon itsexposure to the recent Central Java earthquake as well as the regular occurrence of other natural disas-ters in the geographic region. While our past surveys have identified private individuals as the pri-mary provider of initial relief services, in this study the local government was cited as the primaryprovider of aid. Across all aid categories combined, the local government provided 36% of the aid inthe first 48 hours (See Figure 1). Private individuals also contributed considerably with 31% ofrespondents citing them as their primary source for aid. Twelve percent (12%) mentioned localNGOs while 2% cited international NGOs (INGOs) as the primary provider of relief in the immedi-ate aftermath of the disaster.
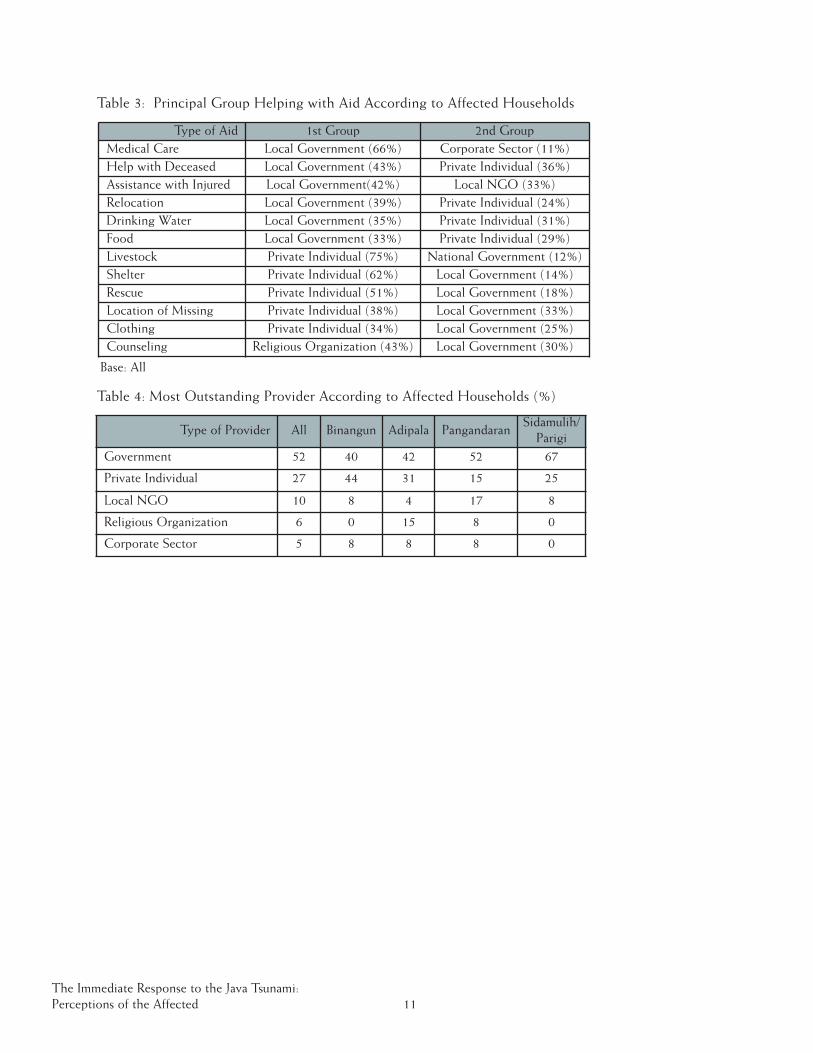
When respondents were asked toname the primary assistanceprovider for each type of assistance,the local government was mostoften associated with help with thedeceased, injured, medical care,drinking water, food, and relocation(See Table 3). Individuals werecited as the major source of aid forrescue, locating missing people,livestock, shelter, and clothing.Religious organizations were theprimary provider of counseling.
2. Affected Households Expected the Government to Provide Relief, and Satisfaction withGovernment Assistance was Generally High
To tap into the expectations of the affected people, the survey asked respondents who they believedshould be responsible for providing the supplies and services required for relief. Interestingly, all100% said they expected the government to bear these responsibilities. To explore whether expecta-tions were met, survey respondents were asked about their satisfaction with the aid specifically pro-vided by the government. An overwhelming 82% indicated that they were satisfied or very satisfied.Moreover, when respondents were asked to name an outstanding provider of aid overall, over half(52%) identified the government (See Table 4). Twenty-seven percent (27%) associated the most out-standing provider with private individuals, while only 10% cited local NGOs.
The Immediate Response to the Java Tsunami:Perceptions of the Affected 4
KEY F IND INGS
Local Government
Private Individual
Local NGO
National Government
Military
Religious Organization
Corporate Sector
INGO
36%
31%
12%
8%
4%
4%3% 2%
Figure 1: Primary Assistance Providers Across All Aid Categories
Base: All
The Immediate Response to the Java Tsunami:Perceptions of the Affected 5
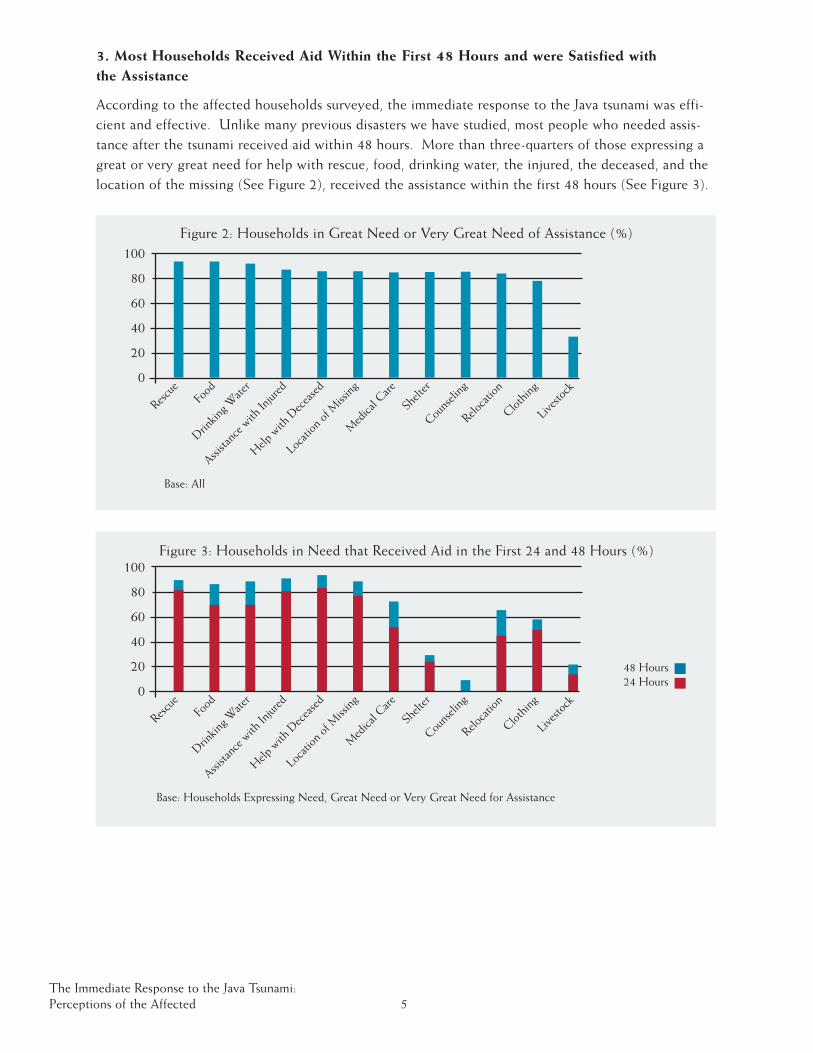
3. Most Households Received Aid Within the First 48 Hours and were Satisfied withthe Assistance
According to the affected households surveyed, the immediate response to the Java tsunami was effi-cient and effective. Unlike many previous disasters we have studied, most people who needed assis-tance after the tsunami received aid within 48 hours. More than three-quarters of those expressing agreat or very great need for help with rescue, food, drinking water, the injured, the deceased, and thelocation of the missing (See Figure 2), received the assistance within the first 48 hours (See Figure 3).
Figure 2: Households in Great Need or Very Great Need of Assistance (%)
Figure 3: Households in Need that Received Aid in the First 24 and 48 Hours (%)
100
80
60
40
20
0
Rescue
Food
AssistancewithInjured
Help
withDeceased
Drinking
Water
Medical Care
Shelter
Counseling
Location of Missing
Relocation
Clothing
Livestock
Base: All
100
80
60
40
20
0
Rescue
Food
AssistancewithInjured
Help
withDeceased
Drinking
Water
Medical Care
Shelter
Counseling
Location of Missing
48 Hours24 Hours
Relocation
Clothing
Livestock
Base: Households Expressing Need, Great Need or Very Great Need for Assistance
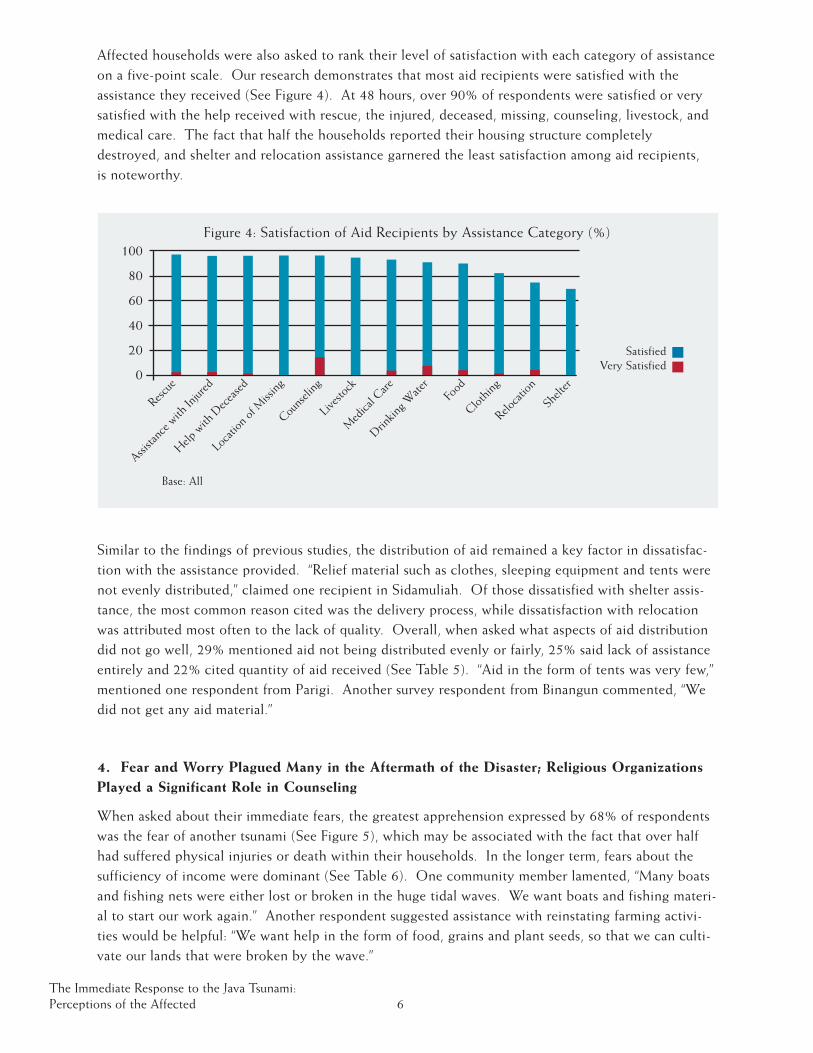
Affected households were also asked to rank their level of satisfaction with each category of assistanceon a five-point scale. Our research demonstrates that most aid recipients were satisfied with theassistance they received (See Figure 4). At 48 hours, over 90% of respondents were satisfied or verysatisfied with the help received with rescue, the injured, deceased, missing, counseling, livestock, andmedical care. The fact that half the households reported their housing structure completelydestroyed, and shelter and relocation assistance garnered the least satisfaction among aid recipients,is noteworthy.
Figure 4: Satisfaction of Aid Recipients by Assistance Category (%)
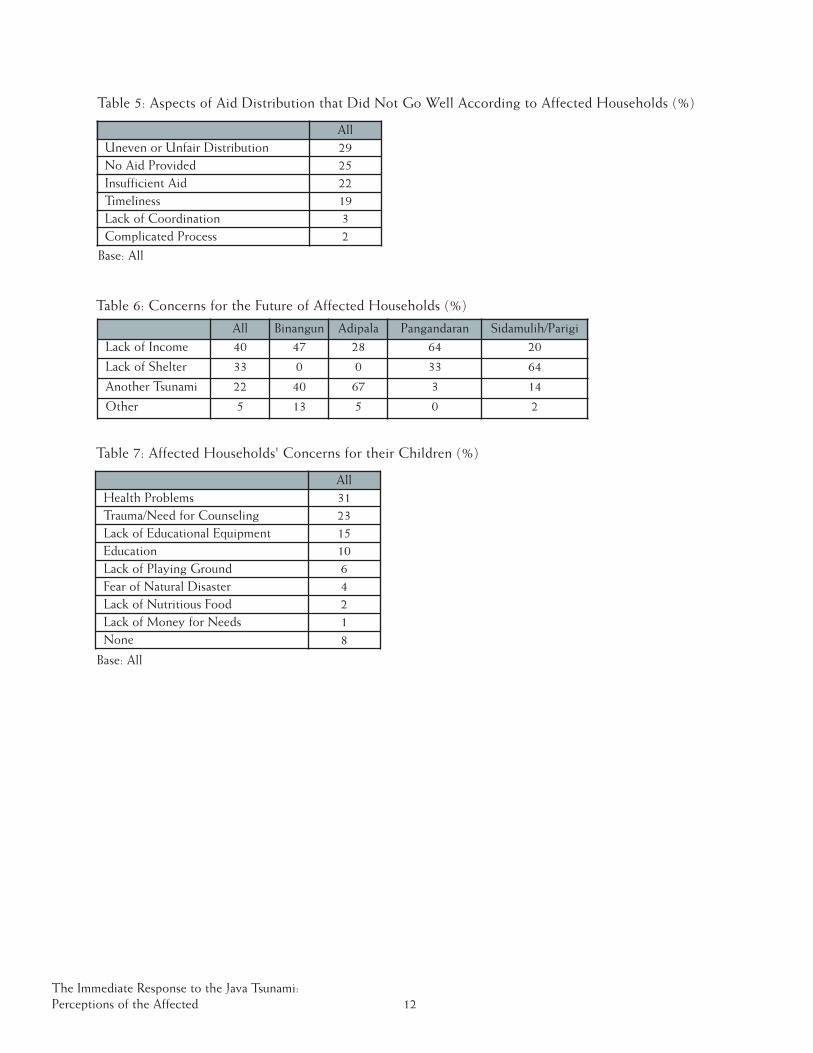
Similar to the findings of previous studies, the distribution of aid remained a key factor in dissatisfac-tion with the assistance provided. “Relief material such as clothes, sleeping equipment and tents werenot evenly distributed,” claimed one recipient in Sidamuliah. Of those dissatisfied with shelter assis-tance, the most common reason cited was the delivery process, while dissatisfaction with relocationwas attributed most often to the lack of quality. Overall, when asked what aspects of aid distributiondid not go well, 29% mentioned aid not being distributed evenly or fairly, 25% said lack of assistanceentirely and 22% cited quantity of aid received (See Table 5). “Aid in the form of tents was very few,”mentioned one respondent from Parigi. Another survey respondent from Binangun commented, “Wedid not get any aid material.”
4. Fear and Worry Plagued Many in the Aftermath of the Disaster; Religious OrganizationsPlayed a Significant Role in Counseling
When asked about their immediate fears, the greatest apprehension expressed by 68% of respondentswas the fear of another tsunami (See Figure 5), which may be associated with the fact that over halfhad suffered physical injuries or death within their households. In the longer term, fears about thesufficiency of income were dominant (See Table 6). One community member lamented, “Many boatsand fishing nets were either lost or broken in the huge tidal waves. We want boats and fishing materi-al to start our work again.” Another respondent suggested assistance with reinstating farming activi-ties would be helpful: “We want help in the form of food, grains and plant seeds, so that we can culti-vate our lands that were broken by the wave.”
The Immediate Response to the Java Tsunami:Perceptions of the Affected 6
100
80
60
40
20
0
Rescue
AssistancewithInjured
Location of Missing
Counseling
Help
withDeceased
Medical Care
Drinking
Water
Food
Livestock
SatisfiedVery Satisfied
Clothing
Relocation
Shelter
Base: All
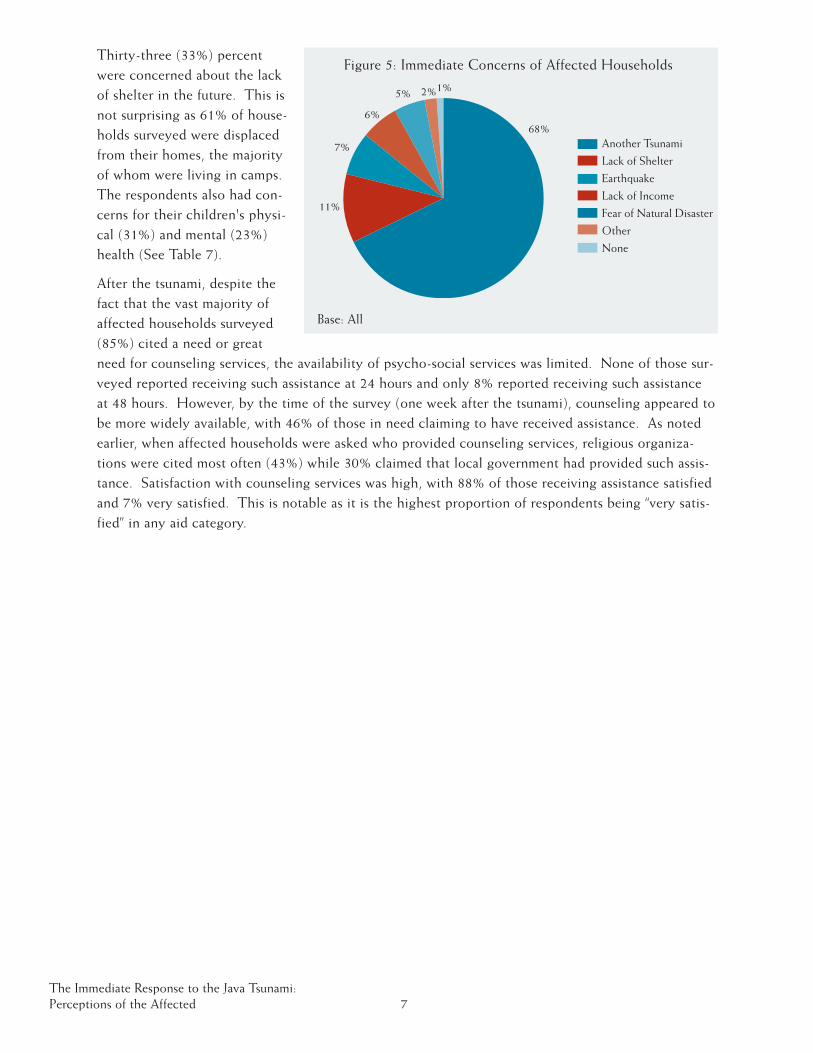
Thirty-three (33%) percentwere concerned about the lackof shelter in the future. This isnot surprising as 61% of house-holds surveyed were displacedfrom their homes, the majorityof whom were living in camps.The respondents also had con-cerns for their children's physi-cal (31%) and mental (23%)health (See Table 7).
After the tsunami, despite thefact that the vast majority ofaffected households surveyed(85%) cited a need or greatneed for counseling services, the availability of psycho-social services was limited. None of those sur-veyed reported receiving such assistance at 24 hours and only 8% reported receiving such assistanceat 48 hours. However, by the time of the survey (one week after the tsunami), counseling appeared tobe more widely available, with 46% of those in need claiming to have received assistance. As notedearlier, when affected households were asked who provided counseling services, religious organiza-tions were cited most often (43%) while 30% claimed that local government had provided such assis-tance. Satisfaction with counseling services was high, with 88% of those receiving assistance satisfiedand 7% very satisfied. This is notable as it is the highest proportion of respondents being “very satis-fied” in any aid category.
The Immediate Response to the Java Tsunami:Perceptions of the Affected 7
Another Tsunami
Lack of Shelter
Earthquake
Lack of Income
Fear of Natural Disaster
Other
None
68%
11%
7%
6%
5% 2%1%
Figure 5: Immediate Concerns of Affected Households
Base: All
1. Building Local Capacity is Critical, Particularly in Hazard-Vulnerable Areas of the World
Within 48 hours of the Java tsunami, the vast majority of affected households had received vital formsof assistance from the local government and private individuals, who comprised over two-thirds of theresponse. The prominent and timely response of the local government combined with the high levelsof satisfaction expressed by aid recipients suggests a significant achievement in preparedness, at leastfor this scale of a disaster.
Looking to the future, local government authorities should recognize the life-saving role of privateindividuals and work towards deepening household and community-level disaster preparedness initia-tives, in addition to establishing more formalized early warning systems and procedures. Only 5% ofaffected households surveyed asserted that they felt equipped to handle such a disaster before thetsunami struck, and only 3% reported receiving any tsunami alerts beforehand. The local govern-ment, in collaboration with community-based organizations, has an opportunity to address the fearand worry expressed by community members by empowering them through household-level disasterpreparedness training and education.
The international humanitarian community needs to recognize existing local and national capacityand coping mechanisms that may be best-suited to meet the needs of communities in the aftermath ofa disaster. As recommended in the Tsunami Evaluation Coalition's Joint Evaluation of the InternationalResponse to the Indian Ocean Tsunami, international agencies must reorient their response from supplyingaid to facilitating communities' own priorities and focusing on strengthening local capacity where it isneeded, particularly in disaster-prone areas of the world.4 As demonstrated in the Java tsunami case,local communities expect their government to provide relief assistance, suggesting other actors shouldcooperate with local government authorities where possible to ensure an effective and coordinatedresponse and to avoid duplication of efforts.
2. Religious Organizations Should be Recognized as an Important Source of CounselingAfter a Disaster
The Java tsunami study reinforces what we have seen in other disaster contexts, in which affectedcommunities express great needs for counseling that are most often unmet. In addition to coping withthe damage and losses suffered, it is clear that the trauma of natural disasters includes an ongoing fearof recurrence. According to the World Food Programme, two weeks after the tsunami more than10,000 people whose homes were not destroyed were still living in camps, afraid to return home forfear of another tsunami.5 Testimony from one of the survey interviewers described the alarmed com-munity at the time of the interview, “During the interview, there was a big wave and people aroundstarted shouting out that there was another tsunami. Everyone was shocked and became afraid.” Theprominent role of religious organizations in providing psycho-social care, combined with the relative-ly high levels of satisfaction with the services provided, suggests the potential role religious organiza-
The Immediate Response to the Java Tsunami:Perceptions of the Affected 8
RECOMMENDAT IONS
4 John Telford and John Cosgrave, Joint Evaluation of the International Response to the Indian Ocean Tsunami: Synthesis Report(London: Tsunami Evaluation Coalition, 2006), 23.
5 United Nations World Food Programme. 2006, August 2. Retrieved April 1, 2007 fromhttp://www.reliefweb.int/rw/rwb.nsf/db900sid/EGUA-6SASMD?OpenDocument&emid=TS-2006-000087-IDN.
tions may play in the aftermath of a disaster. Particularly in hazard-vulnerable areas, where there is afaith community present, it should be incorporated into the fabric of disaster planning.
3. Quality and Fairness in the Delivery of Assistance are Important to Aid Recipients in theImmediate Aftermath of a Disaster
As in our past surveys, aid recipients after the Java tsunami voiced strong opinions about the appropri-ateness and adequacy of the aid provided, opinions that can inform future humanitarian relief efforts.The most prominent reason for dissatisfaction with shelter was the lack of quality. “We have notreceived proper tents,” claimed one of the displaced. Almost one-quarter of those surveyed, whenasked what aspects of aid distribution did not go well, asserted that the assistance was not being dis-tributed evenly. For the disaster relief community this raises not only the issue of enforcing qualitystandards in aid provision; it also suggests that aid distribution processes should adhere to some stan-dards to maintain an environment of fairness. Deeper engagement with affected individuals and trans-parent allocation procedures may mitigate impressions of unfairness in goods and services provided.
The Immediate Response to the Java Tsunami:Perceptions of the Affected 9
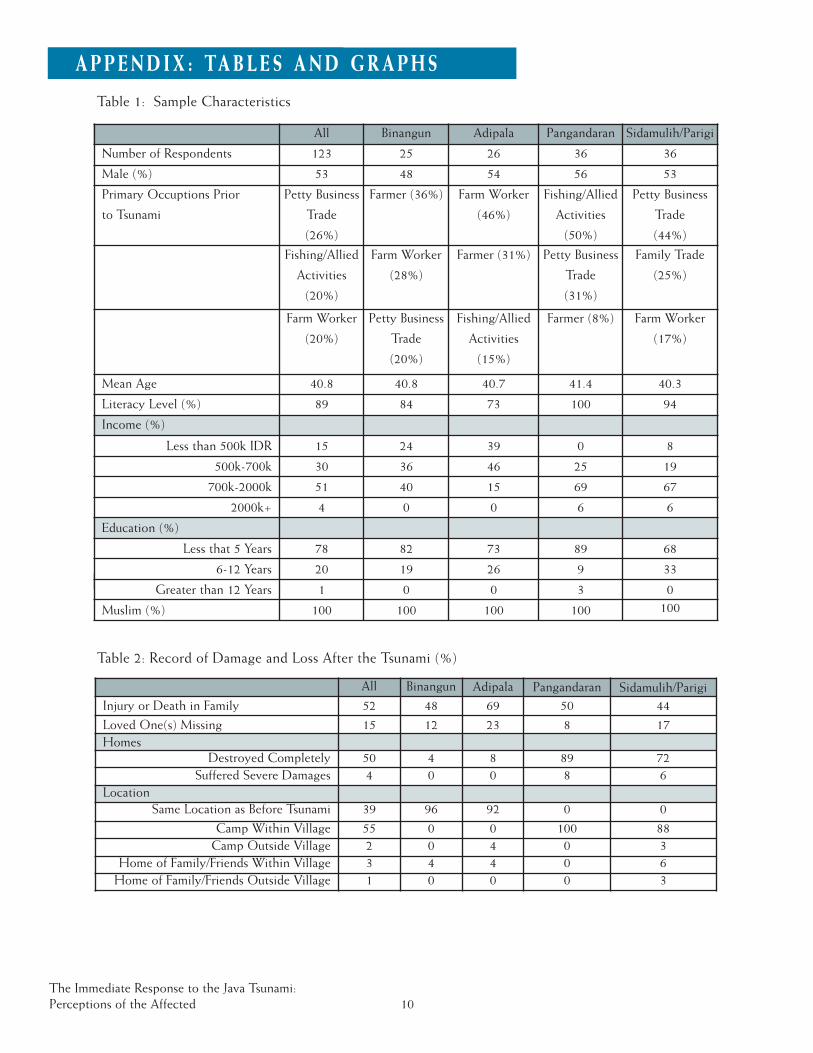
Table 1: Sample Characteristics
Table 2: Record of Damage and Loss After the Tsunami (%)
The Immediate Response to the Java Tsunami:Perceptions of the Affected 10
APPEND IX : TABL E S AND GRAPHS
All Binangun Adipala Pangandaran Sidamulih/Parigi
Number of Respondents 123 25 26 36 36
Male (%) 53 48 54 56 53
Primary Occuptions Prior
to Tsunami
Petty Business
Trade
(26%)
Farmer (36%) Farm Worker
(46%)
Fishing/Allied
Activities
(50%)
Petty Business
Trade
(44%)
Fishing/Allied
Activities
(20%)
Farm Worker
(28%)
Farmer (31%) Petty Business
Trade
(31%)
Family Trade
(25%)
Farm Worker
(20%)
Petty Business
Trade
(20%)
Fishing/Allied
Activities
(15%)
Farmer (8%) Farm Worker
(17%)
Mean Age 40.8 40.8 40.7 41.4 40.3
Literacy Level (%) 89 84 73 100 94
Income (%)
Less than 500k IDR 15 24 39 0 8
500k-700k 30 36 46 25 19
700k-2000k 51 40 15 69 67
2000k+ 4 0 0 6 6
Education (%)
Less that 5 Years 78 82 73 89 68
6-12 Years 20 19 26 9 33
Greater than 12 Years 1 0 0 3 0
Muslim (%) 100 100 100 100 100
All Binangun Adipala Pangandaran Sidamulih/ParigiInjury or Death in Family 52 48 69 50 44
Loved One(s) Missing 15 12 23 8 17Homes
Destroyed Completely 50 4 8 89 72Suffered Severe Damages 4 0 0 8 6
LocationSame Location as Before Tsunami 39 96 92 0 0
Camp Within Village 55 0 0 100 88Camp Outside Village 2 0 4 0 3
Home of Family/Friends Within Village 3 4 4 0 6Home of Family/Friends Outside Village 1 0 0 0 3
The Immediate Response to the Java Tsunami:Perceptions of the Affected 11
Table 3: Principal Group Helping with Aid According to Affected Households
Type of Provider All Binangun Adipala PangandaranSidamulih/Parigi
Government 52 40 42 52 67
Private Individual 27 44 31 15 25
Local NGO 10 8 4 17 8
Religious Organization 6 0 15 8 0
Corporate Sector 5 8 8 8 0
Table 4: Most Outstanding Provider According to Affected Households (%)
Type of Aid 1st Group 2nd GroupMedical Care Local Government (66%) Corporate Sector (11%)Help with Deceased Local Government (43%) Private Individual (36%)Assistance with Injured Local Government(42%) Local NGO (33%)Relocation Local Government (39%) Private Individual (24%)Drinking Water Local Government (35%) Private Individual (31%)Food Local Government (33%) Private Individual (29%)Livestock Private Individual (75%) National Government (12%)Shelter Private Individual (62%) Local Government (14%)Rescue Private Individual (51%) Local Government (18%)Location of Missing Private Individual (38%) Local Government (33%)Clothing Private Individual (34%) Local Government (25%)Counseling Religious Organization (43%) Local Government (30%)
Base: All
The Immediate Response to the Java Tsunami:Perceptions of the Affected 12
Table 6: Concerns for the Future of Affected Households (%)
Table 7: Affected Households' Concerns for their Children (%)
All Binangun Adipala Pangandaran Sidamulih/ParigiLack of Income 40 47 28 64 20
Lack of Shelter 33 0 0 33 64
Another Tsunami 22 40 67 3 14
Other 5 13 5 0 2
AllHealth Problems 31Trauma/Need for Counseling 23Lack of Educational Equipment 15Education 10Lack of Playing Ground 6Fear of Natural Disaster 4Lack of Nutritious Food 2Lack of Money for Needs 1None 8
Base: All
Table 5: Aspects of Aid Distribution that Did Not Go Well According to Affected Households (%)
AllUneven or Unfair Distribution 29No Aid Provided 25Insufficient Aid 22Timeliness 19Lack of Coordination 3Complicated Process 2
Base: All