Embed Size (px)
Citation preview

Bulletin of the Marine Geology, Vol. 28, No. 1, June 2013, pp. 31 to 41
31
The Images of Subsurface Tertiary – Quartenary Deposits Based on Ground Penetrating Radar Records of Subi Kecil Island Coast, Natuna District, Riau Archipelago Province
Pencitraan Endapan Bawah Permukaan Tersier – Kuarter Berdasarkan Rekaman Ground Penetrating Radar, Pantai Pulau Subi Kecil, Kabupaten Natuna Provinsi Kepulauan Riau
Kris Budiono
Marine Geological Institute, Jl. Dr. Junjunan No. 236, Bandung, 40174Email : [email protected](Received 31 January 2013; in revised form 29 April 2013; accepted 17 May 2013)
ABSTRACT: Subsurface Tertiary to Quaternary deposits from coast of Subi Kecil Island, Natuna Distric,Riau Archipelago Province, were imaged with Ground Penetrating Radar (GPR). The GPR survey wascarried out by using GSSI Surveyor III/20 with 270 MHz and 40 MHz of 3200 MLF antennas. GPR data wereprocessed using software GSSI’s RADAN for Windows NT™. The interpretation were done by using theradar facies as a groups of radar reflections. The GPR images of study area can be recoqnized in to severalfacies such as parallel, sub parallel, chaotic, oblique, mound and reflection-free. The calibration were donewith geological data along the coast (cliff and outcrop). Unit A is the uppermost layer which is characterizedby continous to non continous pararel reflection, srong reflector and high amplitude and is interpreted asalluvium deposits. Below the unit A is unit B which is characterized by non continous sub parallel, chaoticand mound reflector, strong reflector and high amplitude.Unit C and D (Mio-Oligocene) are overlain by unit A and B include chaotic, reflection-free and, locally,discontinuous parallel, oblique mound reflector radar facies, correlatable at the cliff face to massive sands,mostly representing near coastal deposits. These units are bounded by continuous, high amplitudereflections that can be easily correlatable throughout the GPR profiles, serving as important stratigraphicmarkers. The GPR survey may improve the reconstruction of the depositional environments through therecognition of massive and unconsolidated sand deposits within unit A and B (Holocene). The stratigraphicframework was also improved through the recognition of the discontinuity surface between Units C and D.
Keywords: radar facies, stratigraphy, Tertiary to Quatenary, Subi Kecil Island
ABSTRAK : Pencitraan endapan bawah permukaan Tersier sampai Kuarter di pantai Pulau Subi Kecil, Natuna,Propinsi Riau Kepulauan, telah dilakukan dengan “Ground Penetrating Radar (GPR). Survey GPR dilakukanmenggunakan SIR 20 GSSI dengan antenna 200 MHz, 40 MHz da MLF 3200. Data GPR diproses mengunakanperangkat lunak Radan GSSI untuk Window NTTM. Citra Radar di daerah penelitian dapat dibagi menjadireflektor paralel, sub paralel, chaotik, oblik, undulasi dan bebas refleksi. Kalibrasi telah dilakukan dengan kondisigeologi sepanjang pantai (tebing dan singkapan batuan). Unit A merupakan lapisan paling atas, dicirikan olehreflektor parallel yang menerus dan tidak menerus, reflektor kuat, amplitudo tinggi dan ditafsirkan sebagai endapanalluvium. Di bawah unit A adalah unit B yang dicirikan oleh reflektor sub paralel yang menerus sampai tidakmenerus, chaotic, hiperbolik, dengan reflektor kuat dan amplitudo tinggi. Unit C dan D (Mio-Oligosen) ditutupi olehunit B yang dicirikan oleh fasies reflektor chaotic, bebas reflektor, dan secara lokal pararel tidak menerus, miring danhiperbolik, dapat dikorelasikan dengan pasir padat pada tebing sebagai endapan dekat pantai. Citra GPRmemperlihatkan rekonstruksi lingkungan pengendapan melalui pengenalan pasir padat dan pasir lepas pada unit Adan B (Holosen). Kerangka stratigrafi akan lebih baik melalui pengenalan ketidak menerusan lapisan antara unit Cdan D.
Kata kunci: fasies radar, stratigrafi, Tersier sampai Kuarter, Pulau Subi Kecil
32 Kris Budiono
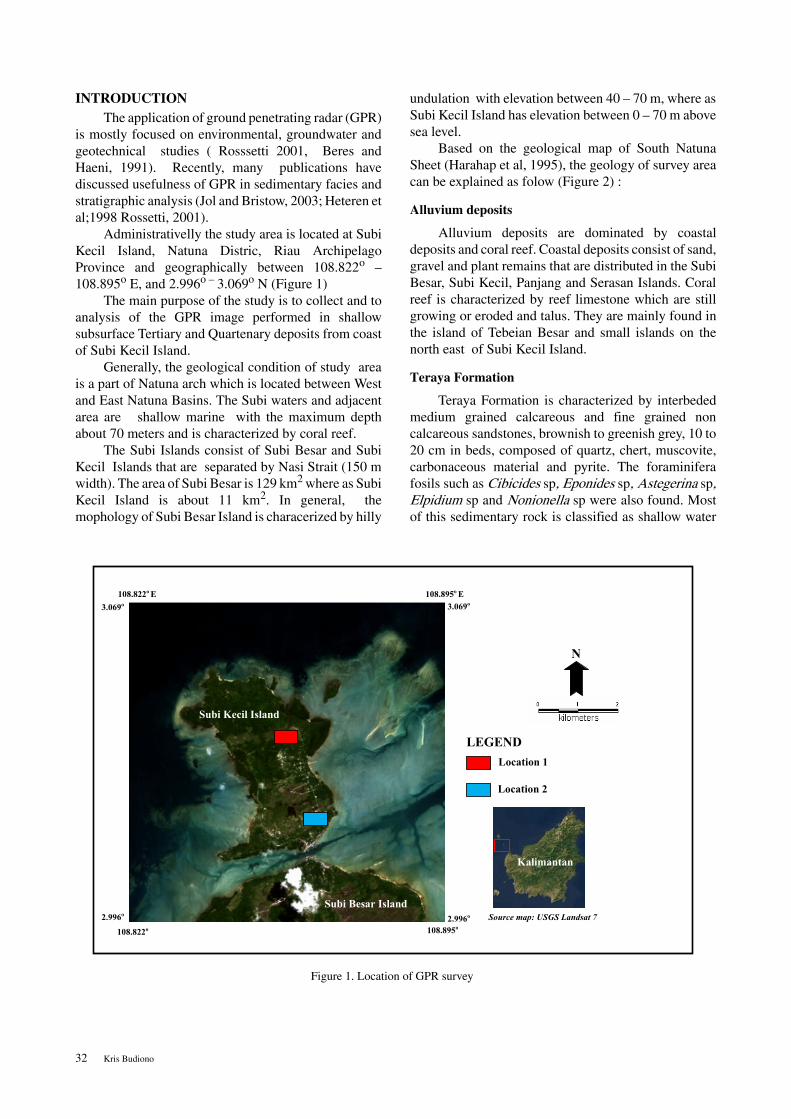
INTRODUCTIONThe application of ground penetrating radar (GPR)
is mostly focused on environmental, groundwater andgeotechnical studies ( Rosssetti 2001, Beres andHaeni, 1991). Recently, many publications havediscussed usefulness of GPR in sedimentary facies andstratigraphic analysis (Jol and Bristow, 2003; Heteren etal;1998 Rossetti, 2001).
Administrativelly the study area is located at SubiKecil Island, Natuna Distric, Riau ArchipelagoProvince and geographically between 108.822o –108.895o E, and 2.996o – 3.069o N (Figure 1)
The main purpose of the study is to collect and toanalysis of the GPR image performed in shallowsubsurface Tertiary and Quartenary deposits from coastof Subi Kecil Island.
Generally, the geological condition of study areais a part of Natuna arch which is located between Westand East Natuna Basins. The Subi waters and adjacentarea are shallow marine with the maximum depthabout 70 meters and is characterized by coral reef.
The Subi Islands consist of Subi Besar and SubiKecil Islands that are separated by Nasi Strait (150 mwidth). The area of Subi Besar is 129 km2 where as SubiKecil Island is about 11 km2. In general, themophology of Subi Besar Island is characerized by hilly
undulation with elevation between 40 – 70 m, where asSubi Kecil Island has elevation between 0 – 70 m abovesea level.
Based on the geological map of South NatunaSheet (Harahap et al, 1995), the geology of survey areacan be explained as folow (Figure 2) :
Alluvium deposits
Alluvium deposits are dominated by coastaldeposits and coral reef. Coastal deposits consist of sand,gravel and plant remains that are distributed in the SubiBesar, Subi Kecil, Panjang and Serasan Islands. Coralreef is characterized by reef limestone which are stillgrowing or eroded and talus. They are mainly found inthe island of Tebeian Besar and small islands on thenorth east of Subi Kecil Island.
Teraya Formation
Teraya Formation is characterized by interbededmedium grained calcareous and fine grained noncalcareous sandstones, brownish to greenish grey, 10 to20 cm in beds, composed of quartz, chert, muscovite,carbonaceous material and pyrite. The foraminiferafosils such as Cibicides sp, Eponides sp, Astegerina sp,Elpidium sp and Nonionella sp were also found. Mostof this sedimentary rock is classified as shallow water
Subi Kecil Island
Subi Besar Island
108.822o E 3.069o
108.895o E 3.069o
108.895o 2.996o
108.822o
2.996o
N
LEGEND Location 1
Location 2
Source map: USGS Landsat 7
Kalimantan
Figure 1. Location of GPR survey

The Images of Subsurface Tertiary – Quartenary Deposits Based on Ground Penetrating Radar Records 33
environment deposition. It was reported that there is nokey fossil for the age in this formation. The distributionof this formation is in the north coast of Subi BesarIsland and the south coast of Subi Kecil Island. Theyoverly conformably the Kutai Formation. Theformation is corelated to the Miocene Arang Formationin the East Natuna and West Natuna Basins.
Kutai Formation
Kutai Formation is dominated by river depositwhich is characterized by poor to moderately beddedand greenish grey to yellowish grey. This formationconsists of conglomerate and sandstone. Conglomerateis characterized by moderately sorted, well rounded,comprise of chert, granite, silicified rock, chalsedon,quartz, kaolinite clay, with a sand matrix. Sandstone ischaracterized by medium to coarse grained, well sorted,composition same as conglomerate with matrix ofkaolinitic clay. The distribution is in the western part ofSerasan and Subi Kecil Islands. They overlyunconformably the Tebeian Volcanics and SerasanPluton. This formation is might be correlated to theOligocene Gabus Formation in the East Natuna andWest Natuna Basins.
Tebeian Volcanic Rock
Tebeian volcanic rocks consit of dacite andandesite holocrystaline, porphyritic, locally altered tochlorite, sericite and epidote.The volcanic forms dykeand extrusion, a subduction related forming the
magmatic belt as Serasan Pluton. The distribution is inthe islands of Subi Kecil, Tebeian, Nangka andPerayun. The Tebeian volcanic rock intrudes BalauFormation and overlain unconformably by KutaiFormation. The age of this volcanic is definitelyunkown.
METHODSThe geological and geophysical survey of Subi
Kecil Island was done and funded by MarineGeological Institute. The surface geological setting ofthe study area was observed through the recognition ofthe rock outcroup which is exposed along the coast lineand coastal cliff. The sub surface geology of the studyarea was recorded by Geophysical Survey Systems IncSIR- 20 Ground Penetrating Radar (GPR). The GPRoperation was arranged according to pre-exiting flatarea and the line was done pararel and perpendicular tothe coast line.
In many contamination problems, the sub bottomsoil, and stratigraphic sub surface information is sparseand drill core, outcrop description only gives a limitedgeometry picture of inhomogeneties (Saarenketo andScullion, 2000). The method of GPR is a promising toolfor resolving changes of physical properties in burialstratigraphic condition at the scale of naturalinhomogeneties arising from changing physical andengineering properties composition (Carrivick, 2007).The GPR record demonstrates that reflection image ofthe basic geometry forms in subsurface geological
Qp Coastal deposits QC Coral Reef Qp Qc
Tok
Kt
Tmt Teraya Formation
Kutai Formation
Tebeian volcanic Rock
HOLOCENE
MIOCENE
OLIGOCENE
EARLY CRETACEOUS
N
Subi Besar Island
SubiKecil Island
108.690O 109.920O
3.065O
2.835O
108.690O 109.920O
2.835O
Figure 2. Geological map of Subi Island, Natuna (modified from Harahap et al, 1995)

34 Kris Budiono
condition might be distinguished (Budiono at all,1996).
The GPR uses antennas placed near or in contactwith the surface of the ground to probe the shallowsubsurface (Figure 3).
The technique is known as ElectromagneticSubsurface Profiling (ESP) and is the electrical analogof seismic sub-bottom profiling technique used inmarine geology.
The techniques are also based on the principle thathigh-frequency of electromagnetic waves may bereflected at boundaries separating heterogeneousregions of the subsurface. They are best suited for high-resolution geophysical and subsurface concrete blockinvestigation. The system is capable of detecting andgraphically displaying subsurface interface in shallowdepth (Beres and Haeni, 1991).
The system is also capable of identifyingsubsurface materials by analyzing the reflected pulses.The shapes of these pulses depend only on the effectivedielectric constant and conductivity of the material.Ranges of values of dielectric constant and conductivityfor different materials are taken from the literature(Budiono, 1999).
A reflection may also be generated by a gradualchange in dielectric constant caused by variable moist,dry and very dry subsurface lithology. Capillary forceproduce a continous change is moisture content over a
thin depth interval for sediment or soil. If the two typesof reflectors-one a transition zone and the other a layerboundary are closely spaced, then their reflections maybe superimposed in a radar section. Neither feature willbe easily recognized, and interpretation would bedifficult (Rossetti and Goes, 2001).
The GPR system is composed of video pulsetransmitter, a receiver and an antenna and note bokscomputer.
Once an area for subsurface investigation has beenestablished, the lightweight antenna unit is towed overthe ground by hand. A portion of the radar signals thathave been reflected from the interface of surface andsubsurface objects is received by the antenna.
Radar reflections from the interface are governedby the differential in the dielectric constant andconductivity of the materials (Van Dam and Schlager,2000)
The system receives reflections of these pulsesfrom interfaces between materials that have differentelectrical properties. This digital data is stored oncomputer and is printed out graphically after area hasbeen scanned, processes and analysis (Beres andHaeni, 1991).
The equipment which was used are: GSSI SIR-20,Note book and GSSI Software Radan, Transducer 400MHz, 270 MHz and Multy Frequency 3200 MLF.
Fugure 3.Operating of Ground Penetrating Radar with 3200 MLF antenna

The Images of Subsurface Tertiary – Quartenary Deposits Based on Ground Penetrating Radar Records 35
Processing of GPR data involves somemodification that can be more easily visualized andinterpreted. Since data obtained from GPR surveys issimilar to data obtained from seismic reflectionsurveys, many of the same techniques used to processseismic data can be used to process GPR data. In manycases, very little processing of the data is required tolocate the target of interest .Normally, the dataprocessing involves the following steps: (Beres andHaeni, 1991).
Converting the data to a usable digital format, removal or minimization of direct and air waves fromthe data, amplitude, gain, filtering the data, migration,decompulation, and stacking.In many cases, it ispossible to use the results from a GPR survey with verylittle processing. In these cases, the only adjustmentsthat need to be made are to convert the data to a usabledigital format, to make gain adjustments to the data, and
to determine the depth to each reflector (such as thewater table) in the subsurface (Johnson, 1987).
The interpretation of GPR-image in this paper isbased on correlation of GPR reflector with the rockoutcroup which is exposed along the coast line and cliff.
The GPR signal can be affected by rock type andpore-water/clay content and chemistry, and its faciesinterpretation relies on the principles of seismicstratigraphy, which mostly include the identification ofreflection configuration and external geometry(Rossetti and Goes, 2001; Heteren et al, 1998; Beresand Haeni, 1991).
Radar stratigraphic procedure identifies radarsequences which are defined by packeges geneticallyrelated strata bounded by unconformities and theircorrelative conformities, as well as to analyze thesedimentary facies and facies architecture in order tounderstand the lithology, depositional environmentsand stratigraphic evolution ( Rossetti and Goes, 2001).
.�
�
Subi Kecil Island
Subi Besar Island
108.822o 3.069o
108.895o 3.069o
108.895o 2.996o
108.822o
2.996o
Breccia Kutai Formation
Sandstone, Kutai Formation
Sandstone, Teraya Formation
Sand (alluvium)
Figure 4. The exposed rock around the Subi Kecil Island

36 Kris Budiono
RESULTSThe interpretation of Ground Penetrating Radar
image was correlated with the lithology that distributedalong the coast and cliff of Subi Kecil Island.
Surface Lithology
The lithology which is exposed around the studyarea can be summarized as follow:
Sand and clay
Sand and clay can be found along the east coastand characterized by grey to yellow, fine to coarsegrained, consists of shell remains, unconsolidatedsediments that are classified as Quartenary alluviumdeposit (Figure 4)
Sandstone and breccias
Sandstone and breccias are also very goodexposure at south and northern coasts of Subi KecilIsland. Sandstone are grey to yellowish grey coloured,fine to medium grained, consists of quartz and feldspar
mineral, massive and consolidated density, medium tohigh hardness.
Breccia has a component which derived from rockfragments of sandstone, silica, basalt, sub angular toangular form and deposited at the northern part of thecoast.
Based on the correlation with the geological mapof Subi Kecil Island, these lithology are parts of Terayaand Kutai Formations.
Analysis of Radar Facies
The procedure to analize the radar facies is similarto the sedimentological facies analysis. The radarfacies is resulted by analizing the GPR data set, whichis consisted in the identification of individual radarfacies. These facies were grouped into radar unit andwill resulted the interpretation of depositionalenvironments (Budiono at all, 1996).
Based on distinctive reflection configuration,there are three groups of radar facies which can berecognized in study area and the description of eachgroup can be explained as follow:
inous
or
se
5m
10m
20m
15m
10m
5m
25m
0m0m Continous parallel- sub parallel facies
Discontinous sub parallel, chaotic, hummocky and free facies
Continous sub parallel,chaotic, hummocky, mound, and divergen facies
ANTENNA 270 ANTENNA 40MHz/MLF A B
Figure 5. The group of radar facies (A. reflector by antenna 270 MHz., B. reflector by antenna 40MHz/MLF 3200)

The Images of Subsurface Tertiary – Quartenary Deposits Based on Ground Penetrating Radar Records 37
Continous parallel – sub parallel facies
This radar facies is characterized by closely-spaced, continous, strong reflector, high-amplitude(Figure 5A and B) with a contant thickness about 2 m.There are two types of parallel reflection which can beidentified in the study area: even and wavy parallel.Even to transparant – parallel and subparallel is shownby GPR image which is recorded by antenna 270 MHz,consists of series horizontal layered, underlying bytranparent parallel facies (Figure 5A). The wavyparallel – sub parallel facies is dominated by undulatingreflector, strong reflector and high amplitude, with thethickness about 2 m (Figure 5B). Most of this facies isshown by GPR image that was recorded by 40 MHz ofMLF 3200 antenna.
Discontinous- sub parallel, hummocky, chaotic and freefacies
Most of these facies are characterized by weak tomedium reflector and low to moderately amplitude. Theimage of this facies is recorded by 270 MHz antenna,that is shown more transparent, weak reflector and lowamplitude (Figure 5A). This condition is different withthe record that resulted by 40 MHz antenna, where thefacies is characterized by more strong reflector and highamplitude (Figure 5B). The thin layer of continousparallel facies is also shown in GPR image that resultedby 40 MHz antenna.
Continous sub parallel, chaotic, hummocky,hypherbolic and divergent facies
These facies occur in packages that are up to 10 mthick. It consists of medium to strong reflector,moderately to high amplitude. Sub parallel, divergentand hummocky facies is very clear in GPR image thatwas resulted by 40 MHz antenna, whereas hyperbolicand chaotic facies is clear enough both in recorded of270 MHz and 40 MHz antenna (Figure 5A and 5B).
Radar unit and interpretation
Radar discontinuities were recognized by theanalysis of different styles of reflection terminations.These discontinuities show good correlation with thesurface geological condition of Subi Kecil Island. Fourradar units from top to bottom were recognized in thestudy area and each unit is characterized by one or morefacies which have been discussed previously.
Location 1
Location 1 was imaged by using 40 MHz antennaand the radar unit can be divided into 4 units mainly unitA, B, C and D, with maximum penetration about 25 mdepth.
Unit A is the uppermost layer, characterized bycontinous parallel-sub parallel facies, strong reflector
and high amplitude. The thickness of this unitapproximately 2 m depth and was interpreted asalluvium deposit
Based on the surface lithology observation,alluvium deposits consists of sand, fine to coarsegrained and clay. Continous parallel facies indicate thatmost of layer dominated by fine fraction material (clay,silt and fine sand). Strong reflector and high amplitude.
Below the unit A is unit B. On line 1A, it showsthat this unit is characterized by discontinuous subparallel, free and chaotic facies, medium to highreflector and high amplitude. On line 2A the facies isdominated by discontinuous sub parallel and chaotic,low to medium reflector and moderately amplitude. Onthis line, unit A sometimes is directly underlain by unitC. On line 3 A, unit B is dominated by continous subpararel facies and wavy, medium reflector andmoderately amplitude. The thickness of this unit isabout 3 m and in some places it can reach until 5 m(Figure 6). This unit is corelable with alluvium deposit.
Unit C is underlain unit B. On line 1A, isdominated by chaotic, free and discontinuous parallelfacies in bottom part, strong reflector and highamplitude. This condition indicate that this facies isvery influenced by ground water. On line 2A, thereflector is characterized by discontinuous sub parallel,chaotic, hummocky, divergen, strong reflector and highamplitude. It is very clear that in this line the unit C isalready deformed and indicated by devergen facies. Online 3A, this unit is dominated by chaotic and continousdevergen parallel facies, strong reflector and highamplitude. It is interpreted that this unit has beendeformed and created structur geology such as fold andfault (Figure 7). Based on the outcrop which is exposedaround the GPR survey area, this unit is corelable withthe sandstone of Miocene Teraya Formation.
Unit D is the lowest layer, it is characterized bydiscontinuous parallel – subparallel, chaotic,hummocky, hyperbolic, medium reflector andmoderately amplitude. The parallel – subparallel andchaotic facies indicate the sandstone facies whereashummocky, chaotic, and hyperbolic can be interpretedas sandstone and breccias of Oligocene KutaiFormation.
Location 2
The GPR survey which have been carried out atlocation 2 were recorded by using 270 MHz antennaand maximum penetration is about 200 nano second orabout 10 m depth ( Figure 7).
There are 3 radar units that can be recognizedfrom location 2 mainly unit A, B and C.
Unit A is uppermost layer, characterized bycontinous parallel facies, strong reflector and highamplitude. This unit has an approximate thickness

38 Kris Budiono
A B
D
C
0
20
5
10
15
25 m
LINE 3A
0
20
5
10
15
25 m
A
B
D
C
LINE 2A
0
20
5
10
15
25 m
D
C
A B
25 50m 0
South North
South North
South North
Figure 6. The radar unit of location 1, recorded by 40 MHz - 3200 MLF antenna

The Images of Subsurface Tertiary – Quartenary Deposits Based on Ground Penetrating Radar Records 39
ranging from 2 to 5 m and interpreted as alluviumwhich consists of sand and clay. Compared to thesediments facies, the continous parallel facies indicatethat the texture of sediment deposits probably ischaracterized by fine to medium grained sediments thatwas deposited through low energy. Below unit A is unitB which is dominated by discontinuous sub parallel,hummocky, hyperbolic and free facies.
All of these facies are dominated by mediumreflector and moderately amplitude. The thicknes ofthis unit is about 2.5 m. Further more each of radarfacies probably can be interpreted as follow:
Sub parallel facies with strong reflector representsand and clay which is influenced by salt water.Between this facies there is hyperbolic facies and mixwith chaotic and hummocky facies. This facies can beinterpreted as sand, clay and reef. All of these depositsare part of alluvium deposit.
Unit C is the lowest layer, characterized bytransparent continous parallel and chaotic facies. Mostof these facies is dominated by weak to mediumreflector and low amplitude. The thickness of this unit is
about 5 m and can be found from 5 m depth (Figure 8).By compairing to the lithology which is exposedaround the study area, this unit can be interpreted assandstone from Teraya Formation.
DISCCUSSIONSThe radar images from GPR survey, have shown
the radar facies which can be correlated with sedimentfacies. In many contamination problems, the subbottom stratigraphy information of study area is spareand surface geological mapping description only give alimited picture of geometry of inhomogeneties. Theresult of GPR survey allowed the studies of subsurfacestratigraphy to be subdivided into several units. Theyhave good correlations with the stratigraphy unit alongthe coast of Subi Kecil Island. Comparisons betweenradar facies and exsposed sediment along the coastlineand cliff, will give more information about thehorizontal and vertical geometry of the stratigraphy ofthe study area.
In general, the GPR image of the study area is thekey of defining radar facies. Bares and Haeni (1991)
0
5
10
0 25 50m
0
5
10m
South North
B
C
A
Depth (m) B A
C
LINE 1 LINE2LINE3
LINE4
N
0 50 100m
Figure 7. The fence diagram of radar unit of location 2, recorded by 270 MHz antenna
40 Kris Budiono
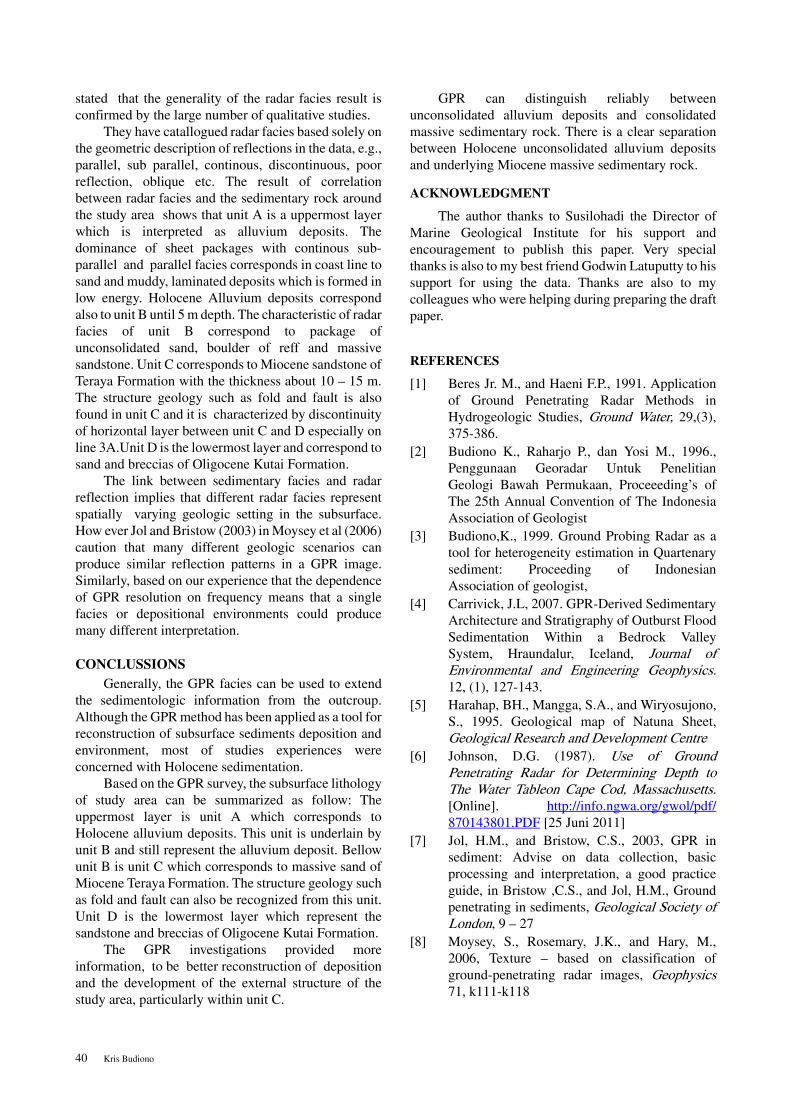
stated that the generality of the radar facies result isconfirmed by the large number of qualitative studies.
They have catallogued radar facies based solely onthe geometric description of reflections in the data, e.g.,parallel, sub parallel, continous, discontinuous, poorreflection, oblique etc. The result of correlationbetween radar facies and the sedimentary rock aroundthe study area shows that unit A is a uppermost layerwhich is interpreted as alluvium deposits. Thedominance of sheet packages with continous sub-parallel and parallel facies corresponds in coast line tosand and muddy, laminated deposits which is formed inlow energy. Holocene Alluvium deposits correspondalso to unit B until 5 m depth. The characteristic of radarfacies of unit B correspond to package ofunconsolidated sand, boulder of reff and massivesandstone. Unit C corresponds to Miocene sandstone ofTeraya Formation with the thickness about 10 – 15 m.The structure geology such as fold and fault is alsofound in unit C and it is characterized by discontinuityof horizontal layer between unit C and D especially online 3A.Unit D is the lowermost layer and correspond tosand and breccias of Oligocene Kutai Formation.
The link between sedimentary facies and radarreflection implies that different radar facies representspatially varying geologic setting in the subsurface.How ever Jol and Bristow (2003) in Moysey et al (2006)caution that many different geologic scenarios canproduce similar reflection patterns in a GPR image.Similarly, based on our experience that the dependenceof GPR resolution on frequency means that a singlefacies or depositional environments could producemany different interpretation.
CONCLUSSIONSGenerally, the GPR facies can be used to extend
the sedimentologic information from the outcroup.Although the GPR method has been applied as a tool forreconstruction of subsurface sediments deposition andenvironment, most of studies experiences wereconcerned with Holocene sedimentation.
Based on the GPR survey, the subsurface lithologyof study area can be summarized as follow: Theuppermost layer is unit A which corresponds toHolocene alluvium deposits. This unit is underlain byunit B and still represent the alluvium deposit. Bellowunit B is unit C which corresponds to massive sand ofMiocene Teraya Formation. The structure geology suchas fold and fault can also be recognized from this unit.Unit D is the lowermost layer which represent thesandstone and breccias of Oligocene Kutai Formation.
The GPR investigations provided moreinformation, to be better reconstruction of depositionand the development of the external structure of thestudy area, particularly within unit C.
GPR can distinguish reliably betweenunconsolidated alluvium deposits and consolidatedmassive sedimentary rock. There is a clear separationbetween Holocene unconsolidated alluvium depositsand underlying Miocene massive sedimentary rock.
ACKNOWLEDGMENT
The author thanks to Susilohadi the Director ofMarine Geological Institute for his support andencouragement to publish this paper. Very specialthanks is also to my best friend Godwin Latuputty to hissupport for using the data. Thanks are also to mycolleagues who were helping during preparing the draftpaper.
REFERENCES
[1] Beres Jr. M., and Haeni F.P., 1991. Applicationof Ground Penetrating Radar Methods inHydrogeologic Studies, Ground Water, 29,(3),375-386.
[2] Budiono K., Raharjo P., dan Yosi M., 1996.,Penggunaan Georadar Untuk PenelitianGeologi Bawah Permukaan, ProceeedingÊs ofThe 25th Annual Convention of The IndonesiaAssociation of Geologist
[3] Budiono,K., 1999. Ground Probing Radar as atool for heterogeneity estimation in Quartenarysediment: Proceeding of IndonesianAssociation of geologist,
[4] Carrivick, J.L, 2007. GPR-Derived SedimentaryArchitecture and Stratigraphy of Outburst FloodSedimentation Within a Bedrock ValleySystem, Hraundalur, Iceland, Journal ofEnvironmental and Engineering Geophysics.12, (1), 127-143.
[5] Harahap, BH., Mangga, S.A., and Wiryosujono,S., 1995. Geological map of Natuna Sheet,Geological Research and Development Centre
[6] Johnson, D.G. (1987). Use of GroundPenetrating Radar for Determining Depth toThe Water Tableon Cape Cod, Massachusetts.[Online]. http://info.ngwa.org/gwol/pdf/870143801.PDF [25 Juni 2011]
[7] Jol, H.M., and Bristow, C.S., 2003, GPR insediment: Advise on data collection, basicprocessing and interpretation, a good practiceguide, in Bristow ,C.S., and Jol, H.M., Groundpenetrating in sediments, Geological Society ofLondon, 9 – 27
[8] Moysey, S., Rosemary, J.K., and Hary, M.,2006, Texture – based on classification ofground-penetrating radar images, Geophysics71, k111-k118

The Images of Subsurface Tertiary – Quartenary Deposits Based on Ground Penetrating Radar Records 41
[9] Rossetti., D.D.F., and Goes, M. A., 2001,Imaging Upper Tertiary to QuarternaryDeposits from Northern Brazil ApplyingGround Penetrating Radar, Journal ofGeoscience. 31 (2), 195-202.
[10] Saarenketo,T., and Scullion, T., (2000). RoadEvaluation with Ground Penetrating Radar,Journal of Applied Geophysics. 43, 119–138.
[11] Van Dam R.L. & Schlager W. 2000. IdentifyingCauses of Ground Penetrating Radar ReflectionUsing Time- Domain Reflectometry andSedimentological Analyses. Sedimentology, 47-435-449.