Embed Size (px)
Citation preview

HAL Id: hal-00960918https://hal.inria.fr/hal-00960918
Submitted on 19 Mar 2014
HAL is a multi-disciplinary open accessarchive for the deposit and dissemination of sci-entific research documents, whether they are pub-lished or not. The documents may come fromteaching and research institutions in France orabroad, or from public or private research centers.
L’archive ouverte pluridisciplinaire HAL, estdestinée au dépôt et à la diffusion de documentsscientifiques de niveau recherche, publiés ou non,émanant des établissements d’enseignement et derecherche français ou étrangers, des laboratoirespublics ou privés.
The ImageCLEF 2012 Plant Identification TaskHervé Goëau, Pierre Bonnet, Alexis Joly, Itheri Yahiaoui, Daniel Barthélémy,
Nozha Boujemaa, Jean-François Molino
To cite this version:Hervé Goëau, Pierre Bonnet, Alexis Joly, Itheri Yahiaoui, Daniel Barthélémy, et al.. The ImageCLEF2012 Plant Identification Task. CLEF’2012: Conference and Labs of the Evaluation Forum, Sep 2012,Rome, Italy. �hal-00960918�

The ImageCLEF 2012 Plant Identification Task
Herve Goeau1, Pierre Bonnet2, Alexis Joly1, Itheri Yahiaoui1,5, DanielBarthelemy3, Nozha Boujemaa1, and Jean-Francois Molino4
1 INRIA, IMEDIA & ZENITH teams, France, [email protected],http://www-rocq.inria.fr/imedia/, http://www-sop.inria.fr/teams/zenith/
2 CIRAD, UMR AMAP, France, [email protected], http://amap.cirad.fr3 CIRAD, BIOS Direction and INRA, UMR AMAP, F-34398, France,
[email protected], http://amap.cirad.fr/fr/index.php4 IRD, UMR AMAP, France, [email protected], http://amap.cirad.fr
5 Laboratoire CReSTIC, Universite de Reims, France, [email protected]
Abstract. The ImageCLEF’s plant identification task provides a testbedfor the system-oriented evaluation of plant identification, more preciselyon the 126 tree species identification based on leaf images. Three typesof image content are considered: Scan, Scan-like (leaf photographs witha white uniform background), and Photograph (unconstrained leaf withnatural background). The main originality of this data is that it wasspecifically built through a citizen sciences initiative conducted by TelaBotanica, a French social network of amateur and expert botanists.This makes the task closer to the conditions of a real-world application.This overview presents more precisely the resources and assessments oftask, summarizes the retrieval approaches employed by the participatinggroups, and provides an analysis of the main evaluation results. With atotal of eleven groups from eight countries and with a total of 30 runssubmitted, involving distinct and original methods, this second year pilottask confirms Image Retrieval community interest for biodiversity andbotany, and highlights further challenging studies in plant identification.
Keywords: ImageCLEF, plant, leaves, images, collection, identifica-tion, classification, evaluation, benchmark
1 Introduction
Convergence of multidisciplinary research is more and more considered as thenext big thing to answer profound challenges of humanity related to health, bio-diversity or sustainable energy. The integration of life sciences and computer sci-ences has a major role to play towards managing and analyzing cross-disciplinaryscientific data at a global scale. More specifically, building accurate knowledgeof the identity, geographic distribution and uses of plants is essential if agri-cultural development is to be successful and biodiversity is to be conserved.Unfortunately, such basic information is often only partially available for pro-fessional stakeholders, teachers, scientists and citizens, and often incomplete forecosystems that possess the highest plant diversity. A noticeable consequence,

expressed as the taxonomic gap, is that identifying plant species is usually im-possible for the general public, and often a difficult task for professionals, suchas farmers or wood exploiters and even for the botanists themselves. The onlyway to overcome this problem is to speed up the collection and integration ofraw observation data, while simultaneously providing to potential users an easyand efficient access to this botanical knowledge. In this context, content-basedvisual identification of plant’s images is considered as one of the most promisingsolution to help bridging the taxonomic gap. Evaluating recent advances of theIR community on this challenging task is therefore an important issue.This paper presents the plant identification task that was organized for the sec-ond year running within ImageCLEF 20126 dedicated to the system-orientedevaluation of visual based plant identification. The task was again focused ontree species identification based on leaf images, but with more species (126 in-stead of 70) which is an important step towards covering the entire flora of agiven region. The task was more related to a retrieval task instead of a pureclassification task in order to consider a ranked list of retrieved species ratherthan a single brute determination. Visual content was being the main availableinformation but with additional information including contextual meta-data (au-thor, date, locality name and geotag, names at different taxonomic ranks) andsome EXIF data. Three types of image content were considered: leaf scans, leafphotographs with a white uniform background (referred as scan-like pictures)and unconstrained leaf’s photographs acquired on trees with natural background.The main originality of this data is that it was specifically built through a cit-izen sciences initiative conducted by Telabotanica7, a French social network ofamateur and expert botanists. This makes the task closer to the conditions ofa real-world application: (i) leaves of the same species are coming from distincttrees living in distinct areas (ii) pictures and scans are taken by different usersthat might not used the same protocol to collect the leaves and/or acquire theimages (iii) pictures and scans are taken at different periods in the year.
2 Task resources
2.1 The Pl@ntLeaves dataset
Building effective computer vision and machine learning techniques is not theonly side of the taxonomic gap problem. Speeding-up the collection of raw ob-servation data is clearly another crucial one. The most promising approach inthat way is to build real-world collaborative systems allowing any user to enrichthe global visual botanical knowledge [15]. To build the evaluation data of Im-ageCLEF plant identification task, we therefore set up a citizen science projectaround the identification of common woody species covering the MetropolitanFrench territory. This was done in collaboration with Tela Botanica social net-work and with researchers specialized in computational botany.
6 http://www.imageclef.org/20127 http://www.tela-botanica.org/

Technically, images and associated tags were collected through a crowd-sourcingweb application [15] and were all validated by expert botanists. Several cyclesof such collaborative data collection and taxonomical validation occurred.
Scans of leaves were first collected over the two summers 2009 and 2010thanks to the work of active contributors from Tela Botanica social network.The idea of collecting only scans during these two seasons periods was to initial-ize training data with limited noisy background and to focus on plant variabilityrather than mixed plant and view conditions variability. This allowed to col-lect 2228 scans over 55 species. A public version of the web application8 wasthen opened in October 2010 and additional data were collected up to March2011. The new collected images were either scans, or photographs with uniformbackground (referred as scan-like photos), or unconstrained photographs withnatural background. They involved besides 15 new species from the previous setof 55 species. Since April 2011 botanists from Tela Botanica contribute regularlyevery month on more and more tree species (174 on leaves at the time of writ-ing), on more localities all over France and neighbouring countries, with moregrowing stages with spring leaves, mature summer leaves, dry autumn leavesand evergreen leaves. This non-stop data collecting over the months introduceslowly visual and morphological variabilities.
The Pl@ntLeaves dataset used within ImageCLEF2012 finally contained 11572images: 6630 scans, 2726 scan-like photos and 2216 photographs (see Figure 1).
Scan Scan-like Photograph
Fig. 1. The 3 image types illustrated with the same species Celtis australis L.
2.2 Pl@ntLeaves metadata
Each image of Pl@ntLeaves dataset is associated with the following meta-data:
– Date date and time of shot or scan– Type (acquisition type: Scan, Scan-like or Photograph)– Content type (see figure3):
• Leaf (tagged by default for all images, supposing that a picture is focusedone single leaf),
8 it is closed now, but a newer a application can be found at http://identify.plantnet-project.org/en/base/plantscan

• Picked leaf most of the time mature leaf - not dry - on the floor,• Upper side and Lower side involving generally 2 images from one leaf,• Branch for some pictures containing enumerable leaves,• Leafage.
– Taxon full taxon name according the botanical database[2](Regnum, Class,Subclass, Superorder, Order, Family, Genus, Species)
– VernacularNames English commun name– Author name of the author of the picture– Organization name of the organization of the author– Locality locality name (a district or a country division or a region)– GPSLocality GPS coordinates of the observation
These meta-data are stored in independent xml files, one for each image. Figure2 displays an example image with its associated xml data.Additional but partial meta-data information can be found in the image’s EXIF,and might include the camera or the scanner model, the image resolution anddimension, the optical parameters, the white balance, the light measures, etc.
Fig. 2. An image of Pl@ntLeaves dataset and its associated metadata
2.3 Pl@ntLeaves variability
The main originality of Pl@ntLeaves compared to previous leaf datasets, such asthe Swedish dataset [22], the ICL dataset [1] or the Smithsonian one [3], is thatit was built in a collaborative manner through a citizen sciences initiative. Thismakes it closer to the conditions of a real-world application: (i) leaves of thesame species are coming from distinct trees living in distinct areas (ii) picturesand scans are taken by different users that might not used the same protocol tocollect the leaves and/or acquire the images (iii) pictures and scans are taken atdifferent periods in the year. Intra-species visual variability and view conditionsvariability are therefore more stressed-out which makes the identification more

Scan Scan-like Photograph
Upper side Lower side Branch Picked leaf Branch Leafage
Fig. 3. Available sub-categories.
realistic but more complex. Figures 4 to 11 provide illustrations of the intra-species visual variability over several criteria including growing stages, colors,global shape, margin appearance, number and relative positions of leaflets, com-pound leaf structures and lobe variations. On the other side, Figure 12 illustratesthe light reflection and shadow variations of Scan-like photos. It shows that thisacquisition protocol is actually very different than pure scans. Both share theproperty of a limited noisy background but Scan-like photos are more complexdue to the lighting conditions variability (flash, sunny weather, etc.) and the un-flatness of leaves. Finally, the variability of unconstrained photographs acquiredon the tree and with natural background is definitely a much more challengingissue as illustrated in Figure 13.
Spring 2012 Summer 2010 Autumn 2011 Winter 2011
Fig. 4. Four leaves from distinct plants of one same species (Platanus x hispanica Wild)collected at different growing stages.
3 Task description
3.1 Training and Test data
The task was evaluated as a retrieval problem with tree species used as classlabels. A part of Pl@ntLeaves dataset was provided as training data whereasthe remaining part was used later as test data. The two subsets were createdwith respect to the individual plants: pictures of leaves belonging to the same

Fig. 5. Color variation of Cotinus coggygria Scop. (Eurasian smoketree)
Fig. 6. Global shape variation of Corylus avellana L. (European Hazel)
Fig. 7. Leaf’s margin variation of Quercus ilex L. (Holm oak)
Fig. 8. Number of leaflets variation of Fraxinus angustifolia Vahl (Narrow-leafed Ash)
Fig. 9. Leaflets relative position variation of Vitex agnus-castus L. (Judas Tree)
individual tree cannot be split across training and test data. This prevents iden-tifying the species of a given tree thanks to its own leaves and that makes thetask more realistic. In a real world application, it is indeed much unlikely that

Fig. 10. Two compound leaves organisations of one same plant of Gleditsia triacanthosL. (Honey locust): pinnate and bipinnate.
Fig. 11. Lobes variation of Broussonetia papyrifera (L.) L’Her. ex Vent. (Paper mul-berry) on one same plant.
Fig. 12. Light reflection and shadow variations of Scan-like photos of Magnolia Gran-diflora L. (Southern Magnolia)
Fig. 13. Variability of unconstrained photographs of Acer platanoides (Norway Maple)
a user tries to identify a tree that is already present in the training data. Thetraining subset was built first by integrating the whole ImageCLEF2011 planttask dataset. New pictures were then added to the training and test data, byselecting randomly new individual plants, in a such way to reach so far aspossible a ratio around 2 individual plants in the training data for 1 individualplant in the test data. Detailed statistics of the composition of the training andtest data are provided in 1.

Pictures Individual plants Contributors Species
ScanTrain 4870 310 22 115Test 1760 157 10 105
Scan-likeTrain 1819 118 8 83Test 907 85 10 77
PhotographTrain 1733 253 22 70Test 483 213 25 63
AllTrain 8422 681 29 126Test 3150 455 38 118
Table 1. Statistics of the composition of the training and test data
3.2 Task objective and evaluation metric
The goal of the task was to associate the correct tree species to each test image.Each participant was allowed to submit up to 3 runs built from different methods.Compared to last year the task was more related to plant species retrieval thana pure classification problem. This year evaluation metric was slightly modifiedin order to consider a ranked list of retrieved species rather than a single brutedetermination. Each test image was attributed with a score between 1 and 0equals to the inverse of the rank of the correct species. An average normalized
score is then computed on all test images. A simple mean on all test images wouldindeed introduce some bias with regard to a real world identification system.Indeed, we remind that the Pl@ntLeaves dataset was built in a collaborativemanner. So that few contributors might have provided much more pictures thanmany other contributors who provided few. Since we want to evaluate the abilityof a system to provide correct answers to all users, we rather measure the mean ofthe average classification rate per author. Furthermore, some authors sometimesprovided many pictures of the same individual plant (to enrich training datawith less efforts). Since we want to evaluate the ability of a system to providethe correct answer based on a single plant observation, we also decided to averagethe classification rate on each individual plant. Finally, our primary metric wasdefined as the following average score S:
S =1
U
U∑
u=1
1
Pu
Pu∑
p=1
1
Nu,p
Nu,p∑
n=1
su,p,n (1)
U : number of users (who have at least one image in the test data)Pu : number of individual plants observed by the u-th userNu,p : number of pictures taken from the p-th plant observed by the u-th usersu,p,n : score between 1 and 0 equals to the inverse of the rank of the correctspecies for the n-th picture taken from the p-th plant observed by the u-th user
It is important to notice that while making the task more realistic, the nor-malized classification score also makes it more difficult. Indeed, it works as if a

bias was introduced between the statistics of the training data and the one of thetest data. It highlights the fact that bias-robust machine learning and computervision methods should be preferred to train such real-world collaborative data.Finally, to isolate and evaluate the impact of the image acquisition type (Scan,Scan-like, Photogragh), a normalized classification score S was computed for eachtype separately. Participants were therefore allowed to train distinct classifiers,use different training subsets or use distinct methods for each data type.
4 Participants and techniques
A total of 11 groups submitted 30 runs, which confirms the successful partic-ipation rate of the previous year task on a new topic. Participants are mainlyacademics, specialized in computer vision and multimedia information retrieval,coming from all around the world: Australia (1), Brazil (1), China (1), France (3),Germany (2), India (1), Italy (1) and Turkey (1). We list below the participantsand give a brief overview of the techniques they used to run the plant identifi-cation task. We remind here that ImageCLEF benchmark is a system-orientedevaluation and not a formal evaluation of the underlying methods. Readers in-terested by the scientific and technical details of any of these methods shouldrefer to the ImageCLEF 2012 working note of each participant.
ArTe-Lab (1 run) [14] In their preliminary evaluations, these participantsexperiment several features and classification methods. They were guided by thewish to design a mobile application and thus aimed to have a good compromisebetween accuracy and computing time and cost. They retained the Pyramid ofHistograms of Orientation Gradients (PHOG) and a variant of the HAAR de-scriptor evaluated as the most stable and robust features in their preliminarytests. They chose a multi-class probability estimation based on Support VectorMachine (SVM) classifiers with a one-vs-one, or pairwise comparisons, strategy.They choose to train a single SVM model for all 3 categories of images, withoutdistinguish Scan, Scan-like and Photograph.
Brainsignals (1 run) [16] The aim of these participants was to focus lesson possible computer-vision related techniques (especially without costly imagepreprocessing and feature extraction), and the much as possible to deal withmachine learning techniques. First, they binarized the images using the Otsualgorithm, in order to extract two features: global shape features (from lateralprojections), and local features (histograms of content types of small rectangularpatches of bits, with and without sub-sampling). A Random Forest Classifier[8]was then used with 100 trees trained with several cross-validation steps on thewhole training data without distinguish Scan, Scan-like and Photograph cate-gories.
BTU DBIS (4 runs) [10] This team used a rather non-typical approach notrelying on classification techniques. Logical combinations of low-level features are

expressed in a query language, the Commuting Quantum Query Language[21],and used to assess a document’s similarity to a species. The principle is tocombine similarity predicates as found in information retrieval and relationalpredicates common in databases. They tested 4 distinct methods without dis-tinguishing the 3 categories Scan, Scan-like and Photograph. Their preliminaryevaluations suggested to use MPEG7 Color Structure Descriptor eventually com-bined with GPS information. The first two runs explored two Query By Examplebased approaches, with or without GPS information. As a third approach, theycombined the second approach with a Top-k Clustering (or ”K-methoid”) tech-niques which exploits relationships within the top-k results. The last run useda pure clustering image approach with GPS information, including the wholetrain and test datasets.
IFSC USP (3 runs) [11] Mainly focused on automatic shape boundary anal-ysis, these participants adapted their approach according the image content andobtained the best results for the Photograph with a semi-automatic approach.Full-automatic approaches were used for Scan and Scan-like, but also on Pho-
tograph for one run. They started by an automatic leaf contour extraction withOtsu’s method on Scan and Scan-like, while they used a k-means clustering al-gorithm in the RGB colorspace for Photograph. The semi-automatic approachon Photograph needs that a user marks leaf and background on regions auto-matically detected by a Mean Shift algorithm. Then, a merging process labelledgradually all content of the picture with these 2 parts. Contour were describedwith complex network[5], volumetric fractal dimension [?] and geometric param-eters. Gabor filters, and local binary patterns were used too. They included foreach run the GPS information. Classification was performed by using LinearDiscriminant Analysis. The first run used all samples from the 3 images cate-gories for the training stage, which paid off comparing to the second run whereonly Scan and Scan-like were used. Only Gabor and GPS features were used forthe automatic run on Photograph because contour extraction were sufficientlyreliable.
Inria IMEDIA (3 runs) [6] These participants used distinct approaches. ForScan and Scan-like, they applied a late fusion of an approach based on shapeboundary features and a large-scale matching approach. The second run used anadvanced shape context descriptor combining boundary shape information andlocal features within a matching approach. These two runs used a top-K decisionrule as classifier, while the third used a multi-class SVM technique on contourbased descriptors with a one-vs-one schema and a linear kernel. For Photograph,local features around constrained Harris points in order to reduce the impactof the background, but automatic segmentation with a rejection criterion wasattempted in order to extract shape features when possible. Two first runs usedmatching and top-K classifier. Last run used a method were Harris points wereassociated to bounding boxes detected as images’ interesting zones; each boxproposed a classification based on a multi-class SVM and a voting scheme uni-

fying their responses. All preliminary evaluations used cross validation withoutsplitting images from a same individual plants.
LIRIS ReVes (3 runs) [12] The method used by these participants is clearlyoriented mobile application and is designed to cope with the challenges of com-plex natural images and to enable a didactic interaction with the user. Thesystem first performs a two-step segmentation of the image, fully automatic onplain background images, and only guided by a rough coloring on photographs.It relies on the evaluation of a leaf model representing the global morphology ofthe leaf of interest, which is then used to guide an active contour towards the ac-tual leaf margin. High-level geometric descriptors, inspired by the criteria usedby botanists, are extracted on the obtained contour, along with more genericshape features, making a semantic interpretation possible. All these descriptorsare then combined in a Random Forest classification algorithm[8].
LSIS DYNI (3 runs) [19] These participant used a modern computer visionframework involving feature extraction coupled with Spatial Pyramidal Match-ing for local analysis and large-scale supervised classification based on linearSVM with the 1-vs-all multi-class strategy. For all submitted runs, they do notconsider the three image categories. They notably obtained good results on Scan
and Scan-like without any segmentation and/or specific pre-processing, and theyobtained the 3 best results for Photograph among all full-automatic approacheswith a significant difference. The differences between the runs concerns the choiceof features and their combination (in late fusion schema). They used a Multi-scale and Color extension of the Local Phase Quantization[17], dense Multiscale(Color) Improved Local Binary Patterns with Sparse Coding of patches[24], anddense SIFT feature with Sparse Coding too. More they combined the descrip-tors, more they obtained better performances.
Sabanci-Okan (2 runs) [25] Mainly focused by automatic shape boundaryanalysis, these participants adapted their approach according the image con-tent and obtained the best results for Scan and Scan-like. They used a balancedcombination of 2 kinds of classifications, a Local Features Matcher and SVM clas-sifiers. Only Scan and Scan-like images were used as a training dataset. Theyused two distinct segmentation methods: Otsu’s method for Scan, Scan-like,and two methods based on watershed transform for Photograph (full or semi-automatic). The Local Feature Matcher exploited local features (shape context,HOG, local curvature) from salient points on the boundary of the leaf. The SVMclassifiers used texture and optionally shape features if test image were from thecategory Scan, or Scan-like or interactively segmented Photograph. For automat-ically segmented Photograph test images, the leaf boundary extractions were notsufficiently reliable for using shape information, and thus they used texture fea-tures for re-training the classifiers. These participants are among the rare onesto mention that they used cross validation without splitting images from a sameindividual plants in order to avoid over fitting problems.

The Who IITK (4 runs) [4] One originality is that these participants re-defined 3 categories taking into account morphological properties of leaves: Sim-
ple leaf in Scan or Scan-like, Compound leaf in Scan or Scan-like and Photo-
graph. For the ”Simple” category, they developed an automatic segmentationmethod based on Otsu working on two steps in order to remove shadows, noisybackground and the petiole of the leaf since it can affect the shape. For the”Compound” category, they used a combination of polynomial curve fitting andminimum-bounding-ellipse scores in order to extract the contour of the ”most”representative leaflet. For Photograph, they developed a GrabCut [20] based in-teractive segmentation technique. Shapes were then described with complex net-work [5] and geometric parameters, and extracted specialized features on marginand venation. In order to fully automatise the process, they designed a Sim-
ple/Compound leaf classifier for test images. Note that on some ”complex” pho-tos where contour was too difficult to extract, like bipinnate compound leaves,they chose to use SURF with a bag-of-word technique. Random Forest Classifi-cation [8] for each category was finally used for the species prediction. The rungiving the best result used in addition the Smote algorithm [13] designed to dealwith unbalanced classification problems.
ZhaoHFUT (3 runs) [26] These participants investigated a linear SpatialPyramidal Matching using Sparse coding (ScSPM) since this kind of approachachieve very good performance in object recognition. Indeed, SPM extends pop-ular bag-of-features approach by taking account the spatial order of local ap-pearances. They used the same structure in [24] and they tested thought the 3runs the spatial encoding of dense SIFT, dense flip-SIFT descriptors (a SIFTextension considering leaf symmetry), and a late fusion of the two approaches.The sparse encoded features are pooled among several scales as spatial pyramidhistogram representations, and these last representations are used as input ofSVM classifiers tuned by cross-validations. The species predictions are formedby normalizing the degrees of attribution in different SVMs.
Table 2 attempts to summarize the methods used at different stages (feature,classification, subset selection,...) in order to highlight the main choices of partic-ipants. This table should be used in next section on result analysis, in order to seeif there are some common techniques which tend to lead to good performances.
5 Results
5.1 Global analysis
Figures 14, 15 and 16 present the normalized classification scores of the 30 sub-mitted runs for each of the three image types. Note that two colors are used inthe graphs to distinguish fully automatic methods from humanly assisted meth-ods. Table 3 finally presents the same results but with detailed numerical values(in that case a run is labelled as automatic only if all image types were processed

Team Segmentation Features Classification Trainingsubset(s)
S/CIP
ArTe-Lab
×PHOGHAAR-like
SVMs, one-vs-one All × ×
Brain-signals
Otsu-likeLateral proj. shapeHisto. of local binary content
Random Forests All × ×
BTUDBIS
×MPEG7 CSD(+GPS)
Query By Example All × ×
IFSCUSP
AllScans: OtsuPhoto: Auto. k-MeansPhoto: Interactive MeanShift
Numerous shape and texture,GPS
Linear Discrimi-nant Analysis
AllAllScans
× ×
InriaIMEDIA
AllScans: OtsuPhoto: Otsu+abort criterion
Harrislike+constraints+SURF+Local shape and textureShape context, DFH shape
Large scale match-ing+knn classifierSVM one-vs-one
AllAllScans
×√
LIRISReVes
Guided active contourGeometric model parameters,Numerous shape and texture,Morphological features
Random ForestsScanScan-likePhoto.
√×
LSISDYNI
×(Multiscale local (color) tex-ture, SIFT) + Sparse codingSpatial Pyramidal Matching
Linear SVM 1-vs-allmulti-class strategy
All × ×
SabanciOkan
AllScans: OtsuPhoto: Semi-auto watershed
Numerous shape and texture,Morphological features
SVM classifiers AllScans ×√
TheWhoIITK
AllScans: OtsuPhoto: interactive GrabCut
Numerous shape and texture,Morphological features,SURF
Random Forest(+Smote)
AS-Simple,AS-Compound,Photo.
√×
Zhao-HFUT
× (flip-)SIFT + Sparse codingSpatial Pyramidal Matching
Linear SVM 1-vs-allmulti-class strategy
All × ×
Table
2.Approaches
used
byparticip
ants.
Intra
iningsubset
columnAll
meansthat
the3categ
ories
where
notdistin
guish
ed,while
AllS
cansmeansScan
and
Scan-like.
ColumnS/C
indica
tesifparticip
ants
treated
distin
ctively
Sim
ple
andCompound.Col-
umnIP
indica
tesif
particip
ants
avoid
tosplit
images
from
asameIndividualPlant
durin
geva
luatio
nontra
iningdataset.

fully automatically).
Run name retrieval type run-type Scans Scan-like Photos Avg
SABANCI OKAN run 2 Visual HA 0,58 0,55 0,22 0,45
THEWHO run 3 Visual HA 0,43 0,4 0,49 0,44
SABANCI OKAN run 1 Visual Auto 0,58 0,55 0,16 0,43
IFSC USP run 1 Mixed HA 0,35 0,41 0,51 0,42
LIRIS Reves run 1 Visual HA 0,42 0,51 0,33 0,42
INRIA Imedia PlantNet run 1 Visual Auto 0,49 0,54 0,22 0,42
INRIA Imedia PlantNet run 2 Visual Auto 0,39 0,59 0,21 0,40
THEWHO run 4 Mixed HA 0,37 0,35 0,43 0,38
LSIS DYNI run 3 Visual Auto 0,41 0,42 0,32 0,38
THEWHO run 1 Mixed HA 0,37 0,34 0,43 0,38
INRIA Imedia PlantNet run 3 Visual Auto 0,47 0,46 0,15 0,36
IFSC USP run 2 Mixed HA 0,34 0,43 0,3 0,36
LSIS DYNI run 2 Visual Auto 0,35 0,35 0,29 0,33
ARTELAB run 1 Visual Auto 0,4 0,37 0,14 0,30
LSIS DYNI run 1 Visual Auto 0,33 0,32 0,24 0,30
THEWHO run 2 Mixed HA 0,3 0,25 0,24 0,27
LIRIS Reves run 0 Visual HA 0,31 0,26 0,19 0,25
HFUT run 3 Visual Auto 0,32 0,26 0,11 0,23
HFUT run 1 Visual Auto 0,3 0,24 0,09 0,21
DBIS run 2 Visual Auto 0,27 0,17 0,17 0,21
DBIS run 1 Mixed Auto 0,27 0,18 0,17 0,20
DBIS run 3 Mixed Auto 0,24 0,16 0,16 0,19
BRAINSIGNALS run 1 Visual Auto 0,25 0,22 0,05 0,17
HFUT run 2 Visual Auto 0,24 0,17 0,09 0,17
DBIS run 4 Mixed Auto 0,23 0,14 0,13 0,17
IFSC USP run 3 Mixed Auto 0,2 0,14 0,12 0,16
LIRIS Reves run 2 Visual Auto 0,21 0,15 0,05 0,14
RMIT run 3 Visual Auto 0,01 0 0 0,00
RMIT run 1 Visual Auto 0 0 0,01 0,00
RMIT run 2 Visual Auto 0 0 0 0,00
Mean 0,32 0,31 0,21 0,28
Median 0,32 0,29 0,18 0,26
Max 0,58 0,59 0,51 0,56Table 3. Normalized classification scores for each run and each image type. HA =humanly assisted, Auto=Full automatic. Top results per image type are highlighted inbold
Best runs: Although scores are more uniform across the three image types,there is still no run this year achieving the best performances on the threetypes. There is even no run in the top-3 of each image type. Sabanci-Okan runs

Fig. 14. Scores for Scan images
Fig. 15. Scores for Scan-like images
achieved very good results on both Scan (1st) and Scan-like (2nd). TheWhoruns achieve good results across the 3 categories but do not obtain the bestperformances on any of them. IFSC USP run1 obtained the best performanceon Photograph category using semi-supervised segmentation but gets modestperformances on Scan. Similarly, INRIA run 2 obtained the best performanceon Scan-like but gets mitigated performances on Scan and Photograph. Finally,

Fig. 16. Scores for Photograph images
the 3rd run of LSIS DYNI is interesting even if it is positioned only at the 9thrank when looking at the average score across all categories: it actually obtainedthe best fully automatic performances on Photograph category which is actu-ally the most challenging task. A normalized recognition rate of 32% on thatcategory makes an automatic real-world application more realistic (whereas lastyear’s automatic runs on photographs did not exceed 20% and with less species).
Impact of the number of species: A first general remark is that the scores areglobally lower than the one obtained during the 2011 campaign whereas the newevaluation metric of the 2012 campaign is more advantageous for participants(only the top-1 specie contributed to the score within the old metric whereas thenew one allows retrieving the right species at larger ranks). That means that thedifficulty of the task increased, and that the technological progress achieved bythe participants did not compensate the increased difficulty. The main changebetween the two campaigns being the number of species covered by the task(from 70 to 126 species), it is very likely that this growth explains the over-all lower performances. More classes actually involve more confusion. From abotanical point of view, the 2012 dataset actually contains more pairs of mor-phologically similar species. The species Betula pendula Roth was for instancequite well recognized in many runs during the 2011 campaign but is this yearoften confused with other species, probably Betula pubescens Ehrh. or Betula
utilis var. jacquemontii sharing several morphological attributes.
Impact of the image type: Another global remark is that the scores of the2012 campaign are more uniform across the different image types than the year

before. So that it is not true anymore that the performances are degrading withthe complexity of the acquisition image type. This might be due to several rea-sons: (i) many species in the training set are more populated than last year withScan-like images, (ii) several participants did use semi-supervised approachesto extract leaf contours in the Photograph category, (iii) participants may havework more on improving their methods for Scan-like and Photograph (since scanswere identified more easily in the 2011 campaign).
About full automatic approaches and using semi-supervised segmen-tation: Every runs were performed with full automatic methods on Scan andScan-like, with or without automatic image segmentation, revelling that all teamsconceive that the problem is solvable in a long term. But with a max of 0.58,and average and a median around 0, 32 for Scan, there is still an important roomof improvement especially when all tree species from a given flora (like aroundthe 500 to 600 tree species in France) will be considered.Concerning Photograph, results demonstrated that a quite accurate leaf con-tour extraction in all training dataset performed with semi-supervised segmen-tation approaches enable to tend towards equivalent performances for Scan andScan-like like for the IFSC-USP or TheWho teams. However it is not the casefor Sabanci-Okan semi-automatic run, maybe because they performed semi-supervised segmentation on test-images only while learning models on Scan andScan-like. In the other side, IFSC-USP team obtained lower results on Scan andScan-like than on Photograph which maybe highlights that accurate leaf contouris required. Moreover, it is difficult to conceive an approach needing tens or hun-dreds thousands of interactive leaf segmentations of a dataset on a entire flora.
About matching and shape boundary approaches: The most frequentlyused class of methods is shape boundary analysis (16 runs among 30 used), exclu-sively or not) which is not surprising since state-of-the-art methods addressingleaf-based identification in the literature are mostly based on leaf segmentationand shape boundary features [7, 18, 9, 23, 5]. Last year, one important remark wasthat more generic image retrieval approaches like matching could provide bet-ter results especially on Scan. But, rather than opposing these two approaches,several participants combined them with success. This suggests that modellingleaves as part-based rigid and textured objects might be complement to shapeboundary approaches that do not characterize well margin details, ribs or limbtexture.
Impact of the training subsets and cross-validations: Considering testimages of Scan and Scan-like categories, we can say it was preferable to excludePhotograph images from training dataset and to not distinguish Scan and Scan-
like during preliminary evaluations. But for Photograph test images, this ruleseems not to be confirmed if we look the best performances obtained automati-cally by LSIS DYNI who used all images in the training dataset. Moreover, onecan note that Sabanci-Okan and Inria teams seem to have take benefit from

the respect of individual-plant during their cross-validation. Indeed, they men-tionned that they do not split images from one same individual plant, in orderto avoid overfitting problems, because images from a one same plants (and thusone same event) are very similar. This approach could be one key of the successof these runs independently to the relevance of the methods.
About using metadata: Using geo-tags to help the identification has beentried again this year by some participants (IFSC USP, THEWHO and DBIS).Unfortunately, this year again, the results show that adding GPS informationin the identification process is likely to degrade the performances. Best runs ofTheWho and DBIS are actually the ones that did not use any additional meta-data complementary to their baseline visual-based technique. The main reason isprobably that the geographic spread of the data is limited (French Mediterraneanarea). So that most species of the dataset might be identically and uniformly dis-tributed in the covered area. Geo-tags would be for sure more useful at a globalscale (continent, countries). But at a local scale, the geographical distributionof plants is much more complex. It usually depends on localized environmentalfactors such as sun exposition or water proximity that would require much moredata to be modelled.We have to note that some potentially relevant information were not or very fewexplored. The content tags (Leaf, Picked leaf, Leafage) for instance were onlyused by Inria Team. Date could have been used in order to identify evergreenplants and improve performances on these species. None of teams explored eitherthe hierarchical taxonomy structure which could be a source of improvement.But some participants like The Who and ReVes LIRIS teams, created their ownmetadata about the leaf organisation (Simple or Compound) in order to treatdifferently these two categories of leaves, which seems to have paid off for im-proving performances.
5.2 Performances per species
This section aims to analyse, considering the results of the various approaches,how and which part of the task were difficult. We analyse which species, imagesand kind of leaves according to morphological attributes, were easy or very hardto identify.We attempt here to evaluate which species are more difficult to identify thanothers. We focus only on Scan in order to limit view conditions bias. We com-puted some basic statistics (mean, median, max) on the score by species overthe runs of all participants. Figure 17 shows these statistics by species with adecreasing order of the max score values. We can note that few species enable toobtain good performances over all approaches. For around one third there is atleast one approach which performed perfectly on all images of theirs associatedspecies. Most of them were species yet contained in the previous year dataset,and thus most of the time with more individual-plants and images. Figure 18shows in addition how are related max scores to the number of individual plantby species and it indicates clearly how more a species has some individual plants
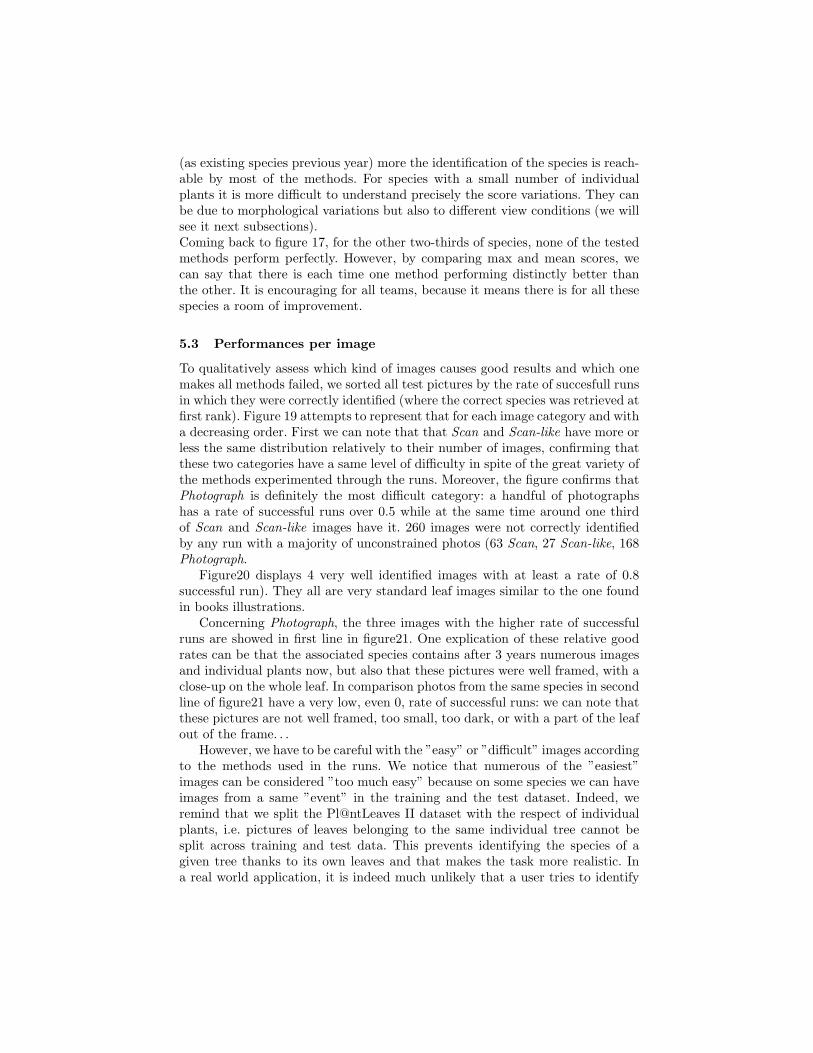
(as existing species previous year) more the identification of the species is reach-able by most of the methods. For species with a small number of individualplants it is more difficult to understand precisely the score variations. They canbe due to morphological variations but also to different view conditions (we willsee it next subsections).Coming back to figure 17, for the other two-thirds of species, none of the testedmethods perform perfectly. However, by comparing max and mean scores, wecan say that there is each time one method performing distinctly better thanthe other. It is encouraging for all teams, because it means there is for all thesespecies a room of improvement.
5.3 Performances per image
To qualitatively assess which kind of images causes good results and which onemakes all methods failed, we sorted all test pictures by the rate of succesfull runsin which they were correctly identified (where the correct species was retrieved atfirst rank). Figure 19 attempts to represent that for each image category and witha decreasing order. First we can note that that Scan and Scan-like have more orless the same distribution relatively to their number of images, confirming thatthese two categories have a same level of difficulty in spite of the great variety ofthe methods experimented through the runs. Moreover, the figure confirms thatPhotograph is definitely the most difficult category: a handful of photographshas a rate of successful runs over 0.5 while at the same time around one thirdof Scan and Scan-like images have it. 260 images were not correctly identifiedby any run with a majority of unconstrained photos (63 Scan, 27 Scan-like, 168Photograph.
Figure20 displays 4 very well identified images with at least a rate of 0.8successful run). They all are very standard leaf images similar to the one foundin books illustrations.
Concerning Photograph, the three images with the higher rate of successfulruns are showed in first line in figure21. One explication of these relative goodrates can be that the associated species contains after 3 years numerous imagesand individual plants now, but also that these pictures were well framed, with aclose-up on the whole leaf. In comparison photos from the same species in secondline of figure21 have a very low, even 0, rate of successful runs: we can note thatthese pictures are not well framed, too small, too dark, or with a part of the leafout of the frame. . .
However, we have to be careful with the ”easy” or ”difficult” images accordingto the methods used in the runs. We notice that numerous of the ”easiest”images can be considered ”too much easy” because on some species we can haveimages from a same ”event” in the training and the test dataset. Indeed, weremind that we split the Pl@ntLeaves II dataset with the respect of individualplants, i.e. pictures of leaves belonging to the same individual tree cannot besplit across training and test data. This prevents identifying the species of agiven tree thanks to its own leaves and that makes the task more realistic. Ina real world application, it is indeed much unlikely that a user tries to identify

Fig. 17. Mean, median and max over the runs of all participants for each specie - scantest images only
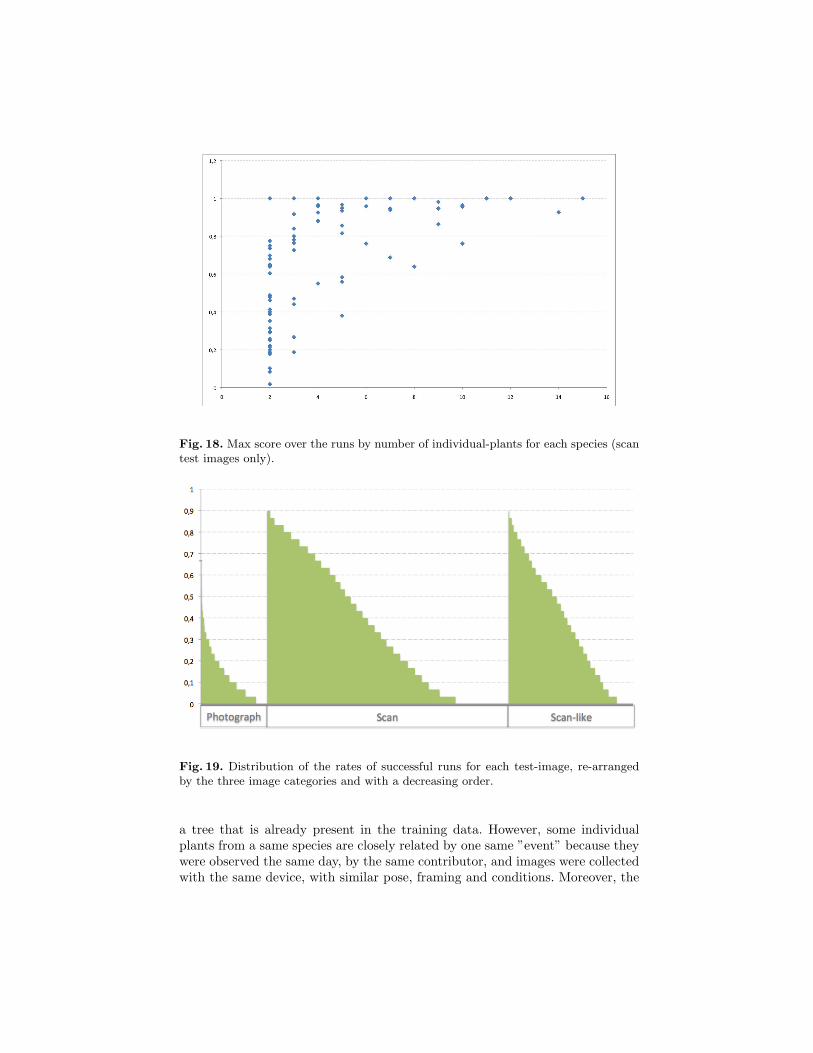
Fig. 18. Max score over the runs by number of individual-plants for each species (scantest images only).
Fig. 19. Distribution of the rates of successful runs for each test-image, re-arrangedby the three image categories and with a decreasing order.
a tree that is already present in the training data. However, some individualplants from a same species are closely related by one same ”event” because theywere observed the same day, by the same contributor, and images were collectedwith the same device, with similar pose, framing and conditions. Moreover, the

Fig. 20. 4 well identified images (more than 24/30 successful runs).
Easy
0.66 0.43 0.43
Difficult
0.03 0.03 0.0
Sp.
Cercis siliquastrum L. Corylus avellana L. Pittosporum tobira(Thunb.) W.T. Aiton
Fig. 21. The 3 photos with the highest rate of successful runs, and 3 photos wih verylow ones from the same species.
individual plants from a same ”event” are observed at the same place and canbe parent tree and/or present the same morphological attributes in function ofthe environment. In other words, these individual plants can be considered asone same individual-plant, and Since we not split the dataset with the respect ofthe notion of ”event”, it still have some bias between test and training datasets,as it can be observed in figure 22.
This notion of ”event”, instead of ”individual-plant”, should be consideredin a next plant identification task.

test image 10921 train image 5483 train image 6358indiv. 209 indiv. 42 indiv. 10312/10/11 12/10/11 12/10/11
Fig. 22. One test image identified by a high rate of 0.9 successful runs, but, which canbe considered ”too easy” because the only individual plants of the associated speciesRhus coriaria L. in the training dataset were observed by a same contributor (DB),the same day (12/10/11), and probably at the same place in Monferrier-sur-Lez.
6 Conclusions
This paper presented the overview and the results of ImageCLEF 2012 plantidentification testbed following the pilot one in 2011. The number of partici-pants increased from 8 to 11 groups showing an increasing interest in applyingmultimedia search technologies to environmental challenges (in 8 distinct coun-tries). The main change between the two campaigns was the number of speciescovered by the task which was increased from 70 to 126 species. The techno-logical progress achieved by the participants did unfortunately not compensatethis increased difficulty since the overall performances degrade. This shows thatscaling state-of-the-art plant recognition technologies to a real-world applicationwith thousands of species might still be a difficult task. On the other side, apositive point was that the performances obtained on unconstrained picturesof leaves with non-uniform background were better than last year. The use ofsemi-supervised segmentation techniques has notably been a key element towardsboosting performances showing that interactivity might play an important roletowards successful applications, typically on mobile phones. But, the best au-tomatic method also provided very honourable results showing that the door isnot closed for a fully automatic identification. Interestingly this method was ageneric visual classification technique without any specificity related to plants.Regarding the other image types, the best method on scans used a combinationof many leaf boundary shape and texture features trained with a SVM classi-fier. The best run on pseudo-scans (photographs with uniform backgrounds) wasachieved by another technology purely based on shape-context features that arealready known to provide good performances for leaf recognition in the litera-ture. Finally, using GPS data in the recognition process was still not beneficialprobably because the geographic spread of the data is limited. A possible evolu-tion for a new plant identification task in 2013 is to extend the task to multipleorgans including flowers, trunks and fruits.

Acknowledgements
This work was funded by the Agropolis fundation through the project Pl@ntNet(http://www.plantnet-project.org/) and the EU through the CHORUS+ Coor-dination action (http://avmediasearch.eu/). Thanks to all participants. Thanksto Violette Roche, Jennifer Carre and all contributors from Tela Botanica.Thanks to Vera Bakic and Souheil Selmi from Inria and Julien Barbe from Amapfor their help for checking the datasets and developing the crowd-sourcing ap-plications.
References
1. The icl plant leaf image dataset, http://www.intelengine.cn/English/dataset2. Tropicos (August 2012), http://www.tropicos.org3. Agarwal, G., Belhumeur, P., Feiner, S., Jacobs, D., Kress, J.W., R. Ramamoorthi,
N.B., Dixit, N., Ling, H., Mahajan, D., Russell, R., Shirdhonkar, S., Sunkavalli,K., White, S.: First steps toward an electronic field guide for plants. Taxon 55,597–610 (2006)
4. Arora, A., Gupta, A., Bagmar, N., Mishra, S., Bhattacharya, A.: A Plant Identi-fication System using Shape and Morphological Features on Segmented Leaflets.In: Working notes of CLEF 2012 conference (2012)
5. Backes, A.R., Casanova, D., Bruno, O.M.: A complex network-based approach forboundary shape analysis. Pattern Recognition 42(1), 54 – 67 (2009)
6. Bakic, V., Yahiaoui, I., Mouine, S., Ouertani-Litayem, S., Ouertani, W., Verroust-Blondet, A., Goeau, H., Joly, A.: Inria IMEDIA2’s participation at ImageCLEF2012 plant identification task. In: Working notes of CLEF 2012 conference (2012)
7. Belhumeur, P., Chen, D., Feiner, S., Jacobs, D., Kress, W., Ling, H., Lopez, I., Ra-mamoorthi, R., Sheorey, S., White, S., Zhang, L.: Searching the world4s herbaria:A system for visual identification of plant species. In: ECCV, pp. 116–129 (2008)
8. Breiman, L.: Random forests. Mach. Learn. 45(1), 5–32 (Oct 2001),http://dx.doi.org/10.1023/A:1010933404324
9. Bruno, O.M., de Oliveira Plotze, R., Falvo, M., de Castro, M.: Fractal dimensionapplied to plant identification. Information Sciences 178(12), 2722 – 2733 (2008)
10. Bottcher, T., Schmidt, C., Zellhofer, D., Schmitt, I.: BTU DBIS’ Plant Identi-fication Runs at ImageCLEF 2012. In: Working notes of CLEF 2012 conference(2012)
11. Casanova, D., ao Batista Florindo, J., Goncalves, W.N., Bruno, O.M.: IFSC/USPat ImageCLEF 2012: Plant identification task. In: Working notes of CLEF 2012conference (2012)
12. Cerutti, G., Antoine, V., Tougne, L., Mille, J., Valet, L., Coquin, D., Vacavant,A.: ReVeS Participation - Tree Species Classification using Random Forests andBotanical Features. In: Working notes of CLEF 2012 conference (2012)
13. Chawla, N.V., Bowyer, K.W., Hall, L.O., Kegelmeyer, W.P.: Smote: Syntheticminority over-sampling technique. Journal of Artificial Intelligence Research 16,321–357 (2002)
14. Gallo, I., Zamberletti, A., Albertini, S.: Fast Tree Leaf Image Retrieval using aProbabilistic Multi-class Support Vector. In: Working notes of CLEF 2012 confer-ence (2012)

15. Goeau, H., Joly, A., Selmi, S., Bonnet, P., Mouysset, E., Joyeux, L.: Visual-basedplant species identification from crowdsourced data. In: Proceedings of ACM Mul-timedia 2011 (2011)
16. Grozea, C.: Brainsignals Submission to Plant Identification Task at ImageCLEF2012. In: Working notes of CLEF 2012 conference (2012)
17. Heikkila, J., Ojansivu, V., Rahtu, E.: Improved blur insensitivity for decorrelatedlocal phase quantization. In: Proceedings of the 2010 20th International Confer-ence on Pattern Recognition. pp. 818–821. ICPR ’10, IEEE Computer Society,Washington, DC, USA (2010), http://dx.doi.org/10.1109/ICPR.2010.206
18. Neto, J.C., Meyer, G.E., Jones, D.D., Samal, A.K.: Plant species identificationusing elliptic fourier leaf shape analysis. Computers and Electronics in Agriculture50(2), 121 – 134 (2006)
19. Paris, S., Halkias, X., Glotin, H.: Participation of LSIS/DYNI to ImageCLEF 2012plant images classification task. In: Working notes of CLEF 2012 conference (2012)
20. Rother, C., Kolmogorov, V., Blake, A.: grabcut”: interactive foreground extractionusing iterated graph cuts. ACM Trans. Graph pp. 309–314 (2004)
21. Schmitt, I.: Qql: A db&ir query language. The VLDB Journal 17(1), 39–56 (Jan2008), http://dx.doi.org/10.1007/s00778-007-0070-1
22. Soderkvist, O.J.O.: Computer Vision Classification of Leaves from Swedish Trees.Master’s thesis, Linkoping University, SE-581 83 Linkoping, Sweden (September2001), liTH-ISY-EX-3132
23. Yahiaoui, I., Herve, N., Boujemaa, N.: Shape-based image retrieval in botanicalcollections. In: Advances in Multimedia Information Processing - PCM 2006, vol.4261, pp. 357–364 (2006)
24. Yang, J., Yu, K., Gong, Y., Huang, T.: Linear spatial pyramid matching usingsparse coding for image classification. In: in IEEE Conference on Computer Visionand Pattern Recognition(CVPR (2009)
25. Yanikoglu, B., Aptoula, E., Tirkaz, C.: Sabanci-Okan at ImageCLEF 2012 PlantIdentification Competition: Combining Features and Classifiers (2012)
26. Zheng, P., Zhao, Z.Q., Glotin, H.: ZhaoHFUT at ImageCLEF 2012 Plant Identifi-cation Task. In: Working notes of CLEF 2012 conference (2012)