Embed Size (px)
Citation preview

Report III, Measuring Internal Auditing’s Value, is one of five deliverables of The IIA’s Global Internal Audit Survey: A Component of the CBOK Study. This is the most comprehensive study ever to capture current perspectives and opinions from a large cross-section of practicing internal auditors, internal audit service providers, and academics about the nature and scope of assurance and consulting activities on the profession’s status worldwide.
Measuring Internal Auditing’s Value identifies the value added to the organization by an internal audit activity and how different factors affect the perceived contribution of an
internal audit activity. The analysis is based on 13,582 responses of IIA members and nonmembers in more than 107 countries.
Other reports in this series are:
Characteristics of an Internal Audit Activity
Core Competencies for Today’s Internal Auditor
What’s Next for Internal Auditing?
Imperatives for Change: The IIA’s Global Internal Audit Survey in Action
This project was made possible through the generous donations made to the
William G. Bishop III, CIA, Memorial Fund
Measuring Internal Auditing’s Value
THE IIA’S GLOBAL INTERNAL AUDIT SURVEY
978-0-89413-698-6
Item No. 5010.3US $25 IIA MembersUS $45 Nonmembers
Measuring Internal Auditing’s Value
THE IIA’S GLOBAL INTERNAL AUDIT SURVEY
A Component of the CBoK Study
Measuring Internal A
uditing’s Value


The IIA’s Global Internal Audit Survey: A Component of the CBOK Study
Measuring Internal Auditing’s Value
Report III
Jiin-Feng Chen, PhD, CIA, CPA
Wan-Ying Lin, DBA

DisclosureCopyright © 2011 by The Institute of Internal Auditors Research Foundation (IIARF), 247 Maitland Avenue, Altamonte Springs, Florida 32701-4201. All rights reserved. No part of this publication may be reproduced, stored in a retrieval system, or transmitted in any form by any means — electronic, mechanical, photocopying, recording, or otherwise — without prior written permission of the publisher.
The IIARF publishes this document for informational and educational purposes. This document is intended to provide information, but is not a substitute for legal or accounting advice. The IIARF does not provide such advice and makes no warranty as to any legal or accounting results through its publication of this document. When legal or accounting issues arise, professional assistance should be sought and retained.
The Institute of Internal Auditors’ (IIA’s) International Professional Practices Framework (IPPF) comprises the full range of existing and developing practice guidance for the profession. The IPPF provides guidance to internal auditors globally and paves the way to world-class internal auditing.
The mission of The IIARF is to expand knowledge and understanding of internal auditing by providing relevant research and educational products to advance the profession globally.
The IIA and The IIARF work in partnership with researchers from around the globe who conduct valuable studies on critical issues affecting today’s business world. Much of the content presented in their final reports is a result of IIARF-funded research and prepared as a service to The Foundation and the internal audit profession. Expressed opinions, interpretations, or points of view represent a consensus of the researchers and do not necessarily reflect or represent the official position or policies of The IIA or The IIARF.
ISBN 978-0-89413-698-62/11First Printing
ii A Component of the CBOK Study

DedicationWilliam G. Bishop III, CIA, served as president of The Institute of Internal Auditors from September 1992 until his untimely death in March 2004. With a motto of “I’m proud to be an internal auditor,” he strived to make internal auditing a truly global profession. Bill Bishop advocated quality research for the enhancement of the stature and practice of internal auditing. To help enhance the future of this profession, it is vital for the profession to document the evolution of the profession worldwide.
iiiA Component of the CBOK Study


Table of Contents
Acknowledgments ............................................................................................................................. vii
About the Authors ............................................................................................................................. ix
Foreword ........................................................................................................................................ xi
Executive Summary ......................................................................................................................... xv
Chapter 1 Introduction ......................................................................................................................1
Chapter 2 Perceived Contributions of Internal Auditing and Organizational Characteristics ............3
Chapter 3 The Relationship Between Characteristics of the Internal Audit Activity and Agreement with Value Statements ...........................................................................29
Chapter 4 Performance Measurement of the Internal Audit Activity ..............................................39
Chapter 5 Performance Measurement Methods and Perceived Contributions ...............................45
Chapter 6 Audit Activities Performed and Perceived Contributions ................................................47
Chapter 7 Conclusion .....................................................................................................................49
The IIA’s Global Internal Audit Survey — Questions ................................................................51
The IIA’s Global Internal Audit Survey — Glossary ..................................................................57
The IIA Research Foundation Sponsor Recognition .................................................................61
The IIA Research Foundation Board of Trustees .......................................................................63
The IIA Research Foundation Committee of Research and Education Advisors ................64
vA Component of the CBOK Study


AcknowledgmentsThe 21st century presents unprecedented growth opportunities for the internal audit profession. Advances in technology, the confluence of the Information and the Internet Age, and the sheer speed and expansion of communications capabilities have significantly accelerated the pace of globalization. Governance, risk, controls, and compliance processes within organizations have undergone significant change to manage the increasing complexity and sophistication of global business operations. All of these developments offer a huge opportunity for internal audit functions, whether in-sourced, co-sourced, or outsourced, including the potential to add even greater value to their respective organizations.
To ensure that a body of knowledge is systematically built up, developments in practice in a dynamically changing environment must be carefully monitored and continually analyzed to reveal critically important insights. Key lessons learned from the experience of the profession must constitute part of the historical record and be transmitted to current and future generations of internal audit professionals for optimal outcomes. Not only must we strive to secure a robust portrayal of the current state of the profession, but encourage practice-relevant research to inform and push the boundaries of practice.
We are fortunate that under the auspices of the William G. Bishop III, CIA, Memorial Fund, administered by The IIA Research Foundation, it is possible to undertake large-scale studies of the global internal audit profession. We sincerely appreciate Mary Bishop’s passion and commitment to further the internal audit profession while honoring Bill Bishop’s legacy. The inaugural Common Body of Knowledge (CBOK) survey under William Taylor’s leadership occurred in 2006; this is the second iteration. Based on the responses from The IIA’s Global Internal Audit Survey from 2006 and now in 2010, it is possible to compare results and perform high-level trending.
Five reports cover the full spectrum of a wide range of the survey questions (carefully designed to allow for comparison between the 2006 and 2010 survey data). These reports cover topical content from characteristics of an internal audit activity to implications for charting the future trajectory of the profession. The cooperation and sharing among the five report-writing teams representing the Americas, Asia, Europe, and the Middle East have made this project a truly global and collaborative effort.
We hope that this collection of reports describing the expected influence of major themes about, and developments in, the profession as extracted from the survey will provide a comprehensive snapshot of the profession globally, offer helpful insights and actionable intelligence, and point the way forward to maintaining the profession’s continued relevance and value-added contributions.
For a large global project such as The IIA’s Global Internal Audit Survey, the list of individuals to thank is quite extensive. First of all, our special thanks go to IIA Research Foundation Trustee Marjorie Maguire-Krupp who was involved at the inception of the CBOK study in the fall of 2008, and soon thereafter, retired former IIA President David Richards who, along with Michelle Scott, provided the initial leadership to this significant project.
viiA Component of the CBOK Study

In addition, we must acknowledge William Taylor and Leen Paape, both advisors to the CBOK 2010 study co-chairs, and the following international members of the CBOK 2010 Steering Committee, as well as the Survey Design Subcommittee and the Deliverables Oversight Subcommittee, for their guidance and significant contributions to the survey design, administration, data collection, interpretation, and topic-specific reports: Abdullah Al-Rowais, AbdulQader Ali, Audley Bell, Sezer Bozkus, John Brackett, Ellen Brataas, Edouard Bucaille, Adil Buhariwalla, Jean Coroller, David Curry, Todd Davies, Joyce Drummond-Hill, Claudelle von Eck , Bob Foster, Michael Head, Eric Hespenheide, Greg Hill, Steve Jameson, Béatrice Ki-Zerbo, Eric Lavoie, Luc Lavoie, Marjorie Maguire-Krupp, John McLaughlin, Fernando Mills, Michael Parkinson, Jeff Perkins, Carolyn Saint, Sakiko Sakai, Patricia Scipio, Paul Sobel, Muriel Uzan, R. Venkataraman, Dominique Vincenti, and Linda Yanta.
Several members of these committees must be particularly thanked for their extended participation in what became a prolonged, three-year commitment for this large-scale undertaking. Each of these individuals contributed their leadership, wealth of knowledge and experience, time, and effort to the CBOK study and deserves our deepest gratitude.
Professor Mohammad Abdolmohammadi of Bentley University was key to the 2010 data analysis and preparation of summary tables of the survey responses, as he was for the CBOK study in 2006. Professor Sandra Shelton of DePaul University must be recognized for giving the reports a smooth flow and an overall consistency in style and substance.
The survey could not have succeeded without the unstinted and staunch support of the survey project champions at The IIA institutes worldwide. At The IIA’s global headquarters in Altamonte Springs, Florida, United States, many staff members, especially Bonnie Ulmer and Selma Kuurstra, worked tirelessly and provided indispensable support and knowledge. Bonnie Ulmer, IIARF vice president, David Polansky, IIARF executive director, and Richard Chambers, IIA president and CEO (who simultaneously served as executive director for most of the project), provided the necessary direction for the successful completion of the project.
Last but not least, The IIA’s 2010 CBOK study component — The Global Internal Audit Survey — and the resulting five reports owe their contents to thousands of IIA members and nonmembers all over the world who took the time to participate in the survey. In a sense, these reports are a fitting tribute to the contributions made by internal audit professionals around the globe.
CBOK 2010 Steering Committee Co-chairs
Dr. Sridhar Ramamoorti, CIA, CFSA, CGAPAssociate Professor of AccountancyMichael J. Coles College of Business Kennesaw State University
Susan Ulrey, CIA, FCA, CFEManaging Director, Risk Advisory ServicesKPMG LLP
Measuring Internal Auditing’s Value
viii A Component of the CBOK Study

About the AuthorsJiin-Feng Chen, PhD, CIA, CCSA, CPA, is associate professor of accounting at National Chengchi University (Taiwan, Republic of China) where he teaches intermediate accounting and accounting information systems. He is an active participant at The Institute of Internal Auditors (Taiwan) and serves on its executive board. He is one of the main translators of The IIA’s International Professional Practices Framework (IPPF) and COSO Guidance on Internal Control for Financial Reporting for IIA-Taiwan. Chen has published articles for the internal audit profession in Internal Auditor (Taiwan) and Computer Auditing (Taiwan) on topics related to internal audit quality assurance, electronic commerce, and Internet business reporting. His research focuses on the best practices of internal auditing and corporate governance. He also recently authored and taught continuing education programs in the areas of internal auditing, internal financial reporting standards, corporate governance, and internal control.
Wan-Ying Lin, DBA, is associate professor of accounting at National Chengchi University (Taiwan, Republic of China) where she teaches accounting principles, financial statement analysis, and issues on corporate earnings. She currently serves on an independent board of directors of a company listed in the Taiwan Securities Exchange Market. Her research focuses on internal auditing, corporate governance, business processes analysis, financial reporting, and the performance management and accountability for not-for-profit organizations. Lin has published articles in Industrial Management and Data Systems, International Accountant, Journal of Management Research, Corporate Board: Role, Duties and Composition, and journals issued in Taiwan on topics related to her research interests.
ixA Component of the CBOK Study


ForewordThe IIA’s Global Internal Audit Survey: A Component of the CBOK StudyThe 2010 IIA Global Internal Audit Survey is the most comprehensive study ever to capture the current perspectives and opinions from a large cross-section of practicing internal auditors, internal audit service providers, and academics about the nature and scope of assurance and consulting activities on the profession’s status worldwide. This initiative is part of an ongoing global research program funded by The Institute of Internal Auditors Research Foundation (IIARF) through the William G. Bishop III, CIA, Memorial Fund to broaden the understanding of how internal auditing is practiced throughout the world.
A comprehensive database was developed, including more than 13,500 useable responses from respondents in more than 107 countries. The five reports derived from analysis of the survey responses provide useful information to internal audit practitioners, chief audit executives (CAEs), academics, and others to enhance the decision-making process involving staffing, training, career development, compliance with The IIA‘s International Standards for the Professional Practice of Internal Auditing (Standards), competencies, and the emerging roles of the internal audit activity.
�� Characteristics of an Internal Audit Activity (Report I) examines the characteristics of the internal audit activity, including demographics, staffing levels, and reporting relationships.
�� Core Competencies for Today’s Internal Auditor (Report II) identifies and discusses the most important competencies for internal auditors. It also addresses the adequacy, use, and compliance with The IIA’s Standards.
�� Measuring Internal Auditing’s Value (Report III) focuses on measuring the value of internal auditing to the organization.
�� What’s Next for Internal Auditing? (Report IV) provides forward-looking insight identifying perceived changes in the roles of the internal audit activity over the next five years.
�� Imperatives for Change: The IIA’s Global Internal Audit Survey in Action (Report V) contains conclusions, observations, and recommendations for the internal audit activity to anticipate and match organizations’ fast-changing needs to strategically position the profession for the long term.
The 2010 survey builds upon the baseline established in prior Common Body of Knowledge (CBOK) studies (i.e., 2006), allowing for comparison, analysis, and trends as well as a baseline for comparison when The IIA’s Global Internal Audit Survey is repeated in the future.
PRIOR IIA CBOK Studies The IIA has sponsored five prior CBOK studies. The table on the following page compares the number of participating countries and usable questionnaire responses used in each CBOK study. While CBOK studies I through IV were offered only in English, the 2006 and 2010 surveys were available in 17 and 22 languages, respectively.
xiA Component of the CBOK Study

CBOK’s Number of Respondents and Countries Over the Years
CBOKNumber Year
Number of Countries
Number of UsableResponses
I 1972 1 75
II 1985 2 340
III 1991 2 1,163
IV 1999 21 136
V 2006 91 9,366
VI 2010 107 13,582
The 2010 IIA Global Internal Audit Survey — Benefits to the ProfessionMaximizing the internal audit function is imperative to meet the challenges of today’s business environment. Globalization and the rapid pace of change have in many ways altered the critical skill framework necessary for success at various levels of the internal audit function. Internal auditing’s value will be measured by its ability to drive positive change and improvement. It is imperative for internal auditing to examine current trends within the profession and thus be able to make recommendations for changes within the internal audit activity. This should help internal auditing to:
�� Deliver the greatest value to its organization.
�� Anticipate and meet organizations’ needs.
�� Strategically position the profession for the long term.
Research TeamsThe following researchers, selected from the responses to the Request for Proposal, were involved in writing the reports and worked closely with Mohammad J. Abdolmohammadi (Bentley University, United States) who provided general data analysis from the 2006 and 2010 survey databases as well as additional analysis based on researchers’ request.
Report I
Yass Alkafaji, Munir A. Majdalawieh, Ashraf Khallaf (American University of Sharjah, United Arab Emirates) and Shakir Hussain (University of Birmingham, United Kingdom).
Report II
James A. Bailey (Utah Valley University, United States).
Report III
Jiin-Feng Chen and Wan-Ying Lin (National Chengchi University, Taiwan, Republic of China).
Measuring Internal Auditing’s Value
xii A Component of the CBOK Study

Report IV
Georges M. Selim and Robert Melville (Cass Business School, United Kingdom), Gerrit Sarens (Université Catholique de Louvain, Belgium), and Marco Allegrini and Giuseppe D’Onza (University of Pisa, Italy).
Report V
Richard J. Anderson (De Paul University, United States) and J. Christopher Svare (Partners in Communication, United States).
xiiiA Component of the CBOK Study
Foreword

Executive SummaryReport III focuses on measuring the value of internal auditing under dynamic business conditions and the key factors contributing to the value delivered by an internal audit activity. The value can be viewed from the perspectives of internal auditors/internal audit service providers, customers (such as the board, audit committee, senior management) and other stakeholders. This report covers the perceived value of internal audit activities by internal auditors/internal audit service providers. To understand the linkage between the performance of an internal audit activity and its perceived contribution (value), this report addresses 1) the relationship between organizational characteristics and the perceived contribution of an internal audit activity; 2) the effect of an internal audit activity’s characteristics on its perceived contribution; 3) the effect of internal audit activity performance measurement methods on its perceived contribution; and 4) the relationship between the services performed by an internal audit activity and its perceived contribution.
An analysis of the survey responses revealed the following key findings:
�� Most respondents believe that their internal audit activities add value to their organizations. Both independence and objectivity are viewed as key factors for internal audit activities to add value.
�� While most respondents view their internal audit activity as contributing to controls, they do not to the same extent perceive it as contributing to risk management or governance.
�� The results from regional comparisons indicate that there are significant differences across the seven regions in terms of the perceived contribution of internal audit activities to organizations.
�� The most important factors to the perceived contribution of the internal audit activity are 1) having appropriate access to the audit committee; 2) functioning without coercion to change a rating assessment or withdraw a finding; and 3) more audit tools or technology used on a typical audit engagement.
�� Compared to 2006, there appears to be a declining trend in sourcing the internal audit activity from outside the organization. The percentage of co-sourcing or outsourcing of the activity has an impact on its perceived effectiveness, measured in terms of process effectiveness, effective functioning, and sufficient organization status, rather than on the perception of the value added.
�� The internal audit activity performance methods most frequently used include 1) assessment by percentage of the audit plan completed; 2) acceptance and implementation of recommendations; 3) surveys/feedback from the board/audit committee/senior management; 4) customer/auditee surveys from audited departments; 5) assurance of sound risk management; and 6) reliance by external auditors on the internal audit activity.
xvA Component of the CBOK Study

�� The balanced scorecard and assurance of sound risk management/internal control methods are expected to gain importance as internal audit activity performance methods in the coming years.
This report provides insight to direct internal audit activities in delivering value to the organization to meet stakeholder expectations.
Measuring Internal Auditing’s Value
xvi A Component of the CBOK Study

Chapter 1 IntroductionThe IIA defines internal auditing as “an independent, objective assurance and consulting activity designed to add value and improve an organization’s operations.” In the Glossary of The IIA’s International Standards for the Professional Practice of Internal Auditing (Standards), “add value” is defined as, “Value is provided by improving opportunities to achieve organizational objectives, identifying operational improvement, and/or reducing risk exposure through both assurance and consulting services.”1 This report focuses on measuring the value of internal auditing. Its purpose is to 1) conduct a global analysis2 of 2010 survey data that is expected to shed some light on the relative use or different key performance indicators; and 2) provide useful and actionable information for practitioners from the analysis.
As reported in the 2006 survey, value indicators or methods used by the surveyed organizations in measuring the value of internal auditing include the acceptance and implementation of recommendations, assessment by customer surveys from audited departments, the number of management requests for internal assurance or consulting projects, and reliance by the external auditors on the internal audit activity. It is documented that “considerable differences exist between groups in the methods used to evaluate the value add by the [internal audit activities (IAAs)]” (CBOK Survey, 2006, pp. 197–199). The value provided by the internal audit activities can be viewed from the perspectives of internal audit service providers, customers (such as the board, audit committee, senior management), and other stakeholders. The survey only investigates the view of internal audit service providers; therefore, this report only covers the value of the internal audit activity as perceived by internal audit service providers.
This report goes a step further to focus on understanding the linkage between the performance of an internal audit activity and its perceived contribution (value). To better understand the linkage, the following issues are addressed:
�� Is there a relationship between organizational characteristics and the perceived contribution of an internal audit activity?
�� How do the characteristics of an internal audit activity affect its perceived contribution?
�� Do ways of measuring the performance of an internal audit activity used by organizations affect the activity’s perceived contribution?
�� Is there a relationship between the services performed by and the perceived contribution of an internal audit activity?
1A Component of the CBOK Study
1 As of 2011, “add value” is defined as, “The internal audit activity adds value to the organization (and its stakeholders) when it provides objective and relative assurance, and contributes to the effectiveness of governance, risk management, and control pro-cesses.”
2 The global comparison is based on The IIA’s classification of institutes into seven regions.

The basic notion is that the value of an internal audit activity is determined by its usefulness to the organization. The usefulness of internal audit services is reflected by the activity’s perceived contribution, which is affected by many factors, including organizational characteristics (Issue 1), the internal audit activity’s characteristics (Issue 2), performance measurement of the internal audit activity (Issue 3), and the internal audit services performed (Issue 4). In addition, there are other factors (such as laws and regulations, corporate governance structure, and characteristics of survey respondents) that need to be considered in analyzing the value of internal auditing. A conceptual framework for the interrelationships between the perceived contribution (value) of internal auditing and these factors is illustrated in Figure 1-1.
Figure 1-1: Conceptual Framework for Measuring Internal Auditing’s Value
This report analyzes the relationship between organizational characteristics (such as region, industry type, and scope of operations) and the perceived contributions of internal auditing. Secondly, it examines the methods or mechanisms used by organizations to measure the performance of their internal audit activity and determines whether these methods affect the internal auditors’ perceptions of their contribution. Key success factors such as the internal audit activity’s organizational status, independence, strategy, staffing or competencies are identified for valuable internal audit activities. Finally, this report compares the key performance indicators used by an internal audit activity with its perceived contribution to the organization.
Value of Internal Auditing
Determined by
Affected by
Perceived contribution to governance, risk management and control processes by the internal audit activity, the board of directors, senior management, and other stakeholders
IA performance measuresEvaluator of IA performance
Laws and Regulations
IC reportfrequency,
content, etc.
Corporate Governance
Structure, Audit Committee
IA Activity Characteristics
• History• Planning• Audit strategy• Tools, skills &
competencies• Role changes
• Formal IA activity charter/strategy etc.
• Appointment of CAE
• Appointment of IA service provider
IA Standards• Use• Level of
compliance• Adequacy• QAIP• External
quality assessment
Audit Activities• Scope• Audit report
content• Communica-
tion of findings• Follow-up of
corrective actions
OrganizationalCharacteristics• Region• Total
employeesTotal assets
• Total revenue or budget
• Industry type• Scope of
operations
RespondentCharacteristics• Age• Gender• Highest level of
education• Academic
major• Position• Professional
certification• Professional
experience• Total years as
CAE• Line of
reporting• 40 hours of
formal training
Interaction/Communication
In-house oroutsourcing
Measured andaffected by
Measuring Internal Auditing’s Value
2 A Component of the CBOK Study

Chapter 2Perceived Contributions of Internal Auditing and Organizational CharacteristicsPerceived Contributions of Internal Auditing
Report III uses the perceived contribution of an internal audit activity as the proxy for its value to the organization. In the survey, one of the questions is designed to understand the respondents’ perception of the contribution of their internal audit activities. The question contains 15 statements addressing the different aspects of added value of an internal audit activity to its organization. Table 2–1 provides the respondents’ level of agreement with each of the statements.
The majority of the respondents agree that their own internal audit activity:
�� Is an independent objective assurance and consulting activity.
�� Adds value to its organization.
�� Brings a systematic approach to evaluate the effectiveness of internal controls.
�� Proactively examines important financial matters, risks, and internal controls.
In addition, they agree that both independence and objectivity are key factors for their internal audit activity to add value.
In contrast, more than 30 percent of the respondents indicate that their internal audit activities do not bring a systematic approach to evaluate the effectiveness of governance processes and consider that direct access to the audit committee is not an important factor for adding value to the governance process or are neutral in their responses. However, almost 90 percent of the respondents “agree” or “strongly agree” that their internal audit activity is credible within the organization and 80 percent of them “agree” or “strongly agree” that their internal audit activities have sufficient status in the organization to be effective. Although some of the activities are less involved in the governance process, most respondents believe that they add value to their organizations.
3A Component of the CBOK Study

Table 2–1 Perceived Contributions of the Internal Audit Activity
Items Strongly Disagree Disagree Neutral Agree Strongly
Agree Total
A1: Your internal audit activity is an independent objective assurance and consulting activity.
count 45 53 101 1,004 1,699 2,902
% 1.6 1.8 3.5 34.6 58.5 100
A2: Your internal audit activity adds value.
count 31 30 163 1,389 1,278 2,891
% 1.1 1.0 5.6 48.0 44.2 100
A3: Your internal audit activity brings a systematic approach to evaluate the effectiveness of risk management.
count 43 129 431 1,453 825 2,881
% 1.5 4.5 15.0 50.4 28.6 100
A4: Your internal audit activity brings a systematic approach to evaluate the effectiveness of internal controls.
count 34 50 170 1,367 1,269 2,890
% 1.2 1.7 5.9 47.3 43.9 100
A5: Your internal audit activity brings a systematic approach to evaluate the effectiveness of governance processes.
count 41 214 689 1,393 549 2,886
% 1.4 7.4 23.9 48.3 19.0 100
A6: Your internal audit activity proactively examines important financial matters, risks, and internal controls.
count 33 113 385 1,520 835 2,886
% 1.1 3.9 13.3 52.7 28.9 100
A7: Your internal audit activity is an integral part of the governance process by providing reliable information to management.
count 44 128 427 1,381 916 2,896
% 1.5 4.4 14.7 47.7 31.6 100
A8: One way your internal audit activity adds value to the governance process is through direct access to the audit committee (or equivalent).
count 137 211 570 1,088 852 2,858
% 4.8 7.4 19.9 38.1 29.8 100
A9: Your internal audit activity has sufficient status in the organization to be effective.
count 69 165 345 1,265 1,054 2,898
% 2.4 5.7 11.9 43.7 36.4 100
Measuring Internal Auditing’s Value Audit Activity
4 A Component of the CBOK Study
Items Strongly Disagree Disagree Neutral Agree Strongly
Agree Total
A10: Independence is a key factor for your internal audit activity to add value.
count 40 44 139 935 1,736 2,894
% 1.4 1.5 4.8 32.3 60.0 100
A11: Objectivity is a key factor for your internal audit activity to add value.
count 35 14 66 928 1,843 2,886
% 1.2 .5 2.3 32.2 63.9 100
A12: Your internal audit activity is credible within your organization.
count 33 51 243 1,338 1214 2,879
% 1.1 1.8 8.4 46.5 42.2 100
A13: Compliance with the International Standards for the Professional Practice of Internal Auditing (Standards) is a key factor for your internal audit activity to add value to the governance process.
count 60 183 612 1,277 758 2,890
% 2.1 6.3 21.2 44.2 26.2 100
A14: Compliance with The IIA's Code of Ethics is a key factor for your internal audit activity to add value to the governance process.
count 54 111 505 1,259 963 2,892
% 1.9 3.8 17.5 43.5 33.3 100
A15: Your internal audit activity meets/exceeds the requirements of The IIA's Code of Ethics.
count 46 109 569 1,356 815 2,895
% 1.6 3.8 19.7 46.8 28.2 100
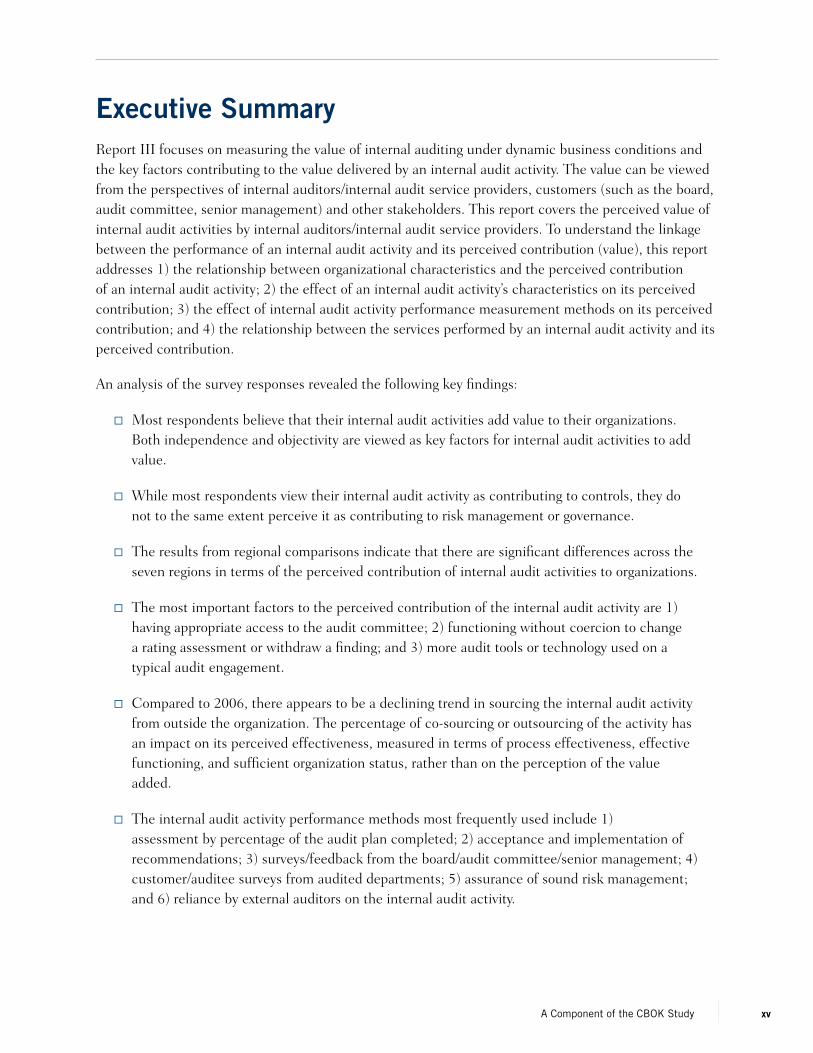
Most respondents believe that compliance with the Standards and The IIA’s Code of Ethics is a key factor in adding value to the governance process and 75 percent of the respondents believe that their internal audit activity meets/exceeds the requirements of the Code of Ethics.
In summary, most respondents believe that their internal audit activities are adding value to their organizations. As expected, both independence and objectivity are viewed as key factors for internal audit activities to add value. The results also indicate that while most internal audit functions see themselves as contributing to controls, they do not to the same extent perceive themselves as contributing to risk management or governance.
The perceived contribution of the internal audit activity is measured with 15 value statements in the 2010 survey questionnaire. Based on the nature of these value statements and for the ease of discussion, the statements are classified into five sub-themes: 1) value added by the internal audit activity; 2) systematic approach to evaluate process effectiveness; 3) effective functioning of the internal audit
Table 2–1 Perceived Contributions of the Internal Audit Activity (continued)
Chapter 2: Perceived Contributions of Internal Auditing and Organizational Characteristics
5A Component of the CBOK Study

activity; 4) adding value to governance process; and 5) organization status of an effective internal audit activity. The reasons for these groupings are as follows.
First, for an internal audit activity to add value (A2), independence (A10) and objectivity (A11) are two of the basic requirements. Furthermore, the internal audit activity contributes to the effectiveness and efficiency of governance (A5), risk management (A3), and control processes (A4). For an internal audit activity to be effective, it should provide independent objective assurance and consulting services (A1), proactively examine important financial matters, risks, and internal controls (A6), and be an integral part of the governance process by providing reliable information to management (A7). Compliance with the Standards (A13) and Code of Ethics (A14) is essential for an internal audit activity to add value to the governance process. Also important is an internal audit activity’s direct access to the audit committee or equivalent (A8). Finally, an effective internal audit activity needs to have sufficient status (A9) and be credible within the organization (A12). Meeting or exceeding the requirements of the Code of Ethics by an internal audit activity (A15) is essential to maintaining its status and credibility. The grouping of the value statements is shown in Table 2–2.
Table 2–2Sub-themes of the Value Statements Concerning Internal Audit Activity
1. Internal auditing as a value-added activity.
A2 Your internal audit activity adds value.
A10 Independence is a key factor for your internal audit activity to add value.
A11 Objectivity is a key factor for your internal audit activity to add value.
2. Systematic approach to evaluate process effectiveness.
A3 Your internal audit activity brings a systematic approach to evaluate the effectiveness of risk management.
A4 Your internal audit activity brings a systematic approach to evaluate the effectiveness of internal controls.
A5 Your internal audit activity brings a systematic approach to evaluate the effectiveness of governance processes.
3. Effective functioning of an internal audit activity.
A1 Your internal audit activity is an independent objective assurance and consulting activity.
A6 Your internal audit activity proactively examines important financial matters, risks, and internal controls.
A7 Your internal audit activity is an integral part of the governance process by providing reliable information to management.
4. Adding value to governance process.
A8 One way your internal audit activity adds value to the governance process is through direct access to the audit committee (or equivalent).
Measuring Internal Auditing’s Value Audit Activity
6 A Component of the CBOK Study

A13 Compliance with the International Standards for the Professional Practice of Internal Auditing (Standards) is a key factor for your internal audit activity to add value to the governance process.
A14 Compliance with The IIA’s Code of Ethics is a key factor for your internal audit activity to add value to the governance process.
5. Organizational status for an effective internal audit activity.
A9 Your internal audit activity has sufficient status in the organization to be effective.
A12 Your internal audit activity is credible within your organization.
A15 Your internal audit activity meets/exceeds the requirements of The IIA’s Code of Ethics.
Perceived Contributions and Regions of WorkThere are regional differences in the social, economic, regulatory, and cultural environments within which organizations operate. These differences would be expected to affect the way an internal audit activity functions and its perceived contribution to the organization. This section analyzes the relationship between the respondents’ perceived contribution and their regions of work based on The IIA’s classification of seven regions.3 Due to the ambiguity inherent in the Unanswered/Other category, the following analyses do not include this category. The results are presented in Tables 2–3 through 2–9.
Internal Auditing as a Value-added Activity
As indicated in Table 2–3, the Latin America and Caribbean region has the highest percentage of respondents who “strongly agree” or “agree” that their internal audit activity adds value to its organization (A2) (95.5 percent). This is followed by the United States and Canada (94.4 percent) and Western Europe (94.0 percent). The Asia Pacific region has the lowest percentage (85.2 percent) of respondents who “strongly agree” or “agree.”
For statements A10 (independence) and A11 (objectivity), the differences in the levels of agreement across the regions are less significant. The Latin America and Caribbean region still has the highest percentage (96.3 percent and 98.0 percent), followed by Western Europe (93.8 percent and 97.5 percent) and the United States and Canada (91.7 percent and 96.0 percent). In addition, Europe-Central Asia and the Middle East have the lowest level of agreement on statements A10 and A11, respectively.
3 Where the respondent is working for a multinational company, the survey does not investigate the regions of operation for that company. Therefore, our analysis is based only on the respondent’s region of work as identified by the respondent.
Table 2–2Sub-themes of the Value Statements Concerning Internal Audit Activity (continued)
Chapter 2: Perceived Contributions of Internal Auditing and Organizational Characteristics
7A Component of the CBOK Study

Table 2–3Regional Comparison of Value Added by the Internal Audit Activity
Region of Work:
Afric
a
Asia
Pac
ific
Euro
pe-
Cent
ral A
sia
Latin
Am
eric
a
and
Carib
bean
Mid
dle
East
Unite
d St
ates
an
d Ca
nada
Wes
tern
Eur
ope
Unan
swer
ed/
Othe
r
Tota
l
A2: Your internal audit activity adds value.
Strongly Disagree Col. % 2.2 1.6 0.9 0.8 0.0 1.6 0.5 0.0 1.1
Disagree Col. % 1.5 1.6 0.9 2.0 3.4 0.9 0.5 0.0 1.0
Neutral Col. % 5.1 11.7 6.0 1.6 5.2 3.1 5.1 14.3 5.6
Agree Col. % 46.0 57.0 44.3 30.2 31.0 42.1 55.3 50.0 48.0
Strongly Agree Col. % 45.3 28.2 47.9 65.3 60.3 52.3 38.7 35.7 44.2
Total Count 137 514 336 245 58 705 882 14 2,891
Row % 4.7 17.8 11.6 8.5 2.0 24.4 30.5 0.5 100.0
A10: Independence is a key factor for your internal audit activity to add value.
Strongly Disagree Col. % 2.2 1.6 1.5 0.4 1.7 1.8 1.0 0.0 1.4
Disagree Col. % 0.7 2.0 1.5 0.4 1.7 2.1 1.2 0.0 1.5
Neutral Col. % 4.4 6.1 7.2 2.9 5.1 4.4 4.0 14.3 4.8
Agree Col. % 30.7 48.4 33.2 16.7 25.4 31.7 28.2 28.6 32.3
Strongly Agree Col. % 62.0 42.0 56.6 79.6 66.1 60.0 65.6 57.1 60.0
Total Count 137 512 334 245 59 710 883 14 2,894
Row % 4.7 17.7 11.5 8.5 2.0 24.5 30.5 0.5 100.0
A11: Objectivity is a key factor for your internal audit activity to add value.
Strongly Disagree Col. % 2.2 1.6 0.9 0.8 1.7 1.7 0.7 0.0 1.2
Disagree Col. % 0.0 1.8 0.0 0.4 0.0 0.3 0.2 0.0 0.5
Neutral Col. % 2.2 3.1 3.9 0.8 5.1 2.0 1.6 7.1 2.3
Measuring Internal Auditing’s Value
8 A Component of the CBOK Study

Region of Work:
Afric
a
Asia
Pac
ific
Euro
pe-
Cent
ral A
sia
Latin
Am
eric
a
and
Carib
bean
Mid
dle
East
Unite
d St
ates
an
d Ca
nada
Wes
tern
Eur
ope
Unan
swer
ed/
Othe
r
Tota
l
Agree Col. % 35.6 48.7 37.0 19.5 25.4 28.3 27.3 28.6 32.2
Strongly Agree Col. % 60.0 44.8 58.1 78.5 67.8 67.7 70.2 64.3 63.9
Total Count 135 509 332 246 59 709 882 14 2,886
Row % 4.7 17.6 11.5 8.5 2.0 24.6 30.6 0.5 100.0
Systematic Approach to Evaluating Process EffectivenessBased on The IIA’s definition, internal auditing helps an organization accomplish its objectives by bringing a systematic, disciplined approach to evaluate and improve the effectiveness of risk management, control, and governance processes. Table 2–4 summarizes the respondents’ assessments by region of the level at which their internal audit activity contributes to the systematic evaluation of the effectiveness of risk management, internal control, and governance processes.
Respondents across all regions indicate that their internal audit activity contributes to the systematic evaluation of internal control, followed by a slightly lower assessment of the contribution of the internal audit activity to the effectiveness of risk management. In addition, there are higher percentages of neutral responses for the statement relating to governance processes. It implies that the respondents are less confident with their contributions to the systematic evaluation of the risk management and governance processes of their organizations than the contribution of the internal audit activity to the evaluation of internal controls (Table 2–4).
If a mature internal audit function is defined as being one where the perceived importance of governance, risk management, and control is co-equal, then the organizational importance of internal auditing may be rated based on the three values in combination. With that in mind, Table 2–5 presents the levels of agreement with these three statements in combination by region. Among the regions, the Middle East has the highest average level of agreement (87.6 percent), followed by Latin America and the Caribbean (84.0 percent) and Western Europe (82.5 percent). The Asia Pacific region has the lowest average level of agreement (70.5 percent).
Effective Functioning of the Internal Audit ActivityThe majority of respondents from all regions “strongly agree” or “agree” that their internal audit activity is an independent objective assurance and consulting activity. The regions with the highest levels of
Table 2–3Regional Comparison of Value Added by the Internal Audit Activity (continued)
Chapter 2: Perceived Contributions of Internal Auditing and Organizational Characteristics
9A Component of the CBOK Study

agreement are Western Europe (95.8 percent), Latin America and Caribbean (95.5 percent), and United States and Canada (94.5 percent). (See Table 2–6.)
The perceived contribution of the internal audit activity in examining important financial matters, risks, and internal controls is highest among respondents from the Middle East (91.2 percent), followed by Latin America and Caribbean (89.4 percent) and Africa (86.7 percent). These regions also have the three highest levels of agreement on the contribution of the internal audit activity to providing reliable information to management (89.7 percent, 83.7 percent, and 82.4 percent). However, only 69.3 percent of the respondents from Europe-Central Asia perceive that their internal audit activity proactively examines important financial matters, risks, and internal controls, which is lower than the average percentage of 81.6 percent.
Table 2–4Regional Comparison of Systematic Approach to Evaluating Process Effectiveness
Region of work:
Afric
a
Asia
Pac
ific
Euro
pe-C
entr
al
Asia
Latin
Am
eric
a an
d Ca
ribbe
an
Mid
dle
East
Unite
d St
ates
an
d Ca
nada
Wes
tern
Eur
ope
Unan
swer
ed/
Othe
r
Tota
l
A3: Your internal audit activity brings a systematic approach to evaluate the effectiveness of risk management.
Strongly Disagree Col. % 2.2 2.2 2.7 1.2 0.0 1.1 0.9 7.1 1.5
Disagree Col. % 5.1 5.7 5.4 2.9 5.1 5.1 3.3 0.0 4.5
Neutral Col. % 15.3 25.0 14.7 13.9 6.8 14.2 10.5 28.6 15.0
Agree Col. % 43.1 50.9 44.3 44.3 49.2 51.1 54.8 57.1 50.4
Strongly Agree Col. % 34.3 16.3 32.9 37.7 39.0 28.5 30.5 7.1 28.6
Total Count 137 509 334 244 59 705 879 14 2,881
Row % 4.8 17.7 11.6 8.5 2.0 24.5 30.5 0.5 100.0
A4: Your internal audit activity brings a systematic approach to evaluate the effectiveness of internal controls.
Strongly Disagree Col. % 2.3 1.6 2.1 0.4 0.0 1.4 0.6 0.0 1.2
Disagree Col. % 0.8 3.9 2.4 1.2 0.0 1.3 1.0 0.0 1.7
Neutral Col. % 6.8 11.5 7.5 3.3 3.4 4.2 3.8 21.4 5.9
Agree Col. % 42.4 53.3 51.5 42.9 45.8 40.6 49.6 50.0 47.3
Strongly Agree Col. % 47.7 29.8 36.5 52.2 50.8 52.5 45.0 28.6 43.9
Measuring Internal Auditing’s Value
10 A Component of the CBOK Study

Region of work:
Afric
a
Asia
Pac
ific
Euro
pe-C
entr
al
Asia
Latin
Am
eric
a an
d Ca
ribbe
an
Mid
dle
East
Unite
d St
ates
an
d Ca
nada
Wes
tern
Eur
ope
Unan
swer
ed/
Othe
r
Tota
l
Total Count 132 514 334 245 59 707 885 14 2,890
Row % 4.6 17.8 11.6 8.5 2.0 24.5 30.6 0.5 100.0
A5: Your internal audit activity brings a systematic approach to evaluate the effectiveness of governance processes.
Strongly Disagree Col. % 1.5 1.8 3.6 1.6 1.7 1.0 0.7 0.0 1.4
Disagree Col. % 5.2 8.4 6.9 6.6 5.1 7.6 7.5 14.3 7.4
Neutral Col. % 23.7 28.5 18.7 16.9 15.3 25.6 24.2 28.6 23.9
Agree Col. % 46.7 46.3 48.9 47.7 49.2 48.2 49.5 50.0 48.3
Strongly Agree Col. % 23.0 15.0 21.8 27.2 28.8 17.5 18.2 7.1 19.0
Total Count 135 512 331 243 59 707 885 14 2,886
Row % 4.7 17.7 11.5 8.4 2.0 24.5 30.7 0.5 100.0
Table 2–5
Regional Comparison of Systematic Approach to Evaluating Process Effectiveness (three statements combined)
Region of work:
Afric
a
Asia
Pac
ific
Euro
pe-
Cent
ral A
sia
Latin
Am
eric
a an
d Ca
ribbe
an
Mid
dle
East
Unite
d St
ates
and
Ca
nada
Wes
tern
Eu
rope
Unan
swer
ed/
Othe
r
Tota
l
A3: Your internal audit activity brings a systematic approach to evaluate the effectiveness of risk management.
Agree Col. % 43.1 50.9 44.3 44.3 49.2 51.1 54.8 57.1 50.4
Strongly Agree Col. % 34.3 16.3 32.9 37.7 39.0 28.5 30.5 7.1 28.6
Total 77.4 67.2 77.2 82.0 88.2 79.6 85.3 64.2 79.0
Table 2–4Regional Comparison of Systematic Approach to Evaluating Process Effectiveness (continued)
Chapter 2: Perceived Contributions of Internal Auditing and Organizational Characteristics
11A Component of the CBOK Study

Region of work:
Afric
a
Asia
Pac
ific
Euro
pe-
Cent
ral A
sia
Latin
Am
eric
a an
d Ca
ribbe
an
Mid
dle
East
Unite
d St
ates
and
Ca
nada
Wes
tern
Eu
rope
Unan
swer
ed/
Othe
r
Tota
l
A4: Your internal audit activity brings a systematic approach to evaluate the effectiveness of internal controls.
Agree Col. % 42.4 53.3 51.5 42.9 45.8 40.6 49.6 50.0 47.3
Strongly Agree Col. % 47.7 29.8 36.5 52.2 50.8 52.5 45.0 28.6 43.9
Total 90.1 83.1 88.0 95.1 96.6 93.1 94.6 78.6 91.2
A5: Your internal audit activity brings a systematic approach to evaluate the effectiveness of governance processes.
Agree Col. % 46.7 46.3 48.9 47.7 49.2 48.2 49.5 50.0 48.3
Strongly Agree Col. % 23.0 15.0 21.8 27.2 28.8 17.5 18.2 7.1 19.0
Total 69.7 61.3 70.7 74.9 78.0 65.7 67.7 57.1 67.3
Average levels of
agreementCol. % 79.1 70.5 78.6 84.0 87.6 79.5 82.5 66.6 79.2
Table 2–6Regional Comparison of Effective Functioning of the Internal Audit Activity
Region of work:
Afric
a
Asia
Pac
ific
Euro
pe-
Cent
ral A
sia
Latin
Am
eric
a an
d Ca
ribbe
an
Mid
dle
East
Unite
d St
ates
an
d Ca
nada
Wes
tern
Eur
ope
Unan
swer
ed/
Othe
r
Tota
l
A1: Your internal audit activity is an independent objective assurance and consulting activity.
Strongly Disagree Col. % 2.9 2.3 1.5 1.2 1.7 2.0 0.7 0.0 1.6
Disagree Col. % 2.2 2.3 2.1 1.6 1.7 1.7 1.6 0.0 1.8
Neutral Col. % 5.8 7.2 5.7 1.6 3.4 1.8 1.9 7.1 3.5
Agree Col. % 29.2 49.9 42.3 24.5 36.2 28.9 30.8 42.9 34.6
Strongly Agree Col. % 59.9 38.2 48.5 71.0 56.9 65.6 65.0 50.0 58.5
Table 2–5Regional Comparison of Systematic Approach to Evaluating
Process Effectiveness (three statements combined) (continued)
Measuring Internal Auditing’s Value
12 A Component of the CBOK Study

Region of work:
Afric
a
Asia
Pac
ific
Euro
pe-
Cent
ral A
sia
Latin
Am
eric
a an
d Ca
ribbe
an
Mid
dle
East
Unite
d St
ates
an
d Ca
nada
Wes
tern
Eur
ope
Unan
swer
ed/
Othe
r
Tota
l
Total Count 137 513 336 245 58 710 889 14 2,902
Row % 4.7 17.7 11.6 8.4 2.0 24.5 30.6 0.5 100.0
A6: Your internal audit activity proactively examines important financial matters, risks, and internal controls.
Strongly Disagree Col. % 2.2 1.4 3.0 0.8 0.0 0.6 0.8 0.0 1.1
Disagree Col. % 1.5 2.5 6.3 1.6 1.8 3.3 5.5 0.0 3.9
Neutral Col. % 9.6 12.5 21.3 8.2 7.0 10.5 15.4 21.4 13.3
Agree Col. % 56.6 60.9 46.8 53.5 52.6 51.9 50.1 42.9 52.7
Strongly Agree Col. % 30.1 22.7 22.5 35.9 38.6 33.8 28.2 35.7 28.9
Total Count 136 511 333 245 57 707 883 14 2,886
Row % 4.7 17.7 11.5 8.5 2.0 24.5 30.6 0.5 100.0
A7: Your internal audit activity is an integral part of the governance process by providing reliable information to management.
Strongly Disagree Col. % 2.2 1.9 1.8 1.6 0.0 1.7 1.0 0.0 1.5
Disagree Col. % 2.2 3.3 5.1 2.9 5.2 2.8 6.9 0.0 4.4
Neutral Col. % 13.2 18.7 11.7 11.8 5.2 14.1 15.6 28.6 14.7
Agree Col. % 47.8 52.0 47.3 40.8 39.7 48.1 47.5 42.9 47.7
Strongly Agree Col. % 34.6 24.0 34.1 42.9 50.0 33.3 29.1 28.6 31.6
Total Count 136 513 334 245 58 709 887 14 2,896
Row % 4.7 17.7 11.5 8.5 2.0 24.5 30.6 0.5 100.0
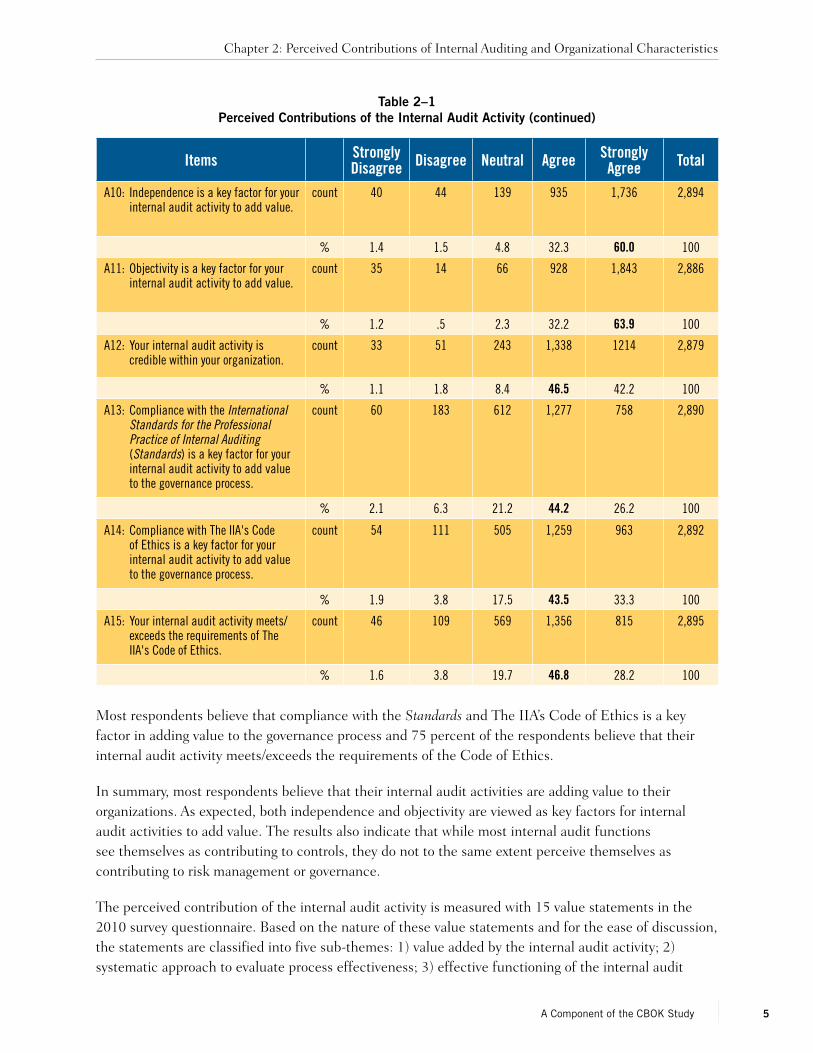
Adding Value to the Governance ProcessMore than 84 percent of the respondents from the United States and Canada “agree” or “strongly agree” that their internal audit activity adds value to the governance process through direct access to the audit committee (or equivalent), followed by Africa (77.1 percent) and the Middle East (76.3 percent). In contrast, only 54 percent of the respondents from Asia Pacific “agree” or “strongly agree” that their internal audit activity adds value to the governance process through direct access to the audit committee or equivalent (Table 2–7).
Table 2–6Regional Comparison of Effective Functioning of the Internal Audit Activity (continued)
Chapter 2: Perceived Contributions of Internal Auditing and Organizational Characteristics
13A Component of the CBOK Study

This result is not consistent with the reported appropriate access of the internal audit activity to the audit committee by region. As shown in Table 2–8, Western Europe ranked second for the appropriate access to the audit committee (20.3 percent) and is very close to the United States and Canada (20.5 percent). In contrast, only 61.1 percent of the respondents from Western Europe indicated that their internal audit activity adds value to the governance process through direct access to the audit committee (or equivalent), which is significantly lower than that of the United States and Canada (84.6 percent). This might suggest that the audit committee does not have the same role in Western Europe that it does in the United States and Canada.
In Table 2– 7, the percentage of respondents that “agree” or “strongly agree” that compliance with the Standards is a key factor for their internal audit activity to add value to the governance process was highest in Africa (87.4 percent), Latin America (85.3 percent), and the Middle East (81.4 percent). Similarly, respondents from these regions that “agree” or “strongly agree” that compliance with The IIA’s Code of Ethics is a key factor for their internal audit activity to add value to the governance process was higher than any other region (87.6 percent, 86.5 percent, and 83 percent, respectively). Surprisingly, the United States and Canada has the lowest level of respondents that “agree” or “strongly agree” (62.8 percent) that compliance with the Standards is a key factor for their internal audit activity to add value to the governance process. Western Europe ranked last for the percentage of respondents that “agree” or “strongly agree” (70.8 percent) that compliance with The IIA’s Code of Ethics is a key factor in adding value to the governance process. Considering the efforts that The IIA has made in promoting the Standards and the Code of Ethics in these two regions, it may be worthwhile to explore the underlying reasons for these results. It might be, for example, that these are regarded as “foundational” in the two regions and that internal audit activities have higher expectations than stated in the Standards and Code of Ethics. This would cause respondents to downgrade their importance.
Organizational Status of an Effective Internal Audit ActivityAs indicated in Table 2–9, more than 80 percent of the respondents from most regions “agree” or “strongly agree” with the statements on their internal audit activity’s sufficiency of status and credibility within the organization. The majority of the respondents in the Middle East (91.5 percent), Latin America (88.2 percent), and Western Europe (82 percent) “agree” or “strongly agree” that their internal audit activity has sufficient status in the organization to be effective. The same regions also ranked among the top three for the response that their internal audit activity is credible within their organization.
In general, the respondents believe that they have sufficient status and are credible in the organization. Both conditions are beneficial to the effectiveness of their internal audit activities. Asia Pacific has the lowest levels of agreement for both statements. This implies that effort may be needed to improve the status of the internal audit profession in this region.
Respondents from the United States and Canada have the highest level of agreement (85.6 percent) that their internal audit activity meets/exceeds the requirements of The IIA’s Code of Ethics, followed by the Middle East (84.2 percent) and Europe and Central Asia (78.2 percent). Again, Asia Pacific has the lowest level of agreement (63.7 percent).
Measuring Internal Auditing’s Value
14 A Component of the CBOK Study
Table 2–7Regional Comparison of Ways to Add Value to the Governance Process by the Internal Audit Activity
Region of work:
Afric
a
Asia
Pac
ific
Euro
pe-C
entr
al
Asia
Latin
Am
eric
a an
d Ca
ribbe
an
Mid
dle
East
Unite
d St
ates
and
Ca
nada
Wes
tern
Eur
ope
Unan
swer
ed/
Othe
r
Tota
l
A8: One way your internal audit activity adds value to the governance process is through direct access to the audit committee (or equivalent).
Strongly Disagree Col. % 5.9 3.9 7.2 4.5 0.0 2.0 7.0 0.0 4.8
Disagree Col. % 4.4 10.0 10.9 5.3 3.4 3.1 9.5 0.0 7.4
Neutral Col. % 12.6 32.1 21.8 14.8 20.3 10.3 22.4 28.6 19.9
Agree Col. % 45.2 35.2 31.8 32.0 42.4 44.6 36.9 50.0 38.1
Strongly Agree Col. % 31.9 18.8 28.3 43.4 33.9 40.0 24.2 21.4 29.8
Total Count 135 511 321 244 59 707 867 14 2,858
Row % 4.7 17.9 11.2 8.5 2.1 24.7 30.3 0.5 100.0
A13: Compliance with the International Standards for the Professional Practice of Internal Auditing (Standards) is a key factor for your internal audit activity to add value to the governance process.
Strongly Disagree Col. % 1.5 2.0 1.5 1.6 1.7 2.8 1.9 7.7 2.1
Disagree Col. % 0.7 4.5 3.0 3.3 5.1 10.6 7.1 0.0 6.3
Neutral Col. % 10.4 24.9 20.1 9.8 11.9 23.8 22.5 38.5 21.2
Agree Col. % 42.2 51.3 46.4 40.2 40.7 38.5 45.8 23.1 44.2
Strongly Agree Col. % 45.2 17.4 29.0 45.1 40.7 24.3 22.7 30.8 26.2
Total Count 135 511 334 246 59 709 883 13 2,890
Row % 4.7 17.7 11.6 8.5 2.0 24.5 30.6 0.4 100.0
A14: Compliance with The IIA’s Code of Ethics is a key factor for your internal audit activity to add value to the governance process.
Strongly Disagree Col. % 2.2 2.1 1.5 1.2 1.7 2.1 1.7 7.1 1.9
Disagree Col. % 2.9 3.5 2.1 2.9 1.7 3.2 5.7 7.1 3.8
Chapter 2: Perceived Contributions of Internal Auditing and Organizational Characteristics
15A Component of the CBOK Study

Region of work:
Afric
a
Asia
Pac
ific
Euro
pe-C
entr
al
Asia
Latin
Am
eric
a an
d Ca
ribbe
an
Mid
dle
East
Unite
d St
ates
and
Ca
nada
Wes
tern
Eur
ope
Unan
swer
ed/
Othe
r
Tota
l
Neutral Col. % 7.3 20.3 15.6 9.4 13.6 16.0 21.8 14.3 17.5
Agree Col. % 39.4 53.1 45.9 35.9 32.2 40.7 42.9 42.9 43.5
Strongly Agree Col. % 48.2 20.9 34.8 50.6 50.8 38.0 27.9 28.6 33.3
Total Count 137 512 333 245 59 708 884 14 2,892
Row % 4.7 17.7 11.5 8.5 2.0 24.5 30.6 0.5 100.0
Table 2–8
Appropriate Access to the Audit Committee by the Internal Audit Activity
Region of work:
Afric
a
Asia
Pac
ific
Euro
pe-C
entr
al
Asia
Latin
Am
eric
a an
d Ca
ribbe
an
Mid
dle
East
Unite
d St
ates
an
d Ca
nada
Wes
tern
Eur
ope
Unan
swer
ed/
Othe
r
Tota
l
Do you believe that you have appropriate access to the audit committee?
Not Answered Col. % 79.6 83.5 84.5 85.9 86.7 78.3 76.6 76.1 80.8
Yes Col. % 18.1 14.9 12.2 12.2 11.7 20.5 20.3 23.9 17.2
No Col. % 2.3 1.6 3.3 1.9 1.7 1.1 3.1 0.0 2.1
Total Count 598 2,099 1,074 1,595 412 3,231 2,798 46 11,853
Row % 5.0 17.7 9.1 13.5 3.5 27.3 23.6 0.4 100.0
Table 2–7Regional Comparison of Ways to Add Value to the
Governance Process by the Internal Audit Activity (continued)
Measuring Internal Auditing’s Value
16 A Component of the CBOK Study

Table 2–9Regional Comparison of Organizational Status of the Internal Audit Activity
Region of work:
Afric
a
Asia
Pac
ific
Euro
pe-
Cent
ral A
sia
Latin
Am
eric
a
and
Carib
bean
Mid
dle
East
Unite
d St
ates
an
d Ca
nada
Wes
tern
Eur
ope
Unan
swer
ed/
Othe
r
Tota
l
A9: Your internal audit activity has sufficient status in the organization to be effective.
Strongly Disagree Col. % 2.9 2.7 3.0 1.2 0.0 2.8 2.0 0.0 2.4
Disagree Col. % 5.1 7.2 8.7 3.7 1.7 4.9 5.3 0.0 5.7
Neutral Col. % 15.3 17.2 11.0 7.0 6.8 11.6 10.6 14.3 11.9
Agree Col. % 39.4 48.1 43.0 35.7 52.5 43.2 43.6 64.3 43.7
Strongly Agree Col. % 37.2 24.8 34.3 52.5 39.0 37.5 38.4 21.4 36.4
Total Count 137 513 335 244 59 709 887 14 2,898
Row % 4.7 17.7 11.6 8.4 2.0 24.5 30.6 0.5 100.0
A12: Your internal audit activity is credible within your organization.
Strongly Disagree Col. % 1.5 2.0 1.5 0.4 0.0 1.6 0.5 0.0 1.1
Disagree Col. % 2.2 2.9 2.4 0.4 1.7 1.7 1.3 0.0 1.8
Neutral Col. % 9.5 16.3 11.5 2.4 1.7 7.1 5.6 21.4 8.4
Agree Col. % 51.1 56.1 47.7 31.8 48.3 42.6 46.9 42.9 46.5
Strongly Agree Col. % 35.8 22.7 36.9 64.9 48.3 47.1 45.8 35.7 42.2
Total Count 137 510 331 245 58 705 879 14 2,879
Row % 4.8 17.7 11.5 8.5 2.0 24.5 30.5 0.5 100.0
A15: Your internal audit activity meets/exceeds the requirements of The IIA’s Code of Ethics.
Strongly Disagree Col. % 1.5 2.2 2.7 0.8 0.0 1.4 1.4 0.0 1.6
Disagree Col. % 5.8 4.7 3.6 4.1 0.0 2.8 3.8 7.1 3.8
Neutral Col. % 21.2 29.4 15.5 18.7 15.8 10.1 23.4 28.6 19.7
Agree Col. % 43.8 49.0 57.0 47.6 54.4 42.8 44.9 35.7 46.8
Chapter 2: Perceived Contributions of Internal Auditing and Organizational Characteristics
17A Component of the CBOK Study

Region of work:
Afric
a
Asia
Pac
ific
Euro
pe-
Cent
ral A
sia
Latin
Am
eric
a
and
Carib
bean
Mid
dle
East
Unite
d St
ates
an
d Ca
nada
Wes
tern
Eur
ope
Unan
swer
ed/
Othe
r
Tota
l
Strongly Agree Col. % 27.7 14.7 21.2 28.9 29.8 42.8 26.5 28.6 28.2
Total Count 137 510 335 246 57 710 886 14 2,895
Row % 4.7 17.6 11.6 8.5 2.0 24.5 30.6 0.5 100.0
Perceived Contributions and Industry GroupsOrganizations specializing or operating in different types of industry may face different kinds of technological, regulatory, and environmental challenges and opportunities. These differences, in turn, are likely to affect the way an internal audit activity functions and its perceived contribution to the organization. This section presents an analysis of the relationship between the perceived contribution and the organization’s industry type based on The IIA’s classification of eight industry groups. The results are presented in Tables 2–10 through 2-14.
Internal Auditing as a Value-added Activity
Table 2–10 indicates a high level of agreement by respondents from different industries that their internal audit activity adds value and that independence and objectivity are key factors for the internal audit activity to add value. Across all industries, statement A11 (objectivity) has the highest level of agreement.
Table 2–9Regional Comparison of Organizational Status of the Internal Audit Activity (continued)
Measuring Internal Auditing’s Value
18 A Component of the CBOK Study

Table 2–10Industry Comparison of Added Value by the Internal Audit Activity
Industry Type:
Fina
ncia
l
Man
ufac
turin
g &
Cons
truc
tion
Publ
ic S
ecto
r/Go
vern
men
t
Raw
Mat
eria
l &
Agric
ultu
re
Serv
ice
Tran
spor
tatio
n,
Com
mun
icat
ion,
El
ectr
ic, G
as,
Sani
tary
Ser
vice
s
Who
lesa
le &
Ret
ail
Trad
e
Othe
r
Tota
l
A2: Your internal audit activity adds value.
Strongly Disagree Col. % 1.0 0.4 2.6 0.0 1.6 1.7 0.0 0.5 1.1
Disagree Col. % 0.8 1.5 1.1 1.8 0.5 0.6 1.4 1.9 1.0
Neutral Col. % 5.6 7.0 3.8 4.4 4.9 5.2 5.0 7.7 5.6
Agree Col. % 45.7 51.7 51.9 41.2 45.6 47.8 49.6 51.4 48.0
Strongly Agree Col. % 46.9 39.5 40.6 52.6 47.4 44.8 43.9 38.5 44.2
Total Count 874 544 266 114 384 362 139 208 2,891
Row % 30.2 18.8 9.2 3.9 13.3 12.5 4.8 7.2 100.0
A10: Independence is a key factor for your internal audit activity to add value.
Strongly Disagree Col. % 1.4 1.3 2.3 0.0 1.8 1.9 0.0 0.5 1.4
Disagree Col. % 0.7 2.0 1.5 0.4 1.7 2.1 1.2 0.0 1.5
Neutral Col. % 1.3 2.0 1.9 0.0 1.3 0.8 1.4 3.4 1.5
Agree Col. % 26.5 39.3 32.0 30.7 31.9 34.6 34.0 35.3 32.3
Strongly Agree Col. % 67.7 50.5 59.4 64.0 60.8 57.7 59.6 54.1 60.0
Total Count 872 545 266 114 385 364 141 207 2,894
Row % 30.1 18.8 9.2 3.9 13.3 12.6 4.9 7.2 100.0
A11: Objectivity is a key factor for your internal audit activity to add value.
Strongly Disagree Col. % 1.1 0.7 2.3 0.0 1.8 1.9 0.0 0.5 1.2
Disagree Col. % 0.3 1.1 0.4 0.0 0.3 0.6 0.0 0.5 0.5
Neutral Col. % 1.4 3.3 3.4 0.9 1.8 1.7 1.4 5.3 2.3
Agree Col. % 27.3 39.4 29.9 25.7 30.4 34.2 37.1 36.4 32.2
Strongly Agree Col. % 69.8 55.4 64.0 73.5 65.7 61.7 61.4 57.4 63.9
Total Count 872 540 264 113 385 363 140 209 2,886
Row % 30.2 18.7 9.1 3.9 13.3 12.6 4.9 7.2 100.0
Chapter 2: Perceived Contributions of Internal Auditing and Organizational Characteristics
19A Component of the CBOK Study

Systematic Approach to Evaluating Process Effectiveness
Table 2–11 summarizes the respondents’ levels of agreement with the three statements regarding their internal audit activity’s contributions to the systematic evaluation of the effectiveness of risk management, internal controls, and governance processes. The levels of agreement (strongly agree and agree) are highest for the statement on the evaluation of internal controls (A4) across all groups, followed by risk management (A3) and governance processes (A5). Similarly, there are higher percentages of “neutral” responses for the statement relating to governance processes.
More specifically, for statement A4, the financial industry (94.4 percent) has the highest level of agreement, followed by the service industry (92.2 percent) and the raw material and agriculture industry (92.1 percent). Probably due to its nature of business and tight regulations, the financial industry leads the level of agreement for statement A3 (86.1 percent). Raw material and agriculture and service industries ranked second and third, with 83.2 percent and 78.3 percent, respectively. The levels of agreement for statement A5 are, on average, lower than those for the previous two statements. Most of the industry groups have a level of agreement below or close to 70 percent, except raw material and agriculture (78.6 percent).
Effective Functioning of the Internal Audit Activity
As indicated in Table 2–12, most of the respondents from all industry groups “strongly agree” or “agree” that their internal audit activity is an independent objective assurance and consulting activity (A1). The groups with the highest levels of agreement are financial (94.4 percent), service (94.3 percent), and raw material and agriculture (93.8 percent).
With respect to proactively examining important financial matters, risks, and internal controls (A6), the group with the highest level of agreement is service (85.1 percent), followed by raw material and agriculture (83.9 percent) and manufacturing and construction (82.1 percent). Financial has the top level of agreement (82.1 percent) that the internal audit activity is an integral part of the governance process by providing reliable information to management (A7), followed by service (81.3 percent) and transportation, communication, electric, gas, sanitary services (80.5 percent).
Measuring Internal Auditing’s Value Audit Activity
20 A Component of the CBOK Study

Table 2–11Industry Comparison of Systematic Approach to Evaluating Process Effectiveness
Industry Type:
Fina
ncia
l
Man
ufac
turin
g &
Co
nstr
uctio
n
Publ
ic S
ecto
r/
Gove
rnm
ent
Raw
Mat
eria
l &
Agric
ultu
re
Serv
ice
Tran
spor
tatio
n,
Com
mun
icat
ion,
El
ectr
ic, G
as,
Sani
tary
Ser
vice
s
Who
lesa
le &
Re
tail
Trad
e
Othe
r
Tota
l
A3: Your internal audit activity brings a systematic approach to evaluate the effectiveness of risk management.
Strongly Disagree Col. % 0.9 1.5 2.2 1.8 1.8 2.2 0.0 1.9 1.5
Disagree Col. % 3.0 5.5 6.0 3.5 5.0 4.4 6.5 4.4 4.5
Neutral Col. % 10.0 20.9 14.2 11.5 14.9 16.3 17.4 19.4 15.0
Agree Col. % 52.6 51.2 50.2 52.2 44.9 48.3 50.7 52.4 50.4
Strongly Agree Col. % 33.5 20.9 27.3 31.0 33.4 28.7 25.4 21.8 28.6
Total Count 871 541 267 113 383 362 138 206 2,881
Row % 30.2 18.8 9.3 3.9 13.3 12.6 4.8 7.2 100.0
A4: Your internal audit activity brings a systematic approach to evaluate the effectiveness of internal controls.
Strongly Disagree Col. % 1.3 0.9 1.9 0.0 1.3 1.7 0.7 0.5 1.2
Disagree Col. % 0.7 3.3 1.9 1.8 1.6 2.2 1.4 1.4 1.7
Neutral Col. % 3.7 7.7 7.5 6.2 4.9 7.5 8.7 5.3 5.9
Agree Col. % 45.1 50.9 52.8 37.2 44.7 44.0 50.0 54.1 47.3
Strongly Agree Col. % 49.3 37.2 36.0 54.9 47.5 44.6 39.1 38.6 43.9
Total Count 871 546 267 113 387 361 138 207 2,890
Row % 30.1 18.9 9.2 3.9 13.4 12.5 4.8 7.2 100.0
A5: Your internal audit activity brings a systematic approach to evaluate the effectiveness of governance processes.
Strongly Disagree Col. % 1.1 1.3 3.0 0.9 1.3 1.7 1.4 1.0 1.4
Disagree Col. % 6.8 8.1 6.0 4.5 8.6 7.5 8.7 8.7 7.4
Neutral Col. % 22.1 27.2 20.6 16.1 26.3 21.9 26.8 27.9 23.9
Agree Col. % 49.3 47.6 49.1 53.6 42.2 49.9 47.8 50.5 48.3
Strongly Agree Col. % 20.6 15.8 21.3 25.0 21.6 19.1 15.2 12.0 19.0
Total Count 872 544 267 112 384 361 138 208 2,886
Row % 30.2 18.8 9.3 3.9 13.3 12.5 4.8 7.2 100.0
Chapter 2: Perceived Contributions of Internal Auditing and Organizational Characteristics
21A Component of the CBOK Study

Table 2–12Industry Comparison of Effective Functioning of the Internal Audit Activity
Industry Type:
Fina
ncia
l
Man
ufac
turin
g &
Cons
truc
tion
Publ
ic S
ecto
r/Go
vern
men
t
Raw
Mat
eria
l &
Agric
ultu
re
Serv
ice
Tran
spor
tatio
n,
Com
mun
icat
ion,
El
ectr
ic, G
as,
Sani
tary
Ser
vice
s
Who
lesa
le &
Re
tail
Trad
e
Othe
r
Tota
l
A1: Your internal audit activity is an independent objective assurance and consulting activity.
Strongly Disagree Col. % 1.4 1.1 3.0 0.9 2.3 1.9 1.4 0.0 1.6
Disagree Col. % 1.7 2.0 1.5 0.9 0.5 2.7 1.4 3.8 1.8
Neutral Col. % 2.5 4.2 4.1 4.4 2.8 3.8 3.5 4.8 3.5
Agree Col. % 28.1 43.5 36.0 37.2 32.3 32.4 43.3 37.5 34.6
Strongly Agree Col. % 66.3 49.2 55.4 56.6 62.0 59.1 50.4 53.8 58.5
Total Count 875 547 267 113 387 364 141 208 2,902
Row % 30.2 18.8 9.2 3.9 13.3 12.5 4.9 7.2 100.0
A6: Your internal audit activity proactively examines important financial matters, risks, and internal controls.
Strongly Disagree Col. % 1.1 0.7 1.9 0.0 1.3 1.4 0.7 1.4 1.1
Disagree Col. % 3.8 3.5 3.8 4.5 4.2 3.8 2.9 5.8 3.9
Neutral Col. % 13.5 13.7 14.0 11.6 9.4 14.3 15.8 15.9 13.3
Agree Col. % 50.6 55.0 54.7 49.1 51.7 53.8 54.7 52.9 52.7
Strongly Agree Col. % 30.9 27.1 25.7 34.8 33.4 26.6 25.9 24.0 28.9
Total Count 873 542 265 112 383 364 139 208 2,886
Row % 30.2 18.8 9.2 3.9 13.3 12.6 4.8 7.2 100.0
A7: Your internal audit activity is an integral part of the governance process by providing reliable information to management.
Strongly Disagree Col. % 1.6 0.2 2.3 0.9 2.8 1.7 0.0 2.4 1.5
Disagree Col. % 4.4 4.4 4.5 5.3 3.4 5.0 5.0 4.8 4.4
Neutral Col. % 11.9 20.0 16.9 15.9 12.4 12.9 17.7 14.8 14.7
Agree Col. % 45.9 49.0 45.5 40.7 50.6 50.7 46.8 48.3 47.7
Strongly Agree Col. % 36.2 26.4 30.8 37.2 30.7 29.8 30.5 29.7 31.6
Total Count 872 545 266 113 387 363 141 209 2,896
Row % 30.1 18.8 9.2 3.9 13.4 12.5 4.9 7.2 100.0
Measuring Internal Auditing’s Value
22 A Component of the CBOK Study

Adding Value to the Governance Process
Table 2–13 presents the industry comparison of the ways of adding value to the governance process. raw material and agriculture has the highest level of agreement (77.9 percent) on statement A8, followed by financial (73.2 percent) and wholesale and retail trade (69.5 percent). On the other hand, public sector/government (55.3 percent) has the lowest percentage, possibly because the audit committee (or equivalent) is not as common in this group.
As for statement A13, the groups with the highest levels of agreement are public sector/government (74.7 percent), raw material and agriculture (73.7 percent), and financial (72.3 percent). The public sector/government respondents also show the highest level of agreement (81.9 percent) on statement A14.
Organizational Status of an Effective Internal Audit Activity
As previously indicated, more than 80 percent of the respondents “agree” or “strongly agree” with the statements regarding their internal audit activity’s sufficiency of status (A9) and credibility (A12). However, for statement A9, only two groups have a level of agreement above 80 percent — financial (85.2 percent) and service (81.6 percent). This implies that the internal audit activities from other industry groups may not have the organizational status that they would like to have. Nevertheless, most of the respondents from all the industry groups “agree” or “strongly agree” that their internal audit activity adds value. Although some respondents feel that their activity does not have sufficient status, this does not necessarily affect its value to the organization.
The respondents’ levels of agreement on statement A12, in general, are higher than those for statement A9. The level of agreement for all respondents is more than 80 percent and there are three groups with a level of agreement more than 90 percent — service (92.4 percent), financial (91.6 percent), and wholesale and retail trade (90.1 percent). This implies that although some of the respondents feel that their internal audit activity does not have sufficient status, it is still able to maintain its credibility within the organization.
For statement A15, “Your internal audit activity meets/exceeds the requirements of The IIA’s Code of Ethics,” the levels of agreement for all groups are lower than 80 percent. There is room for improvement in meeting the requirements of the Code of Ethics.
Chapter 2: Perceived Contributions of Internal Auditing and Organizational Characteristics
23A Component of the CBOK Study

Table 2–13Industry Comparison of Ways to Add Value to the Governance Process by the Internal Audit Activity
Industry Type:
Fina
ncia
l
Man
ufac
turin
g &
Cons
truc
tion
Publ
ic S
ecto
r/Go
vern
men
t
Raw
Mat
eria
l &
Agric
ultu
re
Serv
ice
Tran
spor
tatio
n,
Com
mun
icat
ion,
El
ectr
ic, G
as,
Sani
tary
Ser
vice
s
Who
lesa
le &
Re
tail
Trad
e
Othe
r
Tota
l
A8: One way your internal audit activity adds value to the governance process is through direct access to the audit committee (or equivalent).
Strongly Disagree Col. % 3.8 4.4 6.6 3.5 5.5 5.9 2.1 6.8 4.8
Disagree Col. % 6.0 9.3 10.0 6.2 8.6 6.7 3.5 6.8 7.4
Neutral Col. % 16.9 23.1 28.2 12.4 17.8 21.2 24.8 16.6 19.9
Agree Col. % 38.0 38.1 31.7 39.8 36.1 38.8 44.7 42.9 38.1
Strongly Agree Col. % 35.2 25.0 23.6 38.1 31.9 27.4 24.8 26.8 29.8
Total Count 860 540 259 113 382 358 141 205 2,858
Row % 30.1 18.9 9.1 4.0 13.4 12.5 4.9 7.2 100.0
A13: Compliance with the International Standards for the Professional Practice of Internal Auditing (Standards) is a key factor for your internal audit activity to add value to the governance process.
Strongly Disagree Col. % 1.8 2.6 2.6 0.9 2.3 1.9 2.9 1.0 2.1
Disagree Col. % 5.6 7.9 5.3 1.8 5.2 7.4 7.1 8.7 6.3
Neutral Col. % 20.3 25.8 17.4 23.7 20.2 18.7 22.1 21.7 21.2
Agree Col. % 42.9 43.5 43.4 42.1 45.3 46.6 47.1 45.4 44.2
Strongly Agree Col. % 29.4 20.3 31.3 31.6 26.9 25.3 20.7 23.2 26.2
Total Count 872 543 265 114 386 363 140 207 2,890
Row % 30.2 18.8 9.2 3.9 13.4 12.6 4.8 7.2 100.0
A14: Compliance with The IIA’s Code of Ethics is a key factor for your internal audit activity to add value to the governance process.
Strongly Disagree Col. % 1.4 2.4 2.3 0.0 2.3 2.2 2.1 1.4 1.9
Disagree Col. % 3.9 5.1 3.0 0.9 2.6 5.0 2.1 4.3 3.8
Neutral Col. % 18.6 19.6 12.8 19.5 15.1 15.2 21.3 17.7 17.5
Agree Col. % 40.6 44.8 43.6 45.1 44.2 43.6 47.5 47.4 43.5
Strongly Agree Col. % 35.5 28.1 38.3 34.5 35.8 34.0 27.0 29.2 33.3
Total Count 871 545 266 113 385 362 141 209 2,892
Row % 30.1 18.8 9.2 3.9 13.3 12.5 4.9 7.2 100.0
Measuring Internal Auditing’s Value
24 A Component of the CBOK Study
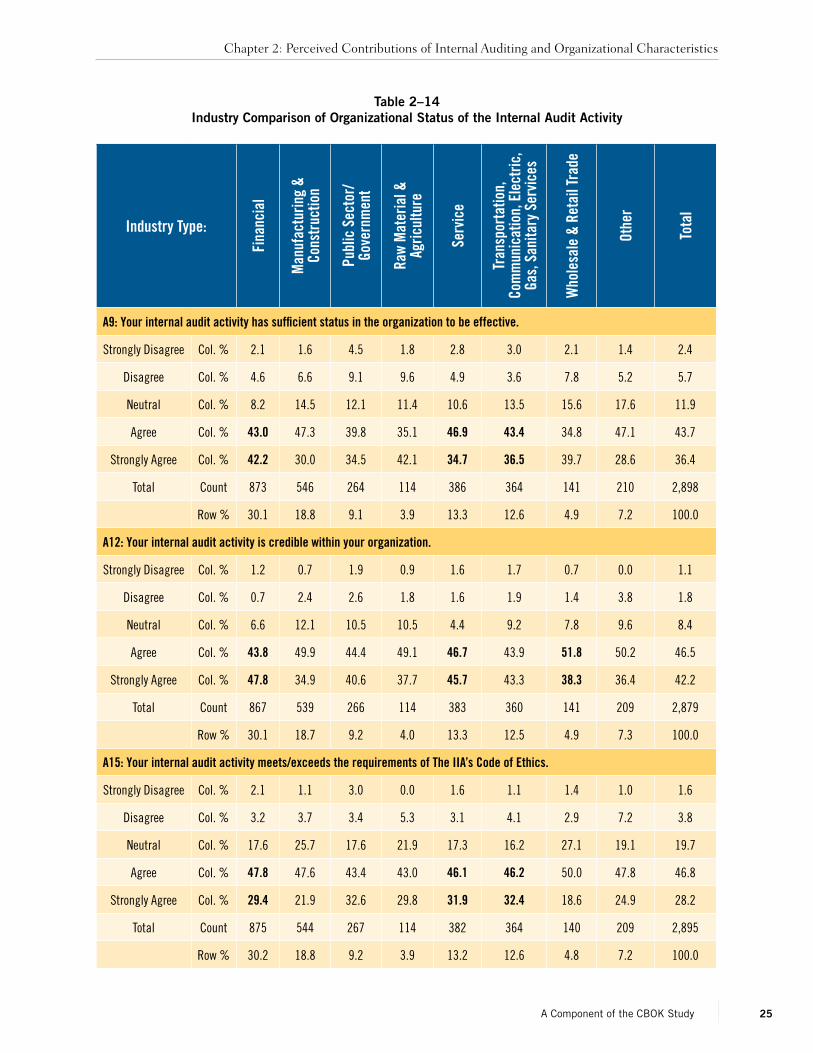
Table 2–14Industry Comparison of Organizational Status of the Internal Audit Activity
Industry Type:
Fina
ncia
l
Man
ufac
turin
g &
Cons
truc
tion
Publ
ic S
ecto
r/
Gove
rnm
ent
Raw
Mat
eria
l &
Agric
ultu
re
Serv
ice
Tran
spor
tatio
n,
Com
mun
icat
ion,
Ele
ctric
, Ga
s, S
anita
ry S
ervi
ces
Who
lesa
le &
Ret
ail T
rade
Othe
r
Tota
l
A9: Your internal audit activity has sufficient status in the organization to be effective.
Strongly Disagree Col. % 2.1 1.6 4.5 1.8 2.8 3.0 2.1 1.4 2.4
Disagree Col. % 4.6 6.6 9.1 9.6 4.9 3.6 7.8 5.2 5.7
Neutral Col. % 8.2 14.5 12.1 11.4 10.6 13.5 15.6 17.6 11.9
Agree Col. % 43.0 47.3 39.8 35.1 46.9 43.4 34.8 47.1 43.7
Strongly Agree Col. % 42.2 30.0 34.5 42.1 34.7 36.5 39.7 28.6 36.4
Total Count 873 546 264 114 386 364 141 210 2,898
Row % 30.1 18.8 9.1 3.9 13.3 12.6 4.9 7.2 100.0
A12: Your internal audit activity is credible within your organization.
Strongly Disagree Col. % 1.2 0.7 1.9 0.9 1.6 1.7 0.7 0.0 1.1
Disagree Col. % 0.7 2.4 2.6 1.8 1.6 1.9 1.4 3.8 1.8
Neutral Col. % 6.6 12.1 10.5 10.5 4.4 9.2 7.8 9.6 8.4
Agree Col. % 43.8 49.9 44.4 49.1 46.7 43.9 51.8 50.2 46.5
Strongly Agree Col. % 47.8 34.9 40.6 37.7 45.7 43.3 38.3 36.4 42.2
Total Count 867 539 266 114 383 360 141 209 2,879
Row % 30.1 18.7 9.2 4.0 13.3 12.5 4.9 7.3 100.0
A15: Your internal audit activity meets/exceeds the requirements of The IIA’s Code of Ethics.
Strongly Disagree Col. % 2.1 1.1 3.0 0.0 1.6 1.1 1.4 1.0 1.6
Disagree Col. % 3.2 3.7 3.4 5.3 3.1 4.1 2.9 7.2 3.8
Neutral Col. % 17.6 25.7 17.6 21.9 17.3 16.2 27.1 19.1 19.7
Agree Col. % 47.8 47.6 43.4 43.0 46.1 46.2 50.0 47.8 46.8
Strongly Agree Col. % 29.4 21.9 32.6 29.8 31.9 32.4 18.6 24.9 28.2
Total Count 875 544 267 114 382 364 140 209 2,895
Row % 30.2 18.8 9.2 3.9 13.2 12.6 4.8 7.2 100.0
Chapter 2: Perceived Contributions of Internal Auditing and Organizational Characteristics
25A Component of the CBOK Study

Summary and ImplicationsIn summary, most respondents believe that their internal audit activities are adding value to their organizations, with both independence and objectivity viewed as key factors. While most internal audit functions see themselves as contributing to controls, they do not to the same extent perceive themselves as contributing to risk management or governance.
To facilitate further analyses, the value statements of the internal audit activity are classified into five sub-themes. The results from regional comparisons indicate that there are significant differences across the seven regions in terms of internal audit activities’ perceived contribution to their organizations. Table 2–15 shows the regions with the top three levels of agreement with each value statement. Latin America and Caribbean is consistently ranked among the top three for almost all the value statements except A8, “One way your internal audit activity adds value to the governance process is through direct access to the audit committee (or equivalent)” and A15, “Your internal audit activity meets/exceeds the requirements of The IIA’s Code of Ethics.” The other regions with a higher number of top three rankings are the Middle East (11), Western Europe (8), and United States and Canada (6). This indicates that the internal audit activities within these four regions are perceived to be adding more value to their organizations. On the other hand, the Asia Pacific respondents’ level of agreement with these value statements is, in general, among the lowest of the regions. This implies that the internal audit activities in the Asia Pacific region may need more effort to enhance their value to organizations.
Organizations in different types of industry may face different challenges and opportunities. These differences are likely to affect the way an internal audit activity functions and its perceived contribution to the organization. Table 2–16 lists the industry groups having the top three levels of agreement with each value statement. The financial industry has the highest number (12) of top three rankings, followed by raw material and agriculture (11) and service (10).
In addition, since most industry groups are spread across different regions, the results from industry comparisons represent the averaging effect of internal audit activities from different regions. There is no industry that is consistently ranked as the lowest of the industry groups.
Measuring Internal Auditing’s Value
26 A Component of the CBOK Study

Table 2–15Regions with the Top Three Levels of Agreement with Value Statements
Value statementsTop three regions ranked by the level of agreement
1 2 3
Internal audit as a value-added activity:
A2 Latin America and Caribbean United States and Canada Western Europe
A10 Latin America and Caribbean Western Europe United States and Canada
A11 Latin America and Caribbean Western Europe United States and Canada
Systematic approach to evaluate process effectiveness:
A3 Middle East Western Europe Latin America and Caribbean
A4 Middle East Latin America and Caribbean Western Europe
A5 Middle East Latin America and Caribbean Europe-Central Asia
Effective functioning of the internal audit activity:
A1 Western Europe Latin America and Caribbean United States and Canada
A6 Middle East Latin America and Caribbean Africa
A7 Middle East Latin America and Caribbean Africa
Adding value to governance process:
A8 United States and Canada Africa Middle East
A13 Africa Latin America and Caribbean Middle East
A14 Africa Latin America and Caribbean Middle East
Organizational status for an effective internal audit activity:
A9 Middle East Latin America and Caribbean Western Europe
A12 Latin America and Caribbean Middle East Western Europe
A15 United States and Canada Middle East Europe-Central Asia
Chapter 2: Perceived Contributions of Internal Auditing and Organizational Characteristics
27A Component of the CBOK Study

Table 2–16Industries with the Top Three Levels of Agreement with Value Statements
Value statementsTop three industries ranked by the level of agreement
1 2 3
Internal audit as a value-added activity:
A2 Raw Material & Agriculture Wholesale & Retail Trade Service
A10 Raw Material & Agriculture Financial Wholesale & Retail Trade
A11 Raw Material & Agriculture Wholesale & Retail Trade Financial
Systematic approach to evaluate process effectiveness:
A3 Financial Raw Material & Agriculture Service
A4 Financial Service Raw Material & Agriculture
A5 Raw Material & Agriculture Public Sector/ Government Financial
Effective functioning of the internal audit activity:
A1 Financial Service Raw Material & Agriculture
A6 Service Raw Material & Agriculture Manufacturing & Construction
A7 Financial Service Transportation, Communication, etc.
Adding value to governance process:
A8 Raw Material & Agriculture Financial Wholesale & Retail Trade
A13 Public Sector/ Government Raw Material & Agriculture Financial
A14 Public Sector/ Government Service Raw Material & Agriculture
Organizational status for an effective internal audit activity:
A9 Financial Service Transportation, Communication, etc.
A12 Service Financial Wholesale & Retail Trade
A15 Transportation, Communication, etc. Service Financial
Measuring Internal Auditing’s Value
28 A Component of the CBOK Study

Chapter 3The Relationship between Characteristics of the Internal Audit Activity and Agreement with Value Statements
The internal audit activity characteristics identified as factors affecting the agreement with the value statement that the activity adds value include:
�� Percentage of internal audit activity co-sourced or outsourced.
�� Appropriate access to the audit committee.
�� Provision of a written report on the overall internal control for use by the audit committee or senior management.
�� Frequency of providing an internal audit report.
�� The coercion to change a rating assessment or withdraw a finding.
�� The number of audit tools or technology used on a typical audit engagement.
Internal Auditing as a Value-added Activity The analysis (see Table 3–1) indicates that access to the audit committee, the coercion to change a rating assessment or withdraw a finding, and audit tools or technology used have a significant relationship with assessments that the internal audit activity adds value and that independence and objectivity contribute to this value-adding agreement. This relationship, however, could not be found with respect to the provision of a written internal control report or the frequency of providing such a report. The results therefore imply that fostering a coercion-free, tools-rich working environment for the internal auditors may enhance their belief that the internal audit activity adds value to the organization.
The co-sourcing or outsourcing percentage of the internal audit activity, with the exception of the 51-74 percent category, is positively and significantly related to the statement that the internal audit activity adds value and that it is objectivity, rather than independence, that contributes to such value-adding perception. The higher the degree of internal audit activity performed by staff sourced from outside the auditee organizations the higher the proportion of agreement with the statement that objectivity is a contributor to the perceived value of the internal audit activity (96 percent, 96.6 percent, 89.6 percent, 97 percent, respectively, for the four categories and in that order).
29A Component of the CBOK Study

Table 3–1Factors Affecting the Agreement with the Value Statement: The Internal Audit Activity Adds Value
Adds value (A2) Independence (A10) Objectivity (A11)
DISAGREE NEUTRAL AGREE DISAGREE NEUTRAL AGREE DISAGREE NEUTRAL AGREE
count % count % count % Sig count % count % count % Sig count % count % count % Sig
Perc
enta
ge o
f co-
sour
ced/
ou
tsou
rced
<=25% 2 2.0 12 11.9 87 86.1 3 3.0 3 3.0 94 94.0 2 2.0 2 2.0 97 96.0
26-50% 2 1.7 10 8.7 103 89.6 5 4.3 4 3.4 108 92.3 1 0.9 3 2.6 113 96.6
51-74% 4 3.8 7 6.7 94 89.5 3 2.9 9 8.6 93 88.6 3 2.8 8 7.6 95 89.6
>=75% 30 1.8 60 3.6 1,588 94.6 42 2.5 74 4.4 1,567 93.1 26 1.6 25 .59 1,631 97.0
Total 38 1.9 89 4.5 1,872 93.7 Y 53 2.6 89 4.5 1,862 92.9 N 32 1.6 89 4.5 1,936 96.5 Y
Appr
opria
te a
cces
s to
au
dit c
omm
ittee Yes 33 1.8 70 3.9 1,687 94.3 44 2.5 71 4.0 1,681 93.6 29 1.6 30 1.7 1,738 96.7
No 7 3.6 17 8.6 173 87.8 10 5.1 17 8.7 168 86.2 3 1.5 8 4.1 184 94.4
Total 40 2.0 87 4.4 1,860 93.6 Y 54 2.7 88 4.4 1,849 92.9 Y 32 1.6 38 1.9 1,922 96.5 Y
Writ
ten
repo
rt on
in
tern
al c
ontro
l Yes 23 1.8 55 4.4 1,172 93.8 26 2.1 52 4.2 1,175 93.8 20 1.6 22 1.8 1,214 96.7
No 17 2.3 33 4.5 688 93.2 28 3.8 38 5.1 675 91.1 12 1.6 17 2.3 710 96.1
Total 40 2.0 88 4.4 1,860 93.6 N 54 2.7 90 4.5 1,850 92.8 N 32 1.6 39 2.0 1,924 96.4 N
Freq
uenc
y of p
rovi
ding
repo
rt
On request 2 3.3 4 6.6 55 90.2 1 1.7 4 6.7 55 91.7 2 3.3 4 6.6 55 90.2
Annually 15 2.7 23 4.1 525 93.3 16 2.8 21 3.8 528 93.5 11 1.9 10 1.8 545 96.3
Periodically 8 1.2 28 4.3 616 94.5 11 1.7 28 4.3 616 94.1 8 1.2 9 1.4 639 97.4
Total 25 2.0 55 4.3 1,196 93.7 N 28 2.2 53 4.1 1,199 93.7 N 21 1.6 23 1.8 1,239 96.6 N
Coer
cion
to c
hang
e a
ratin
g
or w
ithdr
aw a
find
ing Yes 21 3.4 38 6.1 562 90.5 29 4.7 44 7.1 546 88.2 16 2.6 26 4.2 573 93.2
No 34 1.7 104 5.2 1,864 93.1 47 2.3 79 3.9 1,879 93.7 27 1.4 33 1.7 1,943 97.0
No ratings 6 2.4 21 8.3 227 89.4 8 3.1 15 5.9 233 91.0 6 2.4 7 2.8 241 94.9
Total 61 2.1 163 5.7 2,653 92.2 Y 84 2.9 138 4.8 2,658 92.3 Y 49 1.7 66 2.3 2,757 96.0 Y
No. o
f too
ls u
sed
0 6 4.2 15 10.4 123 85.4 7 4.8 12 8.3 126 86.9 5 3.5 8 5.6 131 91.0
1-5 24 2.8 76 8.8 768 88.5 26 3.0 41 4.8 796 92.2 17 2.0 27 3.1 818 95.0
6-10 22 1.6 57 4.1 1,330 94.4 36 2.6 69 4.9 1,307 92.6 18 1.3 24 1.7 1,365 97.0
>11 9 1.9 15 3.2 446 94.9 15 3.2 17 3.6 442 93.3 9 1.9 7 1.5 457 96.6
Total 61 2.1 89 4.5 2,667 92.3 Y 84 2.9 89 4.5 2,671 92.3 Y 49 1.7 89 4.5 2,771 96.0 Y
“Y” indicates that the test result is significant at <0.05 level; “N” indicates the test result is not significant.
Measuring Internal Auditing’s Value
30 A Component of the CBOK Study

Systematic Approach to Evaluate Process EffectivenessTable 3–2 reports the analysis of relationships between the internal audit activity characteristics and agreement that the activity provides systematic approach to evaluate process effectiveness. The results indicate that all factors, with the exception of the frequency of providing the internal audit report, are positively and significantly related to the level of agreement that the internal audit activity brings a systematic approach to evaluate the effectiveness of risk management, internal controls, and governance processes.
Effective Functioning of the Internal Audit ActivityThe internal audit activity is perceived as effective if it is an independent objective assurance and consulting activity; proactively examines important financial matters, risks, and internal controls; and is an integral part of the governance process by providing reliable information to management. Table 3–3 reports the analysis of the relationship between the internal audit activity characteristics and the effective function of the activity. The results indicate that all factors, with the exception of provision of written internal control report and the frequency of providing the internal audit report, are positively and significantly related to the level of agreement that the function of the internal audit activity is effective.
Adding Value to the Governance ProcessTable 3–4 reports the factors related to the belief that direct access to the audit committee and compliance with the Standards and the Code of Ethics are key factors in adding value to the governance process. The analysis indicates that appropriate access to the audit committee, provision of written internal control report, the coercion to change a rating assessment or withdraw a finding, and the number of audit tools or technology used on a typical audit engagement are positively and significantly related to the level of agreement with such belief.
Organizational Status of an Effective Internal Audit ActivityTable 3–5 reports the analysis of factors related to the organizational status of the internal audit activity to be effective. The results indicate that percentage of co-sourced/outsourced internal audit activity, appropriate access to the audit committee, the coercion to change a rating assessment or withdraw a finding, and the number of audit tools or technology used on a typical audit engagement are positively and significantly related to the respondents’ assessments that the internal audit activity has sufficient status to be effective, is credible within the organization, and meets/exceeds the requirements of The IIA’s Code of Ethics.
Chapter 3: The Relationship between Characteristics of the Internal Audit Activity and Agreement with Value Statements
31A Component of the CBOK Study

Table 3–2Factors Affecting the Agreement with the Statement:
The Internal Audit Activity Brings a Systematic Approach
Risk management (A3) Internal controls (A4) Governance process (A5)DISAGREE NEUTRAL AGREE DISAGREE NEUTRAL AGREE DISAGREE NEUTRAL AGREE
count % count % count % Sig count % count % count % Sig count % count % count % Sig
Perc
enta
ge o
f co-
sour
ced/
ou
tsou
rced
<=25% 10 10.1 16 16.2 73 73.7 6 6.0 16 16.0 78 78.0 19 19.2 22 22.2 58 58.6
26-50% 12 10.3 13 11.2 91 78.5 3 2.6 7 6.0 106 91.4 9 7.8 31 26.7 76 65.5
51-74% 10 9.6 11 10.6 83 79.8 5 4.8 6 5.7 94 89.5 13 12.4 22 21.0 70 66.7
>=75% 82 4.9 213 12.7 1,379 82.4 36 2.1 61 3.6 1,583 94.2 125 7.4 365 21.7 1,189 70.8
Total 114 5.7 89 4.5 1,626 81.6 Y 50 2.5 89 4.5 1,861 93.0 Y 166 8.3 89 4.5 1,393 69.7 Y
Appr
opria
te a
cces
s to
au
dit c
omm
ittee Yes 84 4.7 225 12.6 1,480 82.7 41 2.3 70 3.9 1,682 93.8 124 6.9 381 21.3 1,288 71.8
No 28 14.6 28 14.6 136 70.8 9 4.6 20 10.3 166 85.1 41 21.2 53 27.5 99 51.3
Total 112 5.7 253 12.8 1,616 81.6 Y 50 2.5 90 4.5 1,848 93.0 Y 165 8.3 434 21.9 1,387 69.8 Y
Writ
ten
repo
rt on
in
tern
al c
ontro
l Yes 57 4.6 133 10.7 1,059 84.8 23 1.8 47 3.8 1,184 94.4 77 6.2 245 19.6 930 74.3
No 56 7.6 120 16.3 559 76.1 26 3.5 44 6.0 669 90.5 88 11.9 192 26.0 459 62.1
Total 113 5.7 253 12.8 1,618 81.6 Y 49 2.5 91 4.6 1,853 93.0 Y 165 8.3 437 22.0 1,389 69.8 Y
Freq
uenc
y of p
rovi
ding
repo
rt
On request 5 8.3 5 8.3 50 83.3 1 1.7 5 8.3 54 90.0 4 6.7 11 18.3 45 75.0
Annually 33 5.9 63 11.2 467 83.0 12 2.1 16 2.8 537 95.0 46 8.1 112 19.8 408 72.1
Periodically 22 3.4 68 10.4 562 86.2 12 1.8 27 4.1 616 94.1 29 4.5 127 19.5 496 76.1
Total 60 4.7 136 10.7 1,079 84.6 Y 25 2.0 48 3.8 1,207 94.3 N 79 6.2 250 19.6 949 74.3 N
Coer
cion
to c
hang
e a
ratin
g or
wi
thdr
aw a
find
ing
Yes 50 8.1 89 14.4 481 77.6 28 4.5 45 7.3 545 88.2 76 12.3 140 22.7 402 65.1
No 100 5.0 281 14.1 1,615 80.9 46 2.3 103 5.1 1,853 92.6 144 7.2 477 23.9 1,379 69.0
No ratings 22 8.7 57 22.6 173 68.7 10 3.9 20 7.9 224 88.2 33 13.0 67 26.4 154 60.6
Total 172 6.0 427 14.9 2,269 79.1 Y 84 2.9 168 5.9 2,622 91.2 Y 253 8.8 684 23.8 1,935 67.4 Y
No. o
f too
ls u
sed
0 15 10.4 38 26.4 91 63.2 11 7.6 25 17.2 109 75.2 24 16.6 38 26.2 83 57.2
1-5 77 9.0 168 19.6 612 71.4 37 4.3 82 9.5 745 86.2 111 12.9 270 31.4 479 55.7
6-10 66 4.7 190 13.5 1,152 81.8 26 1.8 54 3.8 1,330 94.3 103 7.3 321 22.8 983 69.9
>11 14 3.0 35 7.4 423 89.6 10 2.1 9 1.9 452 96.0 17 3.6 60 12.7 397 83.8
Total 172 6.0 89 4.5 2,278 79.1 Y 84 2.9 89 4.5 2,636 91.2 Y 255 8.8 89 4.5 1,942 67.3 Y
“Y” indicates that the test result is significant at <0.05 level; “N” indicates the test result is not significant.
Measuring Internal Auditing’s Value
32 A Component of the CBOK Study

Table 3–3Factors Affecting the Agreement with the Statement: Effective Functions of an Internal Audit Activity
Assurance & consulting (A1) Examining financial, risk, & controls (A6)
Providing reliable information (A7)
DISAGREE NEUTRAL AGREE DISAGREE NEUTRAL AGREE DISAGREE NEUTRAL AGREE
count % count % count % Sig count % count % count % Sig count % count % count % Sig
Perc
enta
ge o
f co-
sour
ced/
ou
tsou
rced
<=25% 3 3.0 6 6.0 91 91.0 6 6.0 23 23.0 71 71.0 11 11.0 24 24.0 65 65.0
26-50% 5 4.3 3 2.6 109 93.2 8 7.0 21 18.3 86 74.8 7 6.0 25 21.6 84 72.4
51-74% 4 3.8 4 3.8 98 92.5 5 4.8 16 15.2 84 80.0 6 5.7 14 13.2 86 81.1
>=75% 47 2.8 33 2.0 1,606 95.3 64 3.8 190 11.3 1,425 84.9 82 4.9 199 11.8 1,403 83.3
Total 59 2.9 89 4.5 1,904 94.8 Y 83 4.2 89 4.5 1,666 83.3 Y 106 5.3 89 4.5 1,638 81.7 Y
Appr
opria
te a
cces
s to
au
dit c
omm
ittee Yes 45 2.5 29 1.6 1,725 95.9 64 3.6 199 11.1 1,529 85.3 78 4.3 210 11.7 1,511 84.0
No 15 7.7 17 8.7 164 83.7 20 10.3 47 24.2 127 65.5 27 13.9 49 25.3 118 60.8
Total 60 3.0 46 2.3 1,889 94.7 Y 84 4.2 246 12.4 1,656 83.4 Y 105 5.3 259 13.0 1,629 81.7 Y
Writ
ten
repo
rt on
in
tern
al c
ontro
l Yes 36 2.9 30 2.4 1,191 94.8 42 3.4 147 11.8 1,062 84.9 56 4.5 145 11.5 1,056 84.0
No 24 3.2 17 2.3 700 94.5 42 5.7 103 13.9 595 80.4 48 6.5 119 16.1 573 77.4
Total 60 3.0 47 2.4 1,891 94.6 N 84 4.2 250 12.6 1,657 83.2 Y 104 5.2 264 13.2 1,629 81.6 Y
Freq
uenc
y of
prov
idin
g re
port
On request 3 4.9 5 8.2 53 86.9 4 6.8 5 8.5 50 84.8 2 3.3 7 11.7 51 85.0
Annually 15 2.7 15 2.7 536 94.7 19 3.4 75 13.3 472 83.4 25 4.4 73 12.9 468 82.7
Periodically 20 3.1 12 1.8 624 95.1 25 3.8 66 10.1 561 86.0 30 4.6 69 10.5 558 84.9
Total 38 3.0 32 2.5 1,213 94.5 N 48 3.8 146 11.4 1,083 84.8 N 57 4.4 149 11.6 1,077 83.9 N
Coer
cion
to c
hang
e a
ratin
g or
with
draw
a fi
ndin
g Yes 37 6.0 33 5.3 552 88.8 50 8.1 91 14.7 479 77.3 56 9.0 88 14.2 476 76.8
No 48 2.4 51 2.5 1,912 95.1 74 3.7 256 12.8 1,667 83.5 98 4.9 287 14.3 1,620 80.8
No ratings 13 5.1 16 6.3 226 88.6 22 8.6 37 14.5 196 76.9 18 7.0 47 18.4 191 74.6
Total 98 3.4 100 3.5 2,690 93.1 Y 146 5.1 384 13.4 2,342 81.6 Y 172 6.0 422 14.7 2,287 79.4 Y
No. o
f too
ls u
sed
0 11 7.5 13 8.8 123 83.7 14 9.7 26 17.9 105 72.4 9 6.2 41 28.1 96 65.8
1-5 43 5.0 41 4.7 784 90.3 50 5.8 149 17.4 660 76.8 73 8.5 175 20.3 616 71.3
6-10 31 2.2 37 2.6 1,345 95.2 66 4.7 170 12.0 1,176 83.3 74 5.2 173 12.2 1,166 82.5
>11 13 2.7 10 2.1 451 95.2 16 3.4 40 8.5 414 88.1 16 3.4 38 8.0 419 88.6
Total 98 3.4 89 4.5 2,703 93.1 Y 146 5.1 89 4.5 2,355 81.6 Y 172 5.9 89 4.5 2,297 79.3 Y
“Y” indicates that the test result is significant at <0.05 level; “N” indicates the test result is not significant.
33A Component of the CBOK Study
Chapter 3: The Relationship between Characteristics of the Internal Audit Activity and Agreement with Value Statements

Table 3–4Factors Affecting the Agreement with the Statement: Adds Value to the Governance Process
Direct access to audit committee (A18)
Compliance to professional standards (A13)
Compliance to IIA’s Code of Ethics (A14)
DISAGREE NEUTRAL AGREE DISAGREE NEUTRAL AGREE DISAGREE NEUTRAL AGREE
count % count % count % Sig count % count % count % Sig count % count % count % Sig
Perc
enta
ge o
f co-
sour
ced/
out
sour
ced <=25% 24 24.2 32 32.3 43 43.4 5 5.1 23 23.2 71 71.7 6 6.1 20 20.2 73 73.7
26-50% 28 24.0 34 29.1 55 47.0 18 15.5 18 15.5 80 69.0 10 8.6 23 20.0 84 71.8
51-74% 11 10.4 23 21.7 72 67.9 13 12.4 23 21.9 69 65.7 7 6.7 27 25.7 71 67.6
>=75% 63 3.8 192 11.4 1,423 84.8 143 8.5 334 19.9 1,203 71.6 92 5.5 274 16.3 1,316 78.2
Total 126 6.3 89 4.5 1,593 79.7 Y 179 9.0 89 4.5 1,423 71.2 N 115 5.7 89 4.5 1,544 77.1 N
Appr
opria
te a
cces
s to
au
dit c
omm
ittee Yes 71 4.0 215 12.0 1,508 84.1 146 8.1 352 19.6 1,296 72.2 90 5.0 295 16.4 1,410 78.6
No 52 26.9 58 30.1 83 43.0 33 17.0 46 23.7 115 59.3 25 12.8 46 23.6 124 63.6
Total 123 6.2 273 13.7 1,591 80.1 Y 179 9.0 398 20.0 1,411 71.0 Y 115 5.8 341 17.1 1,534 77.1 Y
Writ
ten
repo
rt on
in
tern
al c
ontro
ls Yes 63 5.0 175 14.0 1,014 81.0 96 7.7 240 19.1 918 73.2 65 5.2 205 16.4 983 78.5
No 61 8.3 103 13.9 575 77.8 84 11.4 159 21.6 494 67.0 50 6.8 138 18.6 553 74.6
Total 124 6.2 278 14.0 1,589 79.8 Y 180 9.0 399 20.0 1,412 70.9 Y 115 5.8 343 17.2 1,536 77.0 Y
Freq
uenc
y of p
rovi
ding
re
port
On request 5 8.2 12 19.7 44 72.1 3 4.9 11 18.0 47 77.1 4 6.6 12 19.7 45 73.8
Annually 36 6.4 89 15.8 439 77.8 46 8.2 114 20.2 404 71.6 34 6.0 95 16.8 435 77.1
Periodically 24 3.7 78 11.9 552 84.4 49 7.5 114 17.4 493 75.2 29 4.4 101 15.4 525 80.2
Total 65 5.1 179 14.0 1,035 80.9 Y 98 7.7 239 18.7 944 73.7 N 67 5.2 208 16.3 1,005 78.5 N
Coer
cion
to c
hang
e a
ratin
g or
wi
thdr
aw a
find
ing
Yes 108 17.7 125 20.5 377 61.8 71 11.5 124 20.0 424 68.5 54 8.7 105 17.0 459 74.3
No 203 10.3 373 18.9 1403 70.9 143 7.1 410 20.5 1,451 72.4 95 4.7 335 16.7 1576 78.6
No ratings 34 13.3 65 25.5 156 61.2 29 11.5 73 28.9 151 59.7 16 6.3 61 23.9 178 69.8
Total 345 12.1 563 19.8 1,936 68.1 Y 243 8.5 607 21.1 2,026 70.5 Y 165 5.7 501 17.4 2,213 76.9 Y
No. o
f too
ls u
sed
0 18 12.6 44 30.8 81 56.6 11 7.5 37 25.2 99 67.4 6 4.1 33 22.8 106 73.1
1-5 119 13.9 224 26.2 511 59.8 95 11.0 224 26.0 542 63.0 63 7.3 206 23.8 597 68.9
6-10 171 12.3 240 17.2 982 70.5 115 8.2 286 20.3 1,007 71.5 76 5.4 220 15.6 1,111 79.0
>11 40 8.6 62 13.3 366 78.2 22 4.6 65 13.7 387 81.7 20 4.2 46 9.7 408 86.1
Total 348 12.2 89 4.5 1,940 67.9 Y 243 8.4 89 4.5 2,035 70.4 Y 165 5.7 89 4.5 2,222 76.8 Y
“Y” indicates that the test result is significant at <0.05 level; “N” indicates the test result is not significant.
Measuring Internal Auditing’s Value
34 A Component of the CBOK Study

Table 3–5Factors Affecting the Agreement with the Statement: Organizational
Status for the Internal Audit Activity to Be Effective
Status (A9) Credible (A12) Meeting/exceeding IIA’s Code of Ethics (A15)
DISAGREE NEUTRAL AGREE DISAGREE NEUTRAL AGREE DISAGREE NEUTRAL AGREE
count % count % count % Sig count % count % count % Sig count % count % count % Sig
Perc
enta
ge o
f co-
sour
ced/
ou
tsou
rced
<=25% 3 3.0 6 6.0 91 91.0 7 7.1 12 12.1 80 80.8 9 8.9 28 27.7 64 63.4
26-50% 5 4.3 3 2.6 109 93.2 6 5.2 11 9.5 99 85.3 8 6.8 25 21.4 84 71.8
51-74% 4 3.8 4 3.8 98 92.5 3 2.8 5 4.7 98 92.5 6 5.7 20 18.9 80 75.5
>=75% 47 2.8 33 2.0 1,606 95.3 35 2.1 109 6.5 1,531 91.4 67 4.0 272 16.2 1,342 79.8
Total 59 2.9 89 4.5 1,904 94.8 Y 51 2.6 89 4.5 1,808 90.6 Y 90 4.5 89 4.5 1,570 78.3 Y
Appr
opria
te a
cces
s to
au
dit c
omm
ittee Yes 45 2.5 29 1.6 1,725 95.9 37 2.1 106 5.9 1,645 92.0 62 3.5 294 16.4 1,438 80.2
No 15 7.7 17 8.7 164 83.7 14 7.2 33 16.9 148 75.9 27 13.7 49 24.9 121 61.4
Total 60 3.0 46 2.3 1,889 94.7 Y 51 2.6 139 7.0 1,793 90.4 Y 89 4.5 343 17.2 1,559 78.3 Y
Writ
ten
repo
rt on
in
tern
al c
ontro
l Yes 36 2.9 30 2.4 1,191 94.8 25 2.0 84 6.7 1,140 91.3 53 4.2 219 17.5 982 78.3
No 24 3.2 17 2.3 700 94.5 26 3.5 55 7.5 657 89.0 37 5.0 126 17.0 577 78.0
Total 60 3.0 47 2.4 1,891 94.6 N 51 2.6 139 7.0 1,797 90.4 N 90 4.5 345 17.3 1,559 78.2 Y
Freq
uenc
y of
prov
idin
g re
port
On request 3 4.9 5 8.2 53 86.9 0 0.0 4 6.7 56 93.3 4 6.7 14 23.3 42 70.0
Annually 15 2.7 15 2.7 536 94.7 13 2.3 40 7.1 510 90.6 24 4.2 90 15.9 452 79.9
Periodically 20 3.1 12 1.8 624 95.1 13 2.0 42 6.4 598 91.6 28 4.3 117 17.9 510 77.9
Total 38 3.0 32 2.5 1,213 94.5 N 26 2.0 86 6.7 1,164 91.2 N 56 4.4 221 17.3 1,004 78.4 N
Coer
cion
to c
hang
e a
ratin
g or
wi
thdr
aw a
find
ing
Yes 37 6.0 33 5.3 552 88.8 30 4.9 66 10.7 519 84.4 57 9.3 125 20.3 433 70.4
No 48 2.4 51 2.5 1,912 95.1 44 2.2 139 7.0 1,814 90.8 77 3.8 383 19.1 1,550 77.1
No ratings 13 5.1 16 6.3 226 88.6 10 4.0 36 14.2 207 81.8 21 8.2 57 22.3 178 69.5
Total 98 3.4 100 3.5 2,690 93.1 Y 84 2.9 241 8.4 2,540 88.7 Y 155 5.4 565 19.6 2,161 75.0 Y
No. o
f too
ls u
sed
0 11 7.5 13 8.8 123 83.7 6 4.2 22 15.4 115 80.4 13 9.0 44 30.3 88 60.7
1-5 43 5.0 41 4.7 784 90.3 44 5.1 117 13.6 702 81.3 64 7.4 246 28.4 556 64.2
6-10 31 2.2 37 2.6 1,345 95.2 25 1.8 91 6.5 1,286 91.7 65 4.6 232 16.4 1,114 79.0
>11 13 2.7 10 2.1 451 95.2 9 1.9 13 2.8 449 95.3 13 2.8 47 9.9 413 87.3
Total 98 3.4 89 4.5 2,703 93.1 Y 84 2.9 89 4.5 2,552 88.6 Y 155 5.4 89 4.5 2,171 75.0 Y
“Y” indicates that the test result is significant at <0.05 level; “N” indicates the test result is not significant.
35A Component of the CBOK Study
Chapter 3: The Relationship between Characteristics of the Internal Audit Activity and Agreement with Value Statements

Summary and ImplicationsBased on the nature of the value statements asked in the survey, the value statements are divided into five groupings to facilitate our analyses: 1) value added by the internal audit activity; 2) systematic approach to evaluate process effectiveness; 3) effective functioning of the internal audit activity; 4) adding value to the governance process; and 5) organization status of an effective internal audit activity. The investigation of the relationship between characteristics of the internal audit activity and the level of agreement with the grouped value statements regarding the activity was then performed. Table 3–6 summarizes the most and the least important factors of the internal audit activity characteristics affecting the perceived contribution of the activity based upon the significance of the findings from Tables 3–1 through 3–5.
Table 3–6Summary of Factors Affecting the Agreement with the Value Statements
Value statements
IAA characteristics IAA adds value Process effectiveness
Effective functioning
Add value to governance process Organization status
Co-sourced/ outsourced V V V
Appropriate access to audit committee V V V V V
Written report on internal control X V V
Frequency of providing internal
audit reportX X X
Coercion to change a rating/withdraw
findingV V V V V
No. of tools used V V V V V
“V” indicates factor with significance; “X” indicates factor without significance.
As shown in Table 3–6, having appropriate access to the audit committee, without coercion to change a rating assessment or withdraw a finding, and more audit tools or technology used on a typical audit engagement are the most important factors to the perceived contribution of the internal audit activity in every aspect. It is noted that how often a written internal audit report is provided does not matter to the perceived contribution of the internal audit activity, measured in terms of whether it adds value. The provision of a written report on overall internal control for use by the audit committee or
Measuring Internal Auditing’s Value
36 A Component of the CBOK Study

senior management does not seem to matter for respondents to perceive whether the internal audit activity adds value. However, it does matter to the perception that the internal audit activity provides a systematic approach to governance, risk management, and control processes.
In 2010, there appears to be a declining trend in sourcing the internal audit activity from outside the organization. The percentage of respondents who did no co-sourcing or outsourcing (57 percent) and outsourced 10 percent or less of their activity (27 percent) totaled 84 percent, compared to 75 percent in 2006. It is intriguing to find that the percentage of co-sourcing or outsourcing the internal audit activity does not have an impact on the perception of value-adding but rather on the effectiveness of the activity, measured in terms of process effectiveness, effective functioning, and sufficient organization status for the activity to be effective.
The results reported here therefore imply that it is more essential to provide appropriate access to the audit committee and foster a working environment without undue or extreme pressure (coercion) to change an audit rating or withdraw audit findings. Having sufficient organizational status and appropriate audit tools, internal auditors are more likely to enhance their positive perception that they add value to the organization.
37A Component of the CBOK Study
Chapter 3: The Relationship between Characteristics of the Internal Audit Activity and Agreement with Value Statements


Chapter 4 Performance Measurement of the Internal Audit ActivityMethods Used to Measure the Performance of the Internal Audit ActivityThis section examines the popularity of methods used to measure the performance of the internal audit activity. Table 4–1 provides the frequency of methods used by the respondents’ organizations in 2010 and in five years. It is shown that the top five methods measured in terms of respondents were assessment by percentage of audit plan complete (13.7 percent), acceptance and implementation of recommendations (11.8 percent), assessment by survey or feedback from the board, audit committee, and/or senior management (10.8 percent), assessment by customer/auditee surveys from audited departments (9.1 percent), assurance of sound risk management and internal control (8.3 percent), and reliance by external auditors on the internal audit activity (8.3 percent). The least used internal audit activity performance measurement methods are assessment by absence of regulatory or reputation issues and significant failures (3.8 percent), cycle time from entrance conference to draft report (4.1 percent), and balanced scorecard (4.1 percent). Of the 11,853 respondents, 5.8 percent indicated that they had no formal performance measures for their internal audit activity.
Table 4–1 also indicates that the top five methods used today will continue to be important in the future. In addition, the balanced scorecard method, with the highest percentage (4.1 percent), will gain importance in five years.4
To better understand whether the use of performance measurement methods reported in Table 4–1 are subject to regional and industry variations, further analyses is provided based on classifications by regions and industries. Table 4–2 presents the results by region, while Table 4–3 presents the results by industry.
4 It was not clear how respondents interpreted the column “In Five Years.” It was intended that they should mark all that they believed would be in use in five years, but it might have been interpreted as asking for only additions to the initial list. The counts suggest that only additions have been marked.
39A Component of the CBOK Study

Table 4–1Ranking of Methods Used to Measure the Performance of Internal Audit
Activities — Currently and in Five Years (N=11,853)
Period
Methods Today In Five Years
count % count %
Percentage of audit plan complete 1,620 13.7 332 2.8
Recommendations accepted/implemented 1,393 11.8 315 2.7
Surveys/feedback from the board, audit committee, and/or senior management 1,279 10.8 443 3.7
Customer/auditee surveys from audited departments 1,075 9.1 443 3.7
Assurance of sound risk management/internal control 980 8.3 381 3.2
Reliance by external auditors on the internal audit activity 979 8.3 294 2.5
Timely closure of audit issues 904 7.6 269 2.3
Completion of mandated coverage 830 7.0 209 1.8
Number of significant audit findings 782 6.6 189 1.6
Budget to actual audit hours 741 6.3 232 2.0
Number of management requests for internal audit assurance or consulting projects 692 5.8 236 2.0
No formal performance measurement of the internal audit activity 687 5.8 102 0.9
Cost savings/avoidance and improvements from recommendations implemented 678 5.7 293 2.5
Cycle time — report turnaround (end of fieldwork to final report) 603 5.1 237 2.0
Balanced scorecard 491 4.1 476 4.0
Cycle time from entrance conference to draft report 491 4.1 231 1.9
Absence of regulatory or reputation issues and significant failures 451 3.8 163 1.4
The top three methods (percentages shown in bold) used by the organizations in each region are ranked to understand whether a difference exists. As indicated in Table 4–2, the most commonly used performance measurement methods include assessment by percentage of audit plan complete and
Measuring Internal Auditing’s Value
40 A Component of the CBOK Study

acceptance and implementation of recommendations. These findings are consistent with the results shown in Table 4–1. Analysis by industry shows that in addition to assessment by percentage of audit plan complete and acceptance and implementation of recommendations, surveys and feedback from the board, audit committee, and/or senior management are measurement methods commonly used by all industries. Based on the results from Table 4–2 and Table 4–3, it appears that there is consensus with regard to how performance of the internal audit activity is measured across regions and industries.
Table 4–2
Regional Comparison of the Methods Currently Used to Measure the Performance of Internal Audit Activities
Regions
Methods Africa Asia Pacific
Europe- Central
Asia
Latin America/
Caribbean
Middle East
United States/ Canada
Western Europe Other Total*
Balanced scorecard Col. % 6.2 3.2 3.3 4.4 6.8 2.8 3.3 4.1 4.1
Assurance of sound risk management/
internal control Col. % 6.1 7.8 7.5 6.3 4.9 6.1 7.8 5.7 8.3
Surveys/feedback from the board, audit committee,
and/or senior managementCol. % 8.9 9.1 8.0 7.6 6.8 7.9 11.5 7.9 10.8
Customer/auditee surveys from audited departments Col. % 7.4 7.0 7.1 7.7 8.3 8.6 7.7 6.1 9.1
Recommendations accepted/implemented Col. % 8.6 8.5 11.8 12.0 9.8 8.6 10.7 12.0 11.8
Cost savings/avoidance and improvements
from recommendations implemented
Col. % 4.2 5.9 5.4 5.9 7.1 4.7 3.7 6.1 5.7
Number of management requests for internal audit assurance or consulting
projects
Col. % 6.1 5.6 4.8 4.1 4.5 5.3 4.2 5.7 5.8
Reliance by external auditors on the internal
audit activity Col. % 6.8 4.6 4.9 6.2 2.6 8.9 8.2 5.6 8.3
Budget to actual audit hours Col. % 4.2 4.9 4.8 5.8 5.6 6.7 4.7 4.3 6.3
Percentage of audit plan complete Col. % 11.1 11.2 11.5 13.5 9.0 11.7 11.4 11.8 13.7
Completion of mandated coverage Col. % 8.6 6.9 4.8 4.8 7.1 5.7 5.8 5.7 7.0
Cycle time from entrance conference to draft report Col. % 4.0 3.6 3.7 2.3 4.5 3.4 3.7 3.6 4.1
Chapter 4: Performance Measurement of the Internal Audit Activity
41A Component of the CBOK Study

Regions
Methods Africa Asia Pacific
Europe- Central
Asia
Latin America/
Caribbean
Middle East
United States/ Canada
Western Europe Other Total*
Cycle time — report turnaround (end of fieldwork to final report)
Col. % 4.3 4.4 3.5 3.2 5.3 4.6 4.7 3.6 5.1
Number of significant audit findings Col. % 6.5 6.3 7.5 6.9 7.1 4.4 4.7 6.9 6.6
Timely closure of audit issues Col. % 5.4 7.9 8.0 6.6 7.1 6.7 4.9 6.9 7.6
Absence of regulatory or reputation issues and
significant failuresCol. % 1.7 3.1 3.4 2.8 3.4 3.8 3.0 3.9 3.8
Total after deduction of no formal performance
measurementN 721 2,247 1,550 1,109 266 3,511 3,976 609
No formal performance measurement of the
internal audit activityN 23 141 73 54 8 156 200 32
* Total based on rankings of all respondents (see Table 4.1)
Table 4–2Regional Comparison of the Methods Currently Used to Measure the
Performance of Internal Audit Activities (continued)
Measuring Internal Auditing’s Value
42 A Component of the CBOK Study

Table 4–3Industry Comparison of the Methods Currently Used to Measure the
Performance of Internal Audit Activities
Industries
Methods
Fina
ncia
l
Man
ufac
turin
g
& Co
nstru
ctio
n
Publ
ic S
ecto
r/
Gove
rnm
ent
Raw
Mat
eria
l &
Agric
ultu
re
Serv
ice
Tran
spor
tatio
n,
Com
mun
icat
ion,
El
ectri
c, G
as,
Sani
tary
Ser
vice
s
Who
lesa
le
& Re
tail
Trad
e
Othe
r
Tota
l*
Balanced scorecard Col. % 3.6 3.2 3.4 4.6 2.5 4.4 3.5 3.3 4.1
Assurance of sound risk management/internal
control
Col. % 6.9 7.7 6.1 7.3 7.6 6.4 6.2 7.6 8.3
Surveys/feedback from the board, audit
committee, and/or senior management
Col. % 9.1 9.4 8.2 9.9 9.5 8.9 8.8 9.7 10.8
Customer/auditee surveys from audited
departments
Col. % 7.3 7.4 9.3 7.1 8.3 7.6 7.0 7.9 9.1
Recommendations accepted/implemented
Col. % 9.2 9.8 11.8 8.9 10.5 10.3 9.9 10.5 11.8
Cost savings/avoid-ance and improvements from recommendations
implemented
Col. % 3.6 6.0 4.1 6.9 5.3 5.3 7.6 3.9 5.7
Number of management requests for internal audit assurance or consulting projects
Col. % 4.1 5.1 5.4 5.2 5.8 5.4 5.4 4.8 5.8
Reliance by external auditors on the internal
audit activity
Col. % 8.0 6.1 5.4 5.6 7.8 7.1 6.5 6.4 8.3
Budget to actual audit hours
Col. % 5.8 4.2 5.5 5.5 5.1 5.4 4.8 5.6 6.3
Percentage of audit plan complete
Col. % 12.3 11.7 11.8 11.8 10.3 11.4 10.5 10.8 13.7
Completion of mandated coverage
Col. % 6.3 6.6 5.5 5.0 5.7 5.5 5.9 5.1 7.0
Cycle time from entrance conference to draft report
Col. % 3.5 3.2 4.4 2.9 2.9 3.6 3.7 4.3 4.1
Chapter 4: Performance Measurement of the Internal Audit Activity
43A Component of the CBOK Study

Industries
Methods
Fina
ncia
l
Man
ufac
turin
g
& Co
nstru
ctio
n
Publ
ic S
ecto
r/
Gove
rnm
ent
Raw
Mat
eria
l &
Agric
ultu
re
Serv
ice
Tran
spor
tatio
n,
Com
mun
icat
ion,
El
ectri
c, G
as,
Sani
tary
Ser
vice
s
Who
lesa
le
& Re
tail
Trad
e
Othe
r
Tota
l*
Cycle time — report turnaround (end of
fieldwork to final report)
Col. % 4.4 4.6 4.2 4.3 3.4 4.8 4.0 4.5 5.1
Number of significant audit findings
Col. % 5.3 5.8 5.9 5.5 5.5 5.5 6.4 5.8 6.6
Timely closure of audit issues
Col. % 6.2 7.0 5.8 6.3 6.5 6.5 7.2 7.2 7.6
Absence of regulatory or reputation issues and
significant failures
Col. % 4.4 2.2 3.0 3.2 3.3 2.1 2.7 2.7 3.8
Total after deduction of no formal performance
measurementN 4,469 2,309 1,285 695 1,786 1,841 628 976
No formal performance measurement N 179 142 56 26 114 76 39 55
* Total based on rankings of all respondents (see Table 4.1)
Summary and ImplicationsThe analysis on common performance measures of an internal audit activity indicates that the top ranked methods currently used include assessment by percentage of audit plan completed, acceptance and implementation of recommendations, surveys/feedback from the board/audit committee/senior management, customer/auditee surveys from audited departments, assurance of sound risk management, and reliance by external auditors on the internal audit activity. The least used internal audit activity performance measurement methods are assessment by absence of regulatory or reputation issues and significant failures, cycle time from entrance conference to draft report, and balanced scorecard. It is worth noting that the top ranked methods used today will continue to be important in the future. In addition, the balanced scorecard and assurance of sound risk management/internal control methods are expected to gain importance in five years’ time. Regional and industry comparisons regarding the performance measures of the internal audit activity show no significant differences.
Table 4–3Industry Comparison of the Methods Currently Used to Measure the
Performance of Internal Audit Activities (continued)
Measuring Internal Auditing’s Value
44 A Component of the CBOK Study

Chapter 5 Performance Measurement Methods and Perceived Contributions
The methods used to measure an internal audit activity’s performance, in general, will affect its efforts and focus on different audit activities, and thus its perceived contributions to the organization. To determine whether there is a relationship between the performance measurement methods currently used by the internal audit activities and their perceived contributions, a correlation analysis between the performance measurement methods and perceived contribution is presented. Table 5–1 provides the resulting correlation coefficients for all variables.
It shows that, for each performance measurement method, the correlations with different value statements are fairly consistent. The method with the highest correlation is percentage of audit plan complete (M10), with most coefficients close to 0.7. This association reflects the basic requirement of an internal audit activity to fulfill its annual audit plan.
The other two methods with high correlation are recommendations accepted/implemented (M5) and surveys/feedback from the board, audit committee, and/or senior management (M3), with all of the coefficients above 0.6. The methods are more outcome-oriented and indicative of the internal audit activity’s contribution to organizational process improvements.
In addition, there are three methods with correlation coefficients above 0.5: assurance of sound risk management/internal control (M2), customer/auditee surveys from audited departments (M4), and reliance by external auditors on the internal audit activity (M8). Similarly, these methods are used to measure the internal audit activity’s outcome and its usefulness to the auditee and the organization.
For the remaining performance measurement methods, the correlation coefficients lie between 0.3 and 0.5. These numbers indicate a weaker association between each of these methods and the value statements. Among these methods, M12, M13, and M15 are more process-oriented; M6 and M9 measure financial benefits/budget controls; and M7 indicates the usage of internal audit services.
In summary, the performance measurement methods used by the internal audit activities are associated with their perceived contributions. While the more outcome-oriented methods show a higher correlation with the value statements, the remaining methods also have medium association with these statements. The results imply that although it is important for internal auditors to use their resources efficiently (measured by the process-oriented performance indicators), the outcome of their work is imperative for the internal audit activities to provide value to the organizations.
45A Component of the CBOK Study

Table 5–1Pearson Correlation between Value Statements and Performance Measurement Methods*
Value Statements
Perfo
rman
ce
Mea
sure
men
t Met
hod*
*
A2 A10 A11 A3 A4 A5 A1 A6 A7 A8 A13 A14 A9 A12 A15
M1 .372 .362 .360 .381 .372 .378 .363 .365 .378 .378 .378 .371 .376 .370 .373
M2 .531 .523 .525 .542 .536 .539 .527 .538 .537 .518 .524 .520 .531 .527 .524
M3 .608 .610 .613 .614 .617 .620 .614 .612 .617 .616 .609 .607 .621 .613 .615
M4 .555 .555 .556 .564 .564 .560 .561 .558 .565 .557 .562 .560 .561 .558 .567
M5 .642 .636 .633 .643 .641 .639 .640 .639 .643 .624 .641 .635 .646 .641 .634
M6 .439 .426 .427 .436 .432 .438 .421 .443 .435 .418 .428 .431 .433 .427 .427
M7 .440 .435 .436 .442 .439 .447 .434 .442 .446 .434 .438 .439 .441 .435 .440
M8 .530 .529 .530 .536 .539 .527 .536 .532 .532 .529 .516 .521 .537 .535 .532
M9 .454 .455 .455 .459 .458 .462 .457 .457 .466 .468 .458 .457 .457 .457 .461
M10 .696 .697 .699 .696 .698 .688 .699 .689 .701 .694 .696 .692 .697 .697 .693
M11 .479 .480 .480 .488 .483 .491 .482 .484 .492 .489 .483 .485 .489 .483 .482
M12 .361 .362 .362 .367 .365 .370 .361 .364 .374 .362 .378 .369 .370 .367 .372
M13 .408 .404 .407 .414 .411 .409 .406 .411 .418 .412 .415 .409 .416 .411 .415
M14 .468 .461 .462 .465 .462 .472 .458 .467 .474 .458 .469 .468 .461 .460 .455
M15 .505 .494 .495 .506 .503 .508 .497 .506 .514 .502 .502 .502 .506 .502 .504
M16 .348 .342 .351 .352 .351 .353 .348 .357 .356 .347 .341 .346 .354 .357 .352
M17 .408 .407 .411 .388 .397 .387 .404 .401 .386 .365 .389 .401 .383 .400 .393
* 2-tailed Chi-square test, significance level =0.000 for all items. The number of respondents varies across the 15 value statements (see Table 2-1).
** M1: Balanced scorecard; M2: Assurance of sound risk management/internal control; M3: Surveys/feedback from the board, audit committee, and/or senior management; M4: Customer/auditee surveys from audited departments; M5: Recommendations accepted/implemented; M6: Cost savings/avoidance and improvements from recommendations implemented; M7: Number of management requests for internal audit assurance or consulting projects; M8: Reliance by external auditors on the internal audit activity; M9: Budget to actual audit hours; M10: Percentage of audit plan complete; M11: Completion of mandated coverage; M12: Cycle time from entrance conference to draft report; M13: Cycle time — report turnaround; M14: Number of significant audit findings; M15: Timely closure of audit issues; M16: Absence of regulatory or reputation issues and significant failures; M17: No formal perfor-mance measurement.
Measuring Internal Auditing’s Value
46 A Component of the CBOK Study

Chapter 6 Audit Activities Performed and Perceived ContributionsIn general, when an internal audit activity performs more services, its perceived contribution is expected to be higher. To determine whether there is such a relationship, a correlation analysis between the number of audit activities performed and the respondents’ level of agreement with the value statements is presented. While not tabulated, the results show that the level of agreement with each value statement is generally positively associated with the number of audit services performed.5
The 2010 survey question on internal audit activities performed includes 25 items. These items were classified into three groups: internal control, risk management, and corporate governance (Table 6–1) to be able to examine how the extent of different services affects the value statements, A2, A3, A4, and A5.
Table 6–1Classification of Internal Audit Activities Performed
Group 1: Internal Control
2. Audits of compliance with regulatory code (including privacy) requirements
3. Evaluating effectiveness of control systems (using COSO, COBIT, etc., frameworks)
9. Operational audits
10. Project management assurance/audits of major projects
12. Security assessments and investigations
14. Disaster recovery testing and support
15. Investigations of fraud and irregularities
19. Quality/ISO audits
20. External audit assistance
21. Management audits
22. Facilitating risk/control/compliance training and education for organization personnel
23. Auditing of outsourced operations
24. Migration to International Financial Reporting Standards (IFRS)
25. Implementation of Extensible Business Reporting Language (XBRL)
Group 2: Risk Management
4. Business viability (going-concern) assessments
7. Audits of enterprise risk management processes
5 2-tailed Chi-square test, significance level =0.000 for all items.
47A Component of the CBOK Study

8. Auditing of financial risks
11. Auditing of information risks
13. Auditing of IT/ICT risks
Group 3: Corporate Governance1. Corporate governance reviews
5. Due diligence reviews for corporate acquisitions/mergers, etc.
6. Ethics audits
16. Reviews addressing linkage of strategy and company performance (e.g., balanced scorecard)
17. Executive compensation assessments
18. Social and sustainability (corporate social responsibility, environmental) audits
Table 6–2 shows that the relationships between different types of audit services performed and the four value statements are low. The correlation for statement A2 (add value) with internal control audit activities is higher than those with the other two groups. This implies that a higher proportion of internal audit activities’ perceived contribution is derived from providing internal control audit activities.
Table 6–2Pearson Correlation between Value Statements and Internal Audit Activities Performed*
Value StatementsAudit Services
Performed A2: Add value A3: Risk management A4: Internal controls A5: Governance
Internal control .150 .206 .204 .216
Risk management .123 .254 .212 .210
Governance .103 .188 .114 .286
* 2-tailed Chi-squared test, significance level =0.000 for all items.
In addition, for the value statements on risk management (A3) and governance (A5), their correlations (0.254 and 0.286) with respective audit activities are the highest among the three value statements on bringing systematic approaches to risk management, internal control, and governance processes. These relationships are consistent with the expectation that the efforts in performing risk management or governance services have more of an effect on the respondents’ perceived contribution of their internal audit activities to the related processes.
In summary, the scope of internal audit activities is positively associated with their perceived contribution. While the relationships between different types of audit services performed and the four value statements are low, there is higher correlation between internal control-related audit activities and the perceived contribution. The audit activities related to governance and risk management also have a higher correlation with the internal audit activities’ perceived contribution to these processes.
Table 6–1Classification of Internal Audit Activities Performed (continued)
Measuring Internal Auditing’s Value
48 A Component of the CBOK Study

Chapter 7 Conclusion
Analysis of survey results discussed in this report indicates that most respondents believe their internal audit activities are adding value to their organizations. Both independence and objectivity are viewed as key factors. While most internal audit functions see themselves as contributing to controls, they do not to the same extent perceive themselves as contributing to risk management or governance. The results from regional comparisons indicate that there are significant differences across the seven regions in terms of internal audit activities’ perceived contribution to their organizations. Based on the results from industrial comparison, the industry groups with the top three levels of agreement are service, financial, and raw material and agriculture. However, since most industry groups are spread across different regions, the above results represent, to some extent, the averaging effect of internal audit activities from different regions. In addition, there is no industry that is consistently ranked as the lowest among the industry groups.
The most important factors to the perceived contribution of an internal audit activity in every aspect are 1) having appropriate access to the audit committee; 2) without coercion to change a rating assessment or withdraw a finding, and 3) more audit tools or technology used on a typical audit engagement. Compared to 2006, there appears to be a declining trend in sourcing the internal audit activity from outside the organization. The percentage of co-sourcing or outsourcing the internal audit activity does not have an impact on the perception of value-adding but rather on the effectiveness of the internal audit activity, measured in terms of process effectiveness, effective functioning, and sufficient organization status.
The results imply that it is more essential to provide appropriate access to the audit committee and foster a working environment without undue or extreme pressure (coercion) to change an audit rating or withdraw audit findings. Having sufficient organizational status and appropriate audit tools, internal auditors are more likely to enhance their positive perception that they add value to the organization.
Most frequently used performance methods for the internal audit activity include 1) assessment by percentage of the audit plan completed; 2) acceptance and implementation of recommendations; 3) surveys/feedback from the board/audit committee/senior management; 4) customer/auditee surveys from audited departments; 5) assurance of sound risk management; and 6) reliance by external auditors on the internal audit activity. The balanced scorecard and assurance of sound risk management/internal control methods are expected to gain importance as internal audit activity performance methods in the coming years.
In addition, the methods used to measure the performance of internal audit activities are associated with their perceived contributions. The more outcome-oriented methods show a higher correlation with the value statements.
49A Component of the CBOK Study 49


The IIA’s Global Internal Audit Survey — QuestionsThe entire IIA Global Internal Audit Survey, including question and answer options and glossary, may be downloaded from The IIARF’s website (www.theiia.org/research). The following table provides an overview of the questions and groups that answered the specific questions. In addition, the table indicates in which report the survey data were (mostly) used.
Ques
tion
#
Section and Description of Question CAE
Serv
ice
Prov
ider
Pa
rtne
r
Serv
ice
Prov
ider
Non
-pa
rtne
r
Prac
titio
ners
(sta
ff le
vels
in-h
ouse
and
at-
serv
ice
prov
ider
s)
Acad
emic
s an
d Ot
hers
Data
Use
d in
Rep
ort
Personal/Background Information
1a How long have you been a member of The IIA? X X X X X I & V
1b Please select your local IIA. X X X X X I & V
1c Please select the location in which you primarily practice professionally.
X X X X X I & V
2a Your age. X X X X X I & V
2b Your gender. X X X X X I & V
3 Your highest level of formal education (not certification) completed.
X X X X X I & V
4 Your academic major(s). X X X X X I & V
5a Do you work for a professional firm that provides internal audit services?
X X X X X I & V
5b Your position in the organization. X X X X X I & V
6 Your professional certification(s) (please mark all that apply). X X X X X I & V
7 Specify your professional experience (please mark all that apply).
X X X X X I & V
8 How many total years have you been the CAE or equivalent at your current organization and previous organizations you have worked for?
X I
9 Where do you administratively report (direct line) in your organization?
X I & V
10 Do you receive at least 40 hours of formal training per year? X X X X I & V
51A Component of the CBOK Study

Ques
tion
#
Section and Description of Question CAE
Serv
ice
Prov
ider
Pa
rtne
r
Serv
ice
Prov
ider
Non
-pa
rtne
r
Prac
titio
ners
(sta
ff le
vels
in-h
ouse
and
at-
serv
ice
prov
ider
s)
Acad
emic
s an
d Ot
hers
Data
Use
d in
Rep
ort
Your Organization
11 The type of organization for which you currently work. X X X X I
12 The broad industry classification of the organization for which you work or provide internal audit services.
X X X X I
13a Size of the entire organization for which you work as of December 31, 2009, or the end of the last fiscal year (total employees).
X X X X I & V
13b Total assets in U.S. dollars. X X X X I & V
13c Total revenue or budget if government or not-for-profit in U.S. dollars.
X X X X I & V
14 Is your organization (local, regional, international)? X X X X I & V
Internal Audit Activity
15 How long has your organization's internal audit activity been in place?
X X I, III, & V
16 Which of the following exist in your organization (e.g., corporate governance code; internal audit charter)?
X X I, III, & V
17a Who is involved in appointing the chief audit executive (CAE) or equivalent?
X I & III
17b Who is involved in appointing the internal audit service provider?
X X I & III
18 Who contributes to the evaluation of your performance? X I & III
19 Is there an audit committee or equivalent in your organization? X I, III, & V
20a Number of formal audit committee meetings held in the last fiscal year.
X I & III
20b Number of audit committee meetings you were invited to attend (entirely or in part) during the last fiscal year.
X I & III
20c Do you meet or talk with the audit committee/chairman in addition to regularly scheduled meetings?
X I & III
20d Do you meet with the audit committee/oversight committee/chairman in private executive sessions during regularly scheduled meetings?
X I & III
Measuring Internal Auditing’s Value
52 A Component of the CBOK Study

Ques
tion
#
Section and Description of Question CAE
Serv
ice
Prov
ider
Pa
rtne
r
Serv
ice
Prov
ider
Non
-pa
rtne
r
Prac
titio
ners
(sta
ff le
vels
in-h
ouse
and
at-
serv
ice
prov
ider
s)
Acad
emic
s an
d Ot
hers
Data
Use
d in
Rep
ort
21a Do you believe that you have appropriate access to the audit committee?
X X I & III
21b Do you prepare a written report on overall internal control for use by the audit committee or senior management? Do you prepare a written report on overall internal control for use by the audit committee or senior management?How often do you provide a report?
X X I & III
21c Does your organization provide a report on internal control in its annual report?
X X I & III
21d Which of the following are included in the annual report item on internal control?
X X I & III
21e Who signs the report on internal controls? X X I & III
22 How does your organization measure the performance of the internal audit activity?
X I, III, & V
23a How frequently do you update the audit plan? X I & III
23b How do you establish your audit plan? X I, III, & V
24a What is your IT/ICT audit strategy? X I, III, & V
24b What is the nature of your internal audit activity’s technology strategy?
X I, III, & V
25a What is the number of organizations to which you (as an individual) currently provide internal audit services?
X I & III
25b Please indicate your agreement with the following statements as they relate to your current organization or organizations that you audit.
X I, III, & V
Staffing
26a Is your organization offering any special incentives to hire/retain internal audit professionals?
X I & III
26b What sources does your organization use to recruit audit staff? X I & III
26c Does your organization use college interns/undergraduate placements?
X I, III, & V
26d What is your primary reason for employing college interns/undergraduate placements?
X I, III, & V
53A Component of the CBOK Study
The IIA’s Global Internal Audit Survey — Questions

Ques
tion
#
Section and Description of Question CAE
Serv
ice
Prov
ider
Pa
rtne
r
Serv
ice
Prov
ider
Non
-pa
rtne
r
Prac
titio
ners
(sta
ff le
vels
in-h
ouse
and
at-
serv
ice
prov
ider
s)
Acad
emic
s an
d Ot
hers
Data
Use
d in
Rep
ort
27 What methods do you use to make up for staff vacancies? X I & III
28 What methods is your organization employing to compensate for missing skill sets?
X I & III
29 What percentage of your internal audit activities is currently co-sourced/outsourced?
X I & III
30a How do you anticipate that your budget for co-sourced/outsourced activities will change in the next five years?
X I & III
30b How do you anticipate that your permanent staff levels will change in the next five years?
X I, III, & V
31 What method of staff evaluation do you use? X I & III
Internal Audit Standards
32 Does your organization use the Standards? If you are a service provider, do you use the Standards for internal audits of your clients?
X X II, III, & V
33 If your internal audit activity follows any of the Standards, please indicate if the guidance provided by these standards is adequate for your internal audit activity and if you believe your organization complies with the Standards.
X X II, III, & V
33a Do you believe that the guidance provided by the Standards is adequate for internal auditing?
X II, III, & V
34 Your organization is in compliance. X II, III, & V
35 What are the reasons for not using the Standards in whole or in part?
X X II, III, & V
36 Does your internal audit activity have a quality assessment and improvement program in place in accordance with Standard 1300?
X II, III, & V
37a When was your internal audit activity last subject to a formal external quality assessment in accordance with Standard 1312?
X II, III, & V
37b Why has such a review not been undertaken? X II, III, & V
Measuring Internal Auditing’s Value
54 A Component of the CBOK Study

Ques
tion
#
Section and Description of Question CAE
Serv
ice
Prov
ider
Pa
rtne
r
Serv
ice
Prov
ider
Non
-pa
rtne
r
Prac
titio
ners
(sta
ff le
vels
in-h
ouse
and
at-
serv
ice
prov
ider
s)
Acad
emic
s an
d Ot
hers
Data
Use
d in
Rep
ort
37c As a provider of internal audit services, are your internal audit processes subjected to external quality assessments as specified in Standard 1312?
X II, III, & V
38 For your internal audit activity, which of the following is part of your internal audit quality assessment and improvement program?
X II, III, & V
Audit Activities
39 Please indicate whether your internal audit activity performs (or is anticipated to perform) the following:
X X X X I, III, & V
40a Do you usually provide a form of opinion of the audit subject area in individual internal audit reports?
X X X X I & III
40b Do you usually provide an overall rating (such as satisfactory/unsatisfactory) of the audit subject area in individual internal audit reports?
X X X X I & III
40c Have you ever been subject to coercion (extreme pressure) to change a rating or assessment or to withdraw a finding in an internal audit report?
X X X X I & III
41 After the release of an audit report in the organization, who has the primary responsibility for reporting findings to senior management?
X X X X I & III
42 After the release of an audit report with findings that need corrective action, who has the primary responsibility to monitor that corrective action has been taken?
X X X X I & III
Tools, Skills, and Competencies
43a Indicate the extent the internal audit activity uses or plans to use the following audit tools or techniques on a typical audit engagement.
X X X X II, III, & V
43b What other tools and techniques are you currently using or planning to use (indicate if proprietary)?
X X X X II, III, & V
44 Please mark the five most important of the following behavioral skills for each professional staff level to perform their work.
X X X II, III, & V
44a Please indicate the importance of the following behavioral skills for you to perform your work at your position in the organization
X X II, III, & V
45 Please mark the five most important of the following technical skills for each level of professional staff to perform their work.
X X X II, III, & V
55A Component of the CBOK Study
The IIA’s Global Internal Audit Survey — Questions

Ques
tion
#
Section and Description of Question CAE
Serv
ice
Prov
ider
Pa
rtne
r
Serv
ice
Prov
ider
Non
-pa
rtne
r
Prac
titio
ners
(sta
ff le
vels
in-h
ouse
and
at-
serv
ice
prov
ider
s)
Acad
emic
s an
d Ot
hers
Data
Use
d in
Rep
ort
45a Please indicate the importance of the following technical skills for you to perform your work at your position in the organization.
X X II, III, & V
46 Please mark the five most important of the following competencies for each level of professional rank to perform their work.
X X X II, III, & V
46a Please indicate the importance of the following competencies for you to perform your work at your position in the organization.
X X II, III, & V
46b How important are the following areas of knowledge for satisfactory performance of your job in your position in the organization?
X X II, III, & V
46c Are there other areas of knowledge that you consider essential? X X II, III, & V
Emerging Issues
47 Do you perceive likely changes in the following roles of the internal audit activity over the next five years?
X X X X X IV & V
48 Please indicate if the following statements apply to your organization now, in the next five years, or will not apply in the foreseeable future.
X X X X IV & V
Measuring Internal Auditing’s Value
56 A Component of the CBOK Study

The IIA’s Global Internal Audit Survey — GlossaryThis glossary was made available to respondents when they participated in the survey.
Add Value
Value is provided by improving opportunities to achieve organizational objectives, identifying operational improvement, and/or reducing risk exposure through both assurance and consulting services.
Assurance Services
An objective examination of evidence for the purpose of providing an independent assessment on governance, risk management, and control processes for the organization. Examples may include financial, performance, compliance, system security, and due diligence engagements.
Audit Risk
The risk of reaching invalid audit conclusions and/or providing faulty advice based on the audit work conducted.
Auditee
The subsidiary, business unit, department, group, or other established subdivision of an organization that is the subject of an assurance engage ment.
Board
A board is an organization’s governing body, such as a board of directors, supervisory board, head of an agency or legislative body, board of governors or trustees of a nonprofit organization, or any other designated body of the organization, including the audit committee to whom the chief audit executive may functionally report.
Business Process
The set of connected activities linked with each other for the purpose of achieving one or more business objectives.
Chief Audit Executive
Chief audit executive is a senior position within the organization responsible for internal audit activities. Normally, this would be the internal audit director. In the case where internal audit activities are obtained from external service providers, the chief audit executive is the person responsible for overseeing the service contract and the overall quality assurance of these activities, reporting to senior management and the board regarding internal audit activities, and follow-up of engagement results. The term also includes titles such as general auditor, head of internal audit, chief internal auditor, and inspector general.
Code of Ethics
The Code of Ethics of The Institute of Internal Auditors (IIA) are Principles relevant to the profession and practice of internal auditing, and Rules of Conduct that describe behavior expected of internal auditors. The Code of Ethics applies to both parties and entities that provide internal audit services.
57A Component of the CBOK Study

The purpose of the Code of Ethics is to promote an ethical culture in the global profession of internal auditing.
Compliance
Adherence to policies, plans, procedures, laws, regulations, contracts, or other requirements.
Consulting Services
Advisory and related client service activities, the nature and scope of which are agreed with the client, are intended to add value and improve an organization’s governance, risk management, and control processes without the internal auditor assuming management responsibility. Examples include counsel, advice, facilitation, and training.
Control
Any action taken by management, the board, and other parties to manage risk and increase the likelihood that established objectives and goals will be achieved. Management plans, organizes, and directs the performance of sufficient actions to provide reasonable assurance that objectives and goals will be achieved.
Customer
The subsidiary, business unit, department, group, individual, or other es tablished subdivision of an organization that is the subject of a consulting engagement.
Engagement
A specific internal audit assignment, task, or review activity, such as an internal audit, control self-assessment review, fraud examination, or consultancy. An engagement may include multiple tasks or activities designed to accomplish a specific set of related objectives.
Enterprise Risk Management — See Risk Management
External Auditor
A registered public accounting firm, hired by the organization’s board or executive management, to perform a financial statement audit provid ing assurance for which the firm issues a written attestation report that expresses an opinion about whether the financial statements are fairly presented in accordance with applicable Generally Accepted Accounting Principles.
Framework
A body of guiding principles that form a template against which organi zations can evaluate a multitude of business practices. These principles are comprised of various concepts, values, assumptions, and practices intended to provide a yardstick against which an organization can assess or evaluate a particular structure, process, or environment or a group of practices or procedures.
Fraud
Any illegal act characterized by deceit, concealment, or violation of trust. These acts are not dependent upon the threat of violence or physical force. Frauds are perpetrated by parties and organizations
Measuring Internal Auditing’s Value
58 A Component of the CBOK Study

to obtain money, property, or services; to avoid payment or loss of services; or to secure personal or business advantage.
Governance
The combination of processes and structures implemented by the board to inform, direct, manage, and monitor the activities of the organization toward the achievement of its objectives.
Independence
The freedom from conditions that threaten objectivity or the appearance of objectivity. Such threats to objectivity must be managed at the individual auditor, engagement, functional, and organizational levels.
Internal Audit Activity
A department, division, team of consultants, or other practitioner(s) that provides independent, objective assurance and consulting services designed to add value and improve an organization’s operations. The internal audit activity helps an organization accomplish its objectives by bringing a systematic, disciplined approach to evaluate and improve the effectiveness of governance, risk management, and control processes.
Internal Audit Charter
The internal audit charter is a formal document that defines the internal audit activity’s purpose, authority, and responsibility. The internal audit charter establishes the internal audit activity’s position within the organization; authorizes access to records, personnel, and physical properties relevant to the performance of engagements; and defines the scope of internal audit activities.
Internal Control
A process, effected by an entity’s board of directors, management, and other personnel, designed to provide reasonable assurance regarding the achievement of objectives in the following categories:
�� Effectiveness and efficiency of operations.�� Reliability of financial reporting.�� Compliance with applicable laws and regulations.
International Professional Practices Framework
The conceptual framework that organizes the authoritative guidance promulgated by The IIA. Authoritative Guidance is comprised of two categories — (1) mandatory and (2) strongly recommended.
IT/ICT
Information technology/information communication technology.
Monitoring
A process that assesses the presence and functioning of governance, risk management, and control over time.
59A Component of the CBOK Study
The IIA’s Global Internal Audit Survey — Glossary

Objectivity
An unbiased mental attitude that allows internal auditors to perform engagements in such a manner that they have an honest belief in their work product and that no significant quality compromises are made. Objectivity requires internal auditors not to subordinate their judgment on audit matters to others.
Risk
The possibility of an event occurring that will have an impact on the achievement of objectives. Risk is measured in terms of impact and likelihood.
Risk Assessment
The identification and analysis (typically in terms of impact and likelihood) of relevant risks to the achievement of an organization’s objectives, forming a basis for determining how the risks should be managed.
Risk Management
A process to identify, assess, manage, and control potential events or situations to provide reasonable assurance regarding the achievement of the organization’s objectives.
Service Provider
A person or firm, outside of the organization, who provides assurance and/or consulting services to an organization.
Standard
A professional pronouncement promulgated by the Internal Audit Standards Board that delineates the requirements for performing a broad range of internal audit activities, and for evaluating internal audit performance.
Strategy
Refers to how management plans to achieve the organization’s objectives.
Technology-based Audit Techniques
Any automated audit tool, such as generalized audit software, test data generators, computerized audit programs, specialized audit utilities, and computer-assisted audit techniques (CAATs).
Measuring Internal Auditing’s Value
60 A Component of the CBOK Study

The IIA Research Foundation Sponsor RecognitionThe vision of The IIA Research Foundation is to understand, shape, and advance the global profession of internal auditing by initiating and sponsoring intelligence gathering, innovative research, and knowledge-sharing in a timely manner. As a separate, tax-exempt organization, The Foundation does not receive funding from IIA membership dues but depends on contributions from individuals and organizations, and from IIA chapters and institutes, to move our programs forward. We also would not be able to function without our valuable volunteers. To that end, we thank the following:
The William G. Bishop III, CIA, Memorial Fund
DIAMOND LEVELThe Institute of Internal Auditors (IIA)
EMERALD LEVELWilliam L. Taylor
IIA–Central Illinois ChapterIIA–Dallas Chapter
IIA–New York Chapter
RUBY LEVELJewel and Dennis K. Beran, CIA, CCSA
Mary BishopJohn J. Flaherty, CIA
Anthony J. Ridley, CIAPatricia E. Scipio, CIA
IIA–Dallas ChapterIIA–New York ChapterIIA–Palmetto Chapter
IIA–Pittsburgh ChapterIIA–Washington, DC Chapter
FRIEND LEVELAndrew J. Dahle, CIA
John M. Polarinakis, CIAIIA–Downeast Maine Chapter
IIA–Madison ChapterIIA–Phoenix Chapter
IIA–Triad ChapterIIA–Wichita Chapter
DONOR LEVELAbdulrahman AlSughayer
Augusto BaetaAudley L. Bell, CIA
Jewel and Dennis K. Beran, CIA, CCSA Toby Bishop
LeRoy E. Bookal, CIAMahmood Al-Hassan Bukhari
Judith K. Burke, CCSARichard F. Chambers, CIA, CCSA, CGAP
Michael J. CorcoranNicolette Creatore
Julia Ann Disner, CIA, CFSAEdward M. Dudley, CIA
Gaston L. Gianni, Jr., CGAPStephen D. Goepfert, CIAAl and Kendra Holzinger
Cynthia HuysmanHoward J. Johnson, CIAThomas A. Johnson, CIA
Claude JosephNathania Kasman
Carman L. Lapointe, CIA, CCSAJens Lay
Lorna LintonSusan B. Lione, CIA, CCSA, CFSA, CGAP
Mary LueckemeyerDavid J. MacCabe, CIA, CGAP
Stacy Mantzaris, CIA, CCSA, CGAP
61A Component of the CBOK Study

Robert John Serocki, CIA, CCSAHugh E. Spellman
Frederick H. Tesch, CIA, CFSAArchie R. Thomas, CIA
Don Trobaugh, CIA, CFSABonnie L. Ulmer
Dominique Vincenti, CIADouglas E. Ziegenfuss, PhD, CIA, CCSA
IIA–Baltimore ChapterIIA–El Paso Chapter
IIA–Nisqually ChapterIIA–Tallahassee ChapterOther Research Sponsors
Joseph P. McGinleyBetty L. McPhilimy, CIA
Guenther Meggeneder, CIAPatricia K. Miller, CIAAnthony Minor, CIA
James A. Molzahn, CIADonald J. Nelson, CIAFrank M. O’Brien, CIABasil H. Pflumm, CIA
David N. PolanskyCharity A. Prentice, CIA, CCSA, CGAP
Tabitha Price
Other Research Sponsors Research Sponsors
IIA–Chicago ChapterIIA–Houston Chapter
IIA NetherlandsIIA–Philadelphia Chapter
Principal PartnersStrategic Partners
ACL Services Ltd. CCH® TeamMate
PartnersCaseWare IDEA Inc. Ernst & Young LLP
PricewaterhouseCoopers, LLP
Visionary CircleThe Family of Lawrence B. Sawyer
Chairman’s Circle
Stephen D. Goepfert, CIAMichael J. Head, CIAPatricia E. Scipio, CIA
Paul J. Sobel, CIA
ExxonMobil CorporationItau Unibanco Holding SA
JCPenney CompanyLockheed Martin Corporation
Southern California Edison Company
Diamond DonorIIA–Central Ohio Chapter
IIA–New York ChapterIIA–San Jose Chapter
Measuring Internal Auditing’s Value
62 A Component of the CBOK Study

The IIA Research Foundation Board of TrusteesPresident: Patricia E. Scipio, CIA, PricewaterhouseCoopers LLP
Vice President-Strategy: Mark J. Pearson, CIA, Boise Inc.Vice President-Research: Philip E. Flora, CIA, CCSA, FloBiz & Associates, LLCVice President-Development: Wayne G. Moore, CIA, Wayne Moore Consulting
Treasurer: Stephen W. Minder, CIA, YCN Group LLCSecretary: Douglas Ziegenfuss, PhD, CIA, CCSA, Old Dominion University
Neil Aaron, The McGraw-Hill CompaniesRichard J. Anderson, CFSA, DePaul University
Urton L. Anderson, PhD, CIA, CCSA, CFSA, CGAP, University of Texas-AustinSten Bjelke, CIA, IIA Sweden
Michael J. Head, CIA, TD Ameritrade Holding CorporationJames A. LaTorre, PricewaterhouseCoopers LLP
Marjorie Maguire-Krupp, CIA, CFSA, Coastal Empire ConsultingLeen Paape, CIA, Nyenrode Business University
Jeffrey Perkins, CIA, TransUnion LLCEdward C. Pitts, Avago Technologies
Michael F. Pryal, CIA, Federal Signal CorporationLarry E. Rittenberg, PhD, CIA, University of Wisconsin
Carolyn Saint, CIA, Lowe’s Companies, Inc.Mark L. Salamasick, CIA, University of Texas at Dallas
Susan D. Ulrey, CIA, KPMG LLPJacqueline K. Wagner, CIA, Ernst & Young LLP
Shi Xian, Nanjing Audit University
63A Component of the CBOK Study

The IIA Research Foundation Committee of Research and Education AdvisorsChairman: Philip E. Flora, CIA, CCSA, FloBiz & Associates, LLC
Vice-chairman: Urton L. Anderson, PhD, CIA, CCSA, CFSA, CGAP, University of Texas-Austin
MembersGeorge R. Aldhizer III, PhD, CIA, Wake Forest University
Lalbahadur Balkaran, CIAKevin W. Barthold, CPA, City of San Antonio
Thomas J. Beirne, CFSA, The AES CorporationAudley L. Bell, CIA, Habitat for Humanity International
Toby Bishop, Deloitte FAS LLPSezer Bozkus, CIA, CFSA, KPMG LLP
John K. Brackett, CFSA, RSM McGladrey, Inc.Adil S. Buhariwalla, CIA, Emirates Airlines
Thomas J. Clooney, CIA, CCSA, KPMG LLPJean Coroller
Mary Christine Dobrovich, Jefferson Wells InternationalSusan Page Driver, CIA, Texas General Land OfficeDonald A. Espersen, CIA, despersen & associates
Randall R. Fernandez, CIA, C-Force, Inc.John C. Gazlay, CPA, CCSA
Dan B. Gould, CIAUlrich Hahn, CIA, CCSA, CGAP
John C. Harris, CIA, Aspen Holdings/FirstComp Insurance CompanySabrina B. Hearn, CIA, University of Alabama System
Katherine E. Homer, Ernst & Young LLPPeter M. Hughes, PhD, CIA, Orange County
David J. MacCabe, CIA, CGAPGary R. McGuire, CIA, Lennox International Inc.
John D. McLaughlin, LECG, LLCSteven S. Mezzio, CIA, CCSA, CFSA, Resources Global Professionals
Deborah L. Munoz, CIA, CalPortland CompanyFrank M. O’Brien, CIA, Olin Corporation
Michael L. Piazza, Professional Development InstituteAmy Jane Prokopetz, CCSA, Farm Credit Canada
Mark R. Radde, CIA, Resources Global ProfessionalsVito Raimondi, CIA, Zurich Financial Services NA
Sandra W. Shelton, PhD, DePaul UniversityLinda Yanta, CIA, Eskom
64 A Component of the CBOK Study

Report III, Measuring Internal Auditing’s Value, is one of five deliverables of The IIA’s Global Internal Audit Survey: A Component of the CBOK Study. This is the most comprehensive study ever to capture current perspectives and opinions from a large cross-section of practicing internal auditors, internal audit service providers, and academics about the nature and scope of assurance and consulting activities on the profession’s status worldwide.
Measuring Internal Auditing’s Value identifies the value added to the organization by an internal audit activity and how different factors affect the perceived contribution of an
internal audit activity. The analysis is based on 13,582 responses of IIA members and nonmembers in more than 107 countries.
Other reports in this series are:
Characteristics of an Internal Audit Activity
Core Competencies for Today’s Internal Auditor
What’s Next for Internal Auditing?
Imperatives for Change: The IIA’s Global Internal Audit Survey in Action
This project was made possible through the generous donations made to the
William G. Bishop III, CIA, Memorial Fund
Measuring Internal Auditing’s Value
THE IIA’S GLOBAL INTERNAL AUDIT SURVEY
978-0-89413-698-6
Item No. 5010.3US $25 IIA MembersUS $45 Nonmembers
Measuring Internal Auditing’s Value
THE IIA’S GLOBAL INTERNAL AUDIT SURVEY
A Component of the CBoK Study
Measuring Internal A
uditing’s Value