Embed Size (px)
Citation preview

The Idaho Growth ModelChanging Conversations about Education
www.schoolview.org
Richard J. Wenning & Damian W. Betebenner
[email protected] Center for Assessmentwww.twitter.com/rwenning Dover, New Hampshire

2
Accountability Complexity
• Accountability for educator effectiveness now layered onto systems for student, school, district, state and federal accountability
• Better when these multiple layers are aligned to support the business we are in

3
What Business Are We In?
• Maximize student progress toward college and career readiness– Implies new bright line: all kids ready by exit– Requires a definition of readiness and the
standards leading there – Requires measurement system that determines
how well students are progressing toward and reaching the destination

4
Policy Perspective on Growth• Why is measuring student growth so
important?– NCLB (Accountability 1.0) had right intent but…
• AYP metric not useful for school performance management
• Incentives focused on short-term increases in percent proficient, on “bubble” kids, invited moral hazard
• Instead of long-term effectiveness and progress for all kids toward college & career readiness
– ESEA waivers & reauthorization provides opportunity to get the measures & incentives right

5
Desired Level of Performance?
• Dramatic, not incremental improvements required for students that need to catch up to become college and career ready
• Implies that our accountability systems should should provide information that fuels a consensus for change and capacity for improvement

6
Desired System: Accountability 2.0
• Coherent system focused on learning and building student, educator, school, district, state and federal performance management capacity. – Maximize local ownership of high quality
information to drive insight and action• We should ensure educator effectiveness
conversation not stuck in Accountability 1.0

7
Designing a Coherent System for Performance Management

8
What Models?
• What statistical models of longitudinal student growth will promote the most coherence and alignment in our accountability system?

9
Some Framing Ideas• We understand best those things we see
emerge from their very beginnings. --Aristotle
• All Models are wrong but some are useful. --George E. P. Box
• It is better to have an approximate answer to the right question than a precise answer to the wrong question.
--John Tukey
10
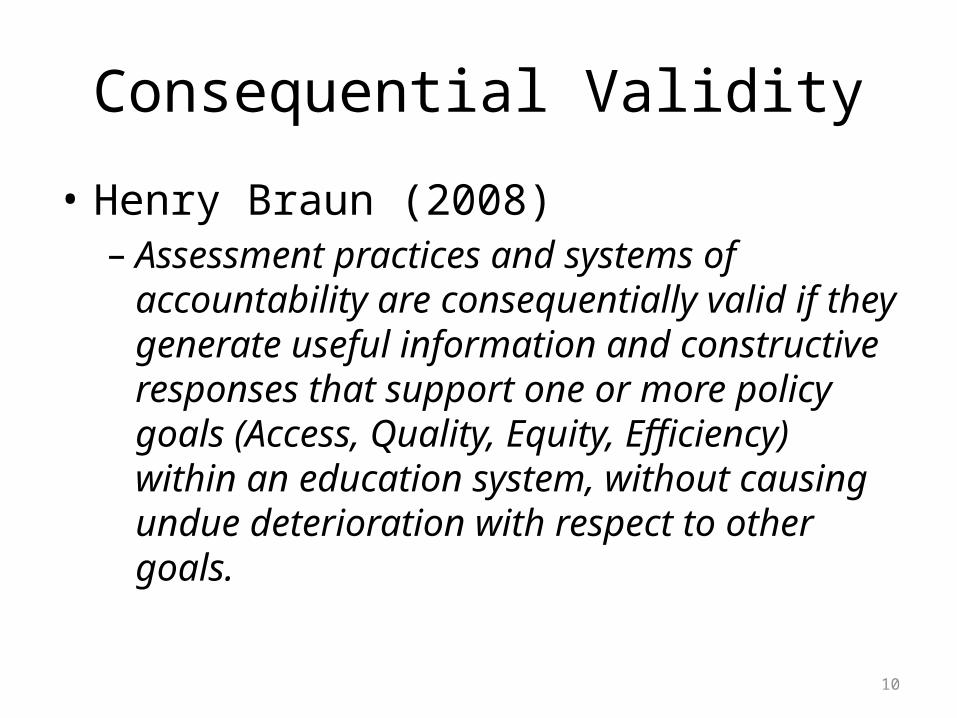
Consequential Validity
• Henry Braun (2008)– Assessment practices and systems of
accountability are consequentially valid if they generate useful information and constructive responses that support one or more policy goals (Access, Quality, Equity, Efficiency) within an education system, without causing undue deterioration with respect to other goals.

Marshaling a Consensus for Change“This is the difference between a retrospective question of identifying fault as opposed to a prospective strategy to engineer some corrective measure, almost independent of considering whether there was blame-worthiness. And to move away from the blame-worthiness paradigm toward something that is more regulatory in nature where onemight seize upon disparities or circumstances that are for some reason deemed unacceptable and engineer the interventions needed to bring about the necessary change.. . . It’s the no-fault gap closing strategy in which the effort is to build a consensus about a vision of an improved society rather than figure out where’s the person we want to pillory.”
Christopher Edley (2006)

12
Questions Set the Table
• Growth models address specific questions– Different techniques are good at answering
different questions– Different questions lead to different conversations
which lead to different uses and outcomes– Starting with the right questions simplifies
development and motivates the proper use of the growth model results

13
Policy Q’s: Educator Effectiveness• What questions do we want to answer about growth
rates of students associated with educators?– What matters and when? Student growth rates as
evidence of effectiveness or ineffectiveness?
• How many categories of effectiveness and ineffectiveness are important?– Which categories are consequential and for what?
• What body of evidence will be used to evaluate and infer teacher value-added?
• Normative and criterion-referenced growth?

14
How much growth did a studentmake and is it enough?
• Describing growth versus ascribing responsibility– The Colorado Growth Model began by separating the
description of growth from discussions of responsibility/ accountability
– Incorporating growth into accountability followed from the accepted description of growth
– The description of growth facilitated stakeholder engagement and investigations of responsibility for good/bad growth
– That in turn led to greater stakeholder support for particular forms of accountability

15
Describing Student Growth• Discussing student growth, even with a vertical scale,
is not a simple task• Growth and change require context. Consider, for
example, height:– A child might grow 4 inches between ages 3 and 4
• 4 inches is a well understood quantity
– The 4 inch increase becomes meaningful only when understood alongside the growth of other 3 to 4 year olds
• Student growth percentiles were developed to provide a norm-referenced basis for describing student growth

16
Who/What is Responsible for Student Growth?
• Some analyses of student growth attempt to determine the amount of student progress that can be attributed to the school or teacher– Called value-added analyses, these techniques attempt to
estimate the teacher/school contribution to student academic growth
• Value added is an inference – a causal conclusion drawn from the data
• All growth models can be used for value-added purposes

17
Colorado Growth Model Asks…
What is?
What should be?
What could be?
How much growth did a child make in one year?
How much growth is enough to reach college & career readiness?
How much growth have other students made with the same starting point?

18
Student Growth Percentiles• Should we be surprised with a child’s current achievement given
their prior achievement?– Student growth percentiles answer this question
• Consider a low achieving student with 90th percentile growth and a high achieving student with 10th percentile growth– The low achieving student grew at a rate exceeding 90 percent of similar
students– The high achieving student grew at a rate exceeding just 10 percent of
similar students– The low achiever’s growth is more exemplary (probabilistically) than the
high achiever’s
• Judgments about the adequacy of student growth require external criteria together with standard setting

19
Establishing Growth Standards Based Upon Growth Norms
• The most common adequacy criterion is judging growth toward an achievement goal (i.e., growth-to-standard)
• Results from student growth percentile analyses can be used to calculate percentile growth trajectories for each student
• These trajectories indicate what future rates of growth will lead to and are used to make adequacy judgments
• This growth-to-standard approach was approved as part of Colorado’s successful application to the Growth Model Pilot Program

20
Understanding Student Growth PercentilesAcademic
Peers
=StudentGrowth
Percentile
What is Student Adequate Growth Percentile (AGP)?
+ +Distance to or from Proficiency
3 Years orBy Grade 10* =Adequate
Growth Percentile
+My prior CSAPAchievement
Prior Year CSAP Achievement
My Growth Compared to My Academic Peers
My Prior CSAPAchievement
Low
Typical
High
*Whichever comes first.
( )

21

22
One Student’s Growth Percentiles

23
Students in a Grade in a School

24
Views of Schools within a District

25

26
View of Districts


29
15 States with MOU• 15 states have signed MOU to use the Colorado
Growth Model growth percentile methodology and SchoolView display tools:– Arizona, Colorado, Georgia, Indiana, Kansas,
Massachusetts, Missouri, Nevada, New Hampshire, New York, Rhode Island, Virginia, Washington, West Virginia, Wisconsin
• Pursue cloud-based analytics and visualizations• Creative Commons Share Alike Noncommercial
Use: http://creativecommons.org/licenses/

30
Colorado Growth Model Shows…• Growth not correlated with how close a student is
to proficient
• Normative growth gaps narrowing among student groups
• Most low achieving students not growing fast enough to catch up
• Many proficient students not keeping up
• Many high achieving schools show low growth and many low achieving schools show high growth

0
1
2
3
4
5
6
7
8
9
10
2004 2005 2006 2007 2008 2009 2010
Gap
in M
GP
Growth Gaps in Reading Closing over Time
Black-White Gap
Hispanic-White Gap
FRL-Non FRL Gap

0
1
2
3
4
5
6
7
8
9
10
2004 2005 2006 2007 2008 2009 2010
Gap
in M
GP
Growth Gaps in Math Closing over Time
Black-White Gap
Hispanic-White Gap
FRL-Non FRL Gap


2004 2005 2006 2007 2008 2009 20100
102030405060708090
Percentage of Students Growing Enough to Catch Up and Keep Up in Reading
Non-FRLFRL
% o
f All
Stud
ents
Keeping Up
Catching Up

010203040506070
2004 2005 2006 2007 2008 2009 2010
% o
f A
ll St
ud
ents
Percentage of Students Growing Enough to Catch Up and Keep Up in Math
Non-FRL
FRL
Keeping Up
Catching Up