Embed Size (px)
Citation preview

1
The IDA cell separation pathway connects developmental and defense responses
Vilde Olsson1, Elwira Smakowska-Luzan2§, Maike Breiden3§, Peter Marhavy4, Rebecca
Schneeweiss2, Youssef Belkhadir2, Rüdiger Simon3 and Melinka A. Butenko1*
1Section for Genetics and Evolutionary Biology, Department of Biosciences, University of Oslo, 0316
Oslo, Norway
2Gregor Mendel Institute (GMI), Austrian Academy of Sciences, Vienna Biocenter (VBC), Dr Bohr-
Gasse 3, 1030 Vienna, Austria
3Institute for Developmental Genetics and Cluster of Excellence on Plant Sciences, Heinrich Heine
University, Universitätsstraße 1, 40225 Düsseldorf, Germany
4Department of Plant Molecular Biology, University of Lausanne, 1015 Lausanne, Switzerland
§Equal contribution
*Corresponding author; email: [email protected]
.CC-BY-NC-ND 4.0 International licensewas not certified by peer review) is the author/funder. It is made available under aThe copyright holder for this preprint (whichthis version posted September 8, 2019. . https://doi.org/10.1101/761346doi: bioRxiv preprint

2
Abstract
The abscission of floral organs and emergence of lateral roots in Arabidopsis is regulated by the
peptide ligand INFLORESCENCE DEFICIENT IN ABSCISSION (IDA) and the receptor protein
kinases HAESA (HAE), HAESA-LIKE 2 (HSL2) and members of the SOMATIC
EMBRYOGENESIS RECEPTOR KINASE (SERK) family. These cell separation processes lead to
induction of defense-associated genes to protect against pathogen invasion. However, the molecular
coordination between abscission and immunity has not been thoroughly explored. Here we show that
IDA induces a receptor-dependent release of cytosolic calcium and an extracellular release of reactive
oxygen species which are signatures of defense responses. IDA promotes heteromerization between
HSL2 and RECEPTOR LIKE KINASE 7 (RLK7), a receptor that enhances immunity and pathogen
responses, and utilizes this novel signaling module to regulate the expression of defense-associated
genes. We propose a molecular mechanism by which IDA drives specific immune response in cells
destined for separation to guard them from pathogen attack.
Introduction
In plants, organ separation or abscission, involves cell separation between specialized abscission zone
(AZ) cells and enables the removal of unwanted or diseased organs in response to endogenous
developmental cues or environmental stimuli. Precise cell separation is also essential during plant
development and growth, including emergence of new lateral root (LR) primordia, root cap
sloughing, formation of stomata and radicle emergence during germination 1. In Arabidopsis thaliana
(Arabidopsis), a peptide mediated signaling system ensures the correct spatial and temporal
abscission of sepals, petals and stamens. Floral organ abscission is regulated by the genetically
redundant receptor protein kinases HAESA (HAE) and HAESA-LIKE 2 (HSL2) that bind the
secreted INFLORESCENCE DEFICIENT in ABSCISSION (IDA) peptide promoting receptor
association with members of the co-receptor SOMATIC EMBRYOGENESIS RECEPTOR KINASE
(SERK) family 2-5. Plants carrying mutations in both the HAE and HSL2 genes, the IDA gene or higher
order combinations of the SERK genes fail to activate an intracellular signaling pathway including a
mitogen-activated protein kinase (MAPK) cascade and members of the transcription factor family
KNOTTED-LIKE FROM ARABIDOPSIS THALIANA (KNAT) 2,3,6. A deficiency in the IDA
signaling pathway impedes the expression of genes encoding secreted cell wall remodeling and
hydrolase enzymes thus hindering floral organs to abscise 2,3,5,7-10. Interestingly, like for other signal
transduction pathways where phylogenetically related families of peptides and receptors regulate
similar developmental processes, components of the IDA signaling system control different cell
separation events during Arabidopsis development. IDA signaling through HAE and HSL2 regulates
.CC-BY-NC-ND 4.0 International licensewas not certified by peer review) is the author/funder. It is made available under aThe copyright holder for this preprint (whichthis version posted September 8, 2019. . https://doi.org/10.1101/761346doi: bioRxiv preprint
3
cell wall remodeling genes in the endodermal, cortical and epidermal tissues overlaying the LR
primordia during LR emergence 8. In addition, IDA-LIKE 1 (IDL1), one of the eight members in the
IDL peptide family 11 that shares a conserved C-terminal domain which in IDA is processed to a
functional 14 amino acid hydroxylated peptide 12,13, signals through HSL2 to regulate cell separation
during root cap sloughing 14.
Plant cell walls act as physical barriers against pathogenic invaders and as thus the cell-wall
processing and remodeling that occurs during abscission and other cell separation events provides an
entry point for phytopathogens 15. Indeed it has been shown that AZ cells undergoing cell separation
express defense genes that have altered expression in the hae hsl2 mutant and it has been proposed
that they function in protecting the AZ from infection after abscission has occurred 9,16. As such,
mediators of cell-wall alteration during plant development could have an effect on plant pathogenicity
and substantiating this, it has been shown that pathogenic bacteria utilize components of the
abscission signaling pathway to induce pectin degrading enzymes and ease Arabidopsis rosette leaf
colonization 17. Furthermore, plants can contain bacterial infection by shedding diseased organs 18,19.
and in Arabidopsis, cauline leaves infected with Pseudomonas syringae are abscised by utilizing the
same signaling pathway that regulates floral organ abscission 19.
From the induction of defense related genes during abscission to the use of abscission regulating
signals to inhibit bacterial infections, it is apparent that there is a tight interplay between plant defense
and abscission. We sought to understand how plant defense programs are unfolded against the
backdrop of coordinated cell separation events and found that IDA modulates plant immune
signaling. Here, we report that a range of biotic and abiotic signals can induce IDA expression. We
demonstrate that IDA is able to activate an arm of the plant immune system that involves the detection
of microbe‐/danger‐associated molecular patterns (MAMPs/DAMPs). This effect is modulated by
HSL2 and RECEPTOR-LIKE KINASE 7 (RLK7). Finally, we establish that IDA promotes a direct
physical interaction between RLK7 and HSL2. Thus, plants utilize IDA-mediated signaling to
coordinate distinct, yet intertwined, cellular functions. We propose that the IDA peptide originally
played a more general function in plant innate immunity and later developed a specified role in
regulating cell separation and in protection of exposed cells during the abscission process.
Results
Expression of IDA in response to abiotic and biotic stresses
Transgenic plants containing the -glucuronidase (GUS) gene under the control of the IDA promoter
(pIDA:GUS) have previously been reported to exhibit GUS expression in AZ tissue at stages of flower
development where there is weakening of the cell walls of AZ cells and in cells overlaying newly
.CC-BY-NC-ND 4.0 International licensewas not certified by peer review) is the author/funder. It is made available under aThe copyright holder for this preprint (whichthis version posted September 8, 2019. . https://doi.org/10.1101/761346doi: bioRxiv preprint

4
formed LR primordia 7,8. To investigate the expression of the IDA gene in response to MAMPs
pIDA:GUS seedlings were exposed to the bacterial derived epitope flg22 and fungal chitin. Compared
to the control seedlings, the seedlings exposed to MAMPs showed a marked increase in GUS
expression (Fig. 1a and Supplementary Fig. 1a). As described earlier 8, the GUS signal in seedlings
grown on untreated media was observed in epidermal and cortical cells covering the LR primordia
during the emergence of a new LR (Fig. 1a and Supplementary Fig. 1a); while in flg22 and chitin
treated seedlings the intensity of the GUS signal was enhanced (Fig. 1a and Supplementary Fig. 1a).
To determine the activity of GUS, 4-methylumbelliferyl β-D-glucuronide (4-MUG) was used as a
substrate. Upon 4-MUG hydrolysis by GUS the fluorochrome 4-methyl umbelliferone (4-MU) is
produced and can be quantified by the emitted fluorescence 20. Untreated, flg22 treated and chitin
treated pIDA:GUS seedlings were incubated with 4-MUG and the fluorescence emitted by 4-MU was
measured and normalised per sample. A significant increase in fluorescence was observed for flg22
and chitin treated samples compared to the untreated control, verifying the observed enhancement of
GUS signal in the micrographs (Fig. 1b and Supplementary Fig. 1b).
Immune signaling in plants in response to flg22 is initiated by the activation of the FLAGELLIN-
SENSITIVE 2 (FLS2) receptor upon peptide perception 21,22. flg22 treatment of pIDA:GUS seedlings
in the fls2 mutant background compared to untreated pIDA:GUS fls2 seedlings showed no significant
difference in GUS activity (Fig. 1a,b) indicating that the flg22 induced IDA expression is FLS2
dependent. Interestingly, PIP1, an endogenous DAMP peptide known to amplify the immune
response triggered by flg22 and pathogen resistance through RLK7 23, could also significantly induce
pIDA:GUS expression; while the inactive IDA peptide, IDAΔN69 4,12, did not (Fig. 1a,b). As for flg22,
the PIP1 induced IDA expression was dependent on the peptide being perceived by its cognate
receptor as no enhancement of pIDA:GUS expression was detected in PIP1 treated pIDA:GUS rlk7
seedlings (Fig. 1a,b).
Spatial IDA expression was also monitored upon induced abiotic stress. When pIDA:GUS seedling
were treated with the osmotic agent mannitol or exposed to salt stress by NaCl, a similar significant
increment in GUS signal was observed as for seedlings subjected to biotic stimuli (Supplementary
Fig. 1a,b). As both mannitol and NaCl lower the water potential of the medium they simulate what
happens in drying soil. Under normal growing conditions Arabidopsis does not display cauline leaf
abscission, however, when experiencing drought followed by re-watering, cauline leaf abscission is
triggered concurrent with an increase in IDA transcript levels in the leaf AZs 24. Given that abiotic
stress induces abscission in Arabidopsis it is conceivable that biotic effectors like flg22 induce IDA
expression as a requisite for pathogen triggered cell separation; alternatively increased IDA levels
.CC-BY-NC-ND 4.0 International licensewas not certified by peer review) is the author/funder. It is made available under aThe copyright holder for this preprint (whichthis version posted September 8, 2019. . https://doi.org/10.1101/761346doi: bioRxiv preprint

5
could trigger a defense response. To explore this avenue further the role of the IDA peptide in plant
immunity was investigated.
mIDA triggers expression of defense-associated marker genes associated with innate immunity
Transcriptional reprogramming mostly mediated by WRKY transcription factors takes place during
MAMP-triggered immunity (MTI) and is essential to mount an appropriate host defense response 25.
The expression of MYB51, a WRKY target gene, has previously been shown to increase in response
to flg22 26 resulting in biosynthesis of the secondary metabolite indolic glucosinolates which plays a
role in defense. To investigate whether IDA could regulate a similar set of genes induced by flg22 we
looked at roots expressing the promoter-driven nuclear localized YFP lines of MYB51
(pMYB51:YFPN) 27 treated with a highly active synthetic IDA peptide 12 (from here on referred to as
mIDA). The fluorescent signal of the reporter was analyzed in the root tip/meristematic zone and an
enhanced expression of MYB51 was predominantly detected in the meristematic zone after 7 hours
(h) of mIDA treatment compared to a non-treated control (Fig. 1c). Fluorescent nuclei were also
detected in the root tip and LR cap in response to mIDA (Fig. 1c). RT-qPCR experiments from 7
days-old seedlings treated with mIDA confirmed the mIDA induced expression of pMYB51:YFPN
with significantly higher levels of expression after 1 and 12 h when compared to untreated tissue (Fig.
1d). Moreover, comparison of mIDA induction with the elicitor-triggered response of pMYB51:YFPN
to flg22 showed similar temporal expression in the root (Supplementary Fig. 2). To further explore
the role of mIDA as an inducer of immunity we selected well-established defense-associated marker
genes and analyzed the ability of mIDA to induce the expression of FLG22-INDUCED RECEPTOR-
LIKE KINASE1 (FRK1), a specific and early immune-responsive gene activated by multiple MAMPs
28,29, the endogenous danger peptide ELICITOR PEPTIDE 3 (PEP3) 30 and WRKY33, a key
transcriptional regulator of defense responses 25,31 by RT-qPCR. Seven days-old Col-0 wild-type
(WT) seedlings treated with mIDA had elevated expression levels of FRK1 and PEP3 compared to
untreated control samples (Fig. 1d). In accordance with previous reports, where the expression of
FRK1 and PEP3 was monitored in response to bacterial elicitors 29,30, the significant increase of
expression was rapid and observed already after 1 h of mIDA treatment (Fig. 1d). After 12 h, FRK1
expression in mIDA treated tissue was not significantly different from expression in untreated tissue;
while PEP3 expression in mIDA treated tissue remained elevated after 12 h but was significantly
lower than the expression detected after 1 h of mIDA treatment (Fig. 1 d). The expression of WRKY33,
a defense gene known to be required for resistance towards necrotrophs, was not increased in mIDA
treated seedlings after 1 h but showed a 2-fold increase when compared to untreated tissue after 12 h
(Fig. 1 d). The temporal delay in induction of WRKY33 compared to FRK1 and PEP3 is comparable
.CC-BY-NC-ND 4.0 International licensewas not certified by peer review) is the author/funder. It is made available under aThe copyright holder for this preprint (whichthis version posted September 8, 2019. . https://doi.org/10.1101/761346doi: bioRxiv preprint

6
to previous reports for leaf samples inoculated with Botrytis cinerea 31. Together, these data show
that IDA can trigger a rapid, albeit transient increase in the expression of key defense genes.
mIDA triggers defense-associated cellular responses
Next we sought to address whether IDA could induce cellular responses associated with early MTI
events. In addition to the transcriptional reprogramming associated with MTI, the rapid production
of reactive oxygen species (ROS) burst and the elevation of cytosolic calcium-ion concentrations
([Ca2+]cyt) is a conserved signaling output in immunity across kingdoms 32,33. To test the ability of
mIDA to trigger an increase in [Ca2+]cyt and to study mIDA-induced Ca2+ dynamics we performed
Ca2+ imaging of 10 days-old roots expressing the cytosolic localized fluorescent Ca2+ sensor, R-
GECO1. We detected a clear increase in [Ca2+]cyt after application of 1 μM mIDA (Fig. 2a,b and
Movie 1). Regions of interest (ROIs) along the whole root were analyzed for signal intensity values
and revealed that the Ca2+ signal was composed of two main waves. The signal initiated in the root
meristematic zone from where it spread toward the elongation zone and root tip, a second wave was
observed in the meristematic zone continuing with Ca2+ spikes (Fig. 2b and Movie 1). The signal
amplitude was at maximum within the elongation zone and decreased as the signal spread (Fig. 2a,b
and Movie 1). Interestingly, when comparing the Ca2+ dynamics in mIDA treated roots to those
treated with flg22 we observed striking differences in the onset and distribution of the Ca2+ signal.
Analysis of roots treated with 1 μM flg22 showed that the Ca2+ signal initiated in the root elongation
zone from where it spread toward the meristematic zone as a single wave and that the signal amplitude
was at maximum within the elongation zone and decreased as the signal spread (Supplementary Fig.
3a,b and Movie 2). The spatial onset of the Ca2+ response in mIDA treated roots correlated with the
spatial expression pattern of pMYB51:YFPN in mIDA treated roots (Fig. 1c) which differed from that
previously reported for the flg22 elicited response 27. These observations indicate differences in tissue
specificity of immune responses between mIDA and flg22 which are likely to depend on the cellular
distribution of their cognate receptors. Indeed, when investigating the promoter activity of the HAE
and HSL2 receptors by cloning the promoters fused to the nuclear localized YFP-derived fluorophore
Venus protein (pHAE:Venus-H2B and pHSL2:Venus-H2B) we observed fluorescent nuclei in the
lateral root cap, root tip and root meristem in pHSL2:Venus-H2B lines and in the epidermis and stele
of the elongation zone in pHAE:Venus-H2B lines (Fig. 2c). This Indicated that the mIDA induced
[Ca2+]cyt was dependent on receptors known to bind IDA 3,4,12,.
To investigate the mIDA dependency of HAE and HSL2 for [Ca2+]cyt increase a cytosolic localized
Aequorin-based luminescence Ca2+ sensor (Aeq) was introduced into the hae hsl2 mutant background.
The Aeq sensor was chosen due to transgene silencing of the R-GECO1 reporter in hae hsl2. The
.CC-BY-NC-ND 4.0 International licensewas not certified by peer review) is the author/funder. It is made available under aThe copyright holder for this preprint (whichthis version posted September 8, 2019. . https://doi.org/10.1101/761346doi: bioRxiv preprint

7
mIDA triggered increase in [Ca2+]cyt was completely abolished in hae hsl2 Aeq seedlings compared
to Aeq expressing seedlings (Fig. 2d), indicating that the response observed is receptor dependent.
The mIDA dependent increase in [Ca2+]cyt was also peptide dose-dependent with a half-maximal
efficient concentration (EC50) of 500 nM (Supplementary Fig. 4). To explore whether an increase in
[Ca2+]cyt could also be triggered in response to mIDA in flowers, we monitored [Ca2+]cyt changes in
flowers expressing the Aeq sensor at different developmental stages (Fig. 2e). Interestingly, only
flowers at a the stage where there is an initial weakening of the cell walls of AZ cells showed an
increase in [Ca2+]cyt. Flowers treated with mIDA prior to cell wall loosening showed no increase in
luminescence (Supplementary Fig. 5a,b), indicating that the mIDA triggered Ca2+ release in flowers
correlates with the onset of the abscission process and the increase in HAE and HSL2 expression at
the AZ 34.
ROS production is tightly connected to increased [Ca2+]cyt as Ca2+ partially activates members of the
NOX family of NADPH oxidases (RBOHs) which are key producers of ROS 32. We have previously
shown that mIDA elicits the production of a ROS burst in Nicotiana benthamiana (N.benthamiana)
leaves transiently expressing HAE or HSL2 12. To investigate whether mIDA could also elicit a ROS
burst in Arabidopsis, a luminol-dependent ROS assay on hae hsl2 mutant rosette leaves expressing a
functional full-length HAE receptor with a YFP fluorescent tag from a constitutive cauliflower
mosaic virus (CaMV) 35S promoter and a YFP fluorescent tag (35S:HAE-YFP) (Supplementary Fig.
6a,b) was used. hae hsl2 35S:HAE-YFP leaf discs treated with mIDA emitted extracellular ROS
whereas the response was not observed in WT leaves (Fig. 2f). Furthermore, by staining WT flowers
undergoing cell separation (position 6, see Supplementary Fig. 5a) with H2DCF-DA, a highly
fluorescent indicator for reactive oxygen intermediates in cells, we could detect a strong fluorescent
signal in AZ cells. The fluorescent signal was absent from AZ cells in hae hsl2 mutant flowers (Fig.
3a), indicating that the ROS production, like the [Ca2+]cyt increase, was receptor dependent.
Transcriptional data revealed that RBOHD and RBOHF are highly expressed in the floral AZs 16 and
we therefore set out to investigate if ROS production in AZ cells was dependent on RBOHD and
RBOHF and whether these NADPH oxidases were necessary for organ separation. The presence of
H2DCF-DA staining in the AZs and the normal floral abscission of rbohd rbohf mutant flowers
indicated that neither ROS production nor cell separation was dependent on RBOHD and RBOHF
(Fig. 3a,b). These results are in stark contrast to what has previously been reported, where cell
separation was shown to be dependent on RBOHD and RBOHF 35. Subtle differences in floral
abscission are difficult to detect and to unequivocally determine a difference in floral abscission
between a mutant and WT it is necessary to quantify the force needed to remove petals from the
receptacle of gradually older flowers along the inflorescence. This is performed by a stress transducer
.CC-BY-NC-ND 4.0 International licensewas not certified by peer review) is the author/funder. It is made available under aThe copyright holder for this preprint (whichthis version posted September 8, 2019. . https://doi.org/10.1101/761346doi: bioRxiv preprint

8
that measures the petal breakstrength (pBS) 5. To conclude whether RBOHD and RBOHF were
necessary for the abscission process we monitored floral organ abscission in rbohd rbohf mutants by
pBS. Measurements showed that at the stage where initial cell wall remodeling and a marked
reduction in pBS is seen in WT plants (floral position 5, see Supplementary Fig. 5a) 7, there was a
significant lower value for the rbohd rbohf mutant than WT, indicating premature cell wall loosening
(Fig. 3c). Furthermore, rbohd rbohf mutant petals abscised one position earlier than WT as it was not
possible to measure the pBS of rbohd rbohf mutant petals at position 6 (Fig. 3c). Different T-DNA
alleles of RBOHD and RBOHF were crossed and phenotypical investigation of double mutants did
not show any plants with a delay in abscission (Supplementary Fig. 7). In conclusion, we found no
RBOHD and RBOHF dependency for cell separation during floral abscission or for ROS production,
indicating that other RBOHs or peroxidases are responsible for the HAE HSL2 dependent ROS
release in AZs. The ROS production detected by H2DCF-DA staining in the rbohd rbohf mutant
flowers (Fig. 3a) is independent from the RBOHD and F-dependent lignification in AZs 35 and we
suggest that this ROS burst may play a role in defense.
Receptors associated with innate immunity are expressed in cells undergoing cell separation
Given that PIP1 and flg22 induce IDA expression by signaling through their cognate receptors RLK7
and FLS2, respectively (Fig. 1a,b) we investigated the promoter activity of these receptors in tissues
where IDA and IDL peptides regulate cell separation and compared it to that of HAE and HSL2. The
promoters were cloned and fused to the nuclear localized YFP-derived fluorophore Venus protein
(pRECEPTOR:Venus-H2B). The nuclear localization facilitates the cell-specific detection of the
fluorescent signal and to analyse the expression pattern of pRLK7:Venus-H2B, pHSL2:Venus-H2B,
pHAE:Venus-H2B and pFLS2:Venus-H2B during LR emergence, roots from 7 days-old seedlings
were stained with propidium iodide and investigated using a confocal laser scanning microscope. As
reported previously, promoter activity was detected for HSL2 and HAE in cells at the base of the LR
during LR emergence and the promoter of HSL2 had prominent activity in the LRP (Fig. 4a). Both
the promoters of RLK7 and FLS2 were active in cells surrounding the LRP (Fig. 4a), where also IDA
is expressed (Fig. 1a). In the root tip, fluorescent nuclei could be observed in the LR cap for
pRLK7:Venus-H2B and pHSL2:Venus-H2B lines, while no fluorescent nuclei were observed for
pHAE:Venus-H2B or pFLS2:Venus-H2B lines (Fig. 2c and supplementary Fig. 8).
In Arabidopsis, floral organ abscission occurs shortly after anthesis and in WT plants the organs
abscise at position 7 (counted from the first flower with visible white petals at the top of the
inflorescence, see Supplementary Fig. 5a) 5. The promoter activity of the receptors in AZ cells
undergoing cell separation was investigated in flowers at position 6 by removing the floral organs.
.CC-BY-NC-ND 4.0 International licensewas not certified by peer review) is the author/funder. It is made available under aThe copyright holder for this preprint (whichthis version posted September 8, 2019. . https://doi.org/10.1101/761346doi: bioRxiv preprint

9
Fluorescent nuclei could be observed in the petal, sepal and anther AZs for all pRECEPTOR:Venus-
H2B lines (Fig. 4b), however, pRLK7:Venus-H2B and pFLS2:Venus-H2B lines had a broader
expression pattern than pHAE:Venus-H2B and pHSL2:Venus-H2B lines, showing fluorescent nuclei
in the carpels and the receptacle in addition to the AZs (Fig. 4b).
HSL2 interaction with RLK7 is modulated by the presence of mIDA and PIP1.
The HAE and HSL2 receptors have been shown to be important for Pseudomonas syringae induced
cauline leaf abscission in that hae hsl2 mutant plants retain their leaves when exposed to the bacterial
pathogen 19. However, during drought induced leaf abscission the presence of a functional HAE, but
not HSL2 receptor is necessary; indicating that HAE and HSL2 can diverge in signaling and that
HSL2 could be exerting a different function when plants are exposed to stress 24. We hypothesised
that the mIDA dependent induction of defense-associated marker genes could be modulated by other
receptor combinations than those regulating organ separation. Based on the recently published
sensitized high-throughput interaction assay between extracellular domains (ECDs) of 200 Leucine-
Rich Repeat (LRR) RLKs, we noticed that HAE and HSL2 possess different interaction networks 36
(Supplementary Fig. 9). Interestingly, LRR-RLKs known to play a function in biotic or abiotic stress
responses interacted with HSL2 but not HAE (Supplementary Fig. 9). One of the LRR-RLKs
identified as an exclusive unidirectional interactor of HSL2 was RLK7. To further explore the ability
of these two receptors to form a complex in planta the HSL2 and RLK7 proteins were expressed as
fusions with either a donor (GFP) or an acceptor (mCherry) fluorophore at their C-terminus from an
estradiol-inducible 35S promoter in N.benthamiana leaves and protein-protein interaction was
investigated by the use of Förster Resonance Energy Transfer (FRET). The estradiol inducible
promoter was used to achieve comparable expression levels for both receptors in the plasma
membrane of leaf epidermal cells (Fig. 5b). We quantified receptor interaction by FRET-Acceptor
photobleaching (APB) measurements where the GFP fluorescence after photobleaching of mCherry
is calculated as the percentage of change in GFP emission (EFRET [%]). Only EFRET significantly higher
than 4 % was regarded to indicate physical interaction between receptor-proteins. As a positive
control for optimal energy transfer between donor and acceptor, we fused GFP with mCherry to the
C-termini of RLK7 (RLK7-GFP-mCherry) giving an intramolecular EFRET of 30 % ± 3,71 % (Fig.
5a). RLK7 and HSL2 clearly formed heteromers at the PM independent of which receptor was
expressed in fusion with the donor or acceptor fluorophore (HSL2-GFP/RLK7-mCherry, EFRET = 15
% ± 2,49 %; RLK7-GFP/HSL2-mCherry, EFRET = 10 % ± 1,7 %) (Fig. 5a). These EFRET values were
significantly different from GFP-only samples of HSL2 (HSL2-GFP, EFRET = -0,9 % ± 1,2 %) and
RLK7 (RLK7-GFP, EFRET = 0,2 % ± 1,7 %) (Fig. 5a). Importantly, heteromers were formed in the
.CC-BY-NC-ND 4.0 International licensewas not certified by peer review) is the author/funder. It is made available under aThe copyright holder for this preprint (whichthis version posted September 8, 2019. . https://doi.org/10.1101/761346doi: bioRxiv preprint

10
absence of exogenous mIDA, and the lack of endogenous mIDA in N.benthamiana leaves 12 suggests
that HSL2 and RLK7 can interact in the absence of mIDA in planta, substantiating the in vitro
interaction results (Supplementary Fig. 9). From the sensitized high-throughput interaction assay,
RLK7 was not present in the HAE interaction network 36 (Supplementary Fig. 9) and APB
measurements between RLK7 and HAE did not indicate close proximity or interaction between the
receptors in planta (RLK7-GFP/HAE-mCherry, EFRET= 3,6 % ± 1,2 %) (Fig. 5a).
To explore whether the interaction between RLK7 and HSL2 could be promoted in the presence of
mIDA or PIP1 the ECDs of the receptors were expressed as recombinant bait and prey proteins in
Drosophila Schneider S2 cells (Supplementary Fig. 10 a,b), and tested in the extracellular interaction
assay established previously 36. Cumulative absorbance (Abs 650 nm) for alkaline phosphatase
activity measured over 10 h was significantly higher in the presence of mIDA, but not in the presence
of IDAN69, indicating enhanced HSL2ECD and RLK7ECD interaction by an active mIDA peptide (Fig.
5c). Interestingly, samples treated with PIP1 also augmented the absorbance to the same level as
mIDA but no further elevation was seen when combining mIDA and PIP1 (Fig. 5c). Samples treated
with unrelated elf18, known to bind and activate the defense related receptor EF-Tu receptor 37, did
not change the absorbance compared to untreated samples (Fig. 5c), showing that the enhanced
interaction between RLK7 and HSL2 is peptide specific. HSL2 has been shown to interact with
SERK3/BAK1 in an mIDA dependent manner 3. This was also observed by the extracellular
interaction assay, whereas no mIDA mediated interaction was observed between HSL2 and the
unrelated PHYTOSULFOKINE RECEPTOR 1 (PSKR1) (Supplementary Fig. 10 and 11 a,b),
substantiating the specificity of the mIDA and PIP1 peptides for enhancing RLK7ECD and HSL2ECD
interaction.
We next investigated whether RLK7 alone or together with HSL2 could contribute to regulating cell
separation during abscission. Phenotypic investigation of floral abscission in an rlk7 single and an
rlk7 hsl2 double mutant did not provide any evidence for this (Supplementary Fig. 12), indicating
that RLK7 does not have a function in cell wall remodeling. We therefore next investigated the role
of RLK7 and HSL2 in regulating defense associated genes.
The immune response activation by IDA is modulated by HSL2 and RLK7
The same defense-associated marker genes that were induced at the transcriptional levels in response
to mIDA after 1 h (FRK1, MYB51, and PEP3) were analyzed by RT-qPCR on tissue from 7 days-old
WT, hsl2, rl7, and rlk7 hsl2 mutant seedlings treated with mIDA and compared to untreated seedlings.
FRK1 and PEP3 showed significantly higher levels of expression in untreated hsl2 seedlings
compared to untreated WT seedlings (Fig. 6 and Supplementary Table 3), indicating that this mutant
.CC-BY-NC-ND 4.0 International licensewas not certified by peer review) is the author/funder. It is made available under aThe copyright holder for this preprint (whichthis version posted September 8, 2019. . https://doi.org/10.1101/761346doi: bioRxiv preprint
11
may be associated with an elevated endogenous level of some defense genes. FRK1 expression was
significantly reduced in mIDA treated hsl2 and rlk7 hsl2 mutant seedlings compared to WT seedlings
grown in the presence of mIDA, as was the expression level of PEP3 in rlk7 hsl2 mIDA treated
mutant seedlings compared to mIDA treated WT (Fig. 6 and Supplementary Table 3). Unexpectedly,
FRK1 and PEP3 expression was higher in hsl2 and rlk7 treated seedlings compared to their untreated
mutant counterparts, indicating that the mIDA dependent induction of FRK1 and PEP3 is not only
dependent on the presence of RLK7 or HSL2, and that other receptors involved in immunity may be
mediating the IDA signal or that the receptors are functionally redundant. This was also apparent
from the MYB51 expression that showed increased expression levels in all mIDA treated seedling
genotypes tested compared to untreated samples (Fig. 6 and Supplementary Table 3).
Given the lower levels of FRK1 and PEP3 expression in the mIDA treated rlk7 hsl2 mutant seedlings
compared to mIDA treated WT seedlings we wanted to investigate whether RLK7 and HSL2 could
be signaling in the same cells. A pRLK7:Venus-H2B line was crossed to a pHSL2:Cerulean-H2B
expressing line and plants expressing both constructs were inspected for overlapping fluorescent
nuclei in 7 days-old roots and AZs from flowers at position 6. In emerging LRs, fluorescent nuclei
with overlapping Venus and Cerulean expression were observed in cells surrounding the LRP
(Supplementary Fig. 13). At the root tip, the root meristem and lateral root cap had fluorescent nuclei
with overlapping expression of the fluorescent tags while in the flowers fluorescent nuclei with
overlapping expression were present in some cells of the AZ, carpels and the receptacle
(Supplementary Fig. 13). This indicates that RLK7 and HSL2 are present in cells destined for cell
separation.
Discussion
Several plant species can abscise infected organs to limit colonization of pathogenic microorganisms
thereby adding an additional layer of defense to the innate immune system 18,19. It has also been shown
that plant pathogens can stimulate the expression of genes encoding peptide ligands suggested, or
shown to regulate cell separation and promote abscission 11,19. However, little is known as to how
molecular components regulating abscission can modulate plant defense. In a developmental context,
there is an induction of defense associated genes in AZ cells during cell separation and prior to the
formation of the suberized layer that functions as a barrier rendering protection to pathogen attacks
1,9,10,16. Here, we address the question of how immune responses triggered by MAMPs and plant
signals regulating abscission can cooperate in modulating immunity by activating defense genes in a
non-developmental setting in cells undergoing cell separation which are potential entry routes for
.CC-BY-NC-ND 4.0 International licensewas not certified by peer review) is the author/funder. It is made available under aThe copyright holder for this preprint (whichthis version posted September 8, 2019. . https://doi.org/10.1101/761346doi: bioRxiv preprint

12
invading pathogens. We explore how the IDA peptide can regulate immune response genes and at the
same time be regulated by MAMPs (Fig. 1).
An increase in [Ca2+]cyt and a transient burst of ROS has for a long time been established to form part
of MTI 32,33. The rise in [Ca2+]cyt is important for RBOH activation both by direct binding to EF hands
and by activating Calcium Dependent Kinases which in turn phosphorylate and activate the RBOH
enzymes leading to an increase in apoplastic ROS production 32. ROS can in turn activate Ca2+ influx
channels and promote an increase in [Ca2+]cyt . This mutual regulation between ROS and Ca2+ likely
plays a key role in the cell-to-cell long distance propagation of Ca2+ and ROS, and is believed to
mediate systemic signaling during biotic and abiotic stresses 33. mIDA mediates a ROS burst in
Arabidopsis rosette leaves (Fig. 2f), also roots expressing the Ca2+ sensor R-GECO1, showed a
[Ca2+]cyt wave propagating from the meristematic zone to the root tip in response to mIDA. Moreover,
increased [Ca2+]cyt was also observed in response to mIDA during floral organ abscission (Fig. 2a,b,d
and e). It is intriguing that mIDA cellular output is similar to that of flg22 32,38 yet shows some distinct
differences. The spatial distribution of the Ca2+ wave emanated by mIDA differs from that of flg22
(Fig. 2a,b, Supplementary Fig. 3a,b and Movies 1 and 2) and whereas flg22-induced ROS and in part
Ca2+ release is dependent on RBOHD 32 this does not appear to be the case for mIDA. In contrast to
published data, we could not detect ROS accumulation in the hae hsl2 mutant 35. The cell-type specific
pattern of ROS in AZs was unaffected in the rbohd rbohf mutant compared to WT (Fig. 3a), indicating
that other NADPH oxidases or cell wall peroxidases expressed in the AZ may be involved in ROS
production. This suggests that while IDA and flg22 share many components for their signal
transduction, such as the BAK1 co-receptor 3,39 and MAPK cascade 2,28, there are other specific
components that are likely important to provide differences in signaling.
It has been suggested that the cell type specific accumulation of ROS during abscission is necessary
for the correct positioning of a lignin brace restricting cell wall enzymes to the region of organ
separation in that rbohd rbohf mutants have been reported to have a defect in floral abscission 35. The
inability of this mutant to undergo cell separation was explained by the diffusion of cell wall digestion
enzymes beyond the cells undergoing remodeling 35. Here we show that precise quantification of
abscission phenotypes of several different T-DNA alleles of RBOHD and RBOHF did not reveal any
delay in floral abscission (Fig. 3b,c and Supplementary Fig.7). Furthermore, we propose that mIDA
induced ROS is associated with an immune response. Supporting this view, ectopic ROS
accumulation is seen in AZ cells of the floral abscission mutant nevershed (nev) that has an increased
transcription of pathogen response genes 10. We cannot, however, exclude that mIDA induced
[Ca2+]cyt and rises in ROS levels may also have an intrinsic developmental role such as modulating
cell wall properties and cell expansion similar to what is observed during FERONIA signaling 40,41.
.CC-BY-NC-ND 4.0 International licensewas not certified by peer review) is the author/funder. It is made available under aThe copyright holder for this preprint (whichthis version posted September 8, 2019. . https://doi.org/10.1101/761346doi: bioRxiv preprint

13
While there is a well of knowledge on the detailed molecular events leading to general immune
responses in plants there has been little focus on how plants can mount tissue specific immune
responses. We found that flg22 and PIP1 enhance IDA expression by their cognate LRR-RLK
immune receptors FLS2 and RLK7, respectively (Fig. 1a,b); and that the promoters of these receptors
are active in cells destined for cell separation (Fig. 4a,b and Supplementary Fig. 13). We suggest that,
in addition to the defense genes which are developmentally regulated during abscission and that show
altered expression in the hae hsl2 mutant 9,10,16, PAMPs/DAMPs such as flg22 and PIP1 induce IDA
expression, which in turn modulates expression of defense-associated genes (Fig. 1c,d). Interestingly,
this mIDA dependent induction is in part reliant on the two LRR-RLK receptors RLK7 and HSL2
(Fig. 6). FRK1, an early acting primary defense response gene and a marker gene commonly used to
monitor the ability of elicitors to induce defense responses 28, had significantly lower expression
levels in mIDA induced hsl2 and hsl2 rlk7 mutant seedlings compared to mIDA treated WT seedlings
(Fig. 6). Elevated level of expression in un-treated hsl2 seedlings was seen for the FRK1 and PEP3
transcript (Fig. 6), indicating that the hsl2 mutant itself has an activated immune response. Unlike the
significant decrease in expression seen for PEP3 in mIDA treated hsl2 rlk7 mutant seedlings
compared to treated WT seedlings, expression of MYB51 showed no difference in expression levels
for any of the treated mutant genotypes compared to treated WT (Fig. 6). Interestingly, MYB51 is
downregulated in the AZ of hae hsl2 compared to WT 9, indicating that the increase in expression
seen in mIDA treated seedlings is dependent on the presence of HAE and HSL2 and not HSL2 and
RLK7. The significant increase in expression of FRK1 and PEP3 in mIDA treated rlk7 samples, and
increased PEP3 expression in treated hsl2 samples compared to untreated samples of the same
genotype shows that other receptors may play a role in this regulation. In the nev mutant that has an
over-activation of SERK1 signaling there was a 3,7 and 4,1 fold increase in expression of FRK1 and
PEP3 compared to WT, indicating that SERK signaling could be important 10,42.
We propose a model (Fig. 7) where IDA-mediated signaling can take place through different receptor
complexes to coordinate developmental abscission and defense. We suggest that biotic and abiotic
elicitors enhance IDA expression in cells that have the potential to undergo cell separation. The
heteromerisation between HSL2 and RLK7 (Fig. 5 a) is promoted upon IDA and PIP1 perception
(Fig. 5c) and leads to the activation of a set of defense-associated genes. PIP1 could thus function as
a molecular switch recruiting HSL2 together with IDA into a signaling module with RLK7 to promote
immune responses. In the event that an organ, such as a leaf, is challenged by a pathogen, the
activation of defense-associated genes in cells at the joint between the organ and the plant could act
as a protective barrier. In cells that undergo cell separation, without the loss of an organ, induction of
defense genes would play a similar function. Indeed both HSL2 and RLK7 are expressed in root cap
.CC-BY-NC-ND 4.0 International licensewas not certified by peer review) is the author/funder. It is made available under aThe copyright holder for this preprint (whichthis version posted September 8, 2019. . https://doi.org/10.1101/761346doi: bioRxiv preprint

14
cells that undergo sloughing (Supplementary Fig. 13). During cell separation RLK7 signaling would
add an additional layer of protection to the defense genes that are developmentally induced, since
RLK7 and PIP1 do not appear to play a role in regulating cell separation (Supplementary Fig. 12 and
23).
Phylogenetic analyses suggest that HSL2 was present in species that gave rise to the angiosperms and
that HAE arose later in evolution 43. It is therefore possible that IDA and HSL2 originally had a
function in plant innate immunity and later developed a specified role in regulating cell separation
yet keeping the ability to respond to environmental stresses. The similarity between PIP/PIPL and
IDA/IDL peptides would support this, in that the PIP and PIPL peptides are involved in regulating
stress responses 11,23. A common function for these family of peptides is also apparent from their
induction by various abiotic stresses like salt 11 (and Genevestigator Experiment ID: AT- 00120).
Given the similarities in signaling components for pathways mediating cell separation and defense, it
will be exciting to further explore the tight interplay between these processes.
Materials and methods
Accession numbers of genes studied in this work: HSL2 At5g65710, RLK7 At1g09970, IDA
At1g68765, FLS2 At5g46330, HAE At4g28490, MYB51 At1g18570, PIP1 At3g61430,
RBOHD At5g47910, RBOHF At1g64060, PEP3 At5g64905, WRKY33 At2g38470, FRK1
At2g19190. Plant lines used in this work: Ecotype Colombia-0 (Col-0) was used as wild type (WT).
Mutant line: hae (SALK 021905), hsl2, (SALK 030520), rlk7 (SALK_094492), fls2
(SALK_062054), rbohd (SALK_070610- exon 7, SALK_120299-exon 7, CS9555 [At rbohd-D3] 44
exon 5), rbohf (SALK_059888-intron 3, SALK_057041-intron 4, CS68748 [At rbohf-F3] exon 1 44).
SALK lines were provided from Nottingham Arabidopsis Stock Centre (NASC).
Plant lines
The pIDA:GUS, pHSL2:Venus-H2B and pMYB51:YFPN lines have been described previously 8,14,27.
The promoters of HAE (1601 bp 8) and HSL2 (2300 bp 43) were available in the pDONRZeo vector
(Thermo Fischer Scientific). Sequences corresponding to the RLK7 (1880 bp 45) and FLS2 promoters
(988 bp 46) were amplified from WT DNA (primers are listed in table 2) and cloned into the
pDONRZeo vector (Thermo Fischer Scientific). All promoter constructs were further recombined
into the promotor:Venus (YFP)-H2B and Cerulean(CFP)-H2B destination vectors 47 using the
Invitrogen Gateway cloning system (Thermo Fischer Scientific). Constructs were transformed into
Agrobacterium tumefacience (A.tumefacience) C58 and the floral dip method 48 was used to generate
transgenic lines. Single-copy homozygous plant lines were selected and used in this study. Full-
.CC-BY-NC-ND 4.0 International licensewas not certified by peer review) is the author/funder. It is made available under aThe copyright holder for this preprint (whichthis version posted September 8, 2019. . https://doi.org/10.1101/761346doi: bioRxiv preprint

15
length CDS of HAE, HSL2 and RLK7 were cloned in frame with expression vectors containing an
estradiol inducible promotor and a C-terminal fluorescent molecule of GFP, mCherry or GFP-
mCherry 49 using the Invitrogen Gateway cloning system. Plasmids were transformed into
A.tumefacience C58 and further used for transient expression of receptor proteins in Nicotiana
benthamiana (N.benthamiana) leaves. The CDS of HAE was cloned into the pEarleyGate101
destination vector 50 using the Invitrogen Gateway cloning system and transformed into
A.tumefacience C58 and further used to generate the 35S:HAE:YFP lines.
Growth conditions
Plants were grown in long day conditions (8 h dark and 16 h light) at 22 °C. Seeds were surface
sterilized and plated out on MS-2 plates, stratified for 24 h at 4 °C and grown on plates for 7 days
before transferred to soil.
Peptide sequences
Peptides used in this study were ordered from BIOMATIK. Peptide sequences are listed in
Supplementary Table 1.
Primers
Primers for genotyping and generation of constructs were generated using VectorNT1. Gene specific
primers for RT-qPCR were generated using Roche Probe Library Primer Design. All primers are
listed in Supplementary Table 2.
Histochemical GUS assay
Seven days-old seedlings were pre-incubated for 12 h in liquid MS-2 medium containing stimuli of
interest; 1 µM peptide (table 1), 60 mM Mannitol (M4125 – Sigma), 20 µg/mL Chitin (C9752 –
Sigma), 50 mM NaCl and then stained for GUS activity following the protocol previously described
5. Roots were pictured using a Zeiss Axioplan2 microscope with an AxioCam HRc, 20x air objective.
Seedlings The assay was performed on 10 individual roots and the experiment was repeated 3 times.
Fluorescent GUS assay
Seven days-old seedlings were pre-incubated for 12 h in liquid MS-2 medium with or without stimuli
of interest; 1 µM peptide (table 1), 60 mM Mannitol (M4125 – Sigma), 20 µg/mL Chitin (C9752 –
Sigma), 50 mM NaCl. After treatment, 10 seedlings were incubated in wells containing 1 mL reaction
mix described in 20 conatining: 10 mM EDTA (pH 8.0), 0,1 % SDS, 50 mM Sodium Phosphate (pH
.CC-BY-NC-ND 4.0 International licensewas not certified by peer review) is the author/funder. It is made available under aThe copyright holder for this preprint (whichthis version posted September 8, 2019. . https://doi.org/10.1101/761346doi: bioRxiv preprint

16
7.0), 0,1 % Triton X-100, 1 mM 4-MUG (, M9130-Sigma) and incubated at 37 °C for 6 h. Six 100 μl
aliquots from each well were transferred to individual wells in a microtiter plate and the reaction was
stopped by adding 50 μl of stop reagent (1 M Sodium Carbonate) to each well. Fluorescence was
detected by the use of a Wallac 1420 VICTOR2 microplate luminometer (PerkinElmer) using an
excitation wavelength of 365 nm and a filter wavelength of 430 nm. Each experiment was repeated 3
times.
Confocal laser microscopy of roots and flowers expressing promoter:Venus/YFP-H2B and
promoter: Cerulean-H2B constructs
Imaging of 7 days-old roots was performed on a LSM 880 Airyscan confocal microscope equipped
with two flanking PMTs and a central 32 array GaAsP detector. Images were acquired with Zeiss
Plan-Apochromat 20x/0.8 WD=0.55 M27 objective and excited with lasers light of 405 nm, 488 nm
and 561 nm. Roots were stained by 1 µM propidium iodide for 10 min and washed in dH2O before
imaging. Imaging of flowers was performed on an Andor Dragonfly spinning disk confocal using an
EMCCD iXon Ultra detector. Images were acquired with a 10x plan Apo NA 0,45 dry objective and
excited with laser light of 405 nm, 488 nm and 561 nm. Maximum intensity projections of z-stacks s
were acquired with step size of 1,47 µm. Image processing was performed in FIJI 51. These steps are:
background subtraction, gaussian blur/smooth, brightness/contrast. Imaging was performed at the
NorMIC Imaging platform.
Protein-protein interaction by FRET-acceptor PhotoBleaching (FRET-APB)
FRET-APB was performed on N.benthamiana leaves transiently expressing full-length receptors as
described previously 12. FRET-APB values was measured as previously described 49 using a Zeiss
LSM880 Airyscan. A Plan-Apochromat 20x/0.8 WD=0.55 M27 objective, an optical zoom of 5 x,
frame size of 256 x 256 pixels and scan speed of 629 msec per frame were used for all measurements.
Frame size, laser-power and gain were kept constantly throughout all measurements. EFRET was
measured via GFP fluorescence intensity increase after photobleaching of the acceptor mCherry using
the Zeiss FRET measurement option (EFRET = (GFPafter − GFPbefore)/GFPafter × 100). Only
measurements with minimal fluctuations of GFP and mCherry were used. EFRET significantly higher
than 4 % was regarded to indicate physical interaction between receptor-proteins as described in 49.
All measurements were performed 15 times and each experiment was repeated 3 times. The donor-
only sample (GFP) was used as a negative control. FRET-APB measurements were performed at the
NorMIC Imaging platform.
.CC-BY-NC-ND 4.0 International licensewas not certified by peer review) is the author/funder. It is made available under aThe copyright holder for this preprint (whichthis version posted September 8, 2019. . https://doi.org/10.1101/761346doi: bioRxiv preprint

17
Molecular cloning of LRR-RLK extracellular domains
This step was performed as described previously in 36.
Secreted expression of LRR-RLK extracellular domains
The extracellular domains (ECDs) of HSL2, RLK7, BAK1, and PSKR1 (nucleotide and amino acid
sequences are listed in Supplementary Table 4) cloned into the pECIA2 (for expression as a bait) and
pECIA14 (for expression as a prey) vectors were expressed using transient transfection of Drosophila
S2 cells cultured at 27 °C. Upon transfection using ExpreS2 TR (ExpreS2ion Biotechnologies), the
culturing temperature was changed to 25 °C. Twenty-four h after transfection, protein expression was
induced with 1 mM CuSO4 and supernatant was collected four days after induction. Protease
inhibitors (Sigma) and 0.02 % NaN3 were added to the medium (ESF 921, Expression Systems)
containing the recombinant ECDs and then stored at 4 °C before use. The cell supernatant was
assessed for recombinant protein expression by western blotting using anti-V5 antibodies (Invitrogen)
for the baits and anti-FLAG antibodies for the preys.
Targeted interaction assay using CSI method
The interaction assays were performed as detailed previously 36 with the slight modifications
indicated below. Schneider’s medium containing recombinant bait ECD of HSL2 and prey ECDs of
RLK7, BAK1, and PSKR1 (protein sequences are listed in Supplementary Table 4) were mixed
together and diluted in a PBS buffer containing 1 mM CaCl2, 1 mM MgCl2 (equilibration buffer) and
0.1 % bovine serum albumin (BSA; Sigma) to obtain a final eightfold dilution in a volume of 100 l.
Each bait-prey combination was incubated for 2 h at 4 °C in the presence and absence of peptides.
Meanwhile, the Protein-A-coated plates were rehydrated by 3 consecutive washes in a PBS solution
containing 0.1 % Tween-20 before use. The bait- prey interaction combinations were captured
directly on the 96-well protein-A-coated plates (Thermo Fisher Scientific) by overnight incubation at
4 °C. The excess of bait-prey mixtures was washed away using equilibration buffer which had
previously been added the alkaline phosphatase substrate (KPL 50-88-02) the same peptide
concentration was kept during the washing steps. Upon addition of the substrate, alkaline phosphatase
activity was monitored for 10 h at room temperature by measuring the absorbance at 650 nm using a
Synergy H4 Multi-Mode plate reader (BioTek). Images of the 96-well plates were acquired for visual
inspection. The complete set of raw absorbance values was combined and then subjected to post
experimental calculations and statistical analysis.
.CC-BY-NC-ND 4.0 International licensewas not certified by peer review) is the author/funder. It is made available under aThe copyright holder for this preprint (whichthis version posted September 8, 2019. . https://doi.org/10.1101/761346doi: bioRxiv preprint

18
Calcium imaging using the R-GECO1 sensor
[Ca2+]cyt in roots were detected using WT plants expressing the cytosolic localized single-fluorophore
based Ca2+ sensor, R-GECO1 52. Measurements were performed using a confocal laser scanning
microscopy Leica TCS SP8 STED 3X using a 20x multi NA 0.75 objective. R-GECO1 was excited
with a white light laser at 561 nm and its emission was detected at 590 nm to 670 nm using a HyD
detector. Laser power and gain settings were chosen for each experiment to maintain comparable
intensity values. Images were recorded with a frame rate of 5 seconds at 400 Hz. Sample mounting
was performed as described in 53. Seedlings were incubated overnight in half strength MS, 21°C and
continuous light conditions before the day of imaging. For mIDA and flg22 two-fold concentrations
were prepared in half strength MS. mIDA or flg22 were added in a 1:1 volume ratio to the imaging
chamber (final concentration 1 M). ATP was prepared in a 100-fold concentration in half strength
MS and added as a last treatment in a 1:100 volume ratio (final concentration 1 mM) to the imaging
chamber as a positive control for activity of the R-GECO1 sensor (Movie 3). Image processing was
performed in FIJI 51. These steps are: background subtraction, gaussian blur, ultiStackReg v1.45
(http://bradbusse.net/sciencedownloads.html), 32-bit conversion, threshold. Royal was used as a look
up table. Fluorescence intensities of indicated ROIs were obtained from the 32-bit images 53.
Normalization was done using the following formula ∆F/F = (F-F0)/F0 where F0 represents the mean
of at least 1 min measurement without any treatment. R-GECO1 measurements were performed at
the Center for Advanced imaging (CAi) at HHU.
Calcium measurements using the Aequorin (pMAQ2) sensor
[Ca2+]cyt in seedlings and flowers were detected using WT plants expressing p35S-apoaequorin
(pMAQ2) located to cytosol (Aeq) 55. Aequorin luminescence was measured as previously described
56. Emitted light was detected by the use of a Wallac 1420 VICTOR2 microplate luminometer
(PerkinElmer). Differences in Aeq expression levels due to seedling size and expression of sensor
were corrected by using luminescence at specific time point (L)/Max Luminescence (Lmax). Lmax was
measured after peptide treatment by individually adding 100 µL 2 M CaCl2 to each well and
measuring luminescence constantly for 180 seconds 57. 2 M CaCl2 disrupts the cells and releases the
Aeq sensor into the solution where it will react with Ca2+ and release the total possible response in
the sample (Lmax) in form of a luminescent peak. A final concentration of 1 µM mIDA was added to
each wells at the start of measurements. For seedlings 3 independent experiments were performed
with 12 replications in each experiment. For flowers 3 independent experiments were performed with
4-6 replications in each experiment.
.CC-BY-NC-ND 4.0 International licensewas not certified by peer review) is the author/funder. It is made available under aThe copyright holder for this preprint (whichthis version posted September 8, 2019. . https://doi.org/10.1101/761346doi: bioRxiv preprint

19
Measurements of reactive oxygen species (ROS)
ROS production was monitored by the use of a luminol-dependent assay as previously described 12
using a Wallac 1420 VICTOR2 microplate luminometer (PerkinElmer). Arabidopsis leaves
expressing 35S:HAE:YFP were cut into leaf discs and incubated in water overnight before
measurements. A final concentration of 1 µM mIDA was added to each well at the start of
measurements. All measurements were performed on 6 leaf discs and each experiment was repeated
3 times.
ROS stain (H2DCF-DA)
Flowers at position 6 were gently incubated in staining solution (25 µM (2',7'-
dichlorodihydrofluorescein diacetate) (H2DCF-DA) (Sigma-Aldrich, D6883), 50 mM KCL, 10 mM
MES) for 10 min and further washed 3 times in wash solution (50 mM KCL, 10 mM MES). For the
hae hsl2 mutant the floral organs were forcibly removed immediately before imaging. Imaging was
done using a Dragonfly Airy scan spinning disk confocal microscope, excited by a 488 nm laser. A
total of 9 flowers per genotype were imaged. The experiment was repeated 2 independent times.
Real time quantitative PCR (RT-qPCR)
Seven days-old Arabidopsis seedlings (WT, rlk7, hsl2 and hsl2 rlk7) grown vertically on ½ sucrose
MS-2 plates were transferred to liquid ½ MS-2 medium (non-treated) and liquid ½ MS-2 medium
containing 1 µM mIDA and incubated in growth chambers for 1 h or 12 h. Seedlings were flash-
frozen in liquid nitrogen before total RNA was extracted using SpectrumTM Plant Total RNA Kit
(SIGMA Aldrich). cDNA synthesis was performed as previously described 58. RT-qPCR was
performed according to protocols provided by the manufacturer using FastStart Essential DNA Green
Master (Roche) and LightCycler96 (Roche) instrument. ACTIN2 was used to normalize mRNA levels
as described in 58. Three biological replicates and 4 technical replicates including standard curves
were performed for each sample.
Petal Break strength (pBS)
The force required to remove a petal at a given position on the inflorescence was measured in gram
equivalents using a load transducer as previously described 5. Plants were grown until they had at
least 15 positions on the inflorescence. A minimum of 15 petals per position were measured. pBS
measurements were performed on WT, rbohd rbohf (SALK_070610 SALK_059888) and hae hsl2
(SALK_021905 SALK_030520) plants.
.CC-BY-NC-ND 4.0 International licensewas not certified by peer review) is the author/funder. It is made available under aThe copyright holder for this preprint (whichthis version posted September 8, 2019. . https://doi.org/10.1101/761346doi: bioRxiv preprint
20
Statistical methods
Two tailed students t-test (p < 0.05) was used to identify significant differences in the fluorescent
GUS assay by comparing treated samples to untreated samples of the same plant line. Two tailed
students t-test (p < 0.05) was used to identify significant differences in RT-qPCR analysis by
comparing all untreated samples to mIDA treated samples of same genotype (*), by comparing all
untreated genotypes to untreated WT (**) and by comparing all mIDA treated genotypes to mIDA
treated WT (***) (statistical data presented in Supplementary table 3). Two tailed students t-test with
(p < 0.05) was used in the petal break strength (pBS) measurements to identify significant differences
from WT at a given position on the inflorescence. Statistical significance of each HSL2ECD (bait) and
RLK7ECD, BAK1ECD, PSKR1ECD (preys) interactions in the presence of peptides (mIDA, PIP1,
IDA∆N69, and elf18) in comparison to interaction in the absence of peptide (-) was determined using
a One-Way ANOVA with pairwise multiple comparisons and the resulting P values were corrected
for multiple testing using the Holm method 36 (p < 0.0001).
Acknowledgements
We thank M.K. Anker, I.M. Stø, V. Iversen and R. Falleth for technical assistance in the laboratory
and phytotrone. We thank the NorMic Imaging platform for the use and technical support. We would
like to extend a thank-you and a welcome to Alex Smakowska for placing the finishing touch on this
manuscript, and T. Ullerud and I. De Smet for insightful discussions. This work was supported by the
Research Council of Norway (grant 230849) to V.O. and M.A.B. By the Hertha Firnberg Programme
post-doctoral fellowship (T-947) from the FWF Austrian Science Fund, Vienna, Austria.to E.S-L.
Work by R. Simon and and M.B. was supported through CEPLAS.
Author contributions
V.O. generated Arabidopsis lines and constructs, tested IDA expression to biotic and abiotic stress,
performed gene expression studies, phenotypic analysis of mutants, ROS measurements and FRET
experiments. V.O. and M.B. performed Ca2+ measurements. E.S-L. and R. Schneeweiss performed
the extracellular interaction assay. P.M. performed IDA expression studies. V.O., E.S-L., M.B., P.M.,
Y.B., R.Simon and M.A.B designed experiments, analyzed data, and drafted the manuscript. V.O.
and M.A.B wrote the paper with input from all authors.
.CC-BY-NC-ND 4.0 International licensewas not certified by peer review) is the author/funder. It is made available under aThe copyright holder for this preprint (whichthis version posted September 8, 2019. . https://doi.org/10.1101/761346doi: bioRxiv preprint

21
References
1 Roberts, J. A., Whitelaw, C. A., Gonzalez-Carranza, Z. H. & McManus, M. T. Cell
separation processes in plants- models, mechanisms and manipulation. Ann Bot-London
86, 223-235 (2000).
2 Cho, S. K. et al. Regulation of floral organ abscission in Arabidopsis thaliana. Proc
Natl Acad Sci USA 105, 15629-15634 (2008).
3 Meng, X. et al. Ligand-induced receptor-like kinase complex regulates floral organ
abscission in Arabidopsis. Cell reports 14, 1330-1338 (2016).
4 Santiago, J. et al. Mechanistic insight into a peptide hormone signaling complex
mediating floral organ abscission. Elife 5, e15075 (2016).
5 Stenvik, G. E. et al. The EPIP peptide of INFLORESCENCE DEFICIENT IN
ABSCISSION is sufficient to induce abscission in Arabidopsis through the receptor-
like kinases HAESA and HAESA-LIKE2. Plant Cell 20, 1805-1817 (2008).
6 Shi, C.-L. et al. Arabidopsis class I KNOTTED-Like Homeobox Proteins act
downstream in the IDA-HAE/HSL2 floral abscission signaling pathway. Plant Cell 23,
2553-2567 (2011).
7 Butenko, M. A. et al. INFLORESCENCE DEFICIENT IN ABSCISSION controls floral
organ abscission in Arabidopsis and identifies a novel family of putative ligands in
plants. Plant Cell 15, 2296-2307 (2003).
8 Kumpf, R. P. et al. Floral organ abscission peptide IDA and its HAE/HSL2 receptors
control cell separation during lateral root emergence. Proc Natl Acad Sci U S A 110,
5235-5240, (2013).
9 Niederhuth, C., Patharkar, O. R. & Walker, J. Transcriptional profiling of the
Arabidopsis abscission mutant hae hsl2 by RNA-Seq. BMC Genomics 14, 37 (2013).
10 Taylor, I. & Walker, J. C. Transcriptomic evidence for distinct mechanisms underlying
abscission deficiency in the Arabidopsis mutants haesa/haesa-like 2 and nevershed.
BMC Res Notes 11, 754 (2018).
11 Vie, A. K. et al. The IDA/IDA-LIKE and PIP/PIP-LIKE gene families in Arabidopsis:
phylogenetic relationship, expression patterns, and transcriptional effect of the PIPL3
peptide. J exp bot. 66, 5351-5365 (2015).
12 Butenko, M. A. et al. Tools and strategies to match peptide-ligand receptor pairs. Plant
cell 26, 1838-1847 (2014).
.CC-BY-NC-ND 4.0 International licensewas not certified by peer review) is the author/funder. It is made available under aThe copyright holder for this preprint (whichthis version posted September 8, 2019. . https://doi.org/10.1101/761346doi: bioRxiv preprint

22
13 Schardon, K. et al. Precursor processing for plant peptide hormone maturation by
subtilisin-like serine proteinases. Science 14, 1594–1597 (2016).
14 Shi, C.-L. et al. The dynamics of root cap sloughing in Arabidopsis is regulated by
peptide signalling. Nat Plants 4, 596-604 (2018).
15 Agustí, J., Merelo, P., Cercós, M., Tadeo, F. R. & Talón, M. Comparative transcriptional
survey between laser-microdissected cells from laminar abscission zone and petiolar
cortical tissue during ethylene-promoted abscission in citrus leaves. BMC Plant Biol. 9,
127 (2009).
16 Cai, S. & Lashbrook, C. C. Stamen abscission zone transcriptome profiling reveals new
candidates for abscission control: enhanced retention of floral organs in transgenic
plants overexpressing Arabidopsis ZINC FINGER PROTEIN2. Plant Physiol. 146,
1305-1321 (2008).
17 Wang, X. et al. IDL6-HAE/HSL2 impacts pectin degradation and resistance to
Pseudomonas syringae pv tomato DC3000 in Arabidopsis leaves. Plant J. 89, 250-263
(2017).
18 Kissoudis, C. et al. Responses to combined abiotic and biotic stress in tomato are
governed by stress intensity and resistance mechanism. J exp bot. 67, 5119-5132 (2016).
19 Patharkar, O. R., Gassmann, W. & Walker, J. C. Leaf shedding as an anti-bacterial
defense in Arabidopsis cauline leaves. PLoS genetics 13, e1007132 (2017).
20 Blázquez, M. Quantitative GUS Activity assay in intact plant tissue. CSH Protoc. 2007,
pdb.prot4688 (2007).
21 Chinchilla, D., Bauer, Z., Regenass, M., Boller, T. & Felix, G. The Arabidopsis receptor
kinase FLS2 binds flg22 and determines the specificity of flagellin perception. Plant
Cell 18, 465-476 (2006).
22 Gómez-Gómez, L. & Boller, T. FLS2: An LRR Receptor–like kinase involved in the
perception of the bacterial elicitor flagellin in Arabidopsis. Mol Cell 5, 1003-1011
(2000).
23 Hou, S. et al. The secreted peptide PIP1 amplifies immunity through Receptor-Like
Kinase 7. PLOS Pathog. 10, e1004331 (2014).
24 Patharkar, O. R. & Walker, J. C. Core mechanisms regulating developmentally timed
and environmentally triggered Abscission. Plant physiol. 172, 510-520 (2016).
25 Birkenbihl, R. P., Kracher, B., Roccaro, M. & Somssich, I. E. Induced genome-wide
binding of three Arabidopsis WRKY transcription factors during early MAMP-
triggered immunity. Plant Cell 29, 20-38 (2017).
.CC-BY-NC-ND 4.0 International licensewas not certified by peer review) is the author/funder. It is made available under aThe copyright holder for this preprint (whichthis version posted September 8, 2019. . https://doi.org/10.1101/761346doi: bioRxiv preprint
23
26 Frerigmann, H. et al. Regulation of pathogen-triggered tryptophan metabolism in
Arabidopsis thaliana by MYB transcription factors and indole glucosinolate conversion
products. Mol. Plant 9, 682-695 (2016).
27 Poncini, L. et al. In roots of Arabidopsis thaliana, the damage-associated molecular
pattern AtPep1 is a stronger elicitor of immune signalling than flg22 or the chitin
heptamer. PloS one 12, e0185808 (2017).
28 Asai, T. et al. MAP kinase signalling cascade in Arabidopsis innate immunity. Nature
415, 977-983 (2002).
29 He, P. et al. Specific bacterial suppressors of MAMP signaling upstream of MAPKKK
in Arabidopsis innate immunity. Cell 125, 563-575 (2006).
30 Huffaker, A., Pearce, G. & Ryan, C. A. An endogenous peptide signal in Arabidopsis
activates components of the innate immune response. Proc Natl Acad Sci U S A 103,
10098-10103 (2006).
31 Birkenbihl, R. P., Diezel, C. & Somssich, I. E. Arabidopsis WRKY33 is a key
transcriptional regulator of hormonal and metabolic responses toward Botrytis cinerea
infection. Plant physiol. 159, 266-285 (2012).
32 Kadota, Y., Shirasu, K. & Zipfel, C. Regulation of the NADPH oxidase RBOHD during
plant immunity. Plant Cell Physiol 56, 1472-1480 (2015).
33 Steinhorst, L. & Kudla, J. Calcium and reactive oxygen species rule the waves of
signaling. Plant Physiol. 163, 471-485 (2013).
34 Patharkar, O. R. & Walker, J. C. Floral organ abscission is regulated by a positive
feedback loop. Proc Natl Acad Sci U S A 112, 2906-2911 (2015).
35 Lee, Y. et al. A Lignin Molecular Brace Controls Precision Processing of Cell Walls
Critical for Surface Integrity in Arabidopsis. Cell 173, 1468-1480 (2018).
36 Smakowska-Luzan, E. et al. An extracellular network of Arabidopsis leucine-rich repeat
receptor kinases. Nature 553, 342 (2018).
37 Zipfel, C. et al. Perception of the bacterial PAMP EF-Tu by the receptor EFR restricts
Agrobacterium-mediated transformation. Cell 125, 749-760 (2006).
38 Kadota, Y. et al. Direct regulation of the NADPH oxidase RBOHD by the PRR-
associated kinase BIK1 during plant immunity. Mol. Cell 54, 43-55 (2014).
39 Chinchilla, D. et al. A flagellin-induced complex of the receptor FLS2 and BAK1
initiates plant defence. Nature 448, 497 (2007).
.CC-BY-NC-ND 4.0 International licensewas not certified by peer review) is the author/funder. It is made available under aThe copyright holder for this preprint (whichthis version posted September 8, 2019. . https://doi.org/10.1101/761346doi: bioRxiv preprint

24
40 Dünser, K. et al. Extracellular matrix sensing by FERONIA and Leucine-Rich Repeat
Extensins controls vacuolar expansion during cellular elongation in Arabidopsis
thaliana. EMBO J. 38, e100353 (2019).
41 Feng, W. et al. The FERONIA receptor kinase maintains cell-wall integrity during salt
stress through Ca(2+) Signaling. Curr Bio.l 28, 666-675 (2018).
42 Taylor, I., Baer, J., Calcutt, R. & Walker, J. C. Hypermorphic SERK1 mutations function
via a SOBIR1 pathway to activate floral abscission signaling. Plant Physiol. 180, 1219-
1229 (2019).
43 Stø, I. M. et al. Conservation of the abscission signaling peptide IDA during
Angiosperm evolution: withstanding genome duplications and gain and loss of the
receptors HAE/HSL2. Frontiers Plant Sci. 6, 931 (2015).
44 Torres, M. A., Dangl, J. L., Jones, J.D., Arabidopsis gp91phox homologues AtrbohD
and AtrbohF are required for accumulation of reactive oxygen intermediates in the plant
defense response. Proc Natl Acad Sci U S A 99 517-522 (2002).
45 Pitorre, D. et al. RLK7, a leucine-rich repeat receptor-like kinase, is required for proper
germination speed and tolerance to oxidative stress in Arabidopsis thaliana. Planta 232,
1339-1353 (2010).
46 Robatzek, S., Chinchilla, D. & Boller, T. Ligand-induced endocytosis of the pattern
recognition receptor FLS2 in Arabidopsis. Gene Dev. 20, 537-542 (2006).
47 Somssich, M., Bleckmann, A. & Simon, R. Shared and distinct functions of the
pseudokinase CORYNE (CRN) in shoot and root stem cell maintenance of Arabidopsis.
J Exp Bot. 67, 4901-4915 (2016).
48 Clough, S. J. & Bent, A. F. Floral dip: A simplified method for Agrobacterium-mediated
transformation of Arabidopsis thaliana. Plant J. 16, 735-743 (1998).
49 Bleckmann, A., Weidtkamp-Peters, S., Seidel, C. A. & Simon, R. Stem cell signaling
in Arabidopsis requires CRN to localize CLV2 to the plasma membrane. Plant Physiol.
152, 166-176 (2010).
50 Earley, K. W. et al. Gateway-compatible vectors for plant functional genomics and
proteomics. Plant J. 45, 616-629 (2006).
51 Schindelin, J. et al. Fiji: an open-source platform for biological-image analysis. Nat.
Methods 9, 676 (2012).
52 Keinath, N. F. et al. Live cell imaging with R-GECO1 sheds light on flg22- and Chitin-
induced transient [Ca2+]cyt patterns in Arabidopsis. Mol. Plant 8, 1188-1200 (2015).
.CC-BY-NC-ND 4.0 International licensewas not certified by peer review) is the author/funder. It is made available under aThe copyright holder for this preprint (whichthis version posted September 8, 2019. . https://doi.org/10.1101/761346doi: bioRxiv preprint

25
53 Waadt, R., Krebs, M., Kudla, J., Schumacher, K. Multiparameter imaging of calcium
and abscisic acid and high-resolution quantitative calcium measurements using R-
GECO1-mTurquoise in Arabidopsis. New Phytol. 216, 303-320 (2017).
54 Krebs, M. & Schumacher, K. Live cell imaging of cytoplasmic and nuclear Ca2+
dynamics in Arabidopsis roots. CSH Protoc. 8, 776-780 (2013).
55 Knight, M. R., Campbell, A. K., Smith, S. M. & Trewavas, A. J. Transgenic plant
aequorin reports the effects of touch and cold-shock and elicitors on cytoplasmic
calcium. Nature 352, 524-526 (1991).
56 Ranf, S. et al. Defense-related calcium signaling mutants uncovered via a quantitative
high-throughput screen in Arabidopsis thaliana. Mol. Plant 5, 115-130 (2012).
57 Ranf, S. et al. A lectin S-domain receptor kinase mediates lipopolysaccharide sensing
in Arabidopsis thaliana. Nat. Immunol. 16, 426-433 (2015).
58 Grini, P. E. et al. The ASH1 HOMOLOG 2 (ASHH2) histone H3 methyltransferase is
required for ovule and anther development in Arabidopsis. PLoS One 4, e7817 (2009).
Figure Legends
Fig. 1: IDA is induced by biotic stress and triggers defense-associated marker genes
a, Enhanced pIDA:GUS expression after 12 hours (h) treatment with 1 µM flg22 or 1 µM PIP1 is
observed in cells surrounding emerging lateral roots. Controls were either not subjected to any stimuli
(No treatment) or exposed to 1 µM of the inactive IDA peptide, IDAΔN69 4,12. No enhanced flg22 and
PIP1 induced expression is observed in pIDA:GUS fls2 or pIDA:GUS rlk7 plants compared to plants
grown without the presence of any stimuli (No treatment). Representative picture of n = 10,
experiment repeated 3 times, scale bar = 50 µm. b, Normalized emitted fluorescence of fluorochrome
4-methyl umbelliferone (4-MU) in 7 days-old seedlings after 12 h treatment with 1 µM PIP1 and 1
µM flg22 in pIDA:GUS seedlings, pIDA:GUS fls2 seedlings and pIDA:GUS rlk7 seedlings. Controls
were either not subjected to any stimuli (No treatment) or exposed to 1 µM IDAΔN69. n = 6, experiment
repeated 3 times. * = significantly different from the non-treated (No treatment) sample (p < 0.05,
student t-test, two tailed). c, pMYB51:YFPN expression is enhanced in roots after 7 h exposure to 1
µM mIDA peptide compared to untreated roots (control), scale bar = 50 µm, maximum intensity
projections of z-stacks, magenta = propidium iodide stain. d, Transcripts of FRK1, MYB51, PEP3
and WRKY33 in WT seedlings exposed to 1 µM mIDA for 1 h (light gray) and to 1 µM mIDA for 12
h (dark gray) compared to untreated tissue (black). RNA levels were measured by RT-qPCR analysis.
ACTIN was used to normalize mRNA levels. n = 4, three biological replicates. * = significantly
.CC-BY-NC-ND 4.0 International licensewas not certified by peer review) is the author/funder. It is made available under aThe copyright holder for this preprint (whichthis version posted September 8, 2019. . https://doi.org/10.1101/761346doi: bioRxiv preprint

26
different from untreated sample (p < 0.05, student t-test, two tailed). Statistical analyses are presented
in Supplementary Table 3.
Fig. 2: mIDA-induced Ca2+ and ROS release in Arabidopsis
a, Normalized R-GECO1 fluorescence intensities (ΔF/F) were measured from regions of interest
(ROI) (outlined in red) in the meristematic and elongation zone of the root. Shown are cytosolic
calcium concentration ([Ca2+]cyt) dynamics in the ROI in response to 1 M mIDA over time. (see also
Movie 1). Representative response from 10 roots. Red arrow at 0 minutes (min) indicates application
of mIDA peptide. b, Representative response from 10 roots. The increase in [Ca2+]cyt response
propagates through the roots as two waves seen as normalized R-GECO1 fluorescence intensities
(ΔF/F) shown as a heat map. c, Expression of pHAE:Venus-H2B and pHSL2:Venus-H2B in 7 days-
old roots. Scale bar = 50 µm, single plane image, magenta = propidium iodide stain. d, Increase in
[Ca2+]cyt in seedlings expressing the cytosolic localized Aequorin-based luminescence Ca2+ sensor
(Aeq) measured in relative light units (RLU) treated with 1 µM mIDA (black). No response is
observed in Aeq seedlings treated with 1 µM IDAΔN69 (gray) or in hae hsl2 Aeq seedlings treated with
1 µM mIDA (blue). e, Increase in [Ca2+]cyt in Aeq expressing flowers at position 5 and 6 (See
Supplementary Fig. 5a for positions) measured in RLU in response to 1 µM mIDA. Curves represent
average of 3 independent experiments with 4-6 replications in each experiment. f, ROS production
detected by the luminol-based assay was monitored over time as RLU. ROS production from hae
hsl2 leaf disks expressing 35S:HAE-YFP in response to 1 µM mIDA (black) and in WT control
(blue).
Fig. 3: ROS production in floral AZs and abscission phenotypes of the rbohd rbohf mutant
a, ROS production in the AZ (white arrow head) detected by using the fluorescent dye H2DCF-
DA in WT, hae hsl2 and rbohd rbohf flowers at position 6 (See Supplementary Fig. 5a for
positions). Scale bar = 100 µm, maximum intensity projections of z-stacks. Representative pictures
from 9 flowers. b, Representative pictures of WT, hae hsl2 and rbohd rbohf inflorescences, notice
that only hae hsl2 retains floral organs along the inflorescence as seen by arrows in inserts, scale
bar for inflorescences = 1 cm. c, Petal break strength (pBS) measurements of WT and the rbohd
rbohf mutant at position 1-6 along the inflorescence. Force required to remove petals from the
receptacle represented in gram equivalent. * = significantly different from WT at the given position
(p < 0.05, student t-test, two tailed).
.CC-BY-NC-ND 4.0 International licensewas not certified by peer review) is the author/funder. It is made available under aThe copyright holder for this preprint (whichthis version posted September 8, 2019. . https://doi.org/10.1101/761346doi: bioRxiv preprint

27
Fig. 4: Promoter activity of HSL2, RLK7, HAE and FLS2 in cells undergoing cell separation
a, Microscopic analysis of 7-days-old pHSL2:Venus-H2B, pRLK7:Venus-H2B, pHAE:Venus-H2B
and pFLS2:Venus-H2B roots. Fluorescent nuclei could be observed during emergence of lateral
roots (arrows indicate LR). Representative pictures of n = 8, scale bar = 50 µm, single plane image.
b, Microscopic analysis of pHSL2:Venus-H2B, pRLK7:Venus-H2B, pHAE:Venus-H2B and
pFLS2:Venus-H2B flowers at position 6 (See Supplementary Fig. 5a for positions). Fluorescent
nuclei could be observed in the AZ (arrows indicate AZ). Representative pictures of n = 8, scale
bar = 100 µm, maximum intensity projections of z-stacks.
Fig. 5: HSL2 interaction with RLK7 is promoted by the presence of mIDA and PIP1.
a, Receptor interaction shown by FRET-APB. Receptors of interest are fused to either an acceptor
(mCherry) or donor (GFP) fluorophore and expressed in N.benthamiana. Protein-protein
interactions are measured as changes in the GFP emission after photobleaching of mCherry,
presented as EFRET [%]. Donor-only samples were used as negative controls. A RLK7-GFP-
mCherry construct was used as a positive control. Line at 4 % indicates GFP background
fluctuations. All measurements were performed on n = 15 cells and experiments were repeated 3
times. b, Representative picture of receptor expression in N.benthamiana leaves, scale bar = 10
µm. c, Plate interaction assays between the extracellular domains (ECDs) of HSL2 (bait) and
RLK7 (prey) in the absence (No treatment) and presence of 1 µM mIDA, PIP1, IDA∆N69, and elf18
represented as cumulative absorbance (Abs 650 nm) over 10 h. Dots represent individual
observations at each minute from four technical replicates. Box plots display the 1st and 3rd
quartiles, split by the median; the whiskers are drawn down to the 10 th percentile and up to the 90
th. **** = significantly different from non-treated sample (p < 0.0001).
Fig. 6: mIDA induced expression of defense-associated marker genes in hsl2, rlk7 and hsl2 rlk7
mutants
RT-qPCR data showing transcription of FRK1, MYB51, and PEP3 in WT, hsl2, rlk7 and hsl2 rlk7
seedlings exposed to 1 µM mIDA for 1 h compared to untreated seedlings (control). ACTIN was used
to normalize mRNA levels. Figure represent 3 biological replicates with 4 technical replicates. * =
Significantly different to untreated of same genotype , ** = Significantly different to untreated WT
(all untreated samples tested), *** = Significantly different to mIDA treated WT (all IDA treated
samples tested). (p < 0.05, student t-test, two tailed). Statistical analyses are presented in
Supplementary Table 3.
.CC-BY-NC-ND 4.0 International licensewas not certified by peer review) is the author/funder. It is made available under aThe copyright holder for this preprint (whichthis version posted September 8, 2019. . https://doi.org/10.1101/761346doi: bioRxiv preprint

28
Fig. 7: IDA regulates cell separation and modulates immunity
IDA and the IDL peptides control cell separation processes during plant development and in response
to abiotic and biotic stress 7,14,19,24. The regulation of IDA expression is under developmental control
but can also be activated by abiotic and biotic stimuli. During developmental control of floral organ
abscission and emergence of lateral roots IDA relays a signal through receptor complexes including
HAE, HSL2, SERK1 and BAK1 to modulate the expression of cell wall remodeling (CWR) genes.
In cells undergoing cell separation IDA and PIP1 can promote interaction of HSL2 and RLK7 to
modulate expression of defense-associated genes thereby mounting a cell specific immune response.
MAMPs and DAMPs activating the FLS2 and RLK7 receptors lead to an induction of defense-
associated genes and IDA, which in turn will enhance HSL2 and RLK7 signaling. Receptor
complexes regulating cell separation and immunity share similar signaling components. Both
activation of receptors modulating cell separation and defense stimulate ROS release and an increase
in cytosolic Ca2+ although the mechanism for ROS and Ca2+ release appears to be different.
Movies
Movie 1: [Ca2+]cyt dynamics in R-GECO1 expressing root tip in response to 1 µM mIDA. 10 days-
old roots were treated with 1 µM mIDA and changes in [Ca2+]cyt was recorded over time.
Response shown as normalized fluorescence intensities (∆F/F). Images were recorded with a frame
rate of 5 seconds. Movie corresponds to measurements shown in Fig. 2a,b. Representative
response from 10 roots. Time shown as, hh:mm:ss.
Movie 2: [Ca2+]cyt dynamics in R-GECO1 expressing root tip in response to 1 µM flg22 10 days-
old roots were treated with 1 µM flg22 and changes in [Ca2+]cyt was recorded over time. Response
shown as normalized fluorescence intensities (∆F/F). Images were recorded with a frame rate of 5
seconds. Movie corresponds to measurements shown in Supplementary Fig. 3. Representative
response from 10 roots. Time shown as, hh:mm:ss.
Movie 3: [Ca2+]cyt dynamics in R-GECO1 expressing root tip in response to 1 mM ATP. 1 mM
ATP will induce a strong increase in [Ca2+]cyt and was added as a last treatment to all roots acting
as a positive control. Response shown as normalized fluorescence intensities (∆F/F). Images were
recorded with a frame rate of 5 seconds. Representative response from 10 roots. Time shown as,
hh:mm:ss.
.CC-BY-NC-ND 4.0 International licensewas not certified by peer review) is the author/funder. It is made available under aThe copyright holder for this preprint (whichthis version posted September 8, 2019. . https://doi.org/10.1101/761346doi: bioRxiv preprint
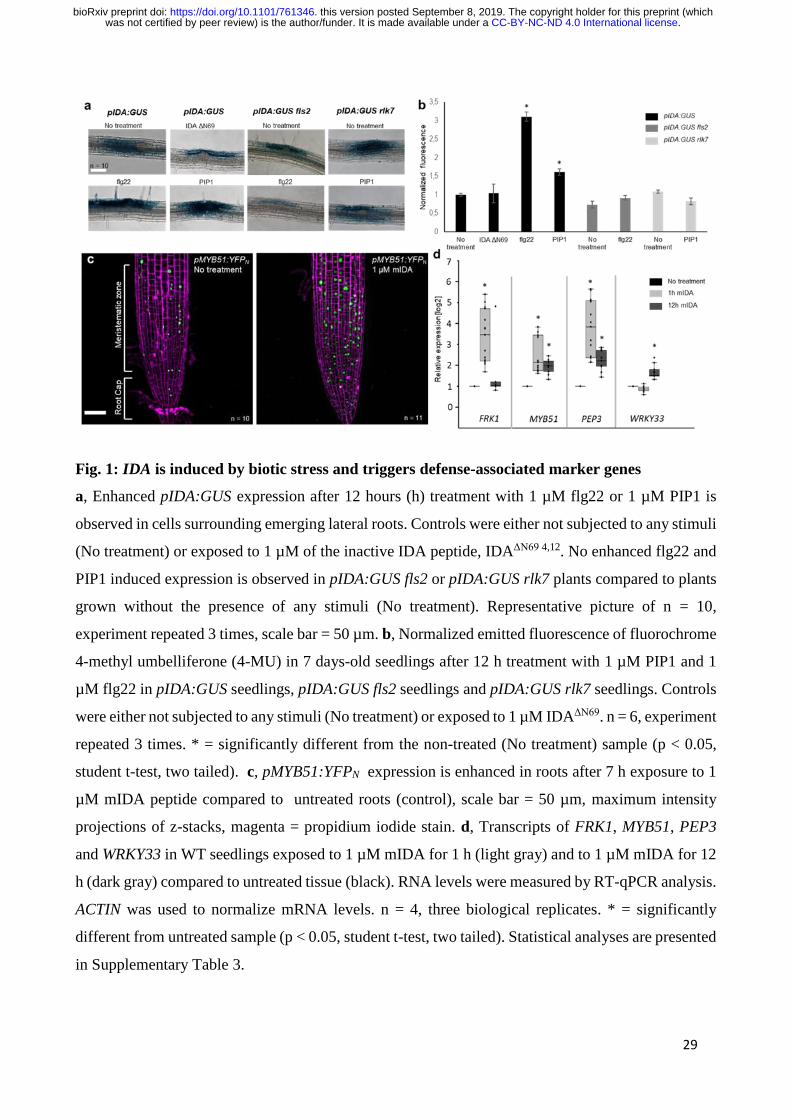
29
Fig. 1: IDA is induced by biotic stress and triggers defense-associated marker genes
a, Enhanced pIDA:GUS expression after 12 hours (h) treatment with 1 µM flg22 or 1 µM PIP1 is
observed in cells surrounding emerging lateral roots. Controls were either not subjected to any stimuli
(No treatment) or exposed to 1 µM of the inactive IDA peptide, IDAΔN69 4,12. No enhanced flg22 and
PIP1 induced expression is observed in pIDA:GUS fls2 or pIDA:GUS rlk7 plants compared to plants
grown without the presence of any stimuli (No treatment). Representative picture of n = 10,
experiment repeated 3 times, scale bar = 50 µm. b, Normalized emitted fluorescence of fluorochrome
4-methyl umbelliferone (4-MU) in 7 days-old seedlings after 12 h treatment with 1 µM PIP1 and 1
µM flg22 in pIDA:GUS seedlings, pIDA:GUS fls2 seedlings and pIDA:GUS rlk7 seedlings. Controls
were either not subjected to any stimuli (No treatment) or exposed to 1 µM IDAΔN69. n = 6, experiment
repeated 3 times. * = significantly different from the non-treated (No treatment) sample (p < 0.05,
student t-test, two tailed). c, pMYB51:YFPN expression is enhanced in roots after 7 h exposure to 1
µM mIDA peptide compared to untreated roots (control), scale bar = 50 µm, maximum intensity
projections of z-stacks, magenta = propidium iodide stain. d, Transcripts of FRK1, MYB51, PEP3
and WRKY33 in WT seedlings exposed to 1 µM mIDA for 1 h (light gray) and to 1 µM mIDA for 12
h (dark gray) compared to untreated tissue (black). RNA levels were measured by RT-qPCR analysis.
ACTIN was used to normalize mRNA levels. n = 4, three biological replicates. * = significantly
different from untreated sample (p < 0.05, student t-test, two tailed). Statistical analyses are presented
in Supplementary Table 3.
.CC-BY-NC-ND 4.0 International licensewas not certified by peer review) is the author/funder. It is made available under aThe copyright holder for this preprint (whichthis version posted September 8, 2019. . https://doi.org/10.1101/761346doi: bioRxiv preprint

30
Fig. 2: mIDA-induced Ca2+ and ROS release in Arabidopsis
a, Normalized R-GECO1 fluorescence intensities (ΔF/F) were measured from regions of interest
(ROI) (outlined in red) in the meristematic and elongation zone of the root. Shown are cytosolic
calcium concentration ([Ca2+]cyt) dynamics in the ROI in response to 1 M mIDA over time. (see also
Movie 1). Representative response from 10 roots. Red arrow at 0 minutes (min) indicates application
of mIDA peptide. b, Representative response from 10 roots. The increase in [Ca2+]cyt response
propagates through the roots as two waves seen as normalized R-GECO1 fluorescence intensities
(ΔF/F) shown as a heat map. c, Expression of pHAE:Venus-H2B and pHSL2:Venus-H2B in 7 days-
old roots. Scale bar = 50 µm, single plane image, magenta = propidium iodide stain. d, Increase in
[Ca2+]cyt in seedlings expressing the cytosolic localized Aequorin-based luminescence Ca2+ sensor
(Aeq) measured in relative light units (RLU) treated with 1 µM mIDA (black). No response is
observed in Aeq seedlings treated with 1 µM IDAΔN69 (gray) or in hae hsl2 Aeq seedlings treated with
1 µM mIDA (blue). e, Increase in [Ca2+]cyt in Aeq expressing flowers at position 5 and 6 (See
Supplementary Fig. 5a for positions) measured in RLU in response to 1 µM mIDA. Curves represent
average of 3 independent experiments with 4-6 replications in each experiment. f, ROS production
.CC-BY-NC-ND 4.0 International licensewas not certified by peer review) is the author/funder. It is made available under aThe copyright holder for this preprint (whichthis version posted September 8, 2019. . https://doi.org/10.1101/761346doi: bioRxiv preprint

31
detected by the luminol-based assay was monitored over time as RLU. ROS production from hae
hsl2 leaf disks expressing 35S:HAE-YFP in response to 1 µM mIDA (black) and in WT control
(blue).
.CC-BY-NC-ND 4.0 International licensewas not certified by peer review) is the author/funder. It is made available under aThe copyright holder for this preprint (whichthis version posted September 8, 2019. . https://doi.org/10.1101/761346doi: bioRxiv preprint
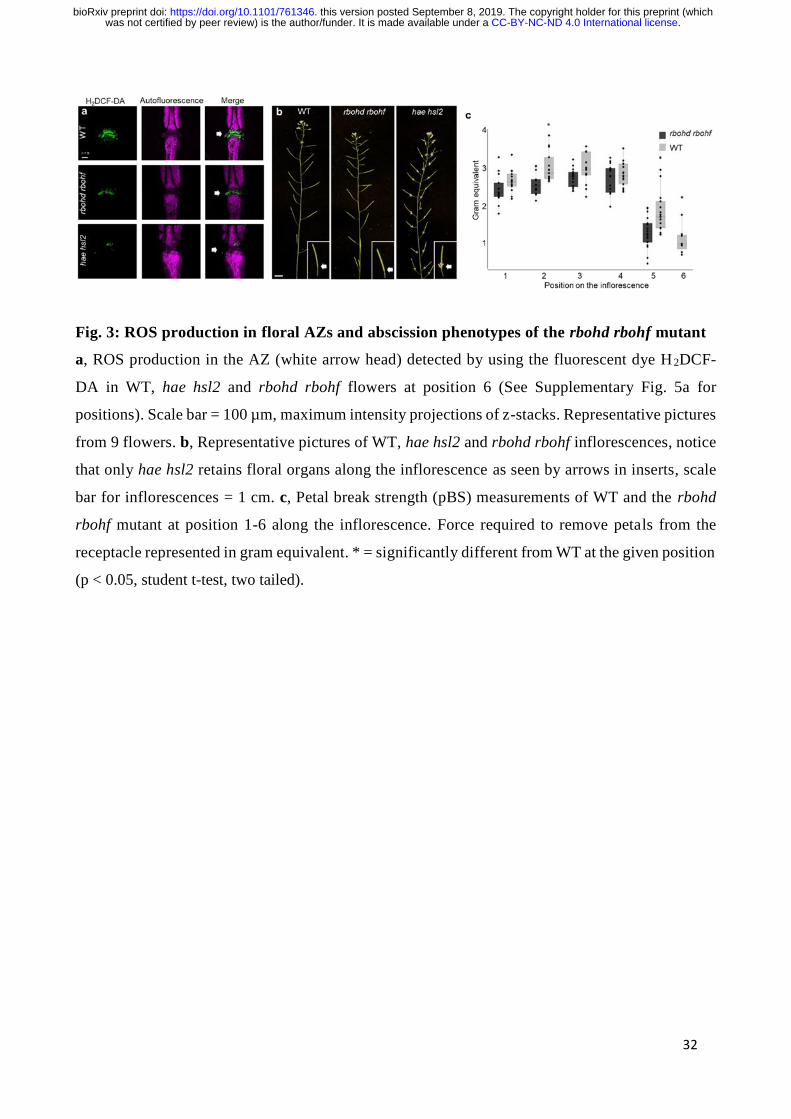
32
Fig. 3: ROS production in floral AZs and abscission phenotypes of the rbohd rbohf mutant
a, ROS production in the AZ (white arrow head) detected by using the fluorescent dye H2DCF-
DA in WT, hae hsl2 and rbohd rbohf flowers at position 6 (See Supplementary Fig. 5a for
positions). Scale bar = 100 µm, maximum intensity projections of z-stacks. Representative pictures
from 9 flowers. b, Representative pictures of WT, hae hsl2 and rbohd rbohf inflorescences, notice
that only hae hsl2 retains floral organs along the inflorescence as seen by arrows in inserts, scale
bar for inflorescences = 1 cm. c, Petal break strength (pBS) measurements of WT and the rbohd
rbohf mutant at position 1-6 along the inflorescence. Force required to remove petals from the
receptacle represented in gram equivalent. * = significantly different from WT at the given position
(p < 0.05, student t-test, two tailed).
.CC-BY-NC-ND 4.0 International licensewas not certified by peer review) is the author/funder. It is made available under aThe copyright holder for this preprint (whichthis version posted September 8, 2019. . https://doi.org/10.1101/761346doi: bioRxiv preprint

33
Fig. 4: Promoter activity of HSL2, RLK7, HAE and FLS2 in cells undergoing cell separation
a, Microscopic analysis of 7-days-old pHSL2:Venus-H2B, pRLK7:Venus-H2B, pHAE:Venus-H2B
and pFLS2:Venus-H2B roots. Fluorescent nuclei could be observed during emergence of lateral
roots (arrows indicate LR). Representative pictures of n = 8, scale bar = 50 µm, single plane image.
b, Microscopic analysis of pHSL2:Venus-H2B, pRLK7:Venus-H2B, pHAE:Venus-H2B and
pFLS2:Venus-H2B flowers at position 6 (See Supplementary Fig. 5a for positions). Fluorescent
nuclei could be observed in the AZ (arrows indicate AZ). Representative pictures of n = 8, scale
bar = 100 µm, maximum intensity projections of z-stacks.
.CC-BY-NC-ND 4.0 International licensewas not certified by peer review) is the author/funder. It is made available under aThe copyright holder for this preprint (whichthis version posted September 8, 2019. . https://doi.org/10.1101/761346doi: bioRxiv preprint

34
Fig. 5: HSL2 interaction with RLK7 is promoted by the presence of mIDA and PIP1.
a, Receptor interaction shown by FRET-APB. Receptors of interest are fused to either an acceptor
(mCherry) or donor (GFP) fluorophore and expressed in N.benthamiana. Protein-protein
interactions are measured as changes in the GFP emission after photobleaching of mCherry,
presented as EFRET [%]. Donor-only samples were used as negative controls. A RLK7-GFP-
mCherry construct was used as a positive control. Line at 4 % indicates GFP background
fluctuations. All measurements were performed on n = 15 cells and experiments were repeated 3
times. b, Representative picture of receptor expression in N.benthamiana leaves, scale bar = 10
µm. c, Plate interaction assays between the extracellular domains (ECDs) of HSL2 (bait) and
RLK7 (prey) in the absence (No treatment) and presence of 1 µM mIDA, PIP1, IDA∆N69, and elf18
represented as cumulative absorbance (Abs 650 nm) over 10 h. Dots represent individual
observations at each minute from four technical replicates. Box plots display the 1st and 3rd
quartiles, split by the median; the whiskers are drawn down to the 10 th percentile and up to the 90
th. **** = significantly different from non-treated sample (p < 0.0001).
.CC-BY-NC-ND 4.0 International licensewas not certified by peer review) is the author/funder. It is made available under aThe copyright holder for this preprint (whichthis version posted September 8, 2019. . https://doi.org/10.1101/761346doi: bioRxiv preprint

35
Fig. 6: mIDA induced expression of defense-associated marker genes in hsl2, rlk7 and hsl2 rlk7
mutants
RT-qPCR data showing transcription of FRK1, MYB51, and PEP3 in WT, hsl2, rlk7 and hsl2 rlk7
seedlings exposed to 1 µM mIDA for 1 h compared to untreated seedlings (control). ACTIN was used
to normalize mRNA levels. Figure represent 3 biological replicates with 4 technical replicates. * =
Significantly different to untreated of same genotype , ** = Significantly different to untreated WT
(all untreated samples tested), *** = Significantly different to mIDA treated WT (all IDA treated
samples tested). (p < 0.05, student t-test, two tailed). Statistical analyses are presented in
Supplementary Table 3.
.CC-BY-NC-ND 4.0 International licensewas not certified by peer review) is the author/funder. It is made available under aThe copyright holder for this preprint (whichthis version posted September 8, 2019. . https://doi.org/10.1101/761346doi: bioRxiv preprint

36
Fig. 7: IDA regulates cell separation and modulates immunity
IDA and the IDL peptides control cell separation processes during plant development and in response
to abiotic and biotic stress 7,14,19,24. The regulation of IDA expression is under developmental control
but can also be activated by abiotic and biotic stimuli. During developmental control of floral organ
abscission and emergence of lateral roots IDA relays a signal through receptor complexes including
HAE, HSL2, SERK1 and BAK1 to modulate the expression of cell wall remodeling (CWR) genes.
In cells undergoing cell separation IDA and PIP1 can promote interaction of HSL2 and RLK7 to
modulate expression of defense-associated genes thereby mounting a cell specific immune response.
MAMPs and DAMPs activating the FLS2 and RLK7 receptors lead to an induction of defense-
associated genes and IDA, which in turn will enhance HSL2 and RLK7 signaling. Receptor
complexes regulating cell separation and immunity share similar signaling components. Both
activation of receptors modulating cell separation and defense stimulate ROS release and an increase
in cytosolic Ca2+ although the mechanism for ROS and Ca2+ release appears to be different.
.CC-BY-NC-ND 4.0 International licensewas not certified by peer review) is the author/funder. It is made available under aThe copyright holder for this preprint (whichthis version posted September 8, 2019. . https://doi.org/10.1101/761346doi: bioRxiv preprint


![Study of Estrogen Receptor, Progesterone Receptor, …...[CANCER RESEARCH 49,4298-4304, August 1. 1989] Study of Estrogen Receptor, Progesterone Receptor, and the Estrogen-regulated](https://img.pdfslide.us/doc/110x75/5f95792bbdbd5e0915333803/study-of-estrogen-receptor-progesterone-receptor-cancer-research-494298-4304.jpg)


![RECEPTOR THEORY AND PRACTICE - University of North ... receptor... · RECEPTOR THEORY AND PRACTICE ... Fractional occupancy [Ligand Receptor] ... as long as one could separate the](https://img.pdfslide.us/doc/110x75/5ab205a37f8b9abc2f8d6c3c/receptor-theory-and-practice-university-of-north-receptorreceptor-theory.jpg)